Article

Development of A Novel Adaptive Range Strain Sensor for Structural Crack Monitoring

1
School of Ocean Science and Technology, Dalian University of Technology, Dalian 124221, China
2
Leicester International Institute, Dalian University of Technology, Dalian 124221, China
3
Faculty of Infrastructure Engineering, Dalian University of Technology, Dalian 116024, China
*
Author to whom correspondence should be addressed.
J. Mar. Sci. Eng. 2022, 10(11), 1710; https://doi.org/10.3390/jmse10111710
Submission received: 4 October 2022 / Revised: 6 November 2022 / Accepted: 7 November 2022 / Published: 9 November 2022

Abstract

:
Ocean platforms that are under complex sea conditions and loads for long periods are prone to fatigue cracks. These cracks may lead to large deformations, even displacement, of the platform, and should be monitored to ensure engineering safety. Cracks are not easily detected in the micro stage and small levels of strain measurement are required to ensure high accuracy. Furthermore, cracks are prone to suddenly developing into large deformations, especially in structural connections in practical engineering. This study developed a novel adaptive range strain sensor for structural crack monitoring that can monitor the whole structural crack propagation process in ocean platforms. The strain sensor is used for micro deformation monitoring through its fiber Bragg grating (FBG) sensor with high sensitivity. The sensor can automatically adapt to crack fractures and provide warnings through an STM32 single-chip microcomputer (SCM) system when the structure suddenly cracks, causing large deformation. The experimental results demonstrate that the device has high precision in micro measurement with the ability to capture structural fractures. The field application shows the high strain sensitivity of the sensor in crack monitoring, which indicates that the adaptive range strain sensor is suitable for the structural crack monitoring of ocean platforms.

1. Introduction

Cracks are prone to occurring when ocean platforms are subjected to complex environmental loads for long periods [1,2]. Crack propagation is defined as a dynamic process of crack growth under the action of external factors that reduces the stability of engineering structures and jeopardizes engineering safety [3,4]. Currently, the aging platforms that are in service have great potential security hazards due to fatigue cracks. As shown in 
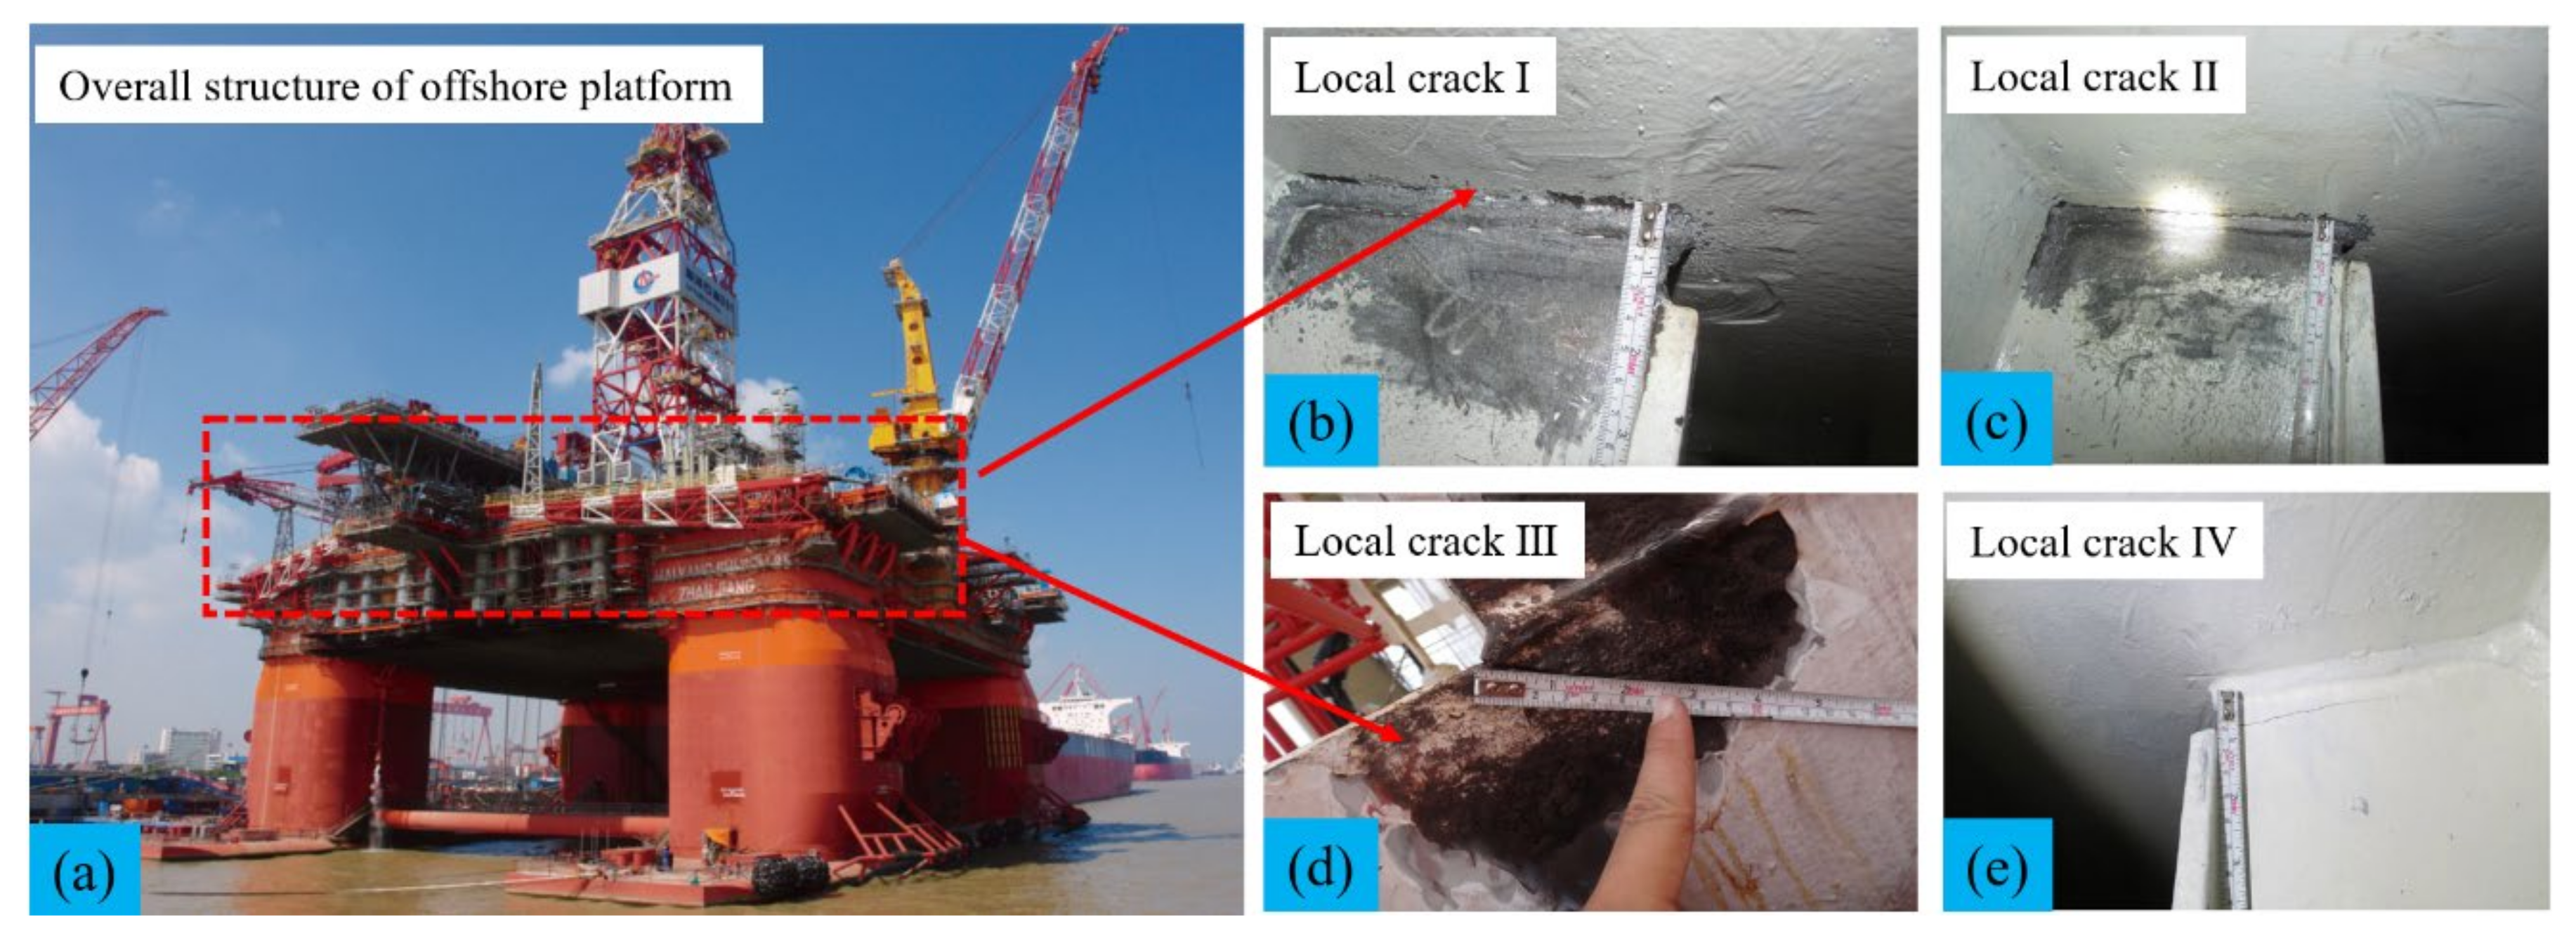
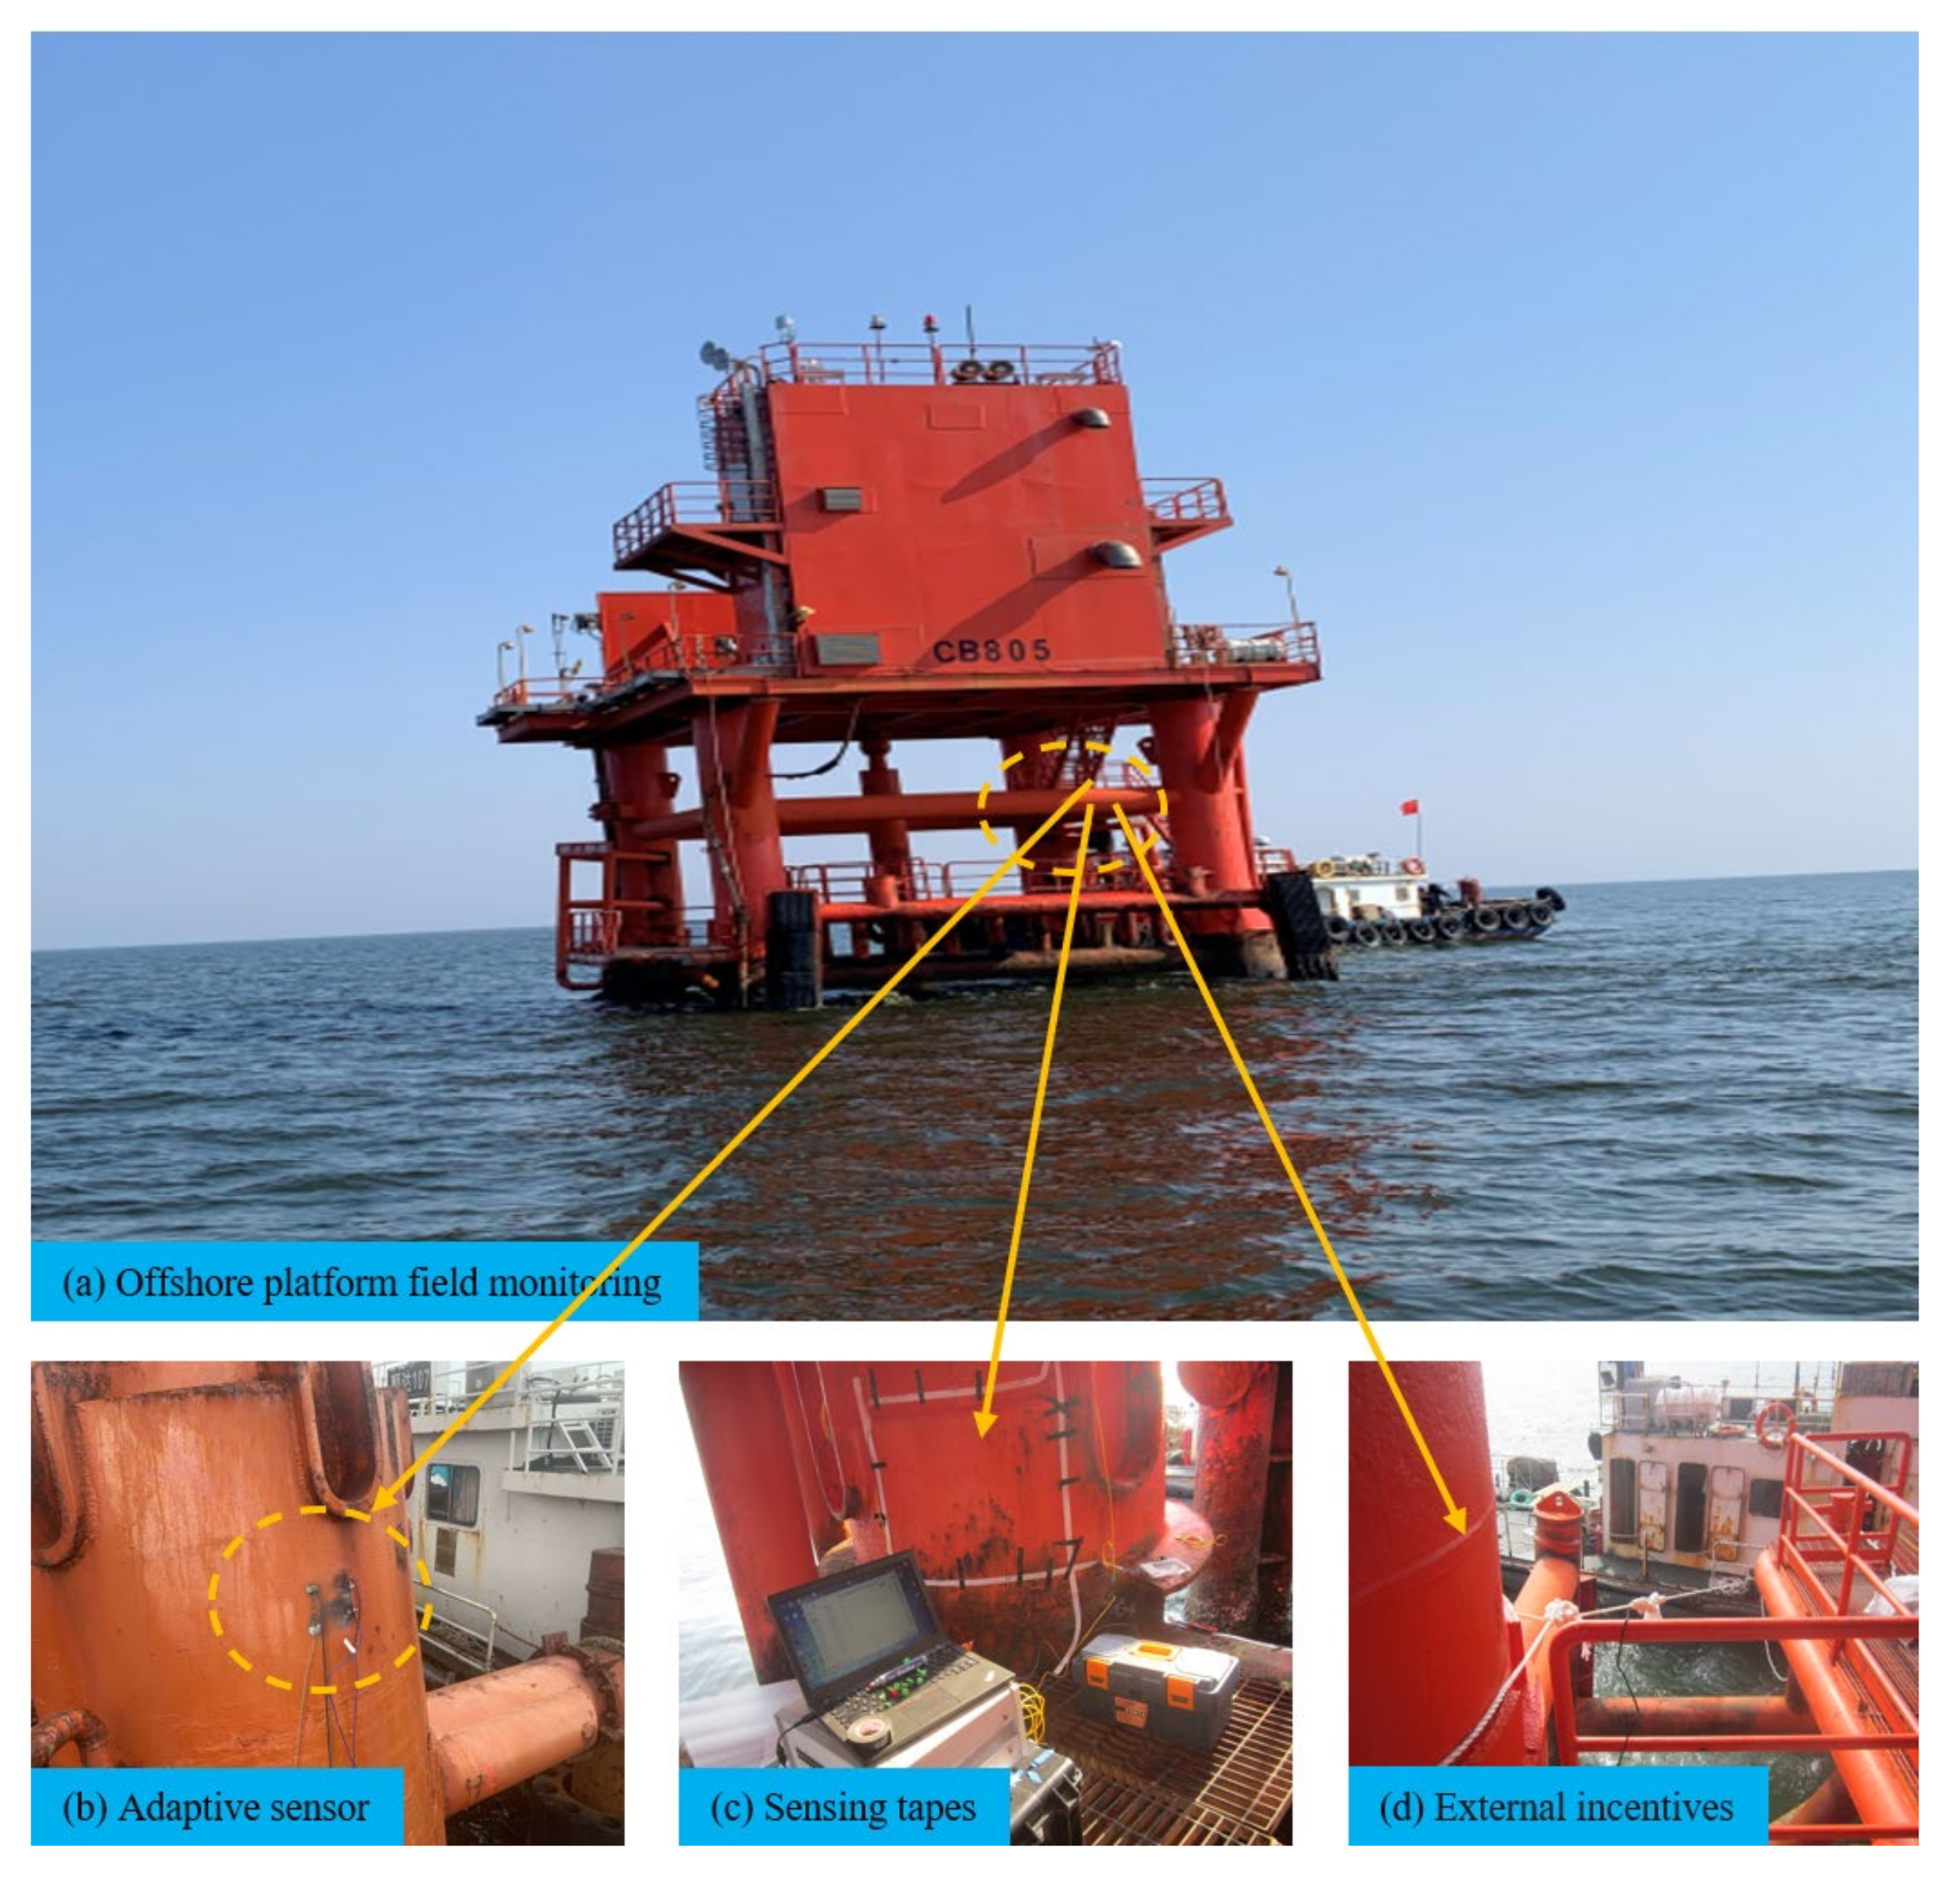
Figure 1, one platform reported that cracks were found in the connection between the added horizontal truss. The crack propagation caused buckling deformation, which reduced the bearing capacity of the vertical column connected with the middle longitudinal bulkhead joint. The cracks in the four corners of the front and rear end walls of the living building had slowly expanded compared with several years prior. The above description indicates that crack monitoring is needed to provide safety warnings and damage diagnoses for ocean platforms.
As shown in Figure 2, finite element modeling of the living floor area was carried out according to the physical model of the platform. The model was simulated to various load conditions according to the environmental data, such as winds, waves and currents. The simulation results show that crack propagation is most obvious in the corner of the living building, which is consistent with the trend of the physical model. According to the data analysis, the whole crack process from germination to fracture demonstrates that it is essential for both the micro deformation of crack propagation and the large displacement of crack failure to be identified and monitored in real-time, as this can provide an early warning for ocean platforms when cracks are about to occur or abruptly enlarge, ensuring platform security [5,6].
Cracks as a mechanical phenomenon cause great strain or even displacement when they propagate. Essentially, a crack can be monitored by strain or displacement measurement. With the development of science and technology, there have been increasingly more methods applied to monitor structural cracks [7,8,9,10]. The piezoelectric effect refers to the deformation of a piezoelectric body caused by an external mechanical force or electric field. Currently, piezoelectric sensors created with an inherent mechanical–electrical coupling effect are usually used in structural monitoring. Arun Narayanan [11] used a surface-mounted lead zirconate titanate (PZT) patch to detect stress-induced damage in concrete substrates in the form of cracks. Zhang et al. [12] proposed using piezoelectric smart aggregates to monitor and evaluate the repair quality of concrete cracks by embedding them in concrete structures based on their encapsulation properties. Acoustic emission technology refers to the technology of dynamic nondestructive testing of materials or components by receiving acoustic emission signals. Wolf et al. [13] proposed an embedded ultrasonic sensor to detect cracks in concrete that can detect and ascertain crack propagation before it is visible on the surface of the concrete. M.U. et al. [14] proposed a new method of semiconductor layer role shaping to achieve crack generation and detection based on acoustic emission testing. Compared with the confirmed optical detection method, the results showed that the method has good repeatability. The piezoresistive strain gauges and non-invasive optical methods [15,16] have also been used for structural health monitoring (SHM). Wu et al. [17] proposed a novel and facile strategy to manufacture highly micro channel crack-based gold@PU sponge piezoresistive material, which makes these fabricated sensors capable of monitoring both tiny and large human motions. In addition, optical fiber sensing technology is widely used in structural deformation and crack monitoring due to its high precision, low loss and anti-electromagnetic interference advantages [18,19,20]. Song et al. [21] proposed a grating coated sensor for metal crack detection, and its quantitative crack detection ability was verified by fatigue crack monitoring experiments. Wan et al. [22] applied distributed optical fiber sensing technology to mixed-mode crack monitoring. The crack opening and shear displacement were obtained at an angle greater than 90° based on the principle that the bending loss of optical fiber intersects the open crack. Han et al. [23] proposed a short-range Brillouin optical fiber sensor that achieves early crack detection and accurate crack width measurement through a Brillouin basic analyzer. Olson et al. [24] proposed a sensing concept based on optical fiber bending loss, obtained the relationship between signal loss and crack opening through experiments with multimode optical fiber, and established a model of power loss and crack opening. The test results were consistent with the theoretical prediction. Rodriguez et al. [25] applied a distributed optical fiber sensor (DOFS) to the shear crack characteristics of concrete elements: monitoring, localization and quantification of shear damage. The experimental data were obtained using an optical backscatter reflectometer (OBR), and a complete crack morphology map was drawn based on its high spatial resolution and sensitivity. Ang é Lica M. [26] applied the group delay behavior of chirped FBG to detect and characterize cracks in materials, and determined the crack location through linear chirp. The preliminary results were in good agreement with the simulation results through experimental verification. Bernasconi et al. [27] applied an equidistant sensor array to fatigue crack research of the bonded joint of thick composite laminates by embedding an FBG sensor into the composite structure. Dong, L. et al. [28] applied a tapered polymer fiber sensor (TPFS) to the crack detection testing of concrete beams, and they measured the deflection of the concrete beams with a linear variable differential sensor (LVDT). A four-point loading test was applied to several samples to evaluate the sensor’s ability to monitor the beam deflection and crack, indicating that TPFSs can be used for post-crack detection.
From the literature review, it can be seen that the monitoring techniques mentioned above have their own advantages for crack monitoring, but each method has its limitations in specific application environments. For example, noise interference should be avoided when using piezoelectric sensor and acoustic emission technology as it reduces the measurement accuracy. Due to its explosion-proof and stability advantages, fiber optic sensors can be applied to offshore platforms in environments with long-term sun exposure, salt spray, high humidity and so on. Hiroshi et al. [29] proved through experimental analysis that the FBG sensor can determine the crack tip location more accurately than the piezoelectric sensor and others. Offshore platforms are complex rigid structures that require high strain sensitivity for deformation monitoring. Distributed optical fiber sensing technology has a wide measurement range, but the measurement accuracy in a single point is relatively low. Currently, the difficulty with crack monitoring is that high sensitivity is needed in the micro deformation stage and a large range is needed in the failure stage for the locally critical areas of ocean platforms. Therefore, single-point measurement of high precision should be used in the key area of concern. Then, the quasi-distributed measurement is formed by concatenating multiple points around the key area to monitor structural damage.
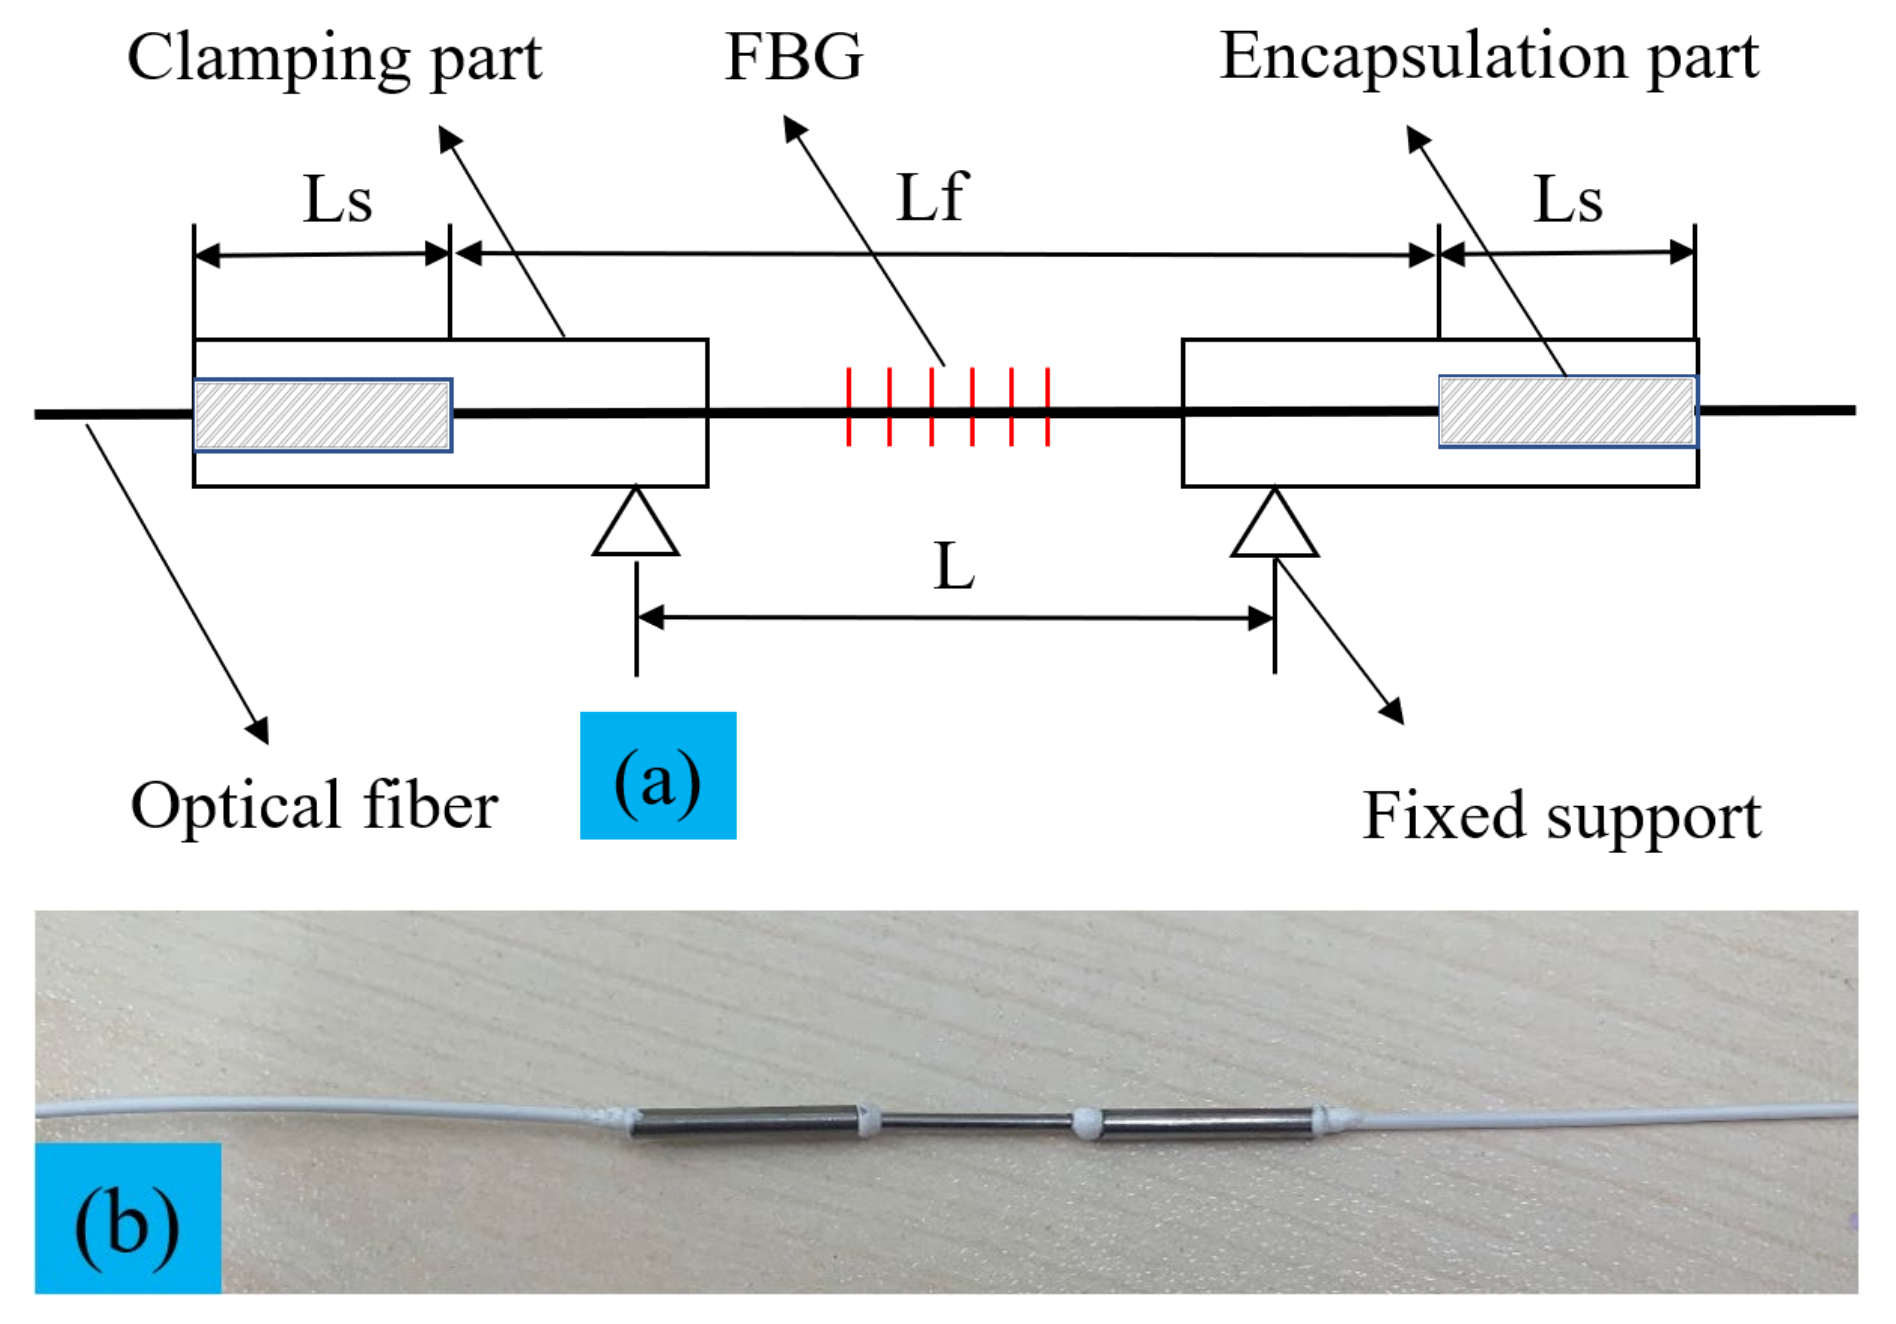
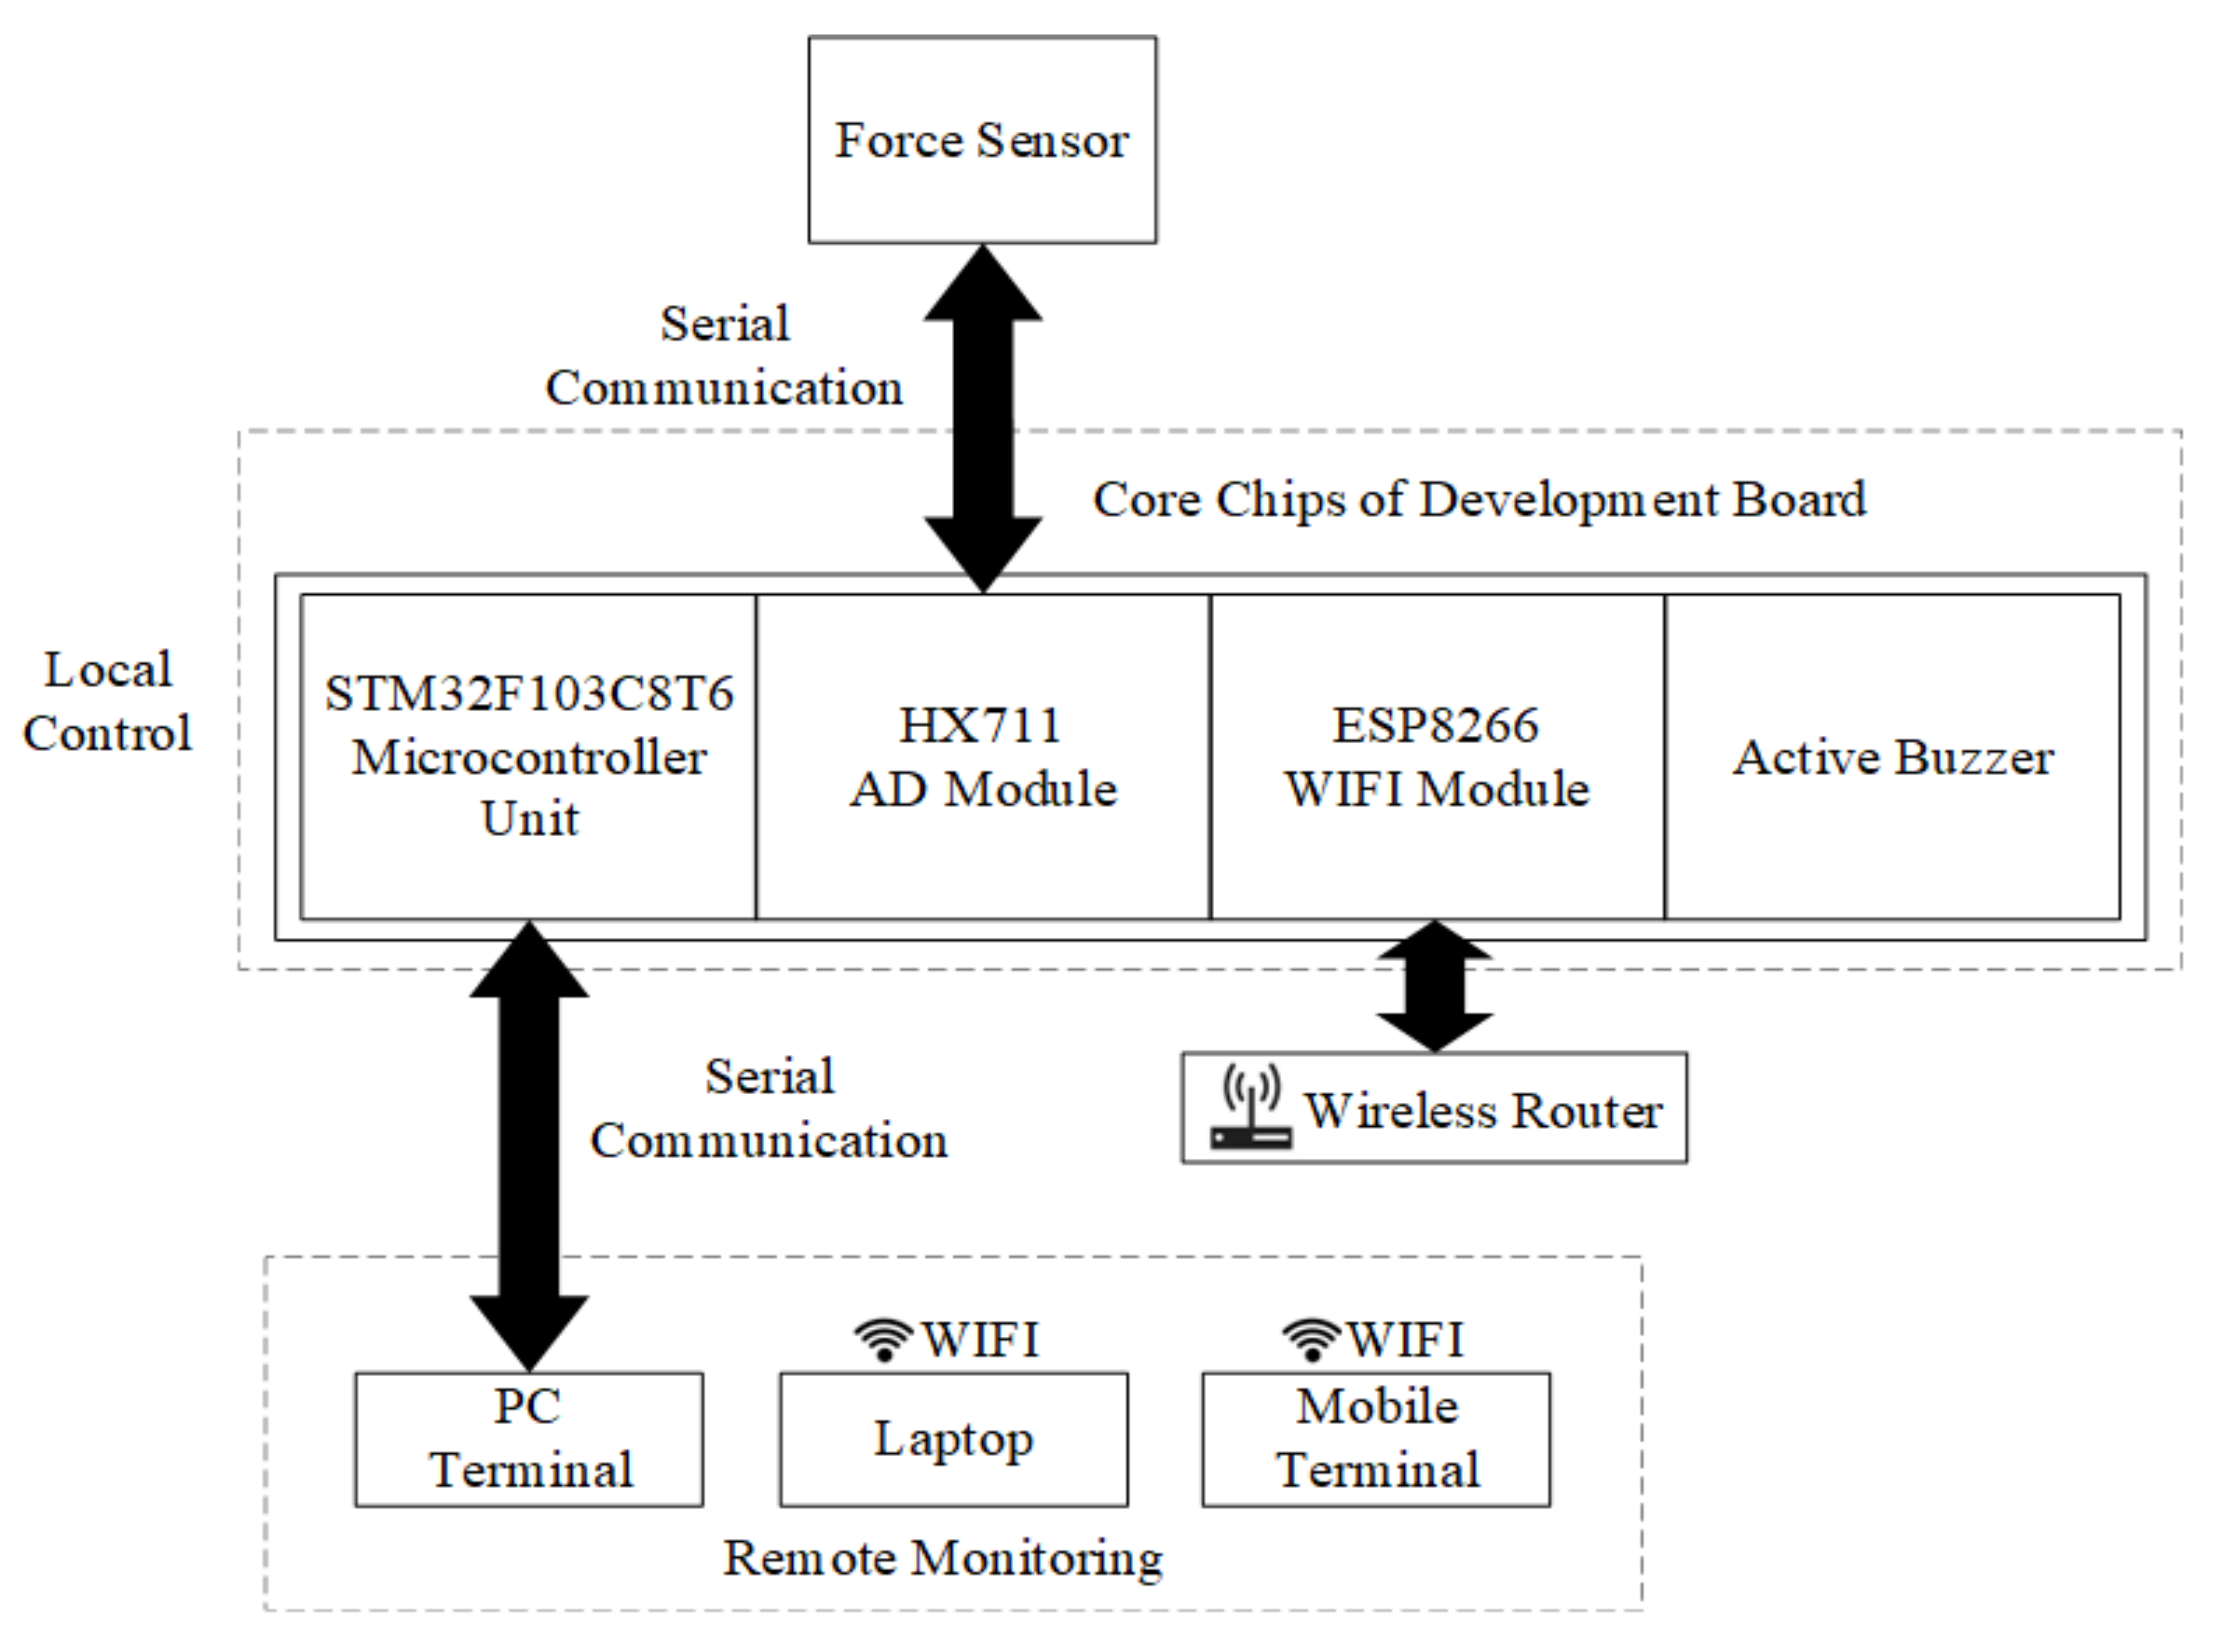
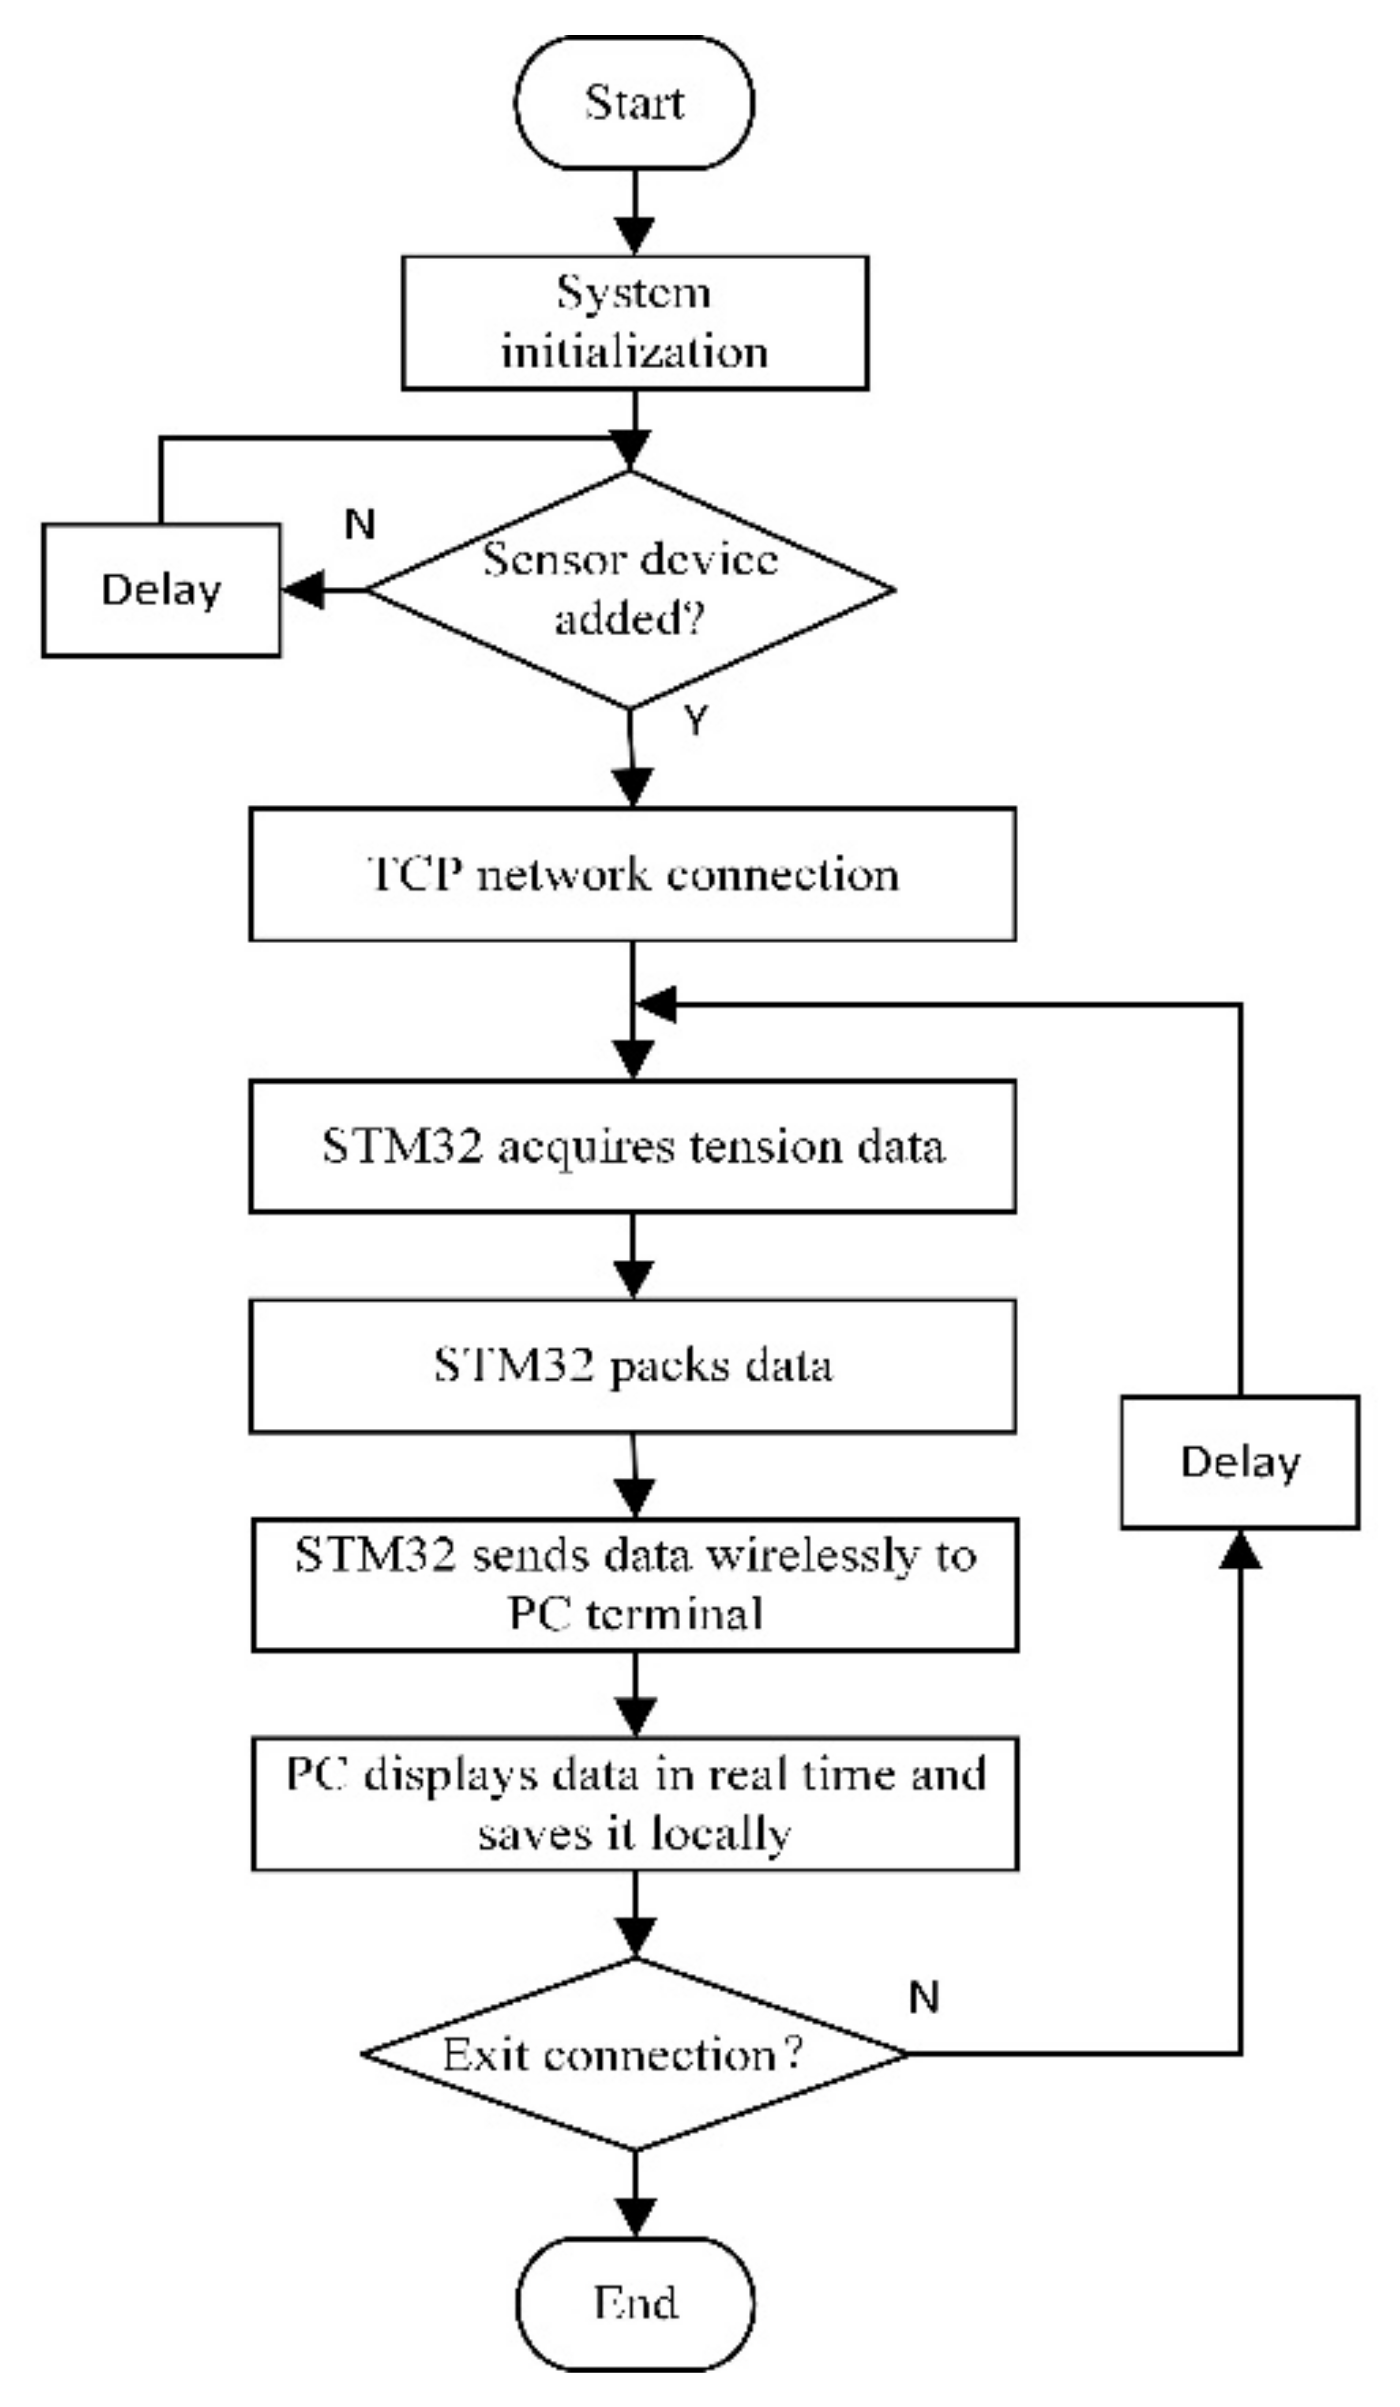
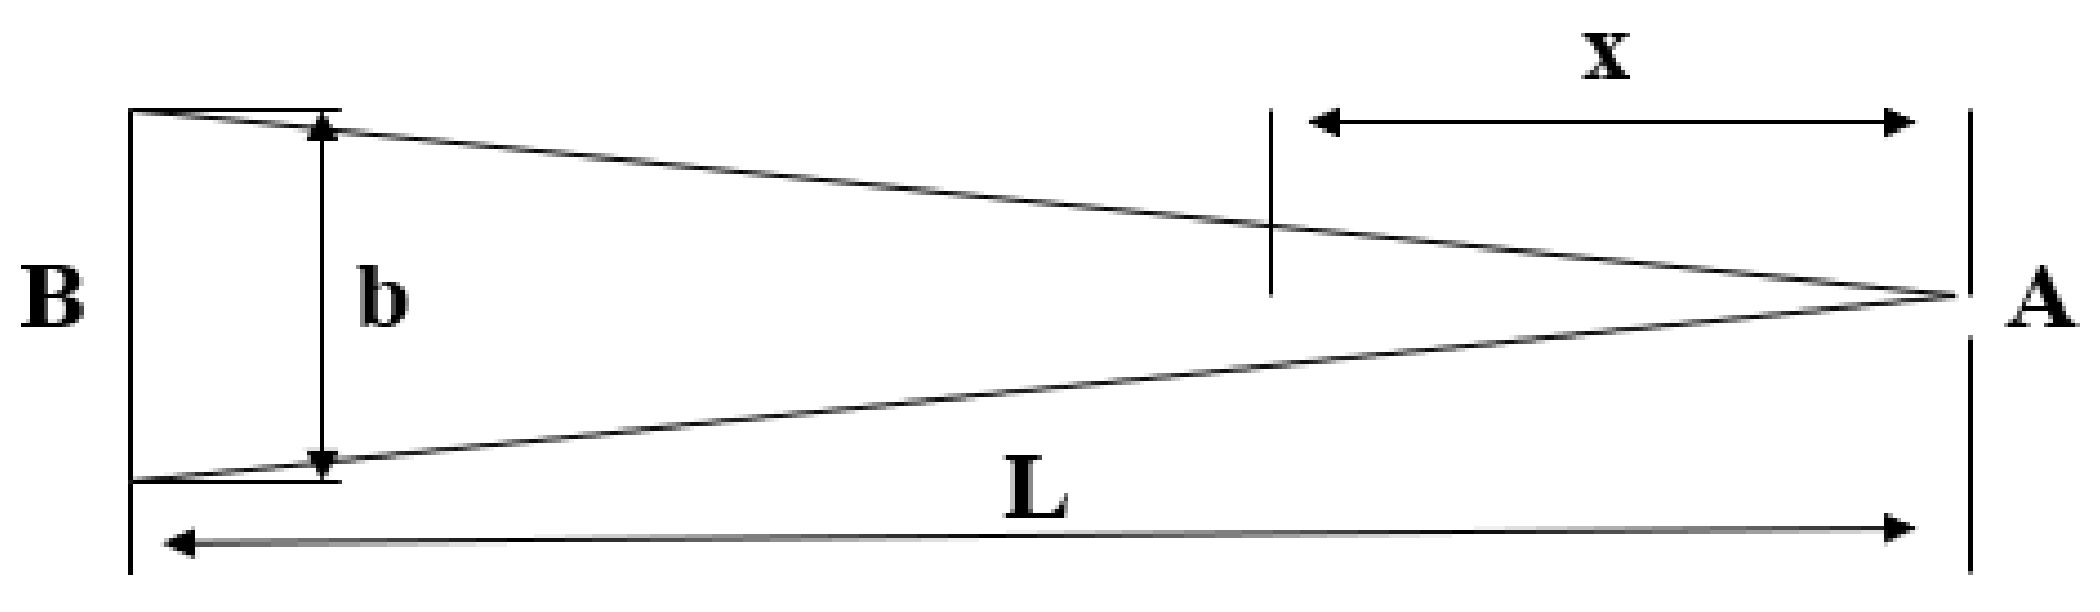
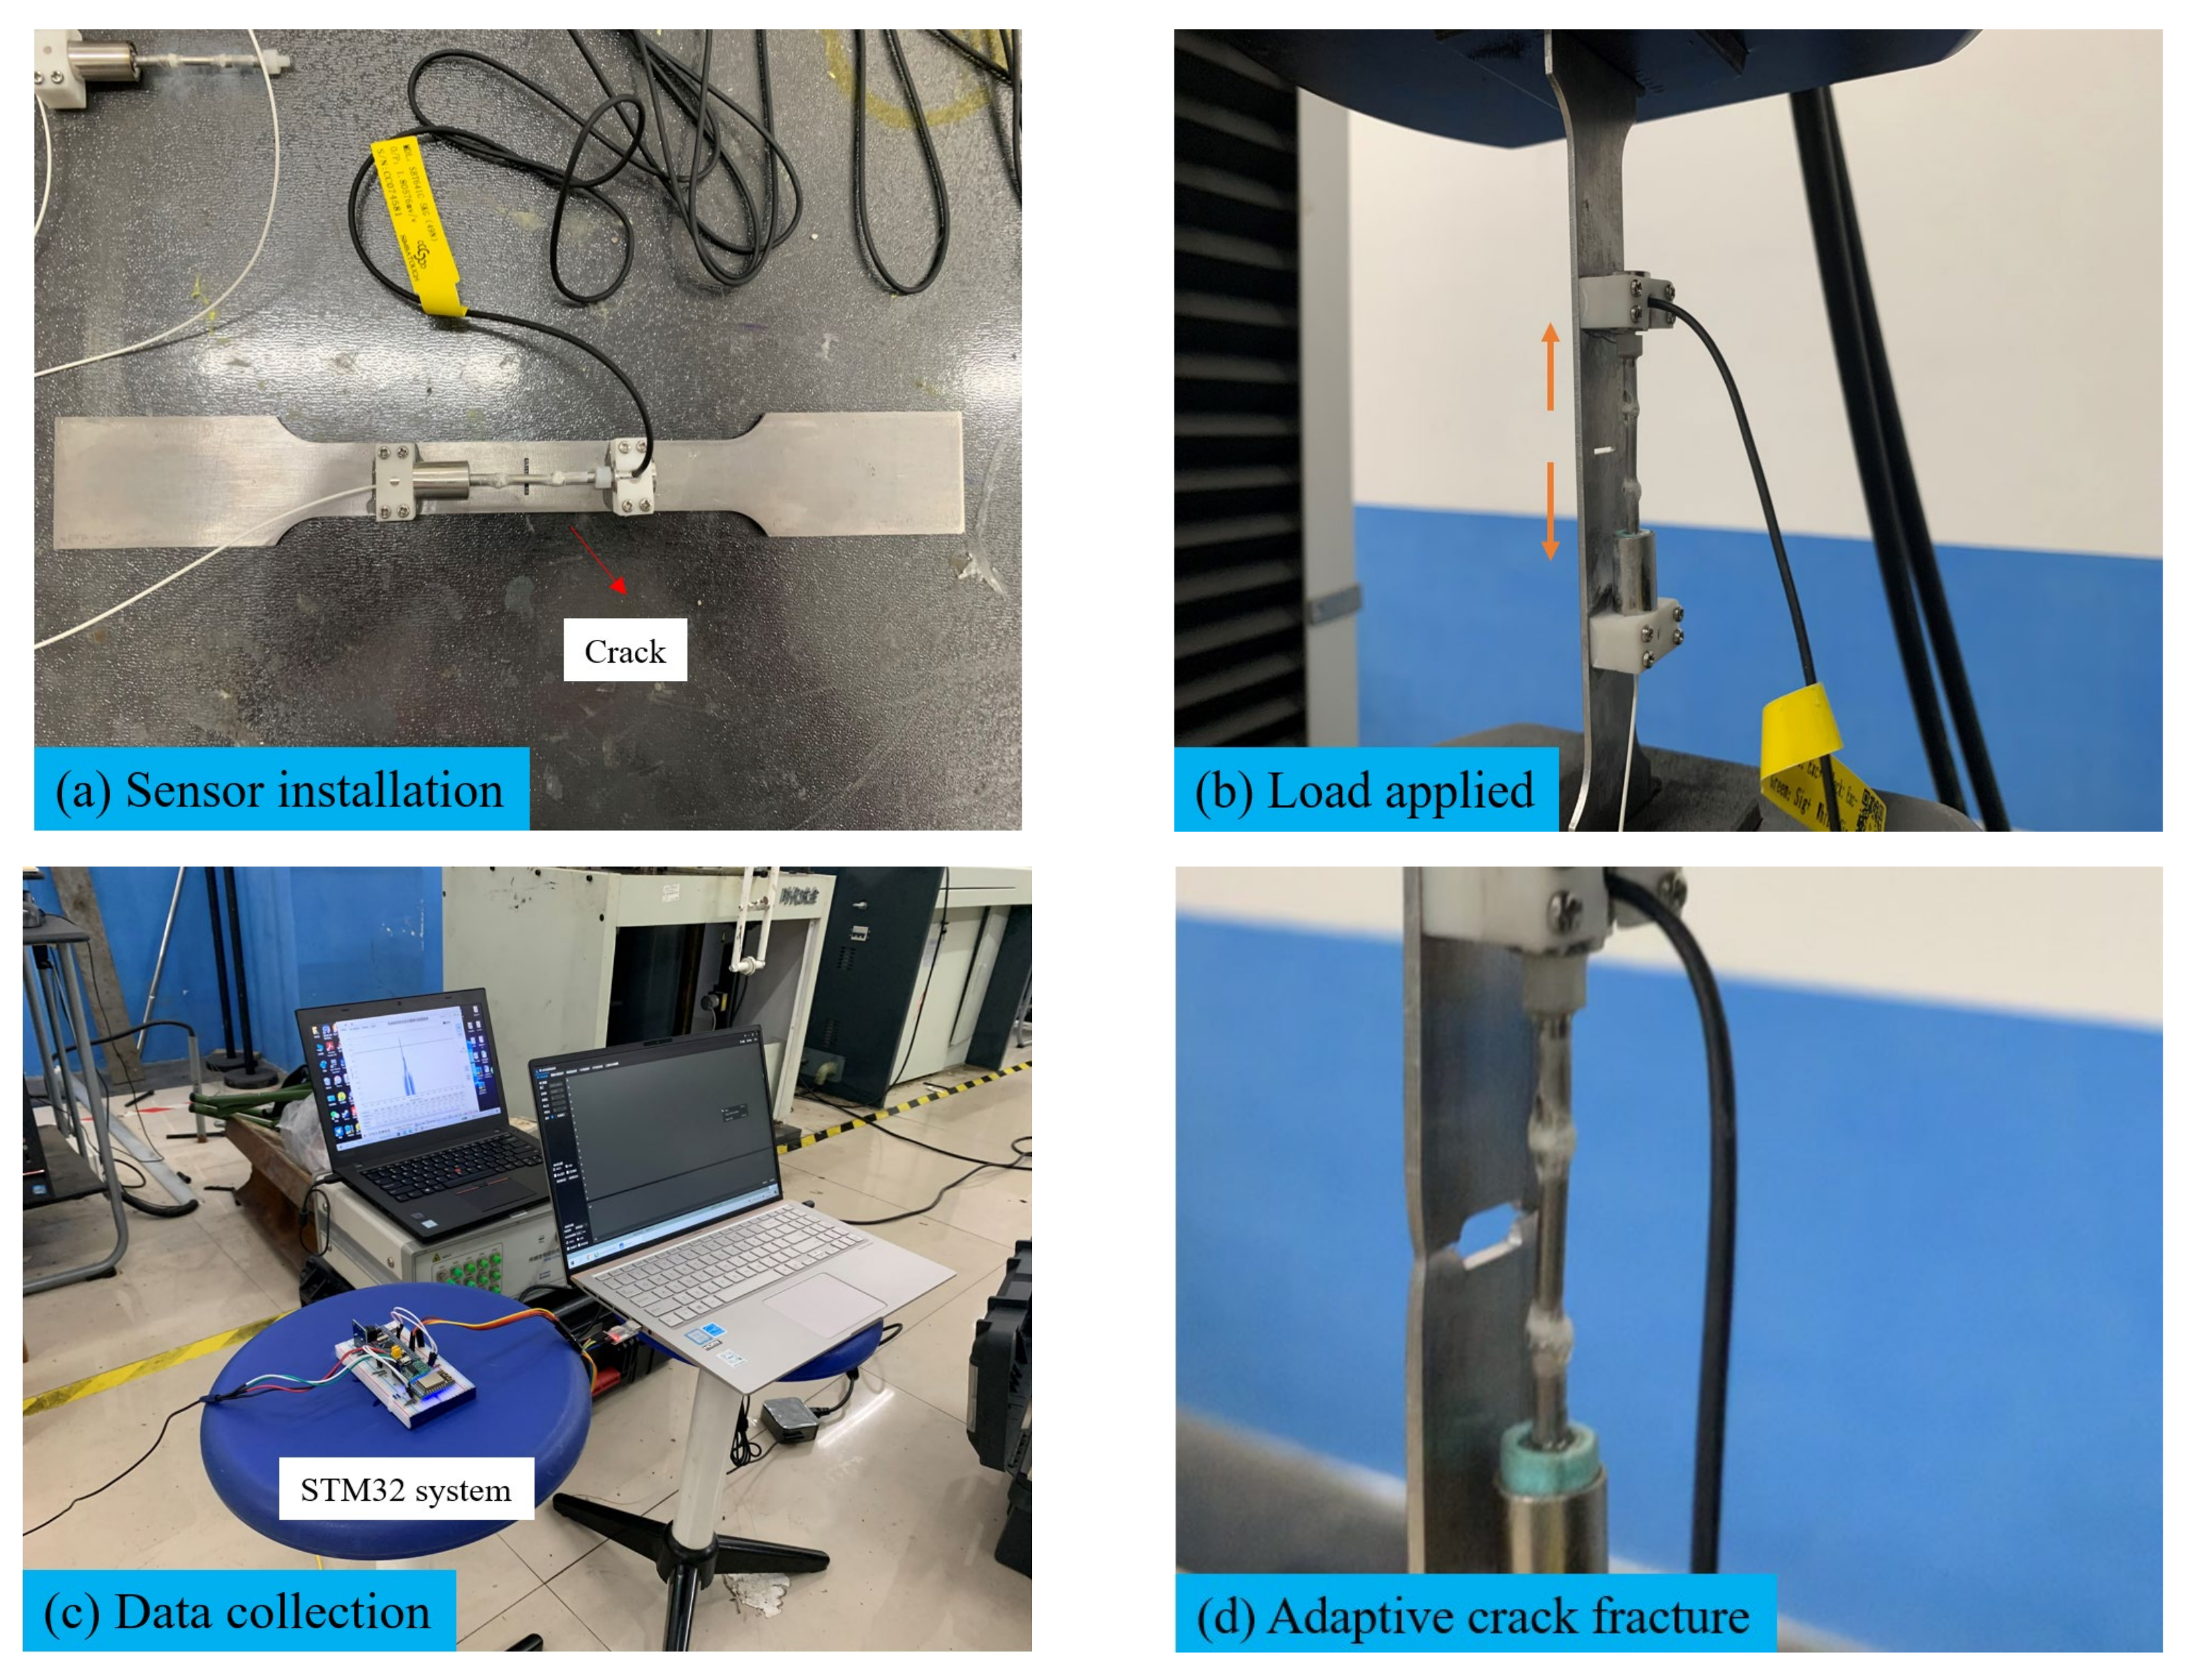
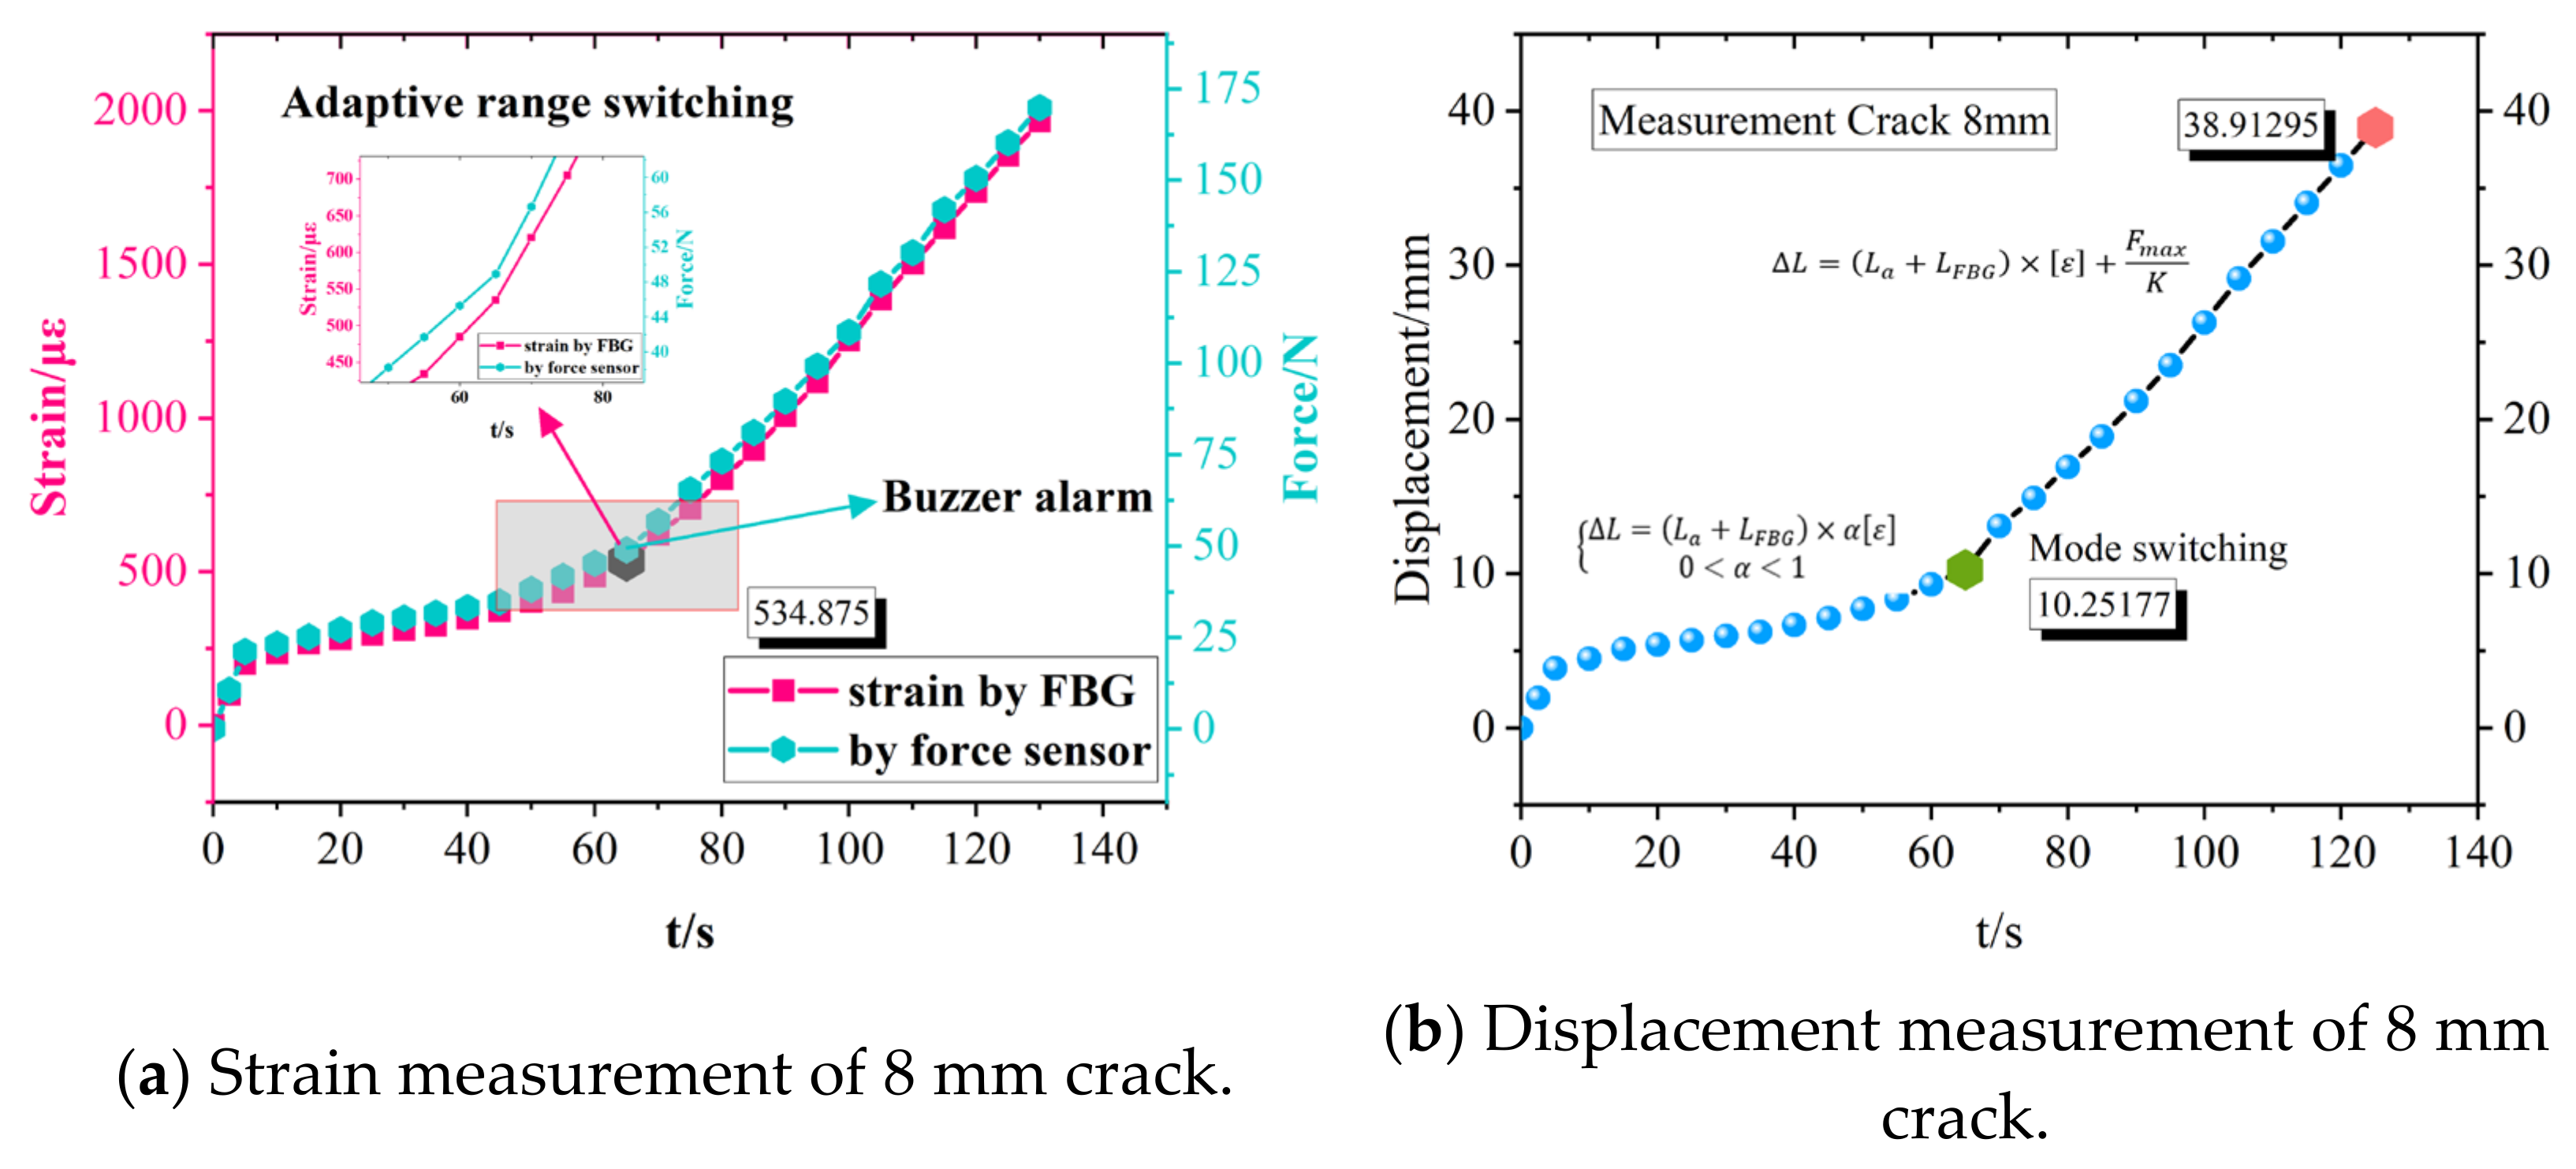
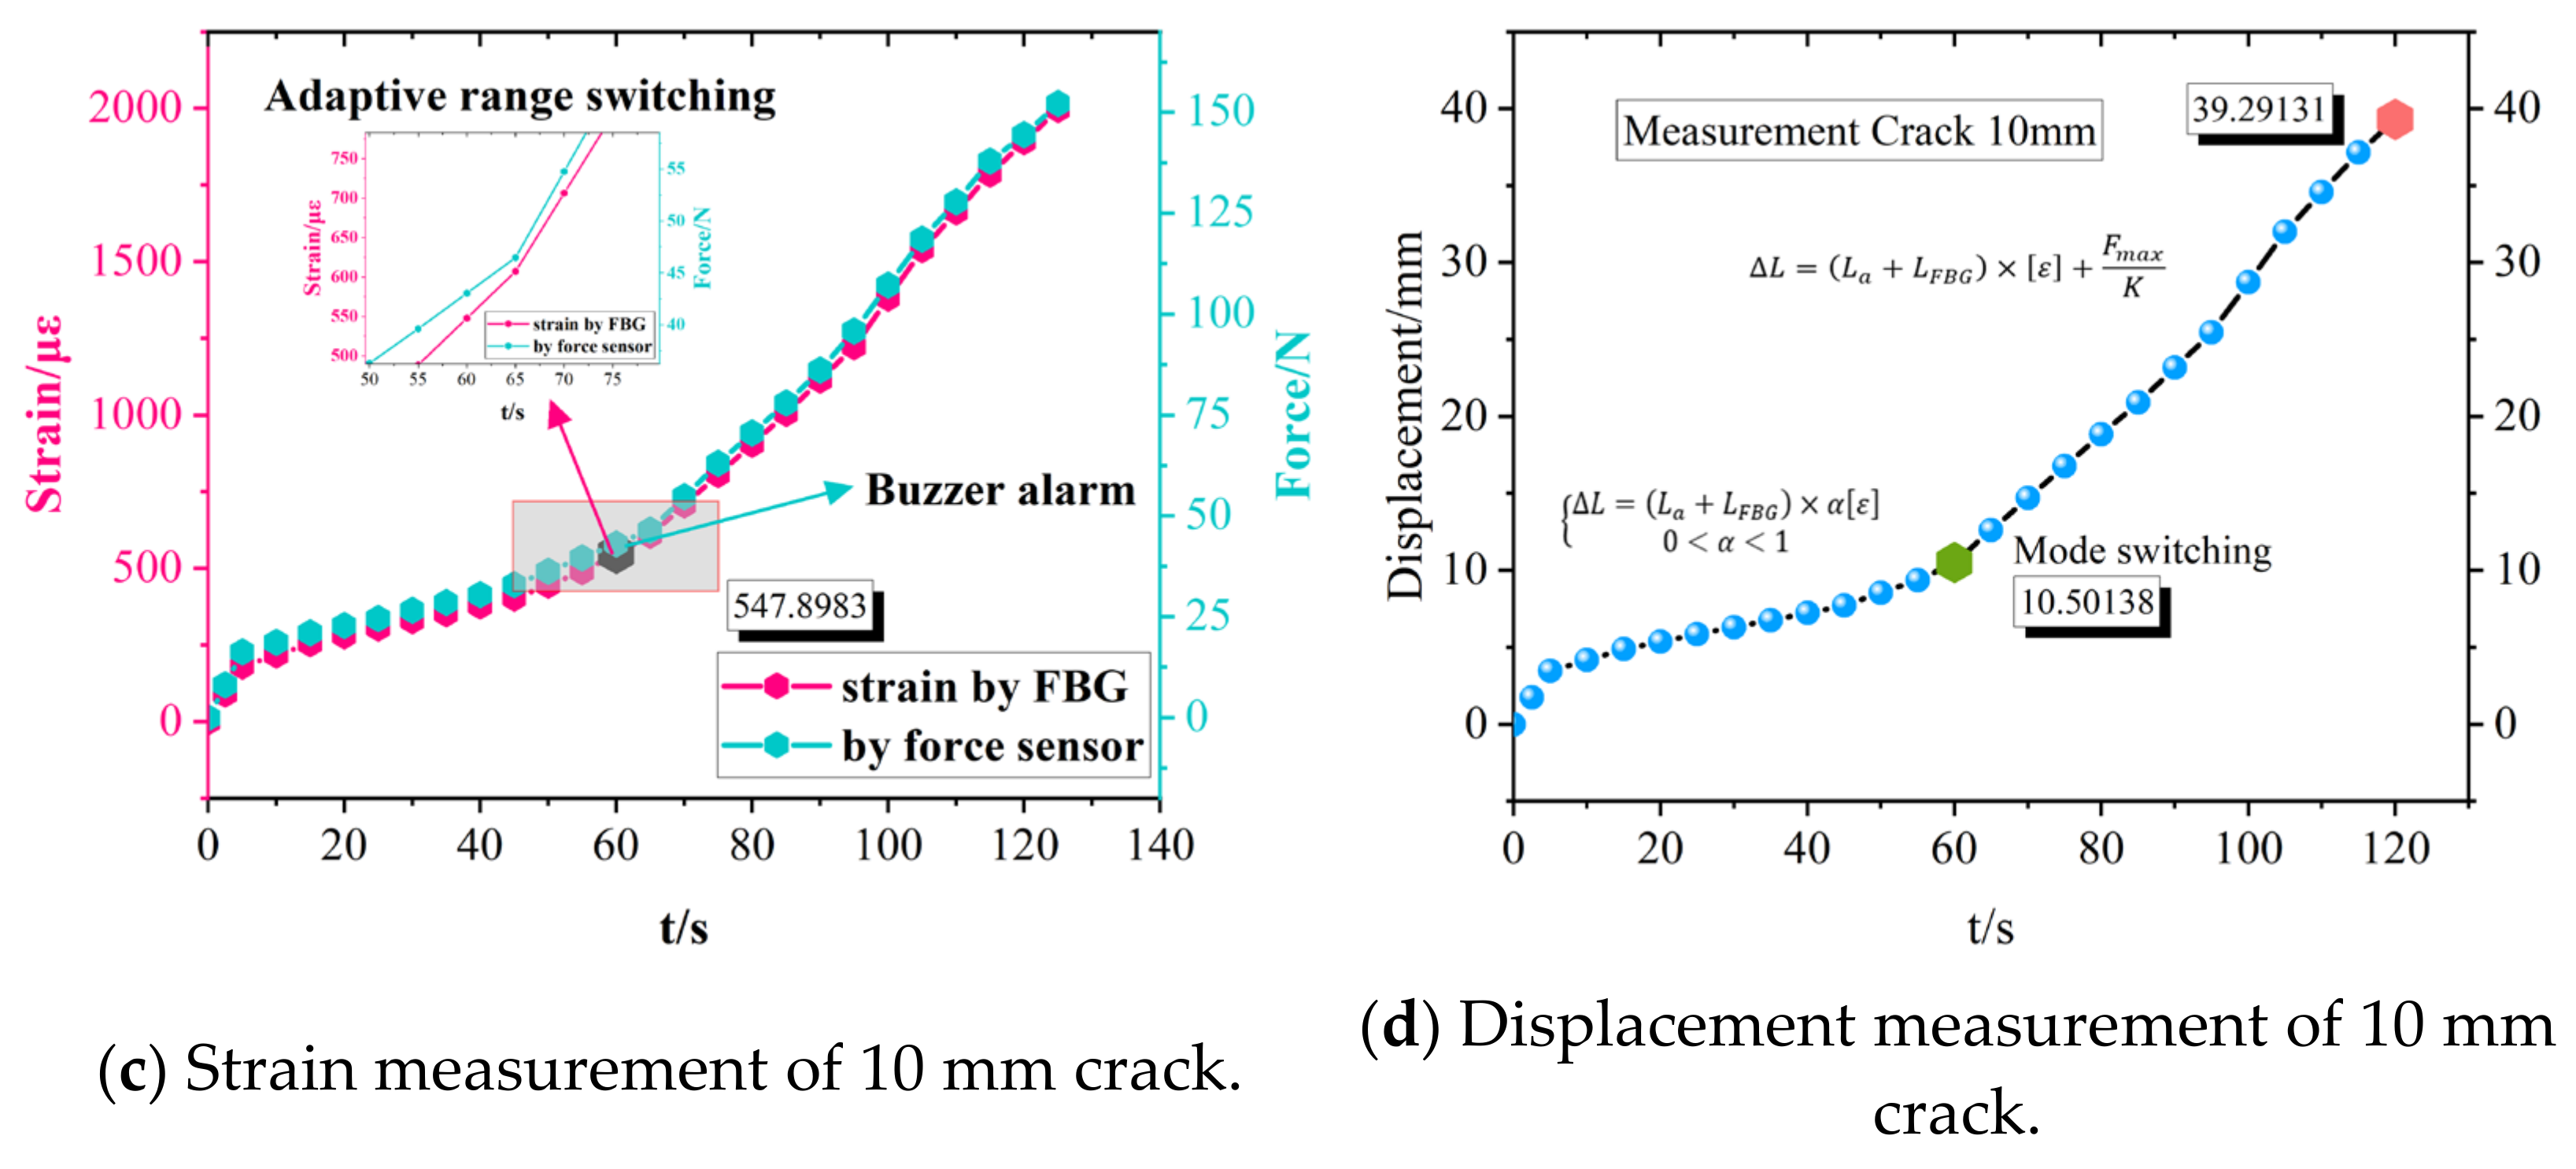
In this paper, a novel adaptive range strain sensor for structural cracks is developed to achieve crack propagation monitoring based on FBG sensing technology and by applying embedded technology. The sensor monitors the micro deformation of the structure using FBG, which has high strain sensitivity. The SCM system conducts real-time data processing and gives warnings when the displacement reaches the monitoring threshold. Both the micro deformation and the fractured displacement of the crack can be measured by the sensor in this way. The outline of this paper is as follows: first, the design and the sensing principle of the sensor are introduced. Then, the detailed packaging process of the sensor and the construction of the SCM system are presented. The ability of the sensor is then demonstrated by monitoring the standard specimens with cracks to measure the overall process of crack propagation. Finally, the adaptive range strain sensor is applied to the field measurement of an ocean platform, which verifies the feasibility of its application for crack monitoring.

2. Design and Sensing Principle

Cracks can be divided into three types: open type (type I), sliding type (type II) and tearing type (type III) [30,31], with regard to the form of the mechanical characteristics or the propagation direction. The propagation of a crack is divided into the initial stage, the propagation stage and the instability stage. The deformation is micro in the initial stage and the opening displacement is similar to the micro stage. The crack tip opening displacement caused by fatigue may be enlarged suddenly when the structure is subjected to an extreme external load or a long-term alternating load, which leads to large deformation and causes the strain variation to exceed the micro strain variation. In order to ensure the safety of offshore platforms, it is necessary to monitor the whole process of crack propagation. The crack propagation mode and failure rate are shown in Figure 3.
Traditional strain or displacement sensors are vulnerable to tensile failure when large deformation occurs induced by crack enlargement. It is very important to design a type of sensor that can accurately monitor the micro deformation of structural cracks and provide an early warning of structural cracking. This paper proposes a novel sensor for solving such a problem, and its principle of adaptive range switching is shown in Figure 4.

2.1. Schematic Design of the Sensor

As shown in Figure 5 the structure consists of two supports, a steel pipe, a spring, piston and an FBG sensor located between two fixed supports. The supports are used to clamp and fix. The end of the steel pipe is fixed onto one of the fixed supports, while the inner part of the other end is used to insert the piston. The spring is placed inside the steel pipe, one end is fixedly connected with the steel pipe, and the other end is fixedly connected with the piston. The piston has a through-line hole in the middle for the optical fiber to pass through. The piston is embedded inside the steel pipe through friction with the inner wall of the steel pipe. The through-line hole is cemented with the optical fiber as one end of the FBG sensor fulcrum. The other end of the FBG sensor is consolidated with the fixed support as its second fulcrum. The FBG grid area within the two supports is used to monitor the strain deformation of the structure surface.
Each part of the adaptive range strain sensor is composed and carried out based on the design and sensing principle. The FBG sensor is encapsulated by a 2.5 mm diameter steel pipe in the middle of a grating and two 3.0 mm diameter steel pipes on two sides. The steel pipe with a diameter of 3.0 mm is connected to the force sensor as one of the fulcrum points. The 3.5 mm-diameter extension steel pipe is used to connect one end of the FBG sensor, which is fixed inside the epoxy resin as the second fulcrum. The spring installed outside the extension steel tube is adhered to using epoxy resin with a diameter of 9 mm and a length of 10 mm at the right end. The FBG sensor and the spring are attached using epoxy resin (with a through-line hole in the middle), with a diameter of 9 mm and a length of 5 mm as the piston. The piston is embedded inside the 10 mm steel pipe through static friction force. The piston will pop out when the force reaches α ε for the FBG sensor. The spring is at the initial length when the piston does not move. The spring starts to work when the piston is ejected from the steel pipe. One side of the FBG sensor is fixed to the support while the other side is cemented to the piston. The piston passes through the optical fiber through the round hole. The force sensor and the 10 mm diameter steel pipe are fixed to the base and the cover plate, respectively. The parameters of the sensor structure are shown in Table 1.

2.2. Sensing Principle of the Sensor

The detailed functions of each component are as follows: the FBG encapsulated by tubes with increased sensitivity is mainly used to monitor structural microcracks for micro deformation. The force sensor with high precision serves as indicator of sudden fracture and large displacement of the structure when the load gradually increases. The piston is temporarily fixed when the axial force borne by the FBG sensor is less than the sliding friction between the piston and the inner wall of the steel pipe. The spring is connected in series with the FBG sensor. The spring is not involved in monitoring in the micro stage of crack growth. The spring is pulled out to intervene when the piston pops out of the steel pipe. The small-range mode switches to the large-range mode adaptively when the crack breaks and becomes a large deformation. The complete entity diagram of the adaptive range strain sensor is shown in Figure 6.
FBG is used as the main component for microscopic crack monitoring. The sensing principle of the FBG sensor is shown in Equation (1)
λ λ = v v = K T T + K ε ε
where λ and v represent the wavelength and frequency of light, respectively, and K T and K ε represent the temperature and strain calibration coefficients, respectively. The wavelength drift of optical fiber will be affected by both strain and temperature.
Through investigation and research, Ren et al. [32] proposed a fiber Bragg grating packaging method for increasing the strain sensitivity of an FBG strain sensor, and evaluated the strain transfer characteristics of sensors on different material plates through calibration and reliability tests. Jia et al. [33] used a fiber strain hoop sensor with an enhanced sensitivity package for pipeline corrosion monitoring research, and accurately obtained the leakage location based on a support vector machine using a high strain feedback mechanism.
The sensor has the characteristic of having a high sensitivity to strain range when monitoring the micro deformation stage of the structure due to its encapsulation method (Figure 7).
The encapsulated part adopts a negative thermal expansion material, and uses its thermal shrinkage and cold expansion material characteristics to counteract the influence of temperature on the wavelength of FBG by adjusting the length of the inner pipe and outer pipe.
In order to counteract the influence of temperature on wavelength drift as much as possible, we chose the packaging material suitable for the strain sensor of low temperature-sensitive fiber grating. The low temperature-sensitive FBG strain sensor in tube package does not need an additional temperature sensor.
For the adaptive sensor, the variable sensitivity is designed according to the crack growth scale and the span length at both ends when switching the range. The strain measurement of FBG in micro deformation monitoring can be described as:
L L a + L F B G = L F B G L F B G = ε = λ K e λ
where L F B G is the length of the FBG sensor part; L a represents the length of external steel pipe; L F B G denotes the relative deformation length of the FBG sensor; L stands for the average deformation length of output; and K e stands for the coefficient of FBG sensor. Then, the strain measurement from FBG sensor is obtained from the wavelength change of Bragg grating. The allowable strain of the FBG sensor monitoring threshold is ε . The small range size of the sensor can be obtained from Equation (2) as:
L = L a + L F B G × α ε 0 < α < 1  
The sensitivity decreases and the measuring range increases when the crack fracture failure becomes a large displacement, enabling the sensor to adapt to a large range. The maximum tensile is F m a x . The stiffness coefficient of the spring is defined as K . The large range size of the sensor can be described as:
L = L a + L F B G × ε + F m a x K
The spring stiffness in Equation (4) can be calculated by the following equation:
K = G d 4 8 D 3 n
where n is the effective number of coils in the spring; d represents the diameter of the material; D denotes the middle diameter of the spring; and G stands for the shear modulus.
The α in Equation (3) is the adaptive coefficient, which should not be more than the allowable strain of the fiber when it is designed, so as to ensure the accuracy of the monitored strain. The sensor switches adaptively to large-range mode when the strain of FBG reaches the α ε value. α can be specifically customized according to the characteristics of the strain monitoring materials. The conservative value of FBG for strain monitoring is 2000/1.2 = 1666.7 με = [ε]. The yield strength of ocean platform steel is 355–460 MPa, which means that 1690 με is identified as having failure risk. The micro deformation stage of the structure in the linear range should be selected for the stress assessment. The packaged method of enhanced sensitivity in this study can amplify the strain measurement range three times. Thus α can be customized to 33% for ε in this study, which is 550 με.

3. Electronic Warning System

3.1. Assembly of STM32 SCM System

Embedded technology has been applied in the damage monitoring of cracks and component joints [34,35]. An SCM system [36,37,38] as a microcontroller can achieve data transmission and control functions by working with different modules. Regarding the overall design, the structural deformation is measured using the FBG sensor in the small-range mode. Large displacement is determined from the tension data by the force sensor, which connects with the STM32 SCM system. The microprogrammed control unit (MCU) controls the buzzer, which warns when the tension reaches the set threshold. The tension data are transmitted to the computer via an ESP8266 WiFi module, which connects with MATLAB to establish the TCP communication protocol.
An STM32F103C8T6 minimum system board is used in the system. The main circuit consists of an H-bridge composed of resistance strain gauges, an analog/digital (A/D) converter chip HX711, an ESP8266 WiFi module and a buzzer. The A/D module is connected to the two I/O ports of the STM32 microcontroller through the SCK and DOUT pins. The processed AD value is sent to the WiFi module via serial communication. A wireless communication with a PC terminal is established to display the values of the tension sensor in large-range mode in real time. The internal voltage regulator circuit of HX711 can provide power for both the external tension sensor and the A/D converter inside the chip. The on-chip clock oscillator with a simple digital control function and a serial communication function does not require any external devices. The DT and SCK ports of HX711 are connected to PB7 and PB6 of the microcontroller, respectively. The working mode of PB7 and PB6 are set to floating input and push–pull output, respectively. The 24-bit precision AD values are read one bit by one bit from high to low through the DT output port by selecting channel A and gain 128. The RXD and TXD pins of the WiFi module are connected to PB10 and PB11 of the microcontroller, respectively. PB10 and PB11 are set to multiplexing push–pull output and floating input, respectively, to implement USART3 communication. The WiFi module is initialized, single STA working mode selected, WiFi connected, TCP communication selected, and transparent transmission mode finally entered. The function of transmission is realized by connecting the corresponding IP address and port number through MATLAB to establish TCP communication. The buzzer is controlled to vibrate and warn when the sensor value reaches the threshold in large-range mode. The passive buzzer is controlled by the high and low levels of the I/O port to trigger the on–off of the voltage, which generates the specific vibration frequency called PWM modulation. The I/O port of the buzzer is connected to the PA1 port of the MCU and set as push–pull output. The frequency of the buzzer is changed by changing the filling value and the prescaler value after setting the mode of TIM2 as PWM. The buzzer sounds when the tension threshold is reached. Figure 8 displays the control system hardware framework. Figure 9 shows the software flow chart.

3.2. Assemebly of Complete Sensor

As an intelligent and independent part, the SCM system can supply power independently and implement WiFi data transmission, effectively combining intelligent sensing technologies. The structure of the sensor is ultimately combined with the SCM system, including the FBG sensor, the force sensor, the STM32 minimum system board and other relative modules. The force sensor is connected to the STM32 SCM control system, which deals with the force data to calculate large displacement and provide timely warnings via the buzzer. The computer receives data from the SCM control system and the fiber optic demodulator. The sensor monitors the strain within the gauge length of the two fulcrum points via the FBG sensor in small-range mode, while measuring large displacement via the force sensor and the spring in large-range mode.

4. Experiment and Results

4.1. Calibrations Tests

The wavelength offset and strain change of the packaged FBG sensor needs to be calibrated and tested on the optical platform for the purpose of subsequent model testing. As shown in Figure 10, the calibration device includes the FBG sensor, the demodulation device, data acquisition equipment and an extensometer. The length L of the iso-strength beam is 188 mm, the thickness Y is 2 mm, the left side is completely fixed to form the cantilever beam and the displacement load is applied to the right side. As shown in Figure 11, load F is applied to the right end point A of the iso-strength beam. The deflection generated at free end A is ω A = 6 F L 3 E b h 3 . The force corresponding to A-end is F = E b h 3 ω A 6 L 3 . The bending moment at x distance from A-end is M x = E b h 3 ω A x 6 L 3 . Modulus of bending section W x = b x h 2 6 = b x h 2 6 L , among them b x = b × x L . Stress σ = M x W x = M x y I z = E b h 3 ω A x 6 L 3 · y · 12 L b x h 3 = 2 E ω A y L 2 , where y is the distance between the center of the sensor and the neutral axis and ω A is the deflection measured by the extensometer. Strain ε = 2 ω A y L 2 . Therefore, the strain of packaged FBG can be obtained by the deflection.
The current position and FBG wavelength should be recorded until the applied displacement reaches 5 mm once the dial number changes by 0.2 mm. The calibration is completed when the deflection increases to the designed range.
The FBG sensor calibration result is recorded in Figure 12a. The green line and its equation in the figure are obtained by line fitting. The slope is the sensitivity coefficient. Table 2 summarizes the coefficient and sensitivity errors of the three calibration tests of FBG sensor. It can be seen that the linearity of the three repeated calibration tests for the same FBG sensor are all above 0.999, and the relative errors of sensitivity are all below 2.5%, which shows good linearity and repeatability within the designed range. The variation of strain can be obtained by a wavelength shift of the FBG sensor through the calibration tests. Similarly, a digital display instrument is used to calibrate the force sensor, which determines the numerical relationship between the real force and the force processed by the AD conversion module. The stable value of the sensor is read repeatedly when it is under axial tension, and the average value is then taken. Subsequently, the real AD value is acquired when subtracting the AD value under tension from the initial value. The processed value is regarded as zero when it is negative. The processed value is divided by GapValue (a constant value determined by the calibration of the tension meter) to establish the real tension value when it is positive. It can be seen that the line linearity of the three repeated calibration tests for the same force sensor is always above 0.998, which proves that the linearity rate is accurate enough to read the force values. The force sensor calibration result is shown in Figure 12b. Table 3 summarizes the coefficient and sensitivity errors of the three calibration tests of force sensor.

4.2. Experimental Set-Up and Simulation

An experiment was designed to analyze the trend of crack propagation of the standard plate (Figure 13) in order to provide reference value for sensor monitoring, including two conditions of an 8 mm central crack and a 10 mm central crack. The experiment was carried out by universal tester. The parameters of the Q235 standard plate are shown in Table 4.
Firstly, the Q235 standard tensile specimen with a type I crack was customized based on the theory in the second section of this paper. The test adopted uniform rate loading mode. The tensile speed was set as 5 mm/min. The change in crack propagation width with displacement tensile load was analyzed.
Secondly, the finite element model was established by ABAQUS software. C3D8R unit was used for meshes. The elastic modulus was 206 GPa, Poisson’s rate is 0.3. The geometric parameters referred to the physical model. The boundary conditions were: one end was completely fixed and the other end was subjected to uniform tensile stress. The finite element simulation is shown in Figure 14.
The experimental data were compared with the FEA data, verifying that the finite element model simulation is accurate enough and provides a reliable index for crack analyzing cooperated with sensor monitoring. Figure 15a,b, respectively, show the test results of the Q235 standard plate with 8 mm crack damage and 10 mm crack damage compared with the FEA data.
As can be seen from the data in Table 5, the stress intensity and the variation range of strain of the components with crack damage are greatly reduced, and the strength decreases further with the increase in crack damage. The true limit stress difference between the undamaged standard plate and the plate with an 8 mm crack and the plate with a 10 mm crack is 273.97 MPa and 303.44 MPa, respectively, and the true limit strain is 0.215 and 0.216, respectively. The FEA curve data are consistent with the experimental curve data. The stress errors of the 8 mm crack and the 10 mm crack are 0.53% and 1.81%, respectively. Furthermore, the stress–strain curve of the crack tip is analyzed using the finite element model below, providing a reliable analysis index for monitoring the crack tip fracture. The FEA data show the stress–strain curve of the crack tip element (Figure 16). The value is higher than the measured average stress–strain due to stress concentration at the crack tip. The standard plate with the 8 mm crack first fails at element 4627 nearest to the crack tip, which is the beginning of fracture failure in the model. Similarly, the fracture starts at element 5169 of the model for the plate with the 10 mm crack. The ultimate stress at the crack tip is approximately 491.81 MPa and 516.69 MPa, respectively.
This section is used to introduce the crack propagation analysis test and finite element simulation, explore the crack failure form, and provide a reference method for the application of sensors in engineering monitoring to extract and analyze the information of the surrounding area of crack damage.

4.3. Performance Study of the Sensor

The sensor was applied to the surface of a Q235 standard specimen with crack damage to verify its monitoring characteristics of adaptive range and variable sensitivity, which are essential for application in SHM. A diagram of the experimental device is shown in Figure 17. The two-component epoxy resin was smeared onto the supports, pasted onto the surface of the structure. The specimen was fixed on the universal tensile testing machine after the glue was fully cured. The FBG sensor was connected to the demodulator. The force sensor was connected to the STM32 SCM system. The crack monitoring data were collected by PC when the displacement load was applied by the tensile testing machine after the test was prepared.
As shown in Table 6 and Table 7, the sensor is used to monitor the standard plate with the 8 mm crack and the 10 mm crack, respectively. The absolute error (AE) proves that the sensor has a good effect on monitoring the crack growth width by comparing the experimental data with the FEA data.
The sensor measurement results are shown in Figure 18. The (a) and (b) curves, respectively, reveal the strain measurement results of the 8 mm crack and the 10 mm crack. showing that the two sensors have high consistency and that adaptive range switching occurs at the inflection point of the curve. The sensor detected a small strain of 534.88 με and 547.90 με at the inflection point, respectively, and a large deformation of 38.9 mm and 39.3 mm, respectively. The beginning of a crack fracture was 10.25 mm and 10.50 mm in the monitoring experiment of standard specimens with crack damage. The error is small compared with the FEA data. The results demonstrate that the sensor has high precision in elastic measurement and an adaptive ability to monitor a large-scale displacement of the structure.

4.4. Field Application of Sensor on Ocean Platform

It is of great significance to continuously monitor and protect the damaged areas of aging offshore platforms, as the number of aging offshore platforms is increasing year by year in the Chinese Bohai Sea. For the stress detection of aging offshore platforms, the current specification does not clearly explain the specific implementation method, so we preliminarily applied adaptive sensors and used sensing tape for auxiliary measurement. Here, the developed sensor is applied to the aging jacket platform for field strain monitoring, which could provide potential value for the residual life assessment of the stress detection of the aging platform. The CB805 jacket platform is shown in Figure 19. The high-stress area is selected for sensor placement through field observation and previous finite element analysis. The adaptive range strain sensor was placed in the high stress critical area, and the distributed sensing tapes were arranged around it to obtain the strain field parameters around the crack damage, so as to realize the quasi-distributed measurement of the local crack damage area of the jacket platform. External excitation is applied by binding rope at the pile leg, which is dragged by the ship. The stress information of the pile leg and pipe joint is fed back by the strain response measured by the adaptive strain sensor and the surrounding distributed sensing tapes. The field monitoring data are shown in Table 8. Based on the field measurement results, it can be seen that the maximum fluctuation of the extreme value of the adaptive strain crack sensor in the high stress zone is 57.9με, and the maximum tensile strain and compressive strain are 13.3με and 44.6με, respectively. Similarly, the maximum fluctuation of the extreme value of the FBG strain sensor in the high stress zone is 54.1με, and the maximum tensile strain and compressive strain are 11.8με and 42.3με, respectively. The primary comparison results verify that the adaptive sensor can ensure the accuracy of micro-crack monitoring. The analysis results show that the adaptive strain sensor maintains the micro strain monitoring state of high strain sensitivity, and no cracking signal of structural fracture is detected. No large deformation can be seen by the naked eye from the field observation of the structure as well due to the high stiffness of offshore platform. In addition, the maximum fluctuation measured by the distributed sensing tapes along the horizontal direction is 33.8με, while the maximum tensile strain and the maximum compressive strain are 11.5με and 27.0με, respectively. The sensing tapes show the state of the strain field in the area around the stress monitoring, which is of great reference significance for subsequent stress assessment if required by relevant codes. The data of field monitoring are shown in Figure 20.
The above describes the field application of the adaptive crack monitoring strain sensor. The sensor is placed in the high-stress area with distributed sensing tapes around it to achieve a measurement of the local hotspot in the offshore platform. The measured data verify that the developed sensor responds well and maintains high sensitivity in the small deformation process of strain monitoring. The data from around the crack damage area and the surrounding strain field will provide reference significance for stress analysis and the life extension evaluation of aging offshore platforms. The sensor has potential value for monitoring large deformations when offshore platforms are in extreme sea conditions based on its adaptive property.
Finally, we compare the adaptive sensor with the common fiber optic strain sensor to evaluate its performance advantages and the areas that need to be optimized. Table 9 shows the comparison of sensor parameters.
According to the parameters in the table, the measuring range of the adaptive sensor is between the strain sensor and the displacement sensor, which can realize the measurement of two ranges with one structure. Through the enhanced-sensitivity packaging of FBG, the temperature coefficient and strain coefficient are improved, which makes it more accurate in measuring the micro-structural variation. The volume of SCM units in large-range mode is larger than that of conventional sensors. It is expected that this part will be integrated into the sensor integrated demodulation system.

5. Conclusions

For ocean platforms, crack monitoring is essential to ensure engineering safety and to provide timely maintenance. A novel adaptive range strain sensor for structural cracks was designed to measure the complete process of crack propagation from micro to fracture failure in this paper. The monitoring principle of the sensor is introduced. The structural design and function realization of the sensor are described in detail. The sensor was used to monitor a standard sheet with crack damage. The overall process of monitoring crack propagation was realized to verify the high strain sensitivity of the sensor and its adaptivity to a large range. The sensor was then applied to the field monitoring of a jacket platform in the Bohai Sea, which proved that the sensor is suitable for crack monitoring in ocean platforms. The following conclusions can be drawn:
  • Different design ranges and monitoring scales can be obtained by changing the structural parameters of the device to meet the actual monitoring needs for ocean platforms.
  • The experimental results show that the sensor can accurately monitor strain changes and adapt to large deformations according to its structural design. The sensor can monitor micro deformation and even crack germination in the small deformation stage. It can also monitor the crack fracture failure process with large displacements in the large deformation stage.
  • The fracture monitoring of type I cracks using this sensor is basically consistent with the FEA value. The accuracy of the sensor is reliable in the design range.
  • The sensor was applied in the field monitoring of an ocean platform to ascertain the stress state, proving that it has excellent application potential for evaluating aging ocean platforms in service.

Author Contributions

Conceptualization, Z.J.; methodology, G.M. and X.S.; software, G.M. and Y.L.; validation, Z.J., G.M. and Y.L.; formal analysis, X.S.; investigation, C.X., S.Y. and X.Y.; resources, Z.J. and C.Q.; data curation, G.M.; writing—original draft preparation, G.M.; writing—review and editing, Z.J. and C.Q.; visualization, G.M., X.S. and Y.L.; supervision, Z.J.; project administration, G.M.; funding acquisition, Z.J. and C.Q. All authors have read and agreed to the published version of the manuscript.

Funding

This work has been supported by the National Key R&D Program of China (grant number 2019YFB1504303), the National Natural Science Foundation of China (grant number 52078100), Fundamental Research Funds for the Central Universities (grant number DUT22JC19), Anhui international joint research center of data diagnosis and smart maintenance on bridge structures (grant number 2022AHGHYB03).

Institutional Review Board Statement

Not applicable.

Informed Consent Statement

Not applicable.

Data Availability Statement

Not applicable.

Conflicts of Interest

The authors declare no conflict of interest.

References

  1. Zhao, X.; Du, W.; Cao, C.; Chen, Y.; Yin, L. Effect of Crack on Dynamic Characteristics of Simple Supported Beam. IOP Conf. Ser. Mater. Sci. Eng. 2019, 470, 012041. [Google Scholar] [CrossRef]
  2. Dai, T.-T.; Jia, Z.-G.; Ren, L.; Li, Y.-T.; Ma, G.-D. Design and experimental study on FBG-based crack extension monitoring sensor. Opt. Fiber Technol. 2022, 71, 102946. [Google Scholar] [CrossRef]
  3. Zhao, W.; Feng, G.; Zhang, M.; Ren, H.; Sinsabvarodom, C. Effect of low temperature on fatigue crack propagation rates of DH36 steel and its butt weld. Ocean. Eng. 2020, 196, 106803. [Google Scholar] [CrossRef]
  4. Tong, Z.; Wentao, N.I.U.; Qing, D.; Cheng, X. Crack Corrosion Simulation of H62 Copper Alloy Coating Under Damage Condition. J. Phys. Conf. Ser. 2020, 1699, 012032. [Google Scholar] [CrossRef]
  5. Qu, C.; Yi, T.; Yao, X.; Li, H. Complex frequency identification using real modal shapes for a structure with proportional damping. Comput. Civ. Infrastruct. Eng. 2021, 36, 1322–1336. [Google Scholar] [CrossRef]
  6. Chun-Xu, Q.; Ting-Hua, Y.; Hong-Nan, L. Modal identification for superstructure using virtual impulse response. Adv. Struct. Eng. 2019, 22, 3503–3511. [Google Scholar]
  7. Lima, R.A.A.; Migliavacca, F.; Martulli, L.M.; Carboni, M.; Bernasconi, A. Distributed fibre optic monitoring of mode I fatigue crack propagation in adhesive bonded joints and comparison with digital image correlation. Theor. Appl. Fract. Mech. 2022, 121, 103501. [Google Scholar] [CrossRef]
  8. Lin, S.; Narita, F.; Shindo, Y. Electroelastic analysis of a penny-shaped crack in a piezoelectric ceramic under mode I loading. Mech. Res. Commun. 2003, 30, 371–386. [Google Scholar] [CrossRef]
  9. Zhou, H.; Liu, Y.; Lu, Y.; Dong, P.; Guo, B.; Ding, W.; Xing, F.; Liu, T.; Dong, B. In-situ crack propagation monitoring in mortar embedded with cement-based piezoelectric ceramic sensors. Constr. Build. Mater. 2016, 126, 361–368. [Google Scholar] [CrossRef]
  10. Manterola, J.; Aguirre, M.; Zurbitu, J.; Renart, J.; Turon, A.; Urresti, I. Using acoustic emissions (AE) to monitor mode I crack growth in bonded joints. Eng. Fract. Mech. 2020, 224, 106778. [Google Scholar] [CrossRef]
  11. Arun, N.; Amarteja, K.; Kolluru, V.L.S. PZT sensor array for local and distributed measurements of localized cracking in concrete. Smart Mater. Struct. 2018, 27, 075049. [Google Scholar]
  12. Zhang, H.; Li, J.; Kang, F.; Zhang, J. Monitoring and evaluation of the repair quality of concrete cracks using piezoelectric smart aggregates. Constr. Build. Mater. 2022, 317, 125775. [Google Scholar] [CrossRef]
  13. Wolf, J.; Pirskawetz, S.; Zang, A. Detection of crack propagation in concrete with embedded ultrasonic sensors. Eng. Fract. Mech. 2015, 146, 161–171. [Google Scholar] [CrossRef]
  14. Unterreitmeier, M.; Nagler, O.; Pfitzner, L.; Weigel, R.; Holmer, R. An acoustic emission sensor system for thin layer crack detection. Microelectron. Reliab. 2018, 146, 16–21. [Google Scholar] [CrossRef]
  15. Chen, L.; Cikalova, U.; Bendjus, B.; Gommlich, A.; Sudip, S.R.; Schott, C.; Steingroewer, J.; Belting, M.; Kleszczynski, S. Laser speckle photometry—Optical sensor systems for condition and process monitoring. Mater. Test. 2019, 61, 213–219. [Google Scholar] [CrossRef]
  16. Lingyan, D.; Dagmar, R.D.; Ludwig, C. Recent progress on flexible and stretchable piezoresistive strain sensors: From design to application. Prog. Mater. Sci. 2020, 114, 100617. [Google Scholar]
  17. Wu, Y.-H.; Liu, H.-Z.; Chen, S.; Dong, X.-C.; Wang, P.-P.; Liu, S.-Q.; Lin, Y.; Wei, Y.; Liu, L. Channel Crack-Designed Gold@PU Sponge for Highly Elastic Piezoresistive Sensor with Excellent Detectability. ACS Appl. Mater. Interfaces 2017, 9, 20098–20105. [Google Scholar] [CrossRef]
  18. Wu, J.; Jiang, H.; Su, J.; Shi, B.; Jiang, Y.; Gu, K. Application of distributed fiber optic sensing technique in land subsidence monitoring. J. Civ. Struct. Health Monit. 2015, 5, 587–597. [Google Scholar] [CrossRef]
  19. Gautam, A.; Kumar, A.; Singh, R.R.; Priye, V. Optical sensing and monitoring architecture for pipelines using optical heterodyning and FBG filter. Optik 2016, 127, 9161–9166. [Google Scholar] [CrossRef]
  20. Henault, J.M.; Quiertant, M.; Delepine-Lesoille, S.; Salin, J.; Moreau, G.; Taillade, F.; Benzarti, K. Quantitative strain measurement and crack detection in RC structures using a truly distributed fiber optic sensing system. Constr. Build. Mater. 2012, 37, 916–923. [Google Scholar] [CrossRef]
  21. Song, Y.; Liu, X.; Zhang, D.; Fan, X.; Cui, R.; Zheng, Y.; Wang, Y. A grating coating sensor for quantitative monitoring of metal structure cracks under varying ambient temperature. Measurement 2022, 192, 110919. [Google Scholar] [CrossRef]
  22. Wan, K.T.; Leung, C.K. Fiber optic sensor for the monitoring of mixed mode cracks in structures. Sens. Actuators A Phys. 2007, 135, 370–380. [Google Scholar] [CrossRef]
  23. Han, T.; Wu, G.; Lu, Y. Crack monitoring using short-gauged Brillouin fiber optic sensor. Measurement 2021, 179, 109461. [Google Scholar] [CrossRef]
  24. Noah, O.; Christopher, K.Y.L.; Aidong, M. Crack sensing with a multimode fiber: Experimental and theoretical studies. Sens. Actuators A. Phys. 2004, 118, 268–277. [Google Scholar]
  25. Rodriguez, G.; Casas, J.R.; Villalba, S. Shear crack width assessment in concrete structures by 2D distributed optical fiber. Eng. Struct. 2019, 195, 508–523. [Google Scholar] [CrossRef]
  26. Yandy, A.M.M.; Duchowicz, R.; Russo, N.A.; Cruz, J.L.; Andrés, M.V. Development and analysis of a model based on chirped fiber Bragg gratings employed for cracks characterization in materials. Opt. Commun. 2018, 426, 401–409. [Google Scholar] [CrossRef]
  27. Bernasconi, A.; Martulli, L.M.; Carboni, M. Fatigue crack growth analysis in composite bonded joints by back face distributed strain sensing and comparison with X-ray microtomography. Int. J. Fatigue 2022, 154, 106526. [Google Scholar] [CrossRef]
  28. Luo, D.; Yue, Y.; Li, P.; Ma, J.; Zhang, L.l.; Ibrahim, Z.; Ismail, Z. Concrete beam crack detection using tapered polymer optical fiber sensors. Measurement 2016, 88, 96–103. [Google Scholar] [CrossRef]
  29. Tsuda, H.; Lee, J.R.; Guan, Y.; Takatsubo, J. Investigation of fatigue crack in stainless steel using a mobile fiber Bragg grating ultrasonic sensor. Opt. Fiber Technol. 2006, 13, 209–214. [Google Scholar] [CrossRef]
  30. Paolo, S.V. A Physically Consistent Virtual Crack Closure Technique for I/II/III Mixed-mode Fracture Problems. Procedia Mater. Sci. 2014, 3, 1983–1987. [Google Scholar]
  31. Kravchenko, S.G.; Kravchenko, O.G.; Sun, C.T. A two-parameter fracture mechanics model for fatigue crack growth in brittle materials. Eng. Fract. Mech. 2014, 119, 132–147. [Google Scholar] [CrossRef]
  32. Ren, L.; Chen, J.; Li, H.-N.; Song, G.; Ji, X. Design and application of a fiber Bragg grating strain sensor with enhanced sensitivity in the small-scale dam model. Smart Mater. Struct. 2009, 18, 035015. [Google Scholar] [CrossRef]
  33. Jia, Z.; Wang, Z.; Sun, W.; Li, Z. Pipeline Leakage Localization Based on Distributed FBG Hoop Strain Measurements and Support Vector Machine. Optik 2018, 176, 1–13. [Google Scholar] [CrossRef]
  34. Feng, Q.; Cui, J.; Wang, Q.; Fan, S.; Kong, Q. A feasibility study on real-time evaluation of concrete surface crack repairing using embedded piezoceramic transducers. Measurement 2018, 122, 591–596. [Google Scholar] [CrossRef]
  35. Qian, F.; Qingzhao, K.; Gangbing, S. Damage detection of concrete piles subject to typical damage types based on stress wave measurement using embedded smart aggregates transducers. Measurement 2016, 88, 345–352. [Google Scholar]
  36. Wang, T.; Chen, T.; Hu, Y.; Zhou, X.; Song, N. Design of intelligent LED lighting systems based on STC89C52 microcomputer. Optik 2018, 158, 1095–1102. [Google Scholar] [CrossRef]
  37. Yishan, Z.; Jun, Q. Designs of a fire detecting and fire pre-warning system based on single chip microcomputer. Procedia Eng. 2010, 7, 360–365. [Google Scholar]
  38. Liang, Y.J.; Liu, J.F.; Zhang, Q.P.; Mu, L.L. Planar location of the simulative acoustic source based on fiber optic sensor array. Opt. Fiber Technol. 2010, 16, 140–145. [Google Scholar] [CrossRef]
Figure 1. Cracks of an ocean platform.
Jmse 10 01710 g001
Figure 2. Finite element simulation.
Jmse 10 01710 g002
Figure 3. The crack propagation mode and failure monitoring.
Jmse 10 01710 g003
Figure 4. The crack monitoring and mode switching of adaptive range strain sensor.
Jmse 10 01710 g004
Figure 5. Schematic diagram of sensor structure.
Jmse 10 01710 g005
Figure 6. Adaptive range strain sensor.
Jmse 10 01710 g006
Figure 7. Enhanced sensitivity package: (a) Packaging principle of detailed design, (b) Physical diagram of FBG sensor.
Jmse 10 01710 g007
Figure 8. Control system hardware framework.
Jmse 10 01710 g008
Figure 9. Flow chart of the software.
Jmse 10 01710 g009
Figure 10. Calibration device.
Jmse 10 01710 g010
Figure 11. Calibration diagram of iso-strength beam.
Jmse 10 01710 g011
Figure 12. The calibration results.
Jmse 10 01710 g012
Figure 13. Establishment of test system.
Jmse 10 01710 g013
Figure 14. Finite element simulation: (a) Crack propagation, (b) details of meshing.
Jmse 10 01710 g014
Figure 15. Experimental data of universal drawing machine.
Jmse 10 01710 g015
Figure 16. Finite element simulation data of crack tip.
Jmse 10 01710 g016
Figure 17. Diagram of experimental device.
Jmse 10 01710 g017
Figure 18. Sensor measurement results.
Jmse 10 01710 g018aJmse 10 01710 g018b
Figure 19. Field application of sensors.
Jmse 10 01710 g019
Figure 20. The curve data of field monitoring.
Jmse 10 01710 g020aJmse 10 01710 g020b
Table 1. Sensor structure parameter.
Material ParameterSizeUnit
Diameter (packaging part)2.5mm
Diameter (clamping part)3.0mm
Diameter (extension part)3.5mm
Length (FBG sensor part)32.5mm
Length (shaft end steel pipe)25mm
Length (force sensor)10mm
Spring stiffness47.4N/mm
Table 2. FBG calibration result data.
Calibration TimesLinearitySensitivity CoefficientRelative Error
10.99940.708 pm/με2.32%
20.99930.728 pm/με2.36%
30.99940.715 pm/με2.28%
Table 3. Force sensor calibration result data.
Calibration TimesLinearitySensitivity CoefficientRelative Error
10.99943.58 AD/N3.13%
20.99844.05 AD/N3.32%
30.99844.08 AD/N3.48%
Table 4. Geometric parameters of Q235 standard plate.
ParameterSizeUnit
Length270mm
Width20mm
Thickness2mm
Gauge length120mm
Clamping width35mm
The arc radius15mm
Table 5. The data of tensile test.
PlateTrue Limit StressTrue Limit StrainFEA Limit StressFEA Limit Strain
No crack509.990.230--
8 mm crack236.020.015234.770.0149
10 mm crack206.550.014202.820.0136
Table 6. Comparison of extended width of FEA and experiment for an 8 mm crack.
Crack (8 mm)Width of Extension (mm)
Force(N)DISP (expt.)DISP (FEA)AE
36001.651.670.02
53001.982.010.03
76002.672.690.02
95005.835.840.01
10,4009.389.420.04
11,30017.3717.420.05
Table 7. Comparison of extended width of FEA and experiment for a 10 mm crack.
Crack (10 mm)Width of Extension (mm)
Force(N)DISP (expt.)DISP (FEA)AE
32001.561.590.03
60002.172.290.02
75002.822.850.03
98006.836.870.04
10,60011.8311.870.04
11,20016.1316.180.05
Table 8. The field monitoring data.
Sensor TypeLocationWavelengthCoefficient SensitivityStrain (με)
Adaptive sensorThe pile legs1525.8 nm1/3.05−44.6  13.3
FBG strain sensorThe pile legs1533.4 nm1/2.62−42.3  11.8
Sensing tapes-1.1The pile legs1536.2 nm1.2−4.0  4.1
Sensing tapes-1.2The pile legs1541.3 nm1.2−4.1  3.9
Sensing tapes-1.4The pile legs1545.6 nm1.2−3.1  3.9
Sensing tapes-2.1The pile legs1537.5 nm1.2−0.8  8.8
Sensing tapes-2.2The pile legs1540.5 nm1.2−2.8  6.1
Sensing tapes-3.1The pile legs1533.7 nm1.2−4.9  7.2
Sensing tapes-3.2The pile legs1537.4 nm1.2−2.2  11.5
Sensing tapes-4.1The pile legs1541.6 nm1.2−2.2  7.4
Sensing tapes-4.2The pile legs1544.3 nm1.2−27.0  6.8
Sensing tapes-4.4The pile legs1537.4 nm1.2−2.2  11.8
Sensing tapes-5.1Cross arm1551.5 nm1.2−7.5  5.1
Sensing tapes-5.2Cross arm1559.4 nm1.2−6.2  5.5
Table 9. The comparison of sensor parameters.
Sensor TypeCommon Strain SensorFBG Displacement SensorAdaptive Range Sensor
Sensitivity0.5 με0.05%F.S.0.5 με
Range±1500 με0–100 mm±1500 με–50 mm
Resolution0.1 °C0.1 °C0.05 °C
Temperature coefficient10.5 pm/°C10.5 pm/°C1.5 pm/°C
Strain coefficient1.2 pm/με1.2 pm/με3.6 pm/με
Publisher’s Note: MDPI stays neutral with regard to jurisdictional claims in published maps and institutional affiliations.

