Article

A Combined Measurement Method for the Seafloor Positioning, Navigation, and Timing Network

1
School of Geodesy and Geomatics, Wuhan University, Wuhan 430079, China
2
Institute of Marine Science and Technology, Wuhan University, Wuhan 430079, China
*
Author to whom correspondence should be addressed.
J. Mar. Sci. Eng. 2022, 10(11), 1664; https://doi.org/10.3390/jmse10111664
Submission received: 7 October 2022 / Revised: 30 October 2022 / Accepted: 2 November 2022 / Published: 4 November 2022

Abstract

:
The idea of constructing the “GNSS-like” seafloor geodetic network for underwater positioning, navigation, and timing (PNT) has been proposed by many countries. Based on this idea, this paper introduces the principle of the seafloor PNT network and provides a combined measurement method, including the absolute positioning and the relative positioning. Experimental results show that the positioning difference between the proposed method and circle-sailing positioning is approximately 10 cm, and the observation efficiency is higher than the existing measurement in the seafloor PNT network. In addition, a model is derived to determine the optimal configuration of the unit network (the basic component of the seafloor PNT network), considering the ranging capability of acoustic beacons, which is helpful to balance the side length of the unit network and the number of observation sessions in the relative positioning. Finally, a chain coordinate transfer strategy in the whole seafloor PNT network is proposed, and the positions where the absolute positioning should be carried out in the whole network are derived based on the conditional adjustment model. Based on this strategy, the design schemes of a seafloor PNT network with centimeter, decimeter, and meter positioning accuracy when the acoustic velocity measuring accuracy is 0.02 m/s and the time measuring accuracy is 10−5 s, are given in the experimental section.

1. Introduction

The marine geodetic network is the reference frame for all marine activities. It consists of buoy datum stations on the ocean surface, mobile datum stations in the water, and the seafloor geodetic network [1]. The seafloor geodetic network is the most important component of the marine geodetic network owing to its good stability and high positioning accuracy, which plays a very important role in ocean engineering [2]. In recent years, coastal states have paid more and more attention to the construction of seafloor geodetic networks. Some countries or organizations, such as the United States, Japan, China, and the European Union, have established seafloor geodetic networks in some waters, which mainly serve marine environment monitoring and seafloor crustal deformation observation [3,4,5,6]. The seafloor geodetic network for observing seafloor crustal deformation has three main forms, including the direct-path acoustic network, the indirect-path acoustic network, and the Global Navigation Satellite System-Acoustic (GNSS-A) network [7]. In the direct-path acoustic network (Figure 1a), two precision acoustic beacons are placed on faults, and repeated interrogations over months to years measure the fault displacement. To overcome the influence of the pressure on the propagation of acoustic waves in the direct-path network, the indirect-path network was invented (Figure 1b), in which at least three seafloor acoustic beacons are deployed, and a floating unit with a depth sensor is added several hundred meters above the beacons [8]. To overcome the effect of seawater stratification on acoustic ranging, researchers have further improved the arrangement of acoustic beacons on the seafloor; three or more beacons are evenly spaced around the perimeter of a circle with a radius of the water depth, which is called the GNSS-A network (Figure 1c). In the GNSS-A network, the positioning of the seafloor acoustic beacon is realized by combining the coordinates of the onboard transducer provided by the GNSS system with the geometric distance between the onboard transducer and the seafloor beacon [9,10,11].
With the increase in marine activities, the application scope of the seafloor geodetic network has been expanded, such as in underwater positioning, navigation, and timing (PNT) for survey ships on the surface and underwater vehicles. In 2015, the American Defense Advanced Research Projects Agency (DARPA) announced the development of the Positioning System for Deep Ocean Navigation (POSYDON), which aims to provide omnipresent, robust positioning for ships and submarines across ocean basins by establishing the “GNSS-like” underwater navigation system, that is, the long baseline hydroacoustic positioning network (called the seafloor PNT network for short) using low-frequency sonar [12]. In 2016, China launched the national key research and development project named Marine Geodetic Datum and Marine Navigation and Positioning Technology, which aims to construct the large-scale seafloor PNT network [13,14]. The idea of underwater PNT is as shown in Figure 1d. The network is achieved by first deploying sonar beacons (similar to satellites) on the seabed to form a seafloor geodetic network, and determining the coordinates of all seafloor sonar beacons. Vehicles can then obtain their coordinates by range intersection positioning using acoustic signals (similar to satellite signals) from the seabed sonar beacons with known coordinates. However, the limited coverage area and specialized purpose make it difficult to serve large-scale underwater PNT for the direct-path acoustic network, indirect-path acoustic network, and GNSS-A network. Therefore, how to construct the underwater PNT network is a new question to discuss.
Similar to the terrestrial geodetic network, a large-scale seafloor PNT network is generally composed of several unit networks, such as the white triangles and squares in Figure 1d. Therefore, it is necessary to formulate a scheme for the optimization of the whole network before deploying sonar beacons from the cost, reliability, and precision views. Up to now, many scholars have carried out research on the optimization of the geodetic network. In 1974, Grafarend proposed four orders for designing the geodesic network, including designing the best datum and coordinate system of the network, designing the best configuration of the network, designing the suitable precision of the observations and types of observations, and designing the expansion or densification of the network [15]. Based on the four orders, in 1985, Koch mentioned the optimum configuration problem of the geodetic network first and used the quadratic programming and linear complementary problem to obtain the position changes or configuration of the network in an optimal way [16]. In 2007, Eshagh and Kiamehr put forward a strategy for the optimum design of the geodetic network using optimization models from a mathematical point of view [17]. In 2009, Bagherbandi et al. obtained the optimum configuration and observation weights in geodetic networks considering the postulated reliability and precision requirements [18]. In 2017, Horemuž and Jansson investigated the optimum horizontal location of the total station in a simple network in which a total station measures several control points in the process of being established [19]. In the following year, Alizadeh et al. investigated the optimal vertical placement of the total station with the variances criterion that related to the sum of total station coordinates and orientations [20]. The studies mentioned above mainly focused on the terrestrial geodetic network, while only a few scholars have studied the optimization of the seafloor PNT network. In 2020, Yang et al. gave the basic principles of the seafloor PNT network design. They believed that three sonar beacons can determine the 3D position of the underwater vehicle, so a equilateral triangle should be the optimal configuration of the unit network in the underwater PNT network. If the redundancy is taken into consideration, then at least four necessary reference points and one redundant reference point constitute the simplest network type, that is, an equilateral pentagon should be the optimal configuration of the unit network in the underwater PNT network [21]. However, the conclusion comes from experience and has not been proven by strict theory, and at present there is no strict optimization theory and design principle of the seafloor PNT network.
With the rapid development of GNSS positioning technology, the impact of a terrestrial geodetic networks’ configuration on positioning accuracy has become less prominent [22]. Moreover, because the electromagnetic wave is easily attenuated in water while the acoustic wave can travel great distances, the underwater positioning mode mainly depends on the acoustic wave [23]. Therefore, it is not applicable to directly transplant the optimization principle of the terrestrial geodetic network into the seafloor PNT network. Given the present situation, this paper studies the optimal design of the seafloor PNT network on the basis of Grafarend’s four orders for designing the geodesic network. The research tasks are as follows. Firstly, the positioning method of seabed control points in the underwater PNT network will be studied, based on which there are two main questions that need to be explored. One is the best configuration of the unit network, that is, how long should the side length of the unit network be and how many observation sessions should be carried out during the observation period under different positioning precisions. The other is how to ensure the positioning accuracy of seafloor control points during the expansion of the underwater PNT network.
The remainder of this paper is organized as follows. In Section 2, the measurement method and adjustment model of the seafloor PNT network are presented. In Section 3, the best configuration of the unit network in the seafloor PNT network is introduced. In Section 4, a chain coordinate transfer strategy is proposed to determine the distribution of the known control points in the expansion of the seafloor PNT network. Section 5 presents an experiment to prove the applicability of the proposed method in Section 2 and shows the layout schemes of seafloor PNT networks with centimeter, decimeter, and meter level precision on the basis of Section 3 and Section 4. Finally, conclusions are drawn in Section 6.

2. The Combined Measurement Method for the Seafloor PNT Network

It is necessary to first determine the coordinates of all control points in the seafloor PNT network according to the principles of underwater PNT. At present, the most commonly used method to determine the coordinates of underwater control points is circle-sailing positioning. The principle of circle-sailing positioning is as follows. The survey ship follows a circular trajectory, centering on the control point. During the sailing, the coordinates of the onboard transducer are provided by GNSS in real time, and the distance between the transducer and the acoustic beacon installed on the seafloor control point is measured by sound waves. Finally, the position of the control point is determined by the range intersection model constructed by combining the coordinates of the onboard transducer and the acoustic ranging results [24]. This method is highly accurate but time-consuming and laborious. Self-calibrating beacons simplify the task by reducing the surveying task to only one or a few beacons, with the others determining their own positions relative to the beacons that have been carried out by circle-sailing [25]. Due to the limited range capability of acoustic beacons, usually about 10 km [26], the relative positioning between beacons is only carried out within the unit network in the seafloor PNT network.
Therefore, the combined measurement method is proposed. As shown in Figure 2, there are two parts in the combined measurement method. The first part is the absolute positioning of several certain control points by circle-sailing positioning. The second part is the relative positioning among all control points, that is, the relative coordinates among seafloor control points are determined by constructing the free network adjustment model using the mutual acoustic ranging results provided by the acoustic beacons installed on them. The two parts can be carried out simultaneously, and the coordinates of all control points can be obtained by combining the results of the two.

2.1. The Adjustment Model of the Absolute Positioning

The model of the absolute positioning in a unit network is shown in Equation (1).
S t P i = X t i X P 2 + Y t i Y P 2 + Z t i Z P 2 + ε i
where S t P i is the geometric distance between the onboard transducer and the acoustic beacons installed on the seafloor control point P at the ith observation time, which is determined by acoustic ray tracing based on the one-way travel time between the two; X t = X t i , Y t i , Z t i and X P = X P , Y P , Z P are the coordinates of the transducer at the ith observation time and the control point P, respectively; ɛi is the observation error.
Linearize Equation (1) to obtain the error equation:
v t P i = X t i X P 0 S t P i 0 d x + Y t i Y P 0 S t P i 0 d y + Z t i Z P 0 S t P i 0 d z S t P i 0 S t P i
where S t P i 0 = X t i X P 0 2 + Y t i Y P 0 2 + Z t i Z P 0 2 and X P 0 = X P 0 , Y P 0 , Z P 0 is the prior coordinates of the control point P. A series of observation equations with the form of Equation (2) can be represented by the matrix notation, as shown in Equation (3).
V a n × 1 = B a n × 3 x a 3 × 1 L a n × 1
where V a , i = v t P i , B a , i = X t i X P 0 S t P i 0 Y t i Y P 0 S t P i 0 Z t i Z P 0 S t P i 0 , x a = d x d y d z T , and L a , i = S t P i 0 S t P i ; the symbol “[Ai]” represents the ith row of the matirx A, the superscript “T” represents the transpose of the matrix, and the subscript “a” represents the absolute positioning.
On the basis of the least-squares criterion, the coordinate corrections x ^ a and the final coordinates XP of the control point can be acquired through Equation (4).
x ^ a = B a T W a B a 1 B a T W a L a , X p = X P 0 + x ^ a
where Wa is the weight matrix of all observations; generally it is a diagonal matrix, and W a , i i = 1 / L a , i .
The precision of the absolute positioning is given in Equation (5).
D x ^ x ^ = σ 0 2 Q x ^ x ^ , σ 0 2 = V a T W a V a n 3 , Q x ^ x ^ = B a T W a B a 1
where D x ^ x ^ is the variance matrix of the control point coordinates, σ ^ 0 is the standard deviation, and Q x ^ x ^ is the covariance matrix of the control point coordinates.
When the absolute positioning is completed, the coordinates of the control point, which has been carried out by the circle-sailing positioning, can be known. Therefore, in this paper, the control point is called “the known point”.

2.2. The 2D Adjustment Model under Depth Constraint in the Relative Positioning

Generally, there is a pressure sensor installed on the seafloor control point that can provide the high-precision depth from the sea surface to the control point. The elevation of the control point can then be obtained by subtracting the depth from the elevation of the sea surface. In this case, the 3D adjustment model in the relative positioning of a unit network can be transformed into a 2D adjustment model. As shown in Figure 3, the geometric distance, Spq, between control points p and q can be obtained by in-layer constant gradient acoustic ray tracing using the acoustic observed value, then the horizontal distance, Dpq, between the two control points can be calculated based on Equation (6) by combining Spq with the elevation difference, ΔZpq [27].
D p q = S p q 2 Δ Z p q 2 , Δ Z p q = Z p Z q
If there are m control points in the unit network, then the number of measured horizontal distance observations, n, is equal to m(m − 1)/2. Supposing that the horizontal coordinates of two control points, p and q, are X P , Y P and X q , Y q , respectively, then the horizontal distance observation, Dpq, between p and q can be expressed by Equation (7).
D p q = X p X q 2 + Y p Y q 2 + ε p q
where ɛpq is the observation error. Equation (7) is linearized to obtain the error equation:
v p q = X p X q D p q 0 d x ^ p Y p Y q D p q 0 d y ^ p + X p X q D p q 0 d x ^ q + Y p Y q D p q 0 d y ^ q D p q 0 D p q
where D p q 0 = X p 0 X q 0 2 + Y p 0 Y q 0 2 and X p 0 = X p 0 , Y q 0 ; X q 0 = X q 0 , Y q 0 are the prior coordinates of control points p and q, respectively.
The error equations of n horizontal distance observations can be written into matrix form, as shown in Equation (9).
V r n × 1 = B r n × 2 m x r 2 m × 1 L r n × 1
where the subscript “r” represents the relative positioning. Vr, Br, xr, and Lr are given in Equation (10).
V r , i = v p q , L r , i = D p q 0 D p q , x ^ r 2 m × 1 = d x ^ 1 d y ^ 1 d x ^ 2 d y ^ 2 d x ^ m d y ^ m T B r , i = 0 0 X p X q D p q 0 Y p Y q D p q 0 0 0 X p X q D p q 0 Y p Y q D p q 0 0 0 column 2 p 1   column 2 p column 2 q 1   column 2 q
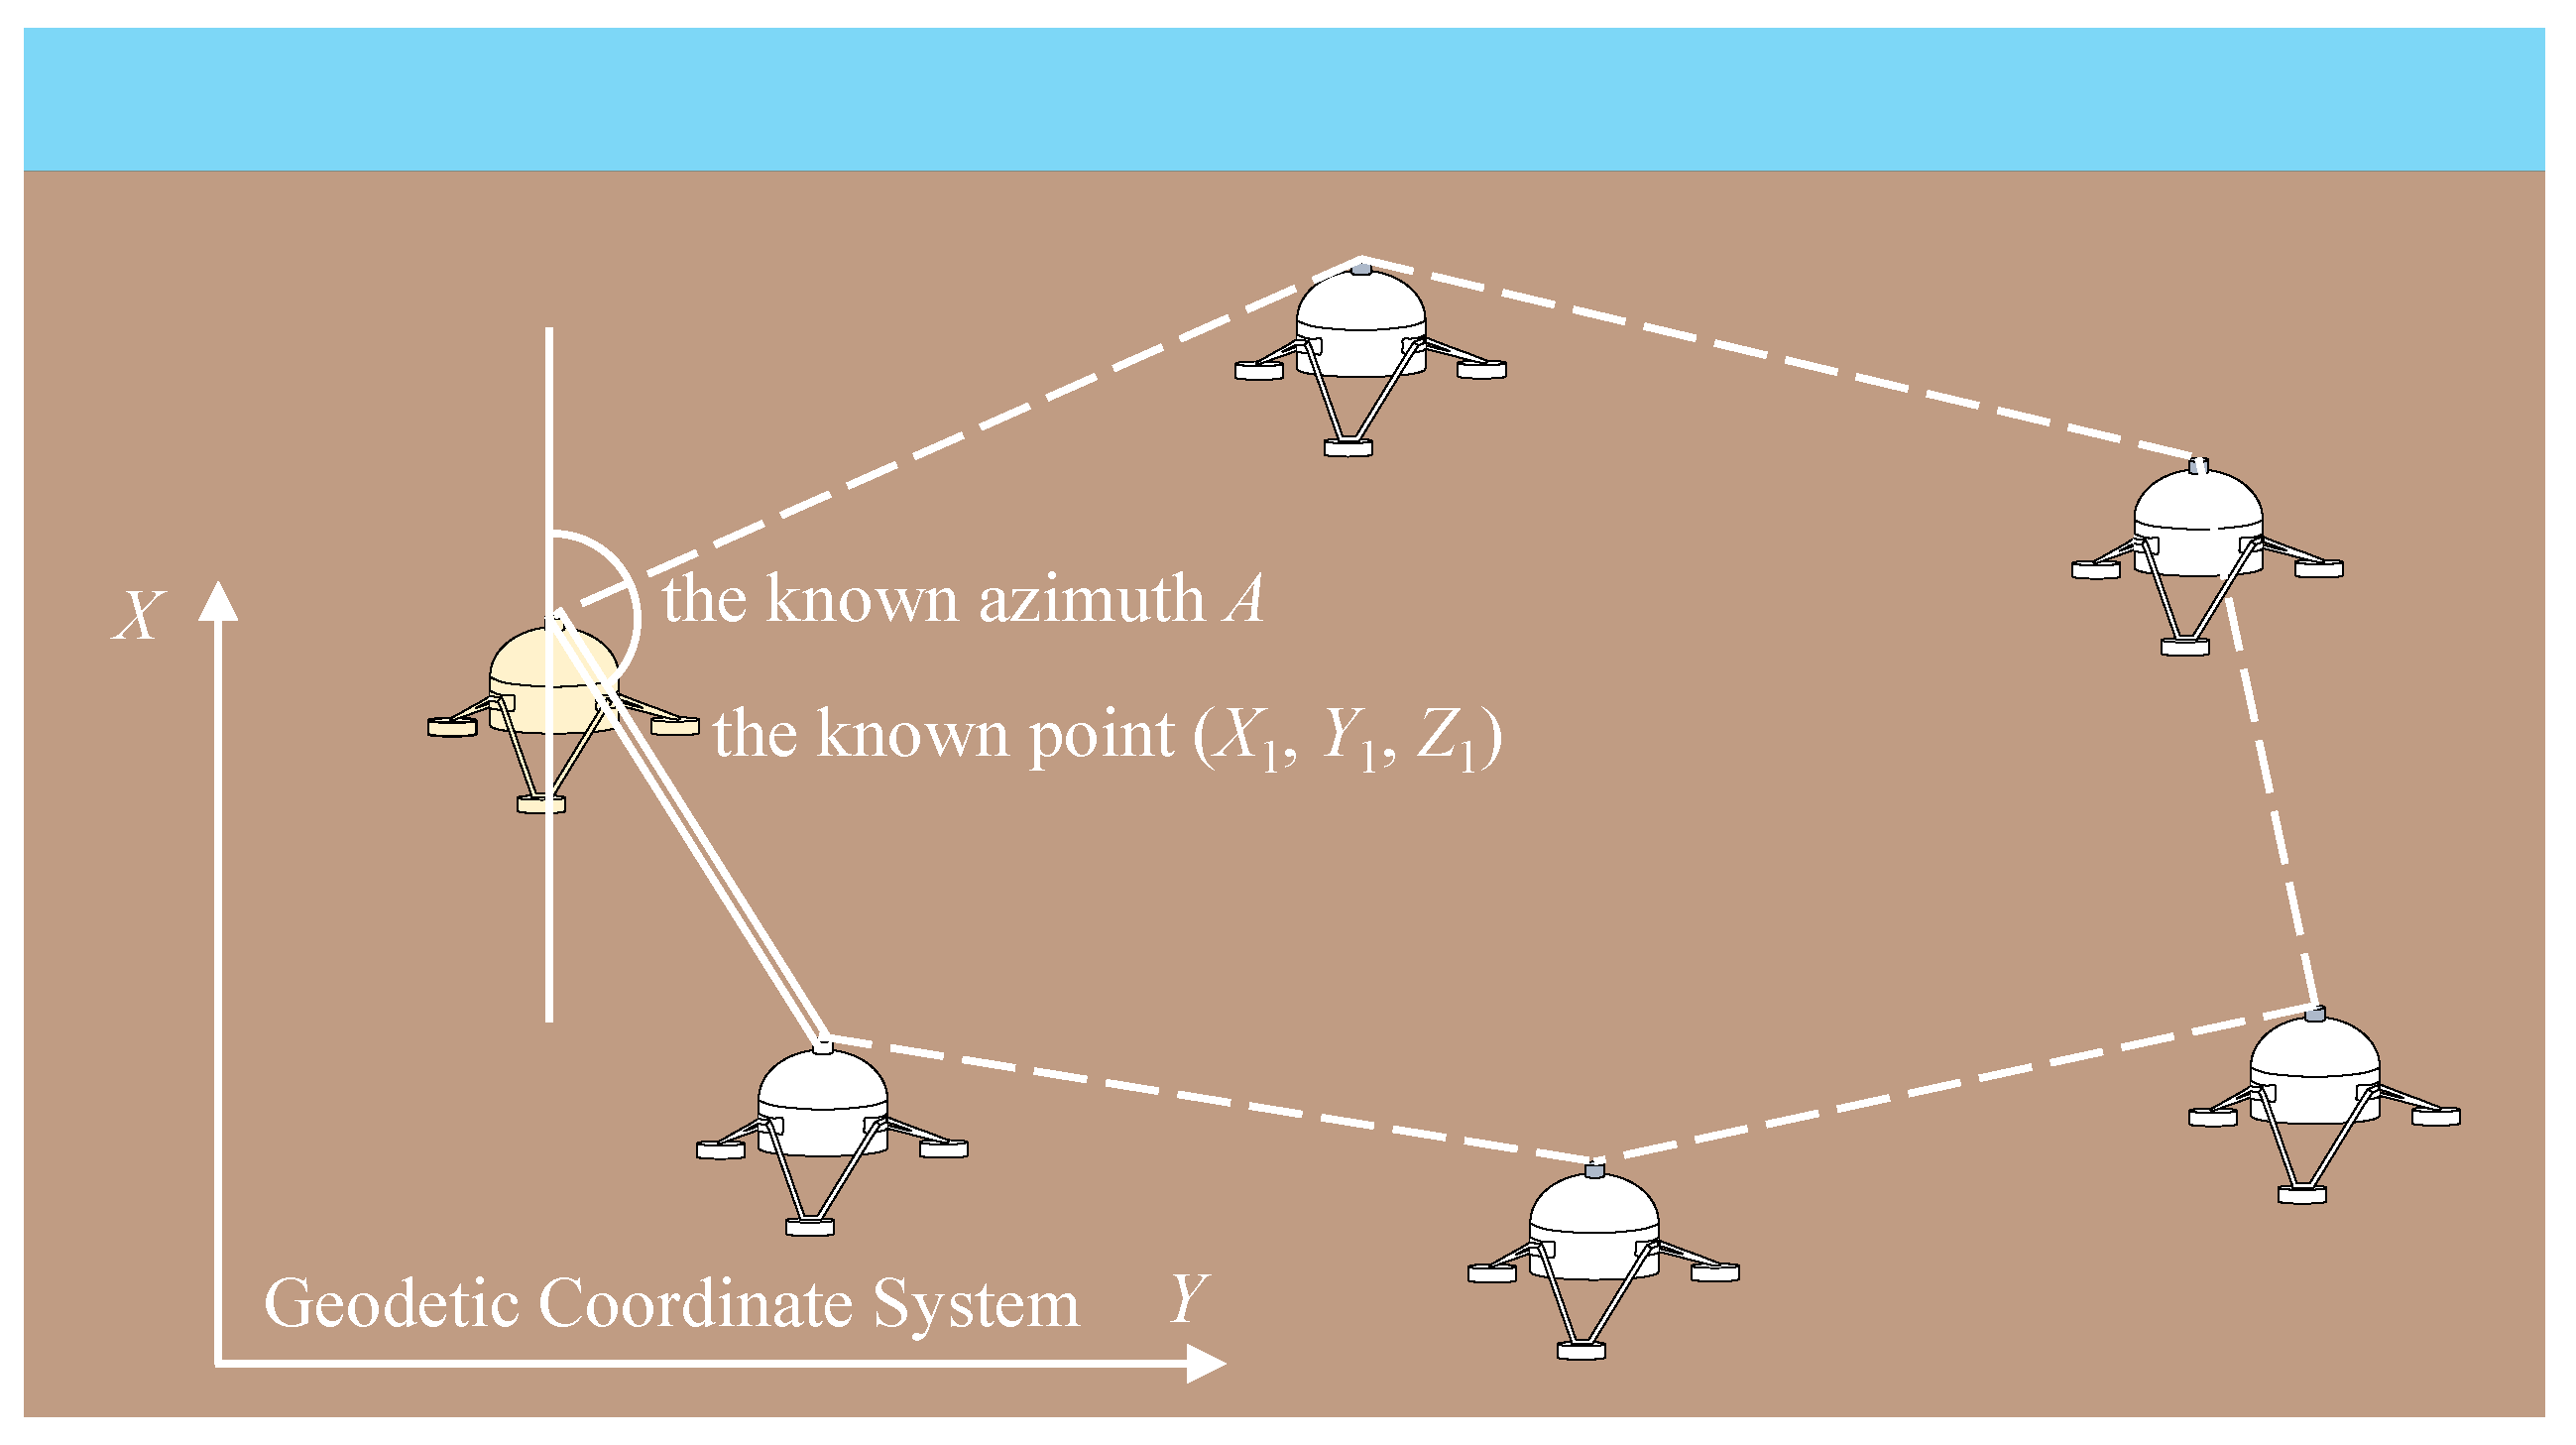
As shown in Figure 4, only one known control point and one known azimuth are provided, and the question is, can the 2D unit network be fixed in a geodetic coordinate system? Because there are no known conditions during the relative positioning, design matrix B is rank-deficient and the number of rank deficiency, d, is equal to 3.
The rank defect network adjustment under the barycentric datum is adopted to solve Equation (10), and the additional datum constraint condition is given in Equation (11).
S T d × 2 m W x 2 m × 2 m x ^ r 2 m × 1 = 0
where S is the base condition matrix and meets the following conditions: r a n k ( S ) = d , r a n k B r S T = 2 m , B r S = 0 ; Wx is the base weight matrix and is an identity matrix. The specific expression of ST is shown in Equation (12).
S T d × 2 m = 1 0 1 0 1 0 0 1 0 1 0 1 Y 1 0 X 1 0 Y 2 0 X 2 0 Y m 0 X m 0
Combining Equations (9) and (11), the coordinate corrections, x ^ r , and the final coordinates, X, of the control points can be obtained by Equation (13) under the adjustment criterion of V r T W r V r = min .
x ^ r = B r T W r B r + W x S S T W x 1 B r T W r L r , X = X 0 + x ^ r
The precision of the relative positioning is given in Equation (14).
D x ^ x ^ = σ ^ 0 2 Q x ^ x ^ , σ ^ 0 2 = V r T W r V r n 2 m d Q x ^ x ^ = Q B r T W r B r Q , Q = B r T W r B r + W x S S T W x 1 G D O P i = Q x ^ x ^ 2 i 1 , 2 i 1 + Q x ^ x ^ 2 i , 2 i
where D x ^ x ^ is the variance matrix of the control point coordinates, σ ^ 0 is the standard deviation, Q x ^ x ^ is the covariance matrix of the control point coordinates, and GDOP is the geometric dilution of precision of the control point.
The relative coordinates between the known point and the other control points can be acquired after the model of the relative positioning is solved, and then the coordinates of all control points can be calculated by combining the coordinates of the known point and the relative coordinates.

3. The Best Configuration of the Unit Network in the Seafloor PNT Network

In the seafloor PNT network, the longer the unit network side length, the lower the control point density and the lower the layout cost. In the relative positioning, the more acoustic ranging observation sessions there are, the higher the ranging accuracy. In order to balance the layout cost and observation efficiency, it is necessary to study the relationship between the side length of the unit network and the number of observation sessions.
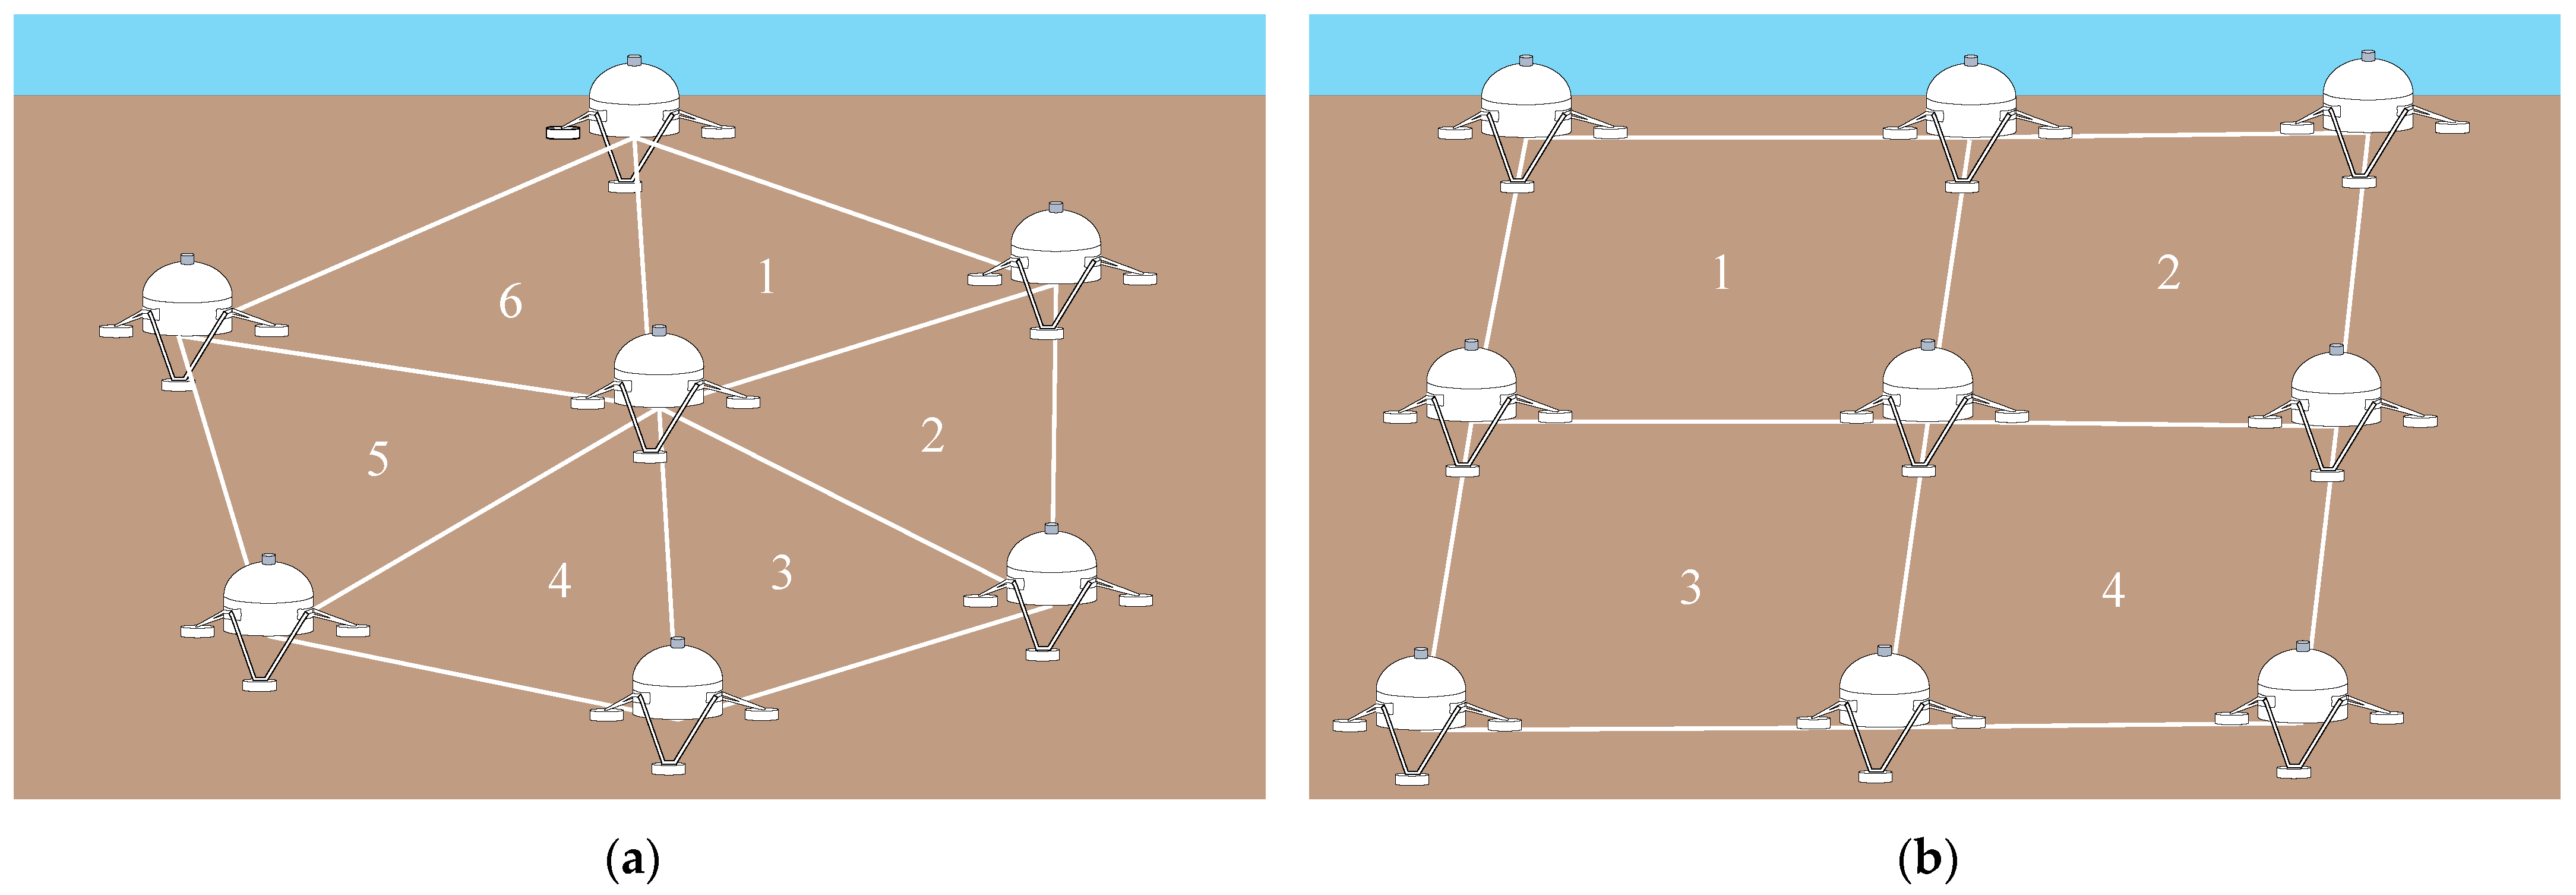
It can be proved that the coverage area of the regular polygon is the largest in the same circumcircle. Therefore, in order to achieve the maximum coverage under the same number of control points, the unit network of the seafloor PNT network is generally arranged as a regular polygon. As shown in Figure 5, in order to achieve seamless full coverage of the water area, the unit network is designed as an equilateral triangle (GDOP = 0.808 when the side length of the unit network is 1 km) or square (GDOP = 0.802) in most cases. Additionally, when the navigation and positioning accuracy requirements are undemanding, the unit network may be designed as a regular hexagon (GDOP = 0.837).
As mentioned in Section 2, the ranging capability of the acoustic beacons is limited. If the upper limit, R, of the range of the acoustic beacon is known, the maximum side length, Lmax, of the equilateral triangle and the square unit network are equal to R and 2 R / 2 , respectively. In the following, the functional relationship between the side length of the unit network and the navigation and positioning accuracy of the control points will be derived.
As shown in Figure 6, there are two known control point in an equilateral triangle unit network, and the distance, S0, and the azimuth, α0, between points A and B can be acquired based on the geometric relations. The coordinates (XP, YP) of the unknown control point P can then be obtained by Equation (15).
X P = X 0 + S cos α , Y P = Y 0 + S sin α
where S is the distance between point P and A; α is the azimuth between the two points and it meet the condition in Equation (16).
α = α 0 180 B P
Based on the law of cosines, Equation (17) can be given in the triangle ΔABP.
S 2 = S 0 2 + S 2 2 S 0 S cos B
where S′ is the distance between point P and B. S and S′ can be measured by acoustic ranging, and their ranging accuracy are known. By differentiating both sides of Equation (17), we can acquire:
S d S = S 0 S cos B d S 0 + S S 0 cos B d S + S 0 S sin B d B / ρ
where ρ is the conversion parameter between angle and radian and ρ = 180°/π. Because S0 is known, which means dS0 is equal to 0, Equation (18) can be simplified as Equation (19).
d B = S ρ d S S S 0 cos B ρ d S S 0 S sin B
By combining Equations (16) and (19), the following equation can be obtained:
d S d α = 1 0 x 1 x 2 d S d S
where x 1 = S ρ S 0 S sin B ,   x 2 = S S 0 cos B ρ S 0 S sin B .
In the equilateral triangle unit network, the ranging accuracy of S is equal to that of S′. Supposing the ranging accuracy of S and S′ is σS, then the covariance matrix between S and α can be depicted as Equation (21) by the variance–covariance propagation law.
σ S 2 σ S α σ α S σ α 2 = σ S 2 x 1 σ S 2 x 1 σ S 2 x 1 2 + x 2 2 σ S 2
Equation (15) can be differentiated and the result written into matrix form, as shown in Equation (22).
d X d Y = cos α S sin α / ρ sin α S cos α / ρ d S d α
Then, according to the variance–covariance propagation law, Equation (23) can be obtained.
σ X 2 σ X Y σ Y X σ Y 2 = cos α S sin α / ρ sin α S cos α / ρ σ S 2 σ S α σ α S σ α 2 cos α sin α S sin α / ρ S cos α / ρ
Based on Equation (23), the coordinate accuracy, σP, of point P is given by Equation (24).
σ P 2 = σ X 2 + σ Y 2 = σ S 2 1 + S 2 x 1 2 + x 2 2 / ρ 2
By substituting x1 and x2 into Equation (24) and considering the geometric conditions S = S′ = S0 and ∠B = ∠P = 60° in the equilateral triangle unit network, Equation (25) can be obtained.
σ S 2 = σ P 2 / 2.667
According to the same principles, the relation between ranging accuracy, σS, and the coordinate accuracy, σP, of the unknown point in the square unit network can also be derived, as shown in Equation (26).
σ S 2 = σ P 2 / 11
Because the distance, S, between two control points is determined by the sound velocity, c, and the one-way propagation time, t, of the acoustic wave, we can acquire Equation (27).
d S = t d c + c d t
Suppose that the measurement accuracy of sound velocity and time are σc and σt, respectively, then, based on the law of error propagation, it can be known that the ranging accuracy, σS, meets the condition in Equation (28).
σ S 2 = t 2 σ c 2 + c 2 σ t 2 = S / c 2 σ c 2 + c 2 σ t 2
Substituting Equation (28) into Equations (25) and (26), the function of the side length, S, and the coordinate accuracy of control points, σP, in one observation period can be obtained, as shown in Equation (29), where the subscripts “3” and “4” represent the number of edges in a unit network.
S 3 = c 2 σ P 2 2.667 c 4 σ t 2 2.667 σ c 2 , S 4 = c 2 σ P 2 11 c 4 σ t 2 11 σ c 2
The limiting conditions for the above formula are σ P > 2.667 c σ t and σ P > 11 c σ t . If there are N observation sessions, that is, each side in the unit network has been observed for N times, the ranging accuracy, σS, satisfies Equation (30).
σ S 2 = S / c 2 σ c 2 + c 2 σ t 2 / N
The relation between the side length and the coordinate accuracy of control points in N observation sessions can then be given by Equation (31).
S 3 = N c 2 σ P 2 2.667 c 4 σ t 2 2.667 σ c 2 , S 4 = N c 2 σ P 2 11 c 4 σ t 2 11 σ c 2
To sum up, in the case that the positioning accuracy of the control points in the seafloor PNT network and the number of observation sessions are given, the side length of the unit network can be determined based on Equation (31). Furthermore, if the positioning precision and the side length of the unit network have been given, the optimal number of observation sessions can be determined.

4. The Distribution of Known Control Points in the Seafloor PNT Network

Due to the large area of the seafloor PNT network, it is time-consuming and high cost to carry out circle-sailing positioning in each unit network in the absolute positioning. To solve this problem, the chain coordinate transfer strategy is proposed, whose principle is as follows.
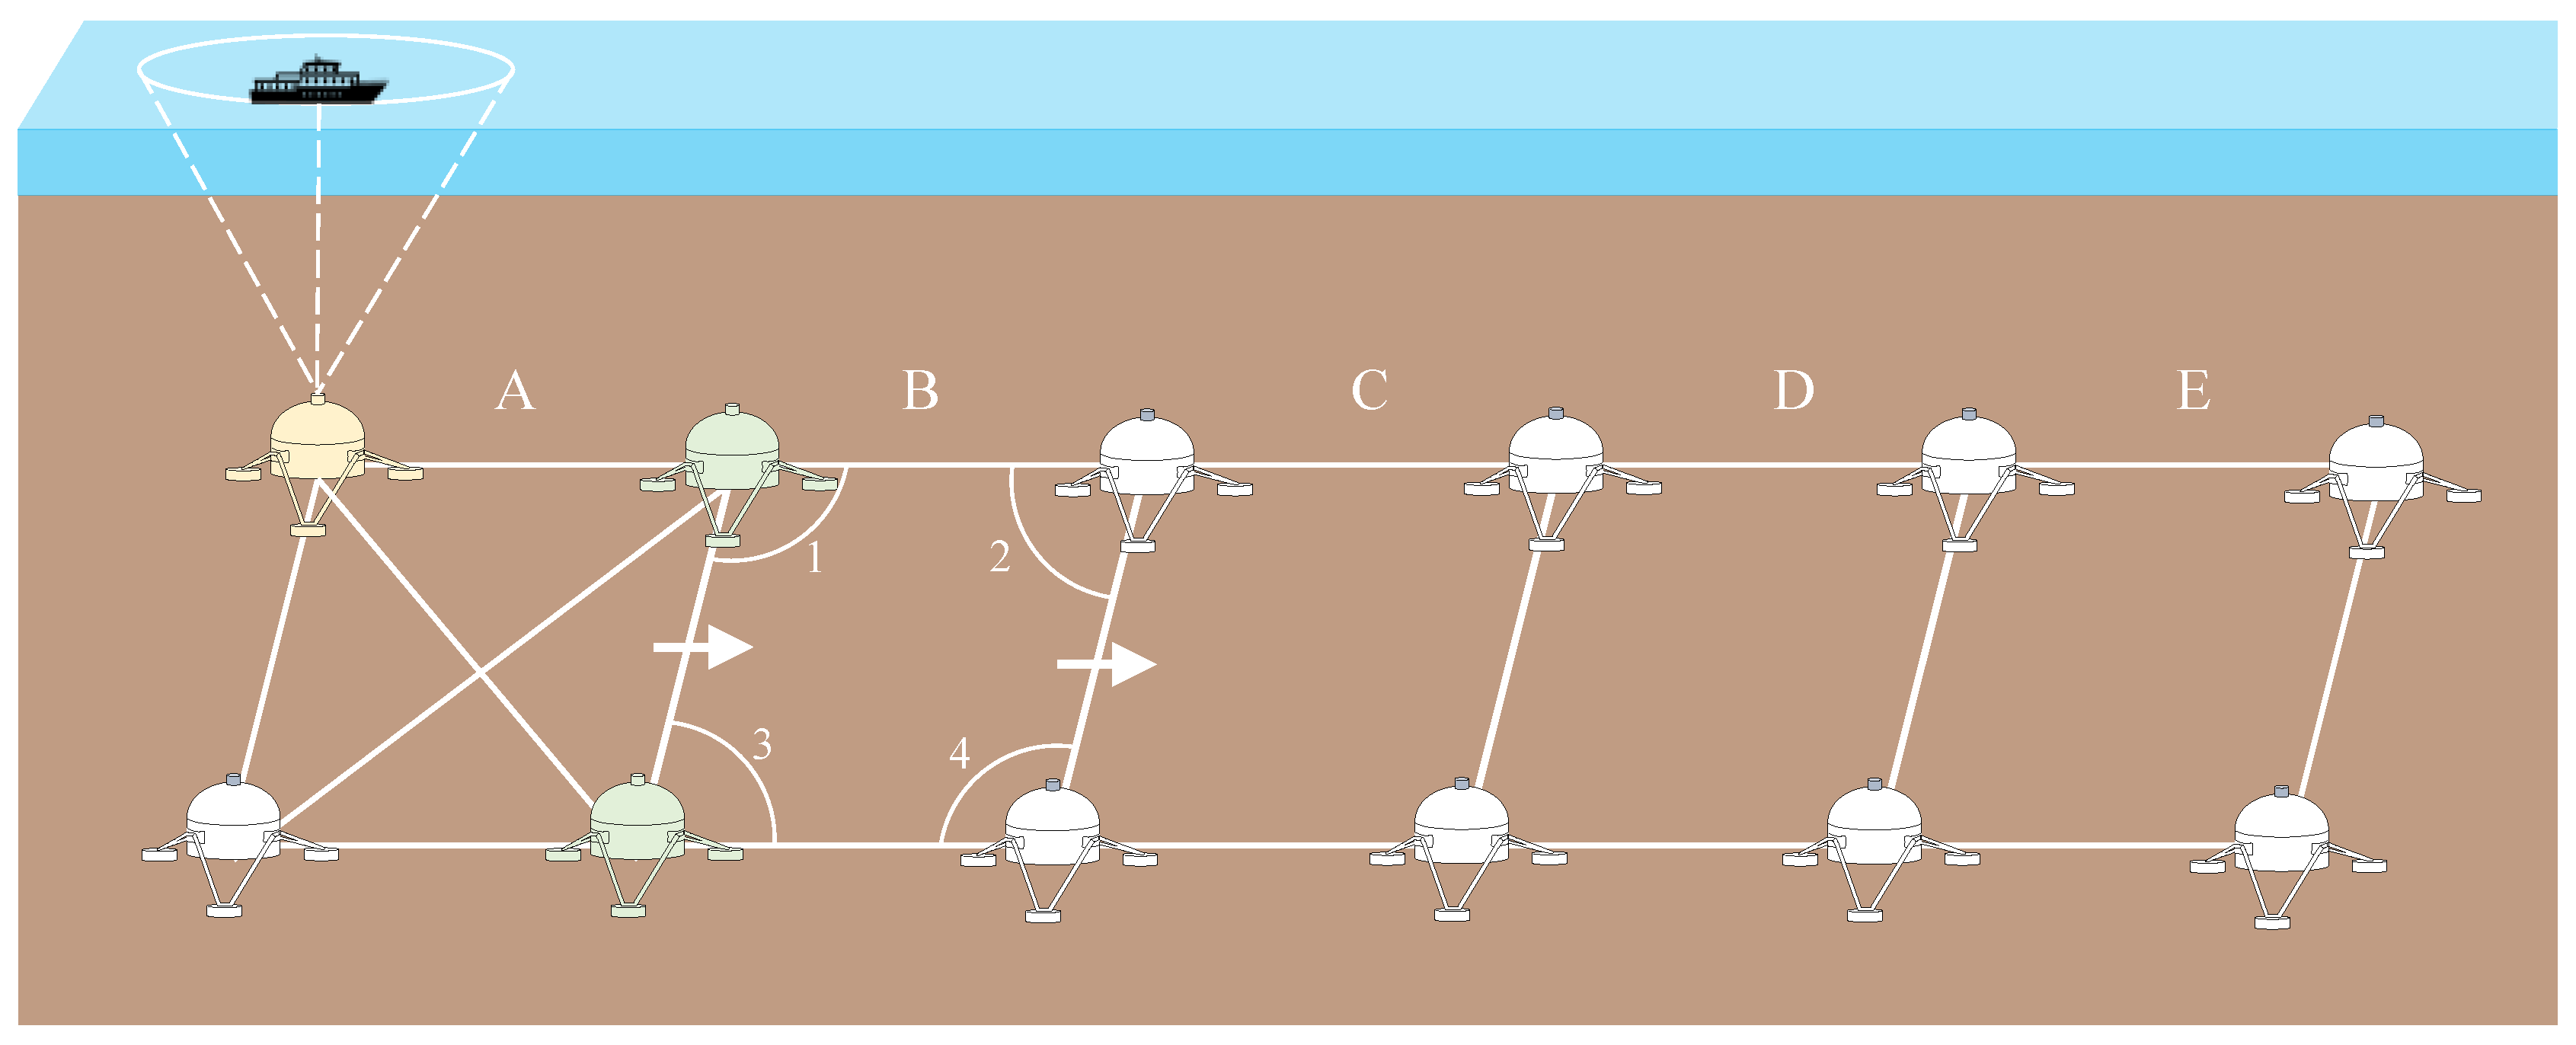
As shown in Figure 7: Firstly, carry out the absolute positioning and the relative positioning in the initial unit network A to determine the coordinates of all control points in it. Then, utilize the results of acoustic ranging in the unit network B adjacent to A to obtain the angle (Angles 1, 2, 3, and 4) between each edge in B. Finally, determine the coordinates of unknown points in B using the coordinates of common points between A and B, the acoustic ranging results, and the computed angles in B. Once the coordinates of the control points in B are determined, it can be regarded as “the initial unit network” relative to the unit network C. The coordinates of the control points in other unit networks (C, D, E, etc.) can then be determined by repeating the process.
During the coordinate transfer in the seafloor PNT network, the positioning error will increase with the increase of the number of unit networks. Circle-sailing positioning should be carried out at the control point whose positioning accuracy is less than the lower limit of accuracy (called “the weakest point” for short) to calibrate its coordinates. Therefore, determining the position of the weakest point is inevitable.
As shown in Figure 8, suppose that the diagonal length between the starting known point P1 and the weakest point Pn is L. Due to the error of acoustic ranging, the computed position of Pn is offset to Pn″, the offset in distance is f (Pn Pn″), and the offset in azimuth is dA. The offset f can be decomposed into the longitudinal offset t and the transverse offset u, which are equal to PnPn′ and PnPn″, respectively. The offsets f, t, and u meet the condition in Equation (32).
f 2 = t 2 + u 2 = t 2 + d A 2 L 2 / ρ 2
Suppose that the positioning accuracy of Pn is σP and the mean square error of t, u, and dA are σt, σu, and σA(L), respectively, the relation among them is given by Equation (33).
σ P 2 = σ t 2 + σ u 2 = σ t 2 + σ A 2 L L 2 / ρ 2
If the number of unit networks shown in Figure 8 is odd, namely there are (2n − 1) unit networks with side length S in the seafloor PNT network, and the observed distance between the control points located on L in the ith unit network is Si, then Equation (34) can be obtained.
L = S 1 + S 2 + + S n
Suppose that the length of the starting edge is S0, then, according to the geometric relations in the equilateral triangle unit network, we can obtain Equation (35).
L = S 0 sin θ 3 sin θ 2 + S 0 sin θ 1 sin θ 5 sin θ 9 sin θ 2 sin θ 4 sin θ 8 + + S 0 sin θ 1 sin θ 5 sin θ 7 sin θ 6 n 3 sin θ 2 sin θ 4 sin θ 8 sin θ 6 n 4
where θ1, θ2, …, θ6n−4 are the computed angles in the unit networks, which can be calculated based on the law of cosines, and they satisfy the following conditions:
θ ˜ 6 n 5 + θ ˜ 6 n 4 + θ ˜ 6 n 3 180 = 0
where θ ˜ i is the true value of θi. The equations corresponding to all unit networks in the form of Equation (36) can be written into the function model of conditional adjustment, as shown in Equation (37).
1 1 1 0 0 0 0 0 0 0 0 0 1 1 1 0 0 0 0 0 0 0 0 0 1 1 1 n × 6 n 3 v 1 v 2 v 6 n 3 6 n 3 × 1 + w 1 w 2 w n n × 1 = 0
where vi is the deviation between θ ˜ i and its corresponding calculated value θi; w n = θ 6 n 5 + θ 6 n 4 + θ 6 n 3 180 . The matrix form of Equation (37) is given by Equation (38).
A v + W = 0
Equation (35) can be expressed as a function between L and all computed angles, as shown in Equation (39).
L = φ θ ˜ 1 , θ ˜ 2 , θ ˜ 3 , θ ˜ 6 n 3 + L θ 1 v 1 + L θ 2 v 1 + + L θ 6 n 3 v 6 n 3
By differentiating Equation (39), the following equation can be gained:
d L ^ = L θ 1 d v 1 + L θ 2 d v 1 + + L θ 6 n 3 d v 6 n 3
where L θ i meets the rule in Equation (41).
L θ 1 = n 1 S 0 c , L θ 2 = n S 0 c , L θ 3 = L θ 9 = L θ 15 = = L θ 6 n 3 = S 0 c , L θ 6 = L θ 12 = L θ 18 = = L θ 6 n 6 = 0 , L θ 7 = L θ 10 = L θ 11 = L θ 14 = = n 2 S 0 c , c = c t g 60 = 3 / 3
Let L θ = L θ 1 L θ 2 L θ 3 L θ 6 n 5 L θ 6 n 4 L θ 6 n 3 T , then the reciprocal of the weight of the adjustment function of Equation (39) can be given by Equation (42) according to the variance–covariance propagation law and the principle of condition adjustment.
1 W L ^ = Q L ^ L ^ = L θ T W 1 L θ A W 1 L θ T A T W A 1 A W 1 L θ
where W is the weight matrix of computed angles and is an identity matrix; A is the design matrix of the condition adjustment function model shown in Equation (38).
Based on Equation (41), the components in Equation (42) can be calculated.
L θ T L θ = S 2 c 2 n 2 + n + 4 n 1 2 + n 2 2 + n 3 2 + 2 2 + 1 2 A L θ T A T A 1 A L θ = 0
If Equation (43) is substituted into Equation (42), then we can obtain Equation (44).
1 W L ^ = S 2 c 2 4 n 3 3 n 2 + 5 n 3
Substitute c2 = 1/3 into the above formula and take into consideration the condition that the truth value of L is equal to n times S0, that is, L ˜ = n S 0 , then the reciprocal of the weight of the diagonal length L between the starting point P1 and the weakest point Pn after condition adjustment is:
1 W L ^ o d d = L ˜ 2 4 n 2 3 n + 5 9 n
If the number of unit networks shown in Figure 8 is even, namely there are (2n) unit networks in the seafloor PNT network, based on the same derivation process we can acquire:
1 P L ^ e v e n = L ˜ 2 4 n 2 + 3 n + 5 9 n
Considering the error of the starting edge, the mean square error of the longitudinal offset σ t 3 in the seafloor PNT network composed of the equilateral triangle unit network can be given by Equation (47).
σ t 3 = σ L 3 = ± L ˜ σ S 0 L ˜ 2 + σ α ρ 2 4 n 2 3 n + 5 9 n
where σ S 0 is the error of the starting edge and σα is the accuracy of the computed angles, which can be calculated based on Equation (21). Based on the same derivation process, the mean square error of the transverse offset σ u 3 can be given by Equation (48).
σ u 3 = L ˜ σ α 0 ρ 2 + σ α ρ 2 4 n 2 3 n + 5 9 n
where σ α 0 is the error of the starting azimuth. Similarly, the mean square error of the longitudinal and transverse offset in the seafloor geodetic PNT composed of the square unit network can also be acquired, as shown in Equation (49).
σ t 4 = L ˜ σ S 0 L ˜ 2 + σ α ρ 2 n 3 , σ u 4 = L ˜ σ α 0 ρ 2 + σ α ρ 2 n 3
Finally, it can be concluded that the positioning accuracy of the weakest point is σ P n = σ t 2 + σ u 2 . If σ P n is greater than the lower limit of the positioning precision, σmax, the equation σ max = σ t 2 + σ u 2 can be solved to obtain n, then the position of the weakest point where the absolute positioning should be carried out can be gained.

5. Experiments and Analysis

5.1. The Applicability of the Combined Measurement Method in the Seafloor PNT Network

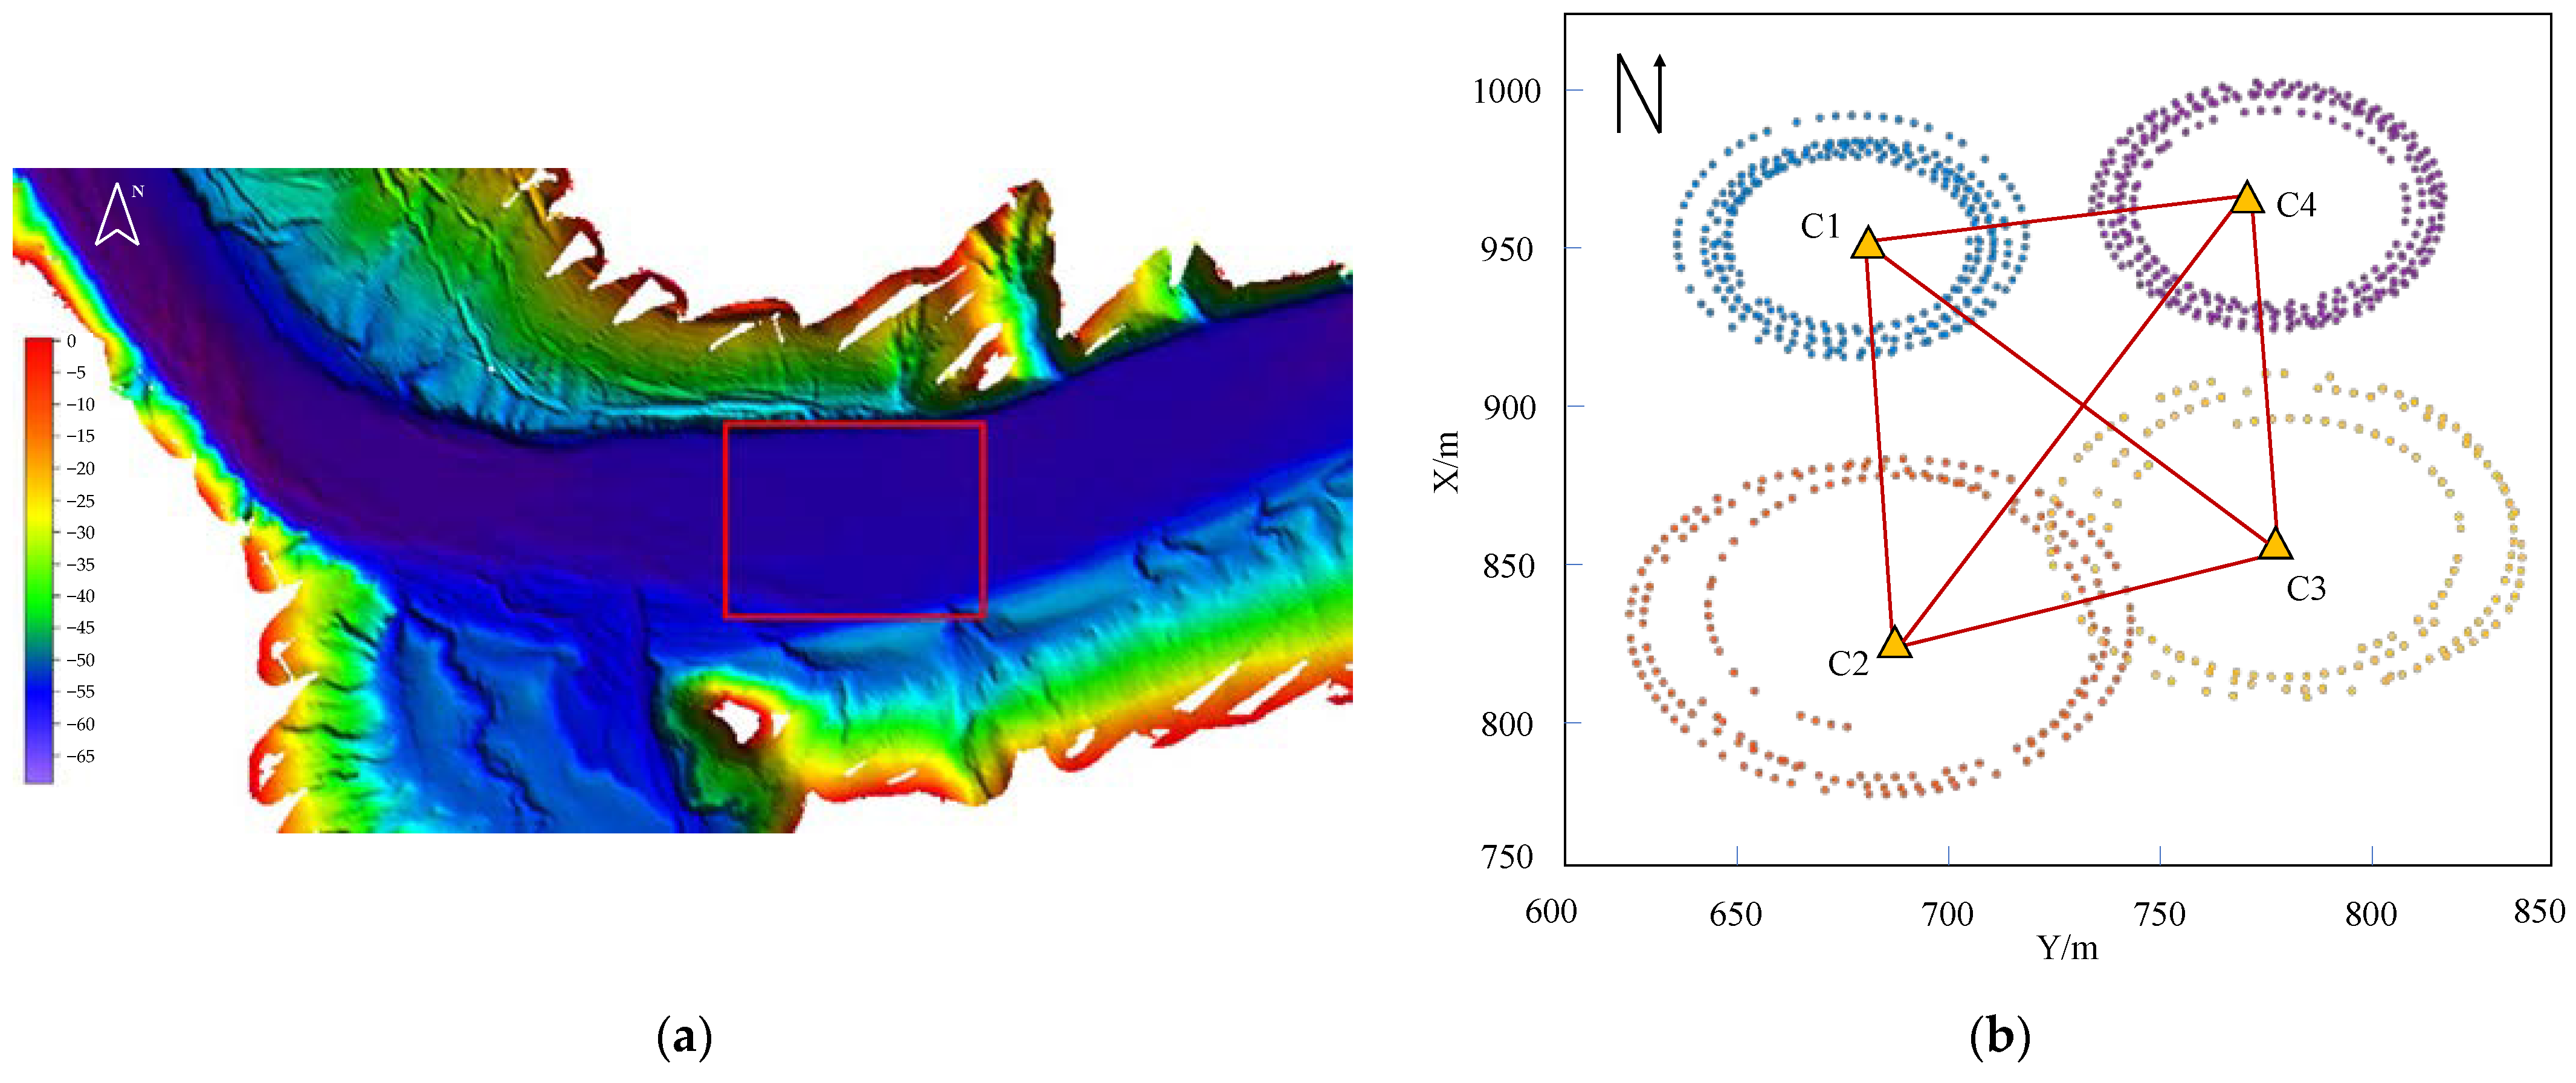
To test the applicability of the combined measurement method in Section 2, it is utilized to solve the coordinates of seafloor control points in a unit network laid in Songhua Lake, Jilin Province, China in October 2012. The seabed for laying the control points is flat, with a depth of 63~64 m, 320 m from north to south, and 400 m from east to west. The topographic map of the experimental water area is shown in Figure 9a.
The unit network is composed of four control points, each of which was carried out by circle-sailing positioning and conducting acoustic ranging of 50 epochs between each other. The structure of the unit network is shown in Figure 9b. Using the data collected in the circle-sailing positioning, the coordinates of the four seafloor control points can be calculated according to the adjustment model of the absolute positioning, as shown in Table 1.
The acoustic ranging results of different combinations of control points (Figure 10) were used to calculate the coordinates of control points according to the relative positioning model. The mean and standard deviation of mutual ranging results between control points are given in Table 2. The difference between the relative positioning results and the absolute positioning results is used as an index to evaluate the accuracy of the relative positioning. The results are shown in Table 3.
The following conclusions can be drawn from Table 3.
  • In the Combination C1C2C3C4, the maximum and minimum of the coordinate difference between the relative positioning and the absolute positioning in the X direction are 0.115 m and 0.009 m, respectively; the maximum and minimum of the coordinate difference in the Y direction are 0.130 m and 0.026 m; the positioning difference is approximately 10 cm.
  • In the Combinations C2C3C4 and C1C2C4, the positioning differences between the relative positioning and the absolute positioning are very slight, and less than 10 cm in most cases.
  • In the Combinations C1C2C3 and C1C3C4, the positioning differences between the relative positioning and the absolute positioning are quite large relative to other combinations, and they are up to the decimeter level. The reason for this is that the standard deviation of the acoustic ranging results between point C1 and point C3 is very large, which means the data quality is poor.
It can be concluded that if the acoustic ranging results are high-quality, the positioning difference between the combined measurement method and circle-sailing is at the centimeter level, which can satisfy the requirement of underwater PNT for the most part. Therefore, it is feasible to use the combined measurement method in the seafloor PNT network.

5.2. The Design of the Seafloor PNT Network under Different Accuracy Levels

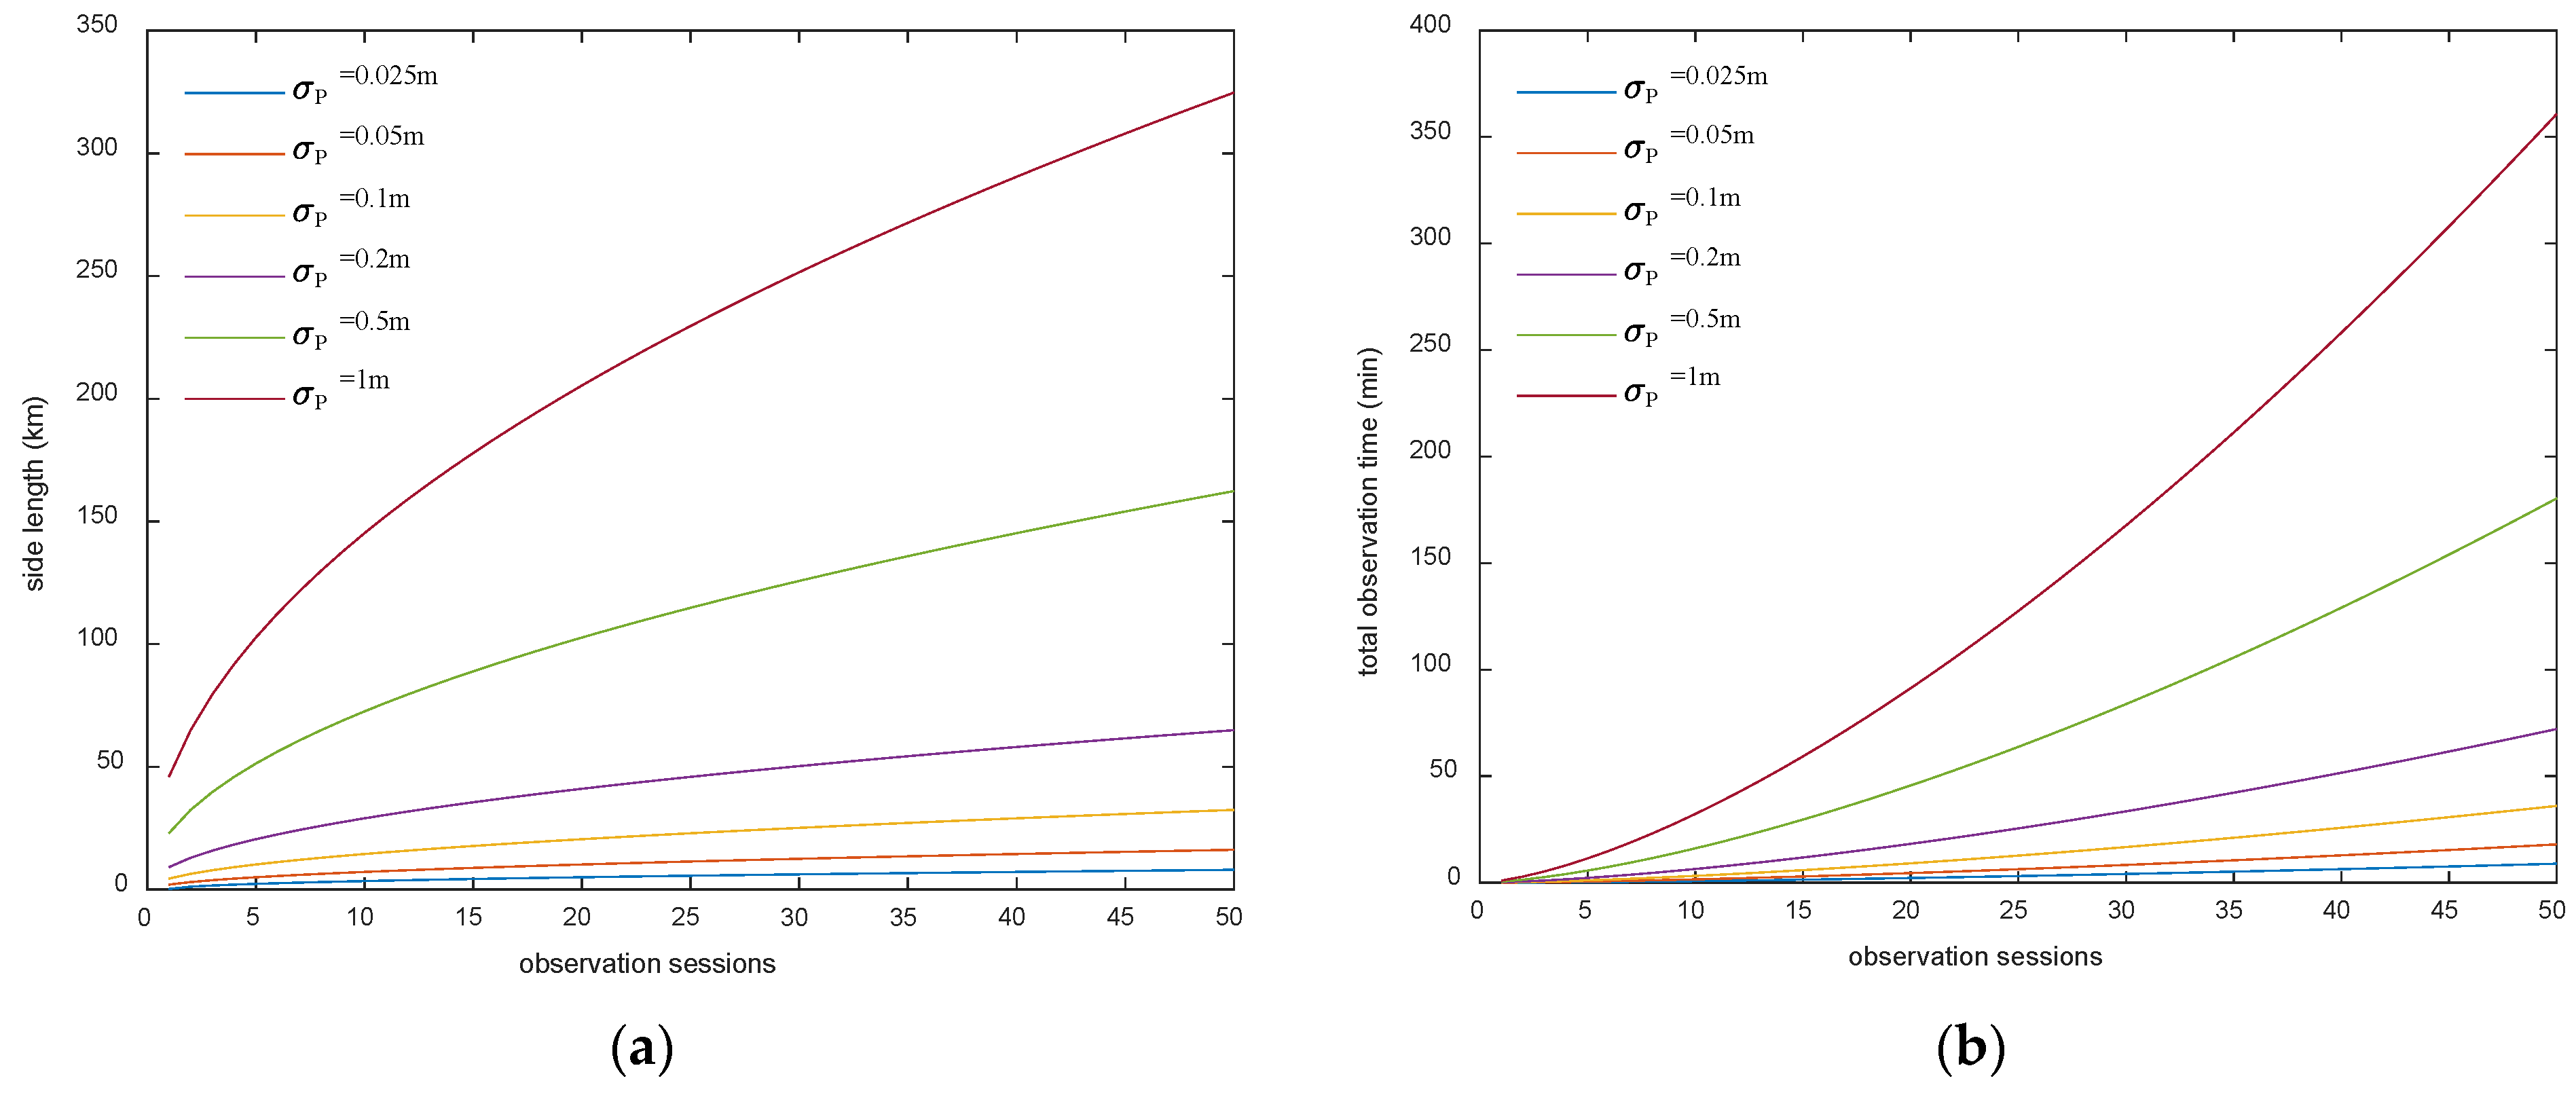
In general, the seafloor PNT network is divided into the centimeter-level network, decimeter-level network, and meter-level network, according to different uses. In this section, the sound velocity, c, in Equation (28) is set to 1500 m/s, the time measuring accuracy of acoustic beacons is set to 10−5 s, and the sound velocity measuring accuracy is set to 0.02 m/s, referring to the Compatt 6+ transponder of Sonardyne. In this case, the highest positioning precision of control points in the seafloor PNT network composed of the equilateral triangle unit network can reach 0.024 m in one observation period, and that of the seafloor PNT network composed of the square unit network can reach 0.05 m. Therefore, two centimeter-level networks (σP = 0.025 m and 0.05 m), three decimeter-level networks (σP = 0.1 m, 0.2 m, and 0.5 m) and one meter-level network (σP = 1 m) are set. Based on Equation (31), the relations between the side length of the unit network (unit: kilometer) and the number of observation sessions at all precision levels, and the relations between the total observation time (unit: minute) in the unit network and observation sessions can be calculated, as shown in Figure 11 and Figure 12.
From Figure 11 and Figure 12, the following conclusions can be drawn.
  • In the same observation sessions, the side length of the unit network decreases with the increase of the positioning precision of the control points.
  • The total observation time increases exponentially with the increase of observation sessions and the side length of the unit network.
  • When the positioning precision of control points in the seafloor PNT network is given, the more observation sessions, and the longer the side length of the unit network, the smaller the density of control points and the lower the layout cost.
  • The side length will not increase infinitely with the increase of observation sessions, and it will gradually approach a certain value. Thereafter, increasing observation sessions has little effect on the side length, but the total observation time will still rise, resulting in low efficiency.
In order to reduce the density of control points so as to reduce the layout cost, the side length of the unit network should be as long as possible within the ranging capability. If the ranging capacity, R, of the transducer is known, then the maximum side length of the equilateral triangle unit network can be set to R and the maximum side length of the square unit network can be set to 2 R / 2 . According to the results in Figure 11 and Figure 12, the number of observation sessions in the unit network to achieve different accuracy levels when R is set to 5 km, 10 km, 15 km, and 20 km is shown in Table 4, where “Δ” represents the equilateral triangle unit network, “*“ represents the square unit network, and “N(T)” represents the total observation time T of N observation sessions (unit: minutes).
In this paper, given observation efficiency, the total observation time in a unit network is limited to no more than 2 min. The observation sessions meeting this condition are marked in bold in Table 4. It can be concluded that if the total observation time is less than 2 min, then:
  • When the side length is 5 km, the equilateral triangle and the square unit network can both meet the accuracy requirements of all levels.
  • When the side length is 10 km, the equilateral triangle and the square unit network can meet the accuracy requirements of 0.1 m and below.
  • When the side length is 15 km, the equilateral triangle unit network can meet the accuracy requirements of 0.1 m and below, while the square unit network can only meet the accuracy requirements of 0.2 m and below.
  • When the side length is 20 km, the equilateral triangle and the square unit network can both meet the accuracy requirements of 0.2 m and below.
Based on Table 4, it can be seen that there are one, three, eight, sixteen, and twenty-two designing schemes for the seafloor PNT network when the positioning accuracy of control points is 0.05 m, 0.1 m, 0.2 m, 0.5 m, and 1 m under different unit network side lengths and different observation sessions. The positions of the weakest points in seafloor geodetic networks at all precision levels corresponding to different schemes are calculated according to Equations (47)–(49). The results are given in Table 5, Table 6 and Table 7, where “N(n)” represents the weakest points in the nth unit network; N is the original calculated value of n.
The TOPSIS method was utilized to evaluate each scheme by comprehensively considering the observation efficiency (the total observation time to the total control area), cost (the ratio of the number of control points to the total control area), and the number to carry out circle-sailing positioning (the number of known points). The comprehensive scores of each scheme are shown in Table 8.
The following conclusions can be drawn from the columns in the table above:
  • The equilateral triangle unit network with the side length (S) of 5 km and observation sessions (Tn) of 20 can be selected when the positioning accuracy, σP, of the control points in the seafloor PNT network is 0.05 m.
  • When σP = 0.1 m, the optimal scheme is the equilateral triangle unit network with S equal to 5 km and Tn equal to 5; the alternative schemes are the equilateral triangle unit network with S equal to 5 km and Tn equal to 20 or the square unit network with S equal to 5 km and Tn equal to 11.
  • When σP = 0.2 m, the optimal scheme is the equilateral triangle unit network with S equal to 10 km and Tn equal to 5; the alternative scheme is the equilateral triangle unit network with S equal to 15 km and Tn equal to 11.
  • When σP = 0.5 m, the optimal scheme is the equilateral triangle unit network with S equal to 15 km and Tn equal to 3; the alternative schemes are the equilateral triangle unit network with S equal to 20 km and Tn equal to 5, the equilateral triangle unit network with S equal to 10 km and Tn equal to 5 or 2, the square unit network with S equal to 20 km and Tn equal to 10, and the square unit network with S equal to 10 km and Tn equal to 11.
  • When σP = 1 m, the optimal scheme is the equilateral triangle unit network with S equal to 15 km and Tn equal to 3 or 1; the alternative schemes are the equilateral triangle unit network with S equal to 20 km and Tn equal to 5 or 1, the equilateral triangle unit network with S equal to 10 km and Tn equal to 1 or 2, the square unit network with S equal to 15 km and Tn equal to 6, and the square unit network with S equal to 20 km and Tn equal to 10.
In this section, the design schemes of the seafloor PNT network are given when the velocity measuring accuracy, σc, is set as 0.02 m/s and the time measuring accuracy, σt, is set as 10−5 s. In practical scheme design, the corresponding condition can be substituted into the model given in this paper to obtain the specific layout scheme.

6. Conclusions

In this paper, the measurement method and the configuration and coordinate transfer strategy are studied from the conception of the construction of the seafloor PNT network. The main contributions are as follows.

6.1. A Combined Measurement Method That Is Less Time Consuming and Less Costly

In order to reduce the influence of the attitude on the positioning results, the ship speed is slow in the circle-sailing positioning, which leads to a long observation time. Moreover, it takes time, and the cost is very high to carry out circle-sailing positioning for each control point in a large-area seafloor PNT network. The combined measurement method proposed in this paper only needs to conduct circle-sailing positioning for a few control points, and the coordinates of other points can be obtained based on the results of mutual acoustic ranging. This method can achieve the same positioning accuracy as circle-sailing positioning with a shorter observation time and lower cost when the observation quality is good.

6.2. The Optimal Observation Time under Different Side Lengths of the Unit Network

Through the model given in this paper, the relationship between the number of observation sessions during acoustic ranging and the side length of the unit network under different accuracy is obtained. The more observation sessions, the longer the side length of the unit network, the smaller the density of control points, and the lower the layout cost. However, the side length will not increase infinitely with the increase of observation sessions and will gradually approach a certain value. Thereafter, increasing observation sessions has little effect on the side length, but the total observation time will still rise. The proposed model can be used to find the optimal observation time under different side lengths of the unit network, so as to improve the observation efficiency.

6.3. The Position of Carrying Out Circle-Sailing Positioning in the Seafloor PNT Network

Because the seafloor PNT network covers a large area, it is not practical to carry out circle-sailing positioning in each unit network. Based on the chain coordinate transfer strategy given in this paper, the position of the weakest point in the coordinate transfer process can be found. All that is needed is to carry out circle-sailing positioning at the position of the weakest point; the positioning accuracy of control points in the whole network can meet the requirements, which can reduce operational cost and improve observation efficiency.

Author Contributions

Conceptualization, J.M. and J.Z.; funding acquisition, J.Z.; investigation, J.M.; methodology, J.M. and J.Z.; writing—original draft, J.M.; writing—review and editing, J.M. and J.Z. All authors have read and agreed to the published version of the manuscript.

Funding

This research was funded by the Wenhai Program of the S&T Fund of Shandong Province for the Pilot National Laboratory for Marine Science and Technology (Qingdao), grant number 2021WHZZB1002.

Institutional Review Board Statement

Not applicable.

Informed Consent Statement

Not applicable.

Data Availability Statement

Access to the data will be considered upon request to the authors.

Acknowledgments

We would like to thank the editor and anonymous reviewers for their valuable comments and suggestions.

Conflicts of Interest

The authors declare no conflict of interest.

References

  1. Liu, J.; Chen, G.; Zhao, J.; Gao, K.; Liu, Y. Development and Trends of Marine Space-Time Frame Network. Geomat. Form. Sci. Wuhan Univ. 2019, 44, 17–37. [Google Scholar]
  2. Yang, Y.; Xu, T.; Xue, S. Progresses and Prospects in Developing Marine Geodetic Datum and Marine Navigation of China. Acta Geod. Cartogr. Sin. 2017, 46, 1–8. [Google Scholar]
  3. Spiess, F.N.; Chadwell, C.D.; Hildebrand, J.A.; Young, L.E.; Purcell, G.H.; Dragert, H. Precise GPS/Acoustic Positioning of Seafloor Reference Points for Tectonic Studies. Phys. Earth Planet. Inter. 1998, 108, 101–112. [Google Scholar] [CrossRef]
  4. Creed, E.L.; Glenn, S.; Schofield, O.M.; Barrier, H.; Petrecca, R.; Dobarro, J.; McLean, S.; Barnard, A.; Brown, K.; Adams, R.; et al. LEO-15 Observatory—The next generation. In Proceedings of the OCEANS 2005 MTS/IEEE, Washington, DC, USA, 17–23 September 2005; Volume 1, pp. 657–661. [Google Scholar]
  5. Favali, P.; Beranzoli, L. Seafloor Observatory Science: A Review. Ann. Geophys. 2006, 49, 515–567. [Google Scholar] [CrossRef]
  6. Matsumoto, Y.; Ishikawa, T.; Fujita, M.; Sato, M.; Saito, H.; Mochizuki, M.; Yabuki, T.; Asada, A. Weak interpolate coupling beneath the sub-duction zone off Fukushima, NE Japan, inferred from GPS/Acoustic seafloor geodetic observation. Earth Planet Space 2008, 60, 9–12. [Google Scholar] [CrossRef] [Green Version]
  7. Chadwell, C.D.; Sweeney, A.D. Acoustic Ray-Trace Equations for Seafloor Geodesy. Mar. Geod. 2010, 33, 164–186. [Google Scholar] [CrossRef]
  8. Sweeney, A.D.; Chadwell, C.D.; Hildebrand, J.A.; Spiess, F.N. Centimeter-level positioning of seafloor acoustic transponders from a deeply towed interrogator. Mar. Geod. 2005, 28, 39–70. [Google Scholar] [CrossRef]
  9. Gagnon, K.; Chadwell, C.; Norabuena, E. Measuring the onset of locking in the Peru-Chile trench with GPS and acoustic measurements. Nature 2005, 434, 205. [Google Scholar] [CrossRef] [PubMed]
  10. Burgmann, Chadwell. Seafllor Geodesy. Annu. Rev. Earth Planet. Sci. 2014, 42, 509–534.
  11. Yokota, Y.; Ishikawa, T. Shallow Slow Slip Events along the Nankai Trough Detected by GNSS-A. Sci. Adv. 2020, 6, eaay5786. [Google Scholar] [CrossRef] [PubMed] [Green Version]
  12. Kris, O. DARPA Discovers “GPS-Like” Undersea Drone Connectivity—Emerging DARPA Technology Connects Undersea Drones with Low-Frequency Sonar. Defense System. 2017. Available online: https://www.defenseone.com/defense-systems/2017/02/darpa-discovers-gps-like-undersea-drone-connectivity/192123/ (accessed on 15 September 2022).
  13. Zhao, J.; Zou, Y.; Zhang, H.; Fang, S. A new method for absolute datum transfer in seafloor control network measurement. Mar. Sci. Technol. 2016, 21, 216–226. [Google Scholar] [CrossRef]
  14. Chen, G.; Liu, Y.; Liu, Y.; Tian, Z.; Liu, J.; Li, M. Adjustment of Transceiver Lever Arm Offset and Sound Speed Bias for GNSS-Acoustic Positioning. Remote Sens. 2019, 11, 1606. [Google Scholar] [CrossRef] [Green Version]
  15. Grafarend, E.W. Optimization of geodetic networks. Can. Surv. 1974, 28, 716–723. [Google Scholar] [CrossRef]
  16. Koch, K.R. First Order Design: Optimization of the Configuration of a Network by Introducing Small Position Changes; Springer: Berlin/Heidelberg, Germany, 1985. [Google Scholar]
  17. Eshagh, M.; Kiamehr, R. A strategy for optimum designing of the geodetic networks from the cost, reliability and precision views. Acta Geod. Geoph. Hung. 2007, 42, 297–308. [Google Scholar] [CrossRef]
  18. Bagherbandi, M.; Eshagh, M.; Sjoberg, L.E. Multi-objective versus single-objective models in geodetic network optimiza-tion. Nord. J. Surv. Real Estate Res. 2009, 6, 7–20. [Google Scholar]
  19. Horemuz, M.; Patrick, J. Optimum Establishment of Total Station. J. Surv. Eng. Asce 2017, 143, 06016004. [Google Scholar] [CrossRef] [Green Version]
  20. Alizadeh-Khameneh, M.A.; Horemuz, M.; Jensen, A.B.; Andersson, J.V. Optimal Vertical Placement of Total Station. J. Surv. Eng. Asce 2018, 144, 06018001. [Google Scholar] [CrossRef]
  21. Yang, Y.; Liu, Y.; Sun, D.; Xu, T.; Xue, S.; Han, Y.; Zeng, A. Seafloor geodetic network establishment and key technologies. Sci. China Earth Sci. 2020, 63, 1188–1198. [Google Scholar] [CrossRef]
  22. Zhao, J. Modern Marine Surveying and Charting; Wuhan University Press: Wuhan, China, 2008. [Google Scholar]
  23. Torge, W.; Müller, J. Geodesy; Walter de Gruyter: Berlin, Germany, 2012. [Google Scholar]
  24. Chen, H.H.; Wang, C.C. Optimal localization of a seafloor transponder in shallow water using acoustic ranging and GPS observations. Ocean. Eng. 2007, 34, 2385–2399. [Google Scholar] [CrossRef]
  25. Leonard, J.J.; Bennett, A.A.; Smith, C.M.; Feder, H.J.S. Autonomous Underwater Vehicle Navigation; Massachusetts Institute of Technology: Cambridge, MA, USA, 1998. [Google Scholar]
  26. Whitcomb, L.L.; Yoerger, D.R.; Singh, H. Combined doppler/lbl based navigation of underwater vehicles. In Proceedings of the 11th International Symposium on Unmanned Untethered Submersible Technology, New England Center, Durham, NH, USA, 22–25 August 1999. [Google Scholar]
  27. Chen, X.; Zhang, H.; Zhao, J. Positioning accuracy model of sailing-circle GPS-Acoustic method. Earth Space Sci. 2021, 8, e2019EA000639. [Google Scholar] [CrossRef]
Figure 1. (a) The direct-path acoustic network; (b) the indirect-path acoustic network; (c) the GNSS-A network; (d) the seafloor PNT network.
Jmse 10 01664 g001
Figure 2. The principle of determining the coordinates of control points in the seafloor PNT network.
Jmse 10 01664 g002
Figure 3. The geometric relations between control points in the unit network of the seafloor PNT network.
Jmse 10 01664 g003
Figure 4. The necessary conditions to constrain a 2D unit network in a geodetic coordinate system.
Jmse 10 01664 g004
Figure 5. (a) the seafloor PNT network composed of equilateral triangle unit networks; (b) the seafloor PNT network composed of square unit networks. The number “i” in the figure represents the ith unit network in the seafloor PNT network.
Jmse 10 01664 g005
Figure 6. The geometric relations of control points in the equilateral triangle unit network. The yellowish points are known points.
Jmse 10 01664 g006
Figure 7. The principle of the chain coordinate transfer strategy. The yellow point is the known point. The green points are the common points between the unit network A and B. The white arrow is the direction of coordinate transfer.
Jmse 10 01664 g007
Figure 8. The chain coordinate transfer in the seafloor PNT network composed of the equilateral triangle unit network. The unit network with the yellowish point is the initial network. The white double line represents the starting edge. The golden point is the weakest point.
Jmse 10 01664 g008
Figure 9. (a) The topographic map of the experimental water area; the red box indicates the area where the unit network is located (Reprinted with permission from Ref. [27]. 2022, John Wiley and Sons). (b) The structure of the unit network and trajectories of circle-sailing positioning.
Jmse 10 01664 g009
Figure 10. The combinations of control points. (a) Points C1, C2, C3, and C4. (b) Points C1, C2, and C3. (c) Points C1, C3, and C4. (d) Points C1, C2, and C4. (e) Points C2, C3, and C4.
Jmse 10 01664 g010
Figure 11. (a) The relations between the side length of the equilateral triangle unit network and the number of observation sessions at all precision levels; (b) The relations between the total observation time in the equilateral triangle unit network and observation sessions.
Jmse 10 01664 g011
Figure 12. (a) The relations between the side length of the square unit network and the number of observation sessions at all precision levels; (b) The relations between the total observation time in the square unit network and observation sessions.
Jmse 10 01664 g012
Table 1. The coordinates of seafloor control points determined by circle-sailing.
PointX (m)Y (m)Z (m)σx (m)σy (m)σz (m)σP (m)
C1955.117690.385−60.8000.0130.0130.0050.019
C2835.095697.771−60.1460.0080.0080.0040.012
C3865.058792.475−60.0440.0070.0060.0060.011
C4969.805787.069−60.5360.0100.0100.0040.015
Table 2. The mean and standard deviation of mutual ranging results between control points.
Point 1Point 2Ave. (m)Std. (m)
C1C2120.2080.017
C1C3136.6033.164
C1C497.8120.003
C2C399.4160.002
C2C4161.5280.028
C3C4104.8850.007
Table 3. The coordinates of control points determined by the relative positioning.
CombinationPointX (m)Y (m)dx (m)dy (m)dP (m)
Jmse 10 01664 i001C1955.002690.4120.1150.0260.118
C2835.028697.8220.0670.0510.084
C3865.048792.6060.0090.1300.131
C4969.906787.0320.1000.0370.107
Jmse 10 01664 i002C1955.247690.0980.1310.2870.315
C2835.249697.8630.1550.0920.180
C3864.702792.8230.3550.3480.497
Jmse 10 01664 i003C2835.040697.7780.0540.0070.055
C3864.990792.5810.0670.1060.125
C4969.843787.1040.0380.0340.052
Jmse 10 01664 i004C1955.048690.4480.0680.0630.093
C2835.080697.7310.0150.0400.042
C4969.869787.0790.0630.0090.064
Jmse 10 01664 i005C1955.725690.0290.6080.3560.705
C3864.643793.2270.4140.7520.859
C4969.546786.8120.2590.2570.365
Table 4. The relations among the acoustic ranging capability, R, the number of observation sessions, N, and the total observation time, T.
R (km)Unit TypeσP (m)
0.0250.050.10.20.51
5Δ20 (1.111)5 (0.278)2 (0.111)1 (0.056)1 (0.056)1 (0.056)
44 (2.444)11 (0.611)3 (0.167)1 (0.056)1 (0.056)1 (0.056)
10Δ77 (8.556)20 (2.222)5 (0.556)2 (0.222)1 (0.111)1 (0.111)
161 (17.889)41 (4.556)11 (1.222)3 (0.333)1 (0.111)1 (0.111)
15Δ172 (19.111)43 (4.778)11 (1.222)3 (0.333)1 (0.111)1 (0.111)
356 (39.556)89 (9.889)23 (2.556)6 (0.667)1 (0.111)1 (0.111)
20Δ305 (33.889)77 (8.556)20 (2.222)5 (0.556)1 (0.111)1 (0.111)
630 (70.000)158 (17.556)40 (4.444)10 (1.111)2 (0.222)1 (0.111)
Table 5. The position of the weakest point under different side lengths and observation sessions when the number of the equilateral triangle unit network is odd.
Side Length (km)Observation SessionsσP (m)
0.050.10.20.51
5205.218 (5)19.516 (19)76.053 (76)471.495 (471)1883.740 (1883)
5/5.218 (5)19.516 (19)118.426 (118)471.495 (471)
2//8.128 (8)47.799 (47)189.042 (189)
1///24.236 (24)94.886 (94)
105//5.337 (5)30.840 (30)121.263 (121)
2///12.704 (12)48.934 (48)
1////24.804 (24)
1511//5.247 (5)30.302 (30)119.113 (119)
3///8.677 (8)32.996 (32)
1////11.402 (11)
205///8.176 (8)31.023 (31)
1////6.624 (6)
Table 6. The position of the weakest point under different side lengths and observation sessions when the number of the equilateral triangle unit network is even.
Side Length (km)Observation SessionsσP (m)
0.050.10.20.51
5204.425 (4)18.763 (18)75.303 (75)470.745 (470)1882.990 (1882)
5/4.425 (4)18.763 (18)117.676 (117)470.745 (470)
2//7.362 (7)47.048 (47)188.292 (188)
1///23.484 (23)94.136 (94)
105//4.546 (4)30.089 (30)120.513 (120)
2///11.948 (11)48.184 (48)
1////24.053 (24)
1511//4.454 (4)29.551 (29)118.363 (118)
3///7.913 (7)32.245 (32)
1////10.644 (10)
205///7.410 (7)30.272 (30)
1////5.849 (5)
Table 7. The position of the weakest point under different side lengths and observation sessions in the square unit network.
The Side Length (km)Observation SessionsσP (m)
0.050.10.20.51
511/2.196 (2)8.785 (8)57.536 (57)230.143 (230)
3//2.357 (2)15.692 (15)62.766 (62)
1///5.231 (5)20.922 (20)
1011//2.357 (2)14.731 (14)58.923 (58)
3///4.017 (4)16.070 (16)
1////5.357 (5)
156///3.587 (3)14.348 (14)
1////2.391 (2)
2010///3.368 (3)13.473 (13)
2////2.695 (2)
Table 8. The comprehensive scores of design schemes for the seafloor PNT network at different precision levels.
Unit TypeSide Length (km)Observation SessionsσP (m)
0.050.10.20.51
Δ5201.0000.3230.1000.0440.028
5/0.4700.1390.0590.038
2//0.1380.0600.039
1///0.0590.039
105//0.1680.0770.052
2///0.0780.054
1////0.054
1511//0.1480.0700.048
3///0.0830.059
1////0.059
205///0.0820.057
1////0.058
511/0.2070.1080.0490.032
3//0.0770.0480.033
1///0.0360.031
1011//0.1220.0670.047
3///0.0570.048
1////0.039
156///0.0630.054
1////0.035
2010///0.0680.054
2////0.042
Publisher’s Note: MDPI stays neutral with regard to jurisdictional claims in published maps and institutional affiliations.