Article

Salinity Tolerance and the Effect of Salinity and Algal Feed on the Demographics of Cultured Harpacticoid Copepods Tisbe holothuriae and Tigriopus sp. from the Messolonghi Lagoon (W. Greece)

Plankton Culture Laboratory, Department of Animal Production, Fisheries and Aquaculture, University of Patras, 30200 Messolonghi, Greece
*
Author to whom correspondence should be addressed.
J. Mar. Sci. Eng. 2022, 10(11), 1663; https://doi.org/10.3390/jmse10111663
Submission received: 14 October 2022 / Revised: 28 October 2022 / Accepted: 1 November 2022 / Published: 4 November 2022
(This article belongs to the Special Issue New Challenges in Marine Aquaculture Research)

Abstract

:
The locally isolated harpacticoid copepods Tigriopus sp. and Tisbe holothuriae were subjected to salinity tolerance experimentation at salinities under and above of 40 ppt, and presented high halotolerances in Tigriopus LC50 (24 h) of 1 ± 4.43 ppt and 132 ± 5.35 ppt, respectively, and in Tisbe of 15 ± 2.41 ppt and 93 ± 3.23 ppt, respectively. Tetraselmis suecica, among other microalgal feeds (Asteromonas gracilis, Rhodomonas salina, Dunaliella salina and Isochrysis galbana), resulted in the higher production of nauplii in Tigriopus and R. salina and D. salina in Tisbe (also close to T. suecica in Tigriopus). The demographics (number of nauplii, egg sacs, completion of hatching) of both copepods, using combinations of salinities in the range of 22–60 ppt and D. salina and R. salina as feeds, exhibited almost the same preference for microalgae but were negatively affected by the salinity of 60 ppt. The present experiments showed that these local copepods that have extreme salinity tolerance and a wide preference for easily cultured microalgae can be used in ecological studies and for mass production as live feed in marine fish hatcheries.

1. Introduction

The rotifers (Brachionus spp.) and the nauplii of the crustacean Artemia sp. are the most widespread live foods for mass production of larvae in fish farms. However, the larvae of certain marine fish species such as those of the Lutjanidae and Serranidae families are not nutritionally covered by these foods and require the use of other live food that covers all of their metabolic needs [1]. In recent years, interest has focused on the nauplii of various species of copepods, mainly of the classes Calanoida and Harpacticoida, and although their use in commercial feed for fish larvae is currently very limited, they present many advantages, leaving many prospects for their wider use in the future [2]. With the use of copepods as live food, there is ground for the introduction of new species of fish into fish farms that until now was not possible to grow, since commercially available foods were not suitable even after enrichment to cover them nutritionally [3]. Many species of copepods are highly tolerant to fluctuations in salinity, temperature and other physicochemical environmental factors. However, their productivity can vary significantly at different values of these factors. When mass producing a species for use as live feed in aquaculture, it is important to ensure optimal conditions to achieve maximum productivity [4]. Copepods of the order Harpacticoida in their nauplii stages have a small size, high reproductive potential, rapid population growth and are nutritionally flexible and tolerant to a wide range of environmental factors, such as temperature and salinity [5,6], with the result that they present themselves advantageously as food for cultured fish larvae. Compared to other orders of copepods such as calanoids, they appear more advantageous for mass production since sustainable cultures of them can be achieved at high densities [7]. At the same time, harpacticoid copepods help keep fish larval rearing tanks clean by consuming the algae and food debris that adheres to their walls [8]. The conversion of organic molecules resulting from the catabolism of copepod’s food into essential fatty acids (EFAs) makes them a more complete source of nutrients for fish larvae than more common foods used today such as Artemia or rotifers [9]. According to Camus and Zeng, [7] the content of chemical compounds in tissues is mainly determined by the species of microalgae that constitute their food. The ability of harpacticoid copepods to biosynthesize long-chain polyunsaturated fatty acids from saturated fatty acids gives them the adaptive capacity to cope with adverse situations related either to the reduced availability of nutrients in their environment, or to gradual environmental changes due to climate change [10]. Harpacticoid copepods, usually living as benthic organisms in coastal habitats, feed mainly on algae and organic particles [11]. Depending on the species and the availability of food, the harpacticoid species are found as epibenthic, endobenthic or mesobenthic organisms. Calliari et al. [12] studied the effect of salinity on the reproduction of two species of copepods of the genus Acartia (A. tonsa and A. clausi). In both species, egg hatching success was low at the lowest salinities tested. Furthermore, the variable size of the eggs between the different salinity values suggests that the egg shell is permeable to water and thus the embryos at the different salinity values faced different osmotic pressures, whereas the higher embryonic mortality at low salinities for A. clausi suggests that embryos are more sensitive than adults to salinity reduction. The narrow range of tolerance to salinity changes during early nauplii stages is a common pattern in several copepod species [13,14]. In a study [15] on the effect of different salinity values on the copepod Pseudodiaptomus pelagicus, fecundity was indirectly affected by the change in salinity, as fewer eggs were counted in the egg sacs of females reared at lower and higher salinities versus optimal salinity. In another study [16], in individuals of the copepod Tisbe holothuriae, the deviation from the optimal salinity value (38 ppt) resulted in a decrease in productivity (a lower number of nauplii from each egg sac), as well as an increase in mortality.
This research work seeks to further contribute to the required knowledge for the use of copepods as food in larval stages of cultured marine fish, against common live foods used today. The interest in the mass cultivation of copepods with the aim of using them as food for the larval stages of fish farming, but also for ornamental fish in aquaria, is growing both in Greece and in other countries in recent years. The mass production of copepods with high nutritional value could lead to the reduction of production costs in fish farming units. In addition, the cultivation of specific copepod species as food could contribute to the production of aquaculture fish of higher nutritional value. In order to achieve this, however, optimal physicochemical growth conditions are required, which are determined not only by the species of copepods, but in some cases also by the particular characteristics of the populations from which they originate. The purpose of the present study is to investigate the possibility of cultivating two genera of copepods that are widely found in Greece and more generally in the Mediterranean, Tisbe and Tigriopus, as well as to investigate the effect of four levels of salinity and two types of microalgae (as food) on their development and production. In addition, investigating their tolerance to extreme salinities will add insight into the survival of these organisms under potential extreme climate change impacts on coastal aquatic ecosystems.

2. Materials and Methods

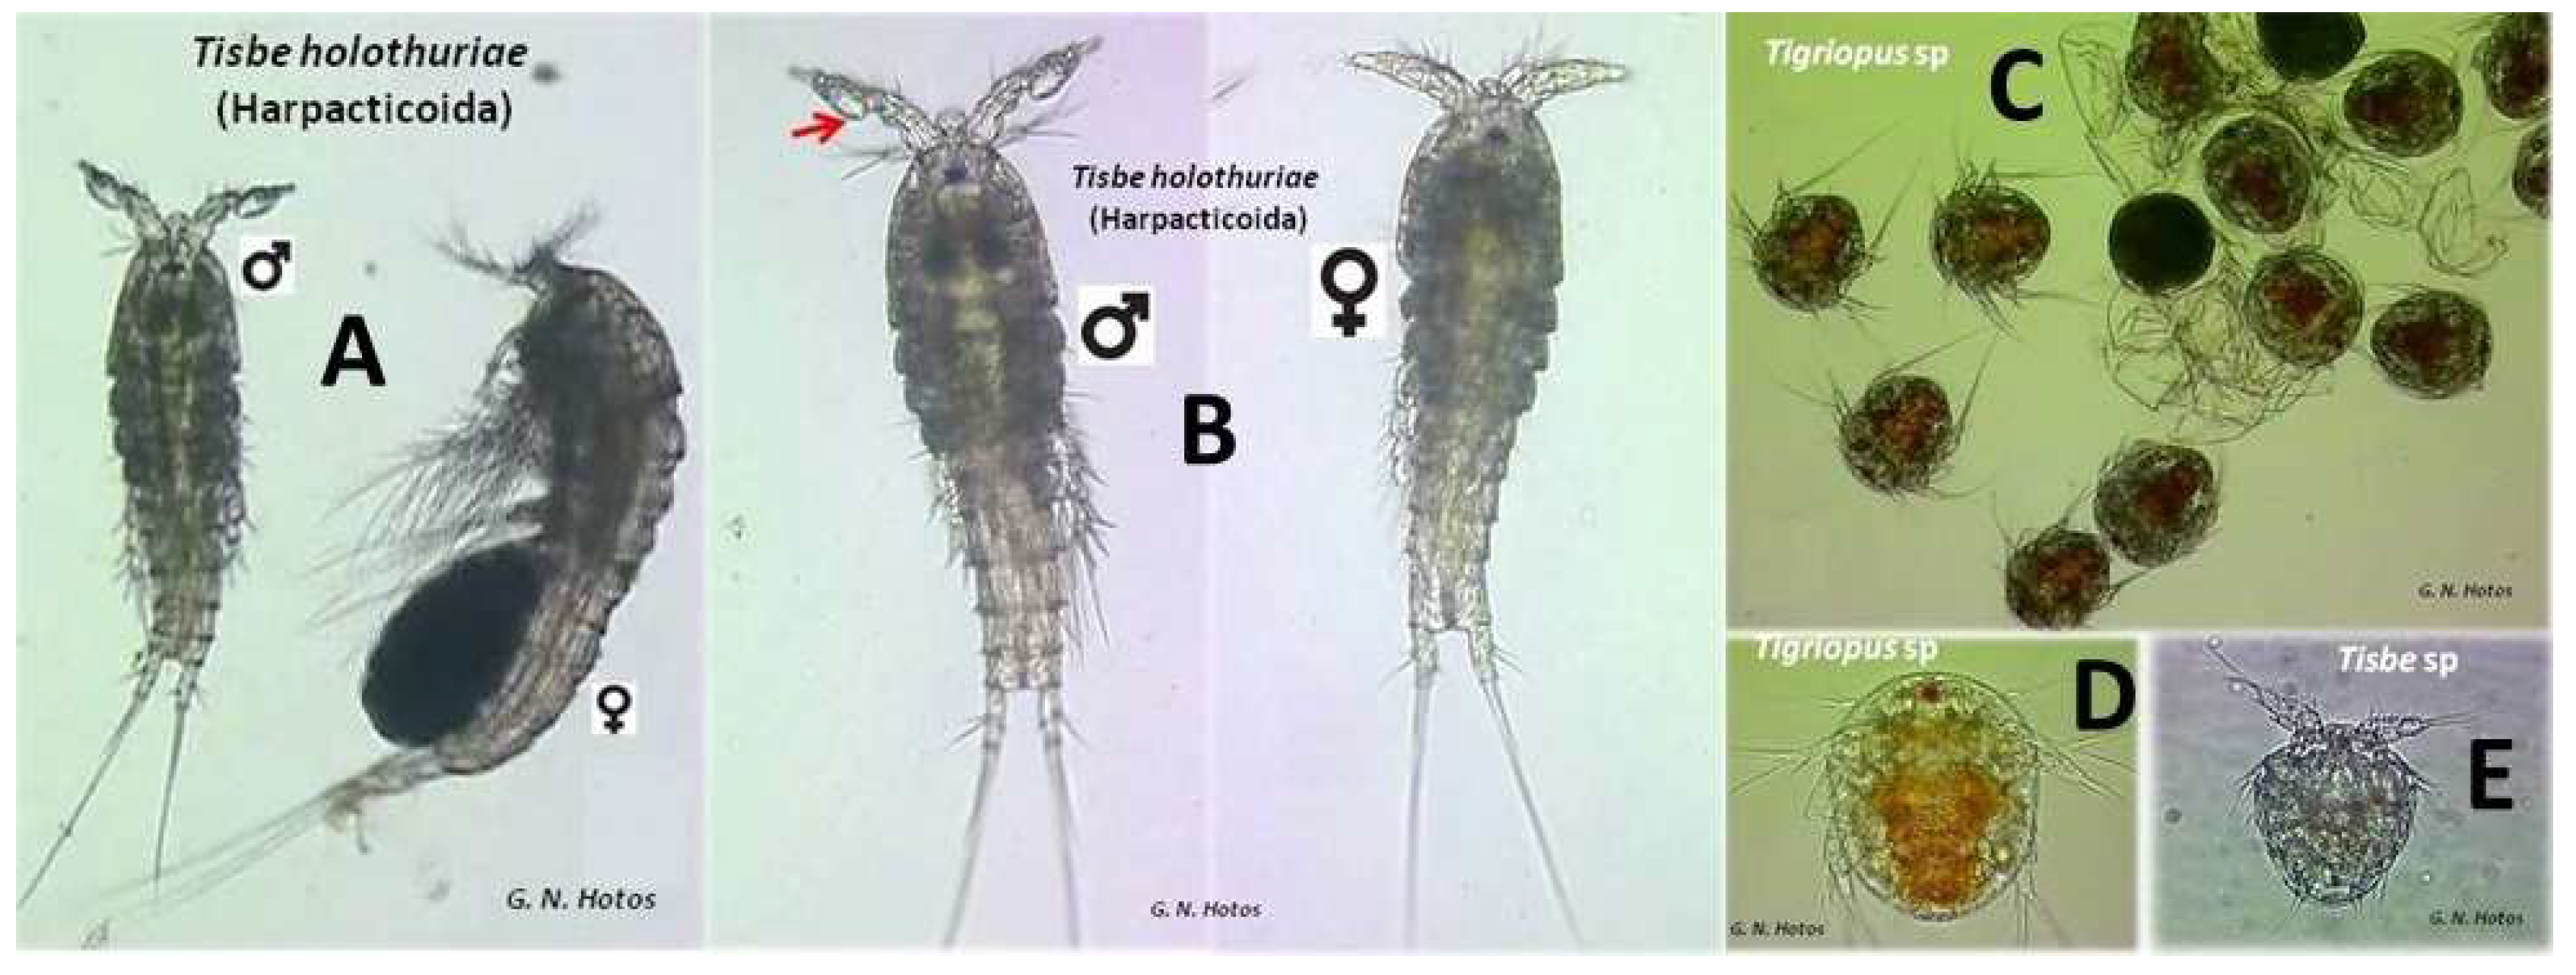
Tigriopus sp. and Tisbe holothuriae (Figure 1 and Figure 2 and Videos S1 and S2, respectively) originated from a screening survey of the saline waters (35–40 ppt) of the Messolonghi lagoon (38°20′05.16″ N, 21°25′28.51″ E) on the Ionian coastline of Greece [17]. The experimentation was comprised of 3 experimental series accomplished separately. The first experiment concerns the salinity tolerance of the copepods. The second experiment concerns the influence of several algal feeds on progeny production. The third experiment concerns the combined influence of salinity and algal feed on the demographics of the copepods. For simplicity, the three experiments are named hereafter as: “Experiment on salinity tolerance”, “Experiment on feed influence” and “Experiment on salinity-feed demographics”, respectively.
For each experiment for both copepod species, the required number of individuals or ovipositor females were obtained from stock cultures acclimatized and maintained in the laboratory under optimal conditions. More specifically, each population of each copepod species was maintained in 1 L glass cylindrical containers with 850 mL of 37 ppt salinity water at room temperature and lighting (~19 °C and ~500 lux, respectively), with a daily supply of a small but sufficiently concentrated by centrifugation (paste) mixture of phytoplankton (Tetraselmis suecica, Rhodomonas salina, Isochrysis galbana, Dunaliella salina and Asteromonas gracilis), cultivated in the laboratory and used in their exponential growth phase. From the container of the stock culture, amounts of 10 mL were taken with a glass pipette, from which, after microscopic inspection, the copepods required in the experiments were taken. In particular, the adult copepods (without egg sac) used for the salinity tolerance experiment and the ovulated females (with egg sac) used in the food type effect experiment were obtained.
In the salinity tolerance experiment (Figure 3A), small plastic containers of 20 mL were used in which water with salinities of 0, 2, 4, 6, 8, 10, 20, 30, 60, 70, 80, 90, 100, 105, 110, 115, 120, 125, 130, 135, 140, 145 and 150 ppt was placed. Twenty-five (25) copepods were placed directly in each number with the defined salinity in order to apply the probit method [18], i.e., to find the 50% mortality rate of the population after the first 24 h (LC50). At the end of the first 24 h, the number of live and dead animals was recorded. Presumed dead animals for determining whether they were indeed dead were collected with a Pasteur pipette into a dish containing salt water of 35–37 ppt and after a reasonable interval were re-checked for liveness. The probit method calculates the 50% mortality rate of experimental animals in a series of escalating concentrations of some substance (in our case salinity). In total, 50% lethality is calculated as LC50 (Lethal Concentration 50%) ± 95% confidence limits (CL) and corresponds to that concentration of the test substance which causes death in 50% of the number of experimental animals exposed to it within a certain period of time (usually 24 h as in our case). The 95% confidence limits of the 24-h LC50, (lethal salinity for 50% of subjects in 24 h) are given as: LC50 1.96[SE(LC50)].
The standard error (SE) of the LC50 was calculated using the formula:
SE LC 50 = 1 b p n w ¯
where b = the slope of the probit-salinity regression line, p = the number of salinities used for each case, n = the number of subjects used in each salinity group = 25, w ¯ = the mean “weight of probit observations” [18].
The feeding experiment (Figure 3B) used multi-chambered plastic plates (20 chambers of 3 mL per plate) in which one ovulated individual per chamber was placed in 37 ppt salinity water, ~20 °C and 500 lux diffuse illumination. Each chamber according to the protocol was given the selected species of microalgae from cultures in the exponential phase in a dose of ~0.1 mL of culture per 3 days. The algae used were Tetraselmis suecica, Asteromonas gracilis, Isochrysis galbana, Rhodomonas salina and Dunaliella salina. In terms of cell biovolume, Rhodomonas was ~400 μm3, Isochrysis ~ 140 μm3, Asteromonas ~ 1200 μm3, Dunaliella ~ 350 μm3 and Tetraselmis ~ 450 μm3. At their exponential phase of their culture, they attained: Rhodomonas ~ 5 × 10⁶ cells/mL, Isochrysis ~ 12 × 106 cells/mL, Asteromonas ~ 0.8 × 10⁶ cells/mL, Dunaliella ~ 9 × 10⁶ cells/mL and Tetraselmis ~ 7.5 × 10⁶ cells/mL. They were cultured in 2 L Erlenmeyer flasks under 8000 lux, 16 hL:8 hD, 19 °C, salinity 40 ppt, supply of filtered air and Walne’s nutrient medium. The progress of each culture was monitored by counting cells with a Fuchs–Rosenthal haematocytometer and a quantity of culture was collected from the middle of the exponential phase. This quantity was centrifuged (3000 rpm, 3 min) and the algal mass was treated appropriately to create a 5–20 × 105 cells/mL stock culture depending on each algae’s cell biovolume and culture density. A 0.1 mL drop of the concentrated algal stock culture of 5–20 × 105 cells/mL of the specific microalgae was poured into each well of the appropriate plate. The quantity of the algae in the wells was estimated to be 0.5–2 × 10⁵ cells/mL per 0.1 mL drop, divided by 3 mL (volume of the well) = 0.16–0.66 × 10⁵ cells. The lower values correspond to bigger biovolumes, and the inverse applies to smaller biovolumes. Overall, approximately the same algal mass was introduced in every well irrespective of the algal type. The experiment lasted 28 days and at the end, the total number of individuals in each chamber was counted.
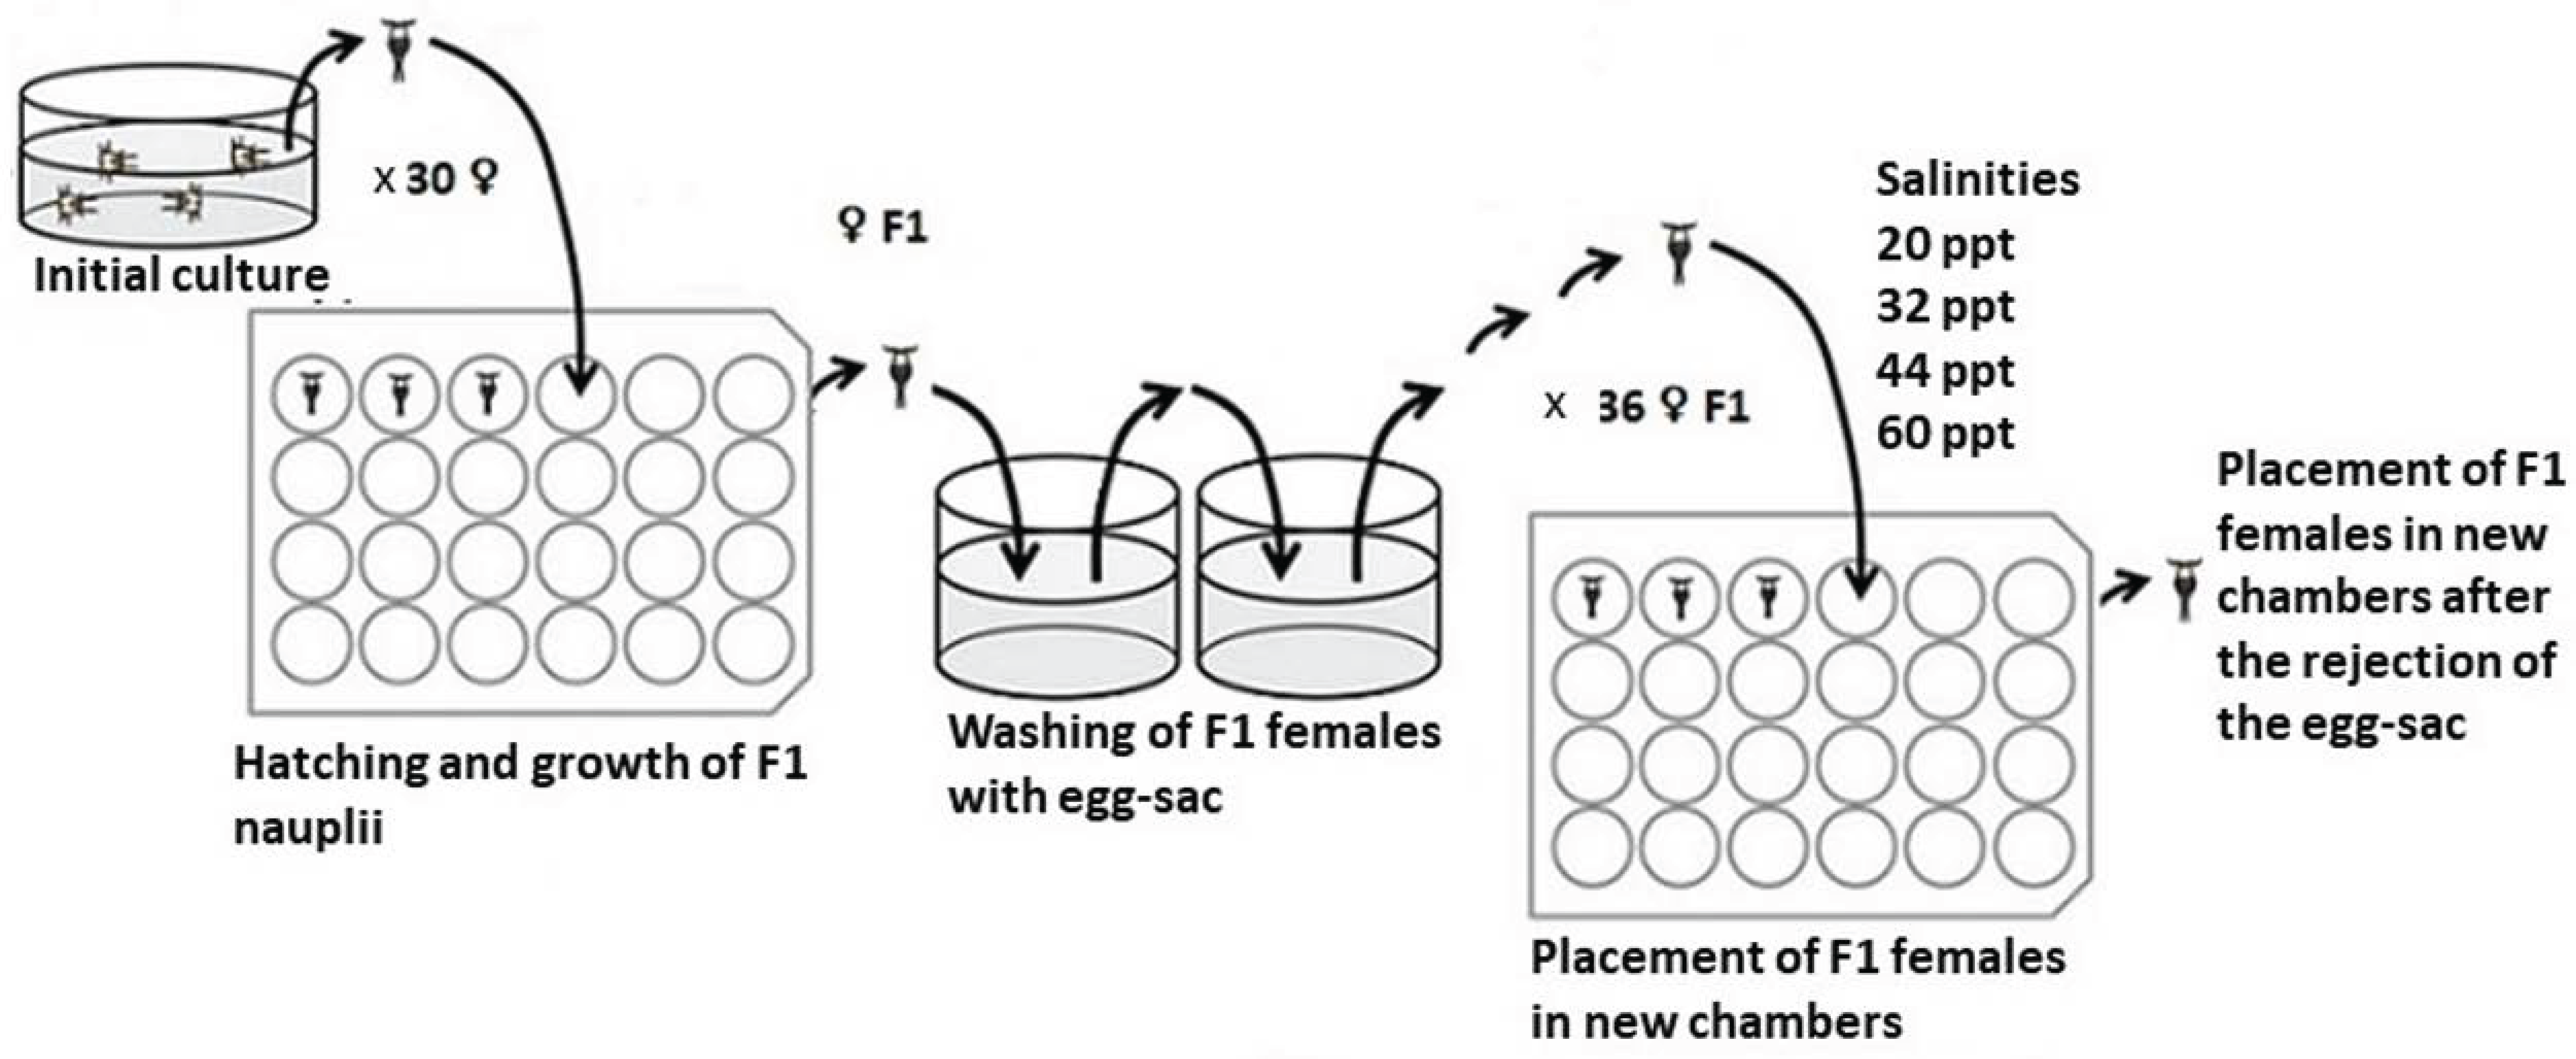
For the experiment of salinity-food demographics (Figure 4), one 1st egg sac female was put in each of the thirty 15 mL chamber of the plates used and filled with 35 ppt salt water. After the complete hatching of the eggs, the mother copepods were pipetted out and removed leaving only the F1 nauplii. The nauplii fed with a proper mixture of microalgae were monitored daily and the females that appeared with their 1st egg sac were sucked, washed in clear 35 ppt seawater and placed in new plates filled with 20, 32, 44, 60 ppt sterilized seawater using minute amounts of concentrated microalgae of either R. salina or D. salina as food thereafter. For each combination of salinity-algae, 36 replicates were created. The temperature was kept at ~21 °C and with a ~500 lux diffuse illumination. The values of pH initially were 7.9 ± 1 but thereafter fluctuated between 7.6 and 8.1. The daily inspection of the populations was performed under a dissecting microscope and salinity was checked by a refractory salinometer. When an increase in salinity (due to mild evaporation) exceeded 2 ppt, the proper addition of distilled water was done. During the experiment, the following parameters were recorded: (i) sum of nauplii from all egg sacs produced by each individual female, (ii) number of F1 nauplii produced by the 1st egg sac, (iii) number of egg sacs produced by each female, (iv) time in days for the complete hatching of the eggs of 1st egg sac, without counting rejected egg sacs (by some females) that were not hatched, (v) time (in days) between the creation of the 1st and 2nd egg sac, without counting females that did not create 2nd egg sac and (vi) percentage of females among adult copepods in each combination of salinity-food. The percentage of females was calculated out of the total number of adults hatched from all 36 female egg sacs at each salinity. Individuals that died at a stage before that of the adults (nauplii-copepodites) were not included for the calculation of the % proportion of female individuals.
Statistical analysis was performed using ANOVA and paired-wise comparisons at the 0.05 level of significance by Tukey’s test using the free PAST3 software (Øyvind Hammer, University of Oslo, Oslo, Norway).

3. Results

3.1. Experiment on Salinity Tolerance

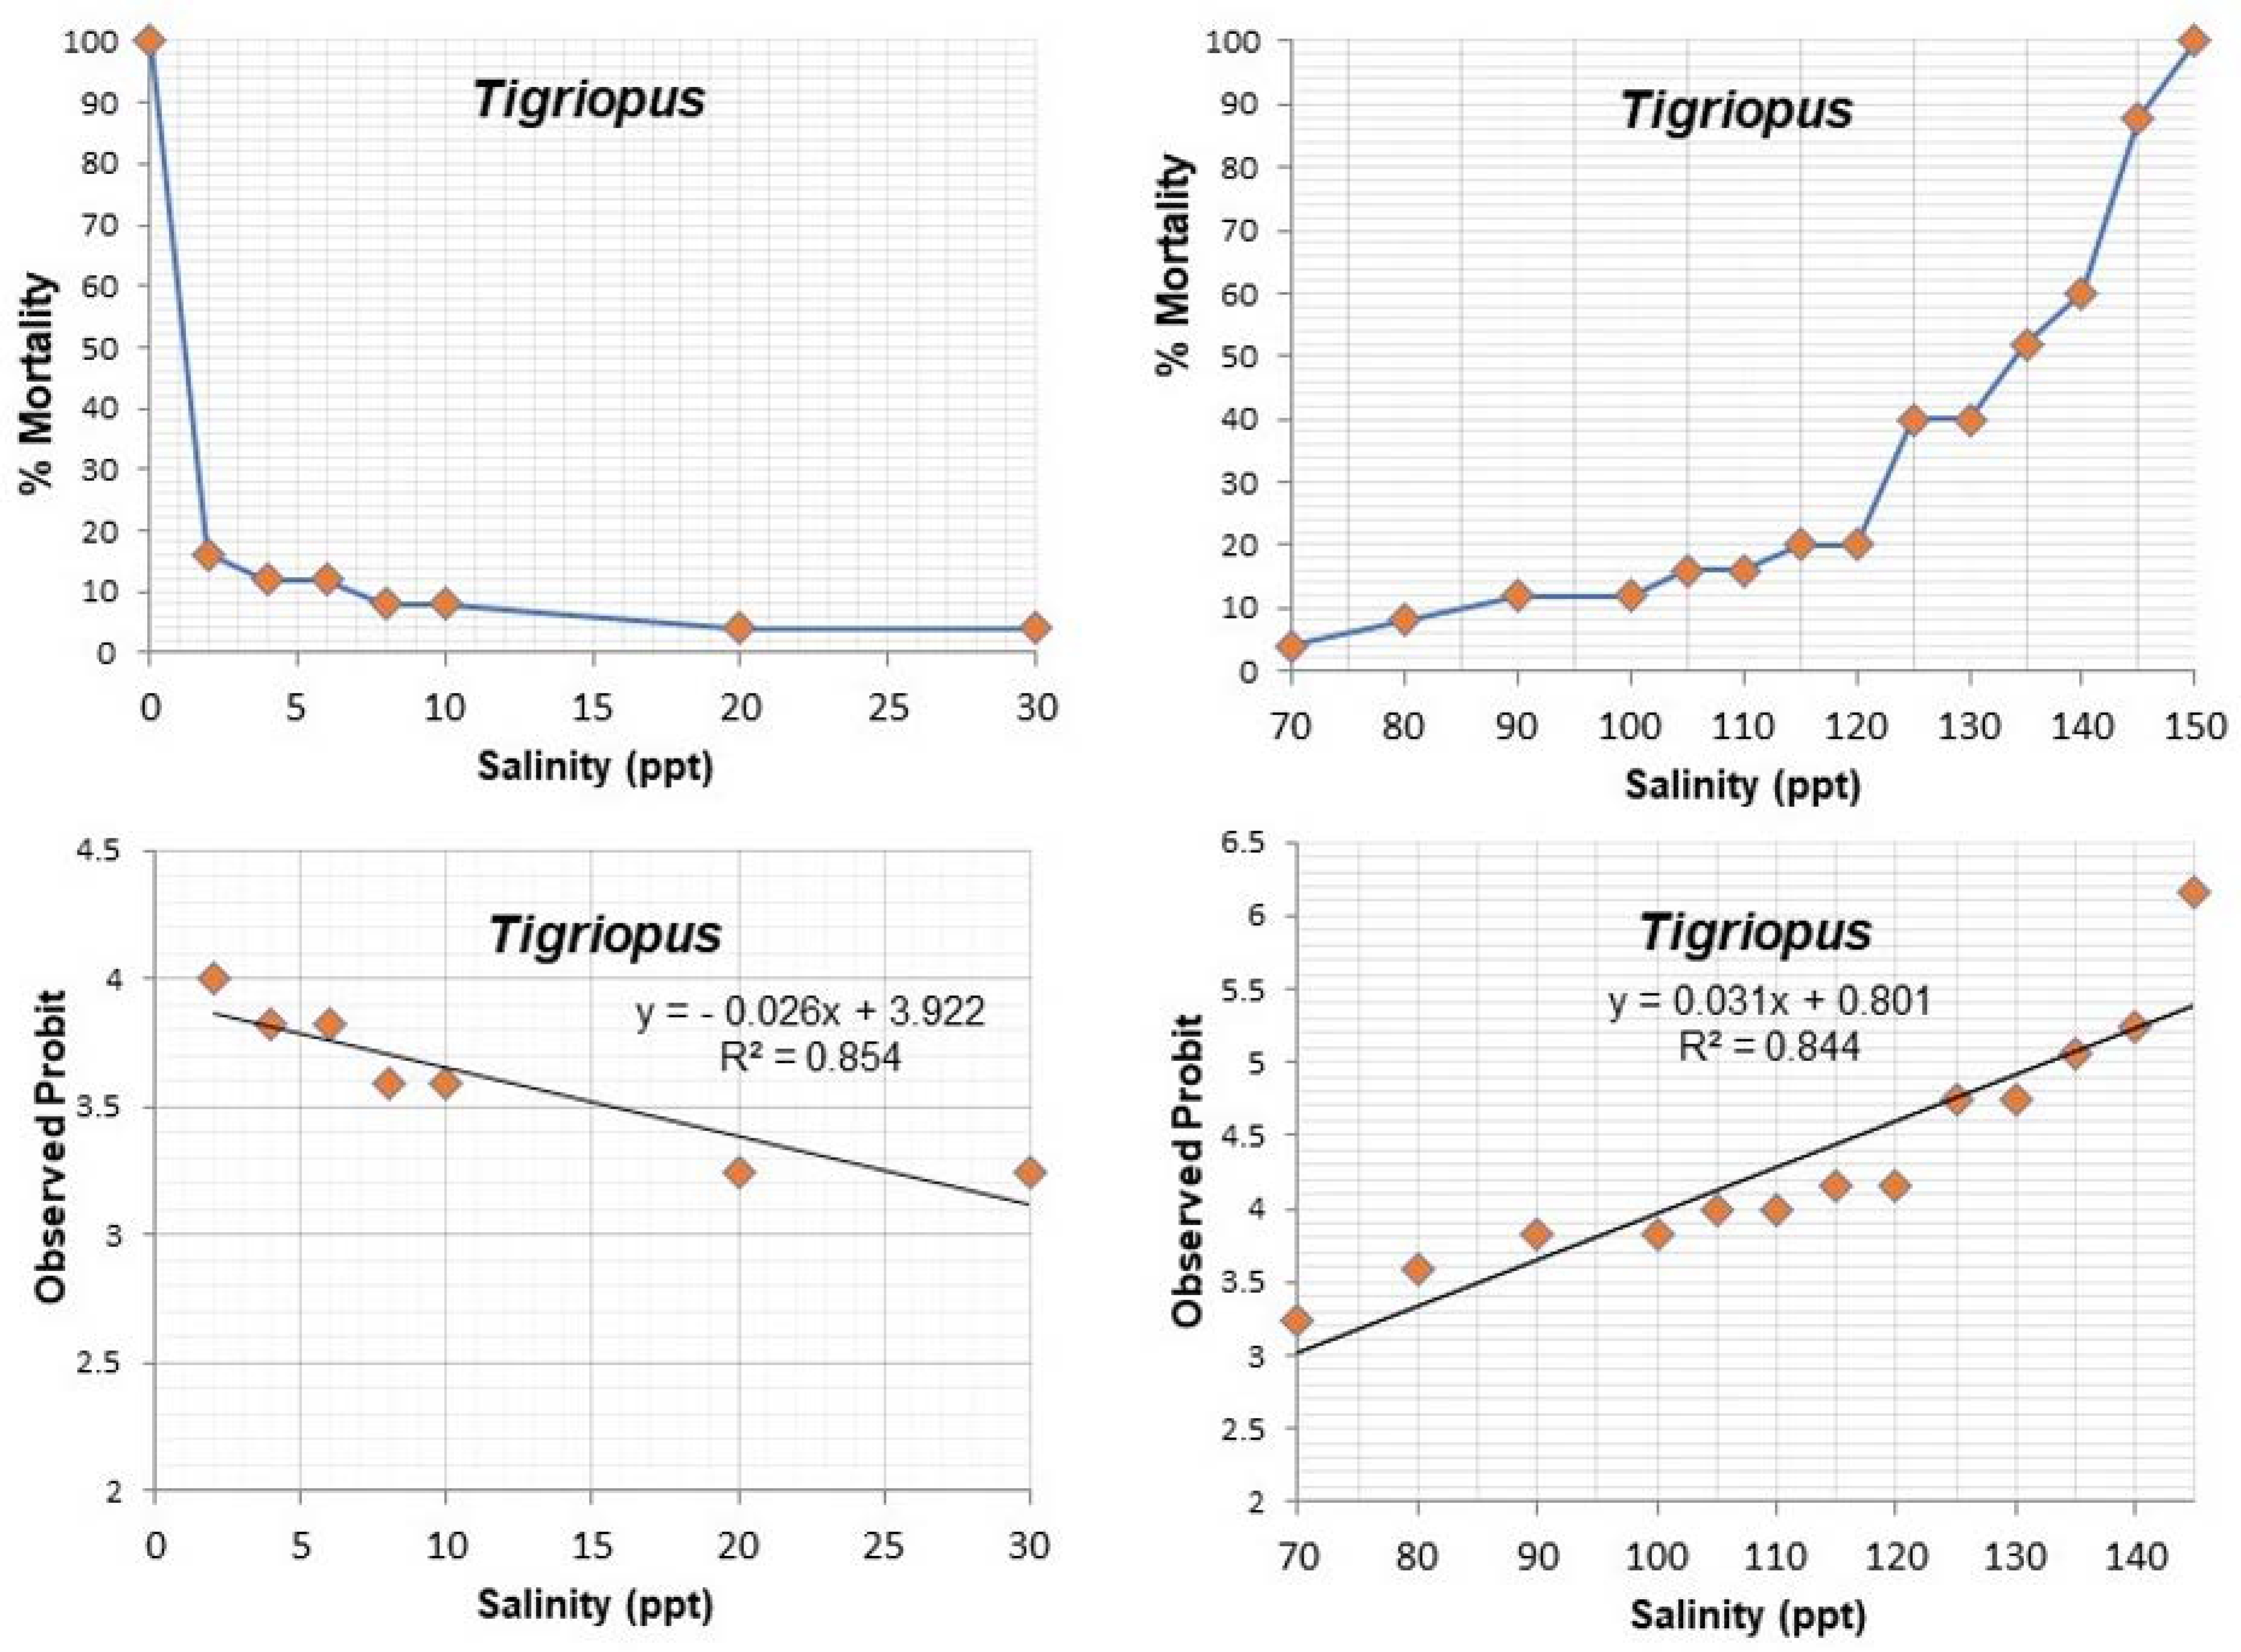
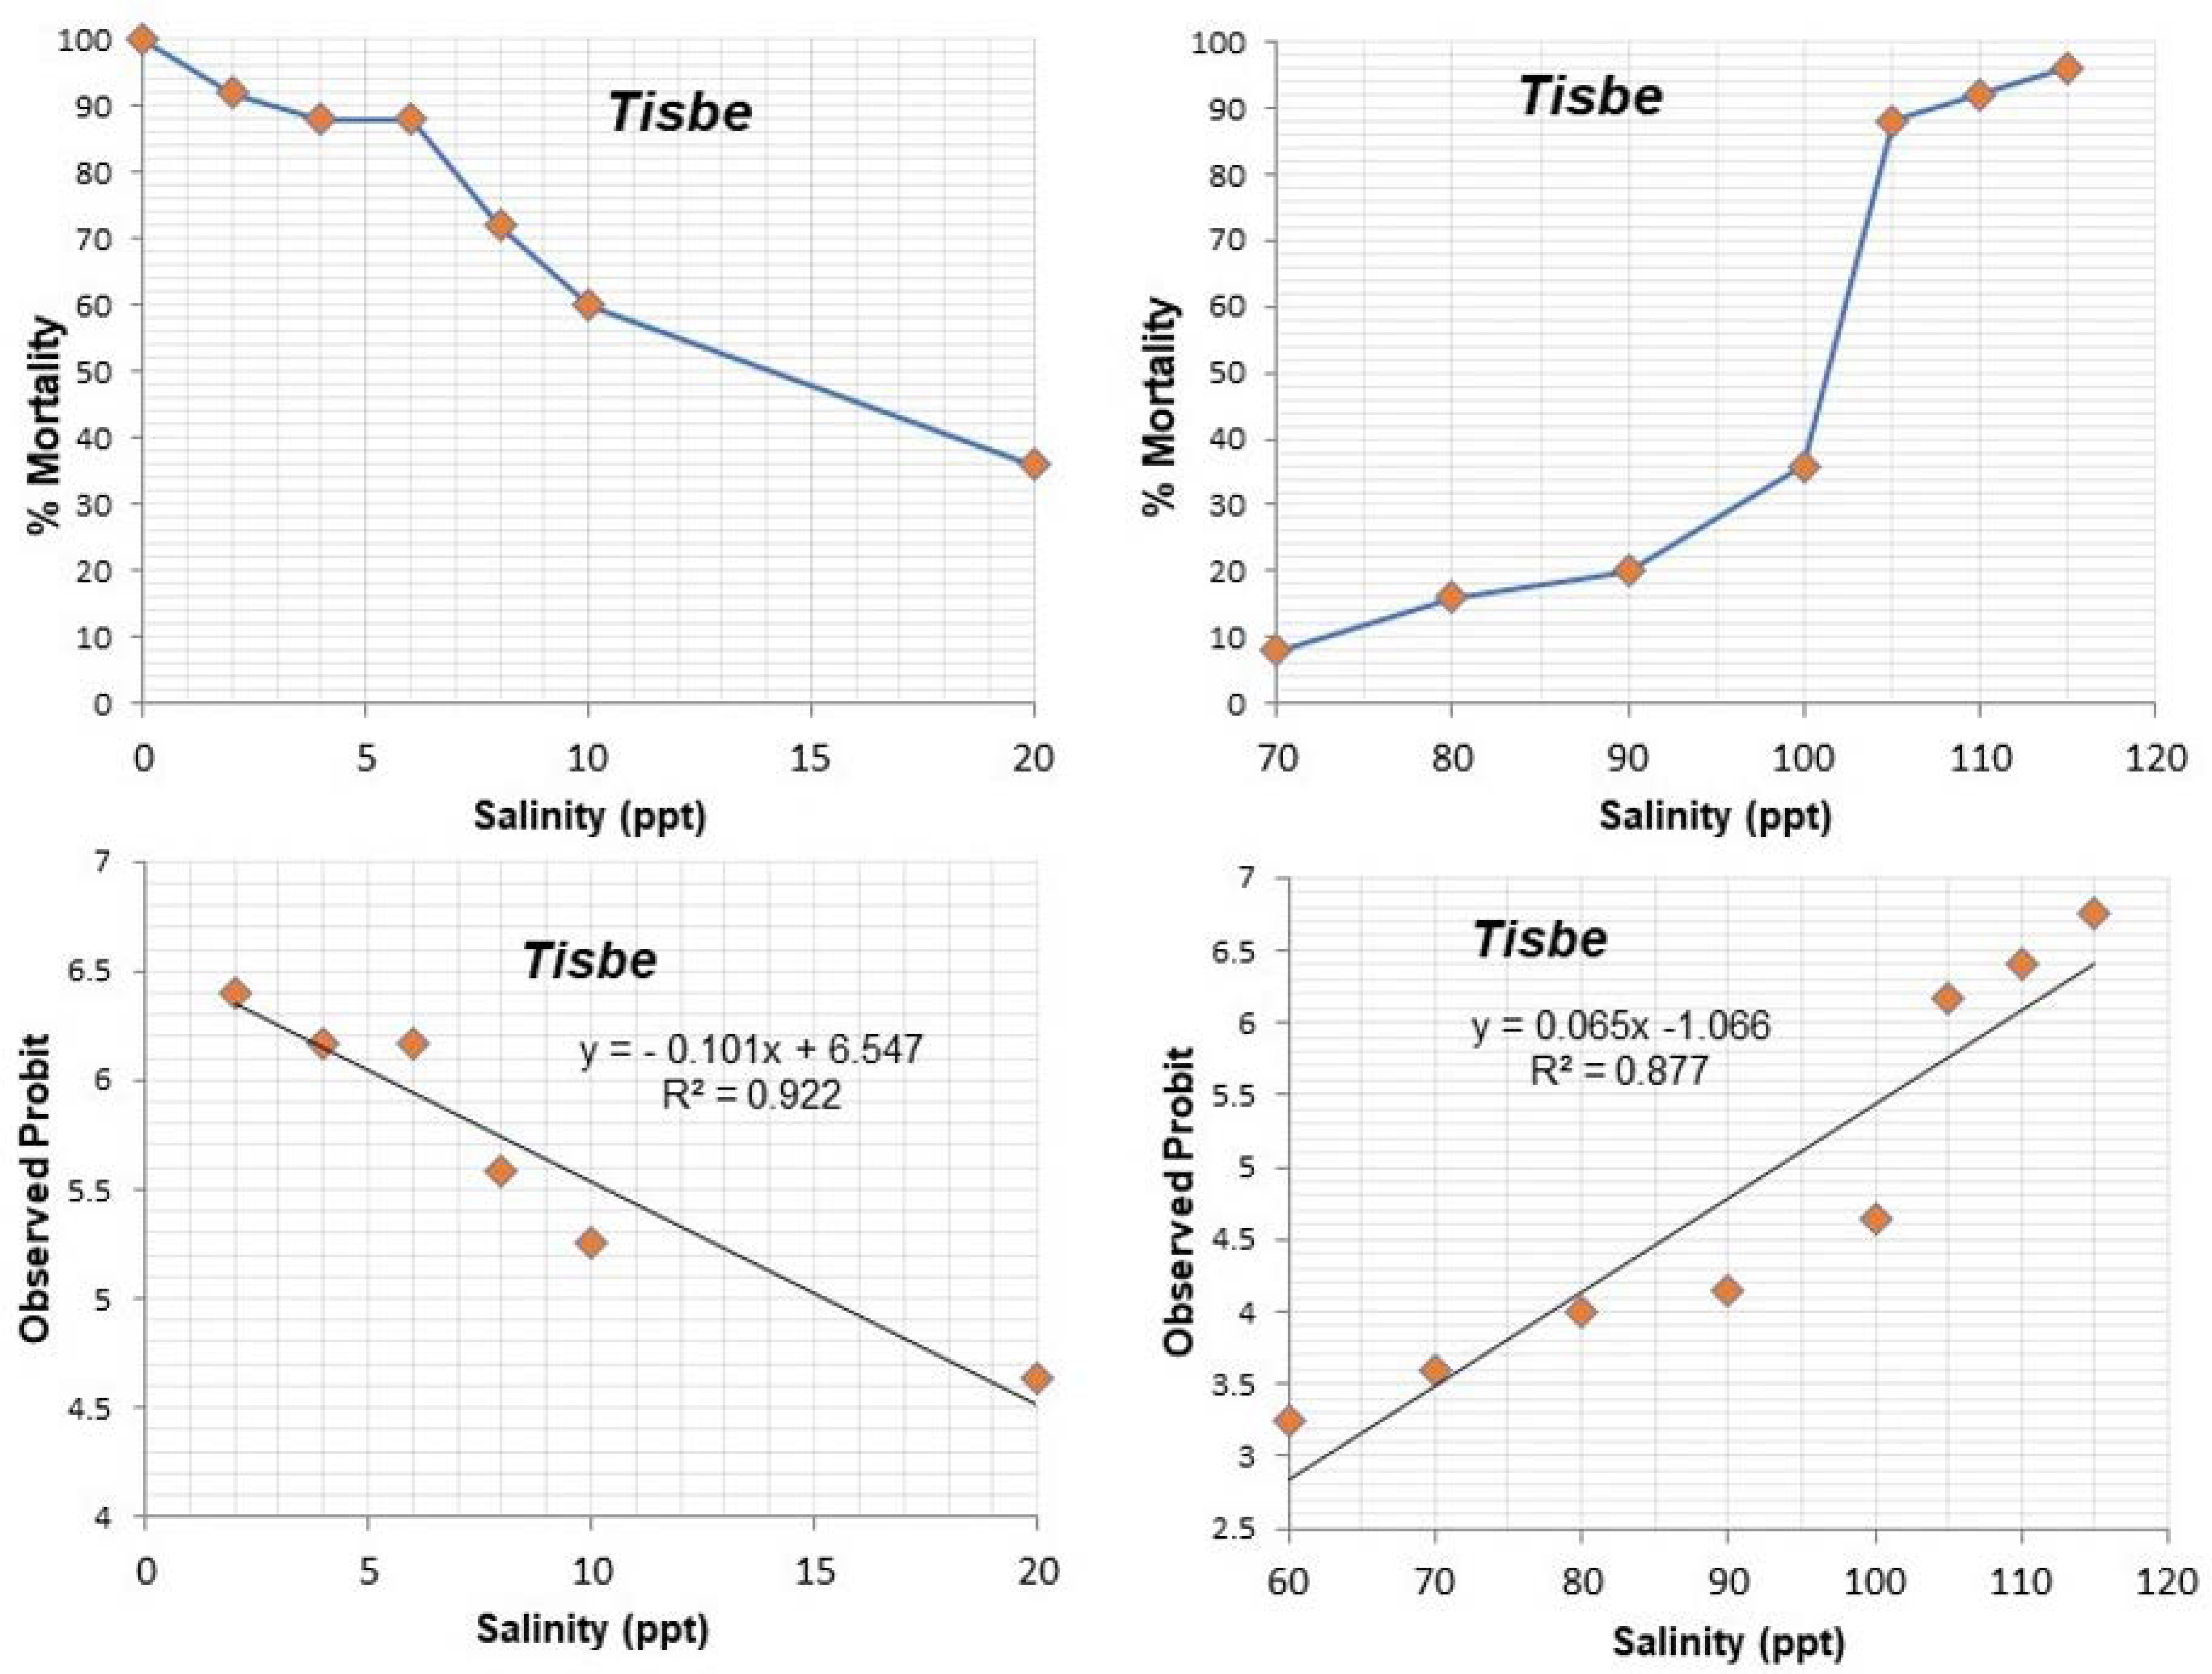
Tigriopus sp. (Figure 5) proved to be more resistant than Tisbe sp. (Figure 6) at both low and high salinities. From the processing of the probit methodology (Table 1, Figure 5 and Figure 6) for low salinities we found: Tigriopus LC50 = 1 ppt ± 4.43 ppt (95% CL) and Tisbe LC50 = 15 ppt ± 2.41(95% CL). That is, in Tigriopus, the salinity that causes 50% mortality is the very low one of 1 ppt, whereas in Tisbe, the relevant salinity is 15 ppt. For high–very high salinities we have: Tigriopus LC50 = 132 ppt ± 5.35 (95% CL) and Tisbe LC50 = 93 ppt ± 3.23 (95% CL). That is, in Tigriopus, the salinity that causes 50% mortality is very high one at 132 ppt, whereas in Tisbe, it is 93 ppt.

3.2. Experiment on Feed Influence

Tetraselmis resulted in the highest production of offspring in Tigriopus (36 ± 0.9 SE), followed by statistically equal Dunaliella (29 ± 1.7) and Rhodomonas (26 ± 1.55), which were also statistically equal for Tisbe (27 ± 1.45 and 28 ± 1.34, respectively) (Figure 7). Asteromonas and Isochrysis were the species with the highest and lowest cell biovolume, respectively, which resulted in substantially and significantly fewer offspring in Tisbe (21 ± 0.56 and 16 ± 0.44, respectively) and even fewer in Tigriopus (16 ± 0.62 and 7 ± 0.48, respectively). However, concerning Tetraselmis in Tisbe, the production of offspring was significantly much lower (22 ± 1.08) than the relevant one of Tigriopus (36 ± 0.91). Based on these findings, Rhodomonas and Dunaliella were selected as the microalgae to be tested for the next experiment on copepod demographics, as they resulted in equal numbers of progenies in both copepod species.

3.3. Experiment on Salinity-Feed Demographics

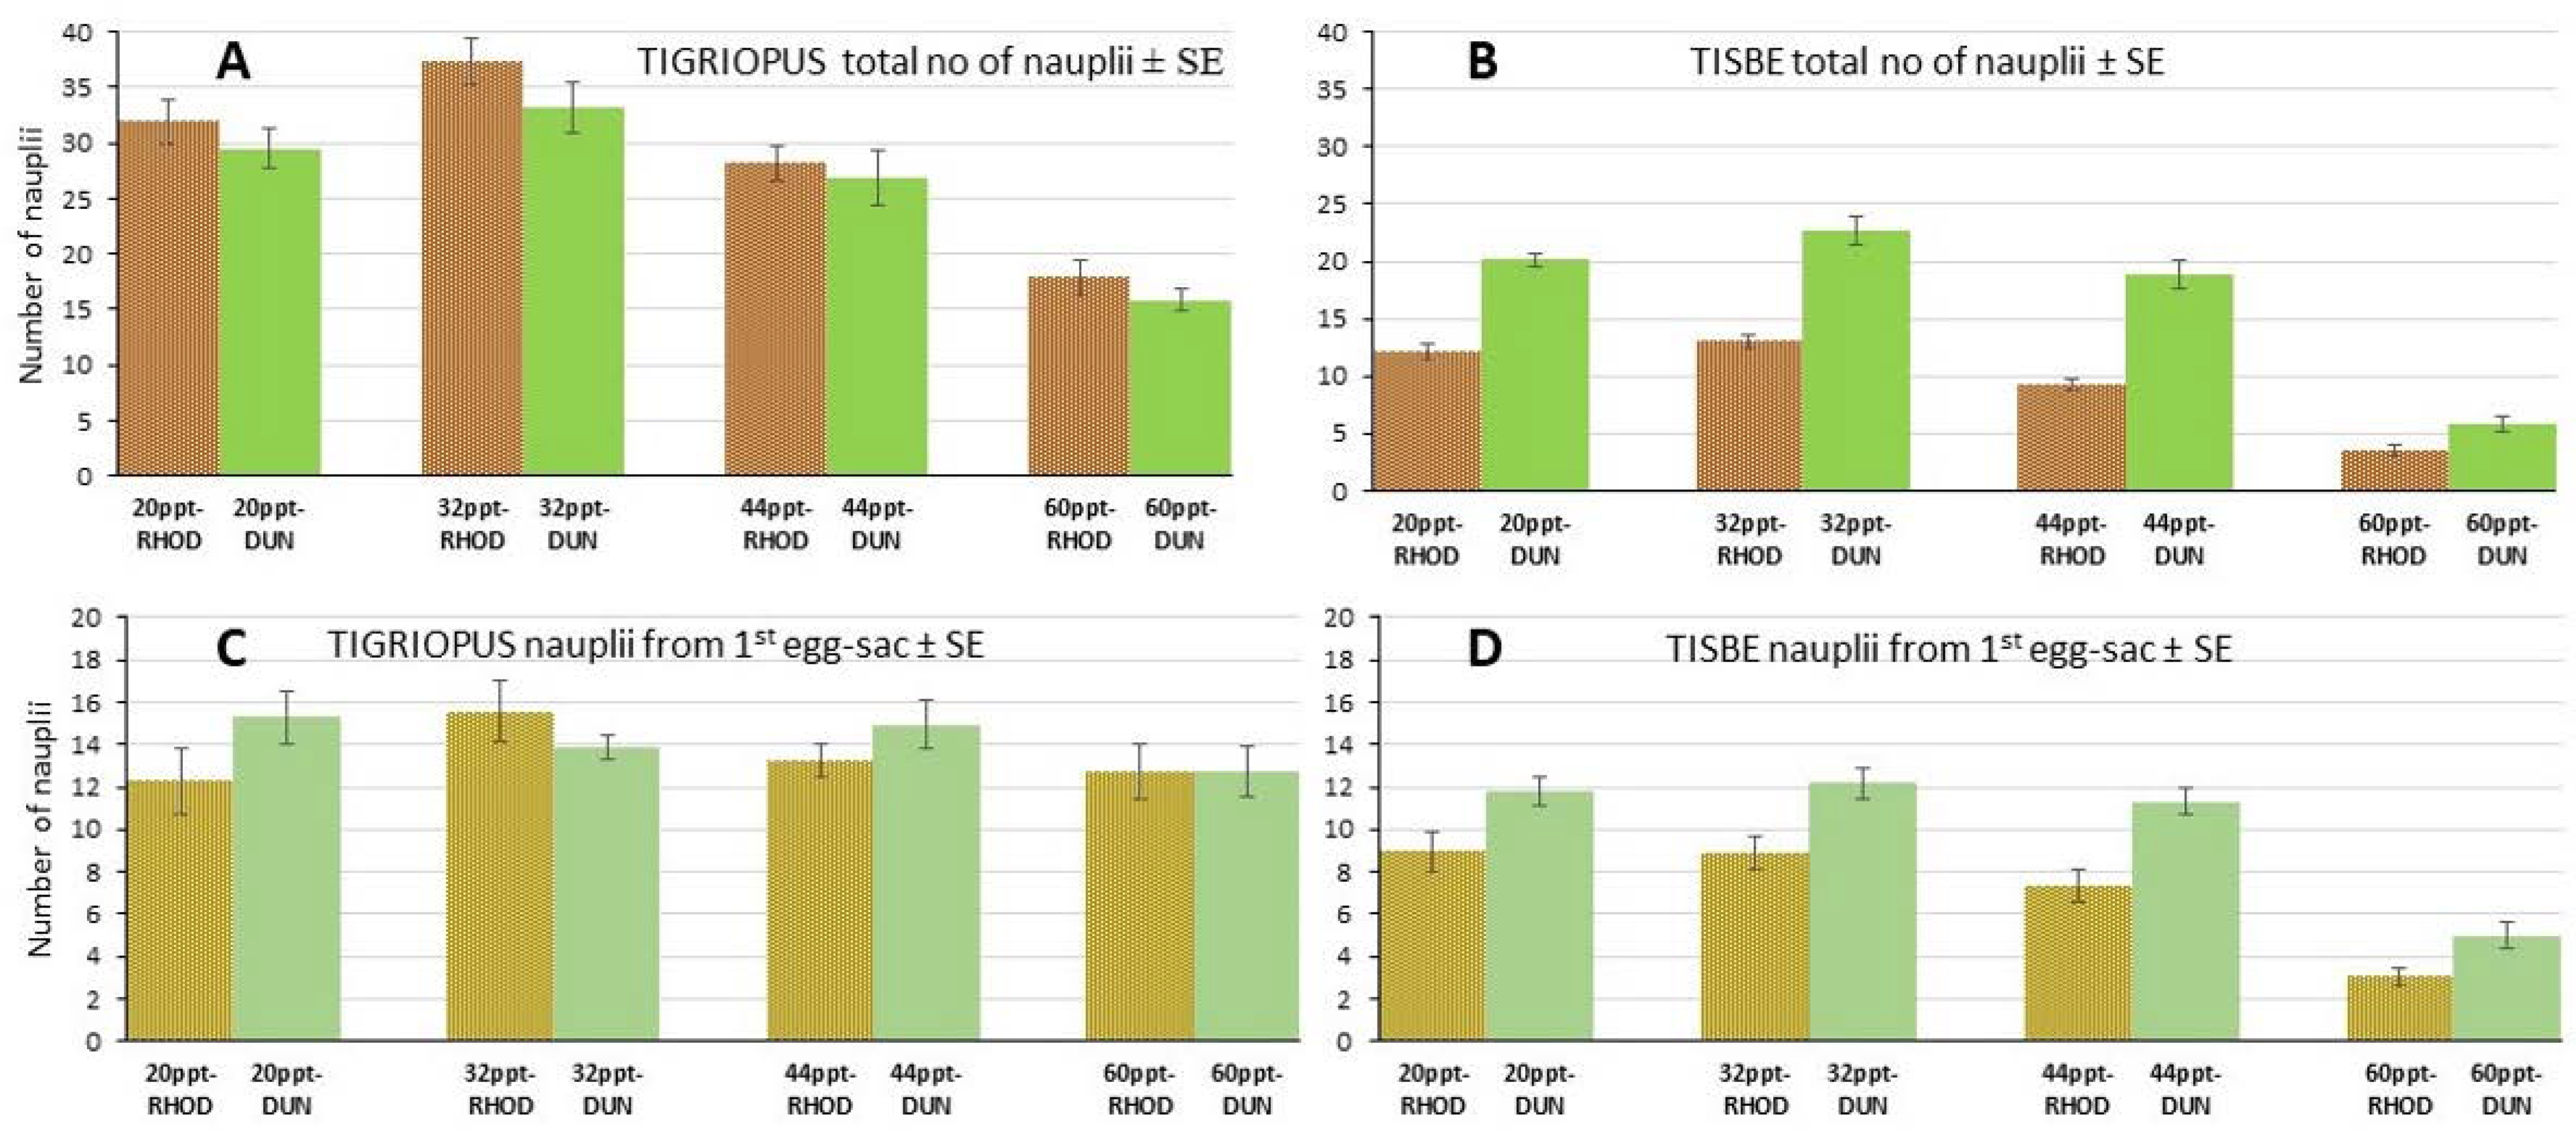
Rhodomonas and Dunaliella equally affected (p > 0.05) the total number of produced nauplii of Tigriopus at each of the four salinities (Figure 8A). The significantly lowest values across salinities for both microalgae were recorded at the highest salinity of 60 ppt (18 nauplii for Rhodomonas, 16 for Dunaliella), whereas the highest numbers (37 for Rhodomonas, 33 for Dunaliella) were recorded at the salinity of 32 ppt. In Tisbe, although the pattern concerning salinity is alike to that of Tigriopus (most progenies at 32 ppt, least at 60 ppt), the effect of the microalgal feed is totally different with Dunaliella’s significant higher values (p > 0.05) than their counterparts of Rhodomonas at all salinities (Figure 8B).
The number of nauplii produced by the 1st egg sac was equal (p > 0.05) across all salinities and type of food (min. 12, max. 15 nauplii) in Tigriopus (Figure 8C). In Tisbe, (Figure 8D) Dunaliella effected the production of significantly more nauplii compared to Rhodomonas (p < 0.05) and produced the same number (11–12 nauplii) statistically across the salinity range of 20–44 ppt, with the salinity of 60 ppt being far less productive in number of nauplii both across the other salinities and compared to Rhodomonas (5 vs. 3, respectively). The number of nauplii was also statistically equal across the salinity range of 20–44 ppt (7–9 nauplii) for Rhodomonas.
In both species of copepods (Figure 9A,B), the highest salinity of 60 ppt for both microalgae resulted in far fewer numbers of total egg sacs produced by a single female in its life span, compared to all other lower salinities (p < 0.05). Whereas in Tigriopus (Figure 9A), in all salinities, the number of egg sacs produced was statistically equal for both microalgae at each particular salinity, in Tisbe (Figure 9B), at the salinities of 32 and 44 ppt, Dunaliella resulted in a significantly higher number of egg sacs compared to Rhodomonas. In general, Tigriopus at all salinities for both microalgae produced more egg sacs than each corresponding case for Tisbe (max. mean 3.8 egg sacs vs. 2.7 respectively).
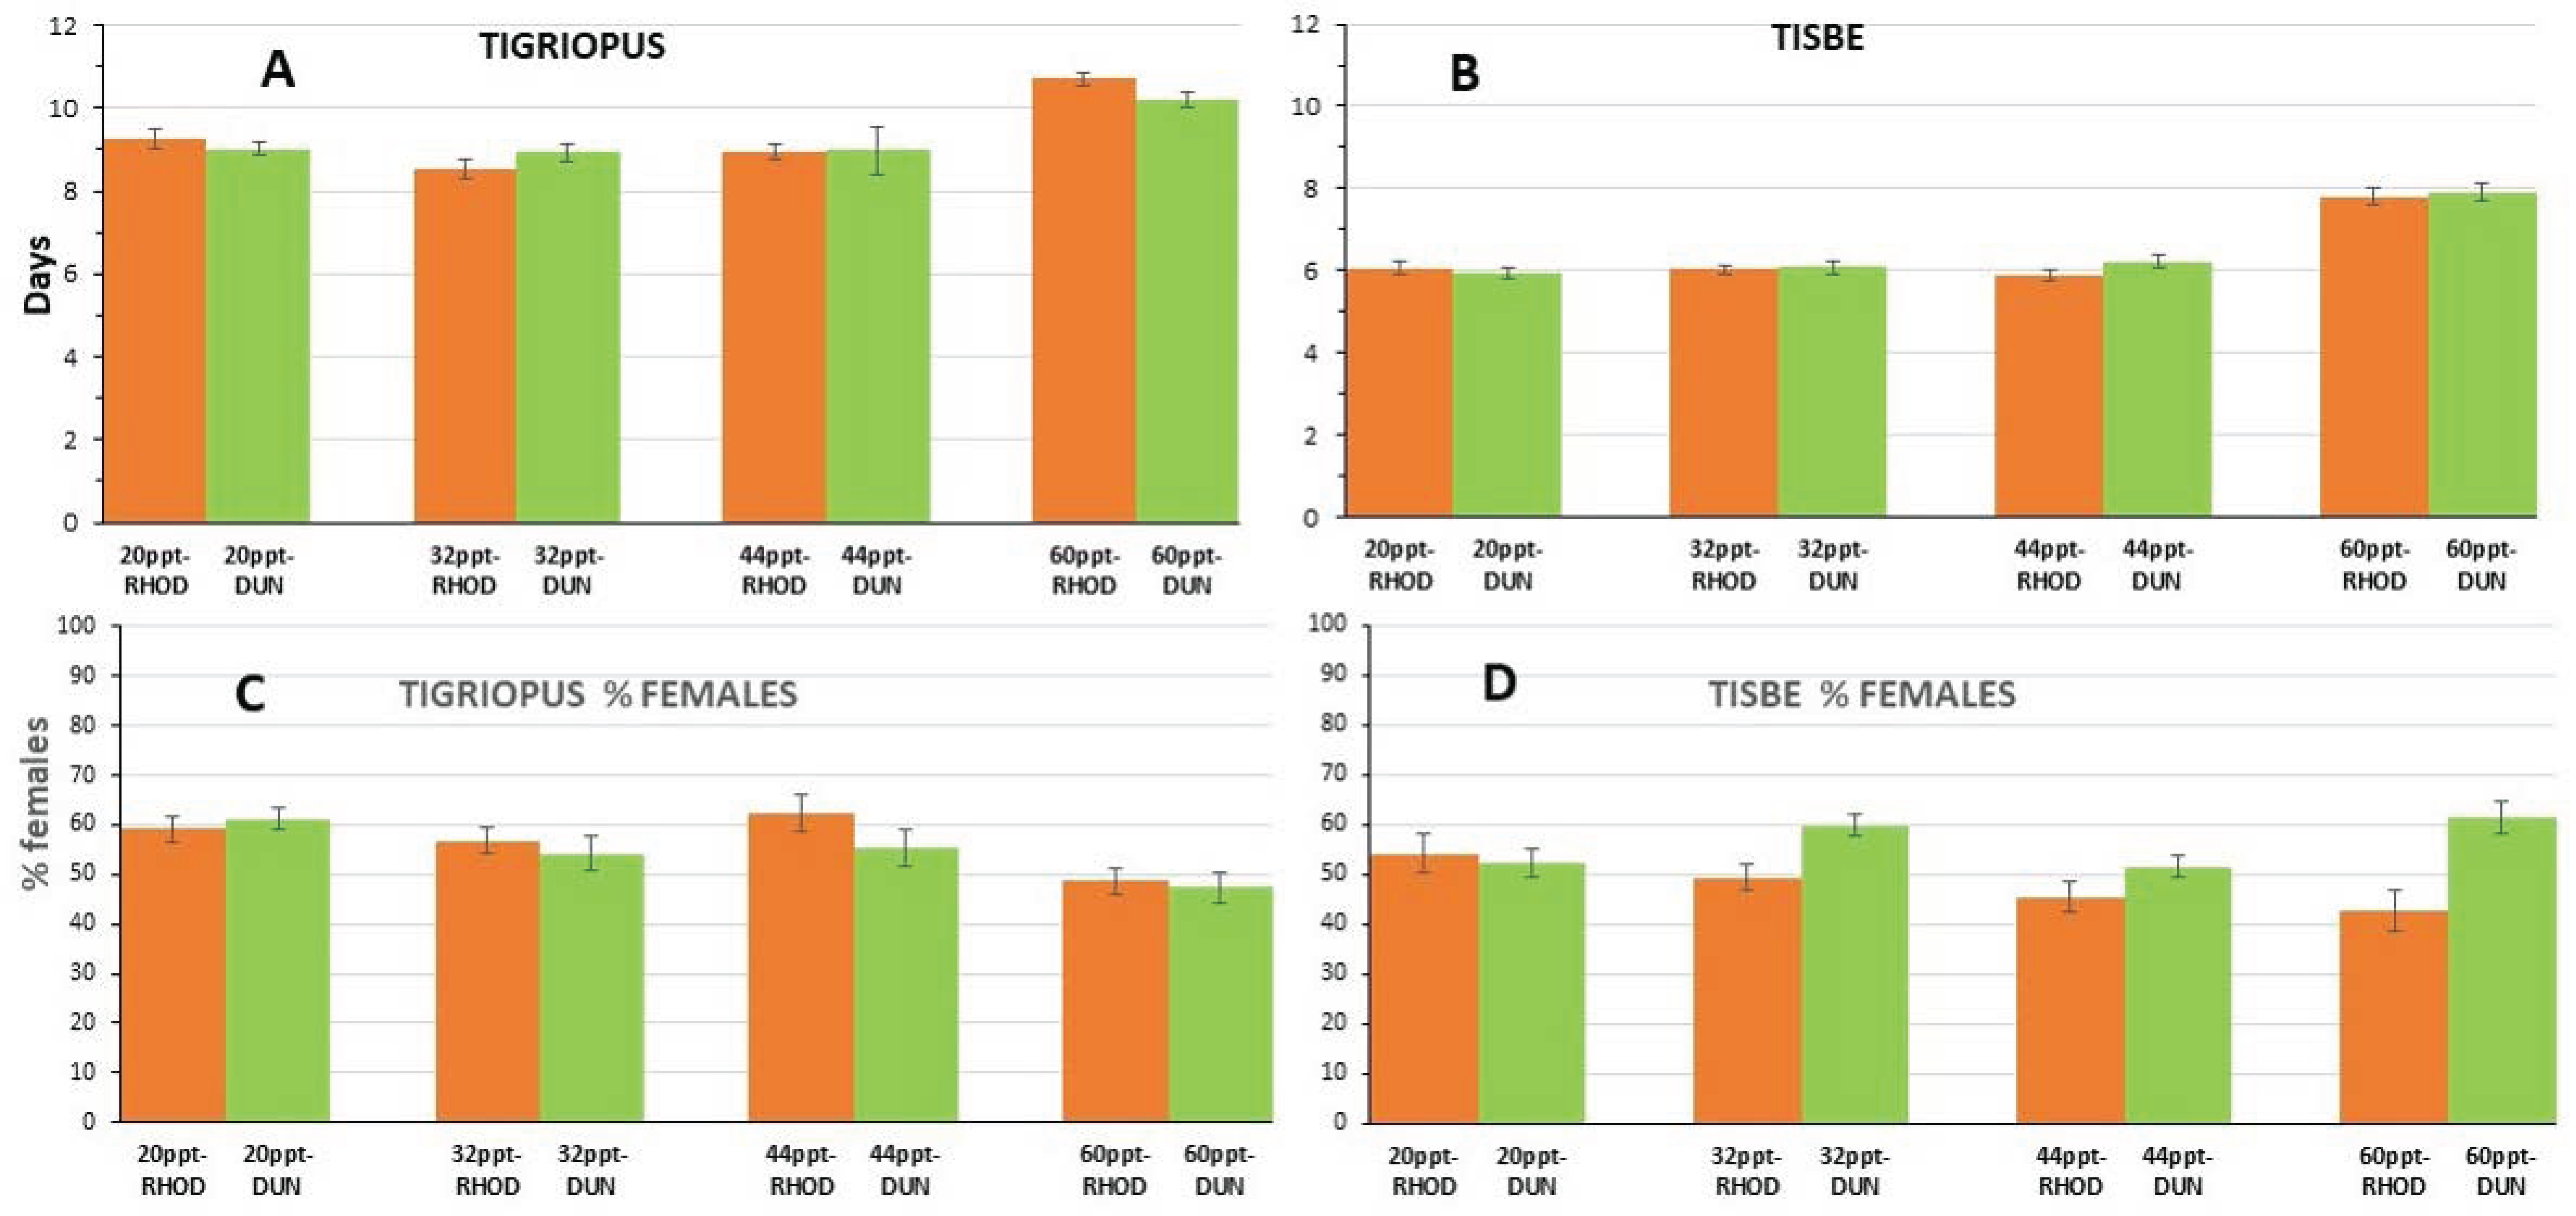
The days required for the complete hatching of all the eggs of the 1st egg sac were in general clearly more in Tigriopus (~7–8 days, Figure 9C) compared to Tisbe (~4–6, Figure 9D). In both species and at all salinities, this time period was statistically equal among the two microalgae at each particular salinity and across salinities in the range of 20–44 ppt. Only at the highest salinity of 60 ppt the required days were statistically greater. The same pattern also occurred concerning the days required for the appearance of the 2nd egg sac from the appearance of the first (Figure 10A,B). Across salinities and type of microalgae, the number of days were statistically equal at the salinity range of 20–44 ppt and significantly less than the days required at 60 ppt in every particular treatment in both copepods, the only difference being that overall values were less in Tisbe (Figure 10B) as compared to Tigriopus (Figure 10A).
The percentage of females was not affected by the type of food in Tigriopus (Figure 10C) as at every salinity, the percentage was statistically equal between Rhodomonas and Dunaliella. On the contrary, in Tisbe (Figure 10D), at all salinities except the one at 20 ppt, Dunaliella effected significantly more females compared to Rhodomonas.

4. Discussion

Copepods of saline environments in general and harpacticoids in particular are euryhaline [17,19,20,21,22,23,24], but to what extent is not clearly known. Existing studies may provide an optimal salinity at which copepods increase in population and additionally provide a range of salinity at which their population maintains satisfactory dynamics, but they do not clearly answer the upper and lower limits of salinity at which they can survive. For Tisbe holothuriae [25], 38 ppt is given as the optimum salinity [16,26]. For other Tisbe species such as T. biminiensis, the limits are reported as very narrow, i.e., 27–34 ppt and even as a prohibitive salinity at that of 20 ppt [27]. For various species of Tigriopus, the survival range is 20–40 ppt with the optimal being at 30 ppt [11], and especially for T. californicus [19] where 100% survival in the range 30–70 ppt is reported. These values are initially considered consistent with the value of 37 ppt in which the copepods lived during the experiments of this work, but we cannot claim that we have exhausted the topic for the optimal development of cultured populations of the specific copepod species. The issue of the presence of copepods in hypersaline waters is important from an ecological point of view as, on the one hand, hypersaline systems are among the most extreme environments on Earth with seasonally dramatic changes in salinity [28], and on the other hand, copepods play an important ecological role, participating largely in the food web and indirectly in the biological recycling of elements [20]. In the literature, there are no corresponding values for T. holothuriae and Tigriopus spp. and therefore ours can be considered as the first data ever presented. Based on our findings, we assume that these copepods will not have any difficulty adapting to salinities that exceed seawater salinity, and based on Figure 5 and Figure 6, we can assume that they will show minimal mortality due to osmoregulatory stress at salinities up to about 70 ppt, especially if their acclimatization is gradual. The importance of copepods resistance to hypersaline environments such as that of the Messolonghi salterns has not been investigated but may be important because they may contribute to good salt production by consuming the microalga Dunaliella sp., whose presence degrades the salt (personal communication). It is clear both from our experimentation and from similar work (but only for Tigriopus, [19,21]) that absolutely fresh water produces almost immediately 100% mortality in both species. However, in brackish water, the situation is radically different. Wheras Tigriopus shows a great adaptation to salinities of 4–10 ppt with almost negligible mortality and practically absolute survival above 10 ppt salinity, Tisbe only after 20 ppt shows 0% mortality. These numbers for Tigriopus especially are in agreement with those found by Hawkins [21]. From the above, we consider that although Tigriopus is shown to withstand a surprising range of salinity (~4–120 ppt) compared to Tisbe (~20–90 ppt), both species can colonize a variety of environments, even extreme water systems (e.g., estuaries, lagoons, hypersaline basins, etc.) and from the point of view of cultivation, any source of supply of salt water can be appropriately used.
The issue of the most suitable microalgal feed for copepods is rather complicated and fragmented in the literature, e.g., it was found [29,30] that Tetraselmis is inferior to Isochrysis as feed for the calanoid Gladioferens imparipes and several species of Acartia, respectively, whereas the opposite occurred in our study for both Tigriopus and Tisbe. As it was demonstrated [31] that T. japonicus does not present any kind of selectivity between Tetraselmis suecica and Isochrysis galbana, equally consuming them in a mixture, it is probable that underlying digestive mechanisms govern the growth of copepods. Many researchers have carried out studies on the correlation of the reproduction of various species of copepods with the species of phytoplankton used for their diet, both in the natural environment and under laboratory conditions. The results demonstrated a strong correlation between reproductive traits of copepods (fecundity, hatching success, nauplii survival) and algae characteristics such as cell size, morphology, toxicity and biochemical composition [1]. In our study, there were clearly different responses among the two copepod species when fed different microalgae (Figure 7). Two of the microalgae (A. gracilis and D. salina) used as food in the present work came from the Messolonghi lagoon [17], the same natural environment as the copepods, so it is possible to draw conclusions about the suitability of these species to be introduced into intensive copepod farming systems. As Dunaliella together with Rhodomonas presented the same nauplii productivity for both copepods next to Tetraselmis (which was more effective in Tigriopus), Dunaliella and Rhodomonas combined with various salinities were selected for the next experimentation on demographics of the culture.
It must be noticed that this work was not carried out under controlled laboratory conditions, without the mass cultivation of copepods, but instead, with the reproduction of individual females and subsequent study of the development of their nauplii progenies. However, we feel that as a first trial, in order to answer some issues on the response of these copepod species to microalgal feeds at different salinities, the present study can reflect quite well what could happen in bigger culture tanks.
The mortality of the female individuals of the F1 generation after their placement in the individual plates for the study of their reproductive activity at the different salinity values was zero. However, at the extreme salinity value (60 ppt) for both species, the time for the transition from the nauplii stages to the adult stage was much longer than that observed in the other salinities. According to Hong et al. [32], the osmoregulatory mechanisms of some marine organisms during their life cycle are differentiated. Studies related to the effect of salinity on individuals of the species Tigriopus japonicus report that although adult individuals have a great capacity to adapt to changing salinity values, the developmental stage between nauplii and copepods appears to be the most sensitive and presents the highest mortality [33,34], whereas according to Paiva et al. [35], adult crustacean individuals are more tolerant to salinity stress than individuals at the other developmental stages.
In the present work, the average value of the total number of offspring produced at the optimal salinity values for both species (Tigriopus and Tisbe) was significantly lower than the values reported by other researchers for female individuals of the species of the same genera grown under controlled laboratory conditions. The reasons why a reduced production of nauplii was observed are likely to be:
High population density. In the present work, for the reproduction and development of copepods, 15 mL chambers were used, resulting in higher population densities compared to those reported by other researchers who used vessels with a larger capacity. In fact, due to the benthic nature of Tisbe and Tigriopus, almost all of the nauplii, especially the first nauplii stages, were concentrated at the bottom of the chambers (diameter of chanber 4cm), and as a result their density increased even more. According to Mauchline [36], the bodies of most copepods are denser than the seawater they live in, regardless of salinity. For this reason, staying in the benthos requires less energy consumption than staying in the water column. The phenomenon became even more intense with the proceeding of the experiment as a rudimentary substrate, which was created at the bottom of the chambers and attracted the copepods. It has been reported that density can affect the growth, survival and fecundity of predatory copepods [37]. In the study of Punnarak et al. [11], in lower density cultures, higher survival rates were observed for copepods collected from natural environments, whereas according to Fava and Crotti [38], copepod cultures at high densities result in increased excrements because of animal stress and, therefore, their survival, development and reproduction are not favored.
Cannibalism. Cannibalism of young individuals is a strategy particularly widespread for many species of animal organisms in nature [39]. In many crustacean species that inhabit both marine and estuarine systems, intraspecific predation of larval individuals is often one of the main reasons for their mortality, helping to maintain their population sizes at a constant level [40,41]. Cannibalism has been reported for calanoid copepods [42,43] as well as harpacticoid copepods of the species Tigriopus fulvus [44,45], T. californicus [46] and T. brevicornis [45]. According to Gallucci and Ólafsson [45], the phenomenon of cannibalism is observed when we have high population densities even when in the environment there is a sufficiency of other types of food. In the present work, it is possible that cannibalistic behaviors were manifested by the adults to the young nauplii, because of the high population density at the bottom of the chambers, with the result that the measurement of the number of nauplii conducted daily gave a lower number of them than those hatched from the eggs of the egg sacs.
Not renewing the development medium. Copepod reproduction is directly affected by abiotic factors in their environment, such as water temperature, turbidity and pH [22]. In the present work, no renewals of the culture medium (water) was made, since such a practice was not possible due to the high density of copepods. During the development of the experiments, the temperature was controlled, but the turbidity and the pH changed, mainly in the salinity values that were not favorable for the development of copepods. At the same time, during the course of the experiment, a rudimentary substrate was created at the bottom of the chambers from the remains of the excess food, from the exoskeletons and from the excreta of the copepods. Excess food remaining in small-volume copepod cultures can create problems such as: accumulation of dead algal cells in the water and on the walls of the container (with an increased possibility of bacterial growth), adhesion of a mass of dead microalgae to the swimming appendages of the copepods resulting in obstruction of free their movement [47], selective feeding by copepods (avoidance of consumption of dead microalgae cells) [2], increase in water turbidity, etc.
Genetic factors. In harpacticoid copepods, even among populations of the same species originating from different regions, significant discrepancies have been reported regarding optimal salinity conditions and abiotic factors in general. For populations of the species Tisbe holothuriae in the gulf of Marseille, there was reproductive activity at salinity values from 20 ppt to 48 ppt, whereas for populations of the same species originating from the Saronic Gulf at salinities of 20 ppt and 48 ppt, not only was no reproductive activity observed but instead, individuals showed high mortality. Based on the researchers who studied the above behaviors, the salinity tolerance of different populations was determined by the salinity of the environment from which they came [16,48]. According to Edmands [49] in the genus Tigriopus, a wide range of genetic divergence has been found in the populations of its species. The individuals studied in the present work came from the Messolonghi lagoon. Although there was acclimation to laboratory conditions over several generations, the genotype of wild populations determined the reproductive behavior of females and the total number of nauplii hatched from each egg sac at different salinity values, differentiating it from that reported in studies with corresponding salinity values for populations of the same genus originating from different regions.
For both copepod species studied in this work, the mean value of the hatching time of their first egg sac and the mean value of the time between the appearance of the first and the appearance of the second egg sac are significantly longer at the extreme value of salinity (60 ppt) in relation to the values in the other salinities. Growth time is an important feature of zooplankton fitness and is closely related to the time of initiation of production of new individuals and the rate of population growth, with faster growth leading to higher abundances in a shorter time [23]. Thus, fast-growing populations in natural environments have a competitive advantage over slower-growing ones, whereas under controlled conditions of production, fast growth is associated on the one hand with cost reduction and increased production, and on the other hand with the production of more robust individuals due to achieving the ideal growth conditions.
The reproduction of copepods is directly affected by the quantity and quality of the ingested food [22], whereas they show great adaptability to the available types of food present in their environment, changing their physiological processes according to the amount of energy they can obtain through their food. In fact, according to Hasset and Landry [50], the lack of food from the environment of copepods (natural or laboratory) can lead to changes in their feeding behavior and in the activity of their digestive enzymes, increasing their survival over time (even for a period of 3 weeks in starvation conditions [51]). In the present work, in the individuals of the genus Tigriopus, for all the parameters studied, no significant differences were presented for the two different types of food used. On the contrary, for the individuals of T. holothuriae, for all parameters at the most favorable salinity value (32 ppt), the microalga D. salina appeared more favorable as food than in R. salina. In a corresponding study [52] on copepods of the species T. holothuriae that grew in salinity 28–33 ppt, the diet with microalgae of the genera Dunaliella and Rhodomonas varied the composition of their tissues in long-chain HUFAs. Copepods fed Rhodomonas showed a lower concentration of HUFAs than those fed Dunaliella. Miles et al. [53] suggest a mixture of microalgae for the optimal development of copepods of the genus Tisbe and for the production of a large number of offspring, whereas according to Cutts [37,54], food must change between the various developmental stages of copepods as the size of their mouthparts change along with their nutrient requirements.
From the first evidence of the results of this work, it appears that both the development and reproduction of copepods are negatively affected by salinity values that deviate from that found in the natural environment of the populations of the species studied (35–40 ppt). The total production of nauplii fluctuated at lower levels, compared to those reported in similar studies with individuals of same or different species of the same genus. The differences in the ability of copepods to adapt to salinity values, different from those found in their natural environment, are related to genetic factors that must be investigated in order to apply (in the cases of copepod mass production systems) the optimal conditions for growth and reproduction.
The knowledge obtained from the study of the effect of different salinity values on the growth and reproduction of specific copepod species, in addition to being used in the production process of fish farming units, could also be used for ecological practices through the creation of predictive models on the effects of changing environmental conditions, not only at the species level but also at the population level. The local adaptation of populations is the evolution of their characteristics, which have been optimized for specific habitats, so that the genotypes of these populations endow them with better fitness than genotypes of the same species from other habitats [55]. In recent decades, genetic data demonstrate that marine populations of coastal habitats are less homogeneous than previously thought, suggesting that local selective forces may be strong enough to offset ongoing gene flow. Information about adaptive divergence is particularly important for predicting the effects of climate change and improving prediction models, which often assume that all populations of a species have the same range of tolerance to environmental conditions (e.g., salinity, temperature, water chemistry). Such an assumption, however, may underestimate the risk of species extinction from a habitat if individual populations have a smaller tolerance range than the species as a whole [24].

Supplementary Materials

The following are available online at https://www.youtube.com/watch?v=zmwXeoN1wTM, Video S1: Tigriopus copepods—adults, egg hatching-nauplii (accessed on 13 October 2022); https://www.youtube.com/watch?v=mKWNr5dhJGY, Video S2: Copepods—harpacticoids vs. calanoids—Tisbe (accessed on 13 October 2022).

Author Contributions

Conceptualization, G.N.H.; methodology, G.N.H., E.K. and I.F.; investigation, G.N.H., E.K. and I.F.; resources, G.N.H.; data curation, G.N.H., E.K. and I.F.; writing—original draft preparation, G.N.H.; writing—review and editing, G.N.H.; supervision, G.N.H. All authors have read and agreed to the published version of the manuscript.

Funding

This research received no external funding.

Institutional Review Board Statement

The study was conducted according to the guidelines of the Declaration of Helsinki and approved by the Ethics Committee of University of Patras (protocol code 13932—9 July 2022).

Informed Consent Statement

Not applicable.

Acknowledgments

The authors thank Despoina Avramidou and the technical staff at the plankton culture laboratory for collecting and keeping the copepods from the lagoon in stock cultures.

Conflicts of Interest

The authors declare no conflict of interest.

References

  1. Hussain, M.B.; Laabir, M.; Daly Yahia, M.N. A Novel Index Based on Planktonic Copepod Reproductive Traits as a Tool for Marine Ecotoxicology Studies. Sci. Total Environ. 2020, 727, 138621. [Google Scholar] [CrossRef] [PubMed]
  2. Alajmi, F.; Zeng, C. Evaluation of Microalgal Diets for the Intensive Cultivation of the Tropical Calanoid Copepod, Parvocalanus crassirostris. Aquac. Res. 2015, 46, 1025–1038. [Google Scholar] [CrossRef]
  3. Baensch, F.; Tamaru, C.S. Spawning and Development of Larvae and Juveniles of the Rare Blue Mauritius Angelfish, Centropyge debelius (1988), in the Hatchery. J. World Aquac. Soc. 2009, 40, 425–439. [Google Scholar] [CrossRef]
  4. Støttrup, J.G. The Elusive Copepods: Their Production and Suitability in Marine Aquaculture. Aquac. Res. 2000, 31, 703–711. [Google Scholar] [CrossRef]
  5. Sun, B.; Fleeger, J.W. Sustained Mass Culture of Amphiascoides Atopus a Marine Harpacticoid Copepod in a Recirculating System. Aquaculture 1995, 136, 313–321. [Google Scholar] [CrossRef]
  6. Støttrup, J.G.; Norsker, N.H. Production and Use of Copepods in Marine Fish Larviculture. Aquaculture 1997, 155, 231–247. [Google Scholar] [CrossRef]
  7. Camus, T.; Zeng, C. Reproductive Performance, Survival and Development of Nauplii and Copepodites, Sex Ratio and Adult Life Expectancy of the Harpacticoid Copepod, Euterpina Acutifrons, Fed Different Microalgal Diets. Aquac. Res. 2012, 43, 1159–1169. [Google Scholar] [CrossRef]
  8. Delbare, D.; Dhert, P.; Lavens, P. Zooplankton. In Manual on the Production and Use of Live Food for Aquaculture; Lavens, P., Sorgelos, P., Eds.; FAO Fisheries Technical Paper; FAO: Rome, Italy, 1996; Volume 361, pp. 252–282. [Google Scholar]
  9. Nanton, D.A.; Castell, J.D. The Effects of Dietary Fatty Acids on the Fatty Acid Composition of the Harpacticoid Copepod, Tisbe sp., for Use as a Live Food for Marine Fish Larvae. Aquaculture 1998, 163, 251–261. [Google Scholar] [CrossRef]
  10. Werbrouck, E.; Bodé, S.; van Gansbeke, D.; Vanreusel, A.; de Troch, M. Fatty Acid Recovery after Starvation: Insights into the Fatty Acid Conversion Capabilities of a Benthic Copepod (Copepoda, Harpacticoida). Mar. Biol. 2017, 164, 217–226. [Google Scholar] [CrossRef]
  11. Punnarak, P.; Jarayabhand, P.; Piumsomboon, A. Cultivation of Harpacticoid Copepods (Families Harpacticidae and Laophontidae) under Selected Environmental Conditions. Agric. Nat. Resour. 2017, 51, 278–285. [Google Scholar] [CrossRef]
  12. Calliari, D.; Andersen, C.; Thor, P.; Gorokhova, E.; Tiselius, P. Salinity Modulates the Energy Balance and Reproductive Success of Co-Occurring Copepods Acartia tonsa and A. clausi in Different Ways. Mar. Ecol. Prog. Ser. 2006, 312, 177–188. [Google Scholar] [CrossRef]
  13. Chinnery, F.E.; Williams, J.A. The Influence of Temperature and Salinity on Acartia (Copepoda: Calanoida) Nauplii Survival. Mar. Biol. 2004, 145, 733–738. [Google Scholar] [CrossRef]
  14. Devreker, D.; Souissi, S.; Seuront, L. Development and Mortality of the First Naupliar Stages of Eurytemora affinis (Copepoda, Calanoida) under Different Conditions of Salinity and Temperature. J. Exp. Mar. Biol. Ecol. 2004, 303, 31–46. [Google Scholar] [CrossRef]
  15. Ohs, C.L.; Rhyne, A.L.; Grabe, S.W.; DiMaggio, M.A.; Stenn, E. Effects of Salinity on Reproduction and Survival of the Calanoid Copepod Pseudodiaptomus pelagicus. Aquaculture 2010, 307, 219–224. [Google Scholar] [CrossRef] [Green Version]
  16. Miliou, H.; Moraitou-Apostolopoulou, M. Combined Effects of Temperature and Salinity on the Population Dynamics of Tisbe holothuriae HUMES (Copepoda: Harpacticoida). Arch. Hydrobiol. 1991, 121, 431–448. [Google Scholar] [CrossRef]
  17. Hotos, G.N. A Preliminary Survey on the Planktonic Biota in a Hypersaline Pond of Messolonghi Saltworks (W. Greece). Diversity 2021, 13, 270. [Google Scholar] [CrossRef]
  18. Wardlaw, C.A. (Ed.) Practical Statistics for Experimental Biologists; John Wiley & Sons: Plymouth, UK, 1989. [Google Scholar]
  19. Herbert, J. Salinity and Upper Temperature Tolerances of a Rockpool Copepod, Tigriopus Californicus (Baker, 1912); University of Oregon: Eugene, OR, USA, 1976. [Google Scholar]
  20. Frangoulis, C.; Christou, E.D.; Hecq, J.H. Comparison of Marine Copepod Outfluxes: Nature, Rate, Fate and Role in the Carbon and Nitrogen Cycles. Adv. Mar. Biol. 2004, 47, 253–309. [Google Scholar] [CrossRef]
  21. Hawkins, B.L. The Biology of the Marine Copepod, Tigriopus californicus (Baker); Humboldt State University: Arcata, CA, USA, 1962. [Google Scholar]
  22. Turner, J.T. The Importance of Small Planktonic Copepods and Their Roles in Pelagic Marine Food Webs. Zool. Stud. 2004, 42, 255–266. [Google Scholar]
  23. Allan, J.D. Life History Patterns in Zooplankton. Am. Nat. 1976, 110, 165–180. [Google Scholar] [CrossRef]
  24. Sanford, E.; Kelly, M.W. Local Adaptation in Marine Invertebrates. Ann. Rev. Mar. Sci. 2011, 3, 509–535. [Google Scholar] [CrossRef]
  25. Heath, P.; Moore, C. Rearing Dover Sole Larvae on Tisbe and Artemia Diets. Aquac. Int. 1997, 5, 29–39. [Google Scholar] [CrossRef]
  26. Miliou, H. The Effect of Temperature, Salinity and Diet On Final Size of Female Tisbe holothuriae (Copepoda, Harpacticoida). Crustaceana 1996, 69, 742–754. [Google Scholar] [CrossRef] [Green Version]
  27. Souza-Santos, L.P.; Pastor, J.M.O.; Ferreira, N.G.; Costa, W.M.; Araújo-Castro, C.M.; Santos, P.J.P. Developing the Harpacticoid Copepod Tisbe biminiensis Culture: Testing for Salinity Tolerance, Ration Levels, Presence of Sediment and Density Dependent Analyses. Aquac. Res. 2006, 37, 1516–1523. [Google Scholar] [CrossRef]
  28. Belmonte, G.; Moscatello, S.; Batogova, E.A.; Pavlovskaya, T.; Shadrin, N.V.; Litvinchuk, L.F. Fauna of Hypersaline Lakes of the Crimea (Ukraine). Thalass. Salentina 2012, 34, 11–24. [Google Scholar]
  29. El-Tohamy, W.; Qin, J.; Abdel-Aziz, N.; El-Ghobashy, A.; Dorgham, M. Suitable Algal Species and Density for the Culture of Copepod Gladioferens imparipes as a Potential Live Food for Fish Larvae. Aquac. Int. 2021, 29, 105–125. [Google Scholar] [CrossRef]
  30. Pan, Y.-J.; Souissi, S.; Souissi, A.; Wu, C.-H.; Cheng, S.-H.; Hwang, J.-S. Dietary Effects on Egg Production, Egg-Hatching Rate and Female Life Span of the Tropical Calanoid Copepod Acartia bilobata. Aquac. Res. 2014, 45, 1659–1671. [Google Scholar] [CrossRef]
  31. Lee, M.-C.; Choi, H.; Park, J.C.; Yoon, D.-S.; Lee, Y.; Hagiwara, A.; Park, H.G.; Shin, K.-H.; Lee, J.-S. A Comparative Study of Food Selectivity of the Benthic Copepod Tigriopus japonicus and the Pelagic Copepod Paracyclopina nana: A Genome-Wide Identification of Fatty Acid Conversion Genes and Nitrogen Isotope Investigation. Aquaculture 2020, 521, 734930. [Google Scholar] [CrossRef]
  32. Hong, H.; Wang, J.; Shi, D. Effects of Salinity on the Chronic Toxicity of 4-Methylbenzylidene Camphor (4-MBC) in the Marine Copepod Tigriopus japonicus. Aquat. Toxicol. 2021, 232, 105742. [Google Scholar] [CrossRef]
  33. Raisuddin, S.; Kwok, K.W.H.; Leung, K.M.Y.; Schlenk, D.; Lee, J.-S. The Copepod Tigriopus: A Promising Marine Model Organism for Ecotoxicology and Environmental Genomics. Aquat. Toxicol. 2007, 83, 161–173. [Google Scholar] [CrossRef]
  34. Kwok, K.W.H.; Leung, K.M.Y. Toxicity of Antifouling Biocides to the Intertidal Harpacticoid Copepod Tigriopus japonicus (Crustacea, Copepoda): Effects of Temperature and Salinity. Mar. Pollut. Bull. 2005, 51, 830–837. [Google Scholar] [CrossRef]
  35. Paiva, F.; Pauli, N.; Briski, E. Are Juveniles as Tolerant to Salinity Stress as Adults? A Case Study of Northern European, Ponto-Caspian and North American Species. Divers. Distrib. 2020, 26, 1627–1641. [Google Scholar] [CrossRef]
  36. Mauchline, J. The Biology of Calanoid Copepods. In Advances in Marine Biology; Mauchline, J., Ed.; Academic Press: Cambridge, MA, USA, 1998; Volume 33, pp. 71–81. [Google Scholar]
  37. Cutts, C.J. Culture of Harpacticoid Copepods: Potential as Live Feed for Rearing Marine Fish. Adv. Mar. Biol. 2003, 44, 295–316. [Google Scholar] [CrossRef] [PubMed]
  38. Fava, G.; Crotti, E. Effect of Crowding on Nauplii Production during Mating Time in Tisbe clodiensis and T. holothuriae (Copepoda, Harpacticoida). Helgoländer Wiss. Meeresunters. 1979, 32, 466–475. [Google Scholar] [CrossRef] [Green Version]
  39. Polis, G.A. The Evolution and Dynamics of Intraspecific Predation. Annu. Rev. Ecol. Syst. 1981, 12, 225–251. [Google Scholar] [CrossRef]
  40. Luppi, T.A.; Spivak, E.D.; Anger, K. Experimental Studies on Predation and Cannibalism of the Settlers of Chasmagnathus granulate and Cyrtograpsus angulatus (Brachyura: Grapsidae). J. Exp. Mar. Biol. Ecol. 2001, 265, 29–48. [Google Scholar] [CrossRef] [Green Version]
  41. Moksnes, P.-O. The Relative Importance of Habitat-Specific Settlement, Predation and Juvenile Dispersal for Distribution and Abundance of Young Juvenile Shore Crabs Carcinus maenas L. J. Exp. Mar. Biol. Ecol. 2002, 271, 41–73. [Google Scholar] [CrossRef]
  42. Landry, M.R. Switching between Herbivory and Carnivory by the Planktonic Marine Copepod Calanus pacificus. Mar. Biol. 1981, 65, 77–82. [Google Scholar] [CrossRef]
  43. Conley, W.J.; Turner, J.T. Omnivory by the Coastal Marine Copepods Centropages hamatus and Labidocera aestiva. Mar. Ecol. Prog. Ser. 1985, 21, 113–120. [Google Scholar] [CrossRef]
  44. Lazzaretto, I.; Salvato, B. Cannibalistic Behaviour in the Harpacticoid Copepod Tigriopus fulvus. Mar. Biol. 1992, 113, 579–582. [Google Scholar] [CrossRef]
  45. Gallucci, F.; Ólafsson, E. Cannibalistic Behaviour of Rock-Pool Copepods: An Experimental Approach for Space, Food and Kinship. J. Exp. Mar. Biol. Ecol. 2007, 342, 325–331. [Google Scholar] [CrossRef]
  46. Lewis, A.G.; Chatters, L.; Raudsepp, M. Feeding Structures and Their Functions in Adult and Preadult Tigriopus californicus (Copepoda: Harpacticoida). J. Mar. Biol. Assoc. United Kingd. 1998, 78, 451–466. [Google Scholar] [CrossRef]
  47. Puello-Cruz, A.C.; Mezo-Villalobos, S.; González-Rodríguez, B.; Voltolina, D. Culture of the Calanoid Copepod Pseudodiaptomus euryhalinus (Johnson 1939) with Different Microalgal Diets. Aquaculture 2009, 290, 317–319. [Google Scholar] [CrossRef]
  48. Gaudy, R.; Guerin, J.P.; Moraitou-Apostolopoulou, M. Effect of Temperature and Salinity on the Population Dynamics of Tisbe holothuriae Humes (Copepoda: Harpacticoida) Fed on Two Different Diets. J. Exp. Mar. Biol. Ecol. 1982, 57, 257–271. [Google Scholar] [CrossRef]
  49. Edmands, S. Phylogeography of the Intertidal Copepod Tigriopus californicus Reveals Substantially Reduced Population Differentiation at Northern Latitudes. Mol. Ecol. 2001, 10, 1743–1750. [Google Scholar] [CrossRef] [PubMed]
  50. Hassett, R.P.; Landry, M.R. Effects of Diet and Starvation on Digestive Enzyme Activity and Feeding Behavior of the Marine Copepod Calanus pacificus. J. Plankton Res. 1990, 12, 991–1010. [Google Scholar] [CrossRef]
  51. Tsuda, A. Starvation Tolerance of a Planktonic Marine Copepod Pseudocalanus newmani Frost. J. Exp. Mar. Biol. Ecol. 1994, 181, 81–89. [Google Scholar] [CrossRef]
  52. Norsker, N.-H.; Støttrup, J.G. The Importance of Dietary HUFAs for Fecundity and HUFA Content in the Harpacticoid, Tisbe holothuriae Humes. Aquaculture 1994, 125, 155–166. [Google Scholar] [CrossRef]
  53. Miles, D.; Auchterlonie, N.; Cutts, C.; de Quero, C.M. Rearing of the Harpacticoid Copepod Tisbe holothuriae and Its Application for the Hatchery Production of Atlantic Halibut Hippoglossus hippoglossus; Link Project FIN 23; SEAFISH Development Aquaculture: Edinburgh, UK, 2001. [Google Scholar]
  54. de Troch, M.; Chepurnov, V.; Gheerardyn, H.; Vanreusel, A.; Ólafsson, E. Is Diatom Size Selection by Harpacticoid Copepods Related to Grazer Body Size? J. Exp. Mar. Biol. Ecol. 2006, 332, 1–11. [Google Scholar] [CrossRef] [Green Version]
  55. Kawecki, T.J.; Ebert, D. Conceptual Issues in Local Adaptation. Ecol. Lett. 2004, 7, 1225–1241. [Google Scholar] [CrossRef]
Figure 1. (A) Tigriopus sp. female with egg sac, (B) female without egg sac, (C) Female and male, (D) Grasping of a young female by a fully grown male; arrow indicates the characteristic lumps on the first pair of antennas of the male.
Jmse 10 01663 g001
Figure 2. (A) Male and female of Tisbe holothuriae with the female carrying a big egg sac, (B) Male and female in juxtaposition; arrow indicates the characteristic lumps on the first pair of antennas of the male, (C) Hatching of Tigriopus sp. egg mass, (D) Newly hatched nauplius of Tigriopus sp., (E) Newly hatched nauplius of T. holothuriae.
Jmse 10 01663 g002
Figure 3. Schematization of the salinity tolerance experiment (A) and the feeding experiment (B) for both copepod species.
Jmse 10 01663 g003
Figure 4. Schematization of the salinity-food demographics experiment for both copepod species.
Jmse 10 01663 g004
Figure 5. Mortality (%) and probits of mortality vs. salinity of Tigriopus sp. in the LC50 experiment. Also depicted are the regression equations and R2 values.
Jmse 10 01663 g005
Figure 6. Mortality (%) and probits of mortality vs. salinity of T. holothuriae in the LC50 experiment. Also depicted are the regression equations and R2 values.
Jmse 10 01663 g006
Figure 7. Mean total number of offspring (nauplii) produced by a single female of Tigriopus sp. and T. holothuriae fed different microalgae; TIGR = Tigriopus, TISB = Tisbe, TETR = Tetraselmis, ISO = Isochrysis, RHOD = Rhodomonas, AST = Asteromonas, DUN = Dunaliella. Error bars stand for Standard Error (SE).
Jmse 10 01663 g007
Figure 8. (A,B) Total number of nauplii produced by a female of Tigriopus and Tisbe, respectively, across treatments of different salinity types of algal feed. (C,D) number of nauplii produced from the first egg sac of Tigriopus and Tisbe, respectively, across treatments of different salinity types of algal feed. Values are means ± SE. RHOD = Rhodomonas, DUN = Dunaliella.
Jmse 10 01663 g008
Figure 9. (A,B) total number of egg sacs produced during the lifetime of a female of Tigriopus and Tisbe, respectively, across treatments of different salinity types of algal feed. (C,D) days required for the complete hatching of the eggs of the first egg sac of Tigriopus and Tisbe, respectively, across treatments of different salinity types of algal feed. Values are means ± SE. RHOD = Rhodomonas, DUN = Dunaliella.
Jmse 10 01663 g009
Figure 10. (A,B) days required for appearance of the 2nd egg sac since the appearance of the 1st egg sac in Tigriopus and Tisbe, respectively, across treatments of different salinity types of algal feed. (C,D) percentage of females in Tigriopus and Tisbe, respectively, across treatments of different salinity types of algal feed. Values are means ± SE. RHOD = Rhodomonas, DUN = Dunaliella.
Jmse 10 01663 g010
Table 1. Records on probit analysis of the influence of salinity on mortality of T. holothuriae and Tigriopus sp.
Salinities
(ppt)
Mortality
Tisbe
Mortality
Tigriopus
% Mortality
Tisbe
% Mortality
Tigriopus
Observed Probit
Tisbe
Observed Probit
Tigriopus
Expected Probit
Tisbe
Expected Probit
Tigriopus
Weight
Tisbe
Weight
Tigriopus
0(25/25)(25/25)100100000000
2(23/25)(4/25)92166.446.343.880.3360.405
4(22/25)(3/25)88126.173.826.153.820.370.37
6(22/25)(3/25)88126.173.825.953.770.4390.37
8(18/25)(2/25)7285.583.595.733.70.5320.336
10(15/25)(2/25)6085.253.595.533.650.5810.336
20(9/25)(1/25)3644.643.244.523.380.5810.237
300(1/25)0403.2403.1200.154
400000000000
500000000000
60(1/25)0403.2402.8300.0920
70(2/25)(1/25)843.593.243.483.10.2690.154
80(4/25)(2/25)16843.594.133.330.4710.208
90(5/25)(3/25)20124.153.824.783.640.6270.302
100(9/25)(3/25)36124.643.825.433.950.6010.439
105(22/25)(4/25)88166.1745.764.120.5030.471
110(23/25)(4/25)92166.446.084.280.4010.532
115(24/25)(5/25)96206.754.156.414.430.3020.558
120(25/25)(5/25)1002004.1504.5900.601
125 (10/25) 40 4.74 4.75 0.627
130 (10/25) 40 4.74 4.9 0.634
135 (13/25) 52 5.05 5.06 0.634
140 (15/25) 60 5.25 5.22 0.627
145 (22/25) 88 6.17 5.38 0.601
150 (25/25) 100 0 0 0
SUM Weight Tisbe6.105
MEAN Weight Tisbe0.436
SUM Weight Tigriopus8.596
MEAN Weight Tigriopus0.429
Publisher’s Note: MDPI stays neutral with regard to jurisdictional claims in published maps and institutional affiliations.