1. Introduction
The German Baltic Sea coast stretches across 2582 km along the two German federal states, Mecklenburg-Vorpommern (MV) and Schleswig-Holstein (SH). A major part of the coast belongs to inner coastal waters or lagoons. Approximately 106 km of the coastline of MV is protected by coastal protection dunes [
1], particularly in exposed areas that are extremely prone to storm surges. In SH, natural dunes are often situated in front of coastal dikes [
2].
Human-induced climate change and the resulting global warming have been scientifically proven [
3]. The German Baltic coast is and will further be affected by the effects of human-induced climate change and the resulting global warming [
3,
4], while not all the consequences are always obvious. A variety of processes and changes are quite subtle. The main challenges for coastal protection are the sea level rise and the increase of storm surges [
4]. The sea level in the southwestern Baltic Sea had already risen by 1.0–1.7 mm/y between 1900 and 2015. The global trend shows a rise of 3.6 mm/y between 2006 and 2015. Depending on the scenario, this value may drastically rise in the future.
Due to rising water levels and the increase in surge events, coastal protection structures will be stressed more frequently. The negative sediment balance of the German Baltic coast will probably intensify [
4]. Maintenance measures for coastal protection, such as the nourishment of beaches and dunes, will be needed more frequently in the future. This, however, is in contradiction with the reduction of available marine resources needed.
During storm surges, waves erode sediment from the dune front and transport it seaward. As a result, the dune front steepens. As soon as the angle of inclination of the dune front exceeds a critical value (angle of failure), the dune fails, and separate dune layers slide off. As the waves scour the dune toe, segments of sediment slide and flow away. Sediment from the eroded dune is deposited on the shore, translocated to the foreshore and then taken up by waves and transported seaward to finally widen the foreshore. This circumstance temporarily reduces further erosion of the dune. As the erosion of the dune continues, the base of the dune moves away from the coastline, and the location of the dune base rises. As a result, fewer waves reach the dune, and the erosion rates decrease. This process continues until an equilibrium profile is established [
5,
6,
7].
The dune erosion process mainly depends on the occurring storm surge water level and wave loading. In addition, erosion is influenced by the distance of the dune from the shoreline, the beach slope, the height and slope of the dune, the wave angle, and the grain sizes of the sediment. The significant failure mechanisms for dunes are (1) erosion of the seaward slope by waves, (2) erosion of the landward slope by overflow, and (3) erosion of the land side slope by wave overtopping [
8,
9,
10] with (1) being the main failure mechanism.
The first documented storm surge-induced dune erosions and breaches on the North and Baltic Seas were mentioned in earlier centuries, e.g., by Arends [
11] or Hagen [
12]. Since then, a large number of experiments have been performed, observations have been evaluated, and various models have been developed over time to better understand the processes of dune erosion. Experiments on dune erosion with various scientific research priorities were performed, among others, by Vellinga [
13], Fisher et al. [
14], Dette [
15], van Gent et al. [
16], van Rijn [
17], and Tomasicchio et al. [
18]. Breach growth has been investigated by Visser [
9], Tuan [
10] and Kraak et al. [
19]. Studies of storm surge-induced hinterland flooding during dike and dune failure in the Baltic Sea area were conducted in the HoRisk project [
20]. The breach widths were assumed on the basis of historical records. Further studies on hinterland flooding were conducted by Muir Wood and Bateman [
21] and Apel et al. [
22].
The numerical models can be divided into (semi-)empirical and process-based models. The first empirical models for dune erosion, based on the equilibrium profile approach, were developed by Bruun [
23], Edelman [
24], van de Graaff [
25] and Vellinga [
13]. Vellinga [
13] investigated the erosion behaviour of coastal protection dunes in 2D and 3D model experiments in a 300 m wave channel (Delta Flume, Netherlands) with wave heights of up to 2 m. The focus of this research was set on the reproducibility of beach and dune erosion in small-scale models and the evolution of sediment concentrations during a storm surge. Van Gent et al. [
16] investigated the influence of wave periods on dune erosion in a wave flume and observed an increase in erosion due to longer wave periods.
The mentioned approaches were later improved and included in the DUROS programme packages (Dune Erosion Model) by van Gent et al. [
16], and den Heijer et al. [
26] applied DUROS to verify the safety of the dunes. The SBEACH model [
27,
28] is also based on the equilibrium profile theory, extended by a term to take into account the inclination of the local foreshore. The federal state of Mecklenburg-Vorpommern uses the NEWDUNE model by Newe [
29] for the design of coastal protection dunes. NEWDUNE has been developed from Kriebel’s approach [
30] and estimates the erosion quantities of a 1D dune profile during a storm surge.
In 2009, the 2DH process-based model XBeach was developed by Roelvink et al. [
31]. XBeach contains approaches for describing the most important hydro- and morphodynamic processes relevant to dune erosion in the trans coastal and longitudinal directions across the Sallenger regimes of swash, collision, overwash, and inundation [
32]. Miani et al. [
33] investigated the wave-driven breach formation process in the Adriatic Sea on a small spatial and temporal scale using XBeach. The focus was on the investigation of the shore-parallel evolution of the breach triggered by wave run-up of the seaward slope. Berard et al. [
34] studied the performance of XBeach based on a laboratory sand dune. After a first adjustment, a better agreement with the laboratory observations was observed during the overwash regime than during the collision regime. However, increasing the grid resolution in the dune area in the field experiment resulted in a higher agreement with the observations during the collision regime.
In spite of the worldwide research, it is yet unclear how a coastal protection dune at the Baltic Sea will actually breach (regarding breach width and depth), how areas behind the dune will fill through a breach and empty after drawdown and how the design swell for hinterland dikes is influenced by the overwashed dune system. If the coastal protection dune is the sole protection element, the stability of the remaining section after a major erosion event is unclear, as is the actual load on additional coastal protection constructions in combined dune–dike/wall systems by water level, waves and currents through a potentially developed breach.
In the German cooperation research project PADO (Processes and Implications of Dune Breaching at the German Baltic Sea Coast; lead partner: dep. Geotechnics and Coastal Engineering, University of Rostock, Germany), a large-scale research dune was investigated in a field experiment to clarify its dynamic processes and to calibrate numerical models [
35,
36]. For the measurements, a new 3D measurement technology was applied [
37] to determine the complete surface of the research dune in the precision range of millimetres (<20 mm) based on a combination of UAV-photogrammetry (periodically determined) and terrestrial laser scanning (event-based). The derived field data was used to calibrate numerical models, which were applied to particular study areas on real coastal protection dunes in Mecklenburg-Vorpommern. As a result of the PADO project, the influence of nearshore bathymetry changes on the numerical simulation of dune erosion has already been discussed [
38]. Detailed studies on the spatial and temporal evaluation of storm-induced erosion simulations based on a two-dimensional field case, including an artificial unvegetated research dune, were also published from the PADO project [
39].
In this paper, the large-scale field research dune and the derived measurement and simulated data are presented and transferred to and compared with the study area “Ahrenshoop”. In addition, the transfer of results to a recent dune breach incident in 2019 in the Hütelmoor reserve close to Rostock is discussed.
2. The Study Areas
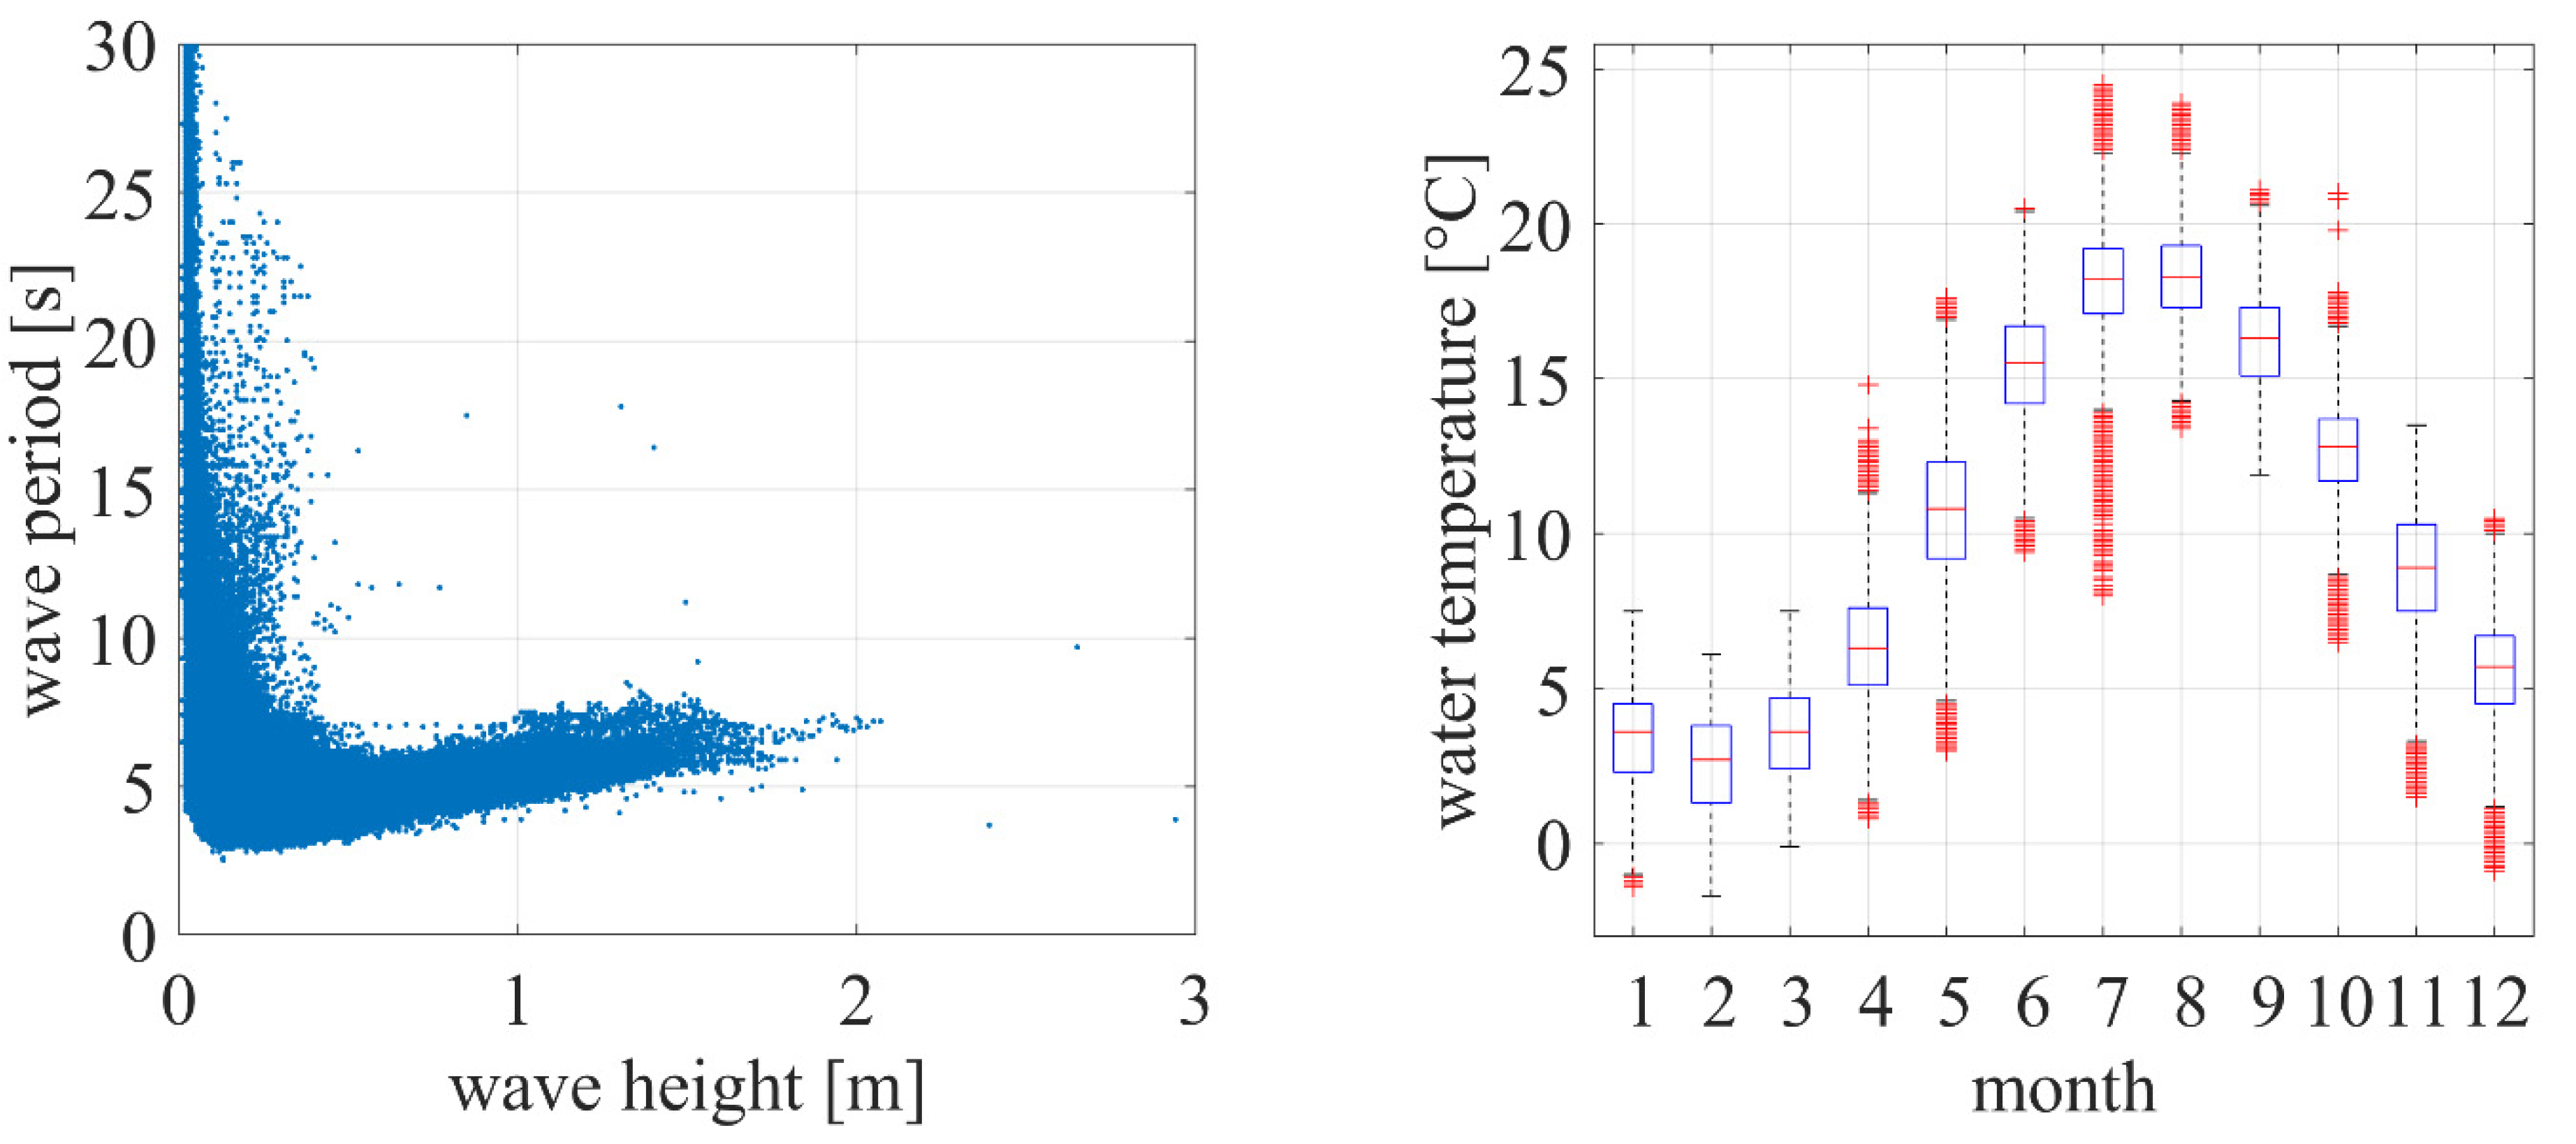
The Baltic Sea is a shallow inland sea with an average depth of 55 m. It is connected to the North Sea by the Kattegat between Denmark and Sweden. The salinity is a result of incoming salt water from the North Sea and fresh water from the rivers and rainwater. It decreases in an easterly direction. On the German Baltic Sea coasts, it is about 1–1.2%. The influence of the tide in the southwestern Baltic Sea is estimated at about 10–15 cm. Water temperatures range between 3 and 5 °C in the winter months. The water in the south-western Baltic Sea reaches its highest values from June to September, with temperatures between 15 and 19 °C (
Figure 1 right). Locally, temperatures can also reach over 20 °C.
The German Baltic Sea coast lies in the temperate climate zone and has characteristics of a typical coastal climate. With onshore winds, the study areas are influenced by maritime conditions, and generally, temperatures in spring and summer are below inland levels during the day, while a sea breeze has a rather mild influence in autumn and winter. Offshore winds, on the other hand, provide characteristics of a continental climate. In summer, tropical temperatures of over 30 °C can be reached on the beach, just as in winter, with wind from the land, icy cold with deep sub-zero temperatures is possible. The small distance to the sea ensures comparatively small fluctuations in the average daily and annual air temperature [
40].
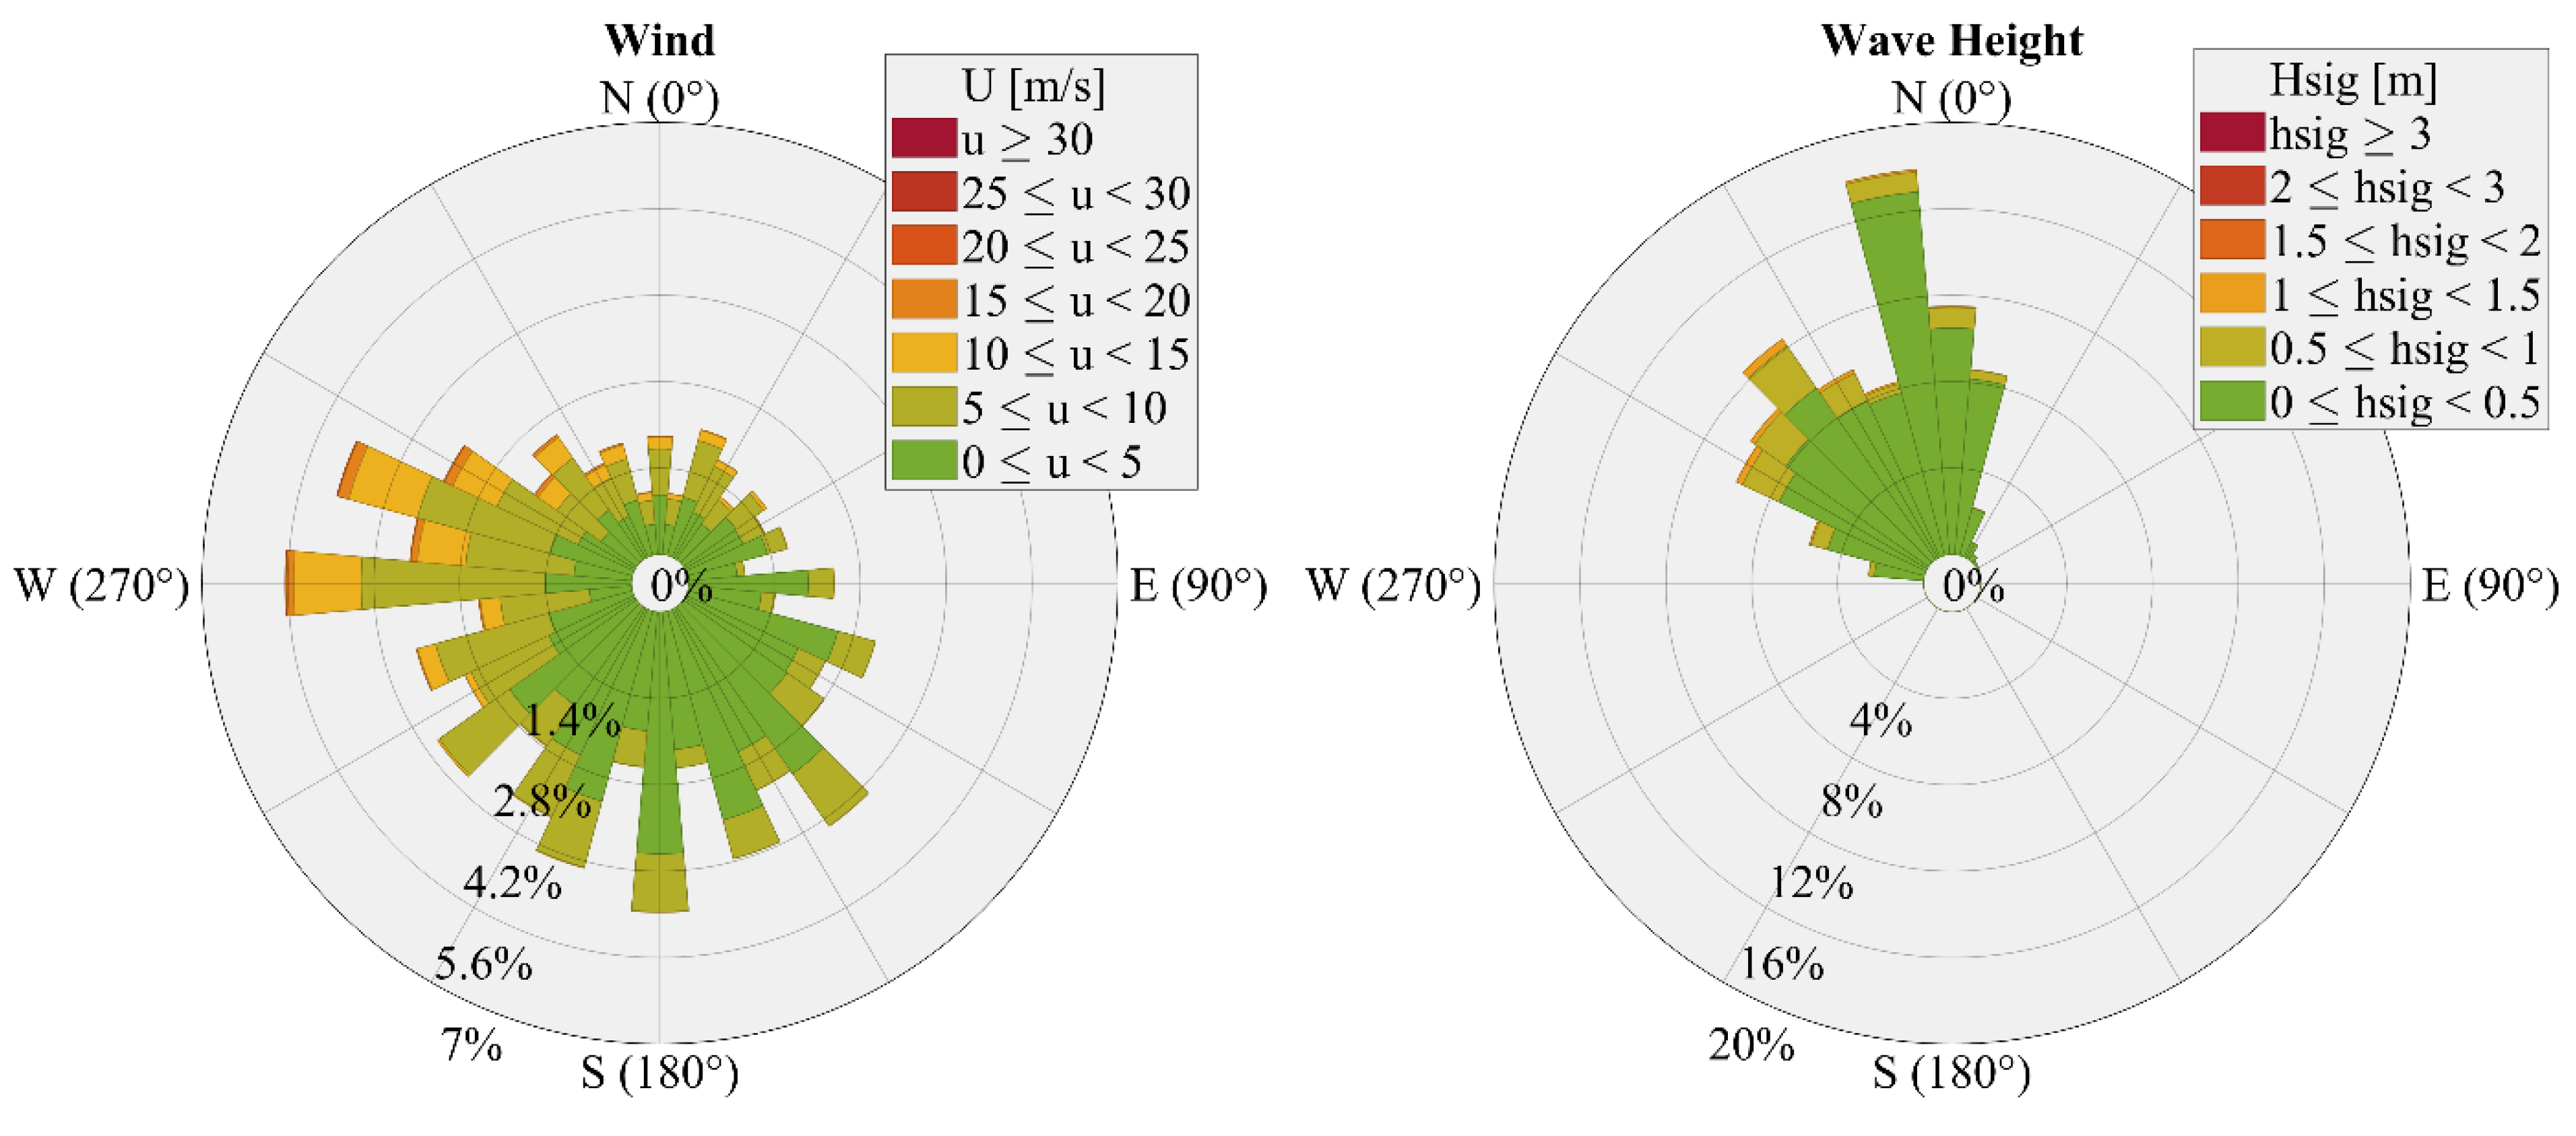
The direction-dependent distribution of wind speeds at the study area Warnemünde, based on data from the German Weather Service for the years 1954 to 2020 [
41], can be seen in
Figure 2 (left). No data is collected at the study areas Hütelmoor and Ahrenshoop. Due to the spatial proximity, it can be assumed that similar wind conditions prevail there. It is visible that the highest wind speeds were measured from west-northwest directions. With easterly currents, the study areas lie in the lee of the Darß peninsula and the island of Rügen. Therefore, the wind speeds and wind-generated waves are lower in comparison.
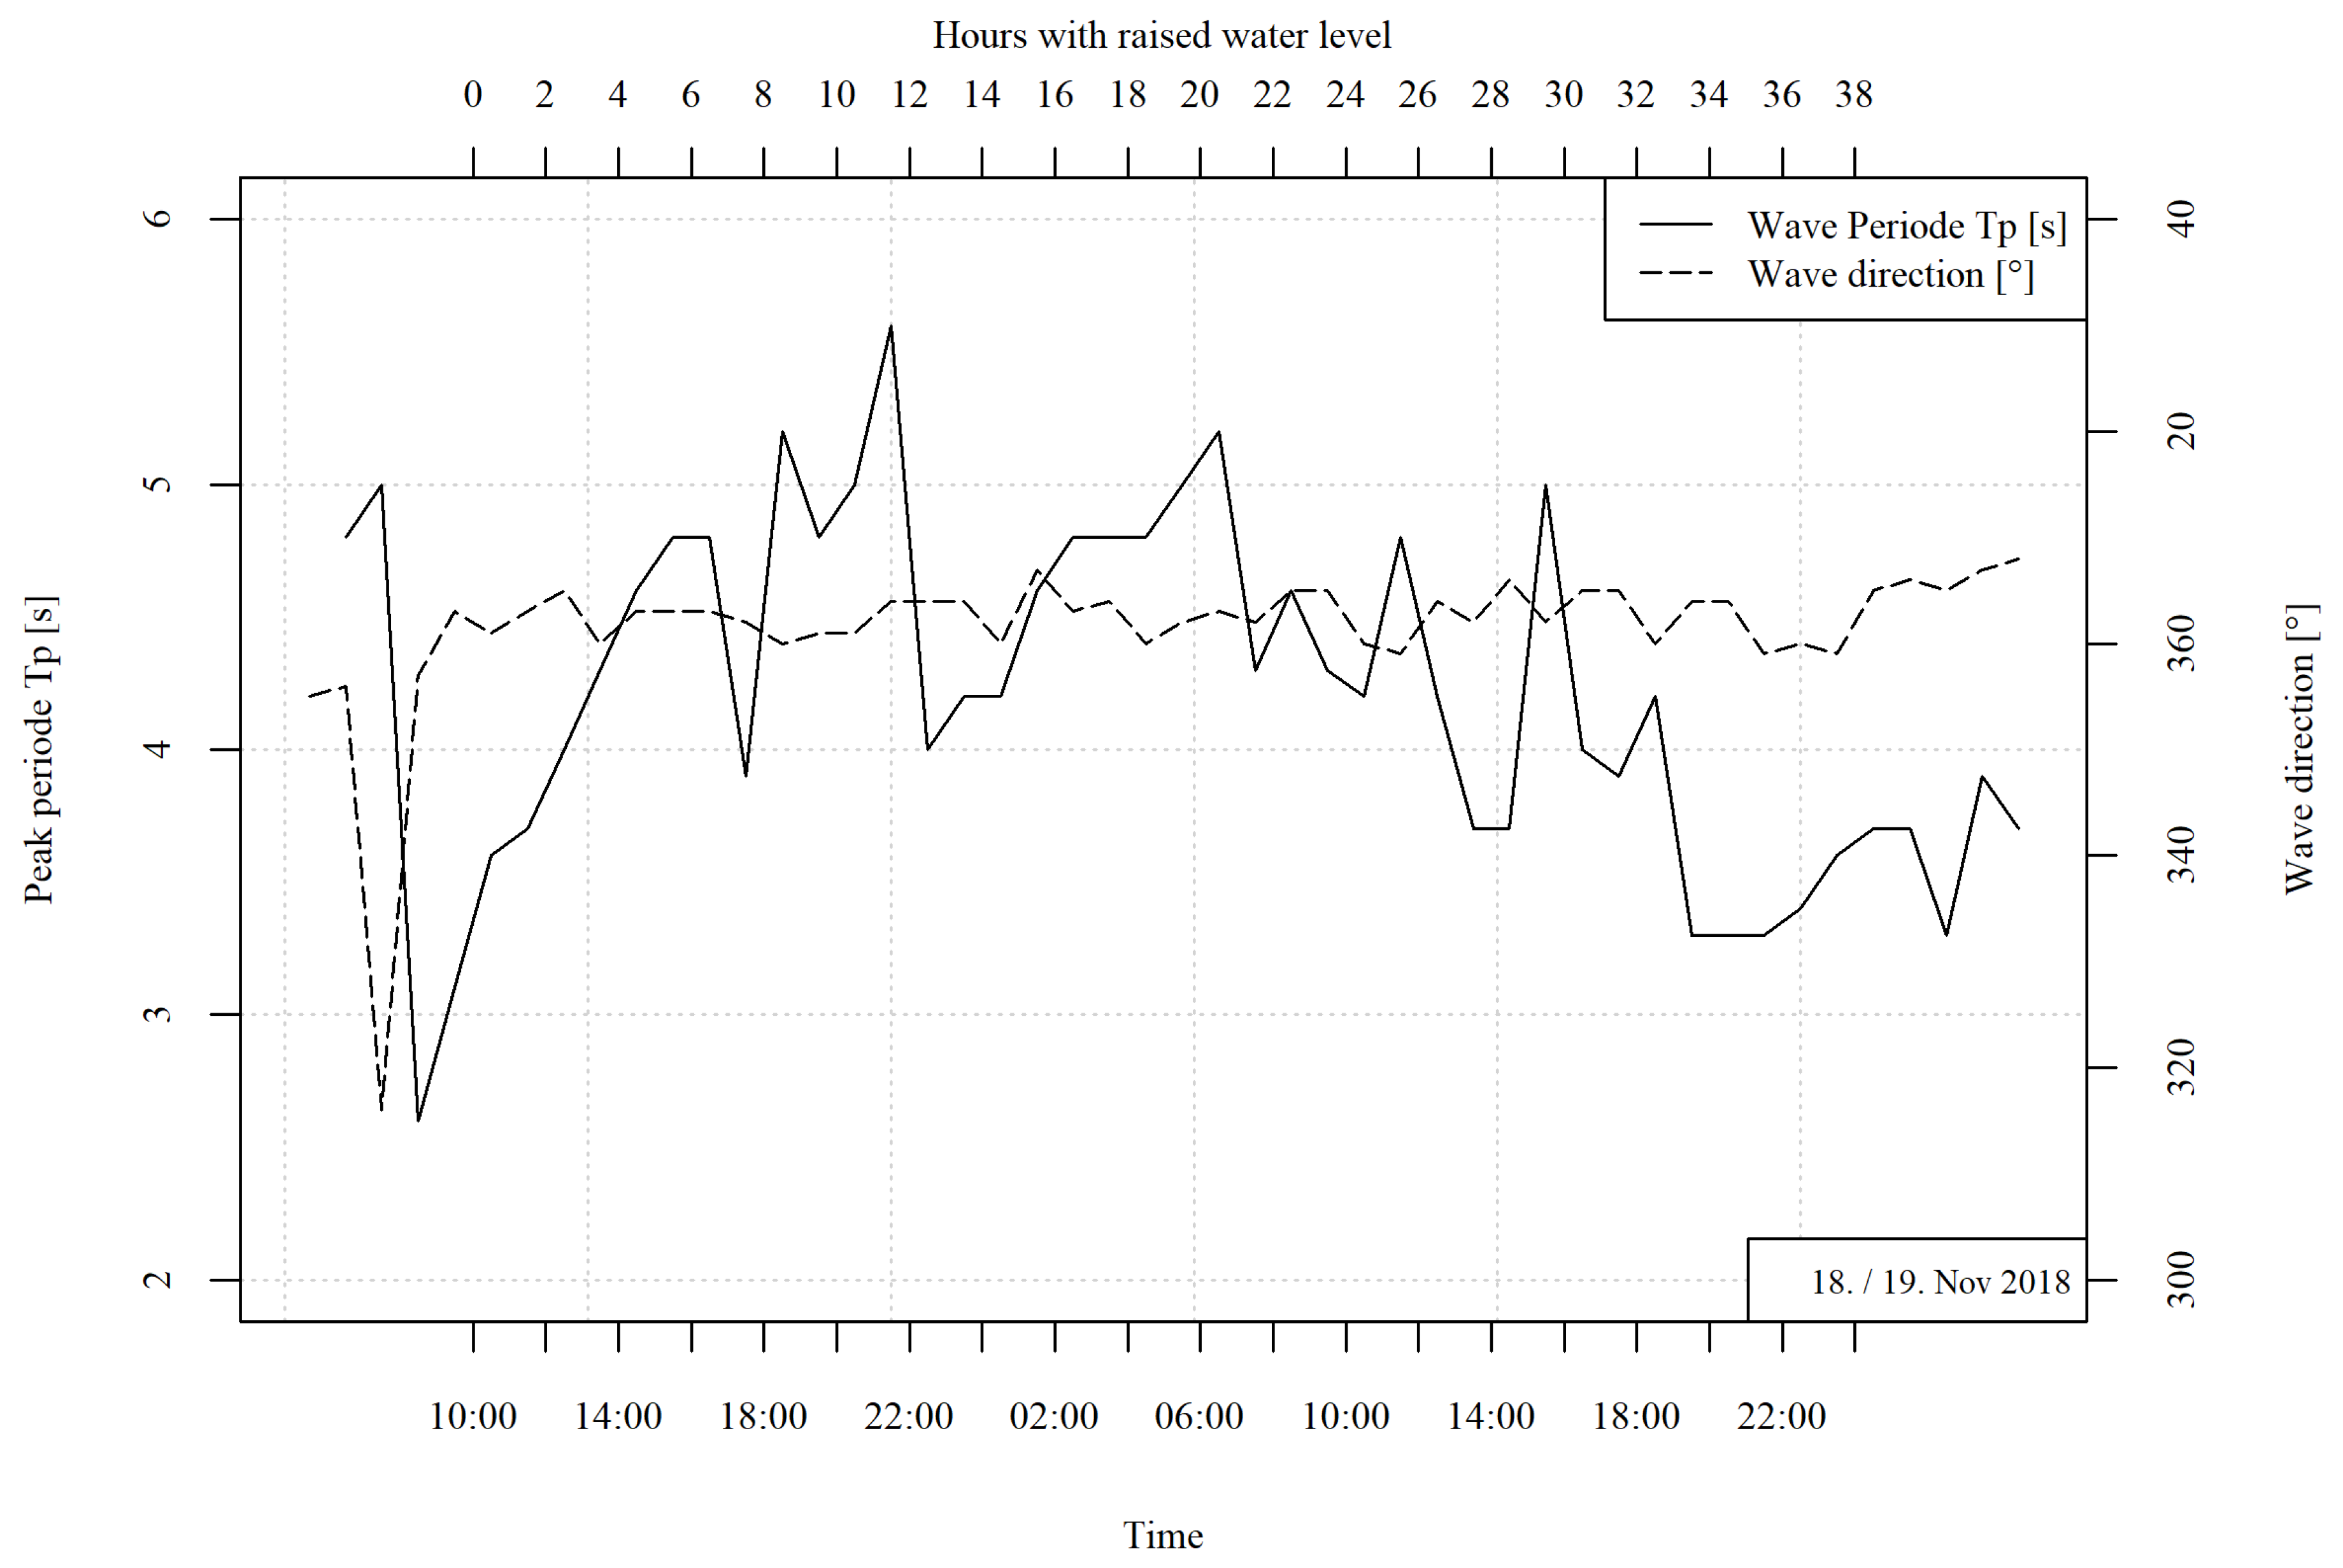
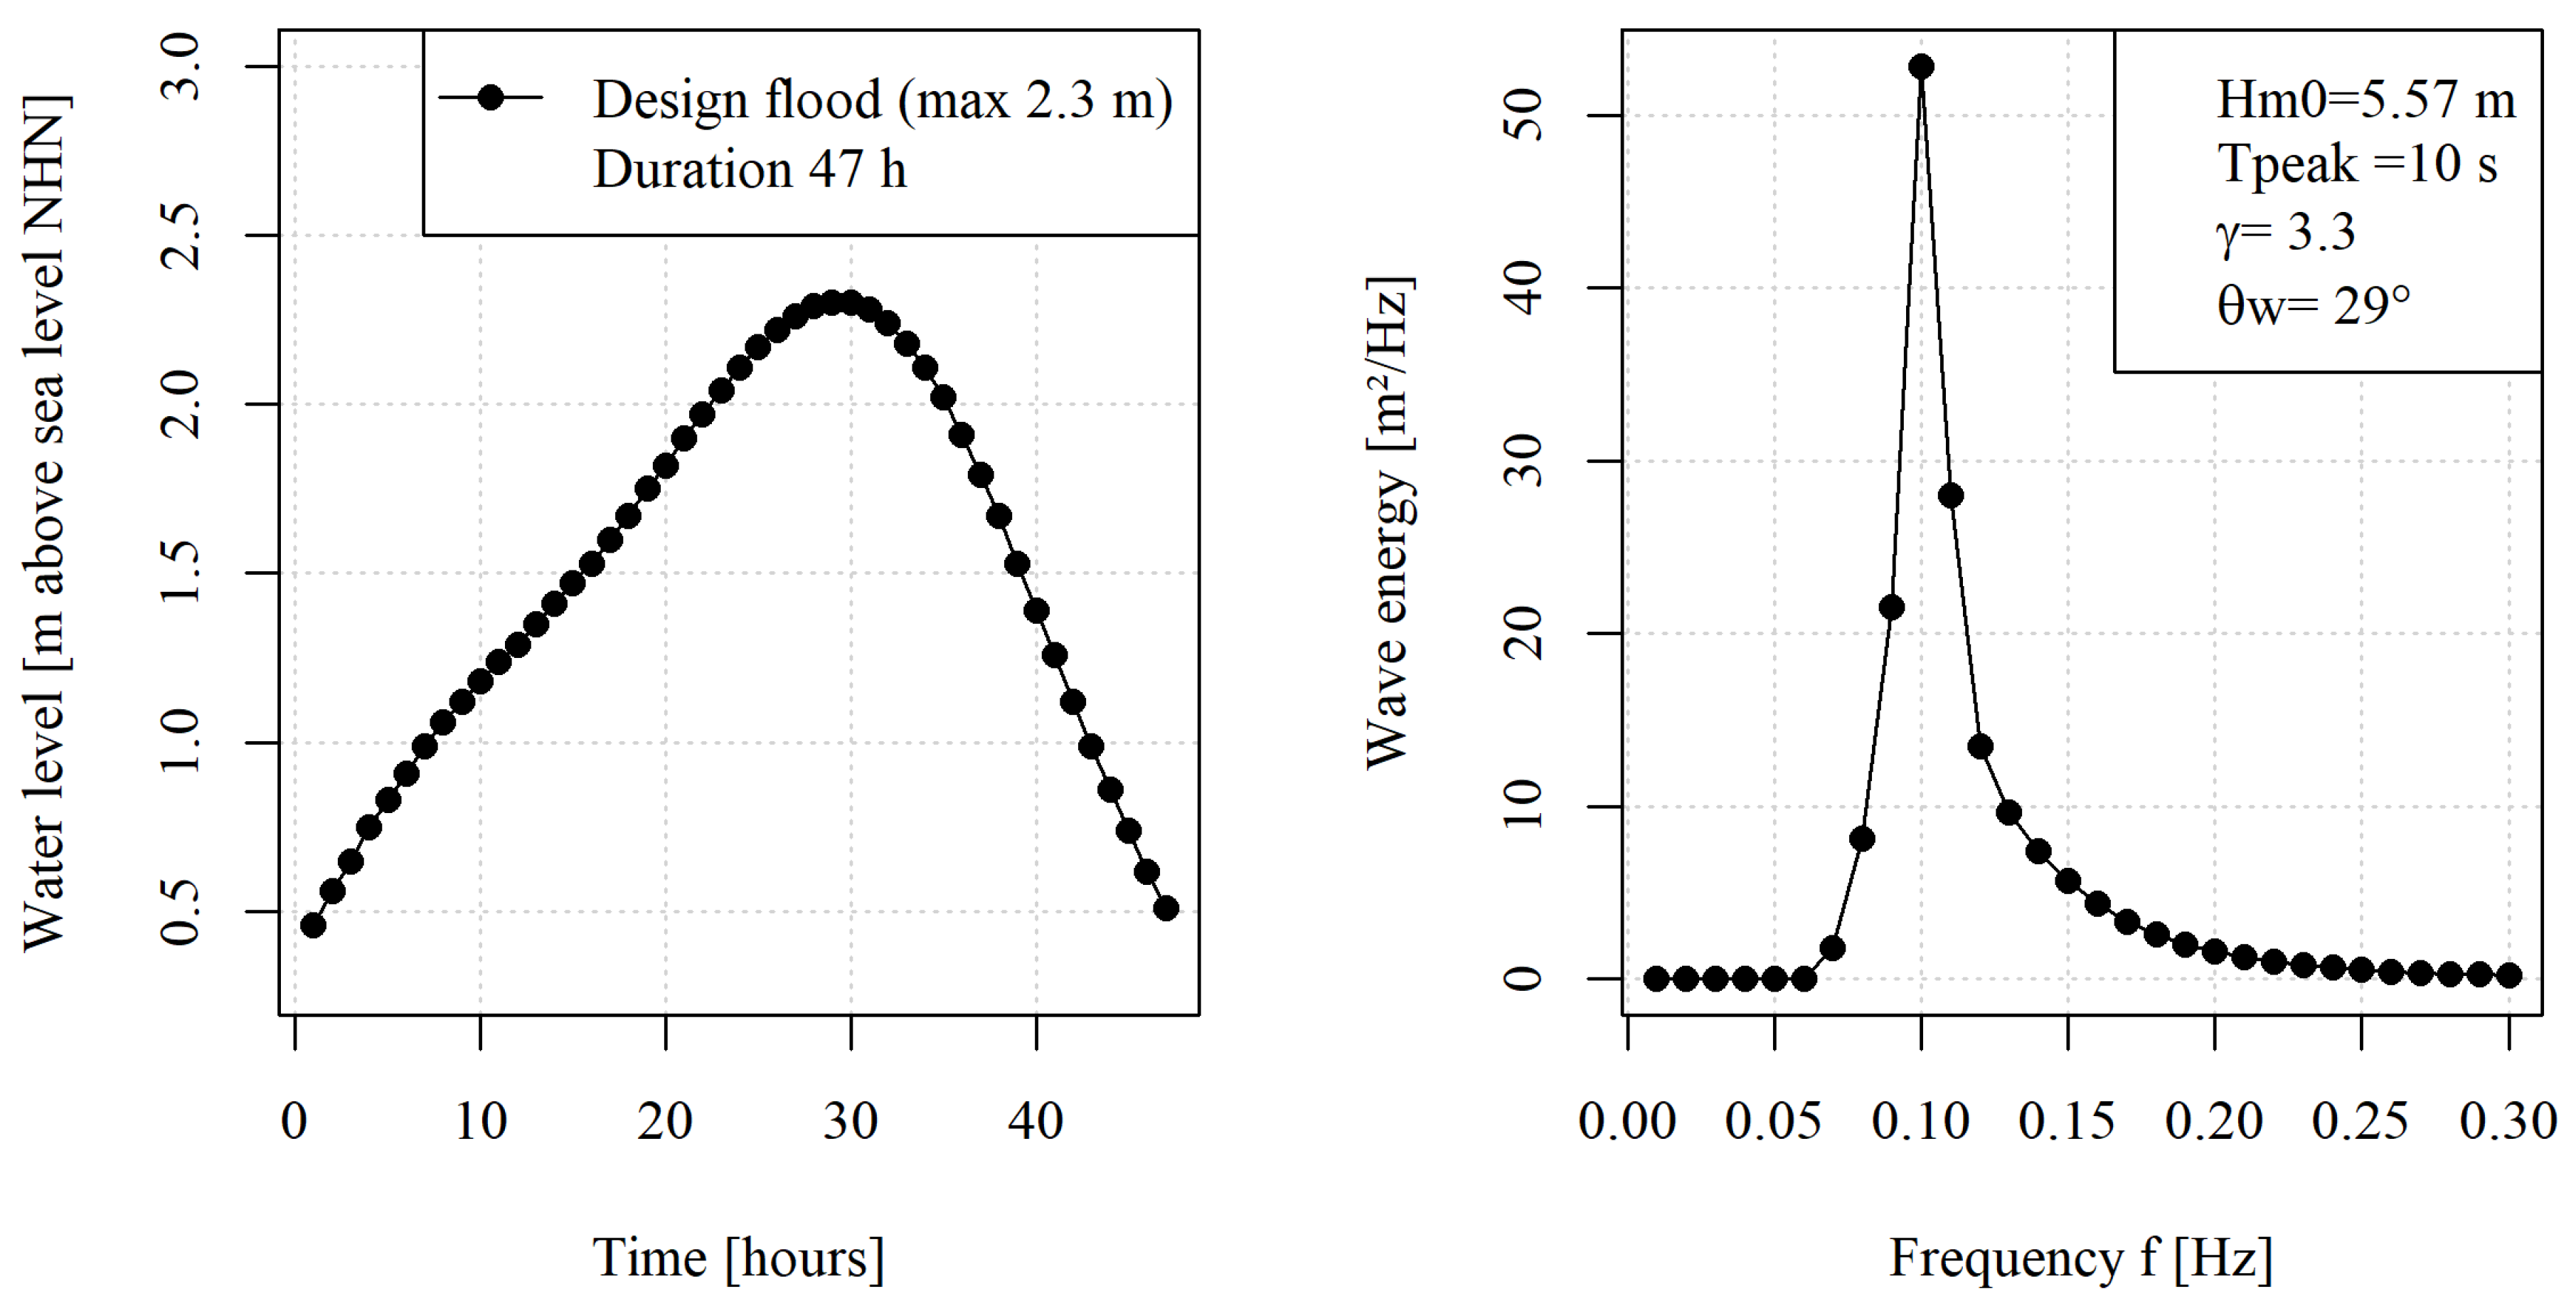
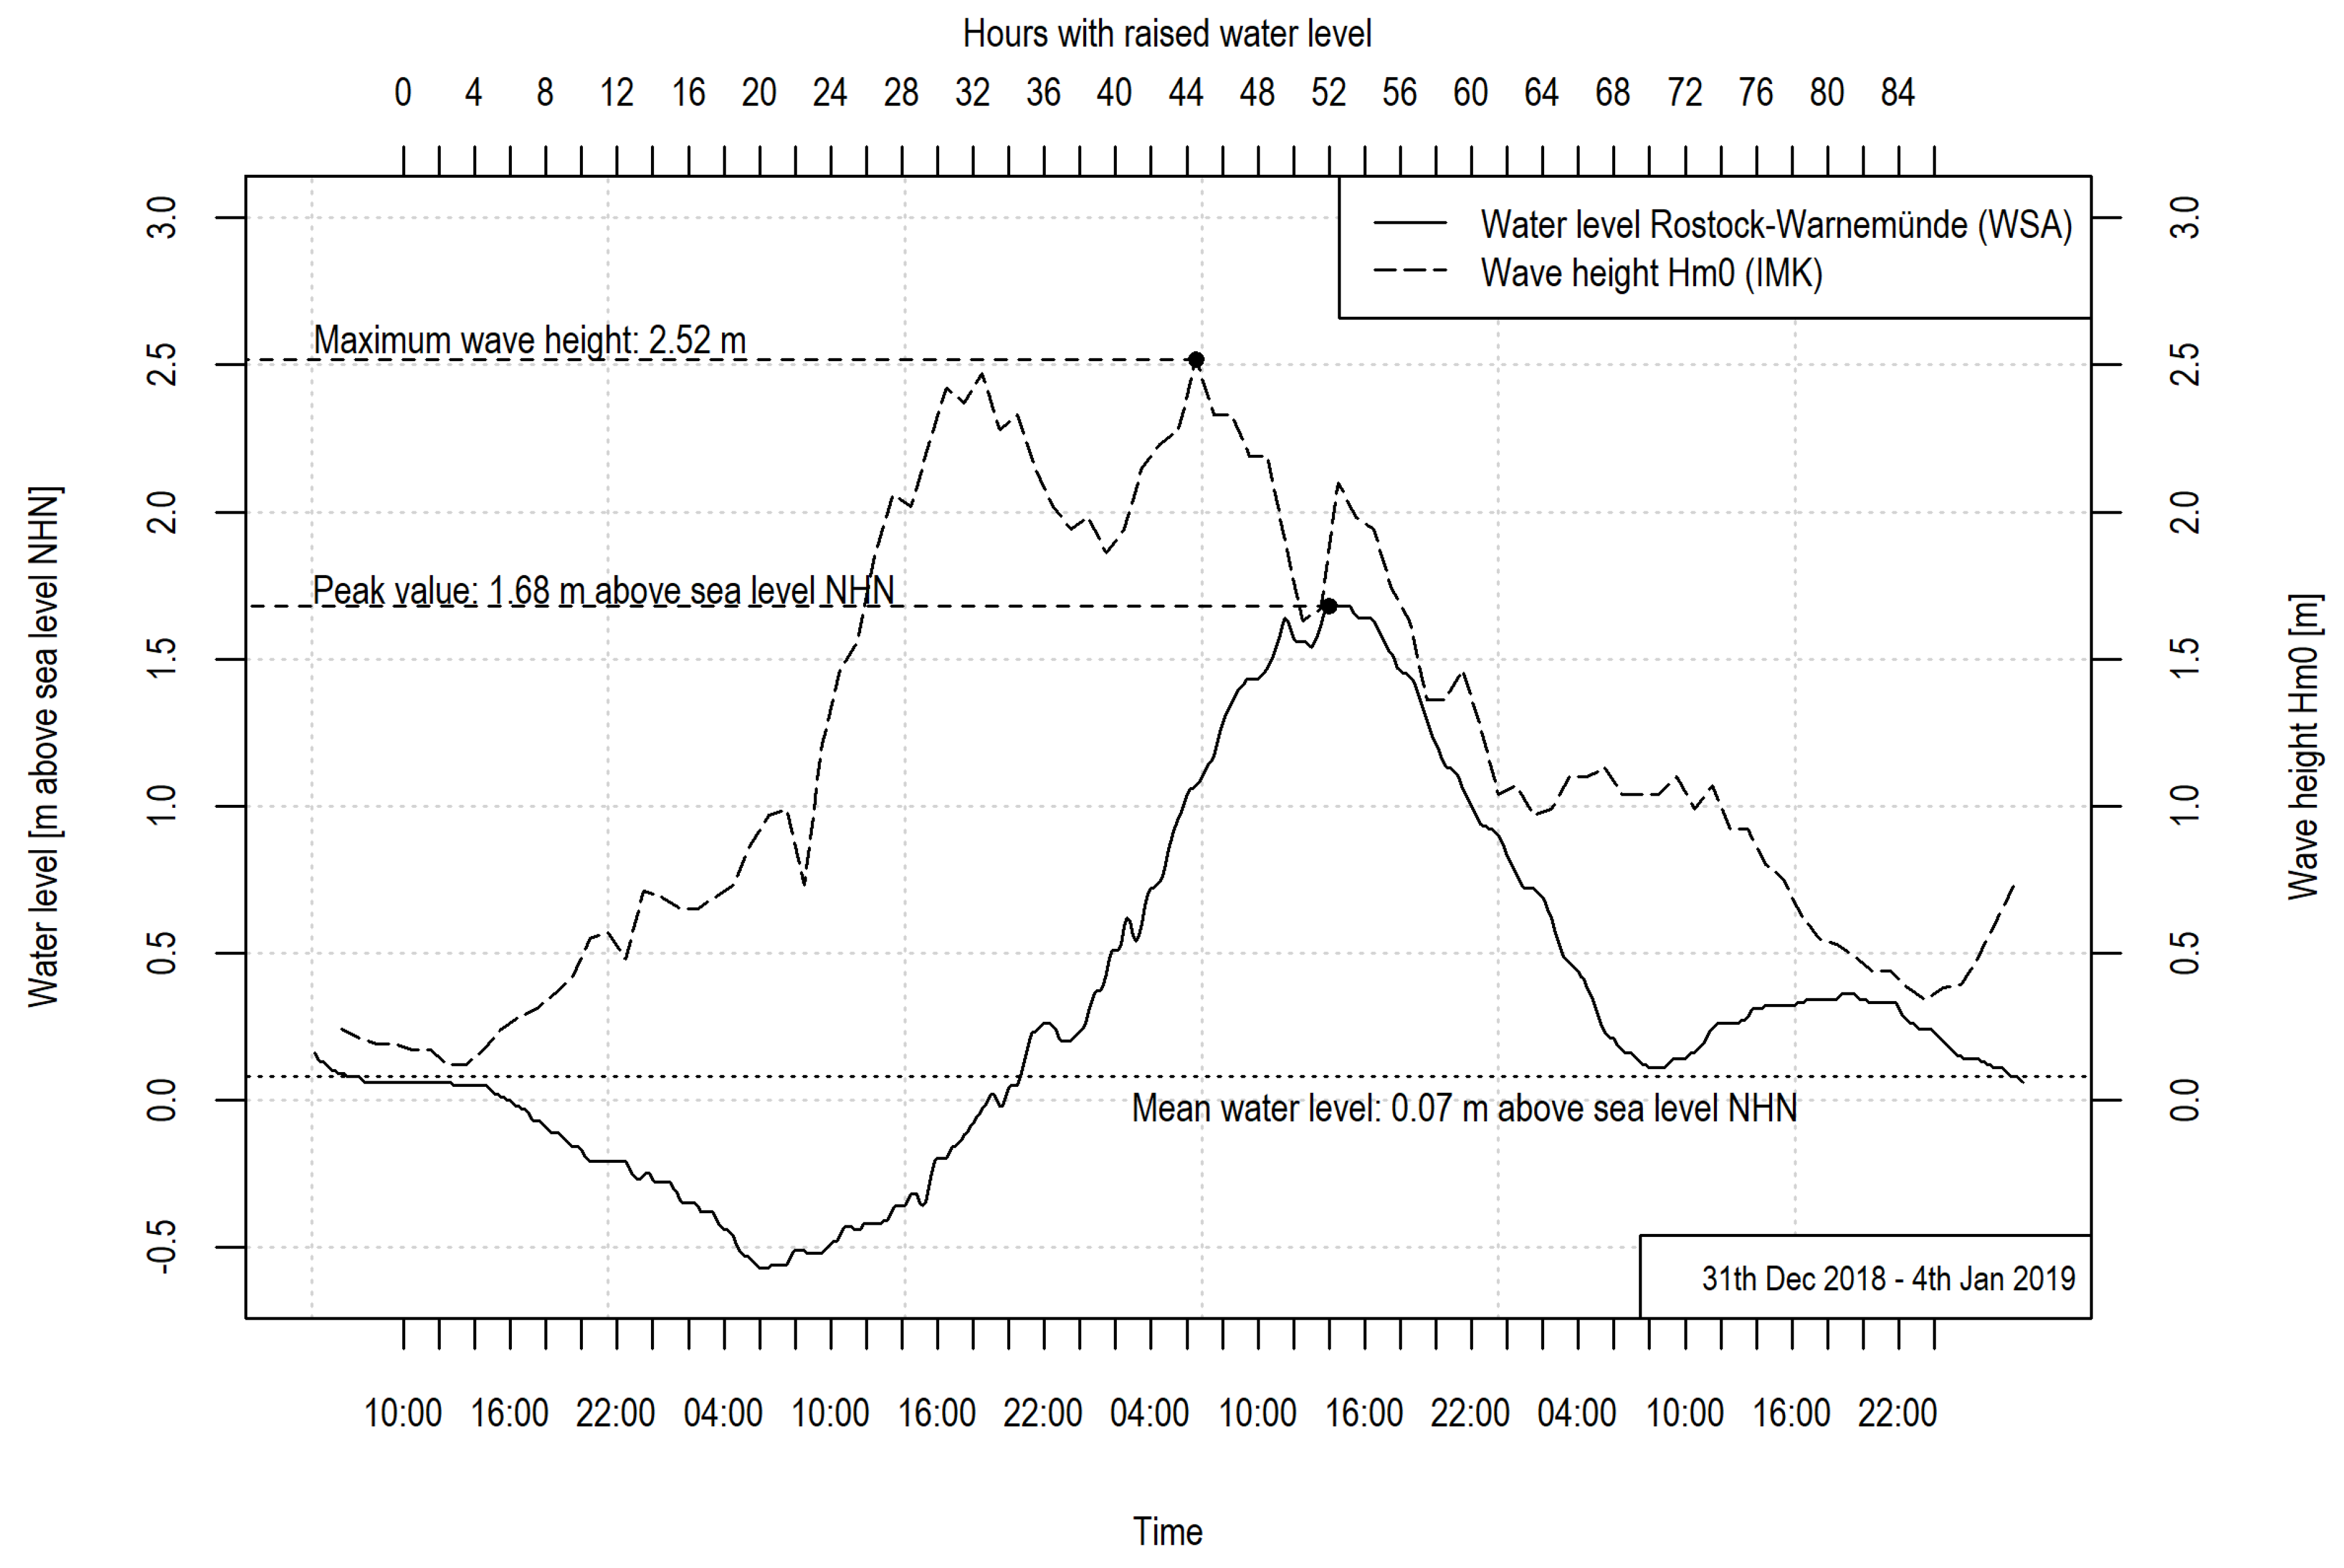
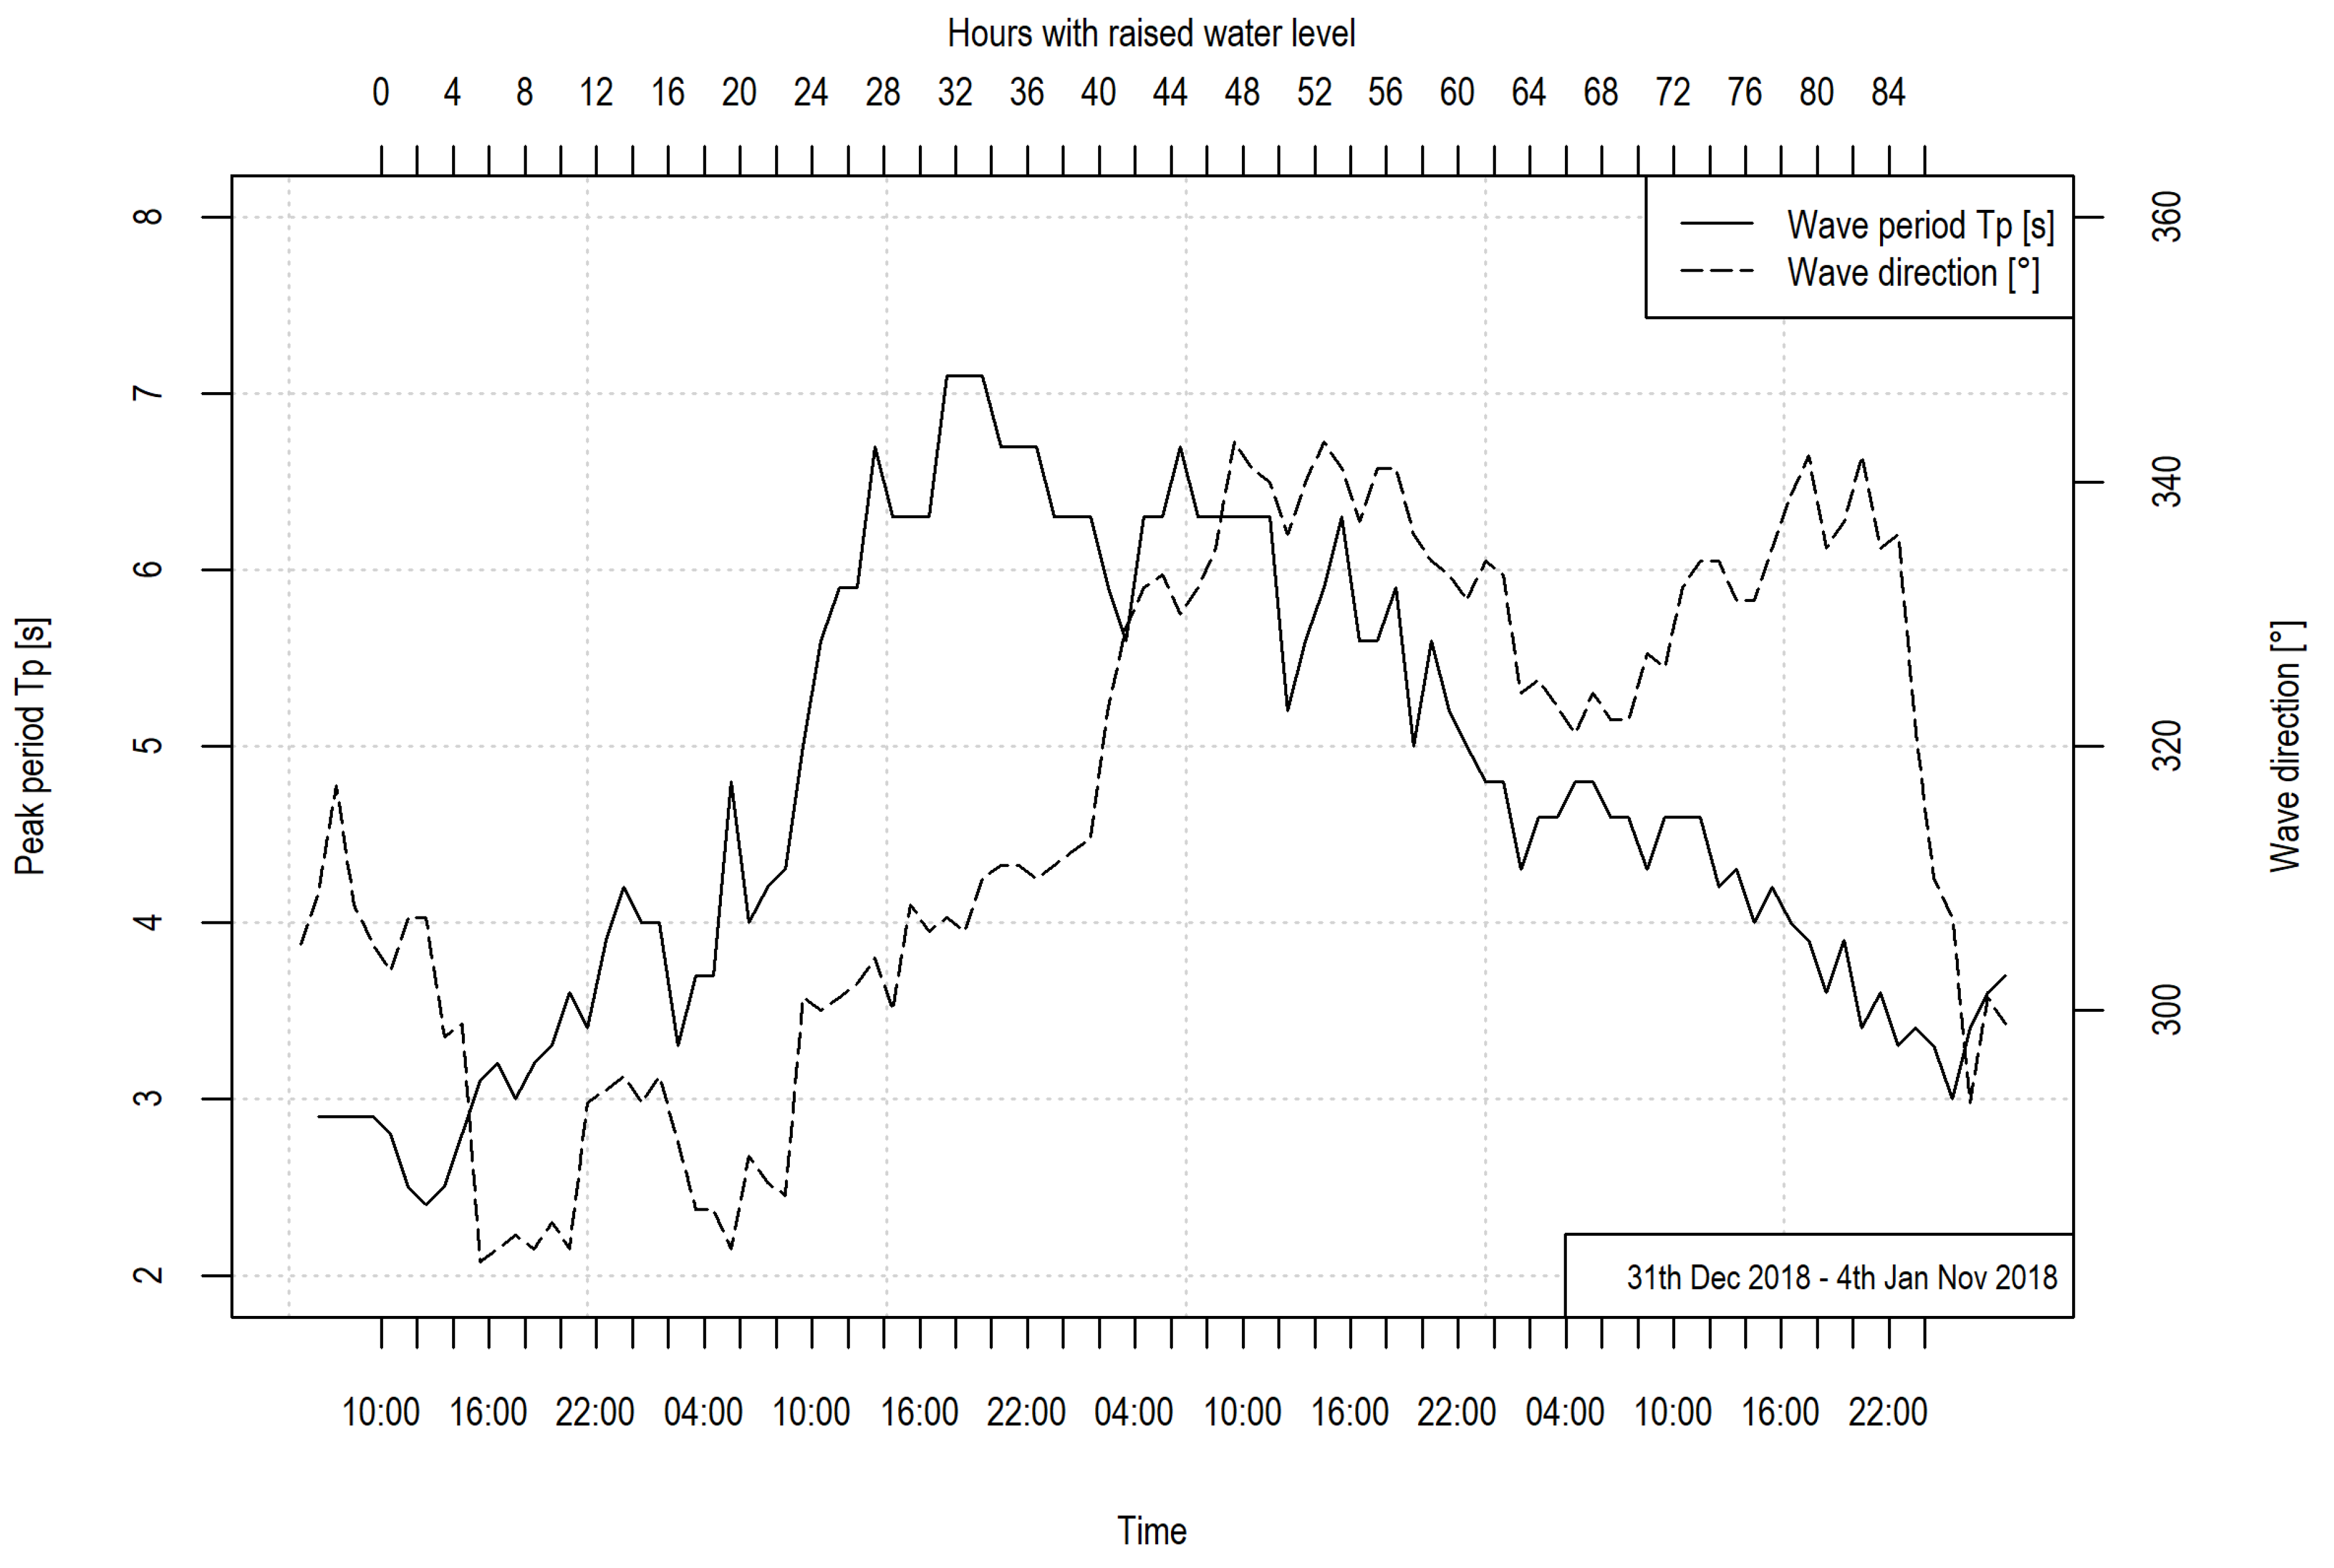
Figure 2 (right) shows that the highest and most frequent waves come from the northwest to the north. The data are based on sea state measurements of the IMK monitoring network in the years 1998 to 2020. More technical information for the IMK network is presented in the experimental dune setup section. Extreme waves have a height of 1–2 m, rarely between 2 and 3 m. No sea-state parameters are measured in the Ahrenshoop study area. Due to the orientation of the coastline, a different distribution of wave heights can be expected here. The period length as a function of the wave height can be seen in
Figure 1 (left). The long-period waves with low height are swell.
In the coastal city of Rostock-Warnemünde in MV, the mean water level has increased by approximately 15 cm since 1953 [
42]. Based on the categories for Baltic Sea storm surges provided by the responsible state agency (StALU MM), an increase of water levels in category 1, “raised water level” (0.5–0.99 m above mean water level) was determined [
1]. Due to the increasing average values related to the currently defined limits, the category 1 water levels are reached more quickly. An increase in higher-category storm floods cannot be detected based on the existing data [
35].
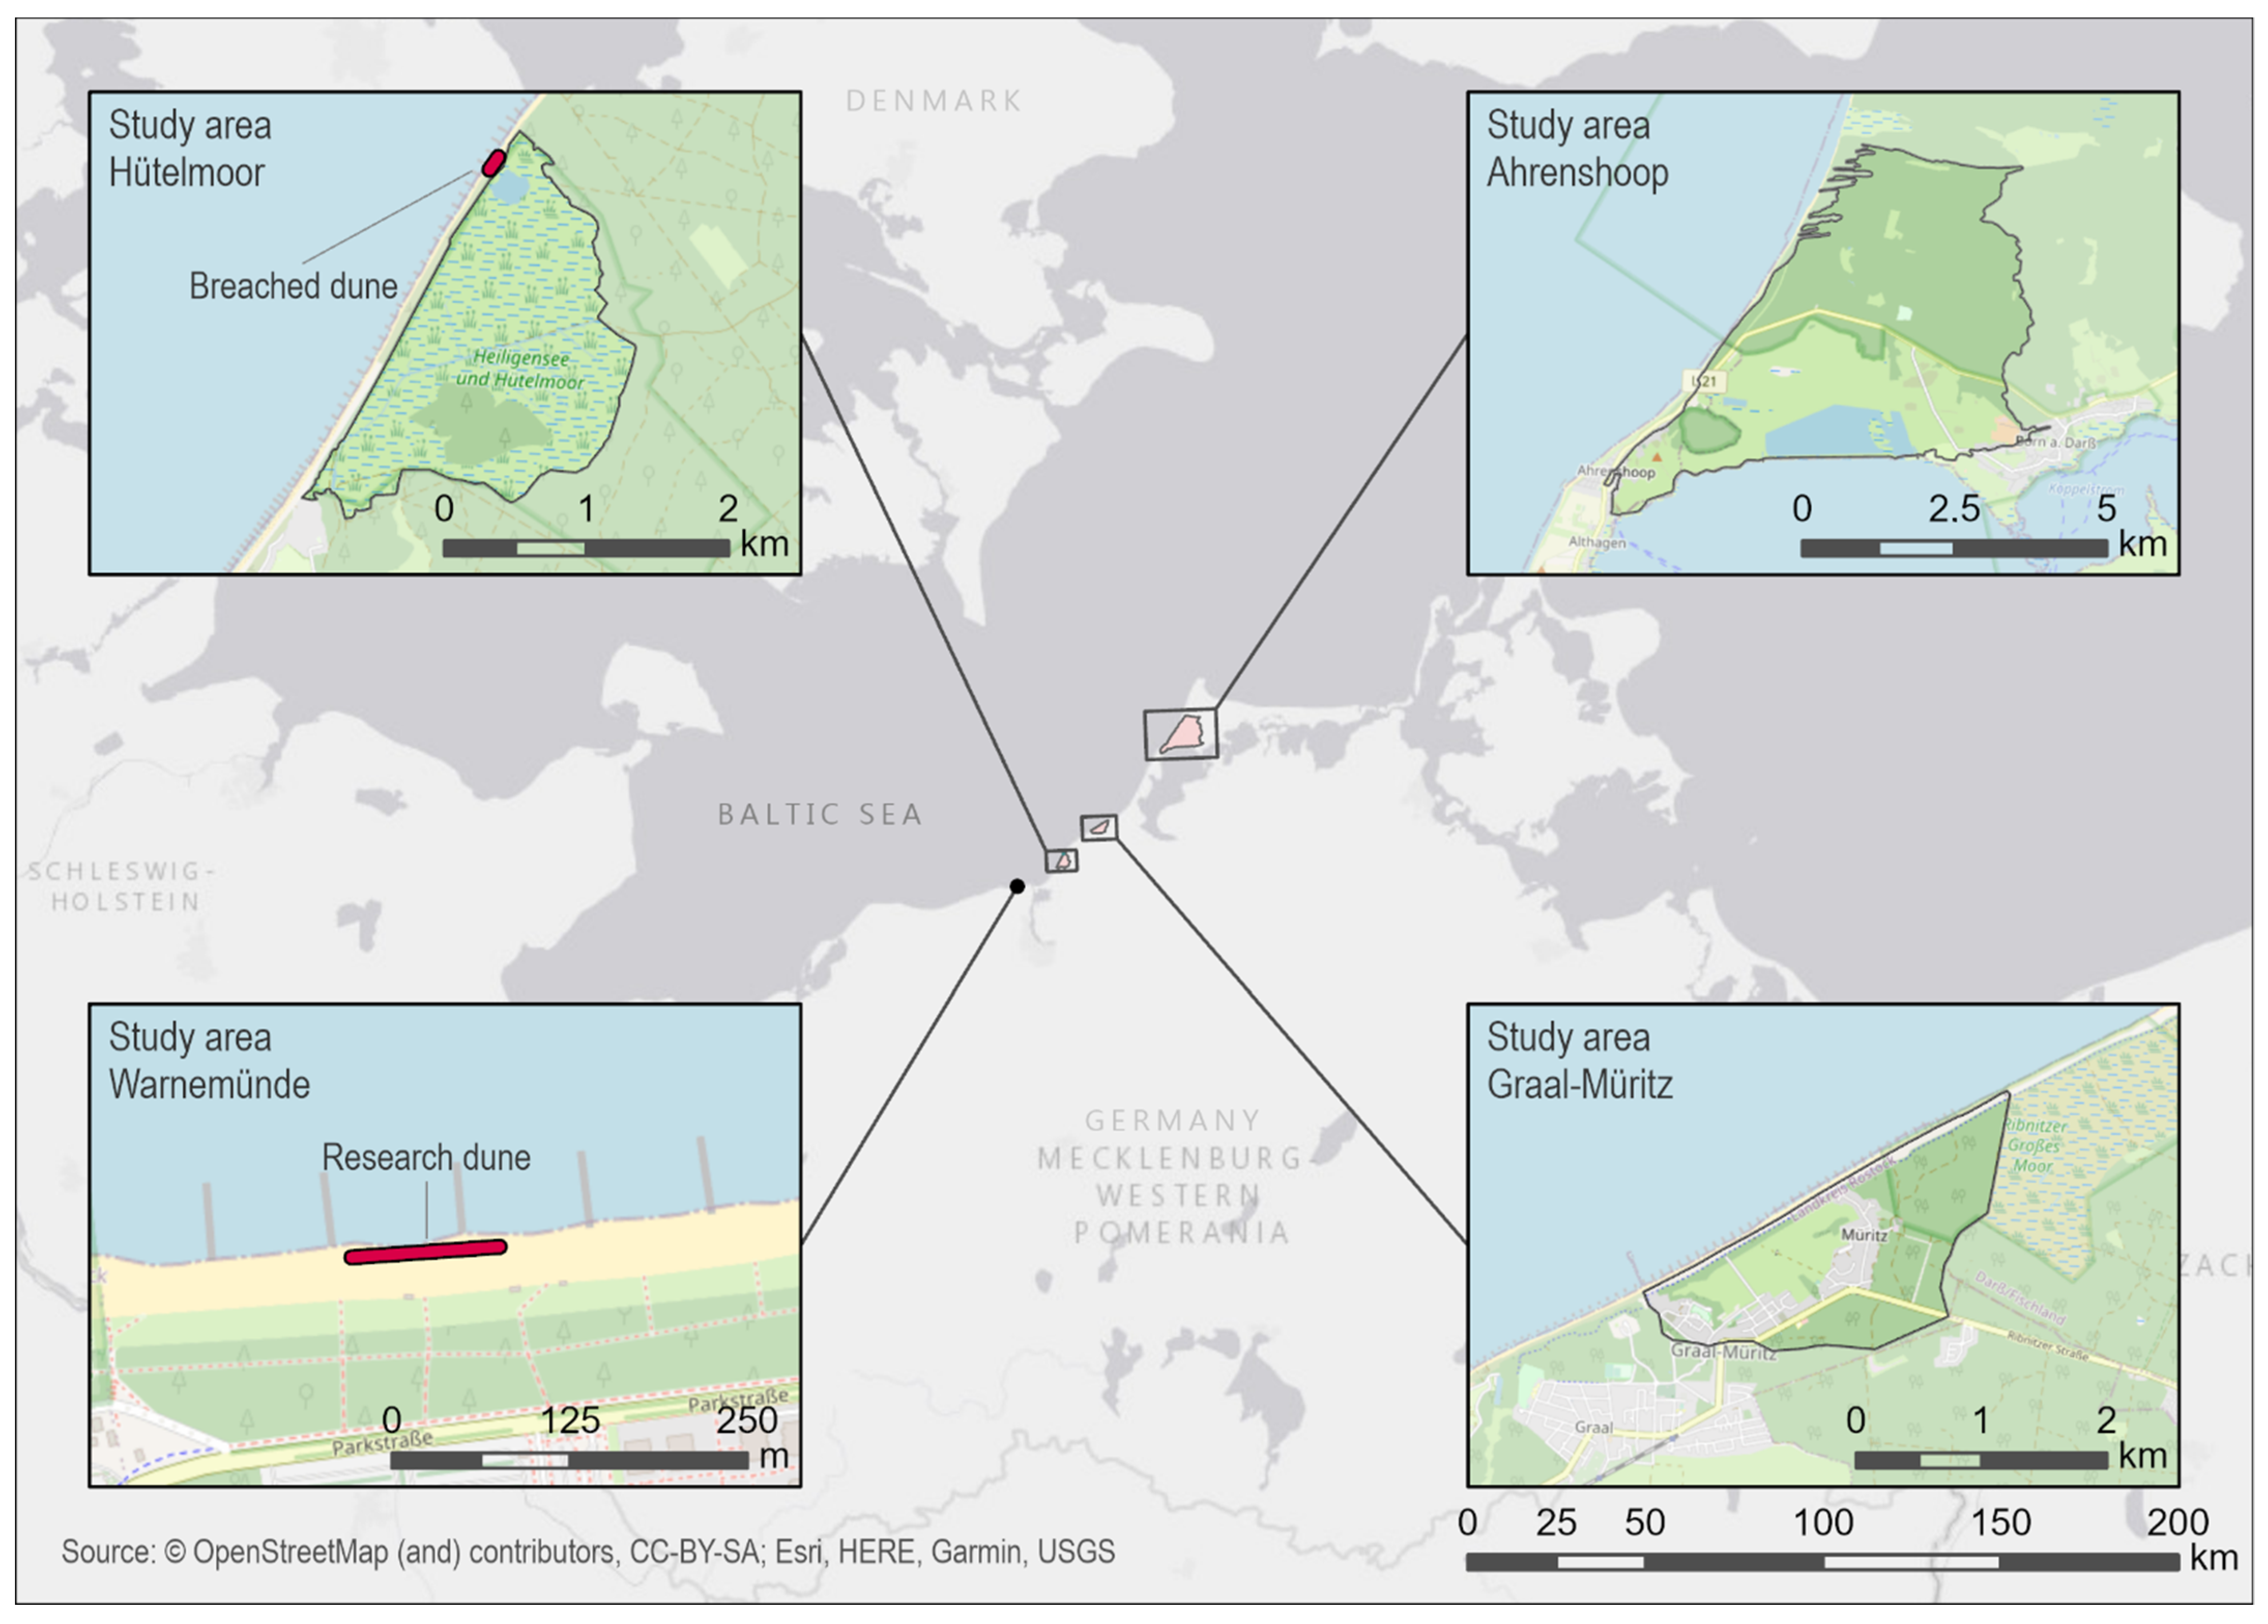
Four different study areas were chosen for the PADO project (
Figure 3). The beachfront of Rostock-Warnemünde was used to construct and investigate the constructed research dune, particularly because there is an existing measurement chain of climate and hydrographic data. Two reference areas, Graal-Müritz and Ahrenshoop, were chosen with two generally different dune protection systems. Later in the project, a third reference area, Hütelmoor, was included due to a recent dune breaching event.
The coastal protection dune in Graal-Müritz, 15 km northeast of Rostock, is an inherent protection dune (German: Vollschutzdüne) where the dune is the sole protection element. Such dunes usually consist of three sections: the wearing section with a large volume for sand relocation, the buffer or reserve section and the safety section, usually 10 m wide [
1]. They need to be repaired immediately after an extreme event to reduce the risk of dune breaching by a follow-up event. Quick repair, however, is currently impaired by the restrictions regarding sand mining for coastal protection. In the project, this study area was mainly used to investigate hinterland implications caused by dune breaching, which is not the focus of this paper.
The coastal protection dune in Ahrenshoop on the Darss peninsula 35 km northeast of Rostock is a system protection dune (German: Systemschutzdüne). This coastal defence system consists of a dune combined with a successive land side buffer polder, coastal protection grove and a hard construction (usually a dike) as the final safety line [
1]. These dunes are designed to be relocated by extreme events so that the dike will be directly affected. Ahrenshoop is one of the most erosion-prone coastlines along the German Baltic coast, with annual erosion rates of 10–15 m
3/m [
43].
The dune in the nature reserve Hütelmoor, located 7 km northeast of the city of Rostock, used to be an inherent protection dune but has purposefully not been maintained since the year 2000 to study a breakthrough that was ecologically favoured regarding the renaturation of the hinterland. Past storm surges had damaged the dune before; however, it never failed. Finally, in January 2019, this dune breached during two consecutive storm surges, coincidentally during the project lifetime—a perfect example to be included in the study. For more scientific investigations on the Hütelmoor dune and hydraulic system, see [
44,
45] and a variety of publications related to the DFG project Baltic TRANSCOAST. Detailed information on the PADO project can be found in the PADO final report [
36].
Coastal protection dunes at the German Baltic coast, such as in Ahrenshoop and Graal-Müritz, are usually built to a height of approximately 5–6 m above sea level NHN with the transition zone to the beach having an elevation of approximately 1–2 m NHN. The dune width is approximately 30–40 m depending on the type of protection dune, the land side slope usually being fully vegetated and under natural development (grey dune) while the water side is frequently nourished and maintained (usually a white dune) with a design slope of approximately 1:3 [
1]. For the design, a design flood event for MV with a return period of 200 years has to be used, which is provided in [
1].
3. Materials and Methods
3.1. Composition of the Dunes under Investigation
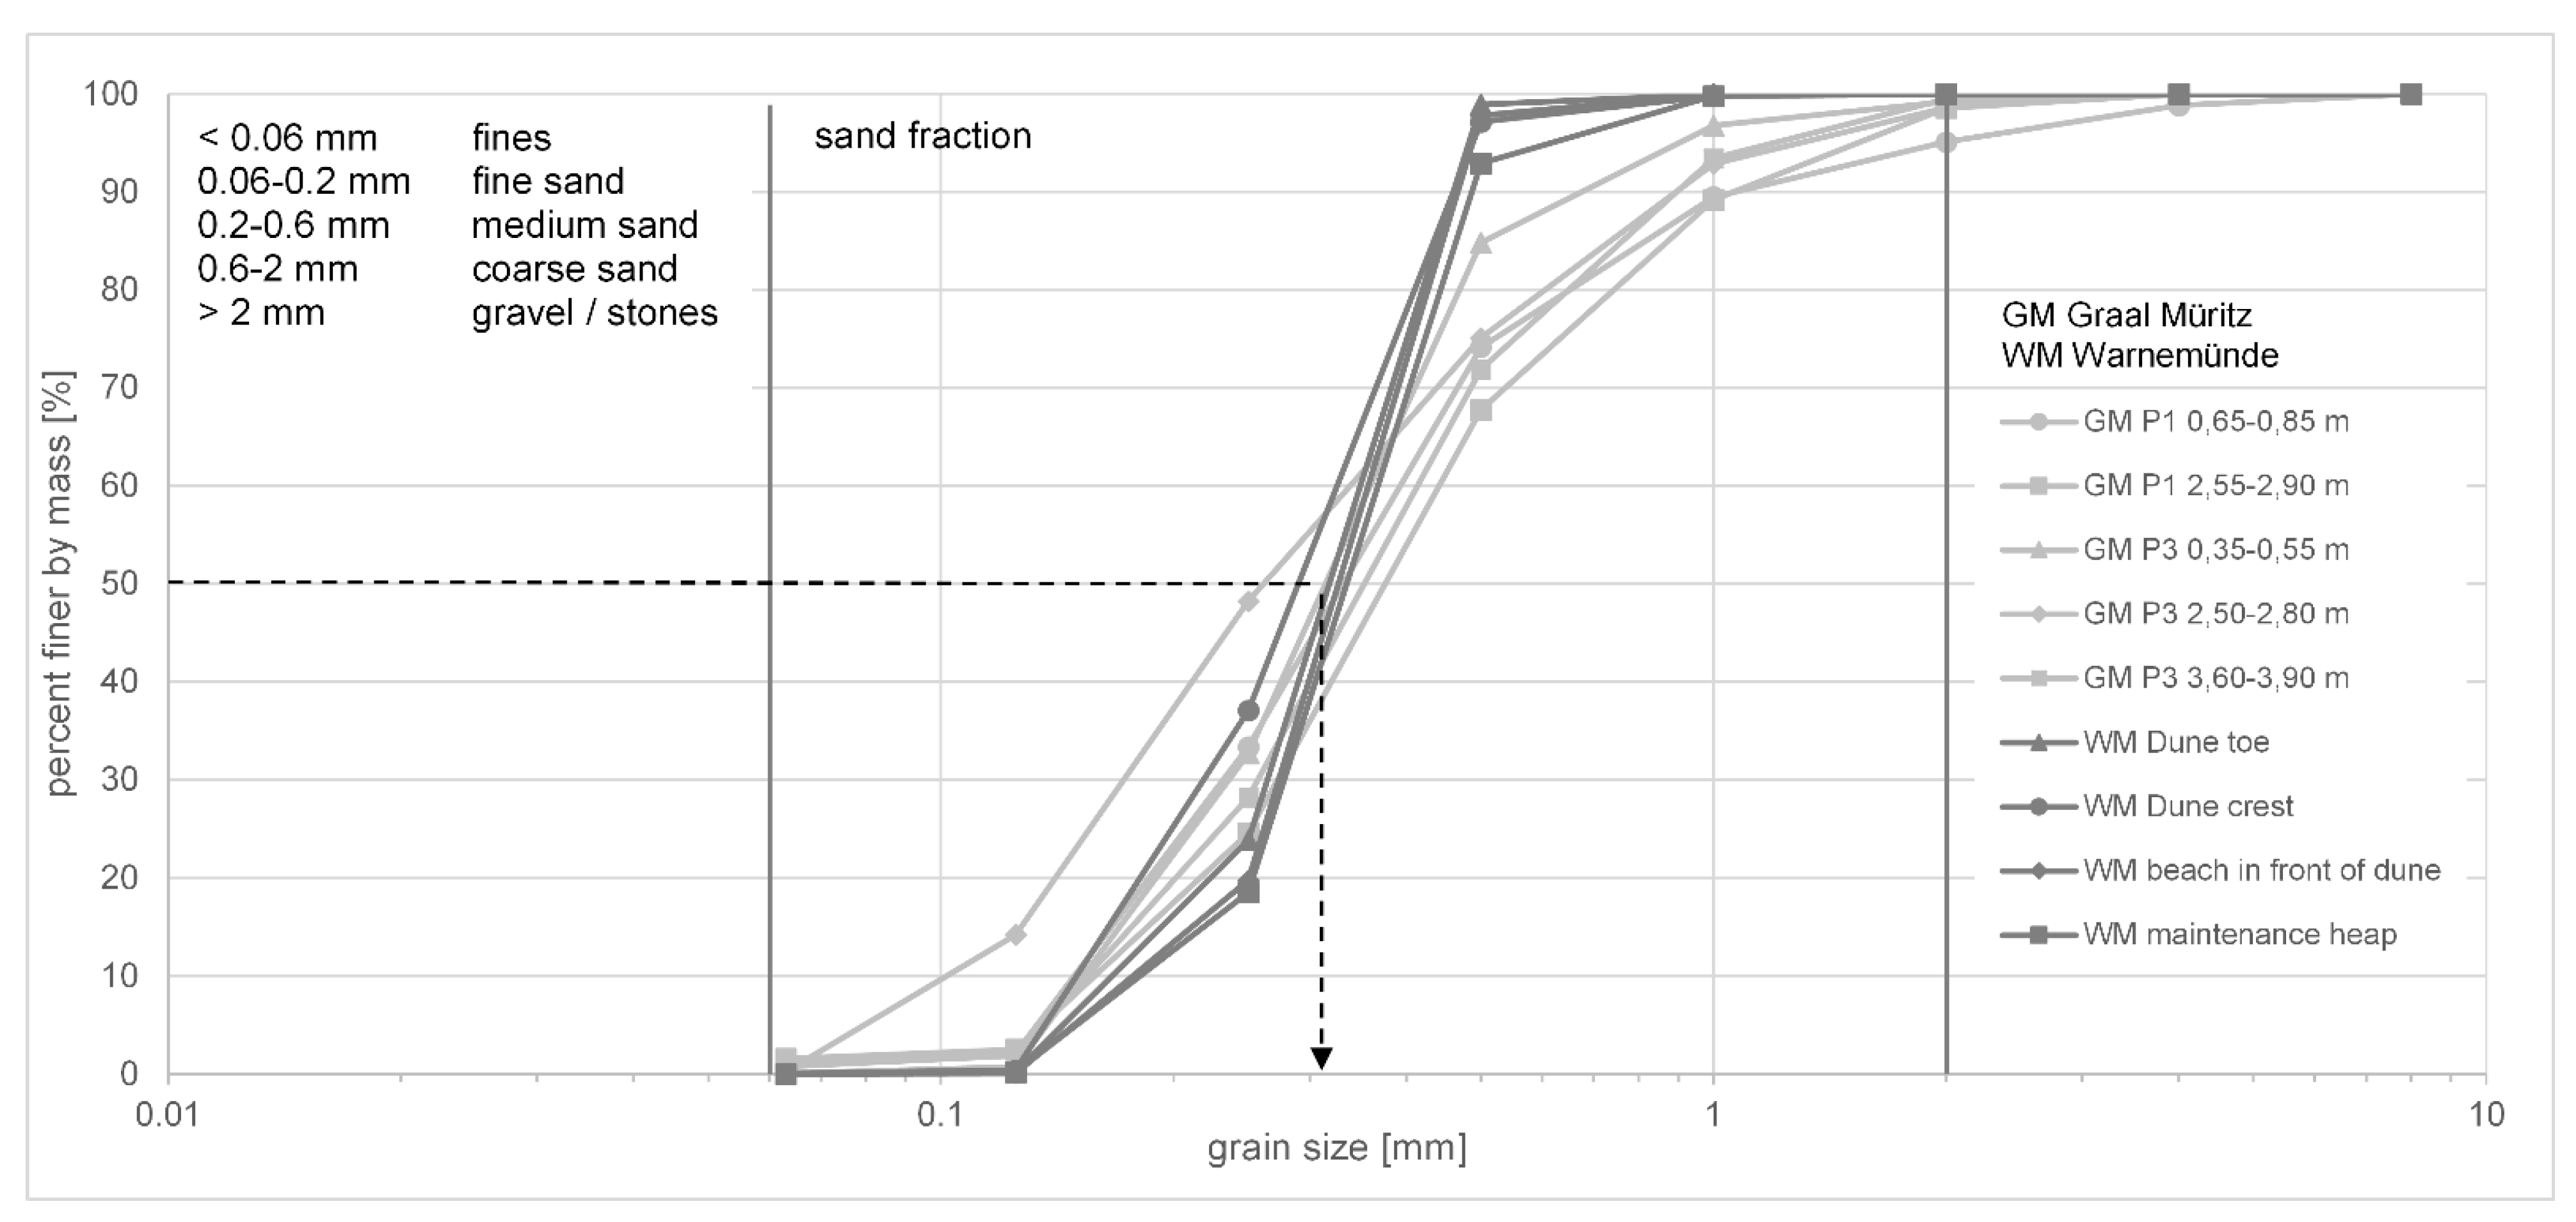
The sand dunes investigated in the PADO project consist of one general type of sea sand with a mean grain diameter d
50 of approximately 0.3 mm. In the planning phase for the experimental dune, geotechnical investigations were performed on the reference dunes of the study areas (Ahrenshoop and Graal-Müritz) and on the beach and dunes in Rostock-Warnemünde. The investigations show that the sands from the different locations are similar (
Table 1). However, in Warnemünde, both on the beach and on the existing dunes, the sand is more uniform (with a d
90 of approximately 0.5 mm) than, e.g., in Graal-Müritz (
Figure 4). Because of the similarity of beach and dune sand in Rostock-Warnemünde, it was decided to use beach sand to construct the research dune. Due to the general similarity, particularly regarding the d
50 value, the chosen material is expected to be a valid reference for the coastal protection dunes in the study areas. A basic microscopic grain shape analysis of Warnemünde sand showed rather round-edged grains. Due to the marine origin of the sand in all project locations and the requirement to use site-typical material for dune construction, it was decided to use the same geometrical and mechanical parameters for all sites.
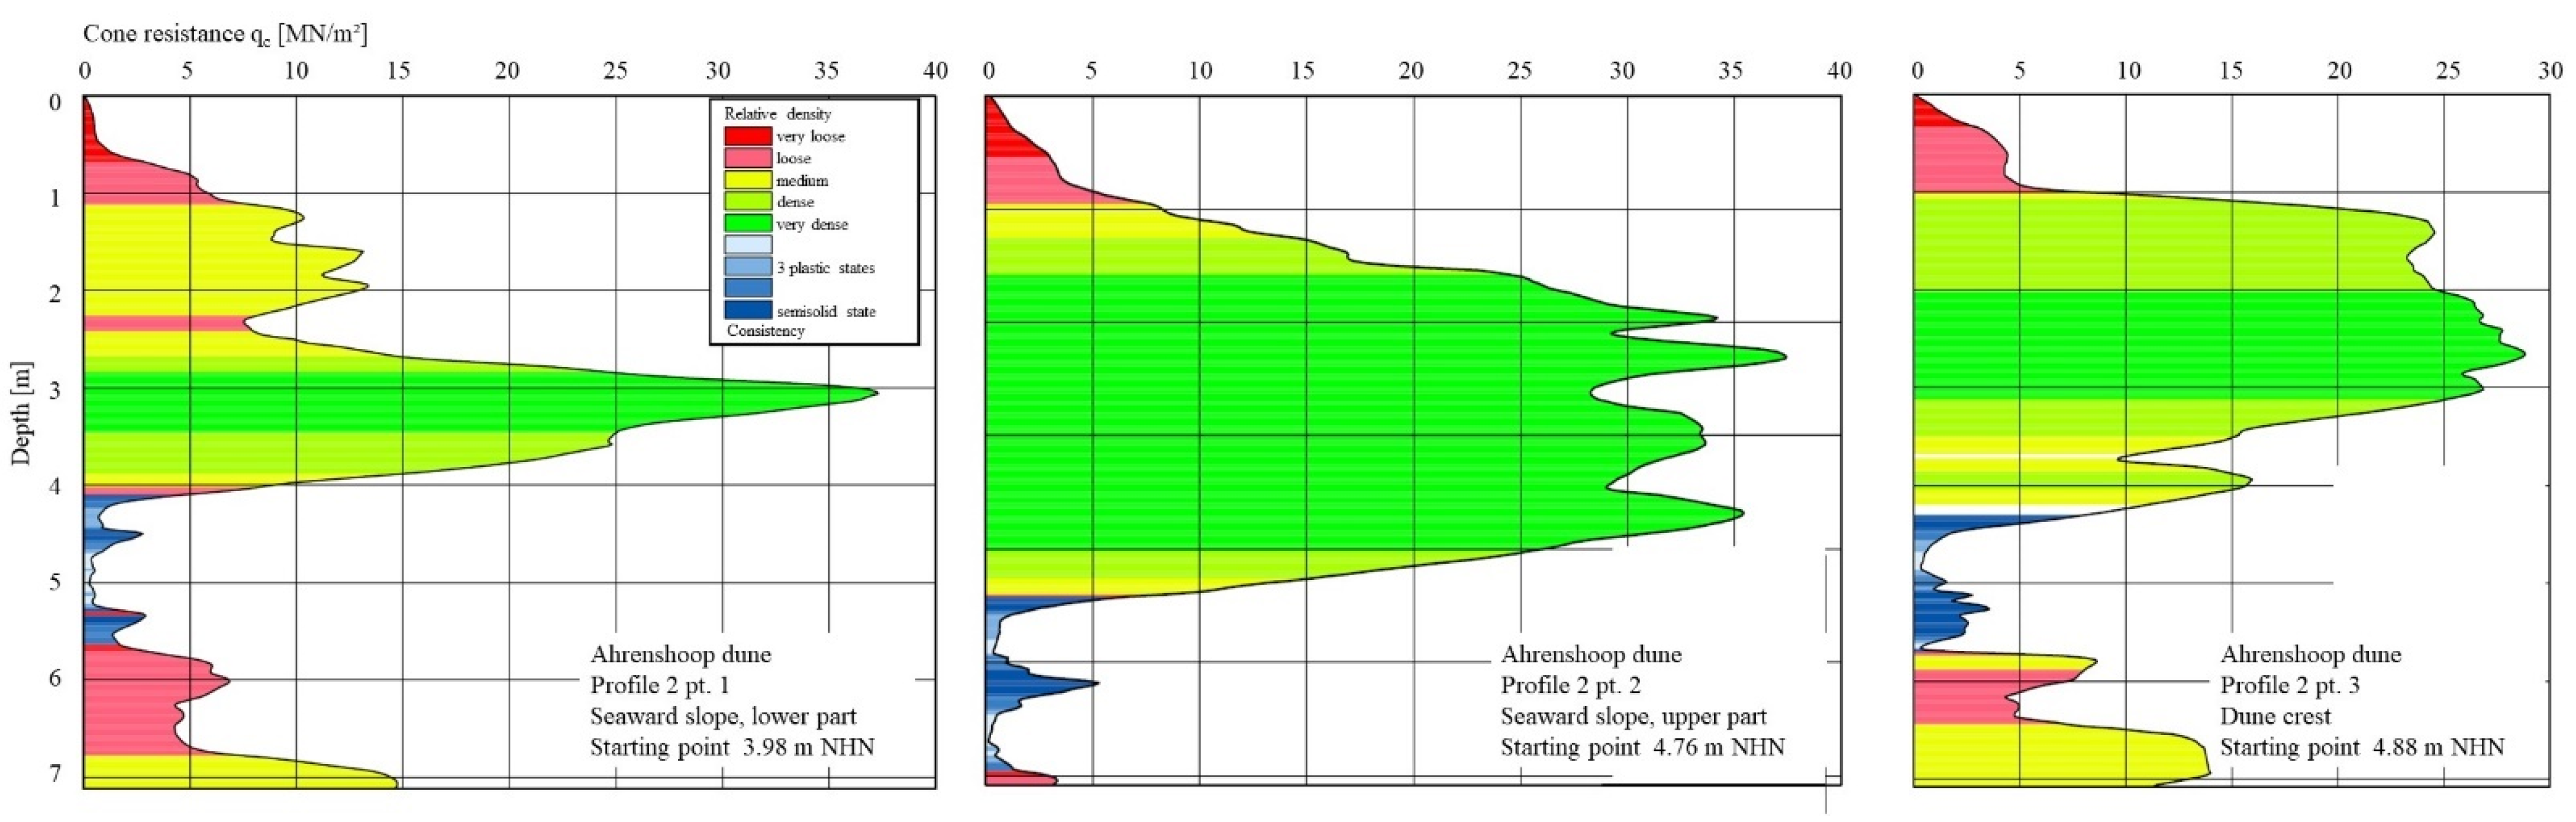
Cone penetration testing (CPT) was performed on the reference dunes in Ahrenshoop and Graal-Müritz with 25 and 23 CPTs, respectively, to determine the installation technology of the sand in the experimental dune. Validation of the derived CPT data was achieved by taking disturbed samples from the relevant depths by pile core sampling at Graal-Müritz. A representative set of CPT results for the Ahrenshoop dune is presented in
Figure 5. A lightweight penetrometer was used to determine the compactness at the beach and dunes as well as the experimental dune. The actual dry density of the installed and compacted sand in the research dune was determined using undisturbed sand samples in the laboratory, resulting in a medium value of 1.67 g/cm
3 with a relative density of D ≈ 67% (medium to dense).
The in-situ tests on the reference dunes (
Figure 5) generally show a rather low bulk density (loose relative density) in the upper 1 m of the constructed dunes, while below the bulk density is comparably high (medium to dense). At the base of the dune, a weak soil layer was found in nearly all locations, mainly consisting of peat that was covered by dune sand while the backward coastal erosion progressed and of saturated loose sand in some places. This weak layer, however, lies beneath the beach profile and is not expected to be involved during a dune breaching event.
3.2. Experimental Dune Setup
The research dune was built on the beach of Rostock-Warnemünde. At this location, the Internal Coastal Monitoring Network (IMK) [
1] provides additional long-term measurement data. The experimental dune was built twice, in the winter months of 2017/2018 and 2018/2019, respectively. For a successful field experiment, the dune had to be designed in size and location so that it would be stressed during a yearly storm surge (or high-water event), resulting in a length of 120 m and a relatively low crest height of 1.50 m NHN (
Figure 5 and
Figure 6).
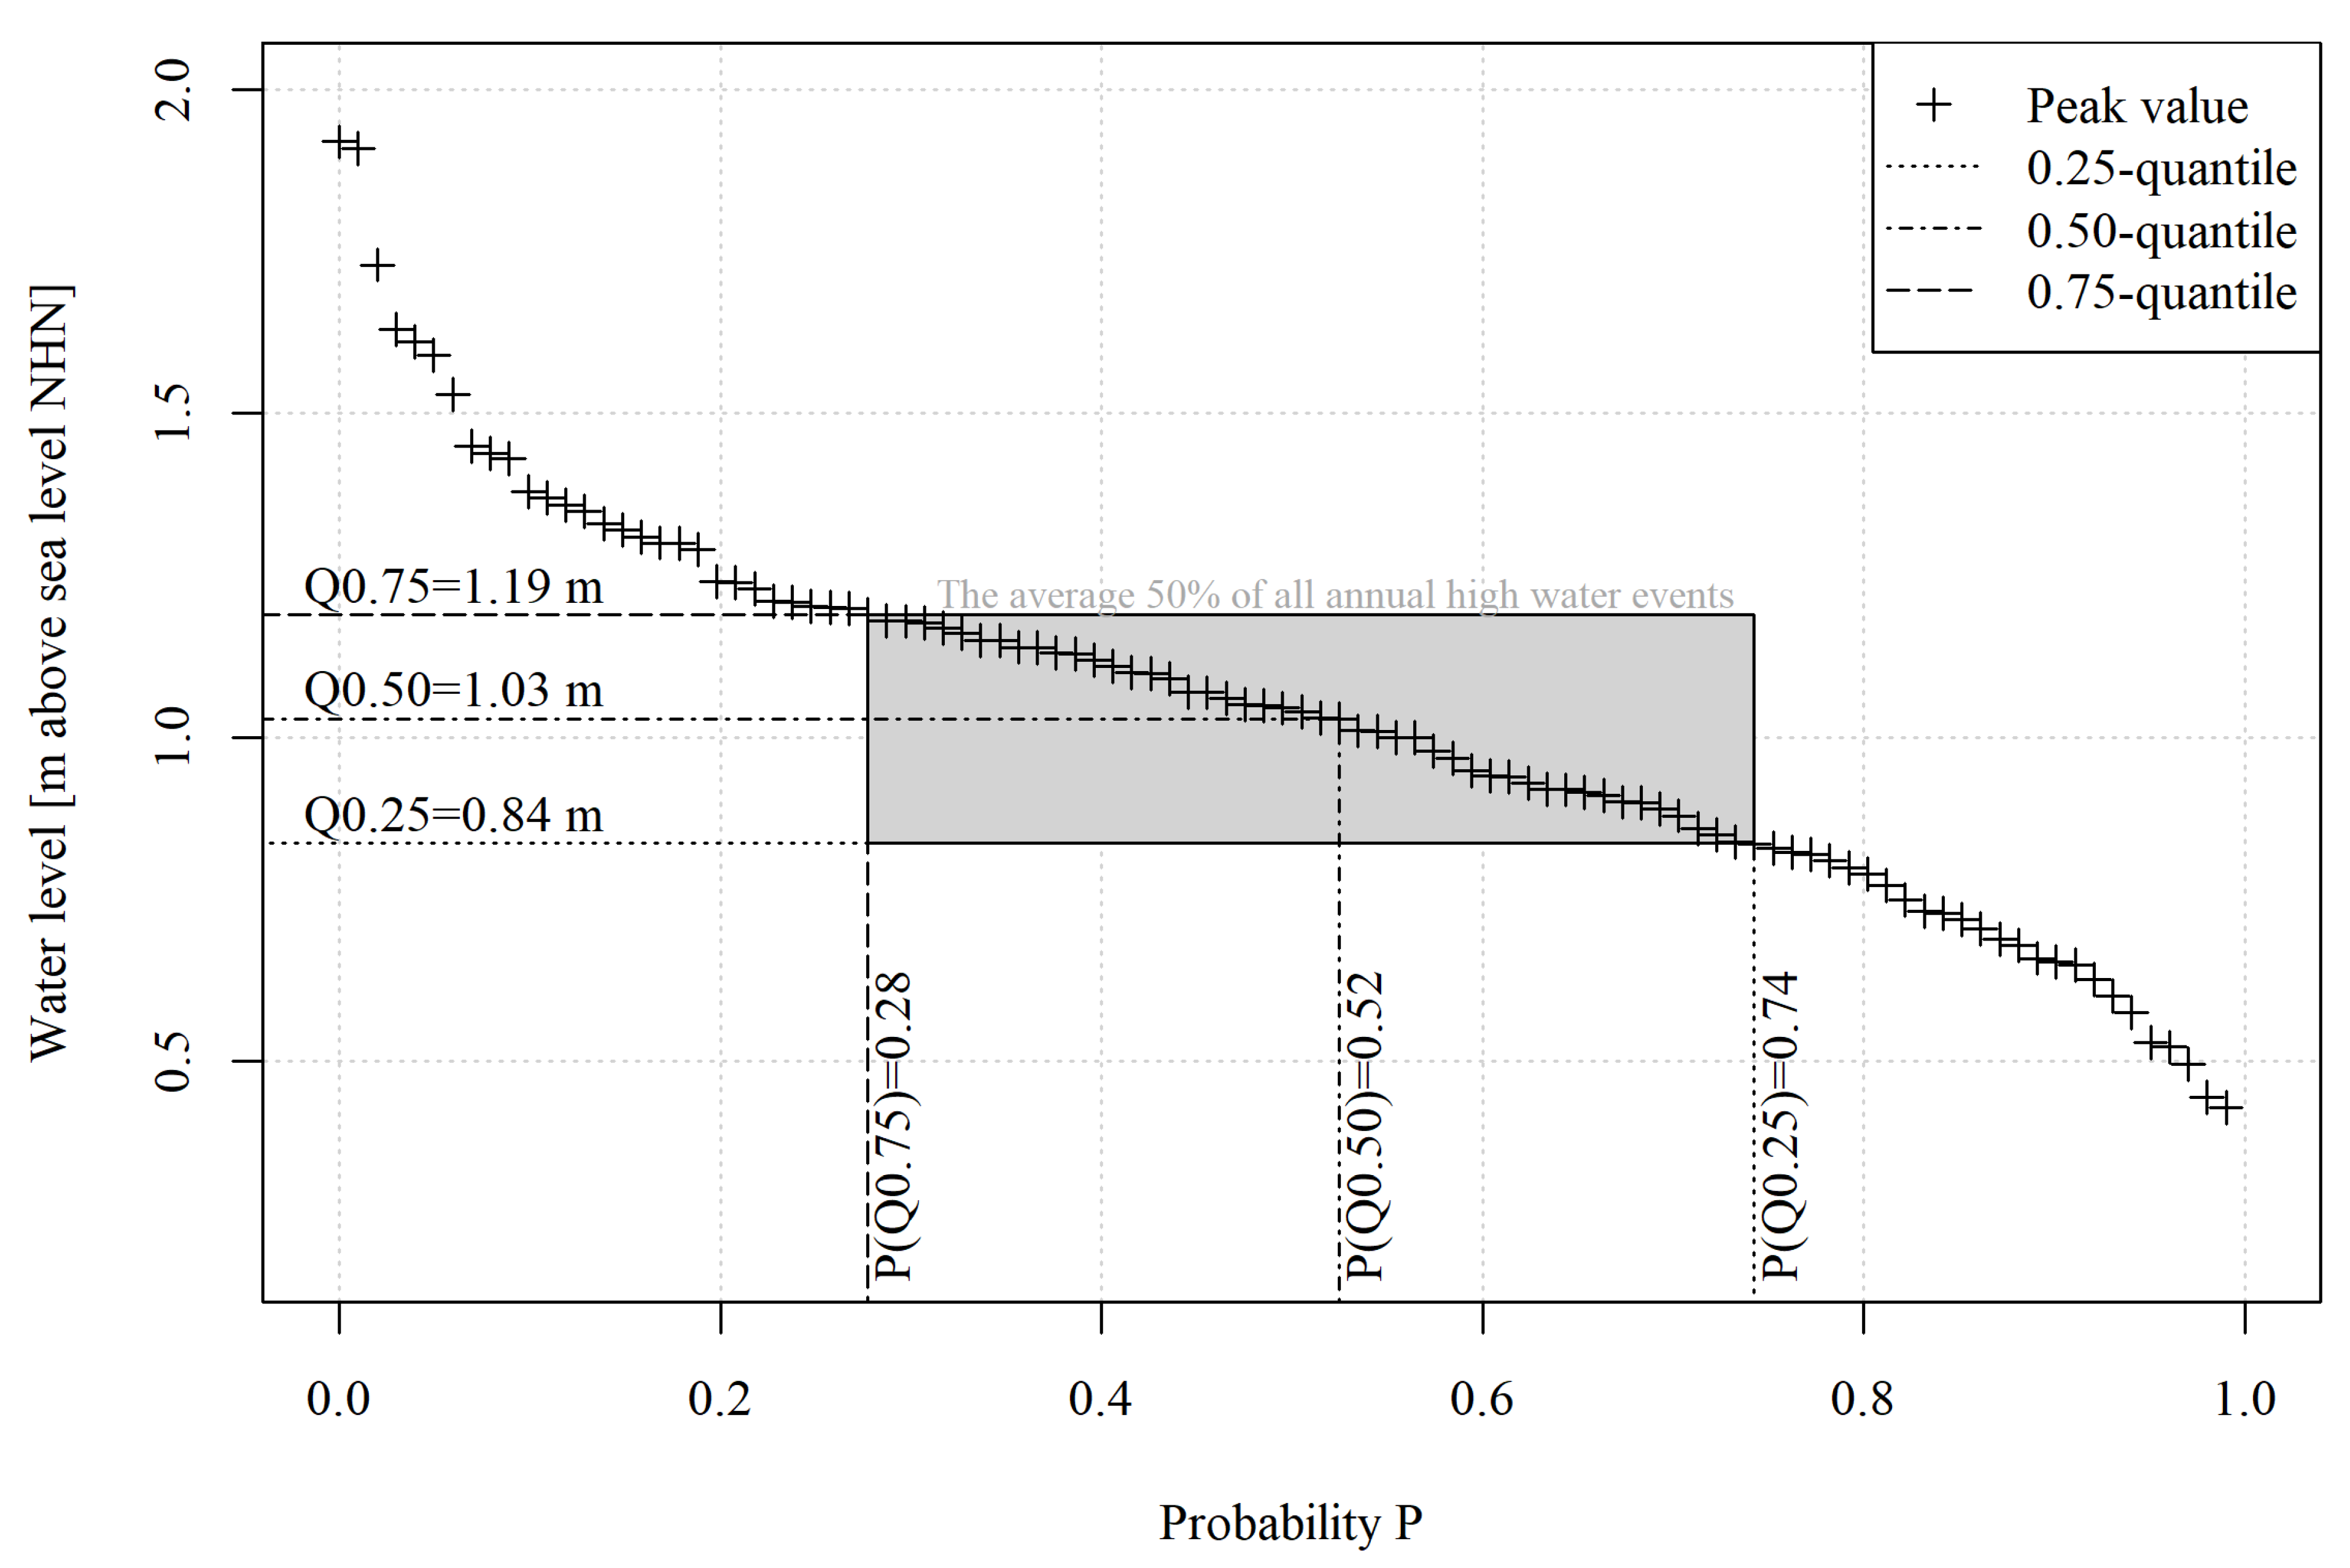
Based on the annual maximum water levels (level gauge Rostock-Warnemünde), an empirical distribution function was created (
Figure 6), and the expected average annual peak values (Q
0.
25 = 0.84 m and Q
0.
75 = 1.19 m above sea level NHN) were derived.
By standardization and subsequent averaging of the water levels and the duration of chosen high water events at the level gauge Rostock-Warnemünde, a statistical hydrograph was synthesized from the available time series. The statistical high water -relevant for the design of the experimental dune- has a duration of 18 h, with a peak value of 0.98 m above sea level NHN.
A similar procedure was used to determine the design wave height. For this purpose, the prevailing wind directions and speeds were determined in relation to the water levels of the statistical hydrograph. A wind-wave correlation was used to determine the hydrograph of the wave heights (maximum of 2.14 m in 10 m water depth). The wave periods were derived from the relationship shown in
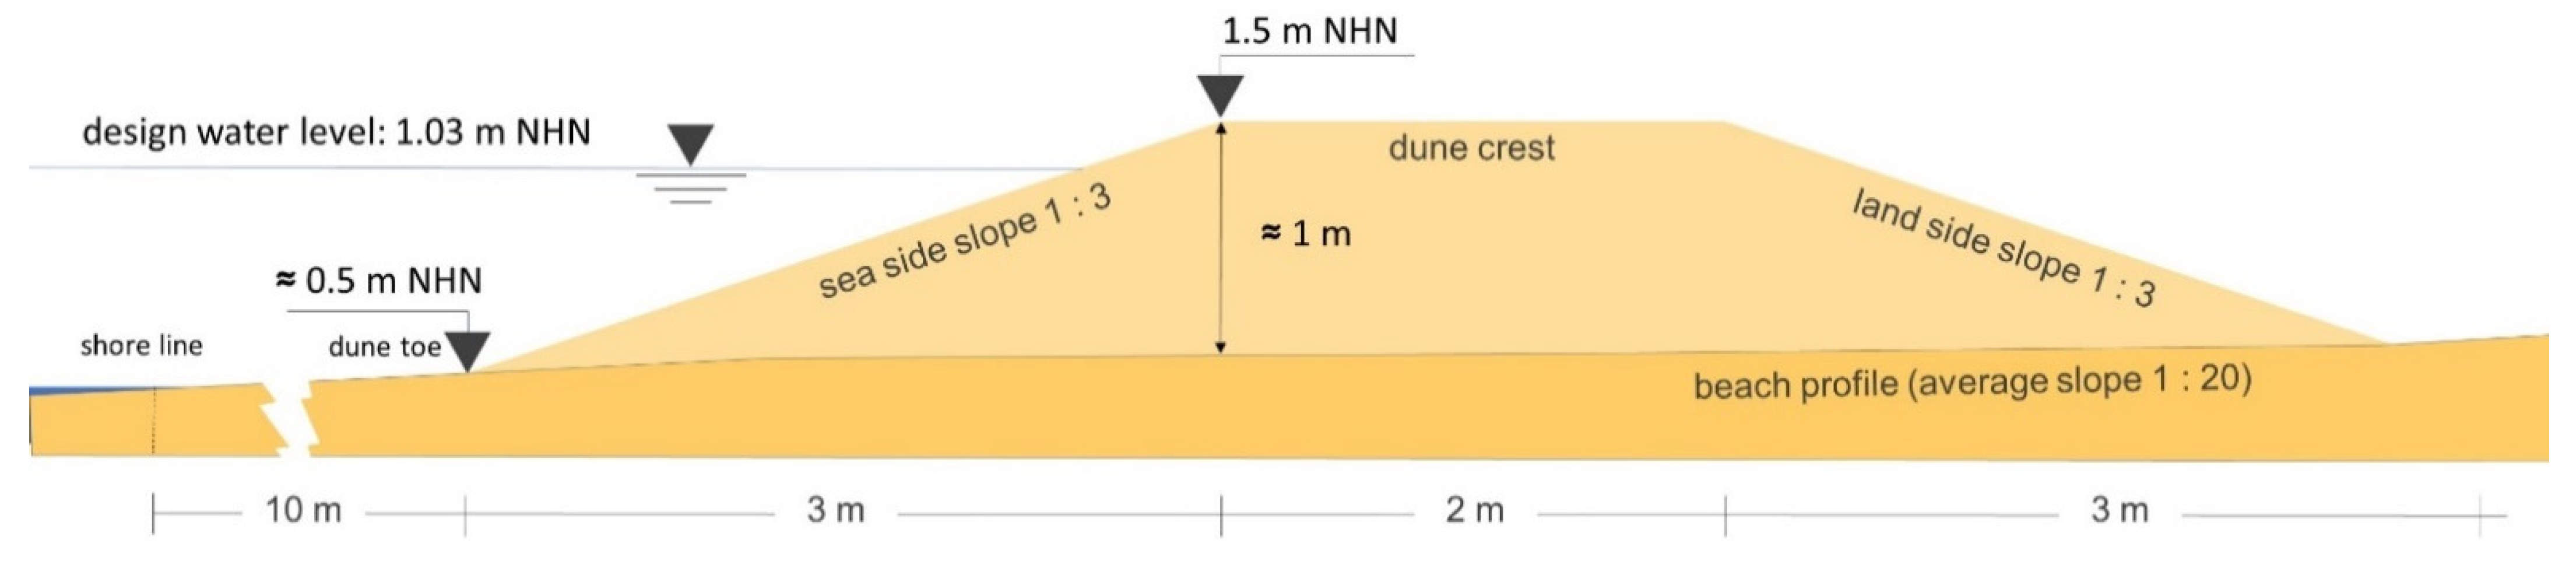
Figure 1. Based on the hydrodynamic boundary conditions and the beach slope (1:20), the research dune had to be dimensioned in such a way that the development of a breach could be measured when the expected conditions occurred. Therefore, before construction, it was important to estimate the optimal configuration of the research dune in terms of height, width and distance of the toe of the dune from the shoreline. For this purpose, a model was built in the numerical model SBEACH with the mentioned boundary conditions. The dune parameters (height and width) and the distance of the dune toe from the shoreline were iteratively modified until the desired result was achieved, considering the wave run-up simulated by SBEACH. The final geometry and the distance to the shore are shown in
Figure 7 and
Figure 8.
The volume of the experimental dune was approximately 5 m
3 per running meter as planned (
Figure 7) and was proven by aerial photogrammetric survey (total volume ca. 680 m
3, considering some unevenness of the underlying beach surface). The sand was installed with compactness comparable to that of the real protection dunes at Rostock-Warnemünde and Ahrenshoop (dry density 1.67 g/cm
3, relative density medium to dense, see above).
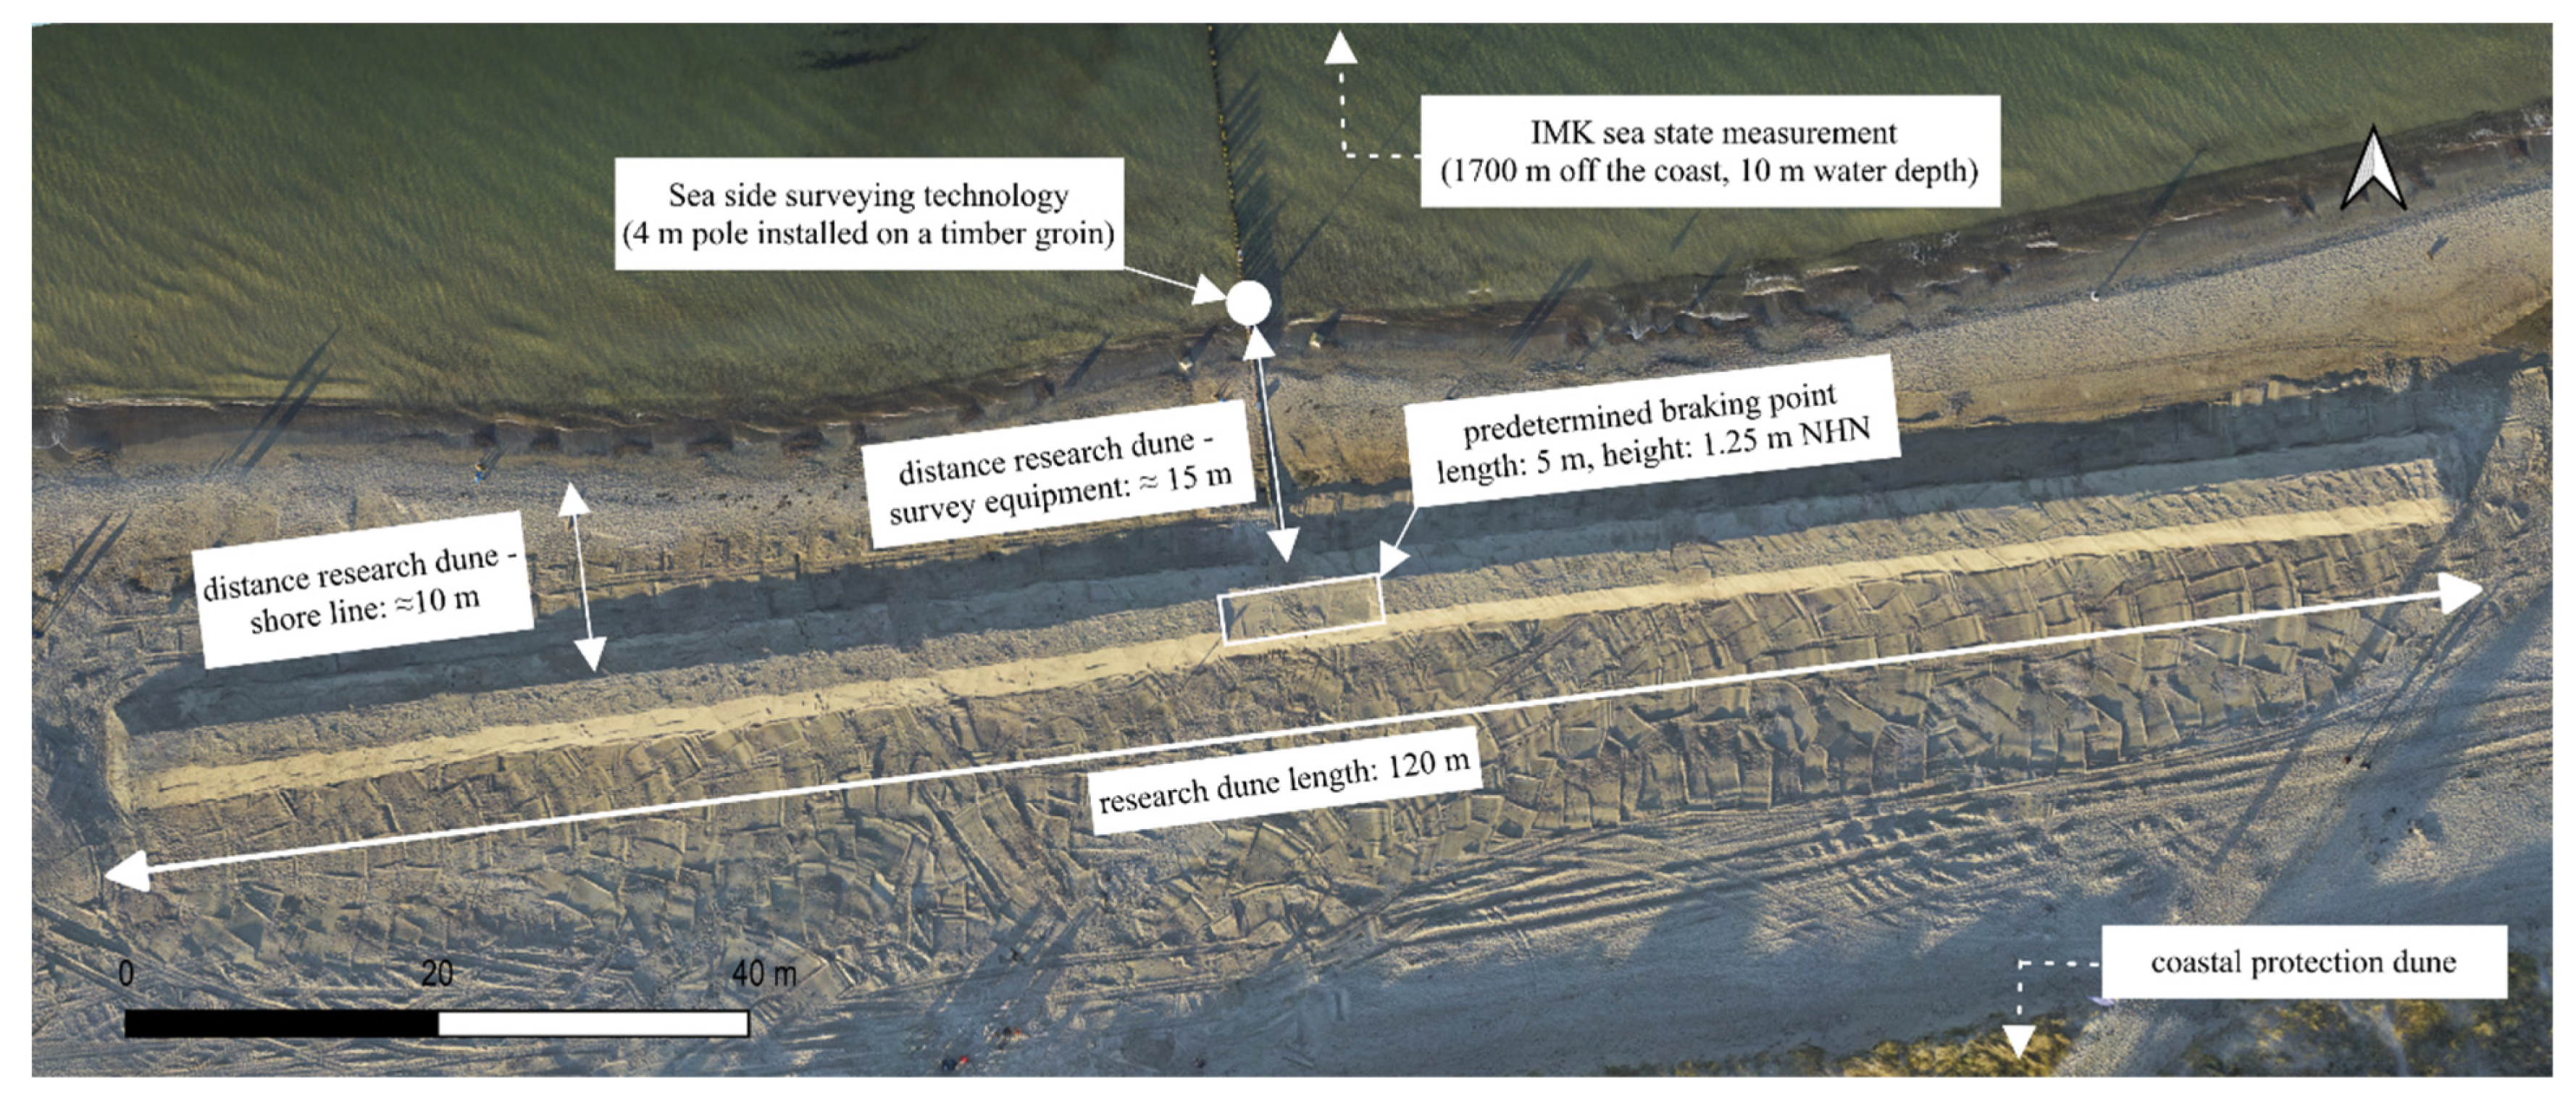
Figure 8 shows an aerial photograph of the finalised dune. Here, a lower section in the middle of the dune can be seen, which was planned as a predetermined breaking point for the breach development. There was no stabilisation of the sediment by planting due to the tight time frame.
3.3. Instrumentation and Measurement Equipment
For both the sea and land side data acquisition, it was necessary to develop an innovative measurement concept which was able to reliably record all relevant processes (i.e., dune erosion) even in challenging weather conditions (
Figure 8 and
Figure 9).
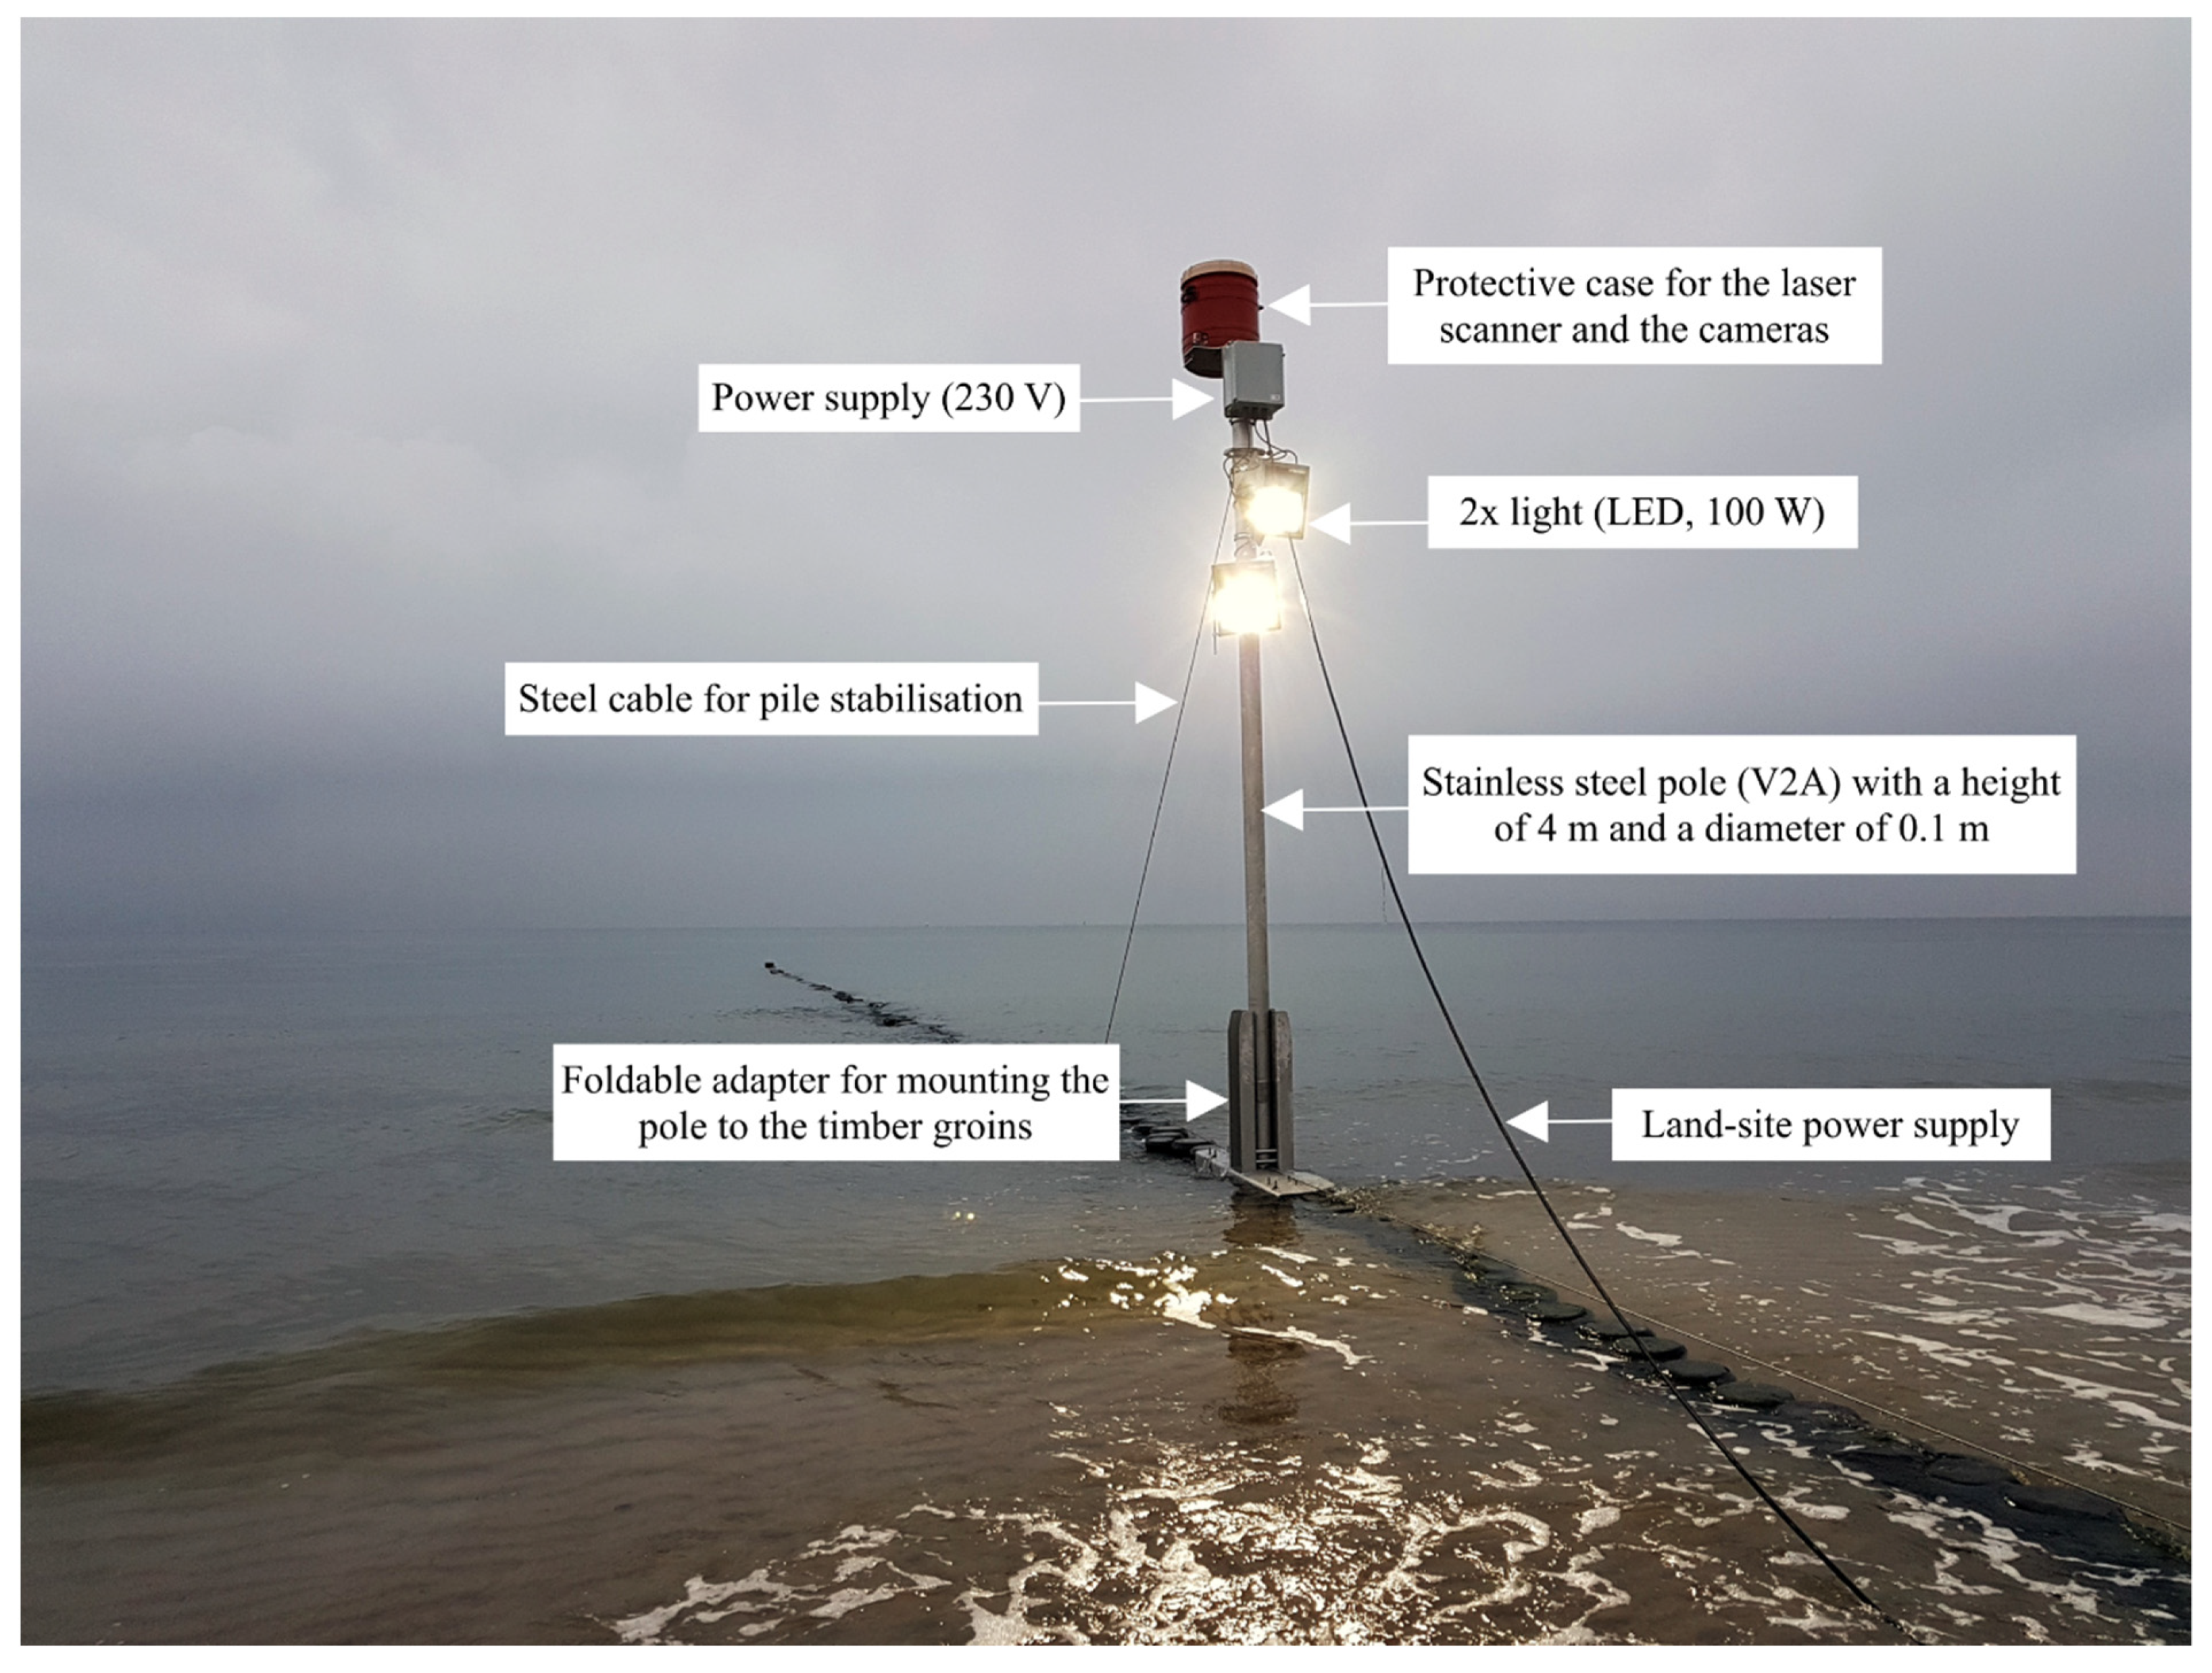
The sea side surveying technology consisted of a pole fixed to a timber groin with a terrestrial laser scanner (FARO Focus 3D X 130, record rate 976,000 pts/s, range 0.6–130 m, ranging error +/− 2 mm) and two digital cameras (GoPro Hero4 Black, resolution 12 MP) installed for photogrammetric analysis. In addition, two spotlights were installed for sufficient illumination during the night (
Figure 9). The pole on the groin was installed at a distance of approximately 15 m for high-accuracy measurement (
Figure 8) so that the wave-induced erosion along the entire length of the experimental dune (ca. 120 m) could be recorded by the terrestrial laser scanner and the cameras with a precision of <20 mm (units of length in 3 dimensions). The measurement equipment was installed at the height of approximately 4.50 m NHN. Digital terrain models can be generated from the recordings of both the laser scanner and the cameras, and then the volume can be determined. By comparing the different terrain models, the erosion-related decrease in volume can be computed.
Generally, the scanner is able to record data in 360 degrees; however, to protect the sensitive instrument from saltwater spray, rain, wind-carried raindrops, snow, and ice, a self-designed chassis was put around it, with an opening as small as possible, optimised to the pole installation point and the dune length. By scanning the beach and dune in short intervals, the deformation of the dune, including the fore-dune down to the waterline, could be recorded in high resolution and accuracy during a high-water event. Measurement accuracy and duration were dynamically adapted to the local conditions. In addition, a Waverider buoy (Datawell) as part of the IMK monitoring network (model Datawell Waverider, time resolution 30 min), recorded the sea state. The buoy is located about 1700 m off the coast in a water depth of 10 m. The water level data was derived from the Federal Maritime and Hydrographic Agency BSH (Bundesamt für Seeschifffahrt und Hydrographie) as basic data for the subsequent numerical modelling.
The relevant topography was regularly surveyed. Therefore, the beach and research dune surfaces were recorded using aerial photogrammetry, while the nearshore and foreshore bathymetry was recorded with different surveying methods, including manual tachymetry in the very flat areas and sonar measurements in the areas up to 5 m depth. The bathymetry outside the 5 m depth line was taken from open-source survey data [
46]. Detailed information on the different topographic measurement and surveying methods has been published by Koldrack [
37].
The dune was instrumented with combined moisture/temperature/conductivity probes (GS3 soil moisture probes by Decagon Devices, Inc., Pullman, WA, USA) in three profiles. The probes were intended to give insight into the collapsing mechanisms depending on saturation and possible freezing of the surface during the winter season.
3.4. Field Measurements and Erosion Analysis in Ahrenshoop
Additional field measurements were performed on the coastal protection dune in the study area Ahrenshoop to analyse the material loss caused by a storm surge in January 2019, where the respective dune section had been newly nourished in 2018. The geometric surveys of the nourished dune section are available in the form of regular profile lines and were provided by the state agency (StALU MM). University of Rostock’s department of geodesy and geoinformatics generated a digital terrain model of the mentioned dune section after the storm surges using UAV-photogrammetry. A Phantom 4 Pro multicopter and AgiSoft PhotoScan Professional Version 1.3.2 were used for this purpose. From both data sets, solids were generated with ArcGis (version 10.5.1). By comparing the volumes before and after the storm surge, it was possible to estimate the erosion-related sediment loss in different areas of the dune.
3.5. Numerical Models
SBEACH (for storm-induced beach change) is a two-dimensional empirical model to predict the change in a defined cross-section due to coast normal sediment transport under storm surge conditions (water level and sea state). The model was developed at the Coastal Engineering Research Center (CERC) for the analysis of sediment transport by hurricanes on the U.S. coast by Larson and Kraus [
47]. The approach is based on the equilibrium profile theory of Bruun [
23] and Dean [
48] but has been extended to include a term that accounts for the local foreshore slope. This considers sediment transport, which increases with the local foreshore slope [
27,
28]. SBEACH assumes that changes in the submarine bed result from the incoming breaking waves. The sediment transport rate in the cross-shore direction is calculated from water level, local wave conditions, energy dissipation, local beach profile, and sediment properties. Temporal changes in sediment balance are estimated using the equation for the conservation of mass.
XBeach (extreme Beach behaviour) is an open-source numerical model developed for simulating storm surge-induced erosion of sandy coasts. The model considers coastal hydrodynamic and morphodynamic processes such as wave generation, propagation and transformation, surf and swash zone processes, as well as the spatially variable effects of water level changes and transient wave loading on sandy coastal sections. The morphodynamic module allows simulating the effects of hydrodynamic loading on, for example, dunes, which can lead to the initiation of a breach. An integrated avalanching mechanism allows the model to account for avalanche-like slides in both the horizontal and vertical planes, thus enabling the detailed simulation of the temporal and spatial evolution of a breach.
In XBeach, different modes are available to generate waves. For storm surge-induced dune erosion, Roelvink et al. [
31] recommend the surf-beat mode in which the model calculates short-period waves on the scale of wave groups, which in turn is the basis for calculating long-period waves with the nonlinear shallow water equations. The calculated hydrodynamic quantities serve as input data to the morphodynamic module, where sediment transport rates are calculated based on the depth-averaged advection-diffusion equation of Galappatti and Vreugdenhil [
49]. A detailed description of the theoretical background is included in [
31] and [
50]. In the PADO project, the XBeach version 1.23.5527 (‘XBeachX’) was used. The parameters used to model the research dune have been published and intensively discussed by Schweiger et al. [
39]. The model parameters and settings for the simulations in Ahrenshoop (MV design flood from [
1] and Zeetje storm surge measurements) and Hütelmoor (Zeetje storm surge) are presented in
Table 2,
Table 3 and
Table 4, respectively. The angle of internal friction, the sediment gradation with respect to D
50/D
90 and the Manning roughness factor were kept constant in all models: friction angle = 30°; D
50 = 0.3 mm; D
90 = 0.5 mm; Manning = 0.02. Only one type of sand material was applied to the topography. Therefore, the effects of different surface roughness, additional strength through vegetation or construction elements (e.g., dikes in the second protection line) or the effects of the determined weak soil layer at the base of the dunes were unattended.
5. Discussion
5.1. Research Dune
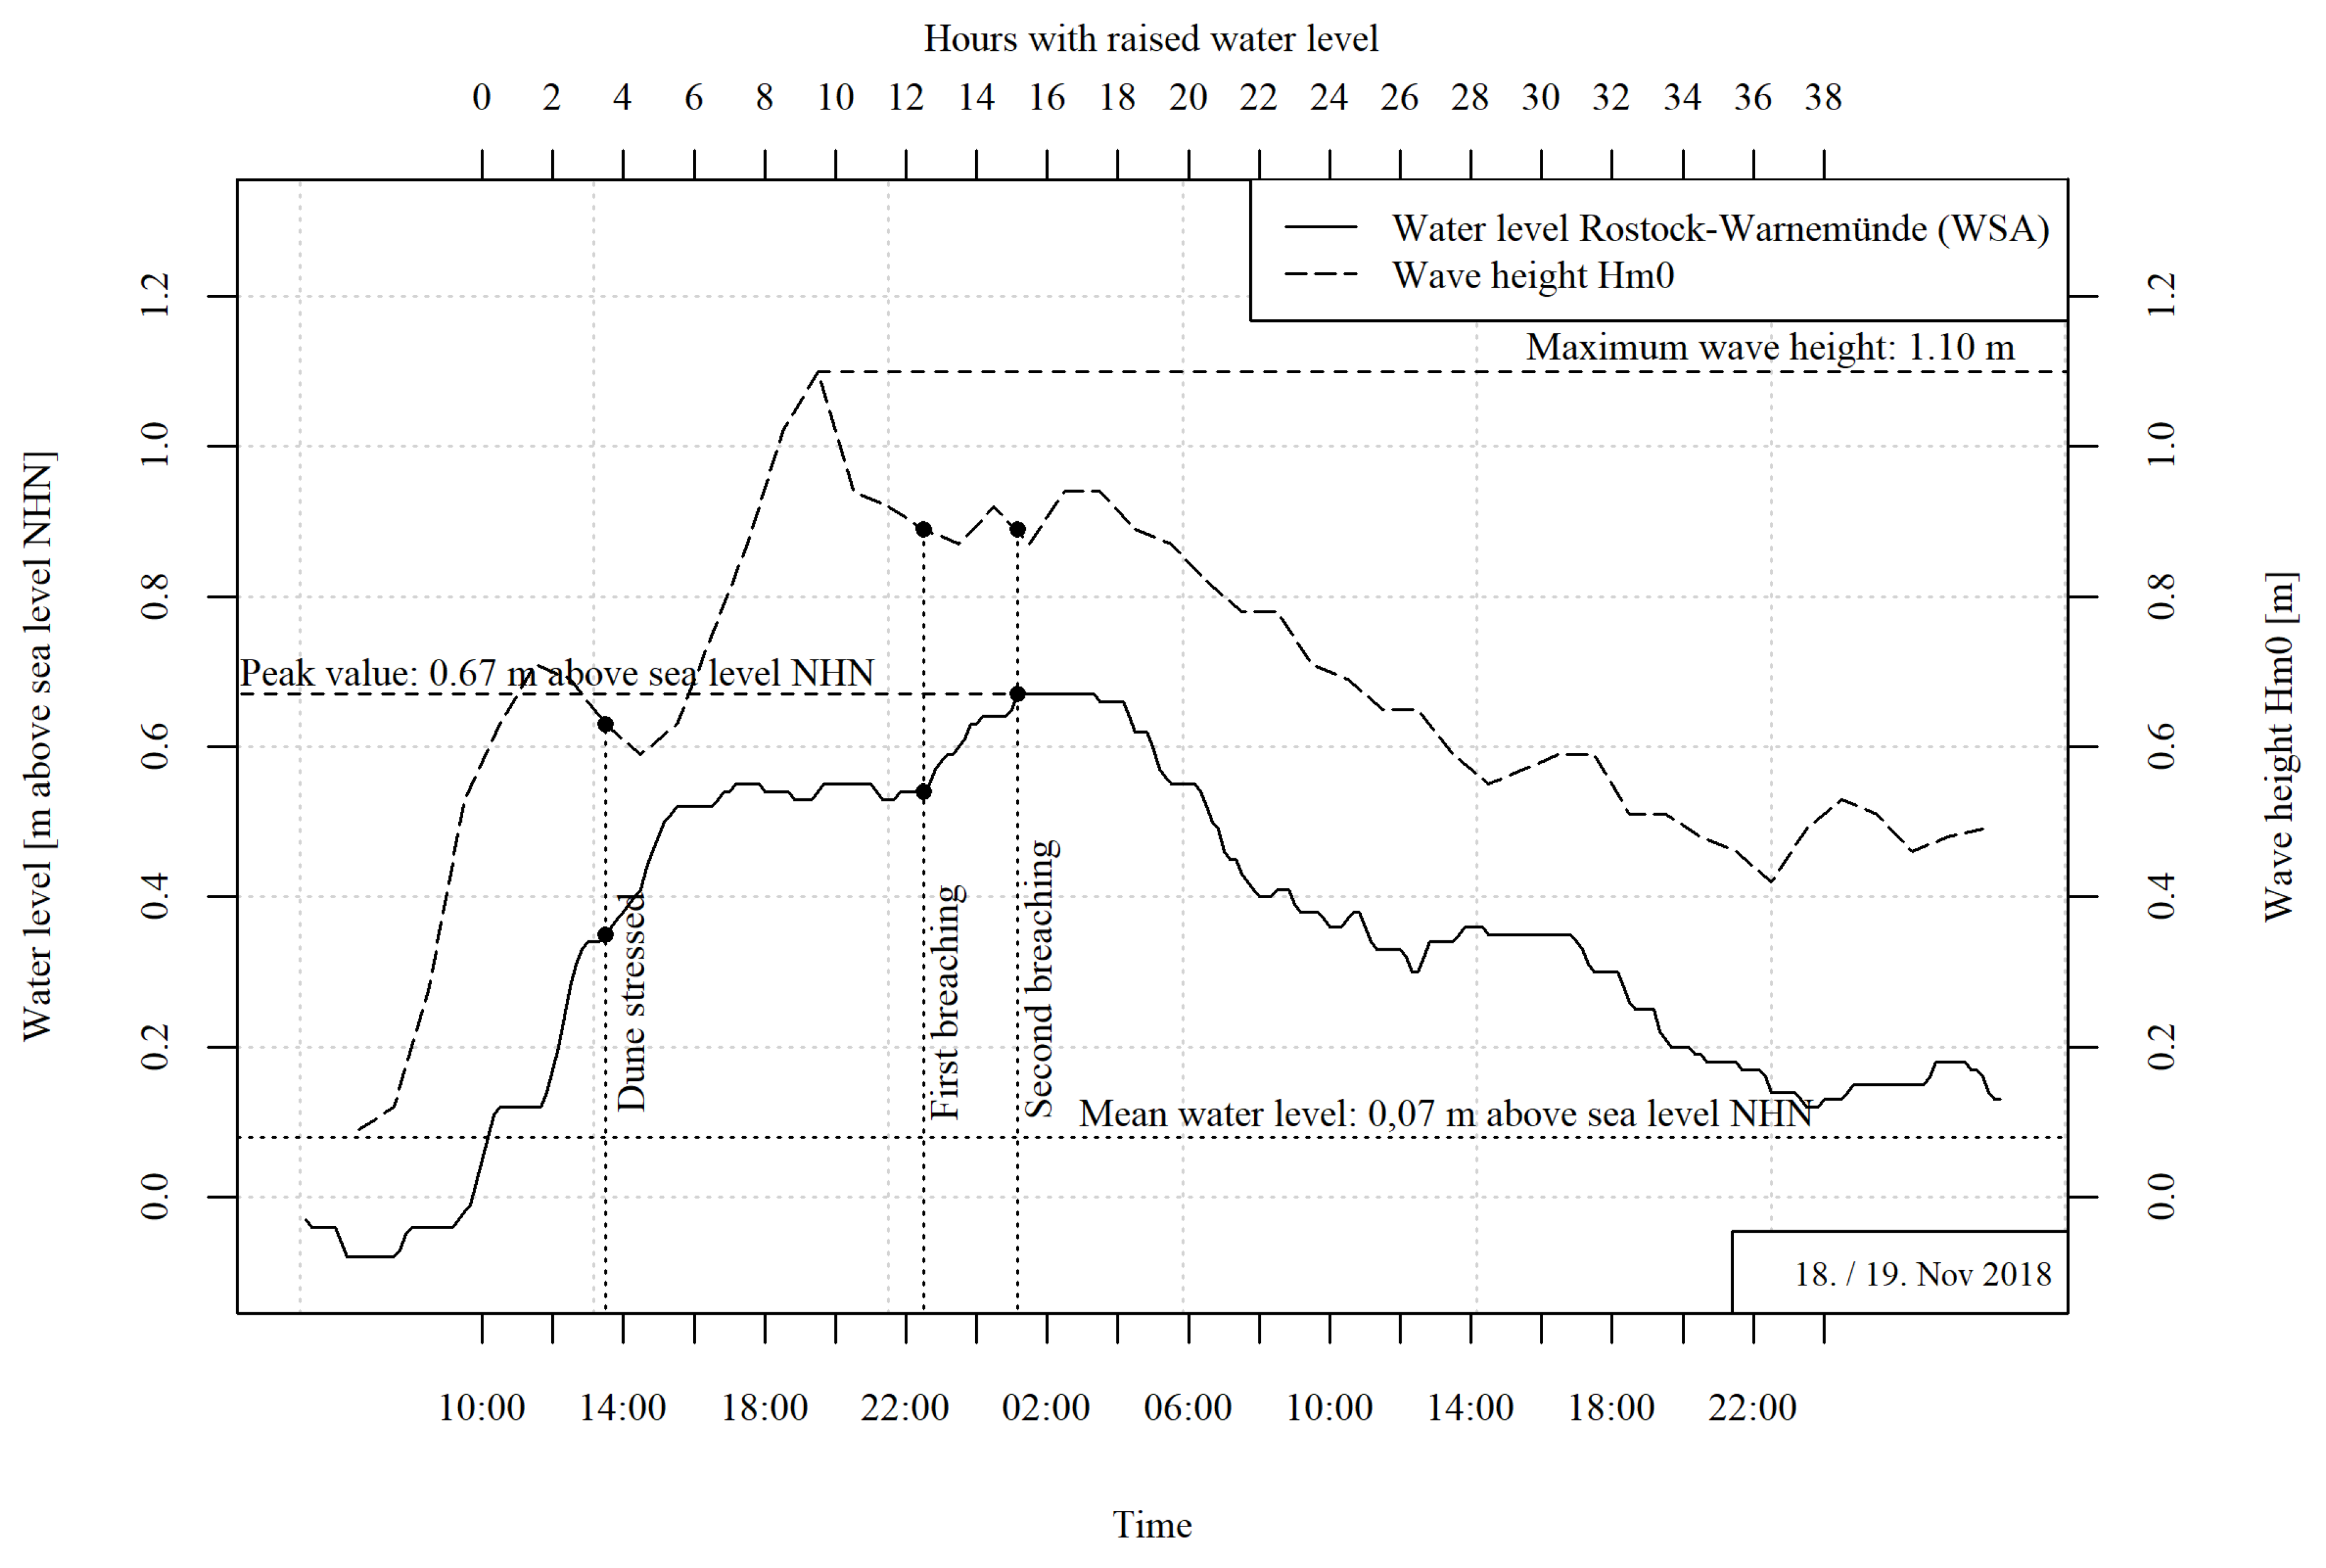
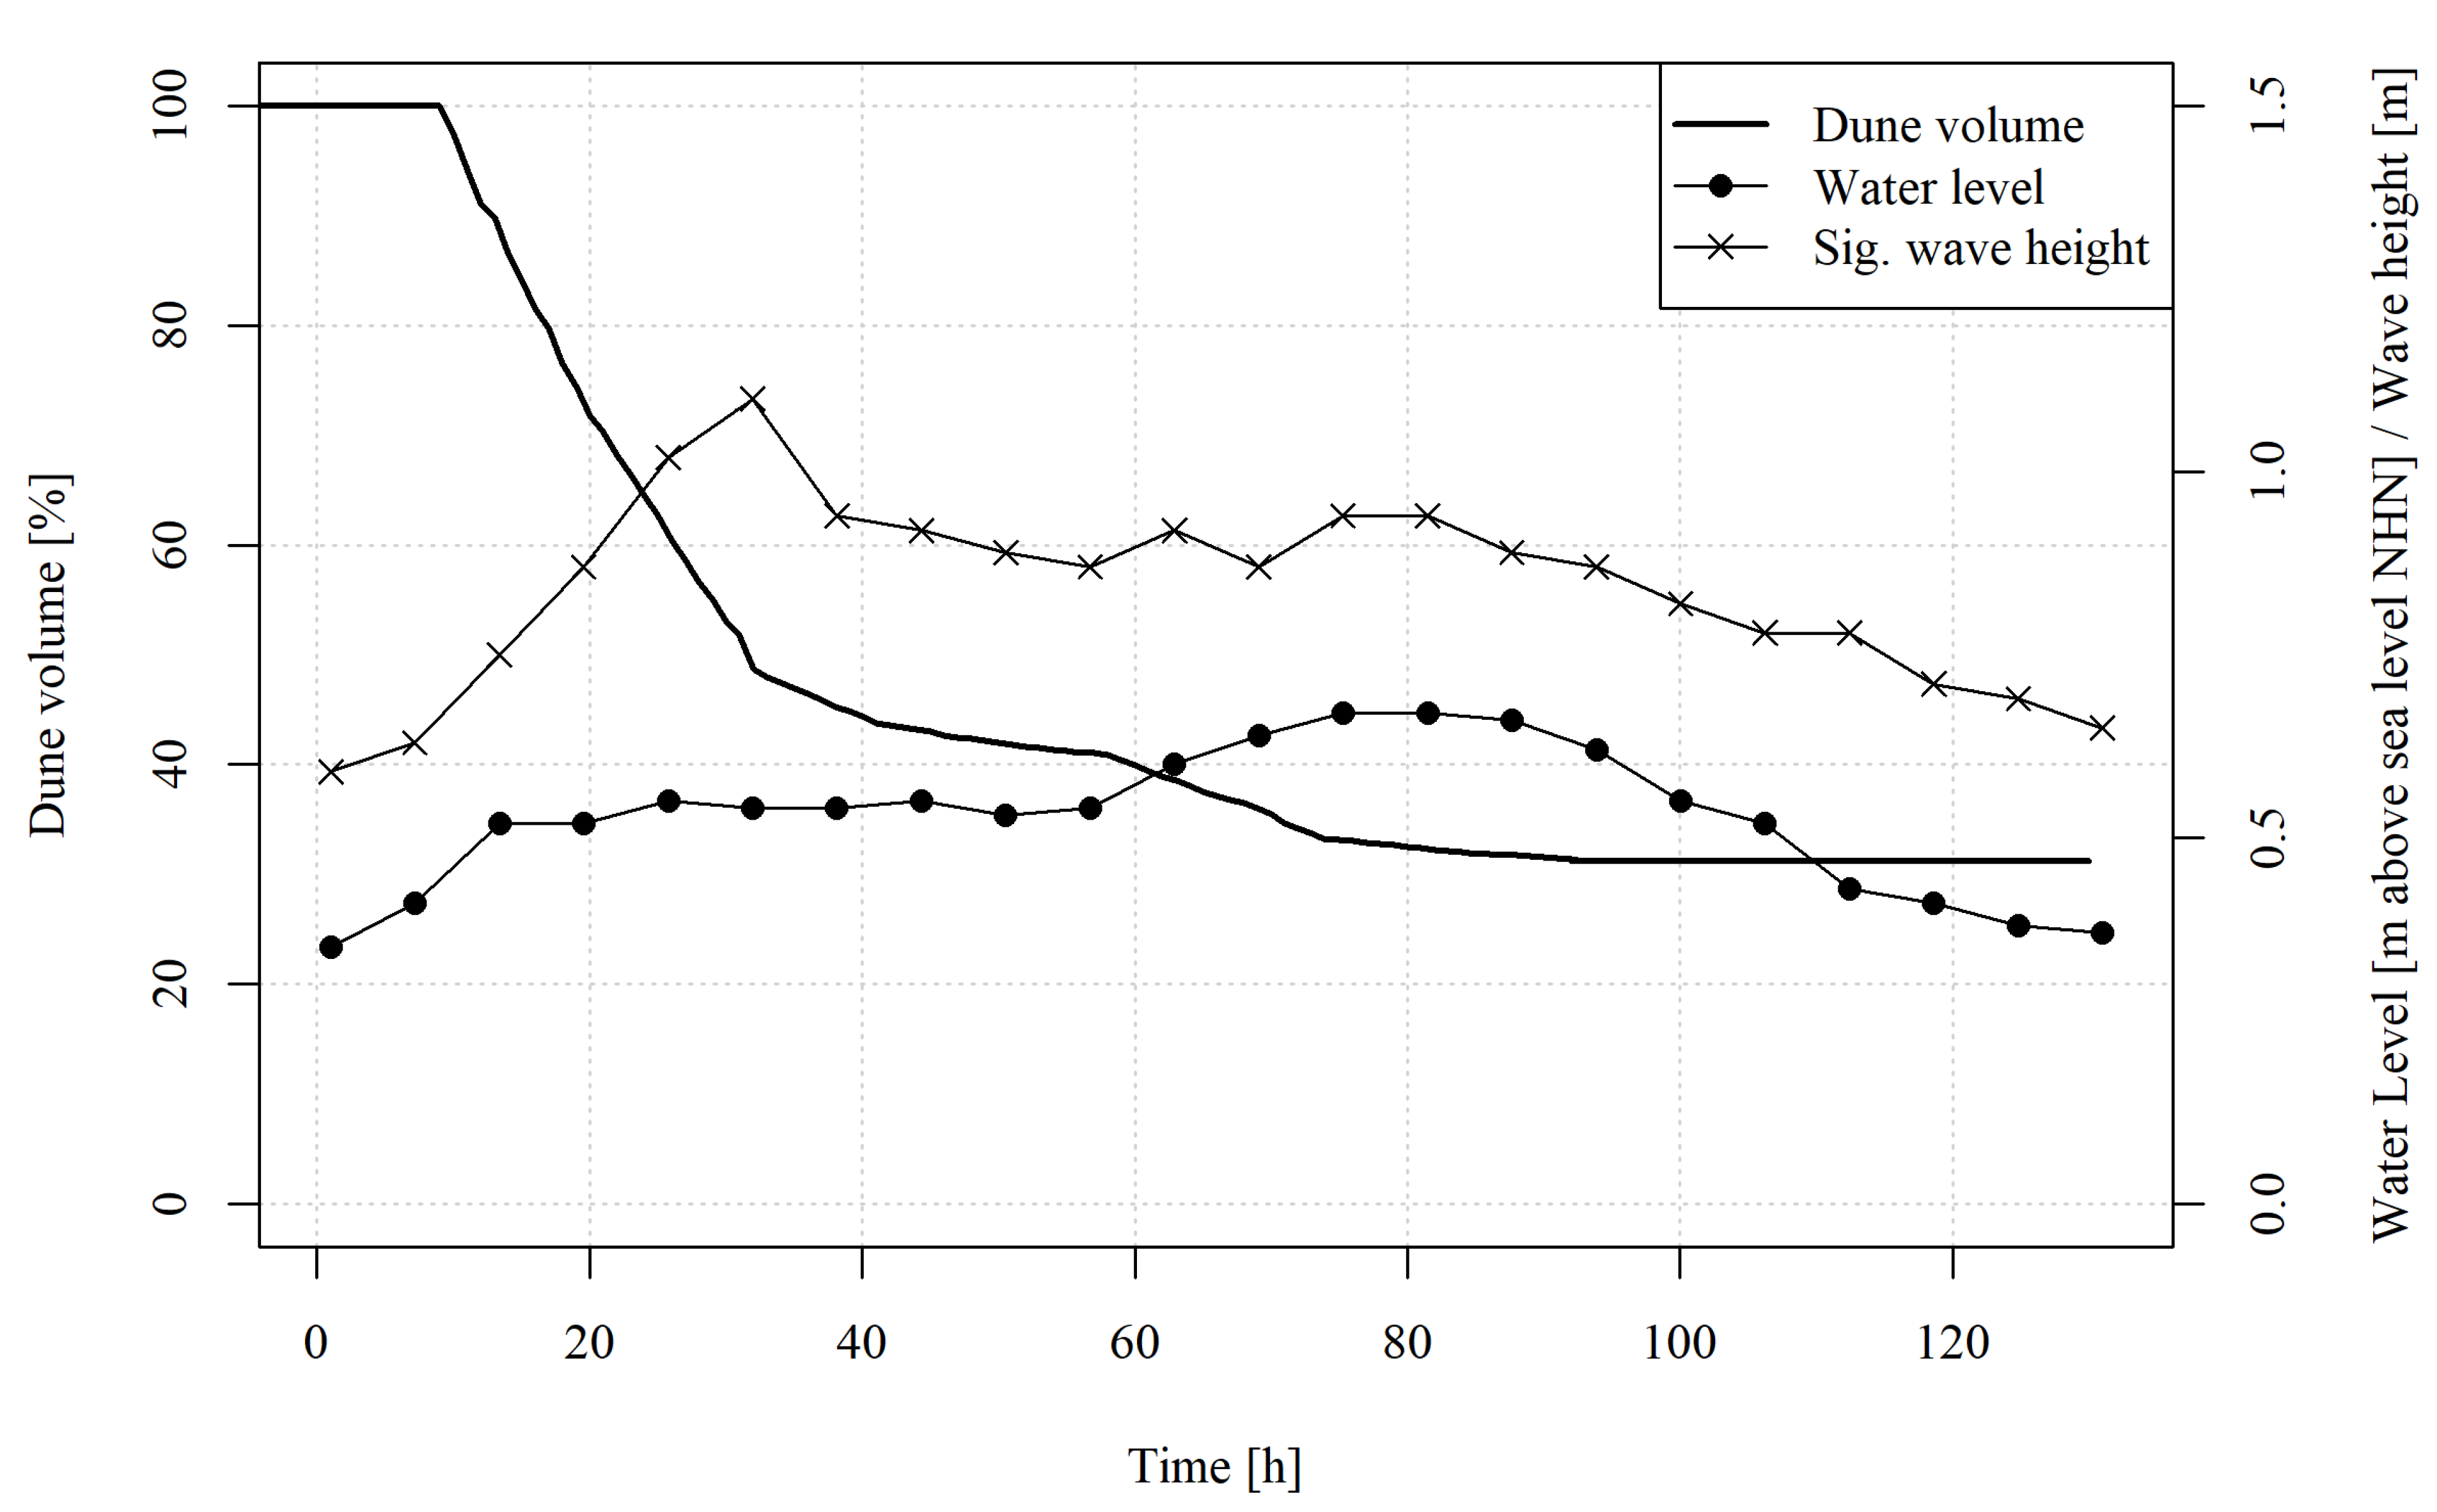
Comparing the results of the measured data from the physical experiment with the numerical model shows that the erosion and breach formation can be reproduced relatively accurately in XBeach with respect to horizontal spatial dimensions (+/− 5 m). The total amount of erosion simulated was only slightly overestimated by the model by 6%. The model shows larger deviations in the temporal evolution of the dune breaches. In spite of the improvement effort by calibrating different XBeach parameters, the dimension of the time deviations (approximately two hours) from the measured values could not be reduced significantly. In addition, the results are sensitive to selected model parameters and boundary conditions. Depending on the configuration, more than two breaches were formed, or their temporal development was either too fast or too slow. The time resolution of the used hydrograph (water level) and the wave parameters was one hour, reducing the natural variability of both variables. Hydrographs with a higher time resolution may still improve the temporal evolution of the breaches; this has not been investigated in the study. Furthermore, existing groins were not integrated into the model for technical reasons. Especially for a spatially limited event with comparatively low water levels (peak = 0.67 m above sea level NHN) and small waves (Hm
0max = 1.10 m), an influence of the hydrometric conditions by the groins is rather likely. During the investigations on the research dune, a strong influence of the nearshore bathymetry on erosion was detected. A high-resolution and up-to-date bathymetry significantly improves the model results [
38].
The research dune was unvegetated and consisted of uniform sand with the D50 and D90 values very close to the medium values used in the model, which may explain the particularly good fit between measurements and modelled geometry data. On the other side, the time shift would be important, e.g., for emergency warning purposes. However, for the dimensioning of coastal protection dunes, the location and size of a potential breach are much more relevant than the exact moment of breach initiation.
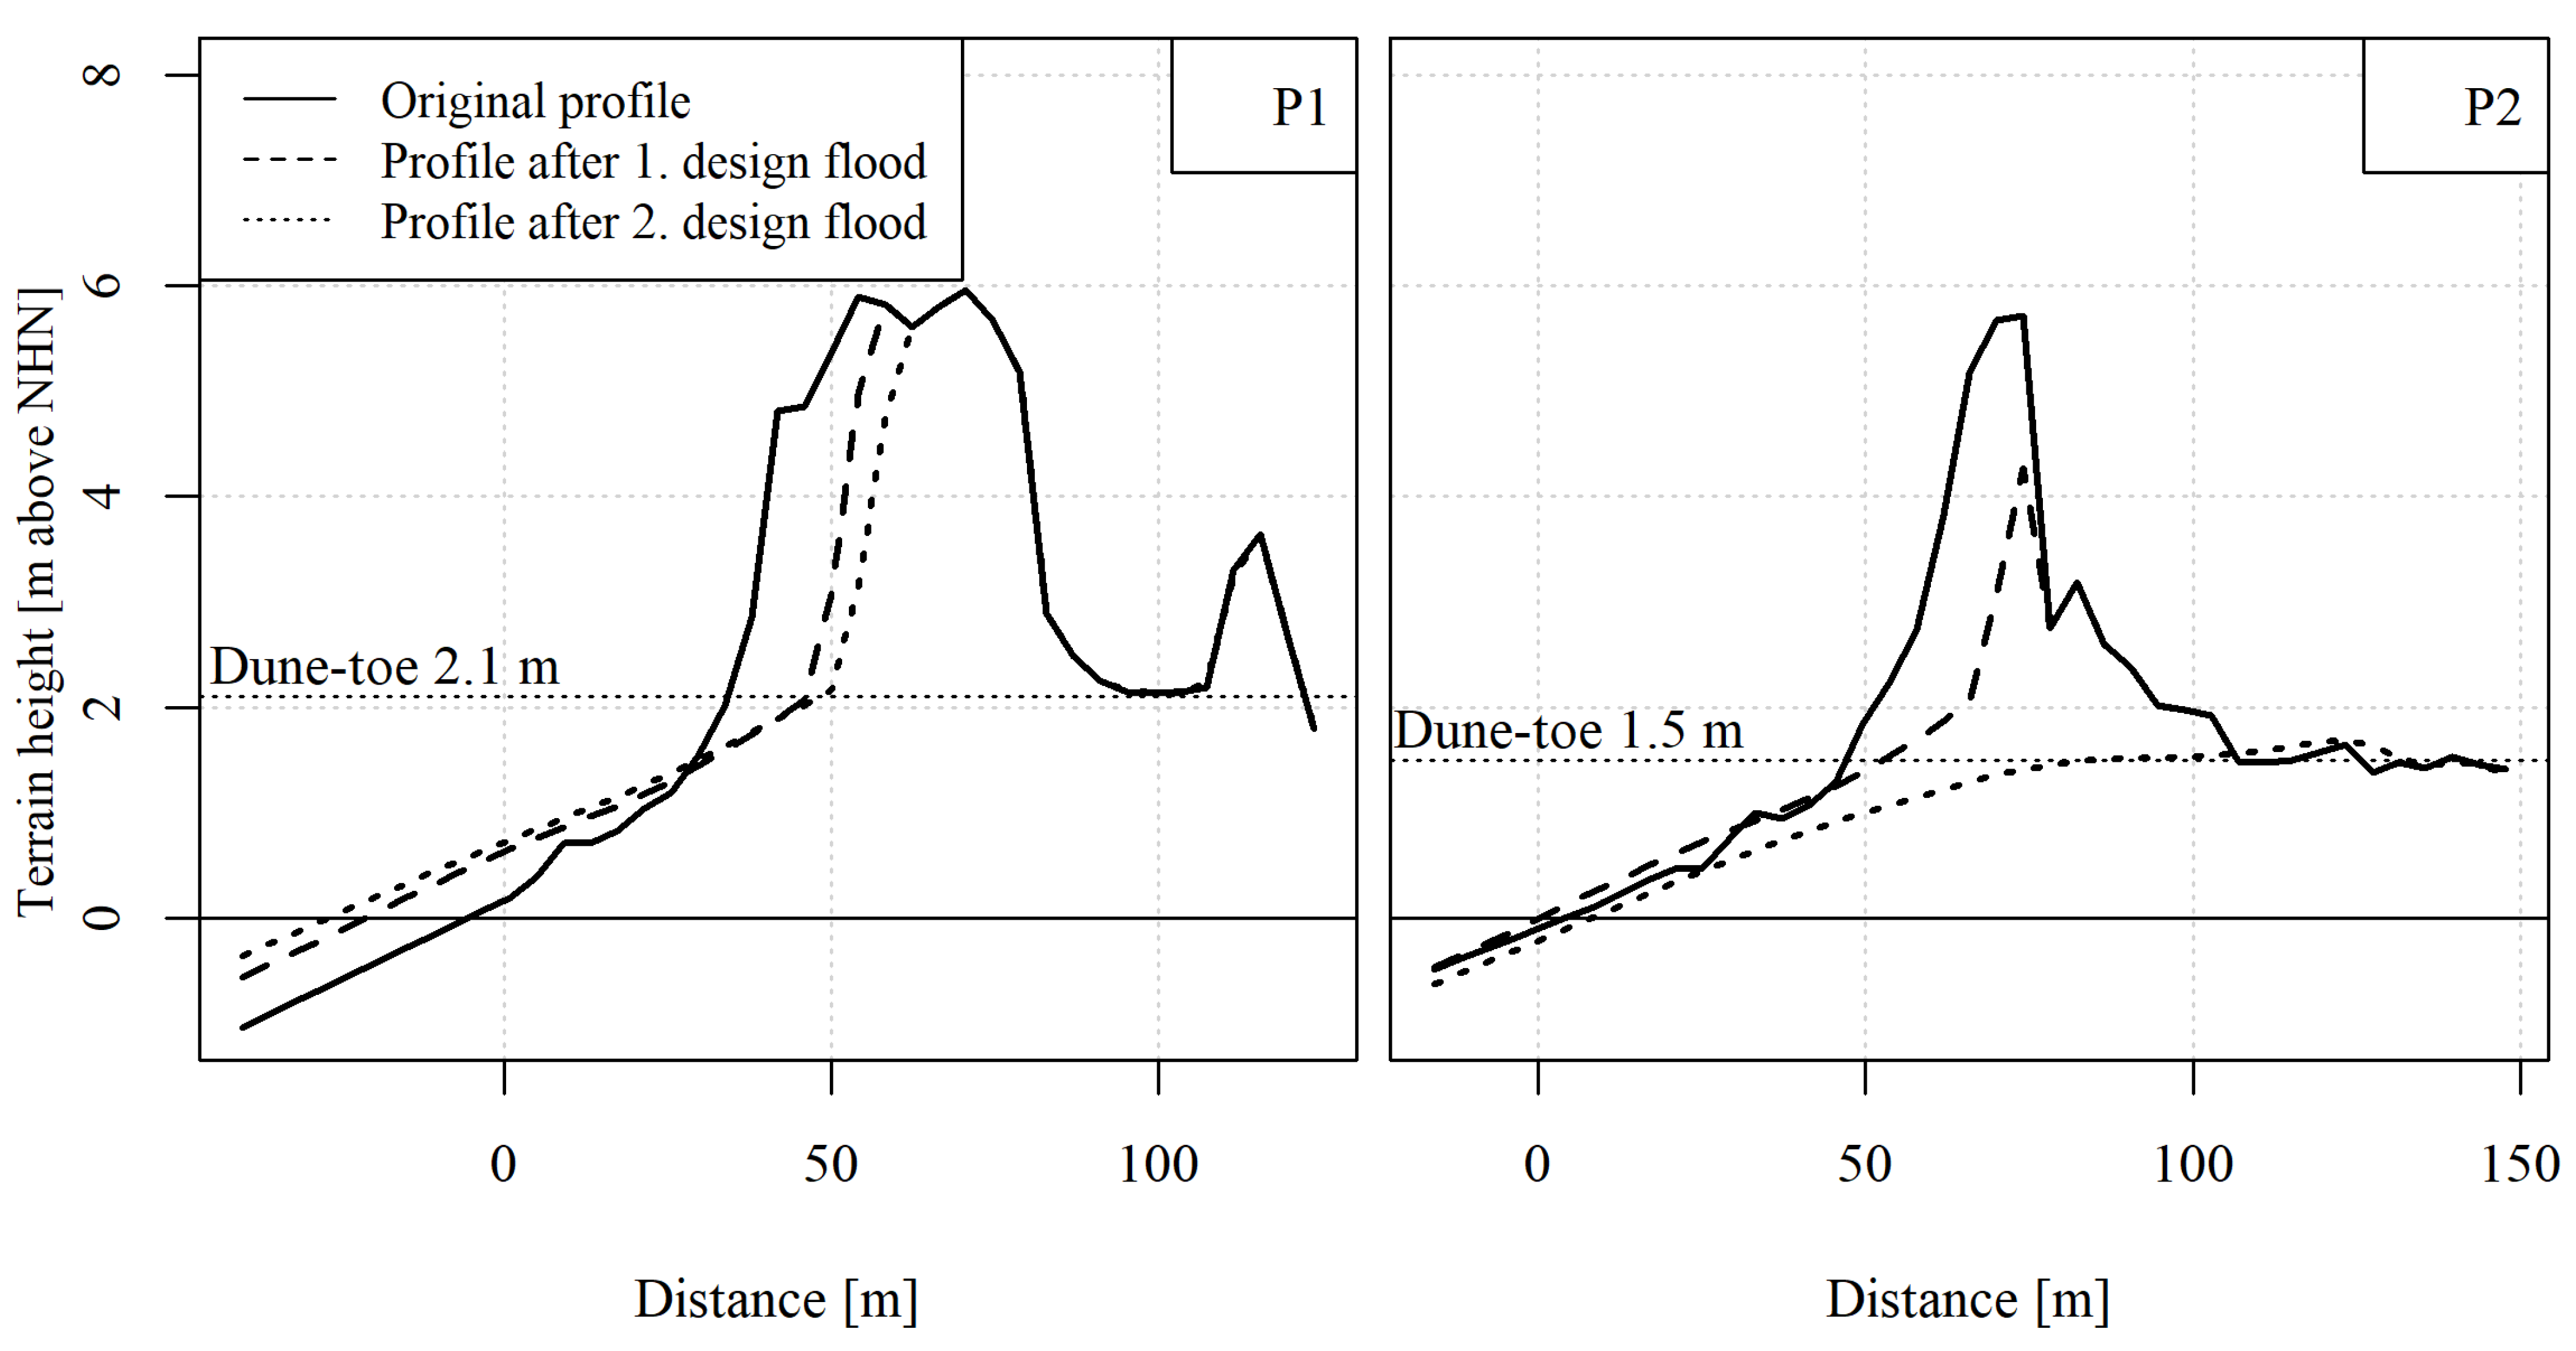
5.2. Modelling of the Design Flood Event for the Ahrenshoop Study Area
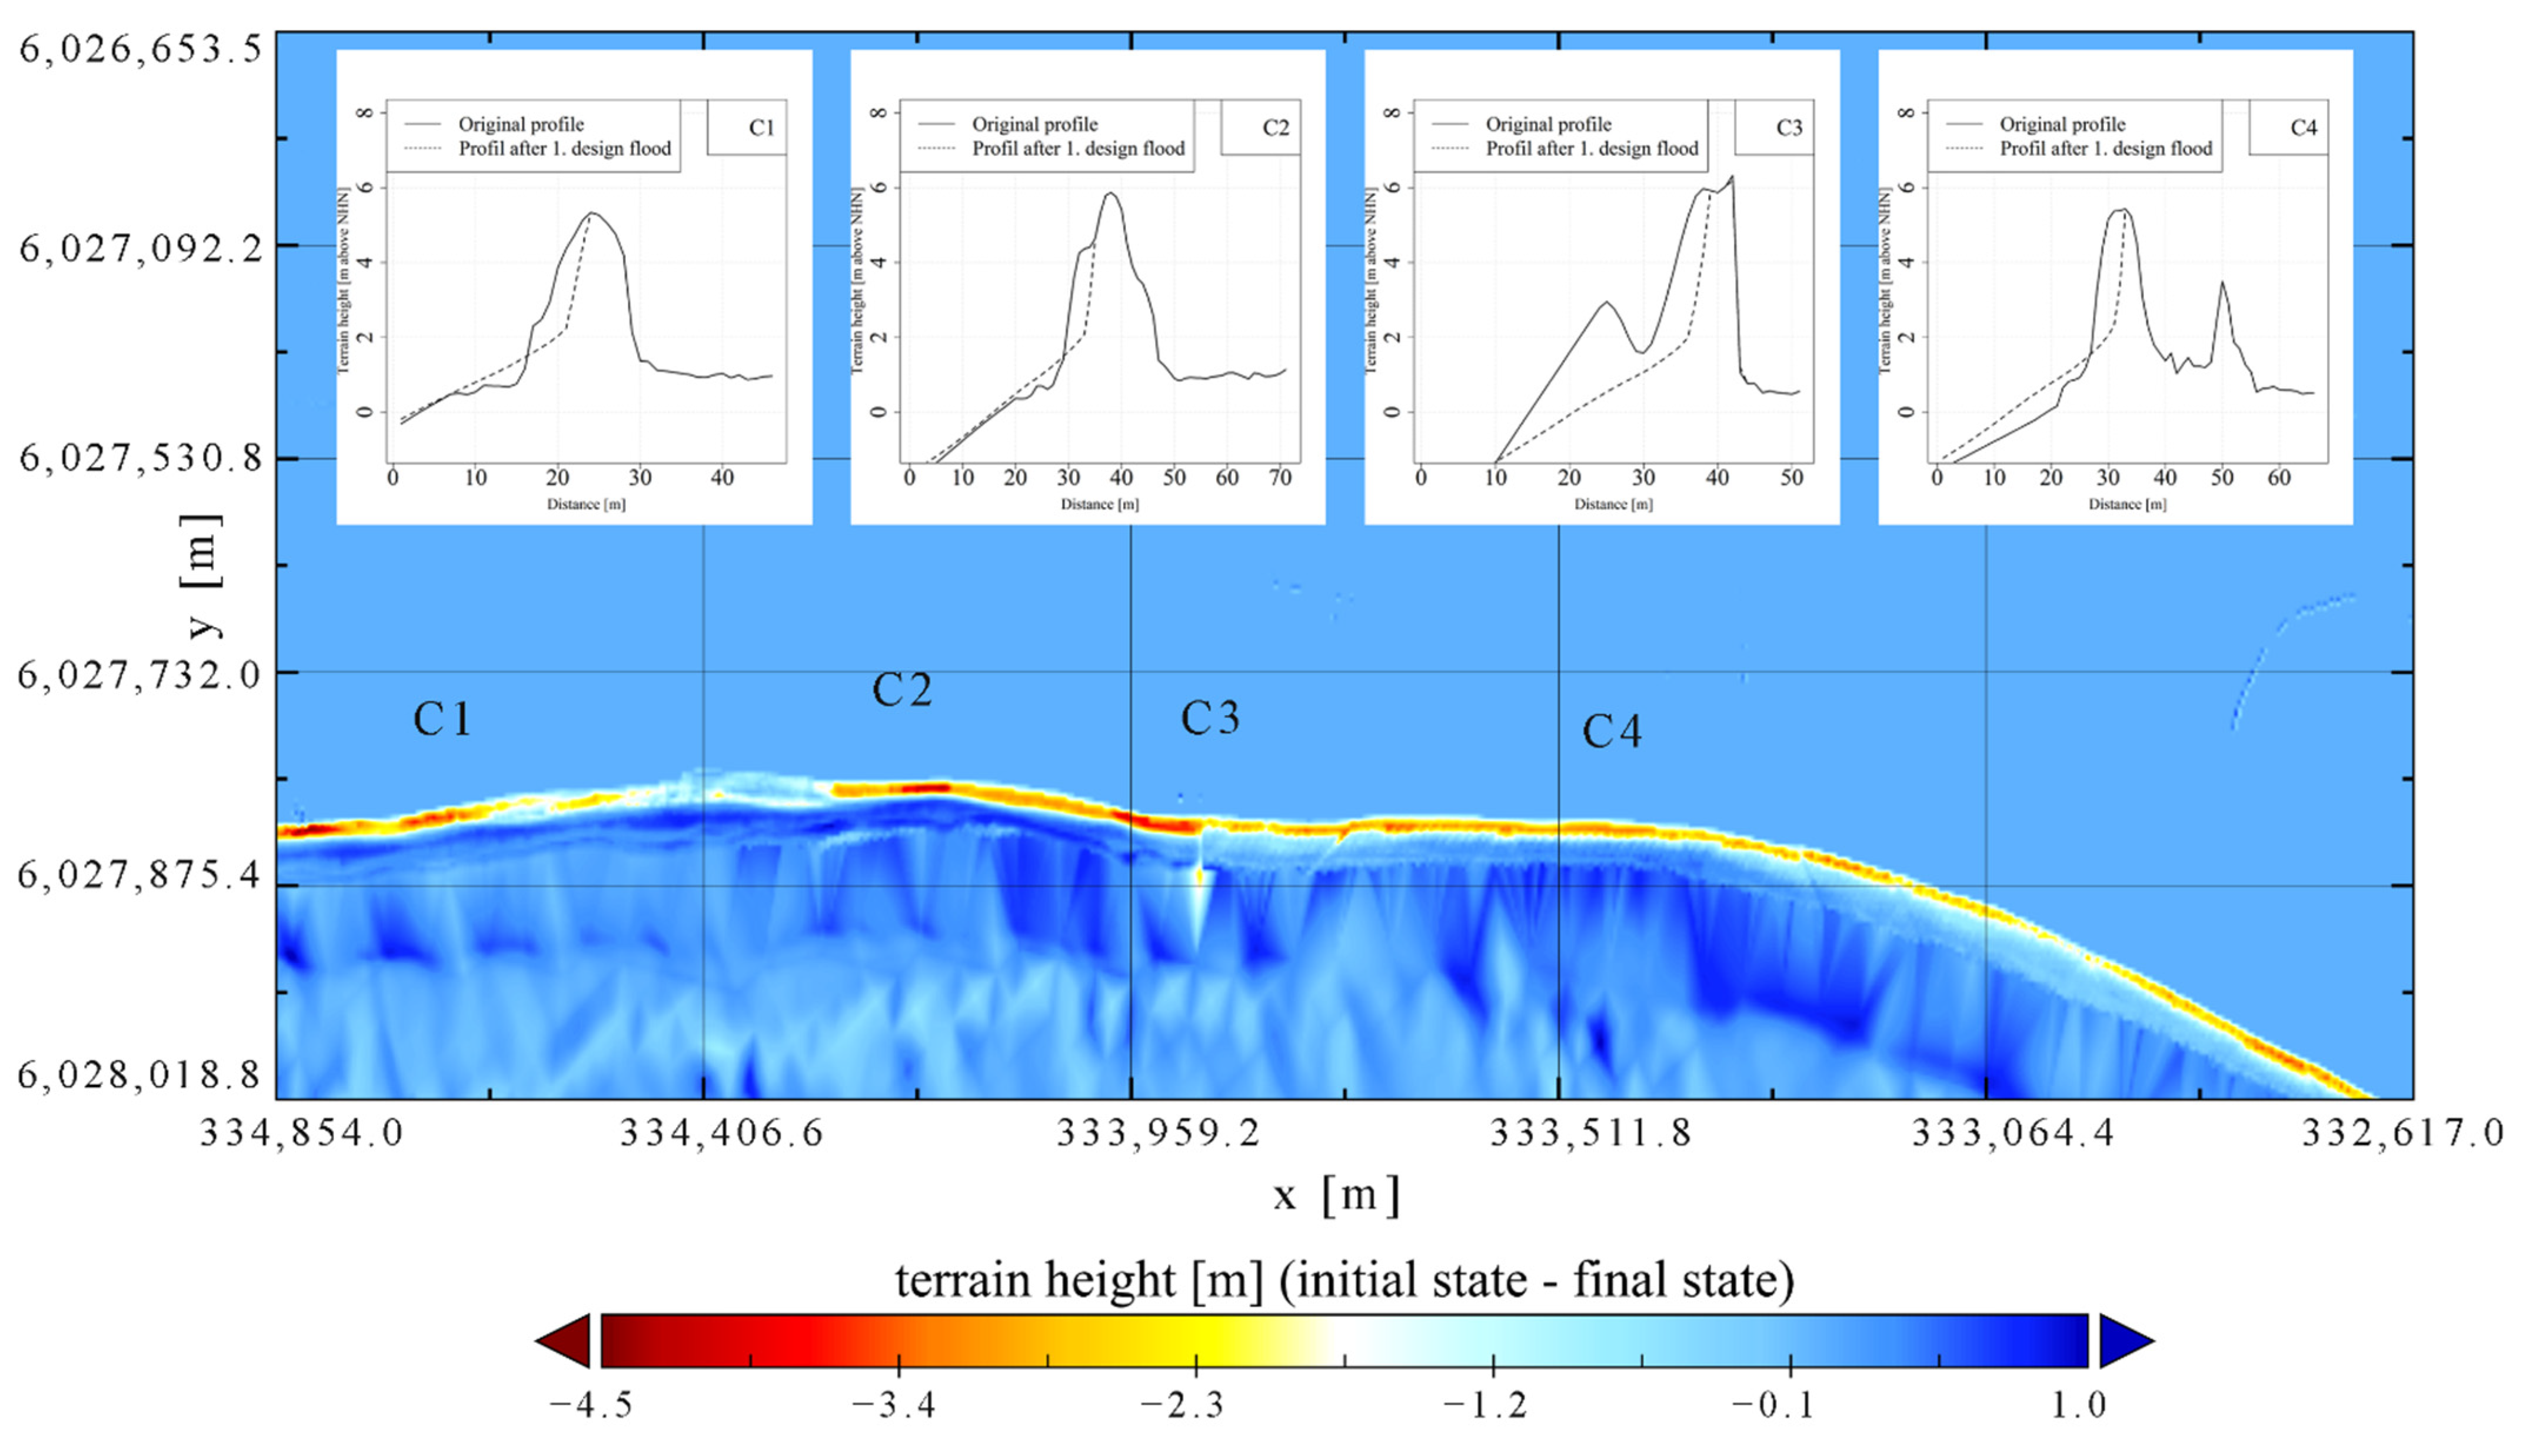
Based on the simulation results, it can be concluded that the dunes in the study area Ahrenshoop withstand the design storm surges when newly nourished and intact. The dune in Ahrenshoop theoretically fails after a second simulated loading with a design flood event. These model results cannot be verified with measured data in the study areas because a design flood with a return period of 200 years has not occurred since at least 1872, and there are no such nature measurements.
The investigations at the research dune and in the study area Hütelmoor demonstrated a significant influence of the bathymetry data on the model accuracy regarding dune erosion and breach evolution during storm surges with lower peak values. Since there is no current high-resolution bathymetry data available for the Ahrenshoop area, an out-dated data set with comparably low resolution had to be used (approximately 20 years old, spatial resolution dx = dy = 50 m). However, there is still not sufficient information about the relevance of the bathymetry regarding the accuracy of sediment relocation and dune erosion for high peak values in the range of the design flood event (peak water level 2.3 m or more). The influence of the bathymetry may actually decrease for higher water levels, particularly in the comparably flat and shallow shorefaces in areas with dune protection systems at the German Baltic coast, which leads to higher water depths on the shore and foreshore. Possibly, the beach surface will be more important in modelling the design of flood events, which is easier to derive on a frequent basis.
Regular surveys in critical dune sections and the associated beach geometries and—if relevant—shallow water bathymetries are recommended. Photogrammetric techniques using UAV technology [
56,
57,
58] offer the possibility to document changes in the coastal zone at a low cost. Up-to-date digital terrain models before and after storm surges allow for accurate verification of the XBeach models. To verify the models, it is advisable also to model storm surges with lower peaks and compare them with existing measured data.
Further uncertainties are included in the hydrodynamic parameters “water level” and “sea state”. The used data from Rostock-Warnemünde is measured as a distance of approximately 35 km. The orientations of the coastlines in Ahrenshoop and Rostock differ significantly. Rostock’s coastline has an east-west orientation, while the coast in Ahrenshoop is oriented from south-west to north-east. The differences in topography can influence the water level and, even more, the local sea-state. In addition to the peak level, the hydrograph volume, the duration of a storm surge and the characteristics of the sea state parameters are critical variables for the loading of coastal protection structures. Simulations with different hydrographs (e.g., the method of MacPherson et al. [
59]) can improve the understanding of dune erosion and breach formation during design storm surges and should be applied in further studies. In general, the hydrodynamic parameters should be measured in the vicinity of the modelled site to reflect local conditions during a storm surge with sufficient accuracy. There is, of course, a certain financial restriction when it comes to measuring hydrodynamic parameters along a diverse coastline such as that in Mecklenburg-Vorpommern.
Further improvements could be achieved by integrating different values for the parameter terrain roughness, depending on the real terrain surface in the study area (instead of defining only one roughness for the whole area). Coastal protection dunes at the Baltic Sea are usually planted (ammophila
arenaria) to protect them against wind erosion and to make the sediment at least a bit more resistant to erosion during storm surges through root penetration. The increased resistance from vegetation is often considered an increased bed friction coefficient in numerical models [
60,
61]. In addition, the consideration of more accurate grain size distribution data in the modelling may improve the simulation quality, as discussed in [
62,
63].
5.3. Modelling of “Zeetje” for the Ahrenshoop Study Area
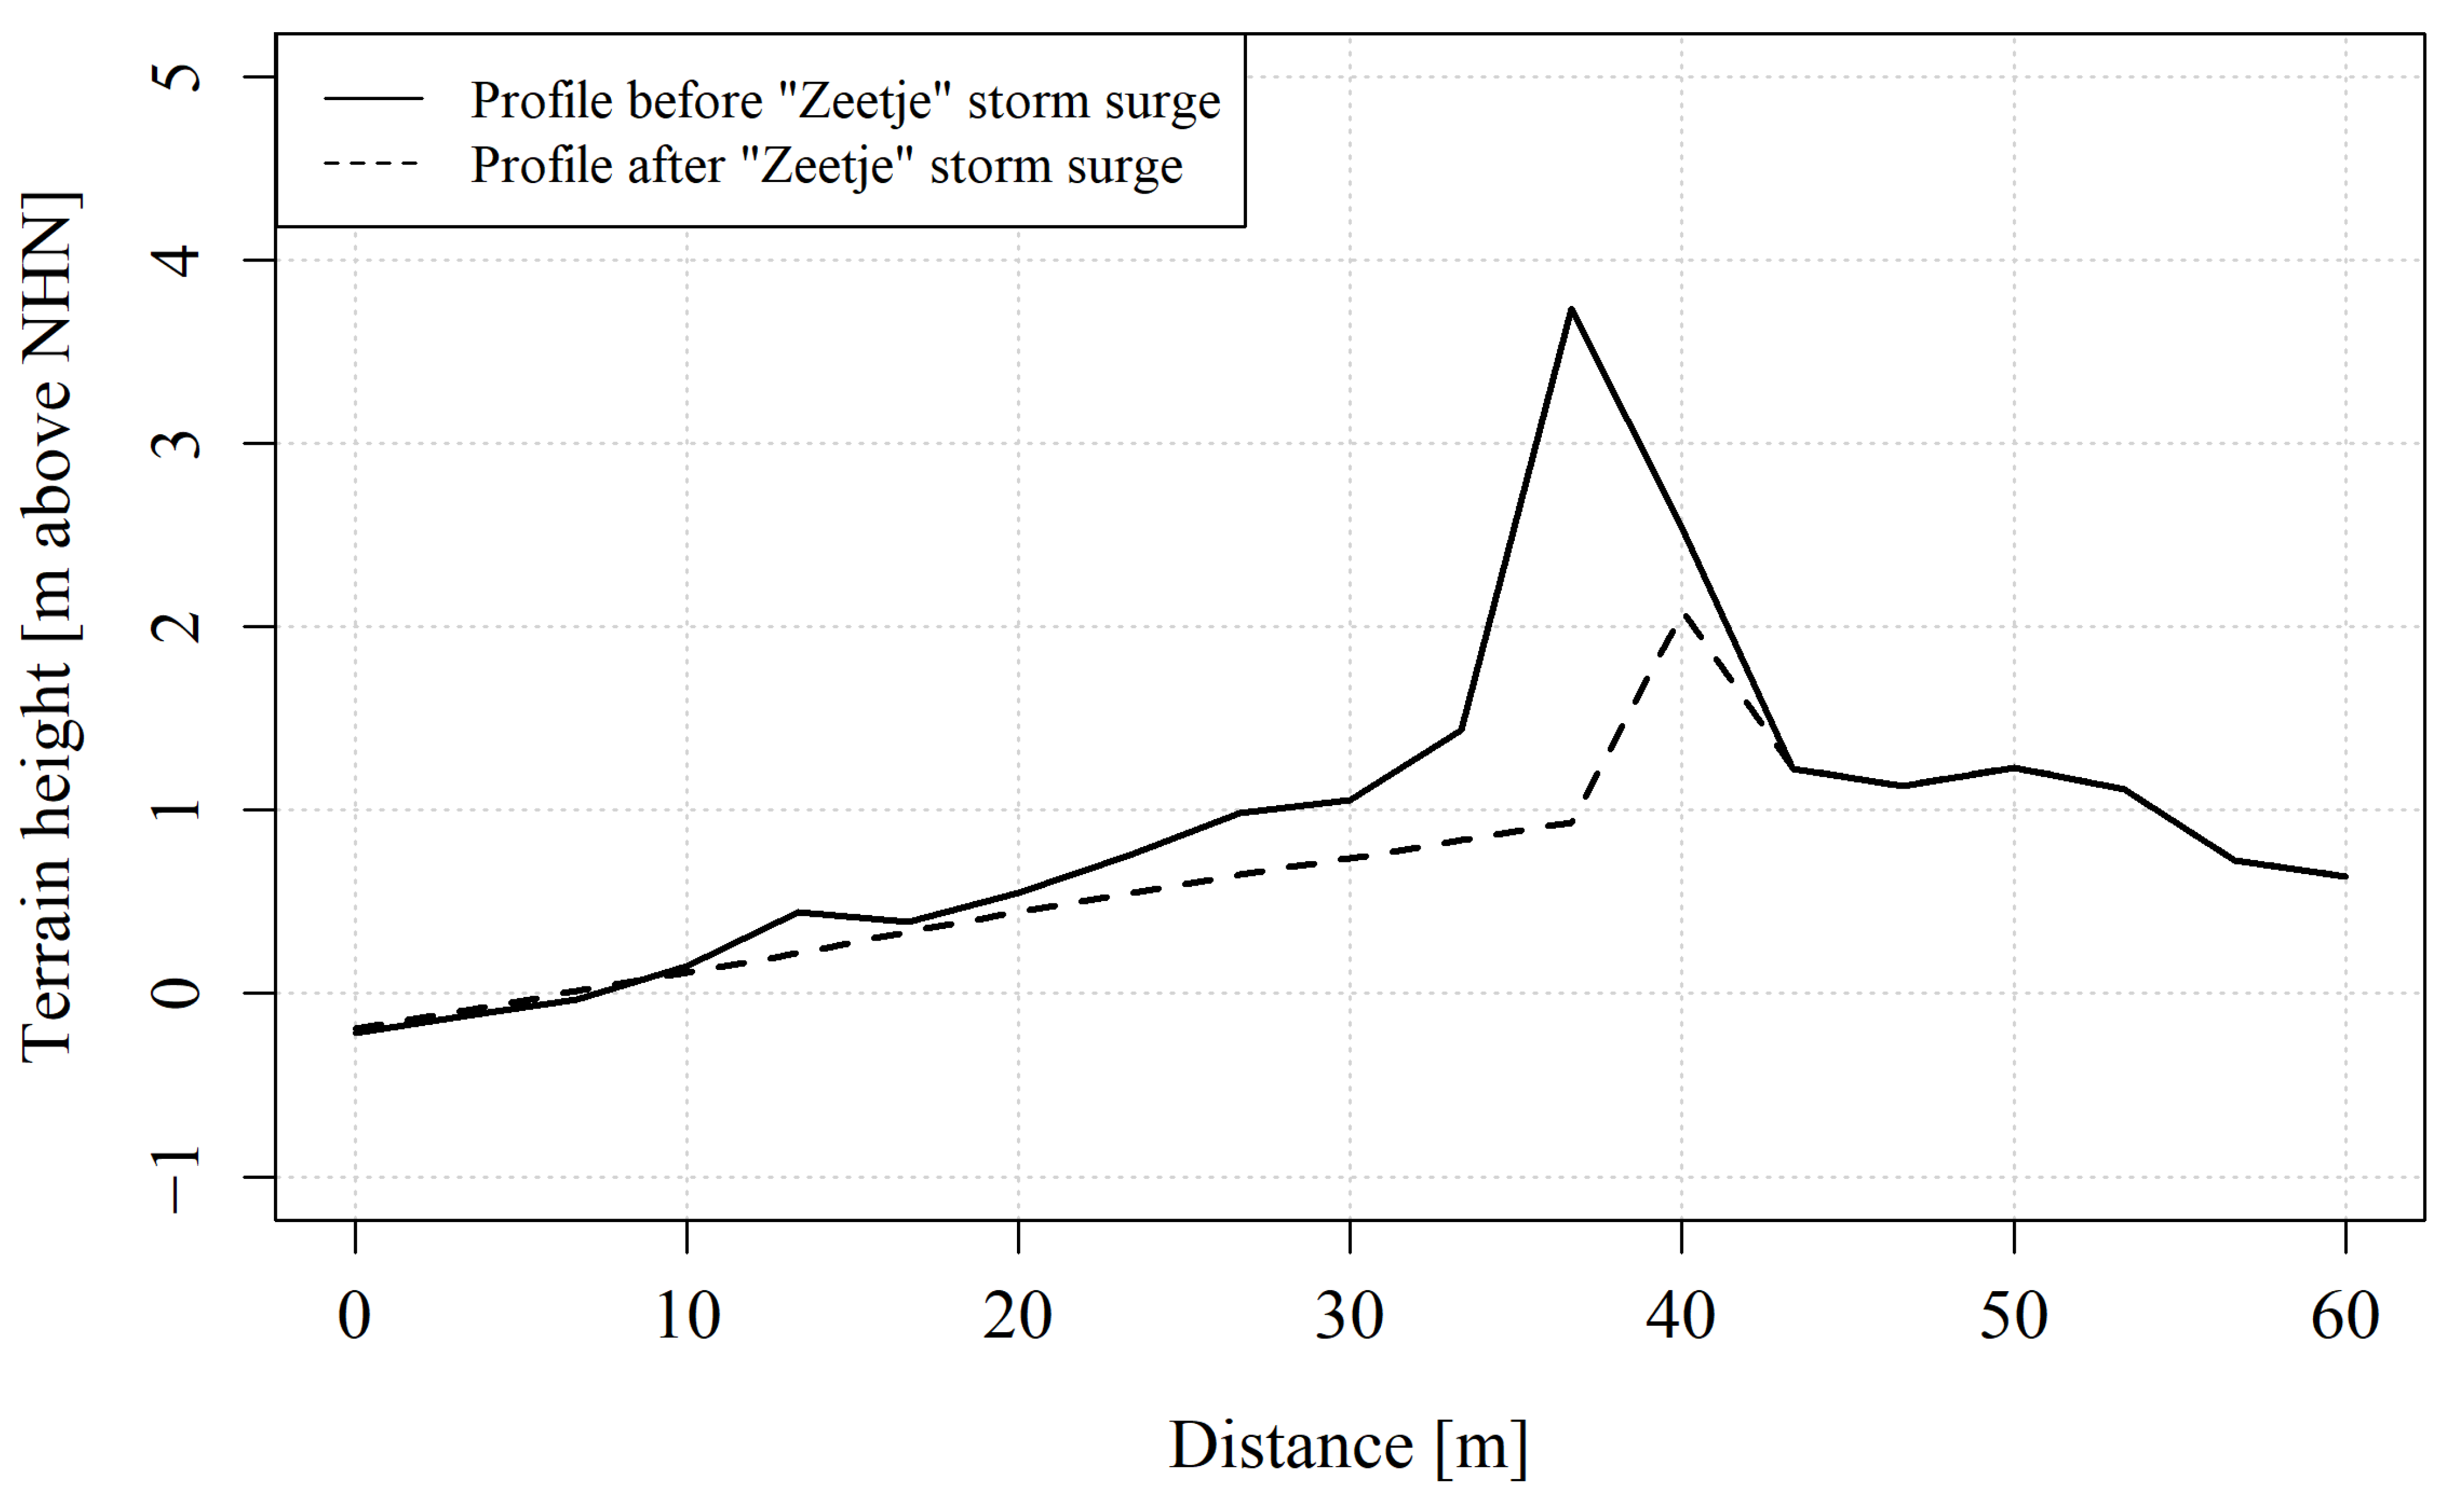
The XBeach model set up for this study could reproduce the “Zeetje” storm surge-induced erosion in the investigated dune section in Ahrenshoop with sufficient accuracy. Although calibration of the model parameters could slightly improve the results, the erosion volume was clearly underestimated by the model. The simulation of the erosion of the research dune and the dune in the Hütelmoor has shown that, with accurate hydrodynamic and bathymetry data, good agreements between model and reality can be achieved. In Ahrenshoop, the out-dated, low-resolution BSH bathymetry and the hydrodynamic parameters from Rostock-Warnemünde were used due to a lack of alternatives (see above). The low agreement is most probably due to the poor quality of the boundary conditions used. In addition, the bathymetry is supposed to be more important for a storm surge far below the design flood, such as the “Zeetje” event. Further investigations with up-to-date topographic data and locally measured hydrodynamic parameters should be undertaken.
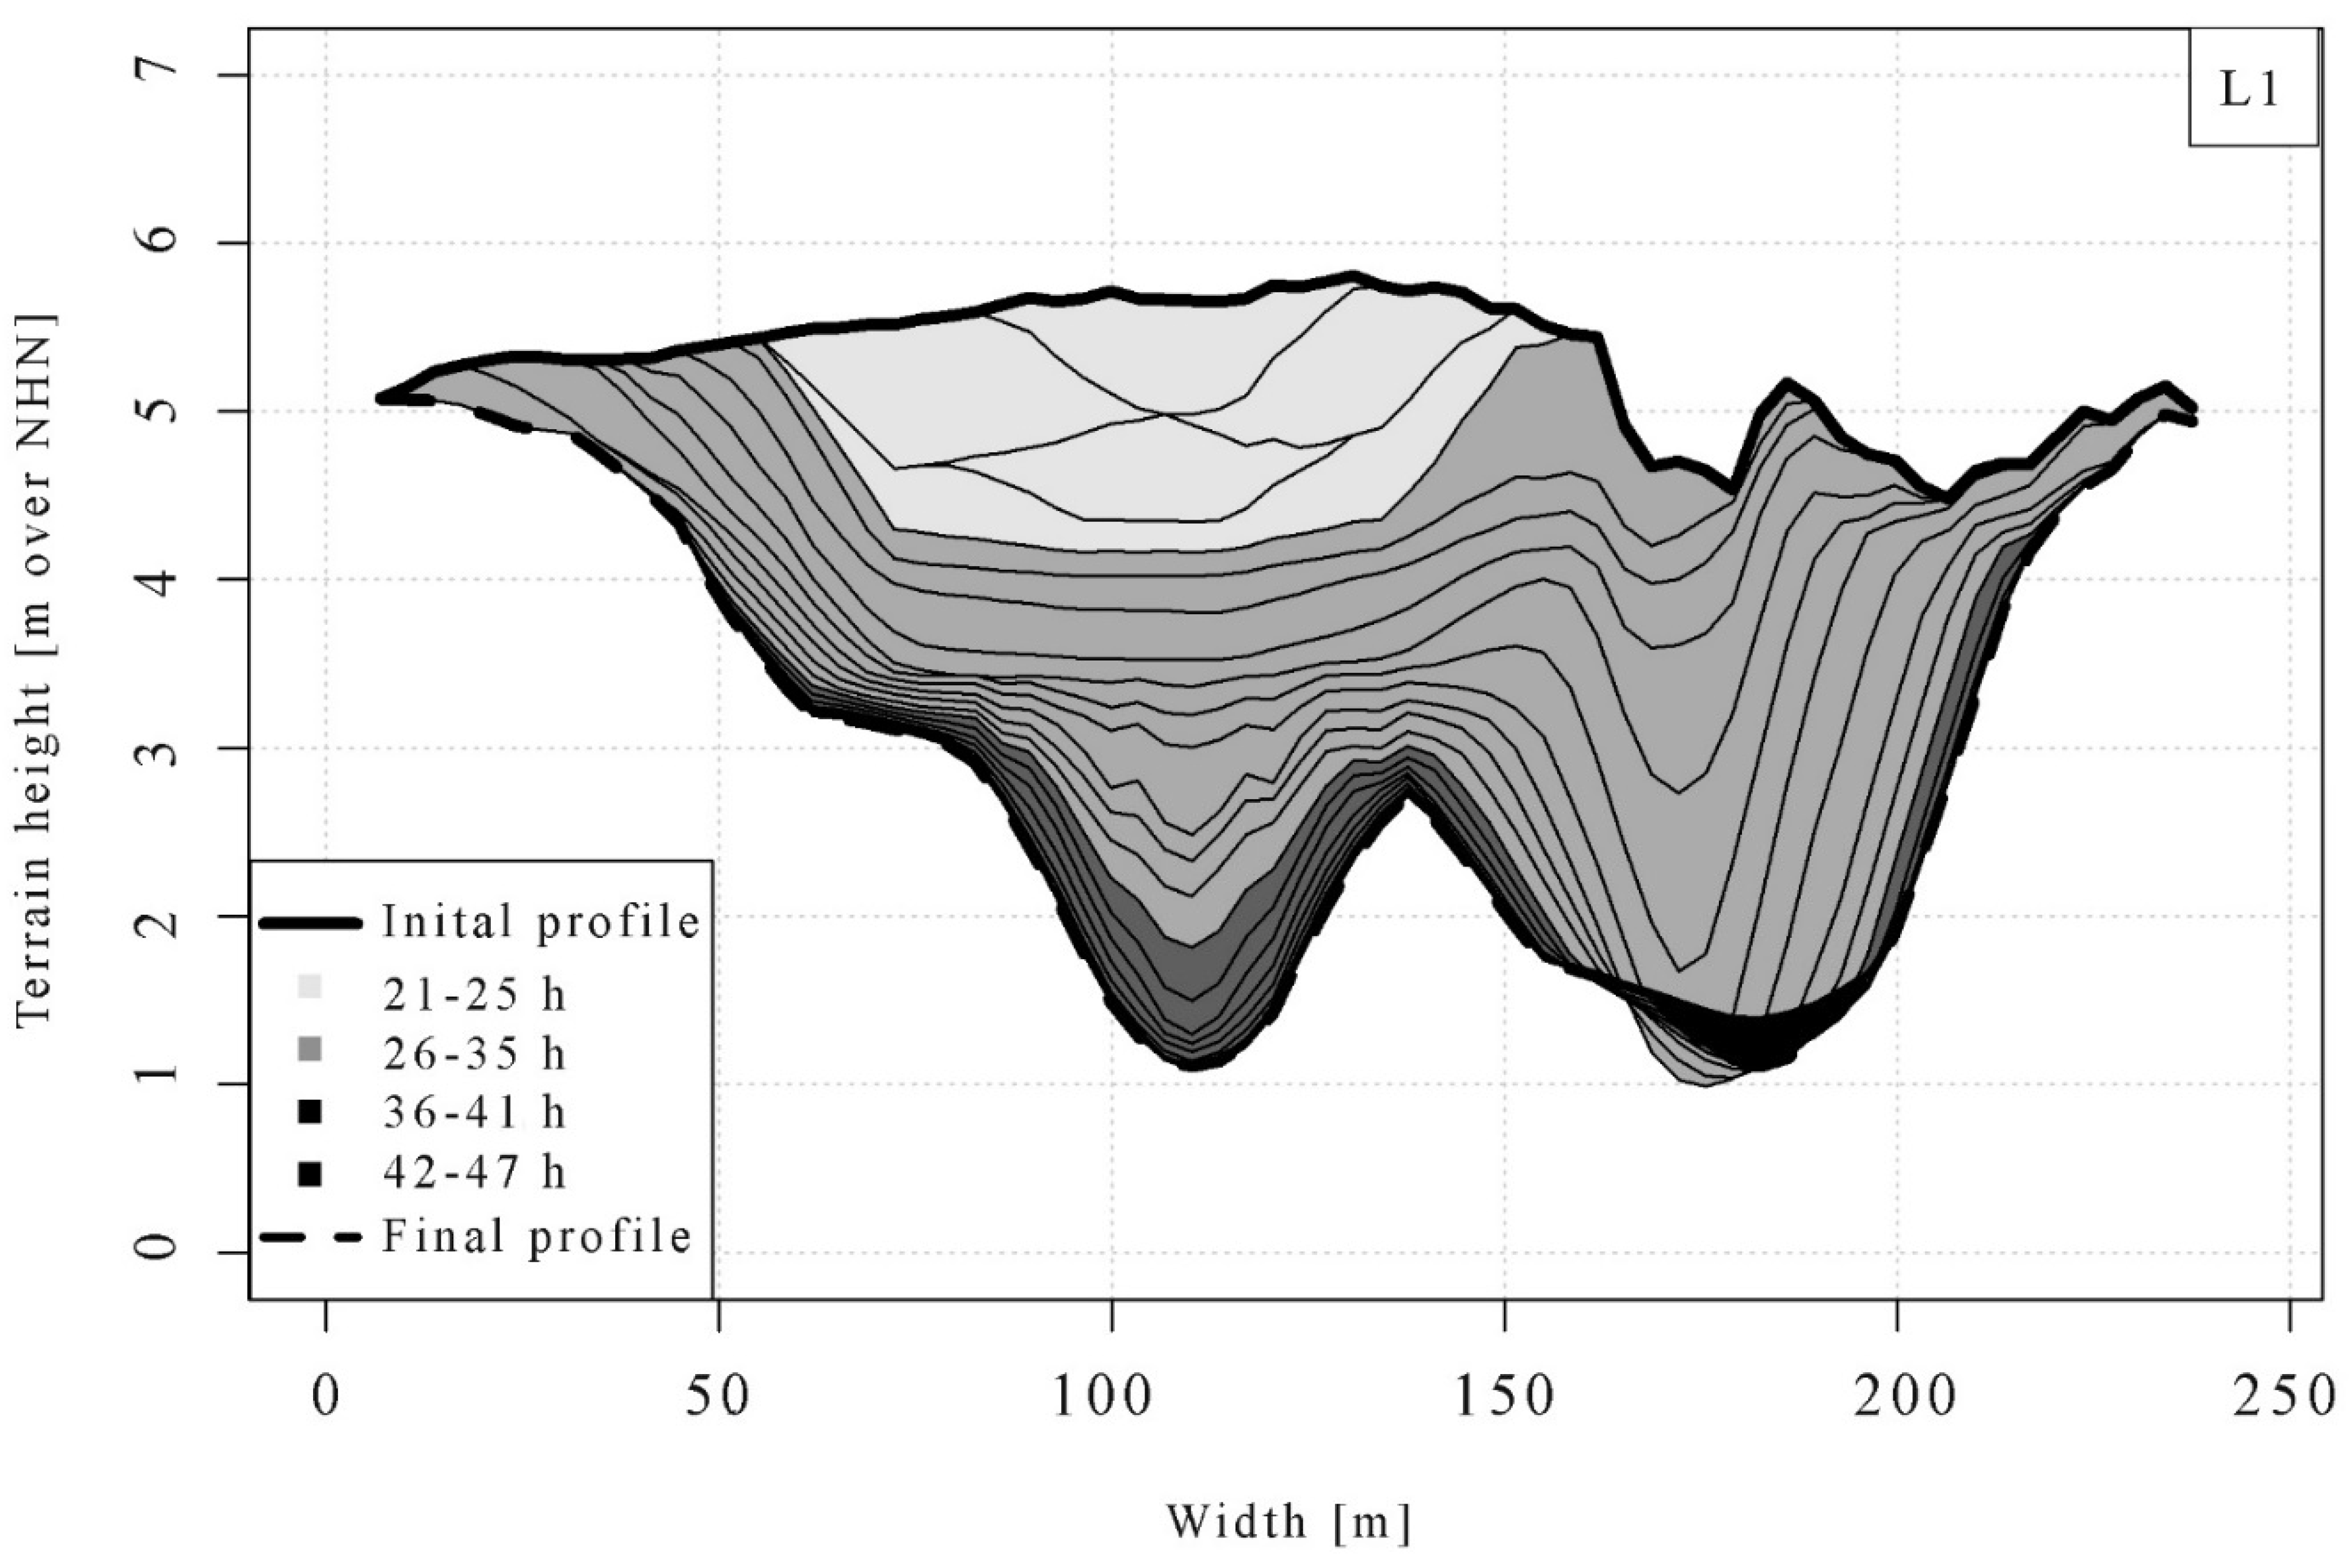
5.4. Modelling of “Zeetje” for the Hütelmoor Dune
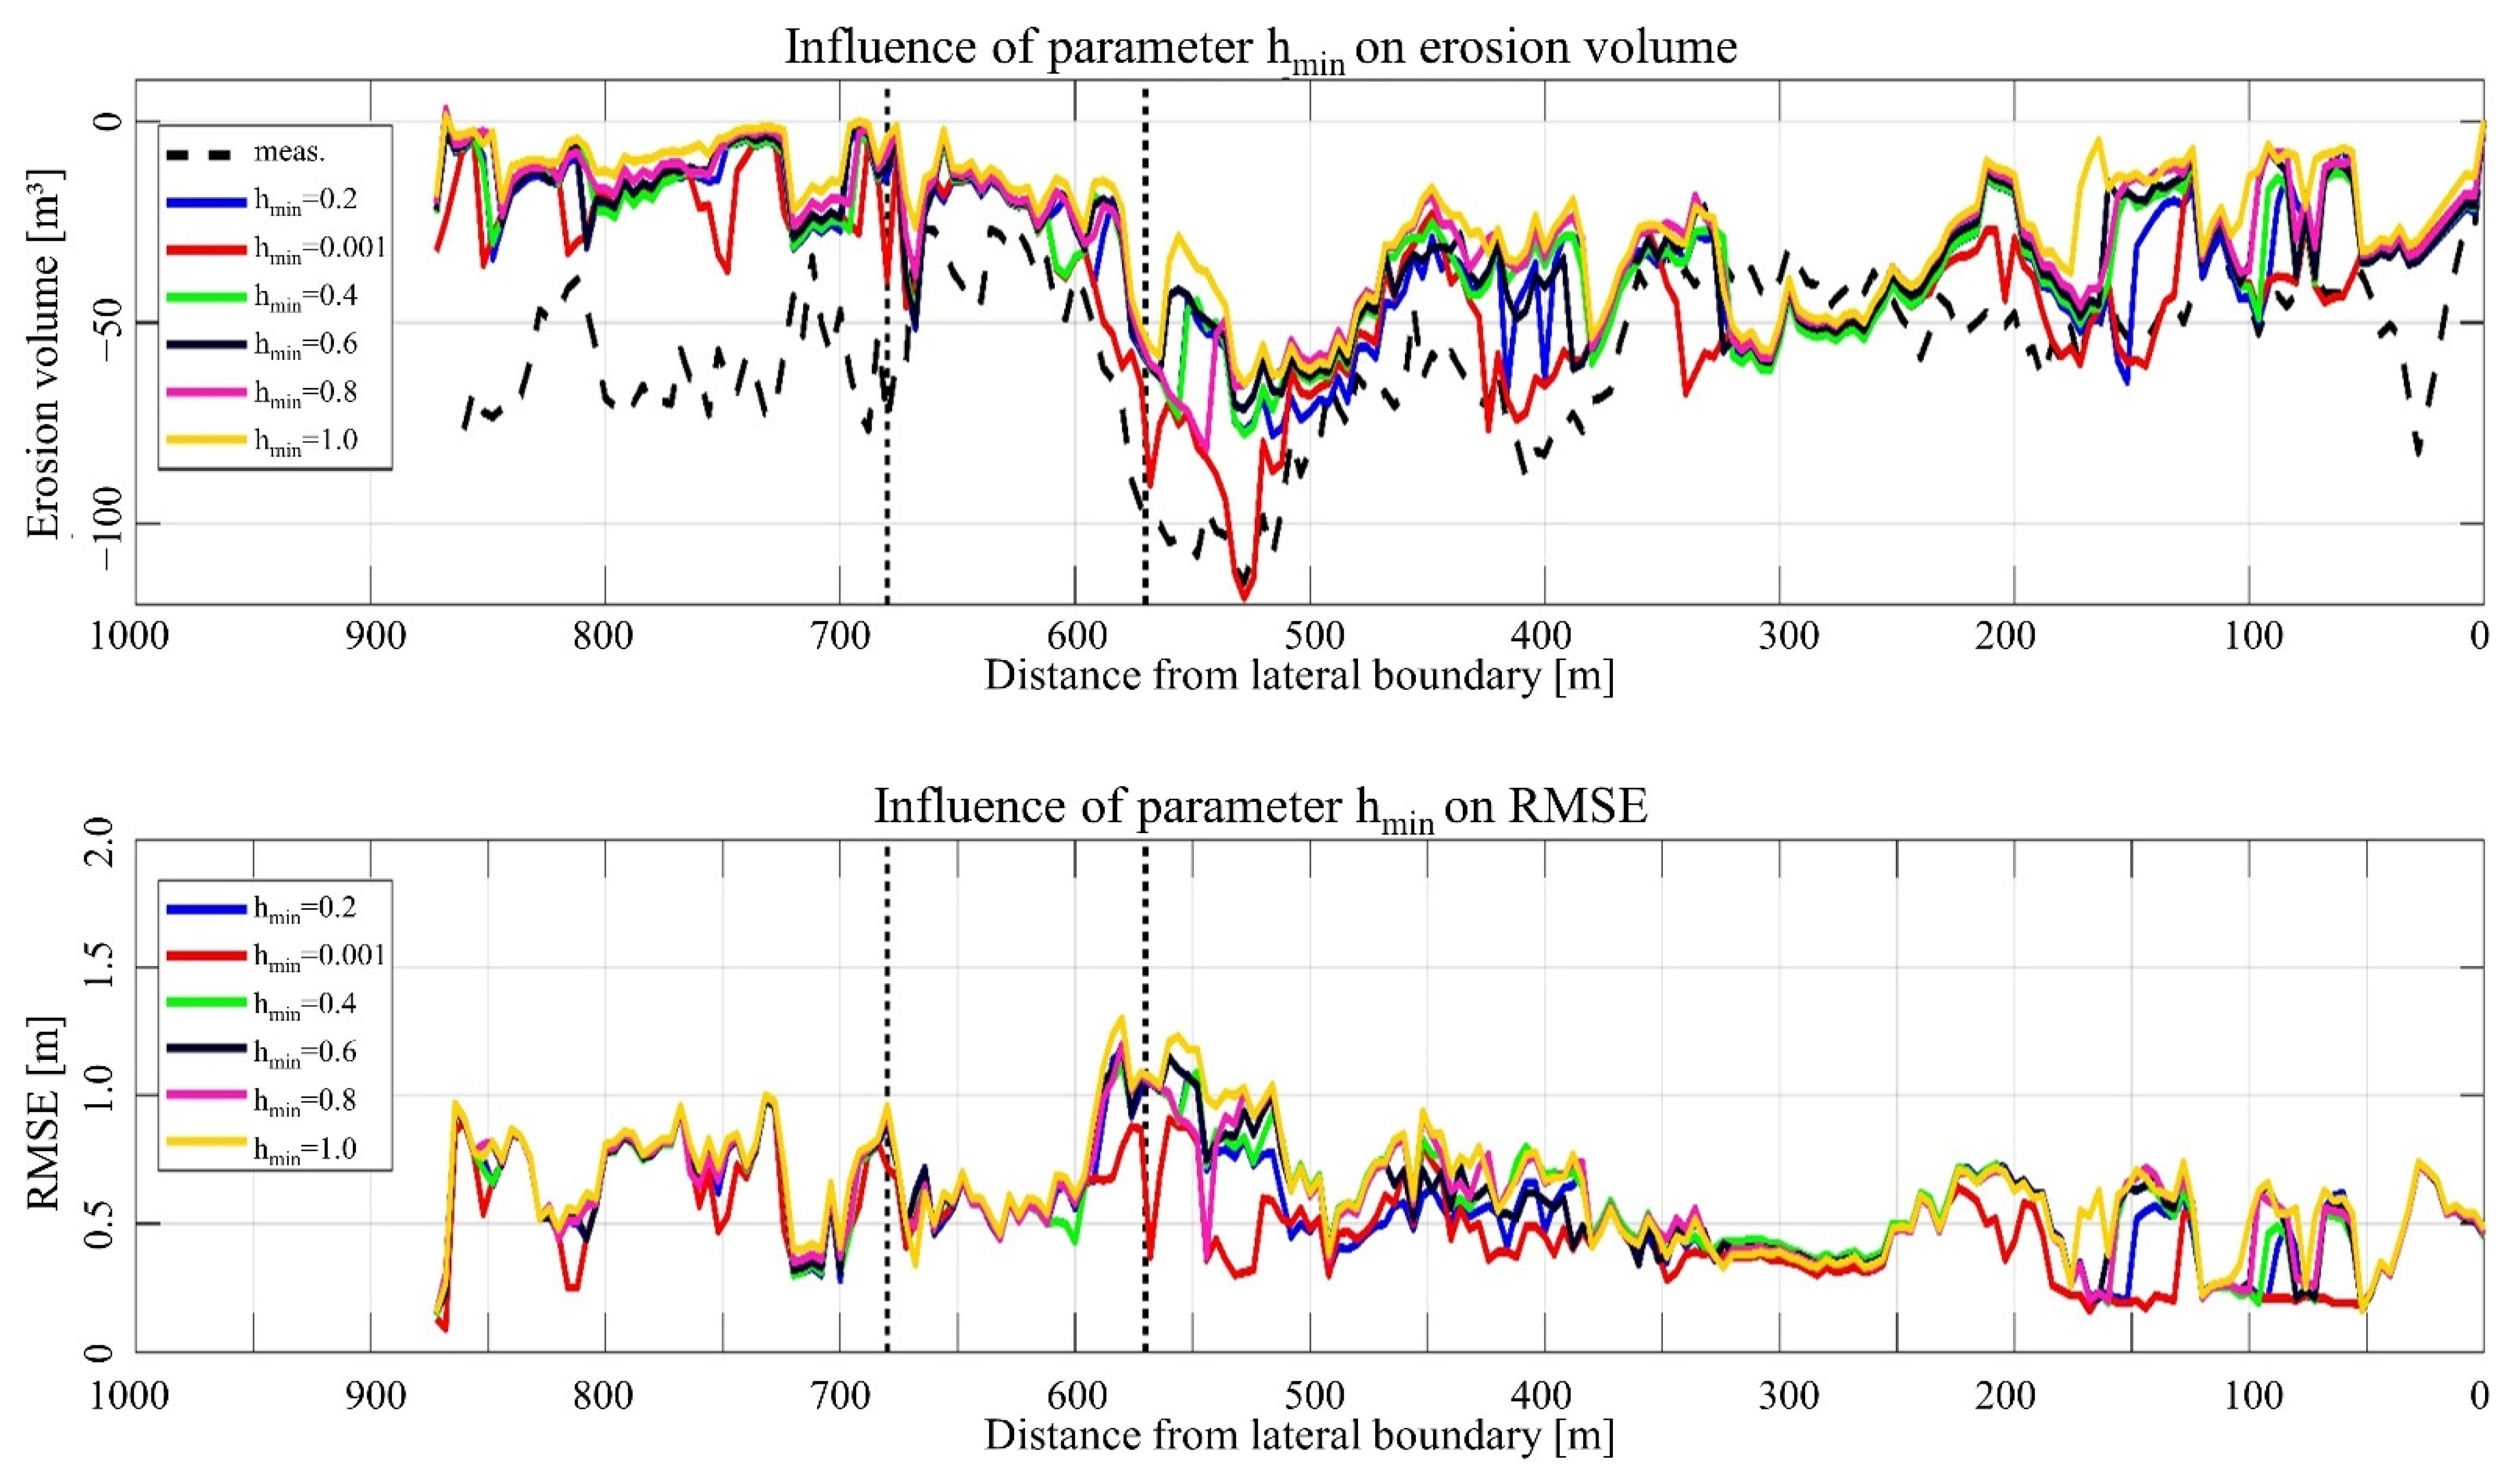
The simulation of the “Zeetje” storm surge in the Hütelmoor study area allowed us to apply the XBeach model to an existing breached coastal protection dune and to further adjust the model to achieve a higher agreement with available measurement data. The breach-zone had already been pre-damaged by past storm surges. During the back calculations, the sensitive model parameters of the research dune were used and verified. The application of the default parameter values led to a satisfactory agreement between the simulation results and the measurement. High accuracy was achieved in both the location and the evolution of the breach. Outside the breach, the simulated erosion of the coastal protection dune is slightly underestimated.
Parameter calibration did not significantly improve the results; only the modification of the parameter h
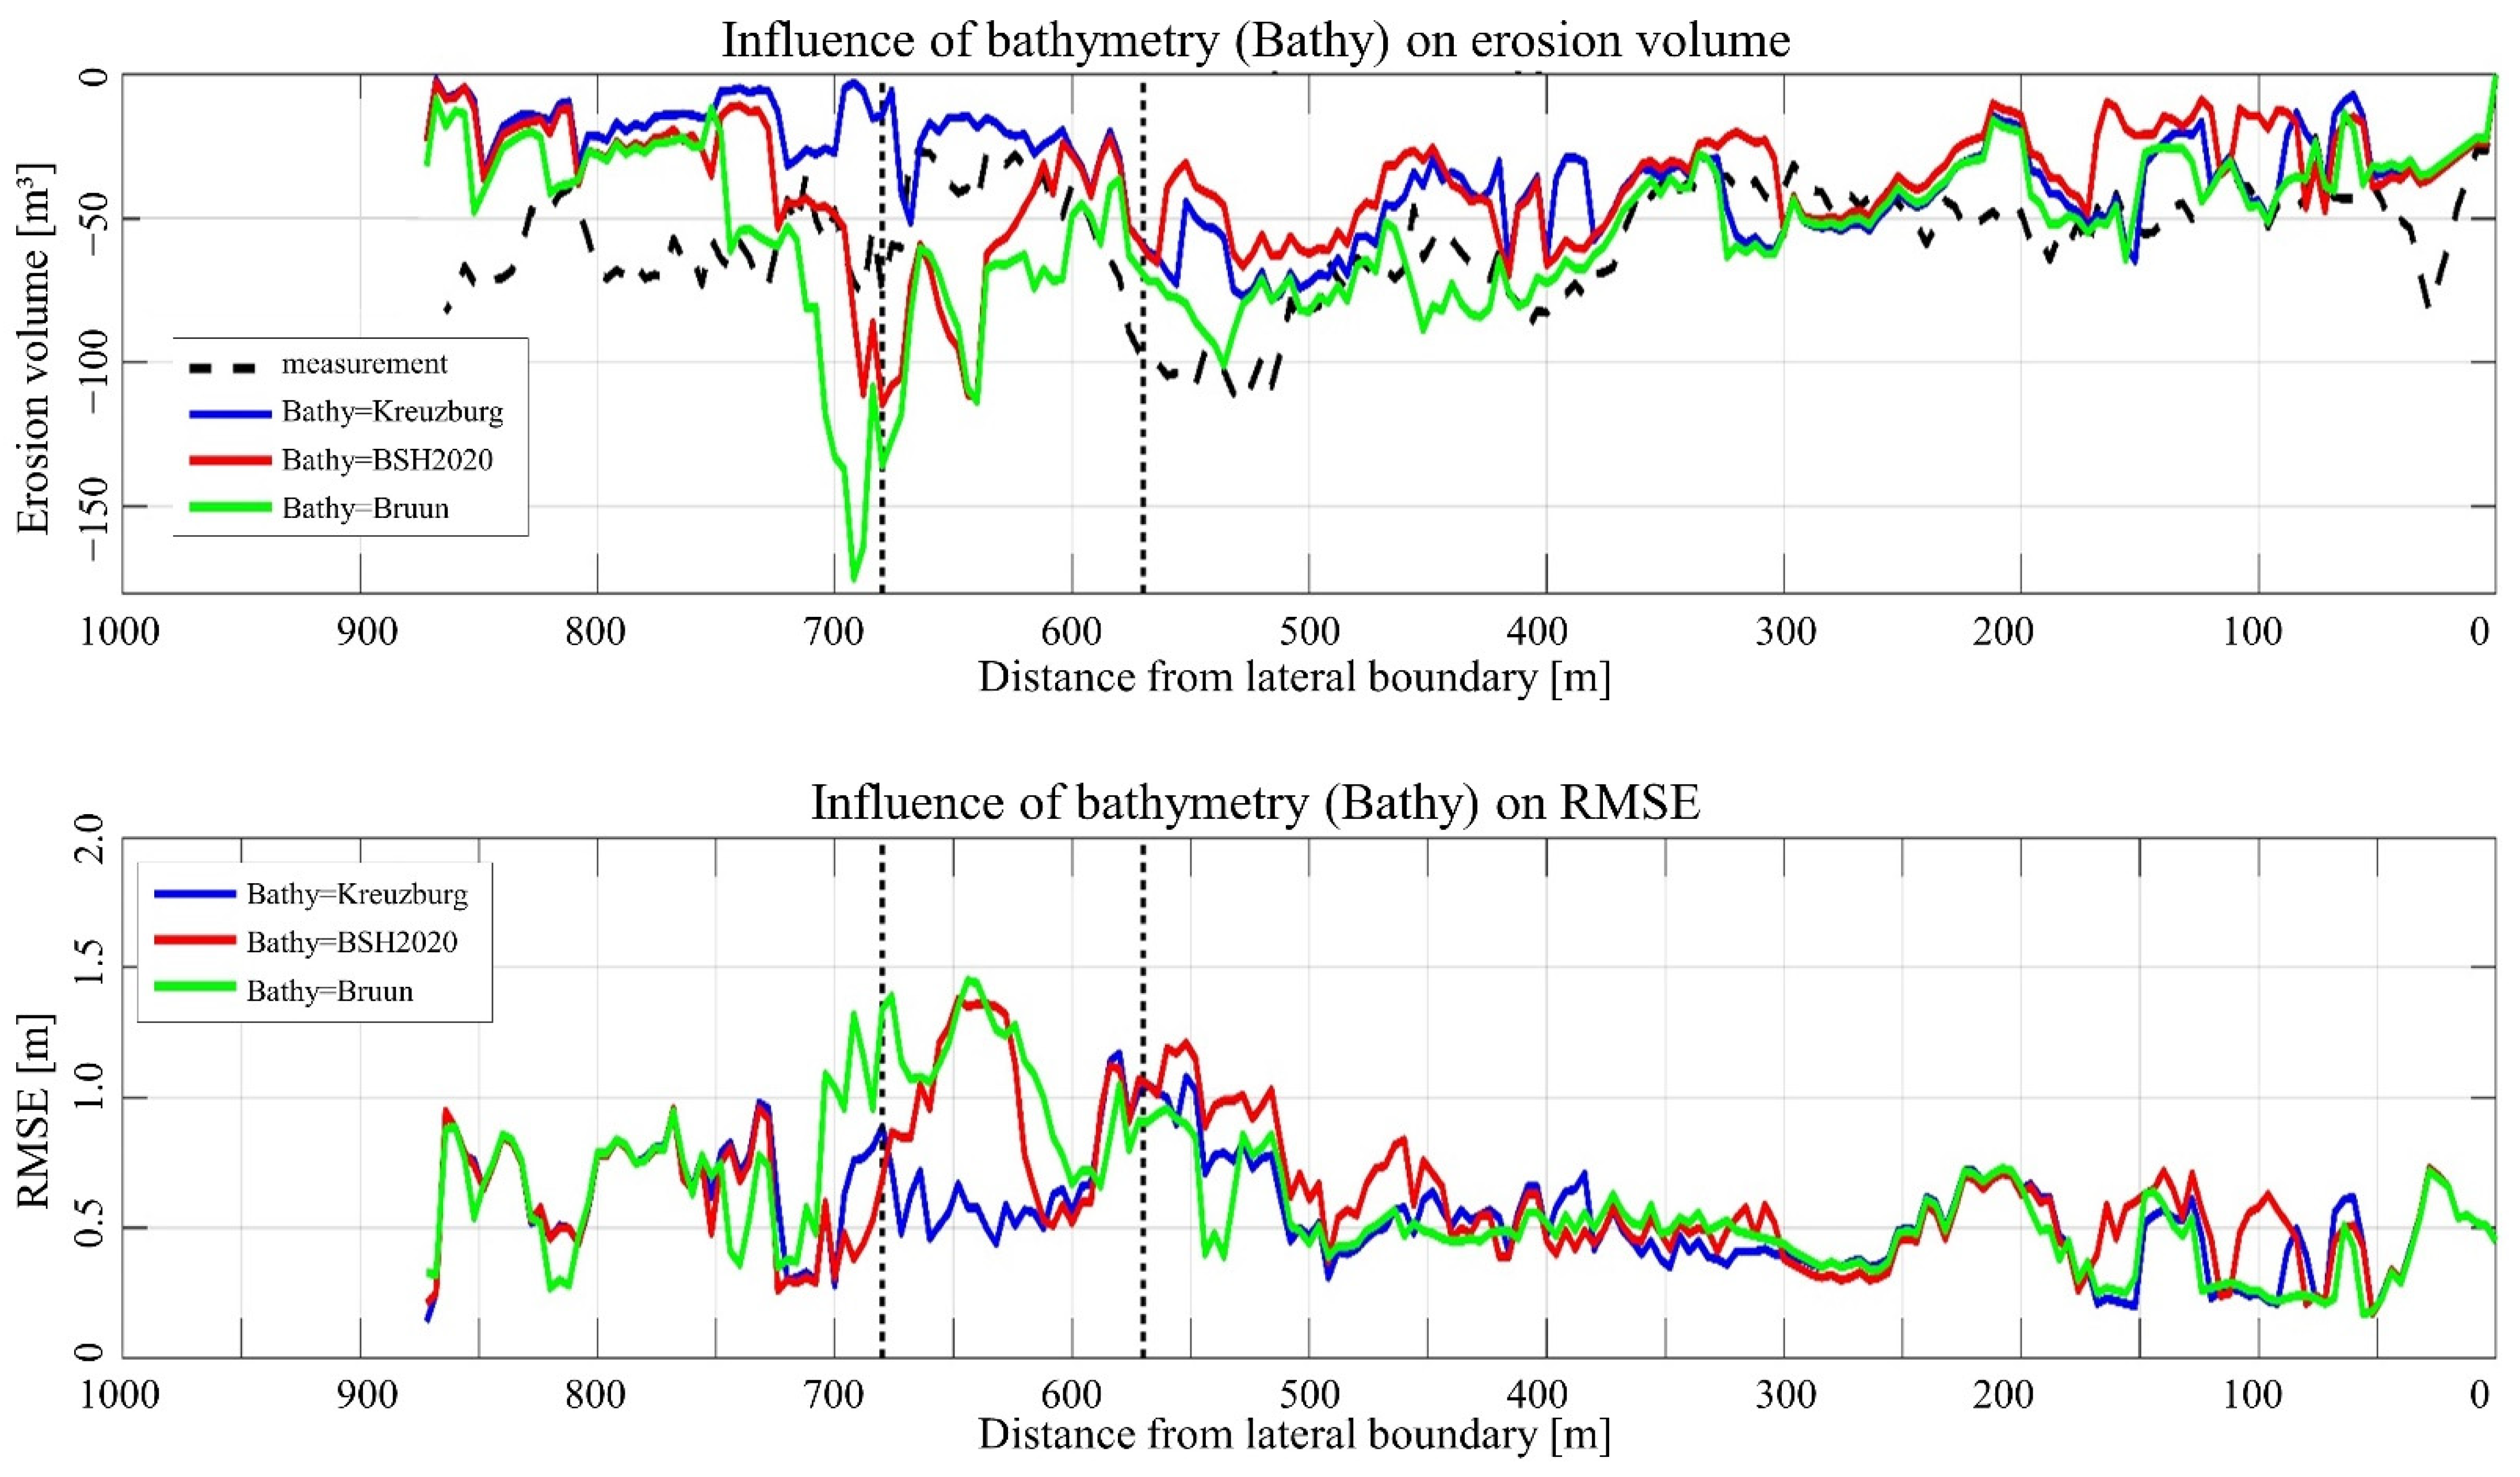
min led to slightly improved results. Like in the physical experiment, a large influence of the nearshore bathymetry on the erosion behaviour of the dune was observed. Using an out-dated, low-resolution BSH bathymetry [
46] and a bathymetry based on Bruun’s equation [
23] resulted in a significant overestimation of the simulated dune erosion. With up-to-date, high-resolution bathymetry data [
54], on the other hand, XBeach provides a good agreement between simulation and measurement, also for the full-scale life dune and even without considering any vegetation.
6. Conclusions
In the PADO project, a large-scale physical experiment was performed at a particularly constructed, unvegetated research dune on the German Baltic Sea coast. To improve the knowledge about dune erosion and particularly the breach evolution in the longitudinal dune direction, the research dune was surveyed with an innovative concept before, during and after a storm surge. This data was used to test and calibrate the numerical coastal erosion model XBeach for its future application in the prediction of dune erosion processes on the German Baltic coast. From the project, the following conclusion can be drawn:
The developed surveying technology using a combination of UAV aerial photogrammetry, terrestrial photogrammetry, and laser scanning proves to be suitable for this kind of nature experiment.
Dune erosion and breaching at the German Baltic coast can be modelled in the numerical model XBeach with sufficient accuracy, particularly with only cohesionless sand involved.
The position of an occurring breach can be determined well with XBeach, with the model settings having little influence on the results.
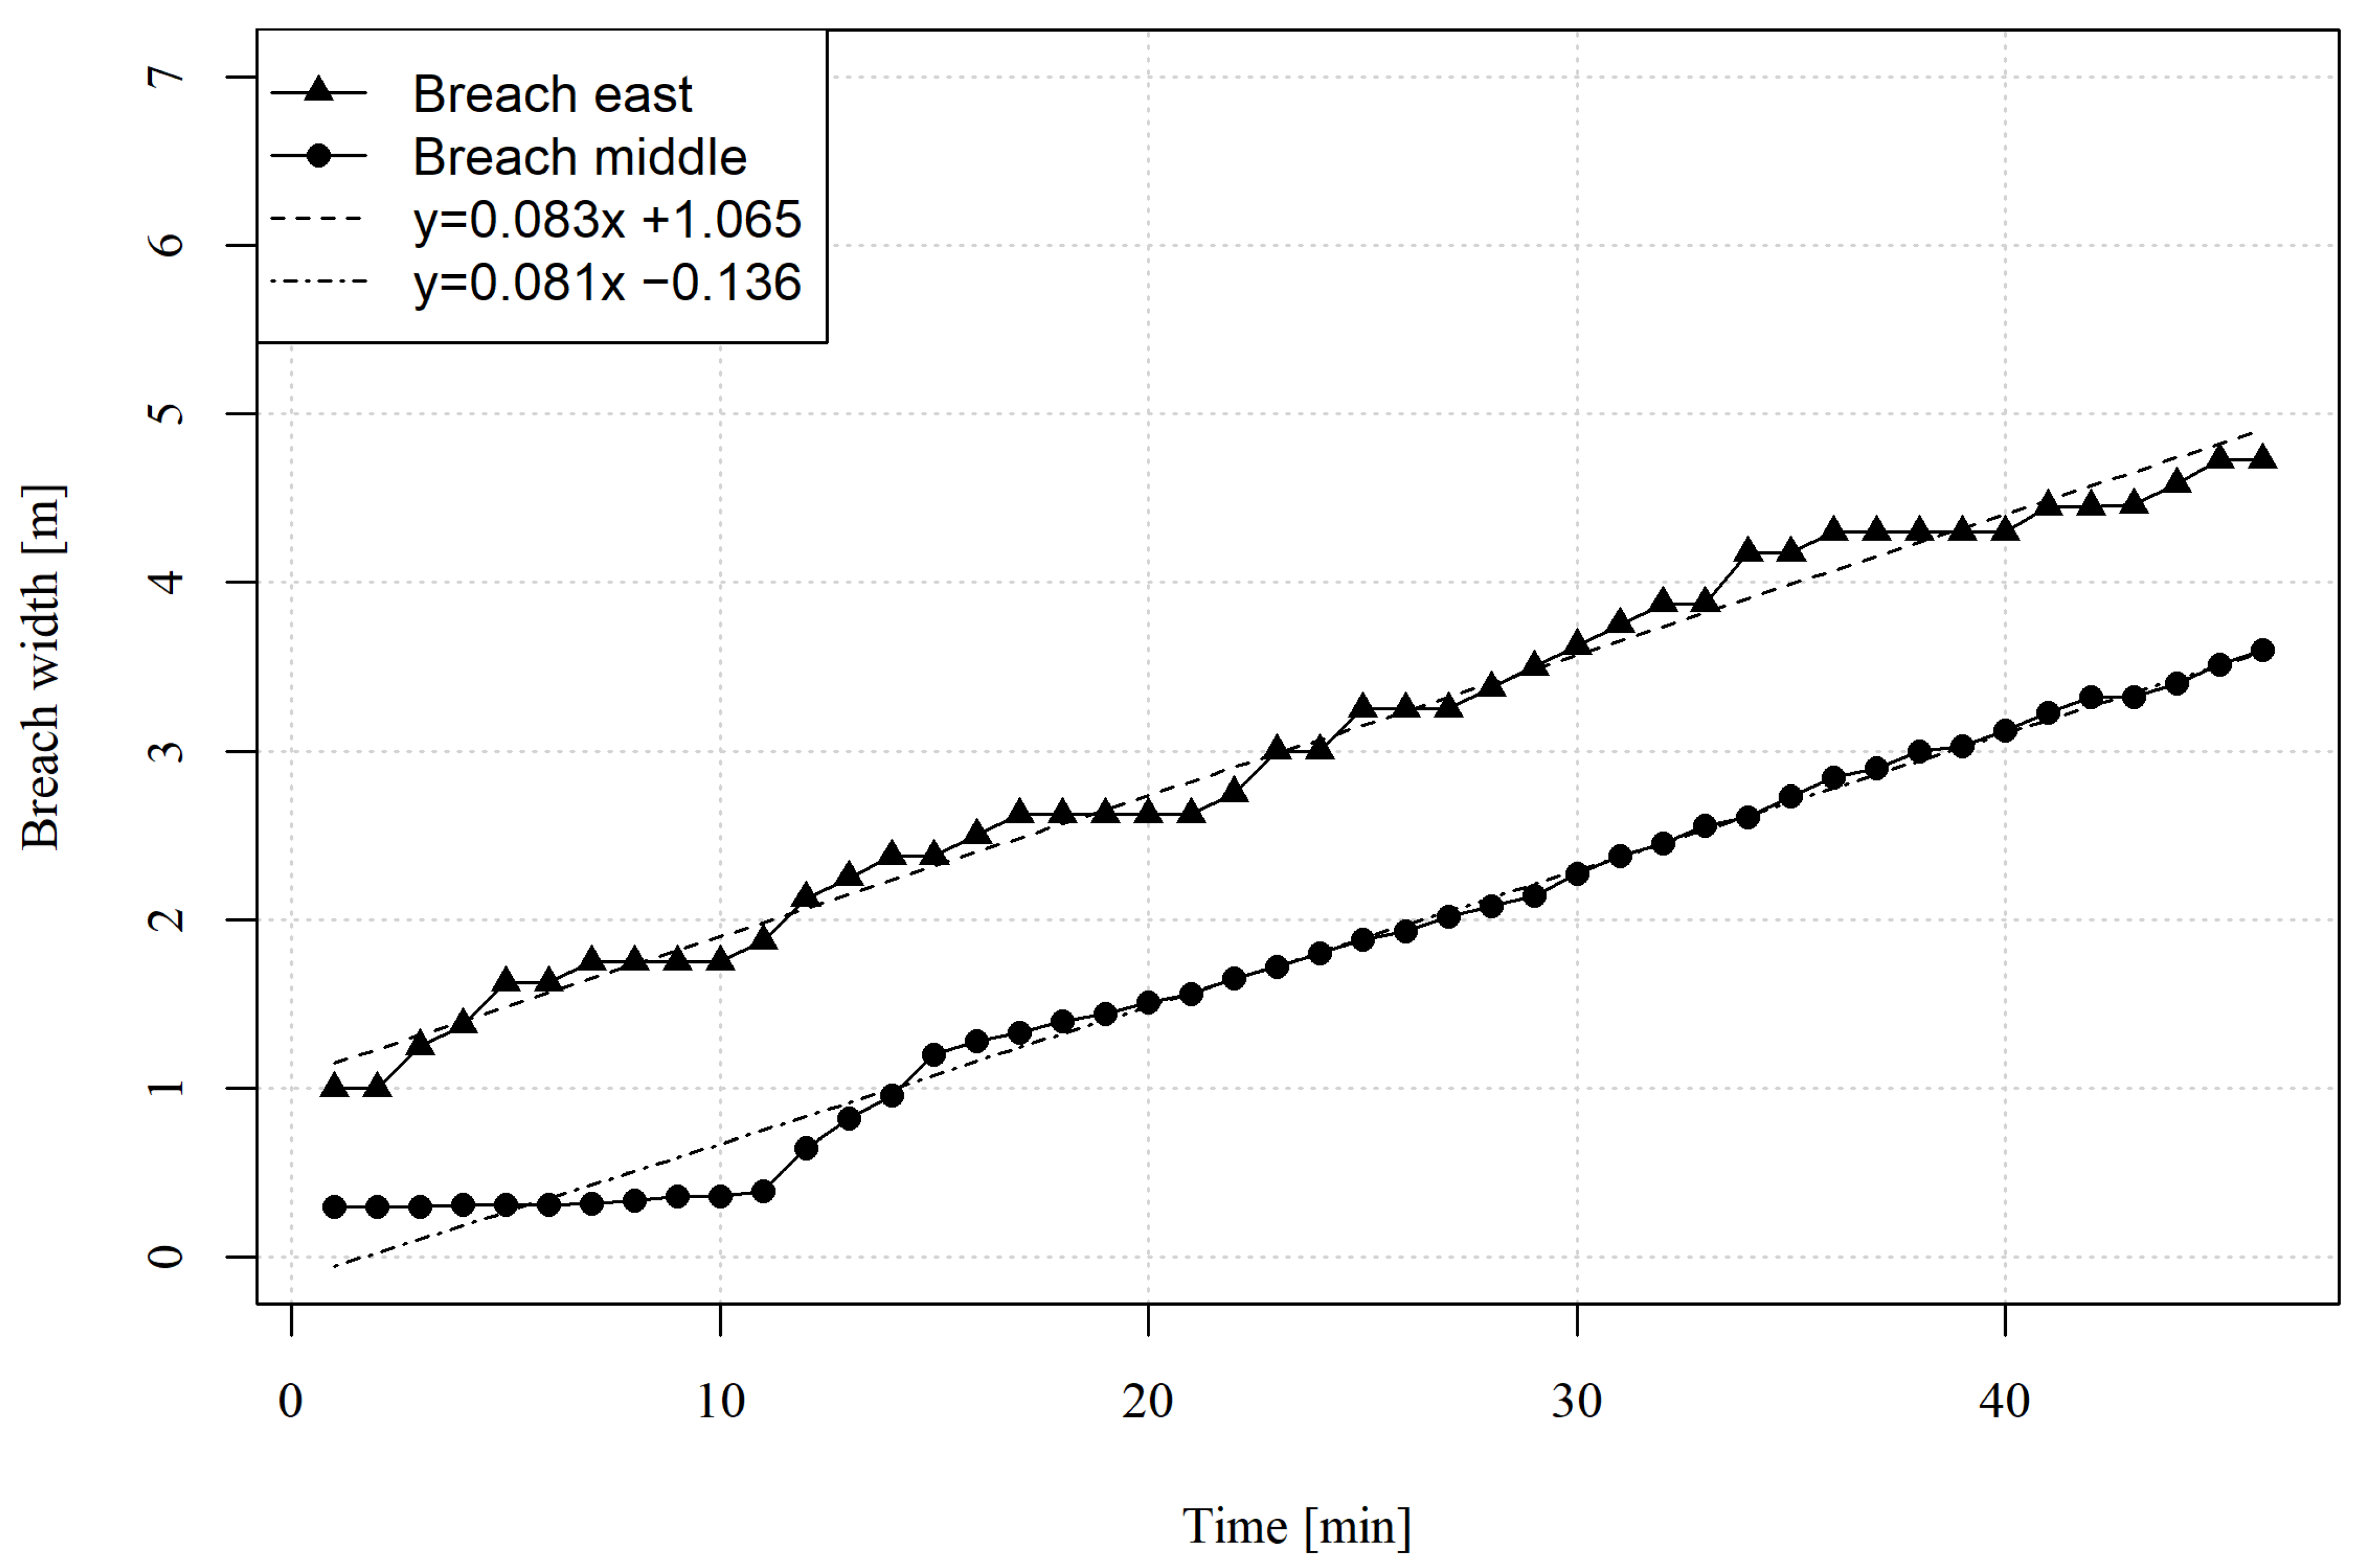
Breach development and the final width of the breach(es) match well between measurements and numerical model, provided that the input data are available in good quality and actuality.
There is a significant time discrepancy between the measured and simulated breach development, which cannot be explained yet. This is, however, not particularly relevant in the design process of dunes because there the final state is of interest.
The default values of the governing parameters in the XBeach model can be used to gain high-quality simulation results, provided that the input data—particularly the bathymetry—are available in good quality and actuality.
Since the parameters are not particularly sensitive to the studied model (e.g., with only sand in the topography), the parameter calibration leads to rather negligible improvements.
The modelling of the eroded sediment volumes and topography strongly depends on accurate, up-to-date and high-resolution topographic and bathymetric data. Based on the study results, this seems to be the most sensitive data set.
Another important and sensitive data set is the hydrodynamic parameters, which should either be measured in close vicinity or transferred from measurements at a similar coastal stretch (similar exposition, bathymetry, coastline geometry) and computed for the actual site.
In numerical simulations with the design flood event for Mecklenburg-Vorpommern, the nearshore bathymetry seems to have a minor effect on the simulation results, while the beach topography seems to govern the situation for the existing relatively shallow conditions at the German Baltic coast in front of dune systems. For dune dimensioning purposes, this would particularly facilitate the data acquisition because the terrestrial topography can be measured easier and at a lower cost than the nearshore bathymetry (particularly in the swash zone with irregular waves, foam, turbidity, etc., hindering the view from above). This issue should be the focus of further research.
Modelling of material relocation after flood events may provide better estimates in the future when quantifying nourishment volumes and nourishment intervals for dunes and beaches. When designing flood protection dunes, to be on the safe side, it is assumed that there will be a complete relocation of material. In the project PADO, it could be shown that the size of the breach is limited to a few 10 m, even in extreme conditions. Thus, in combined coastal protection systems (dune with dike behind), the water flow rate is limited, and the load on the dike may be reduced. Further investigation is required here, too.
The authors recommend further investigation on the influence of the bathymetry and beach topography for the design flood event and, at the same time, a higher frequency for measurements of both coastal topography and nearshore bathymetry together with hydrodynamic parameter measurements (e.g., Waverider buoys) in the vicinity of the most erosion sensitive coastlines in Mecklenburg-Vorpommern.
With the above prerequisites considered, XBeach has the potential to become a powerful tool for future coastal protection planning on the German Baltic coast. A more process-based and site-specific approach for dune dimensioning will allow for more accurate prediction and planning of nourishment needs in the context of the limited marine sand mining potential in the Baltic Sea.


