Article

Detecting Maritime Obstacles Using Camera Images

1
Department of Maritime Transportation System, Mokpo National Maritime University, Mokpo 58628, Korea
2
Division of Navigation Science, Mokpo National Maritime University, Mokpo 58628, Korea
*
Author to whom correspondence should be addressed.
J. Mar. Sci. Eng. 2022, 10(10), 1528; https://doi.org/10.3390/jmse10101528
Submission received: 2 October 2022 / Revised: 16 October 2022 / Accepted: 17 October 2022 / Published: 18 October 2022
(This article belongs to the Section Ocean Engineering)

Abstract

:
Aqua farms will be the most frequently encountered obstacle when autonomous ships sail along the coastal area of Korea. We used YOLOv5 to create a model that detects aquaculture buoys. The distances between the buoys and the camera were calculated based on monocular and stereo vision using the detected image coordinates and compared with those from a laser distance sensor and radar. A dataset containing 2700 images of aquaculture buoys was divided between training and testing data in the ratio of 8:2. The trained model had precision, recall, and mAP of 0.936%, 0.903%, and 94.3%, respectively. Monocular vision calculates the distance based on camera position estimation and water surface coordinates of maritime objects, while stereo vision calculates the distance by finding corresponding points using SSD, NCC, and ORB and then calculating the disparity. The stereo vision had small error rates of −3.16% and −14.81% for short (NCC) and long distances (ORB); however, large errors were detected for objects located at a far distance. Monocular vision had error rates of 2.86% and −4.00% for short and long distances, respectively. Monocular vision is more effective than stereo vision for detecting maritime obstacles and can be employed as auxiliary sailing equipment along with radar.

1. Introduction and Background

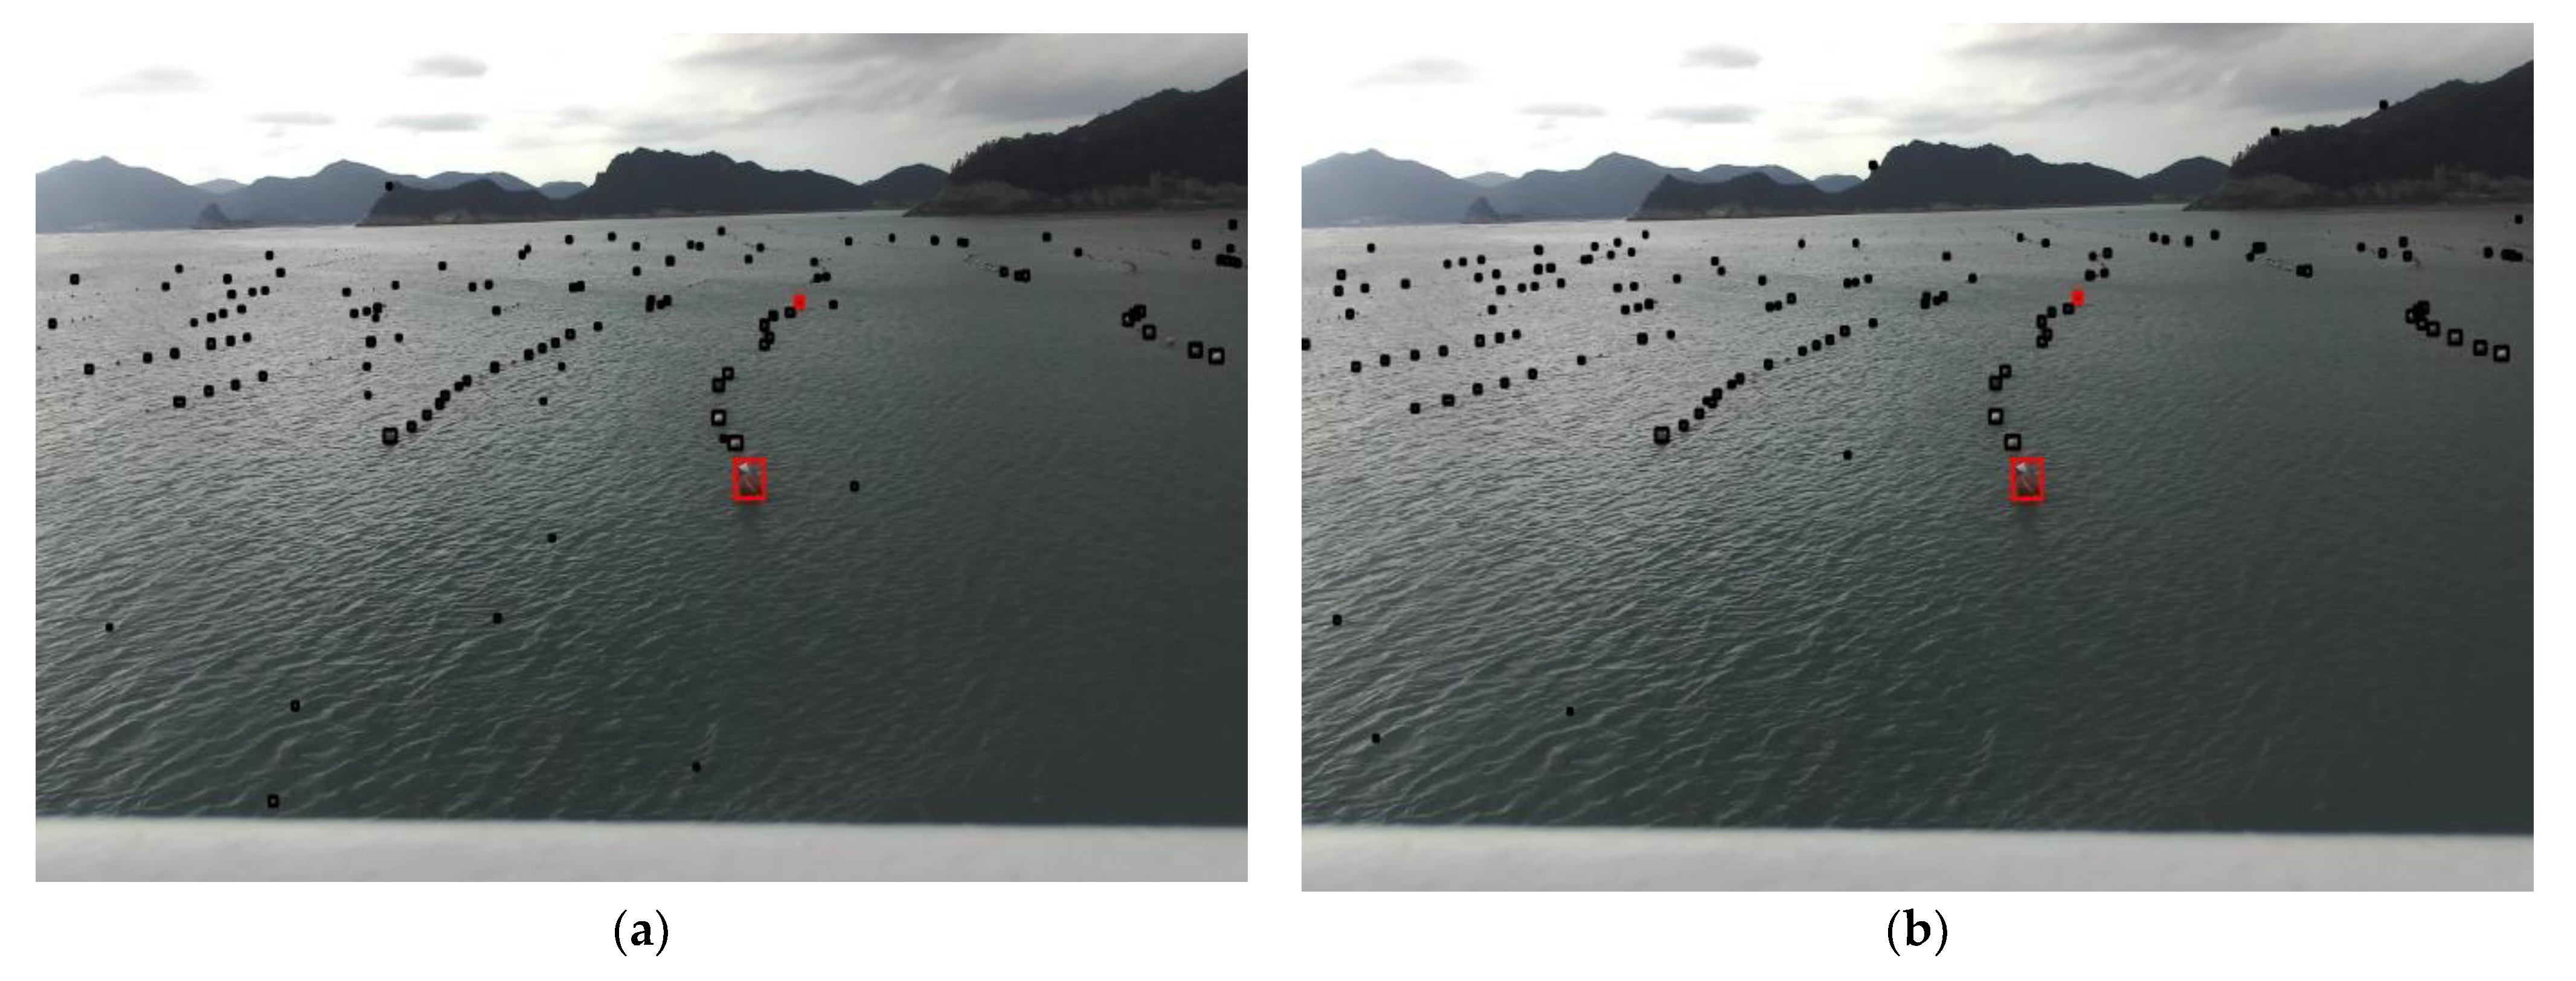
Various technologies related to developing autonomous ships, such as path search, collision avoidance, object detection, and electric propulsion, have been extensively researched. Once autonomous ships become commercialized and sail along the coast of Korea, the most frequently encountered obstacles will be aquaculture farms. The number of aquaculture licenses and area per licensed aquaculture farm in Korea has increased from 9555 and 14.2 ha in 2008 to 9992 and 16.1 ha in 2017, respectively [1]. As of 2017, South Jeolla Province accounted for 74.8% of licensed aquaculture areas among 11 cities and provinces, while the ratio of licensed seaweed farms was 75.4%. Aquaculture farms in Korea are only permitted to be operated on the water surface, enabling their GPS coordinates to be tracked in advance. However, licensed farms may deviate from the permitted location due to wind or tides. Moreover, several aqua farms operate without permission. Though ships are equipped with radars for detecting objects in the sea, identification can be challenging due to reflected waves or aquaculture buoys being too small or located too near to secure the minimum detection distance.
Object detection technologies are widely applied to overcome such limitations. In recent years, deep learning-based object detection methods that extract the detected object features through neural networks have been actively researched [2]. Object detectors are mainly categorized as one-stage or two-stage detectors. One-stage detectors such as SSD [3], You Only Look Once (YOLO) [4,5,6,7], and RefineDet [8] simultaneously perform classification and localization to indicate the location of objects within an image through a box. In contrast, two-stage detectors, such as region-based convolution neural network (R-CNN) [9], Fast R-CNN [10], and Cascade R-CNN [11], sequentially perform localization and classification. In [12], object detection algorithms were largely divided into CNN and YOLO groups for comparative analyses. The YOLO-based object detection algorithms offer faster and more effective detection and are deemed more appropriate for use in actual application programs. In [13], YOLO v4 was proposed, which is capable of accurately identifying moving objects such as a person, motorcycle, or bicycle on congested roads after being trained. The YOLO-based object detection system proposed in [14] synthesized LiDAR point cloud and image data from an RGB camera to detect the driving environment of autonomous vehicles.
The distance to the detected objects must be known for ships to take necessary collision-avoidance actions. The distance to an object in a camera image can be calculated based on monocular or stereo vision. In monocular distance perception, Zhang et al. [15] presented the 3D positions of a target in the camera coordinate frame by measuring the distance between the feature and principal points based on the calculated area in the image. Yang and Cao [16] proposed a 6D object localization method based on a monocular vision system by decomposing the homography matrix and refining the result using the Levenberg–Marquardt algorithm. Qi et al. [17] proposed an improved distance estimation algorithm based on the vehicle pose information by updating the rotate matrix considering vehicle pose information and the vanish line position to eliminate the estimation error caused by vehicle flutter. Dhall [18] suggested an effective CNN architecture for key point regression, which can run in real-time with low computation power using prior 3D information about the object used to match 2D–3D correspondences.
Stereo vision estimates the 3D coordinates of an object by calculating the disparity in object positions in two images of the same scene. Most research has focused on stereo matching, which involves finding corresponding points between two images [19,20]. Stereo matching methods can be categorized as global or local matching methods. Global matching involves minimizing the cost of determining the time difference of each pixel for the entire image region. Frequently used methods include belief propagation [21], dynamic programming [22], and semi-global matching [23]. Local matching is divided into area-based and feature-based matching. Area-based matching, such as SSD, SAD, and NCC, involves finding matching points using pixel information of certain regions [24]. Feature-based matching, such as SIFT [25], SURF [26], KAZE [27], and ORB [28], extracts feature points of an image to find matching points corresponding to the entire image. Yang and Lu [29] proposed a long-distance tsunami prediction system based on binocular stereo vision with a measuring range of 4–20 km, using a two-step matching method. Zheng et al. [30] developed an ORB-based detector for inland river ships and measured distances based on binocular stereo vision with a feature point detection and matching algorithm.
Stereo vision is commonly used in robots and autonomous driving since 3D information of an object can be obtained irrespective of specific external conditions. However, the disadvantages include high computation costs for finding corresponding points between two images and requiring a stereo setup such as synchronization and stereo calibration. In contrast, monocular vision entails low computation costs from using a single camera and fast processing times but requires knowing 3D information for 2D–3D correspondences. However, all objects in the sea have a contact point with the water surface, which can be used to find the object coordinates without knowing the 3D information. Therefore, it is possible to calculate the distance using camera position estimation and water surface coordinates of an object at sea via monocular vision.
To ensure the safe navigation of autonomous ships in the coast of Korea, a maritime obstacle detection method is needed. Accordingly, this study uses YOLOv5 [31], having excellent speed and accuracy, to develop a model for detecting aquaculture buoys found along the coast of Korea, and proposes the most effective method for detecting maritime obstacles by comparing the distances measured through monocular and stereo vision based on image coordinates. The rest of this paper is organized as follows. Section 2 describes the methods used to detect maritime obstacles and calculate the distance from the camera by monocular and stereo vision. Section 3 and Section 4, respectively, present and discuss the experimental results and analysis. Finally, the conclusions are outlined in Section 5.

2. Methods

2.1. YOLOv5

The architecture of YOLOv5, in Figure 1, consists of three parts: backbone for feature extraction, neck for feature fusion, and head for object detection.
The CNN-based backbone network extracts feature maps of different sizes from the input image using multiple convolutions and pooling layers. The convolution with batch normalization and leaky ReLU (CBL) is used for feature extraction. The cross-stage partial network performs convolutional computation on certain parts of a feature map and concatenates with the remaining parts. The computation amount can be reduced since only certain parts of a feature map are passed through the convolutional layer, and the gradient flow can be efficiently carried out during backpropagation, thus improving the performance. The focus layer with a 6 × 6 Conv2d layer was created to reduce layers, parameters, FLOPS, and CUDA memory, and improve forward and backward speed. The spatial pyramid pooling (SPP) network pools the features using filters of various sizes and recombines them, effectively improving the network performance. The neck network fuses the feature maps of different levels to obtain more contextual information and reduce information loss. The feature pyramid network (FPN) and path aggregation network (PAN) are used in the fusion process. The FPN structure conveys strong semantic features from the higher to the lower feature maps, while the PAN structure conveys strong localization features from the lower to the higher feature maps. The two structures jointly strengthen the feature fusion capability of the neck network. Specifically, three feature fusion layers generate three scales of new feature maps. The smaller the feature map size, the larger the corresponding image area of each grid unit. The head network performs object detection and classification from these new feature maps. The leaky ReLU activation function is used in middle/hidden layers and the SiLU (Sigmoid-Weighted Linear Units) activation function is used in the final detection layer.

2.2. Monocular Vision

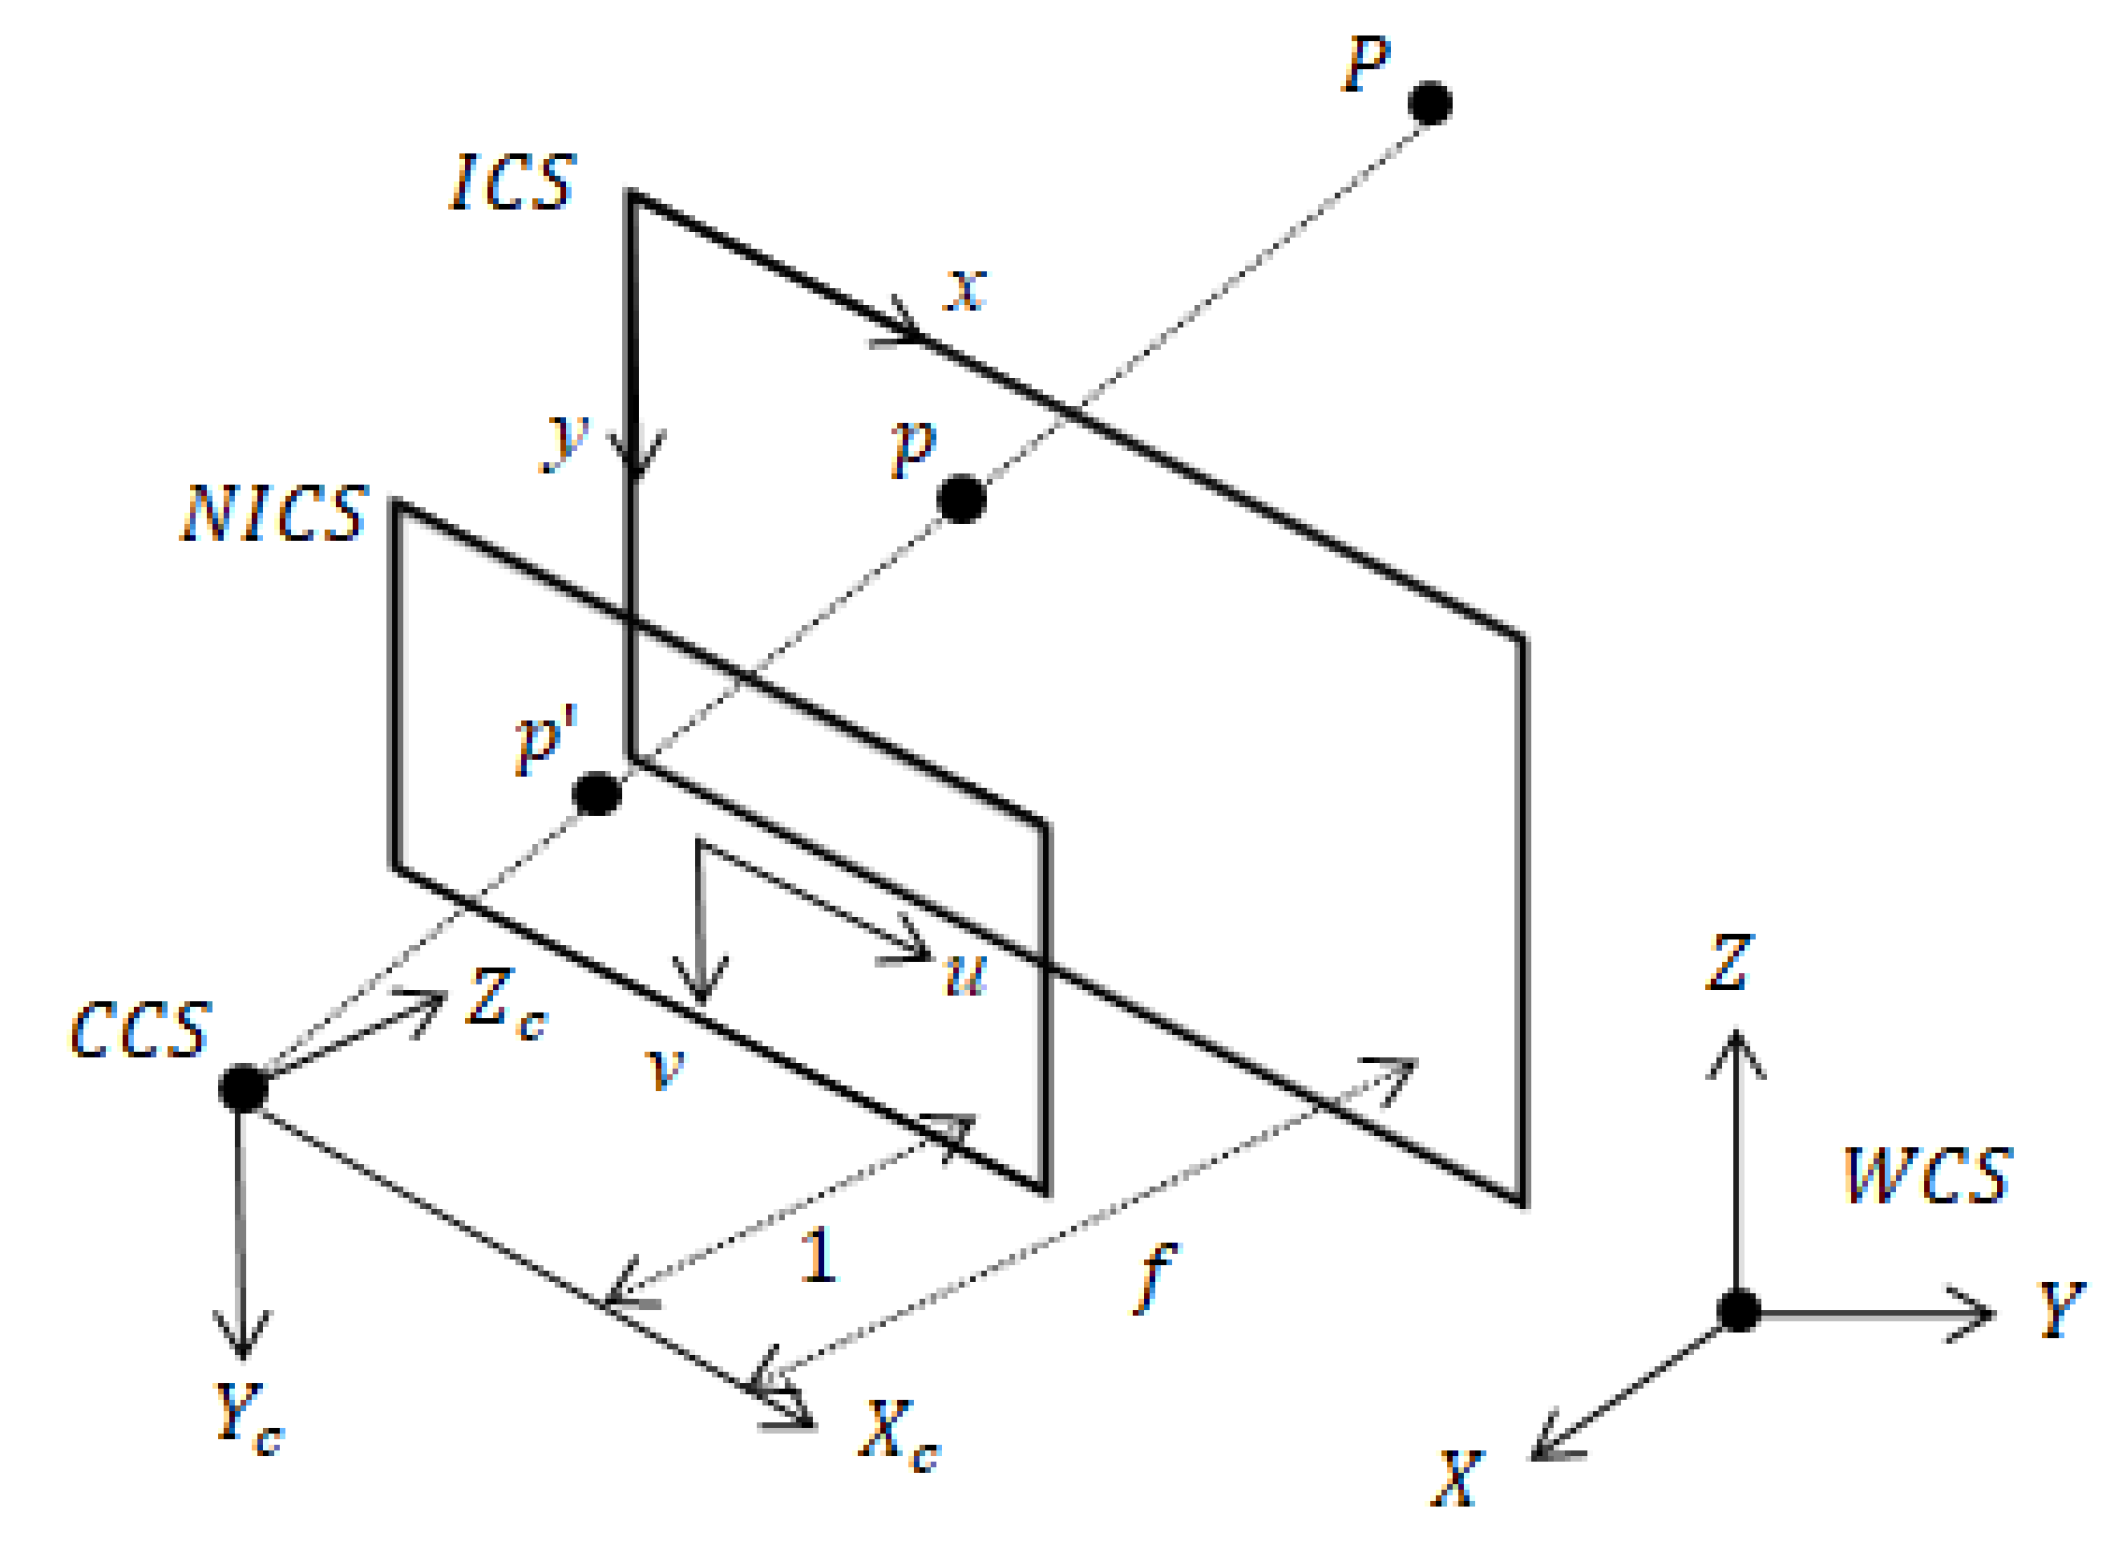
The terminology related to image geometry, representing the relationship between 2D and 3D coordinates in a camera image, can be defined as shown in Table 1 and Figure 2.

2.2.1. Projection Transformation

As shown in Figure 1, a camera projects P = X ,   Y ,   Z on the WCS onto p = x ,   y on the ICS to represent an image through projection. In projective geometry, homogeneous coordinates express an n-dimensional projection space through n + 1 coordinates [32] and give the relationship between P and p , as shown in Equation (1) [33]:
s   x   y 1 = f x s k e w c c x 0 f y c y 0 0 1 1 0 0 0 0 1 0 0 0 0 1 0 r 11 r 12 r 13 t 1 r 21 r 22 r 23 t 2 r 31 r 32 r 33 t 3 X Y Z 1 s p = K T p e r s 1 R t P  
where s is the scaling factor and is considered as 1 for finding the original coordinates, f x   and   f y are the focal length of the camera, c x   and   c y are the cardinal points, s k e w c represents the skewness coefficient of the image sensor, K represents camera intrinsic parameters, T p e r s 1 is the projection matrix which projects 3D coordinates on the CCS onto a normalized image plane with Z c = 1 , and R   and   t are the rotation matrix and translation vector, respectively, which convert the WCS to the CCS, and are referred to as a rigid transformation matrix and camera extrinsic parameters.

2.2.2. Distance Calculation

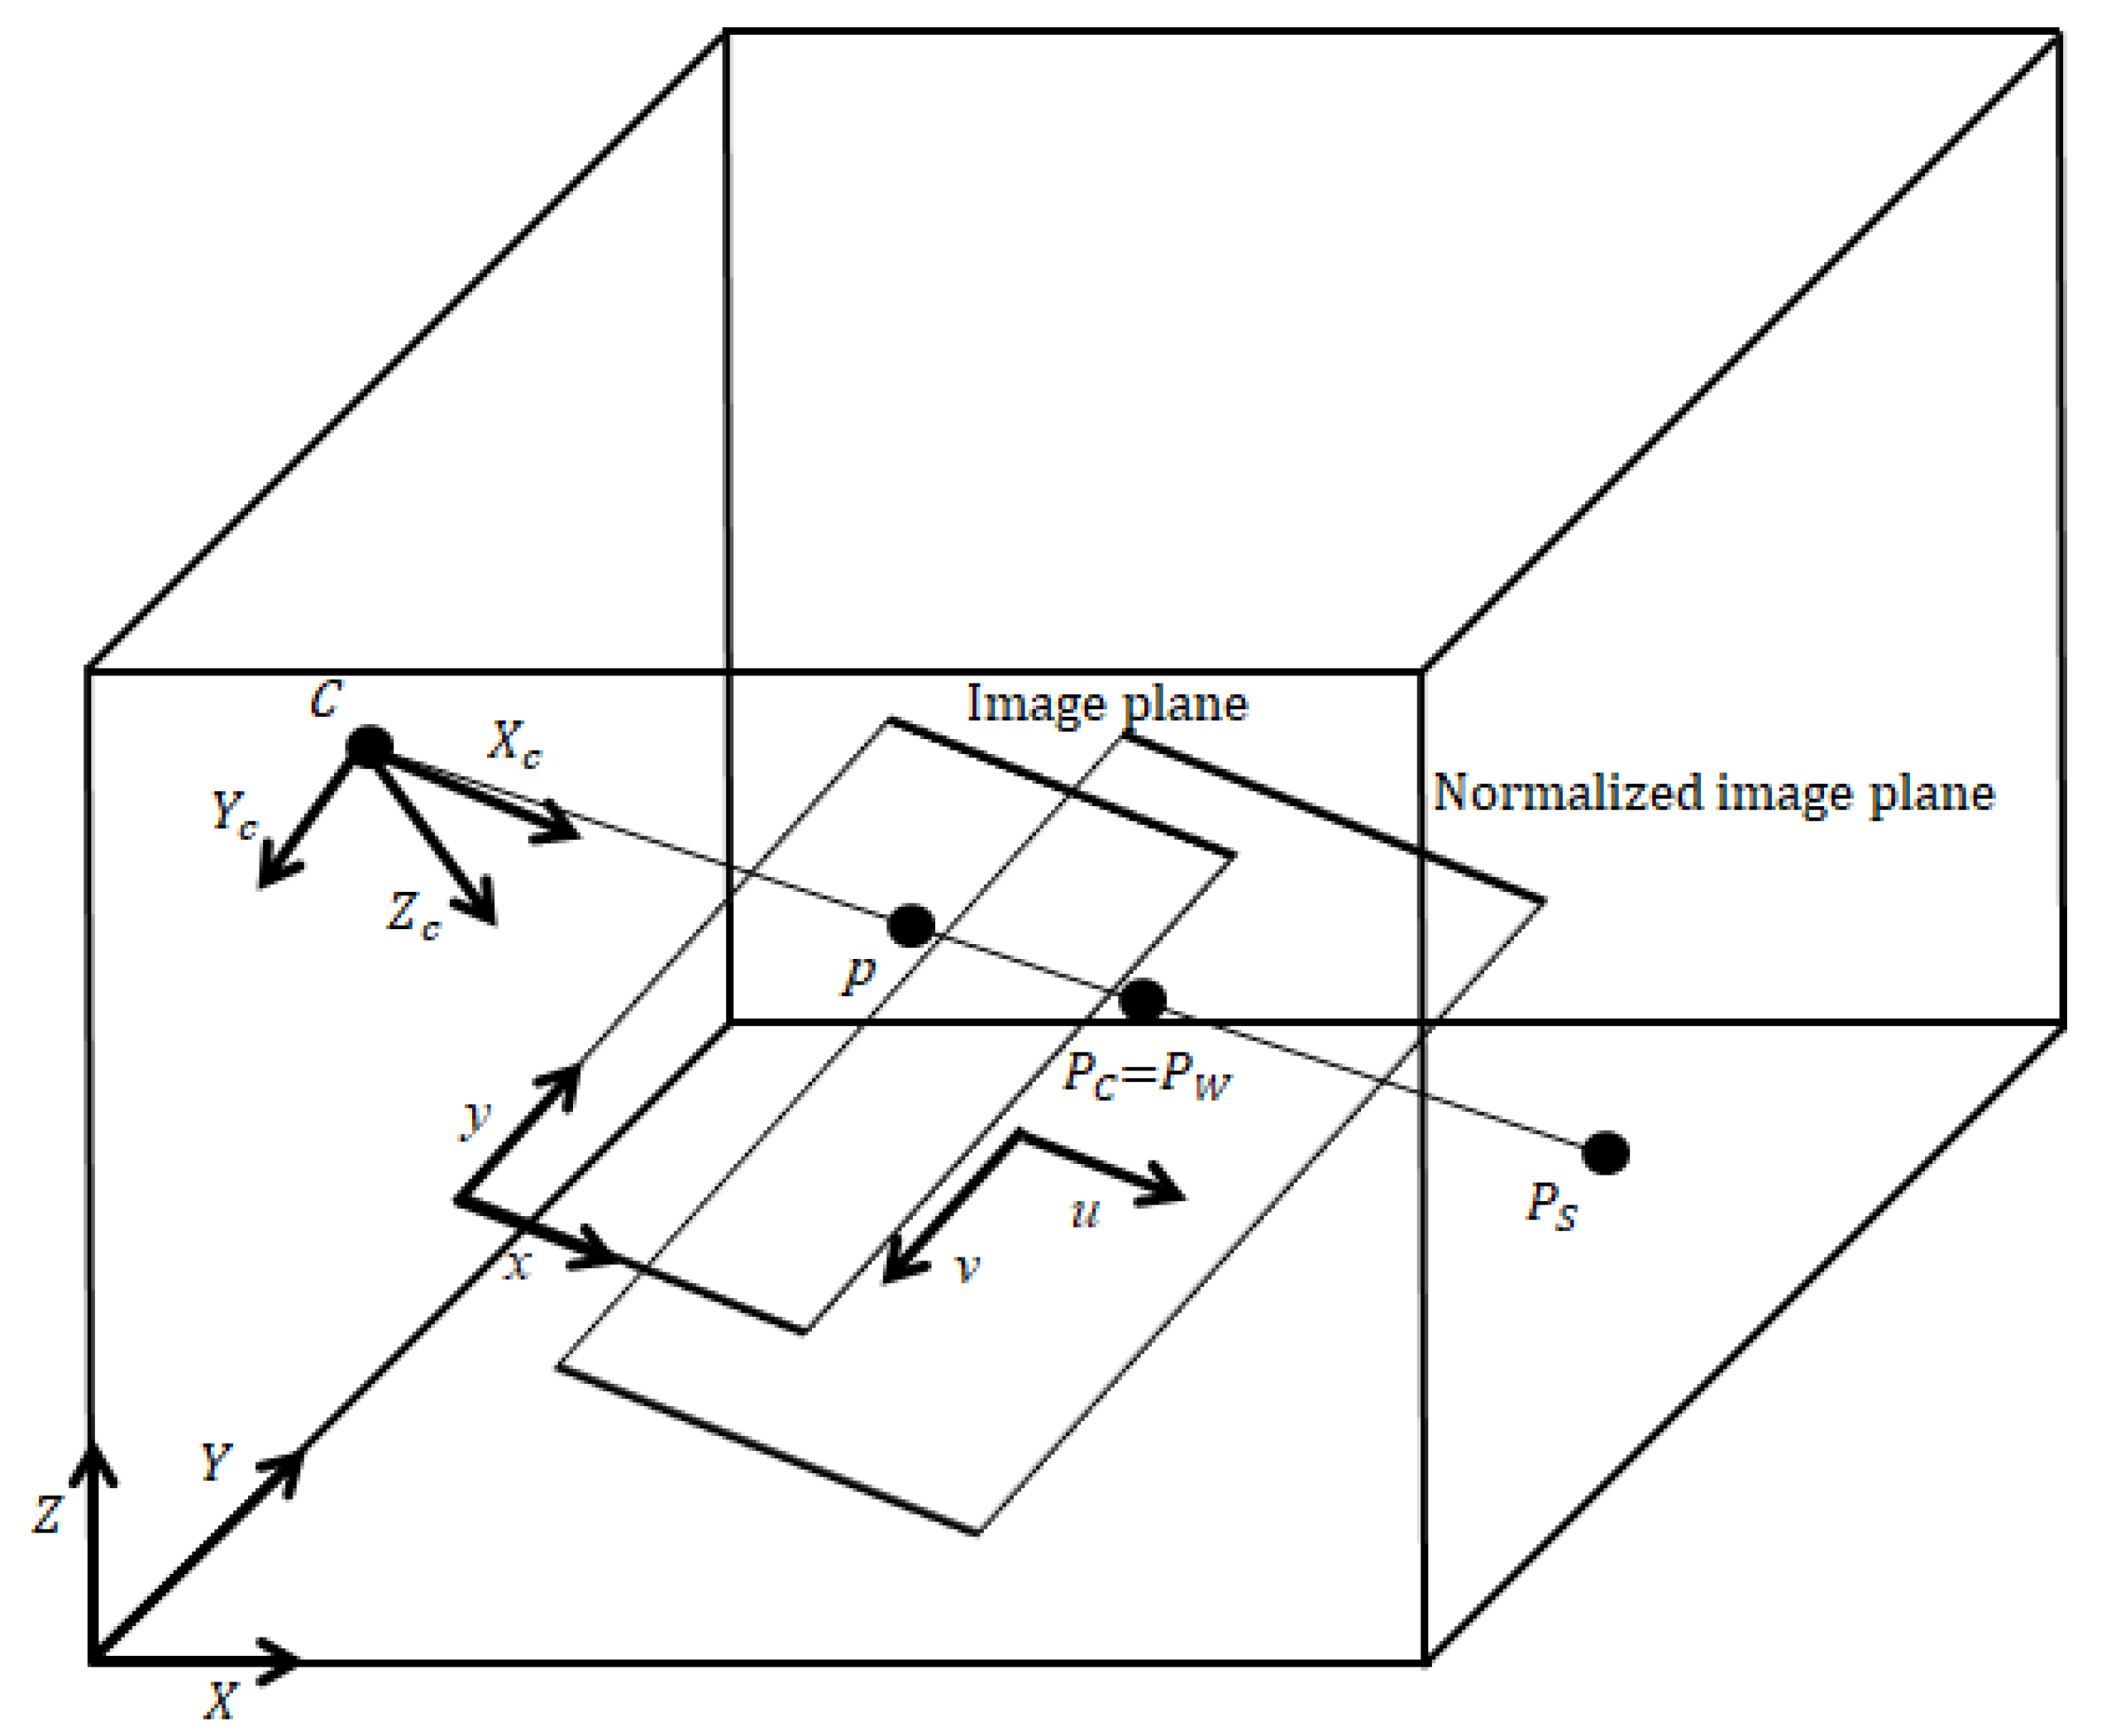
The water surface coordinates of an aquaculture buoy floating on water, P S , are projected onto a point p on an image plane using a camera, as shown in Figure 3. A point projected onto the normalized image plane can be expressed as P W and P C for the WCS and CCS, respectively.
According to Equation (1), the relationship between P W and P C is given in Equation (2), and that between P C = u ,   v ,   1 and p = x ,   y is given in Equation (3):
P C = R P W + t
x = f x u + c x y = f y v + c y  
If the intrinsic and extrinsic camera parameters and the coordinates of point p on an image plane are known, the coordinates of P W can be calculated using Equations (2) and (3). Furthermore, the CCS coordinates of a camera focal point C are (0, 0, 0), which can be converted to WCS coordinates using Equation (2), where C , p , P W , and P S on the same line of projection have the relationship shown in Equation (4):
P S = C + k P W C
where k is an arbitrary constant. Since P S = X ,   Y ,   Z is the only value that satisfies the limiting condition ( Z = 0 ) of the water surface coordinates, the P S WCS coordinates can be calculated. If the WCS reference point is where the camera lens center vertically intersects the water surface, P S WCS coordinates can calculate the horizontal distance from the camera ( D m ) and relative bearing ( θ m ) using Equation (5):
D m = X 2 + Y 2 θ m = atan Y X

2.3. Stereo Vision

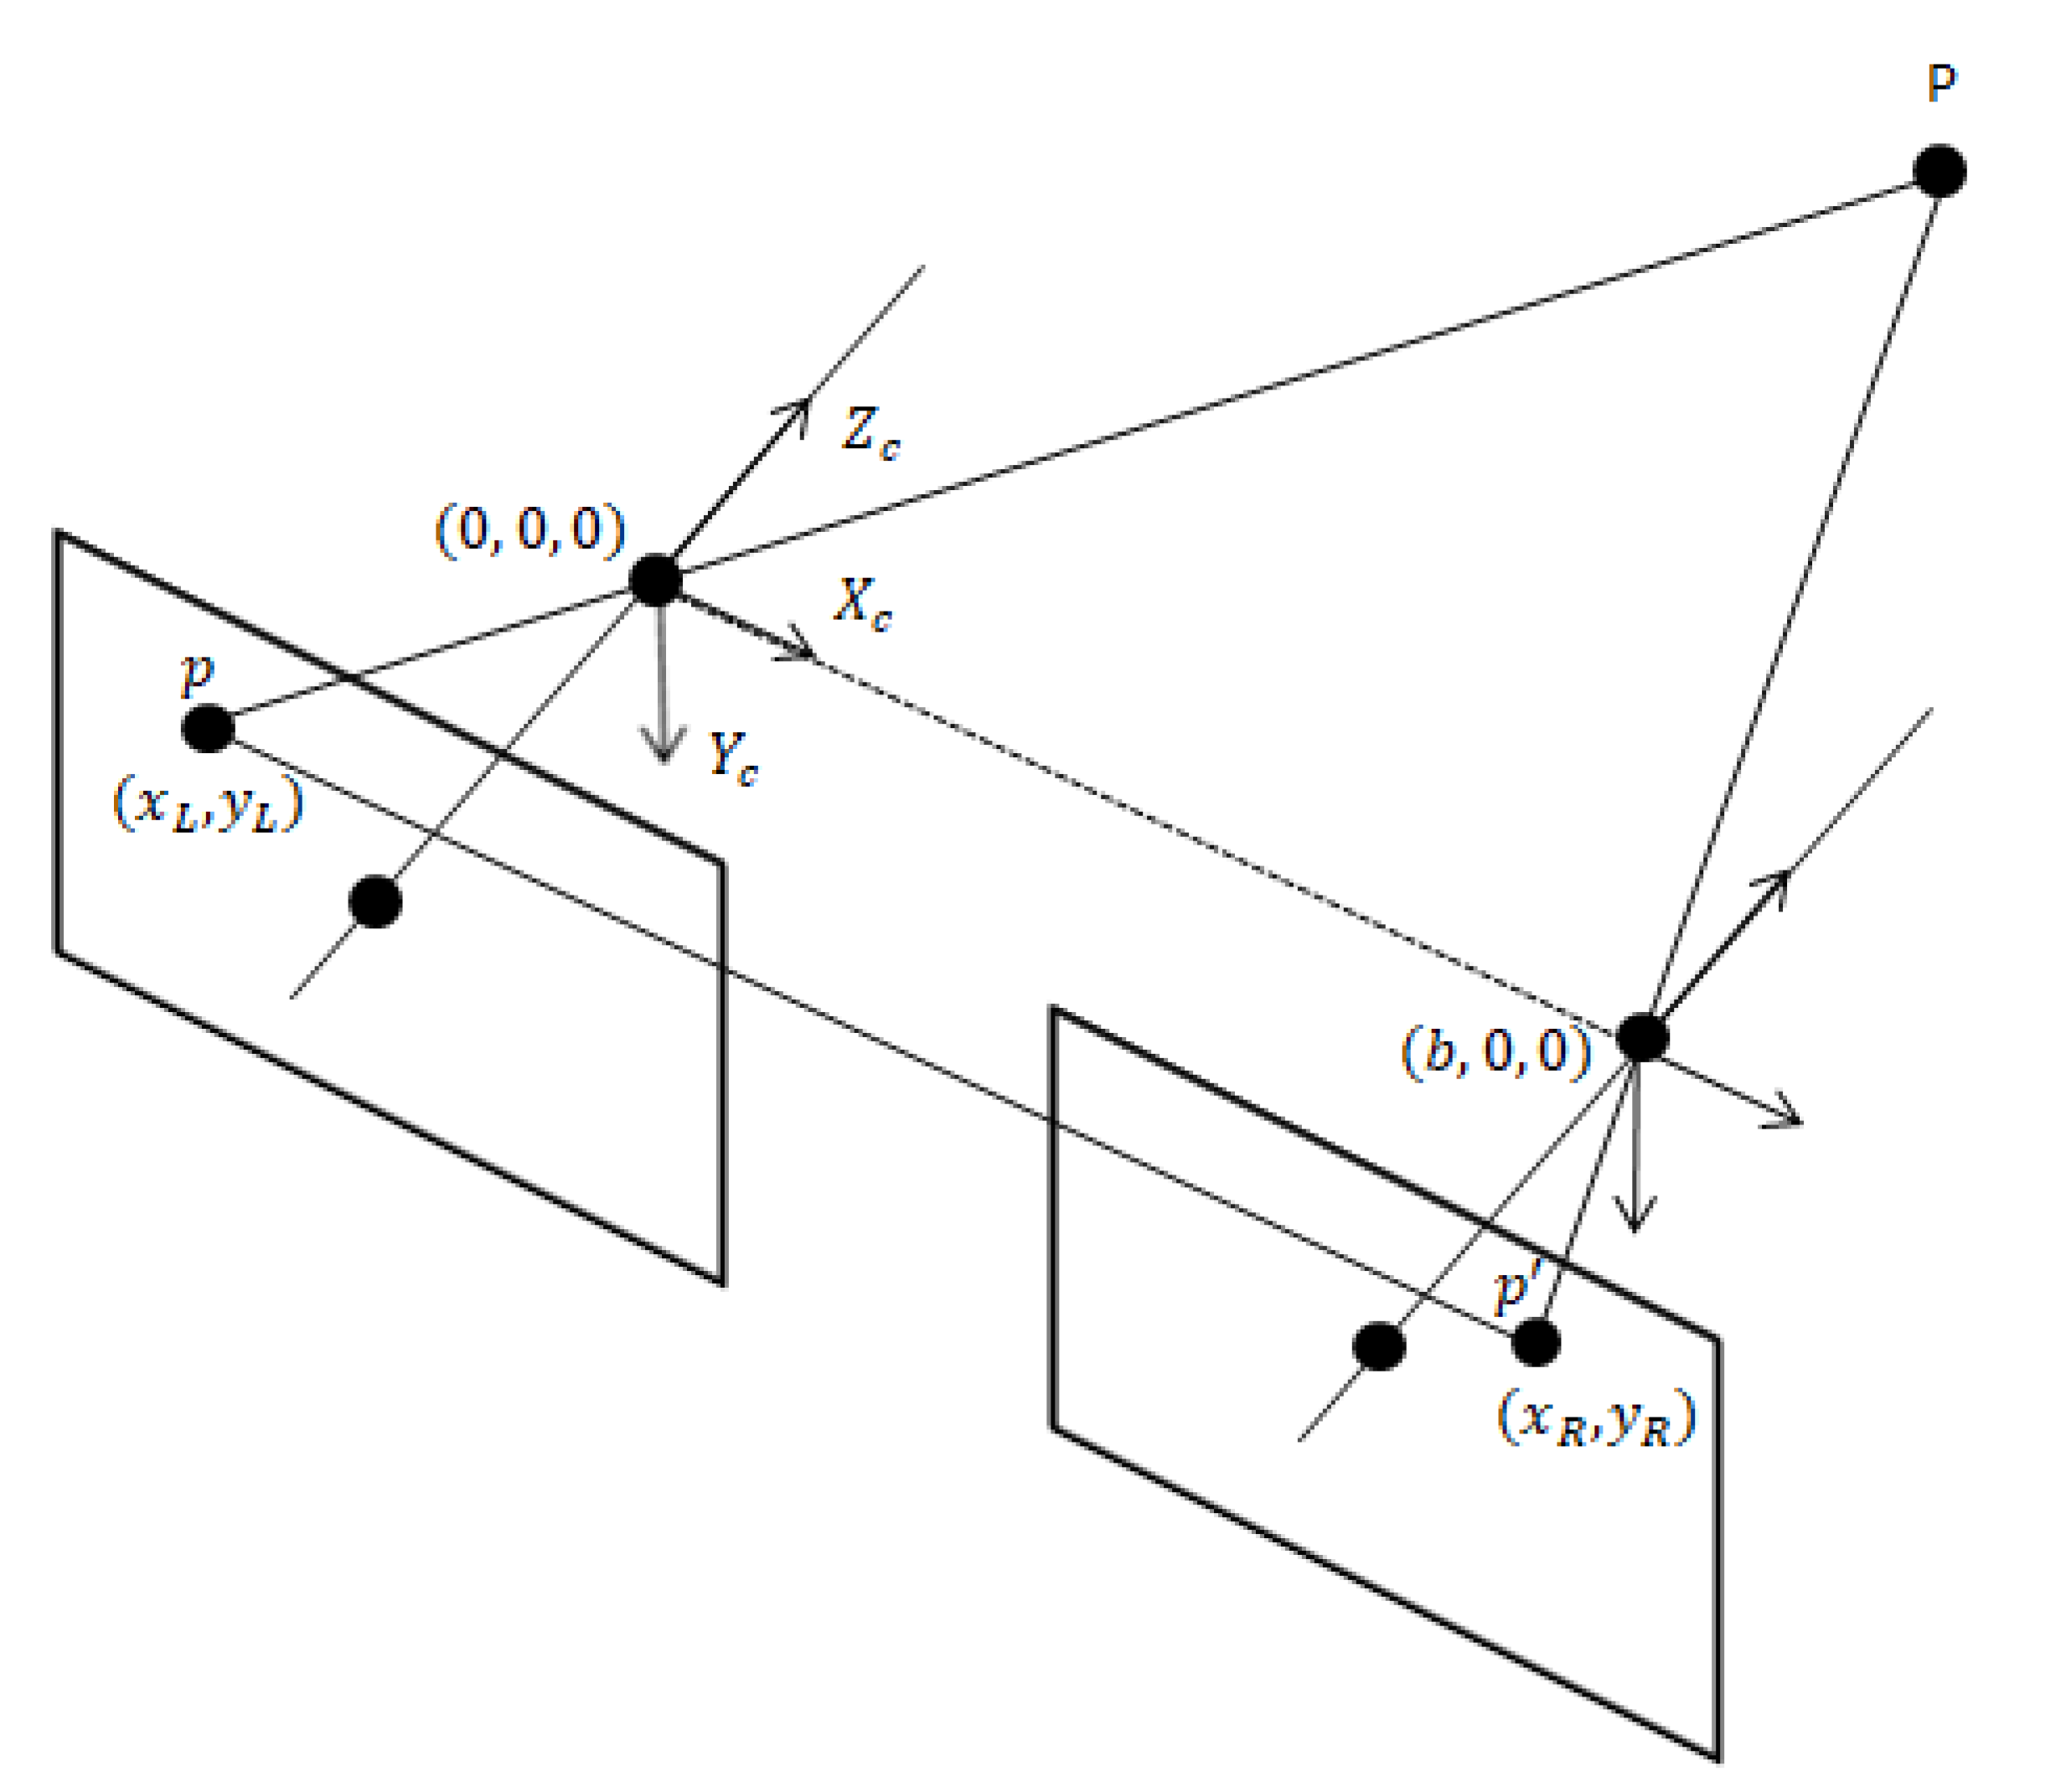
Stereo vision involves finding corresponding points by matching two images of the same object or scene and calculating 3D CCS coordinates using disparity, which is the position difference between corresponding points. In Figure 4, point P in a 3D space passes through the center of a stereo camera lens with baseline b , and is then projected onto p and p of each image plane.
If the camera focal length ( f x ,   f y ) and camera principal point ( c x ,   c y ) are known, the CCS coordinates of point P can be calculated using Equation (6) based on the similarity of trigonometric ratios [34].
X c = b x L c x x L x R ,           Y c = b f x x L c x f y x L x R ,           Z c = b f x x L x R

2.3.1. Distance Calculation

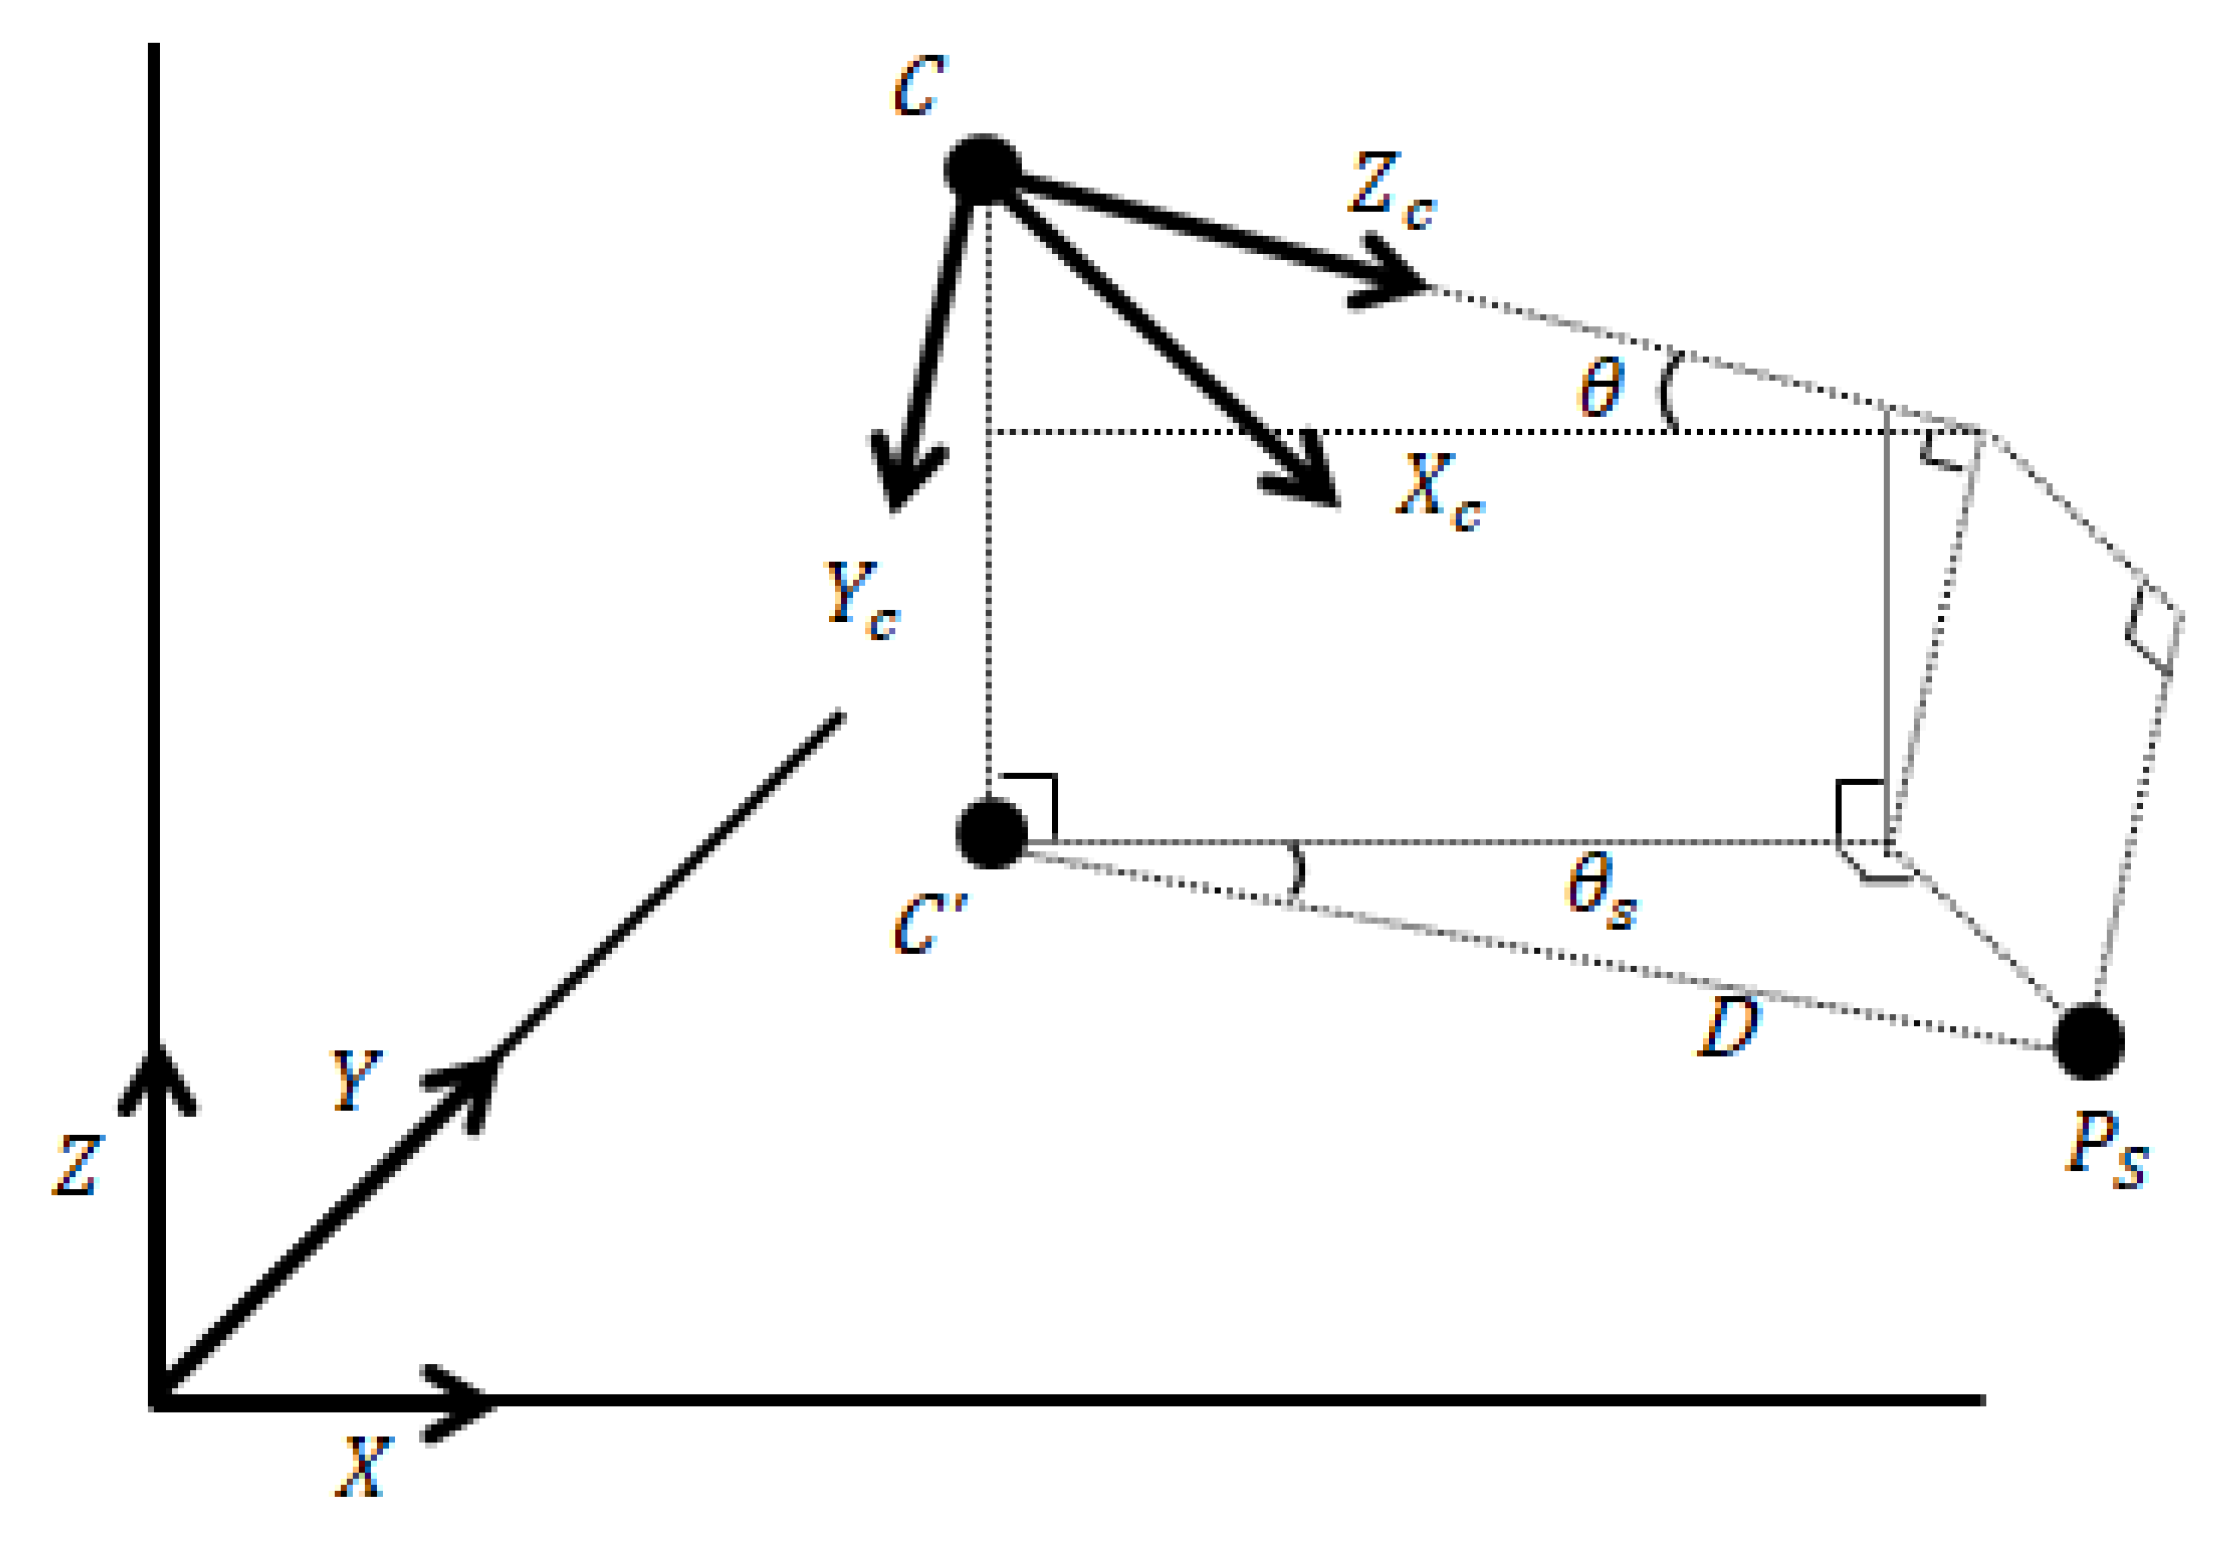
The distance calculation in monocular vision involves finding the distance from the WCS reference point, where the camera lens center vertically intersects the water surface C , to the horizontal distance from an object and relative bearing. The distance for the same scene needs to be computed for comparison. Figure 5 illustrates the stereo vision distance perception for the water surface coordinates, P S , of aquaculture buoys.
X c ,   Y c ,   and   Z c are calculated using Equation (6). The horizontal distance, D s , and relative bearing, θ s , according to the camera tilt angle θ , can be calculated using Equation (7):
D s = Z c c o s θ Y c s i n θ sin ( atan ( Z c c o s θ Y c s i n θ X z ) ) θ s = atan ( X z Z c c o s θ Y c s i n θ )

2.3.2. Epipolar Geometry

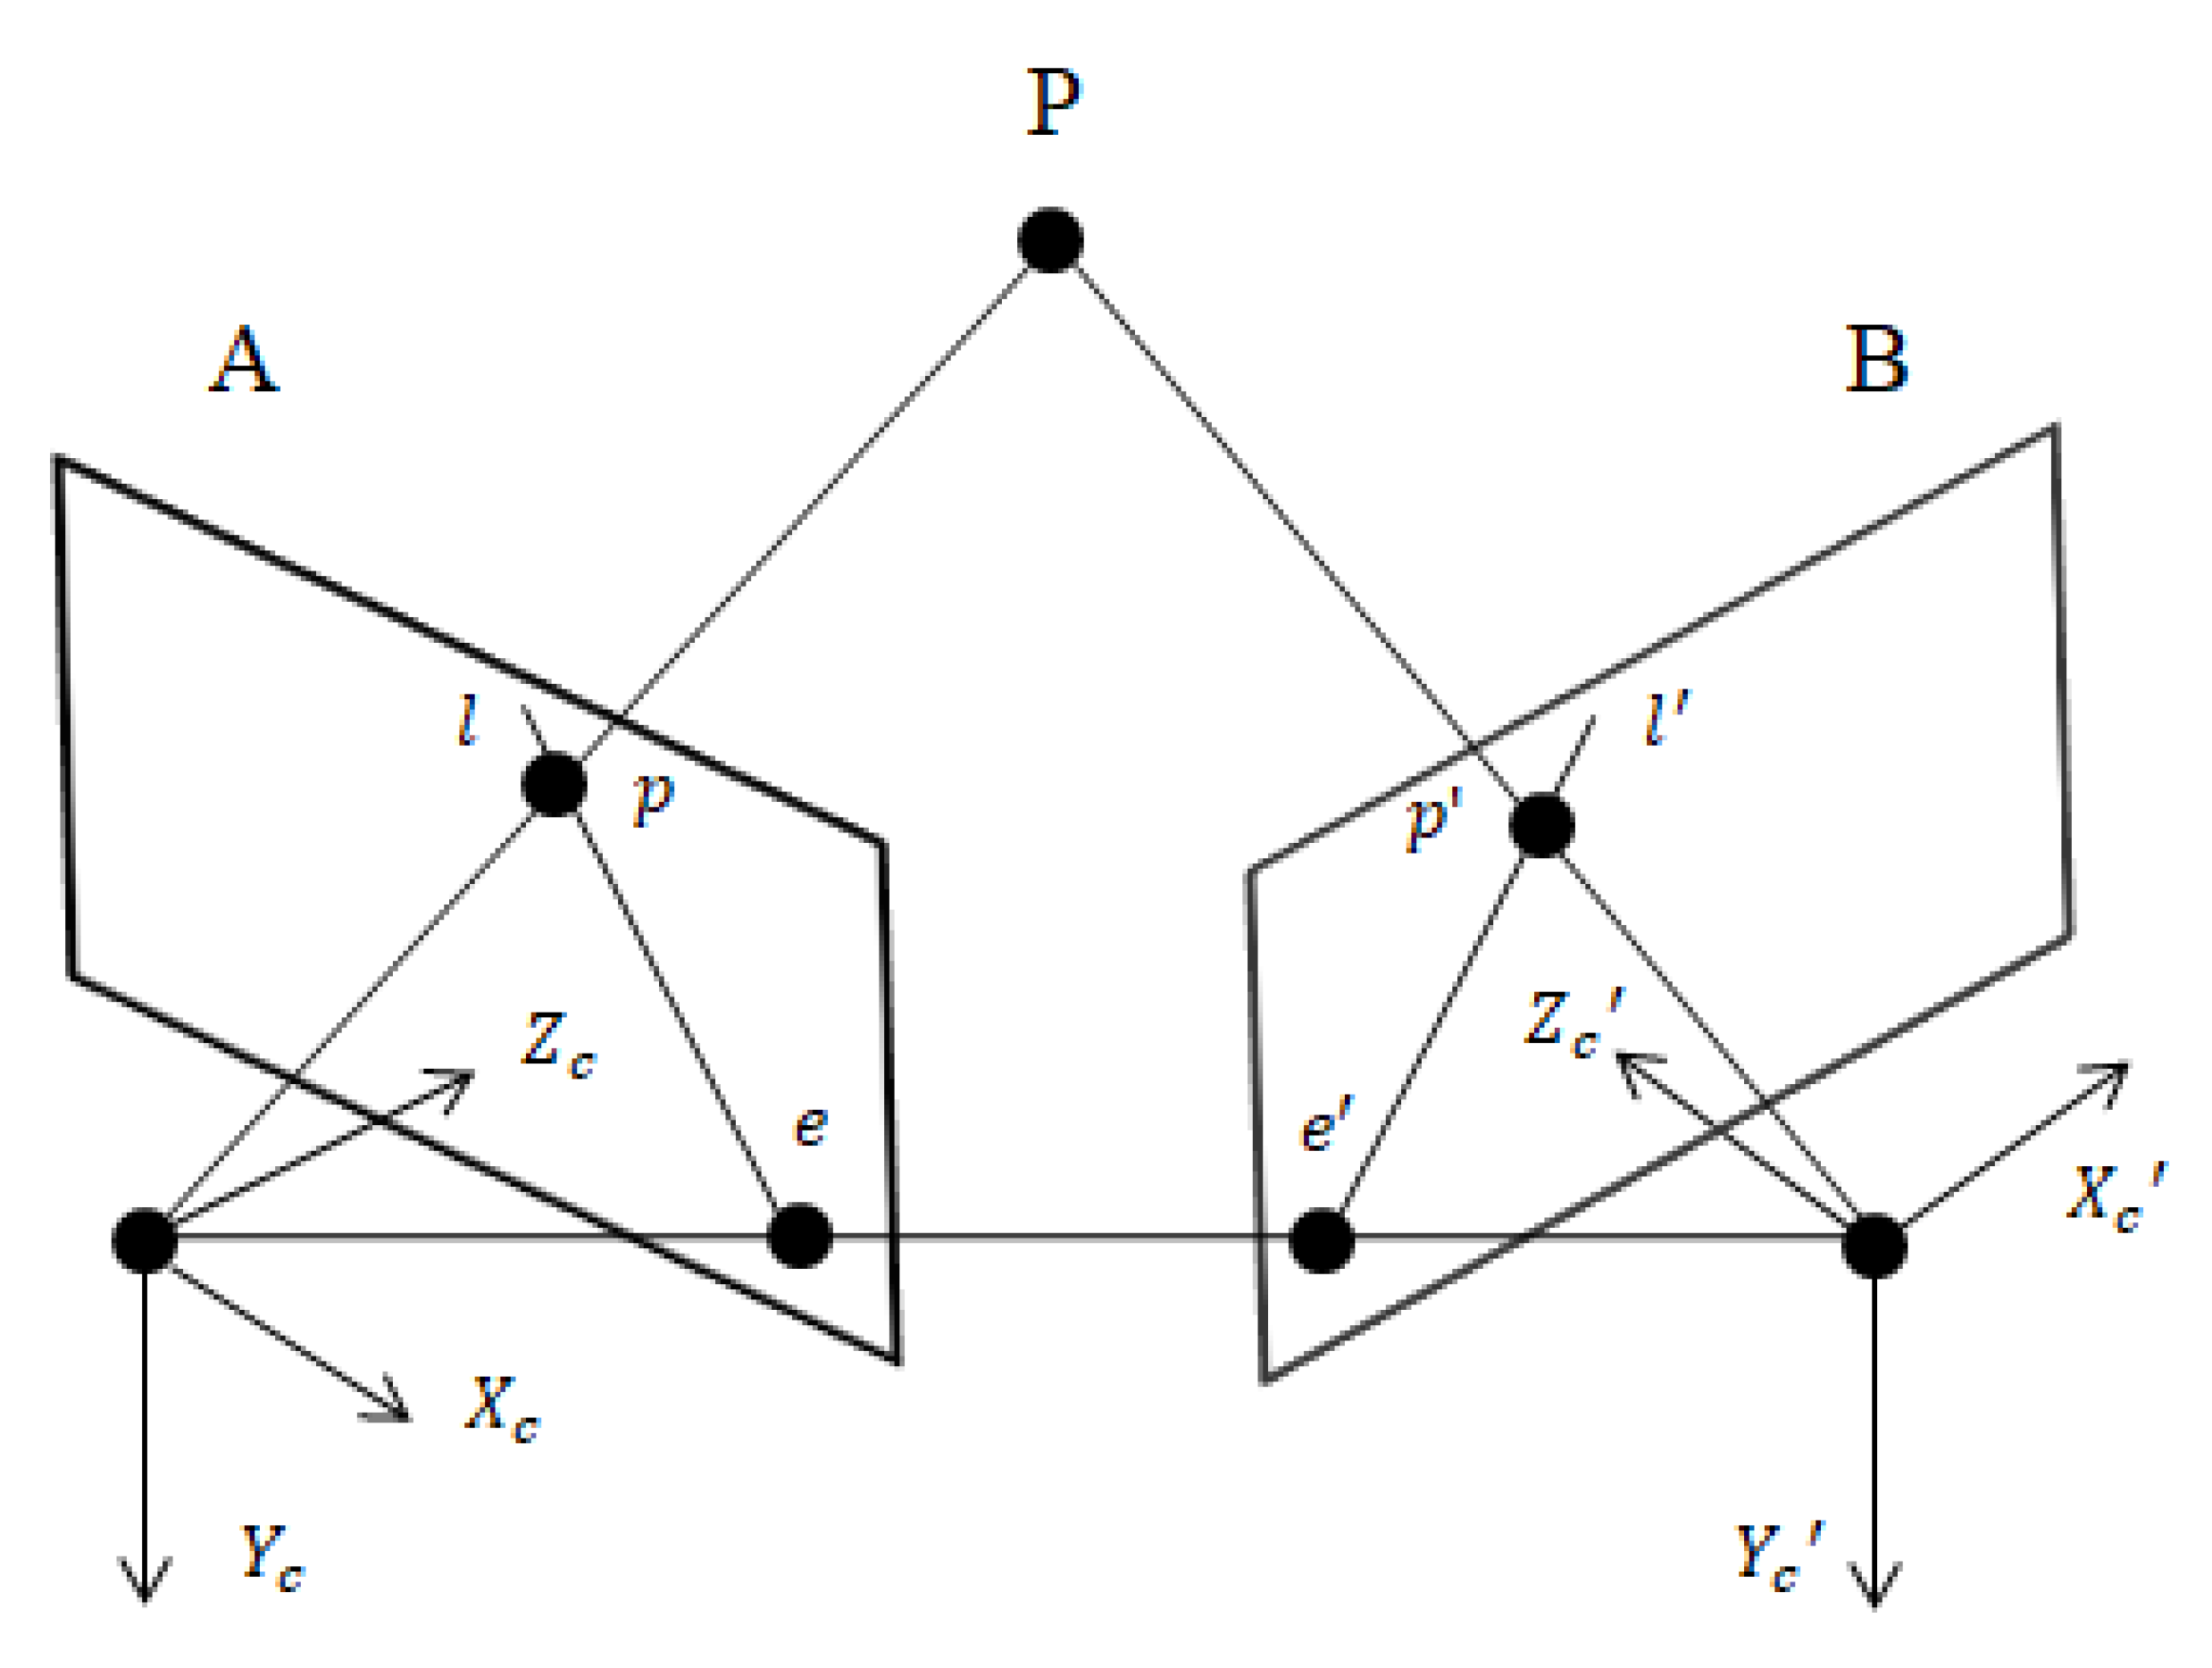
Epipolar geometry examines the geometric relationship between corresponding points in stereo vision. In Figure 6, point P in a 3D space is projected onto p in image A and p in image B. The corresponding points e and e , where the line connecting the camera origins and image planes intersect, are called epipoles. The straight lines l and l connecting the epipole and projection point are called epilines. If the distance from the camera to P is not known, p corresponding to p cannot be uniquely determined. However, the straight line l through which p passes can be uniquely determined and is called the epipolar constraint. However, extensive time and computation resources are required to compare all points and find corresponding points between two images in stereo vision. Therefore, the corresponding points are found using the epipolar constraint by comparing the points on the same line in images after a rectification process so that the epilines are parallel.

2.3.3. Area-Based Matching

Area-based matching is an algorithm for continuously comparing the regions of a window, which is a set unit of neighboring pixels of a certain size. Of the different area-based matching methods, this study employed SSD and NCC, which demonstrate a relatively higher accuracy.
  • SSD
The SSD method involves calculating the similarity between images by summing the square of the brightness differences between pixels within a square window ( W ) in the reference I 1 and target I 2 images [35], as follows:
i ,   j W I 1 i ,   j I 2 x + i ,   y + j 2
2.
NCC
The NCC method involves calculating the similarity between images using Equation (9) for pixels within a square window ( W ) in reference I 1 and target I 2 images [35].
i ,   j W I 1 i ,   j × I 2 x + i , y + j i , j W I 1 i , j 2 × i , j W I 2 x + i ,   y + j 2

2.3.4. Feature-Based Matching

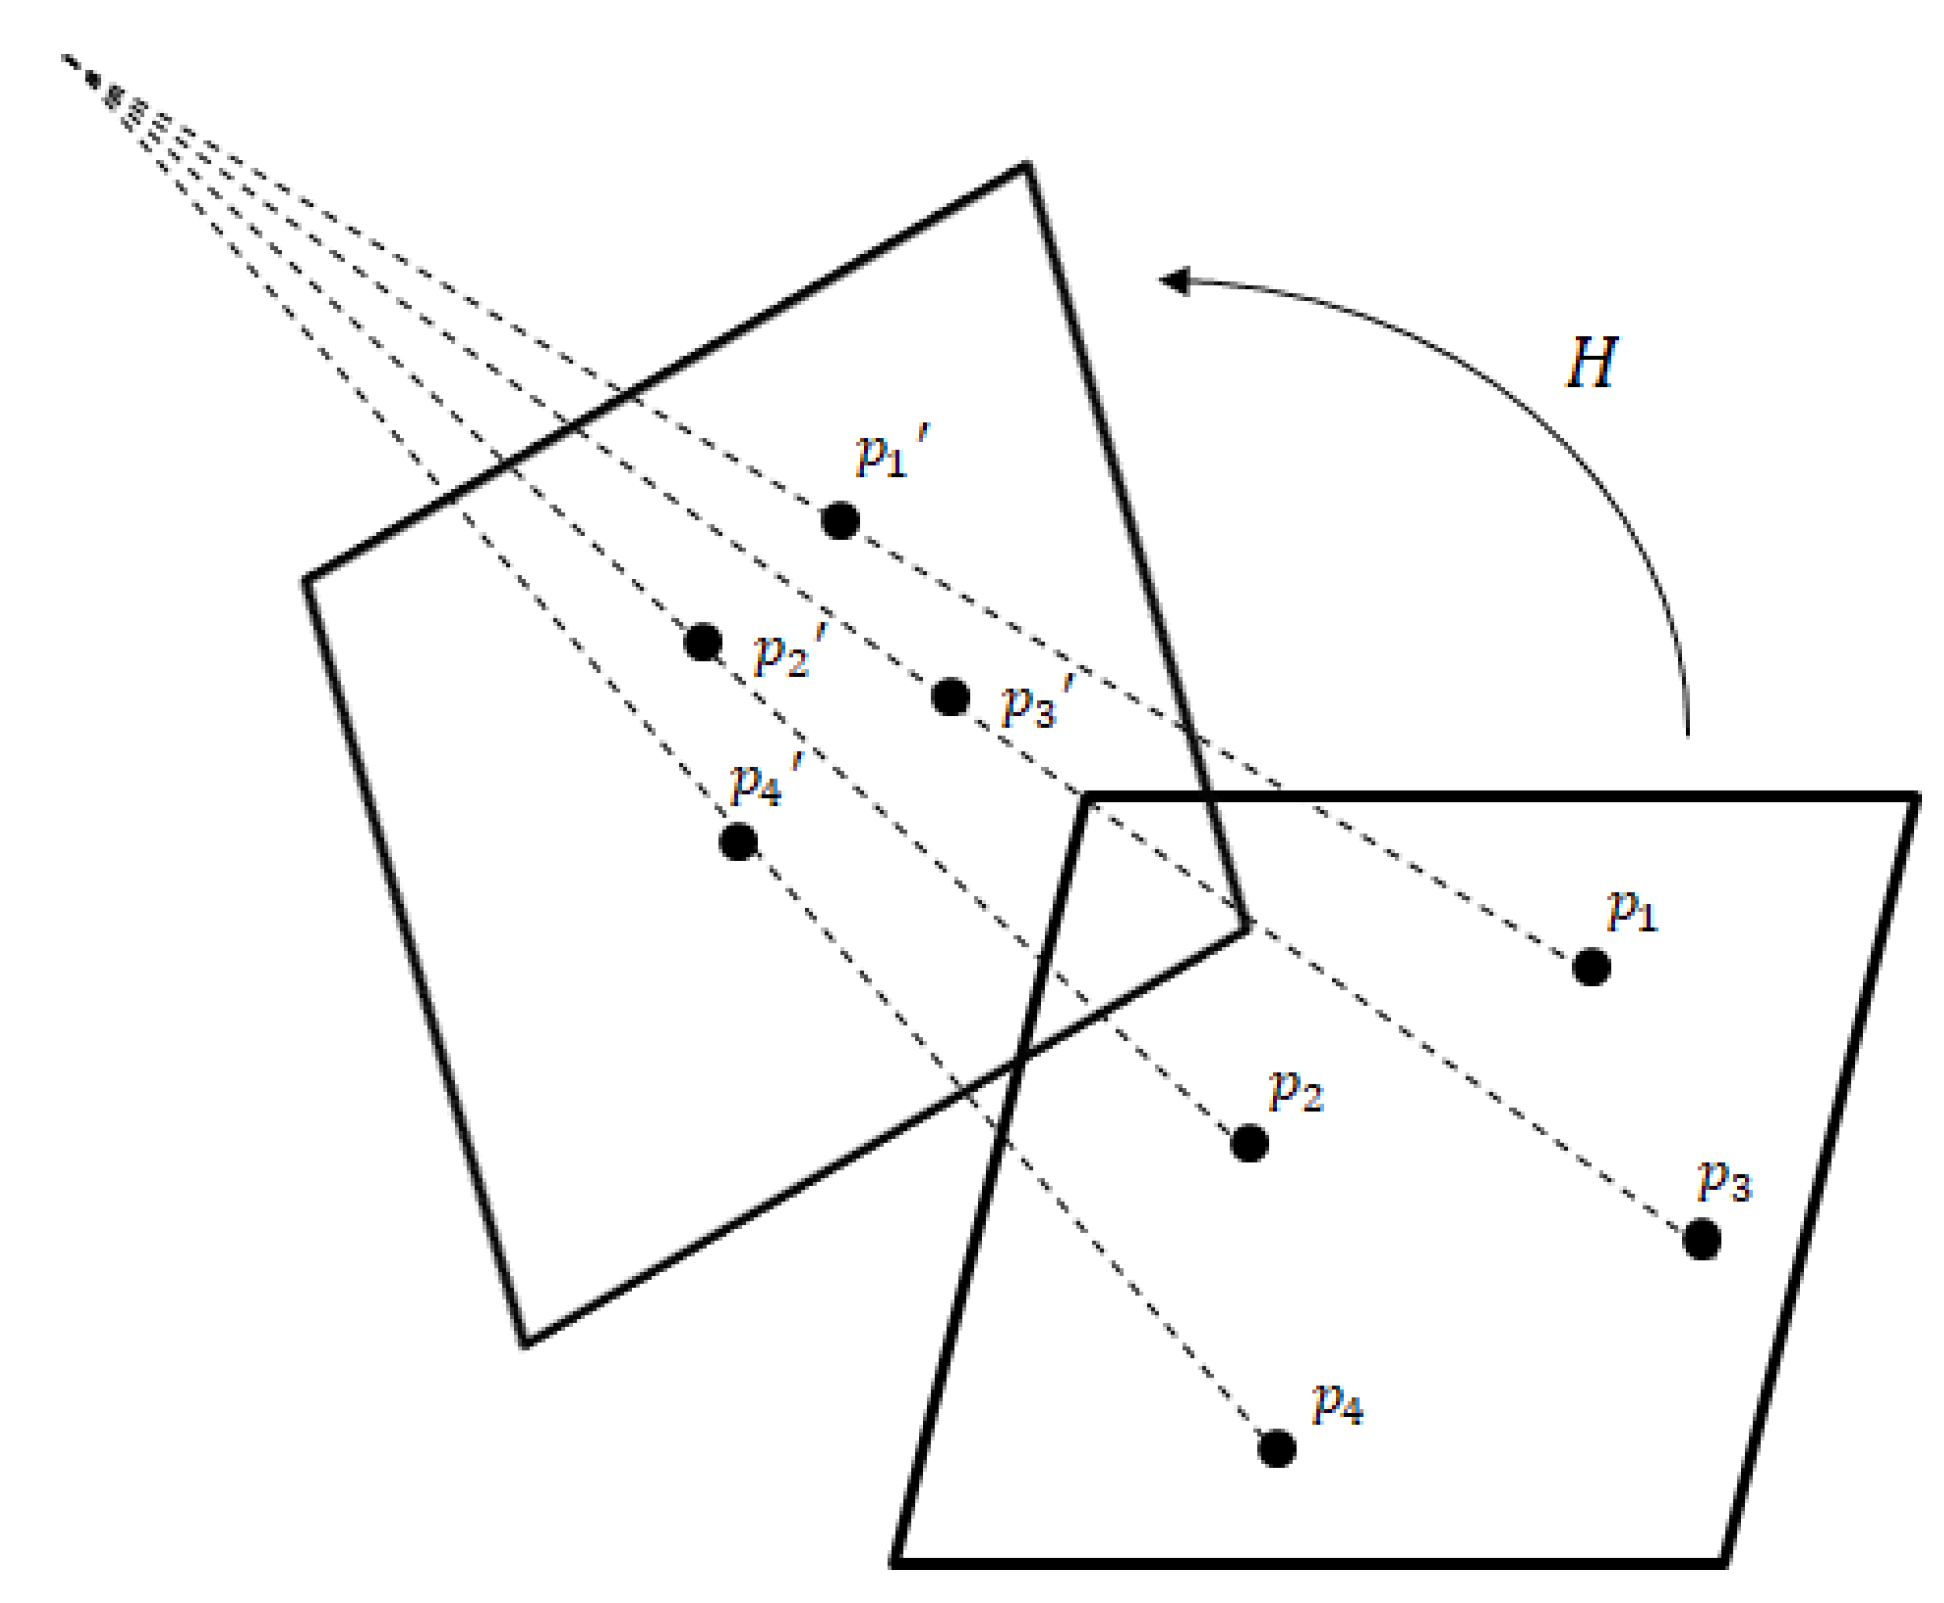
Feature-based matching involves finding distinctive feature points such as corners or junctions in images and generating a descriptor that enables feature points to be compared by describing corresponding regional characteristics. We used the ORB algorithm considering ORB’s fast speed, accuracy, and robustness to size changes and rotations [28]. ORB uses the advantages of two algorithms, feature from accelerated segment test (FAST) [36] as a detector and binary robust independent elementary features (BRIEF) [37] as a descriptor. The feature points that were not properly matched were excluded using the brute force hamming matcher. When one plane is projected onto another plane, as in Figure 7, the transformation relationship in Equation (1) is established, called a homography matrix (H). The RANSAC [38] algorithm arbitrarily selects four pairs of corresponding points and selects the homography matrix with maximum matched corresponding points.
p i = H p i x i y i 1 = h 1 h 2 h 3 h 4 h 5 h 6 h 7 h 8 h 9 x i y i 1

3. Experiment Results

3.1. Detecting Model

3.1.1. Introduction of Dataset

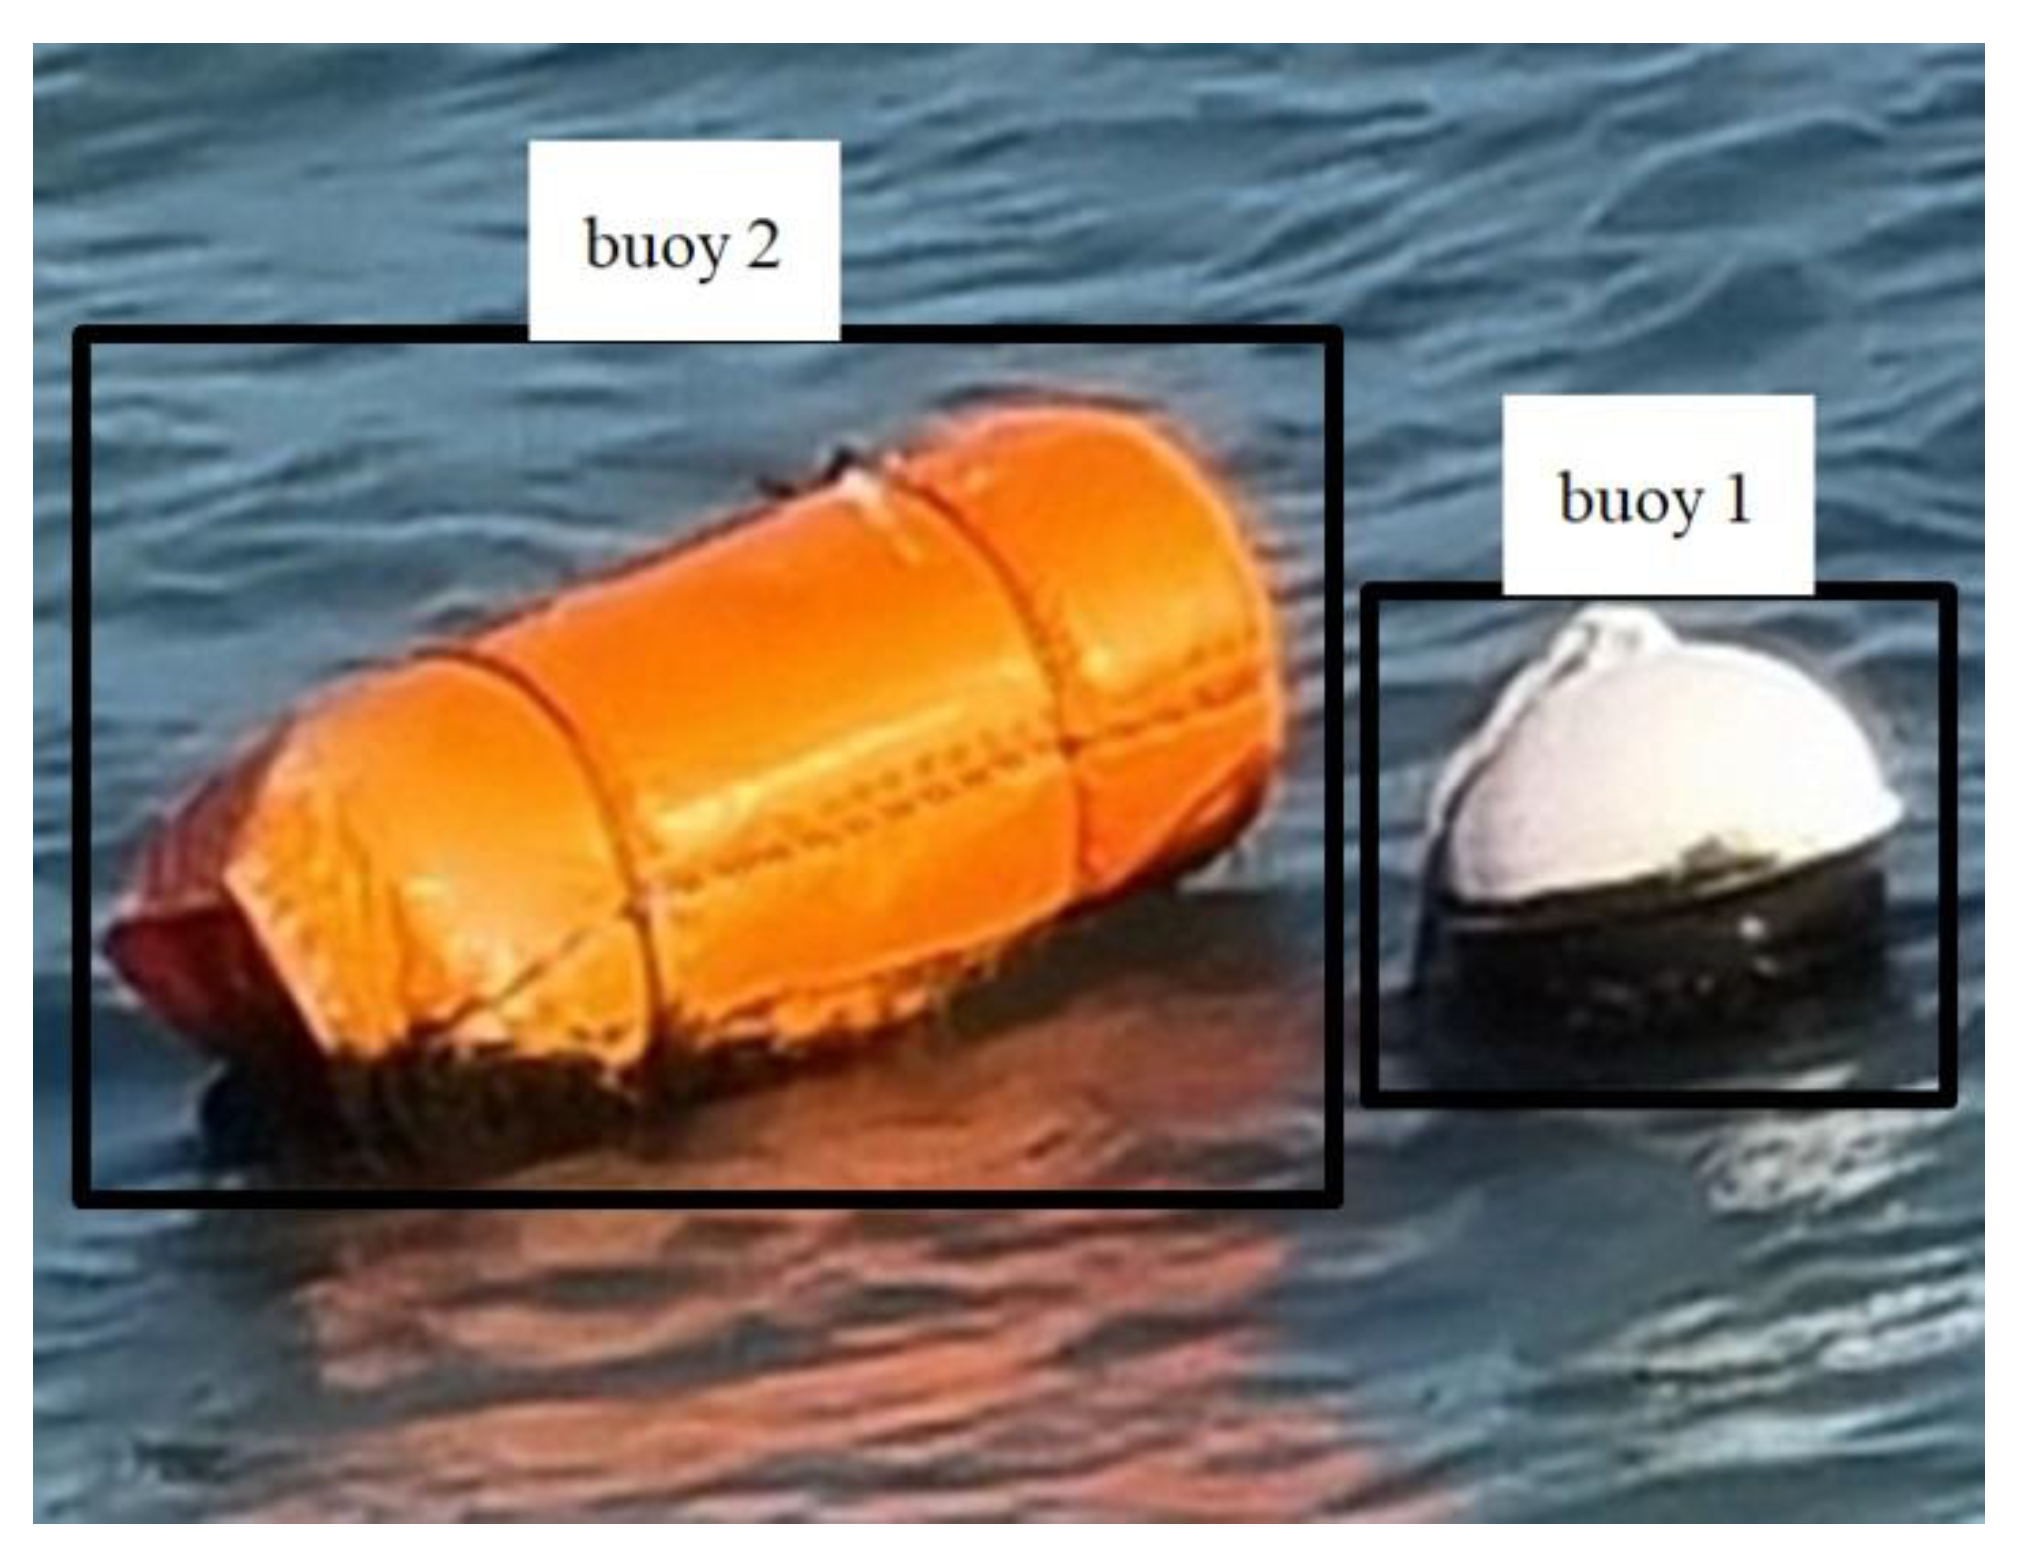
Training data, such as in Figure 8, are needed for custom training of YOLOv5. Buoys 1 and 2 are aquaculture buoys commonly found in the coastal regions of Korea. The training data include the locations of bounding boxes encompassing the objects in images and the classes of the objects through the Labellmg program. The images of buoys 1 and 2 were captured from a ship sailing between aqua farms. Since the captured images had a resolution of 4032 × 3024 or higher, the parts necessary for training were cut to 256 × 256. The training dataset comprised 2700 images, and the ratio of training to testing was set to 8:2. The number of data corresponding to each class is shown in Table 2.

3.1.2. Mosaic Augmentation

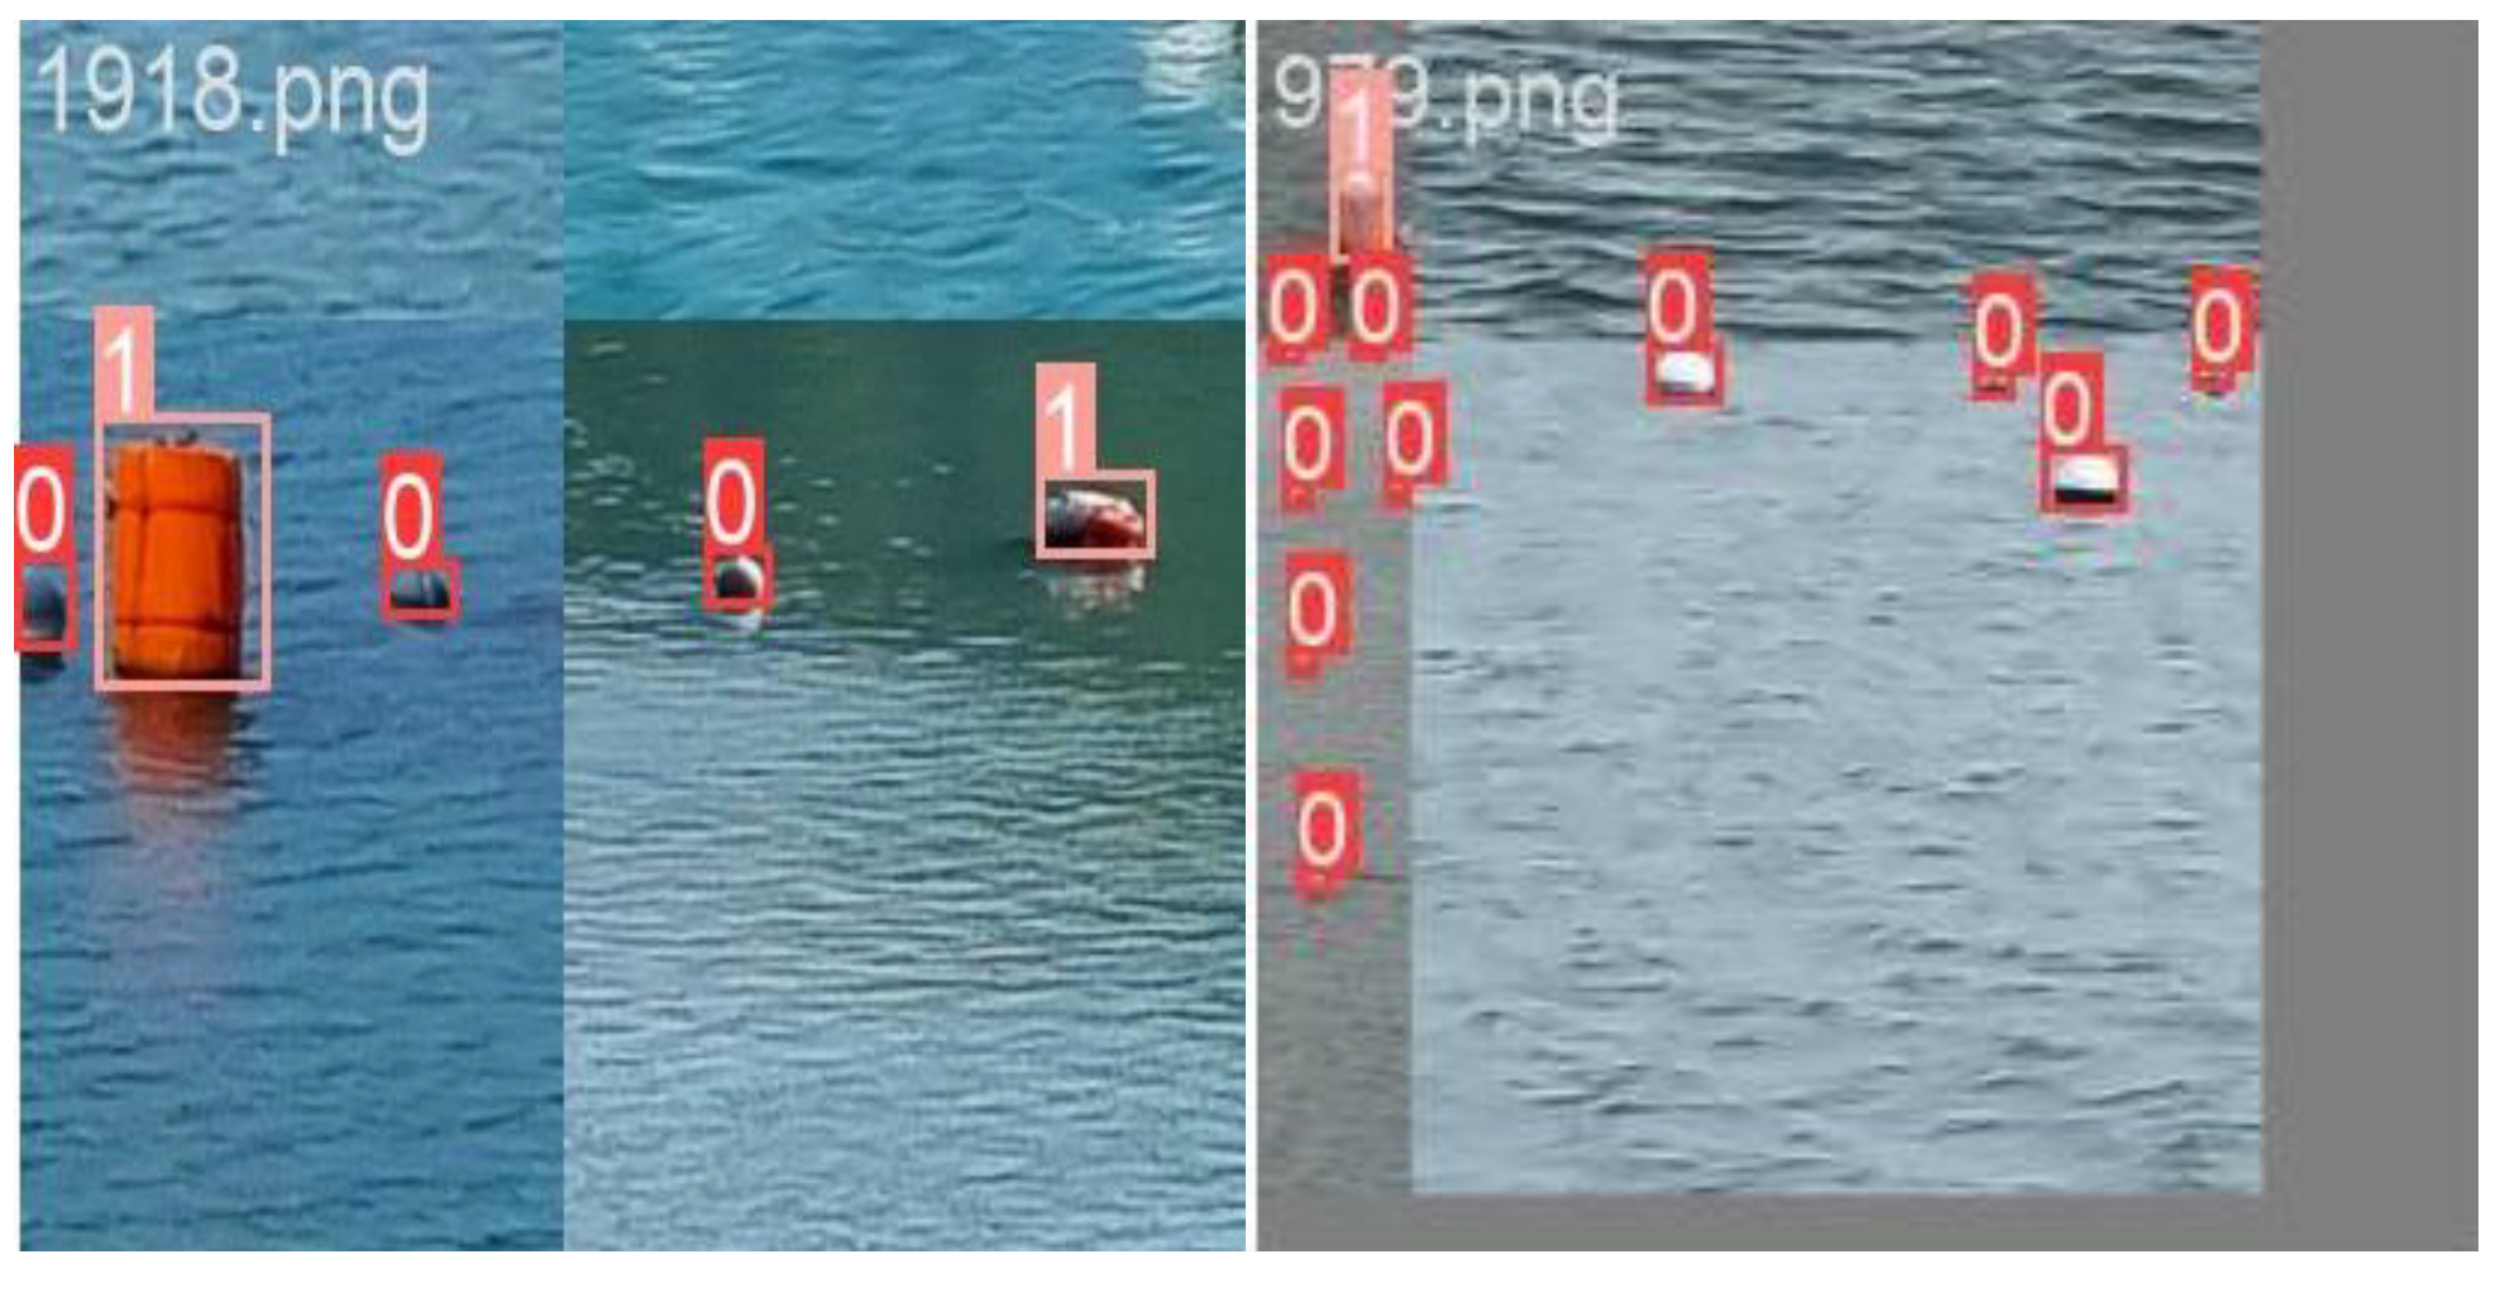
Mosaic augmentation was used to train the model because the sizes of buoys in the training data are relatively small, making them difficult to detect. The main idea is to crop four images randomly and then concatenate them into one image, as shown in Figure 9. This enriched the image background and increased the number of small-sized objects. Moreover, mosaic augmentation allows the model to learn how to identify objects on a small scale and reduces the need for large mini-batch sizes during training. This significantly improved model robustness and performance when recognizing small targets.

3.1.3. Training Results

YOLOv5 is written using the Python language. The training using the YOLOv5x model was run under the Windows 11 operating system, CUDA 11.6, Pytorch 1.12.1, Python 3.9, and a Nvidia GeForce RTX 3070i GPU. The input image size was 256 × 256. The networks were trained for 300 epochs using the stochastic gradient descent optimizer with a learning rate of 0.01 and batch size of 32. After training, the weight file of the model with the highest accuracy was saved, and the validation set was used to evaluate the performance. The performance of the trained model is presented in Table 3.
The number of frames per second (FPS) was used to evaluate the detection speed. The mean average precision (mAP) was adopted to evaluate the accuracy, as follows:
P P r e c i s i o n = T P T P + F P
R R e c a l l = T P T P + F N
A P i = 0 1 P R d R
m A P = 1 N i = 1 N A P i
where precision (P) represents the ratio of true positive values (TP) to the total positive values classified by the model, recall (R) represents the ratio of TP to the actual true values, FP indicates false positive, and FN is false negative. APi is the average accuracy of category i and mAP is the average AP across all N categories.

3.2. Distance Calculation

3.2.1. Experimental Environment and Equipment

A ZED (Stereolabs, San Francisco, CA, USA) stereo camera, which provides high-resolution images of up to 2208 × 1242, was used for the experiments. The camera specifications are presented in Table 4.
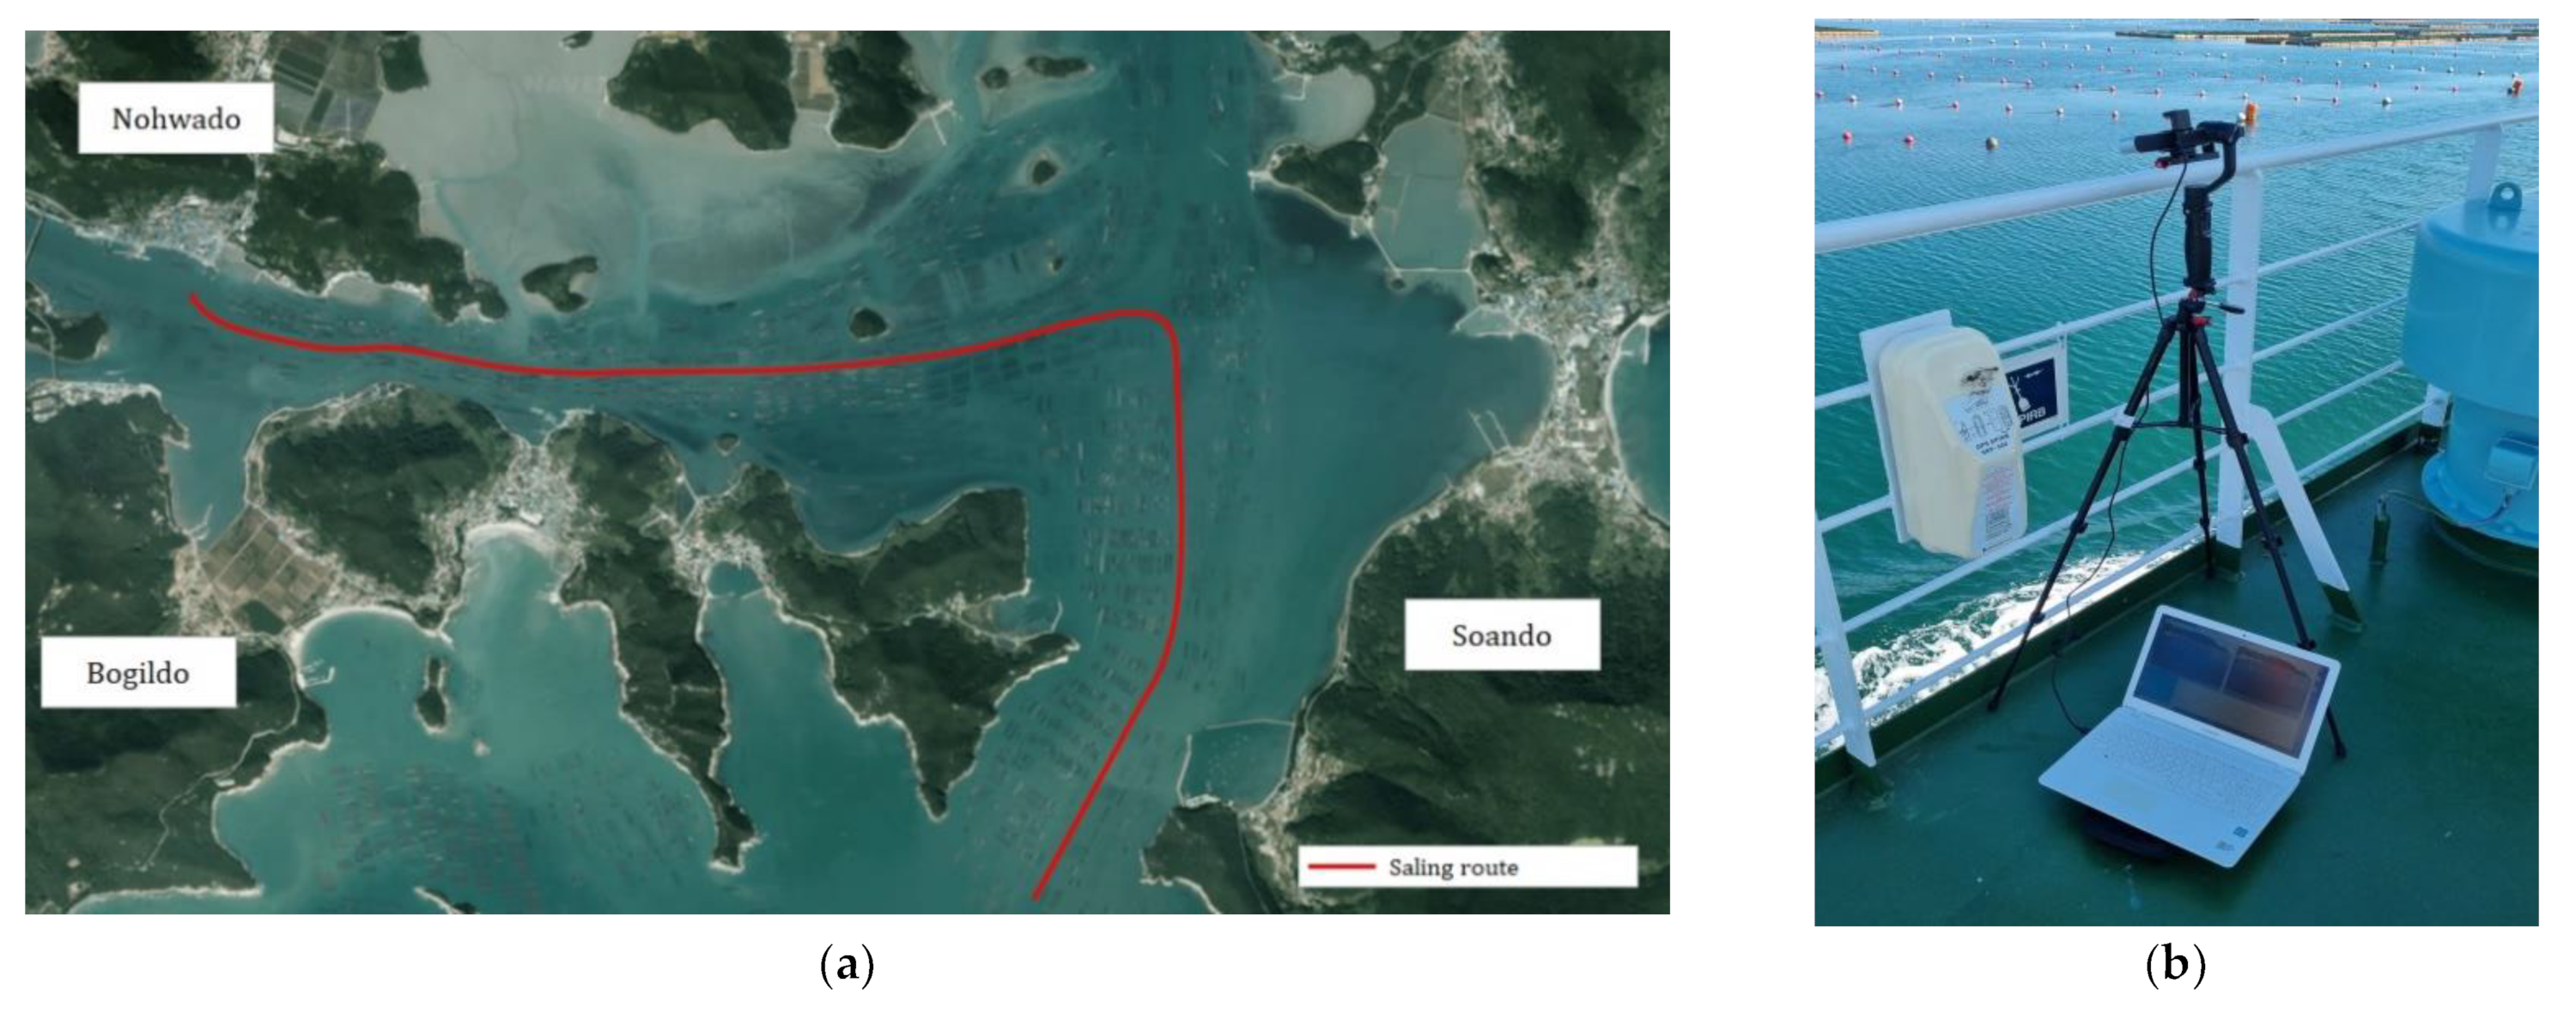
The experiments were conducted in a laboratory and on the deck of a passenger ship sailing between Nohwado, Soando, and Bogildo in Wando County, South Jeolla Province, Korea. The passenger ship sails between the islands where aqua farms are located, as shown in Figure 10a. For the camera to maintain a constant angle under external influences, a tripod and a Hohem iSteady Multi 3-axis gimbal were installed along with the ZED in the laboratory and on the passenger ship deck, as shown in Figure 10b.
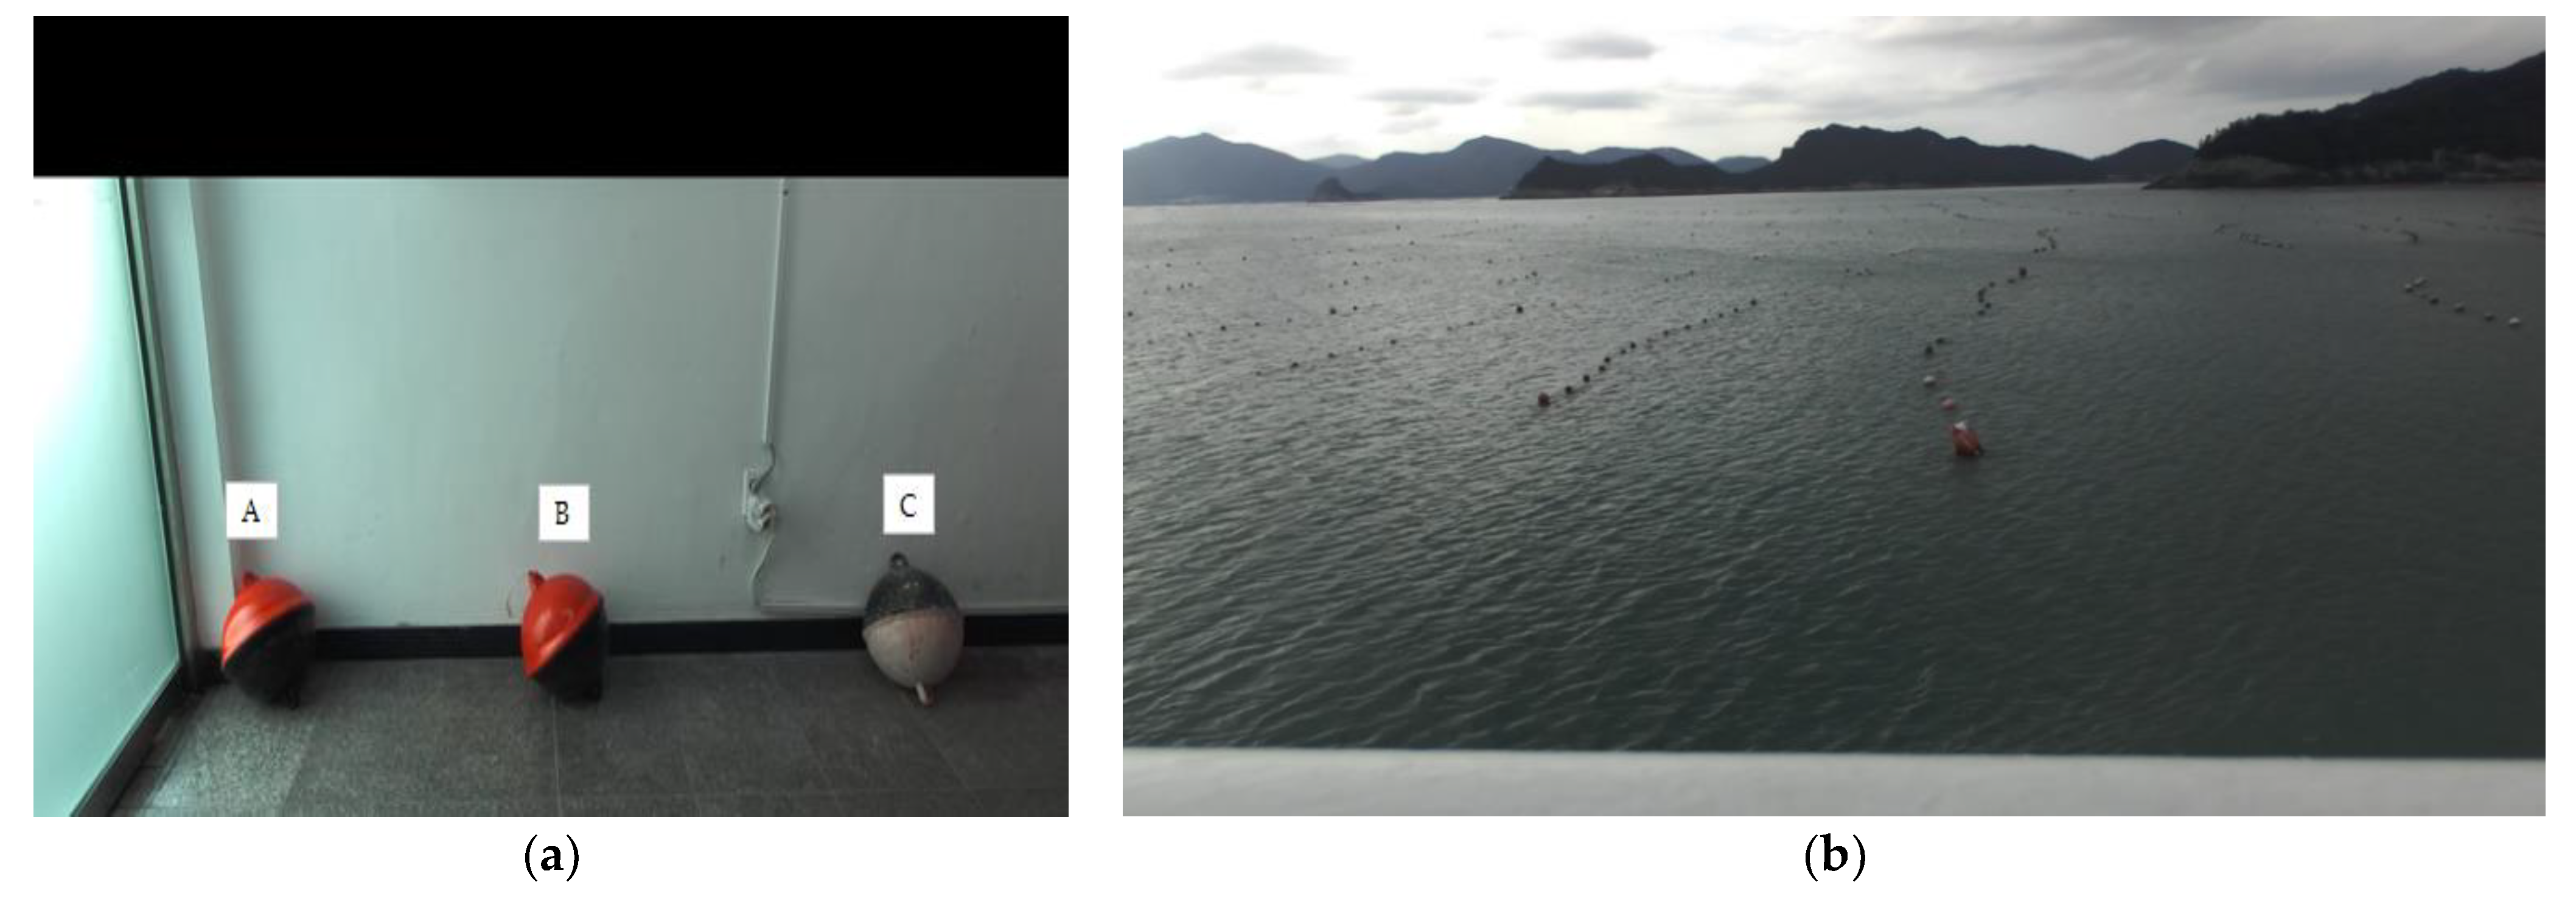
Aquaculture buoys were placed in the laboratory to compare the distance calculation performance of monocular and stereo vision using the installed equipment, as shown in Figure 11a. The ZED captures images of the buoys, recognizes them through the trained detection model, and extracts image coordinates from the bottom center of the bounding box. The extracted image coordinates were used to calculate the distance based on monocular and stereo vision. The distance was compared with the distance measured using Bosch GLM 50-23G laser distance measuring equipment (Experiment A).
The equipment was placed on the passenger ship deck, and the aqua farms were captured, as shown in Figure 11b, to extract image coordinates as in Experiment A. The distance was calculated based on monocular and stereo vision and then compared with the radar image of the ship (Experiment B).

3.2.2. Camera Calibration

The intrinsic and extrinsic camera parameters are required to identify the relationship between the 3D coordinate system and the projection point on a 2D image plane. The process of estimating such values is called camera calibration. The ZED is calibrated by the manufacturer, and the relevant parameter information is provided in Table 5. This information was used when calculating the distance based on stereo vision.
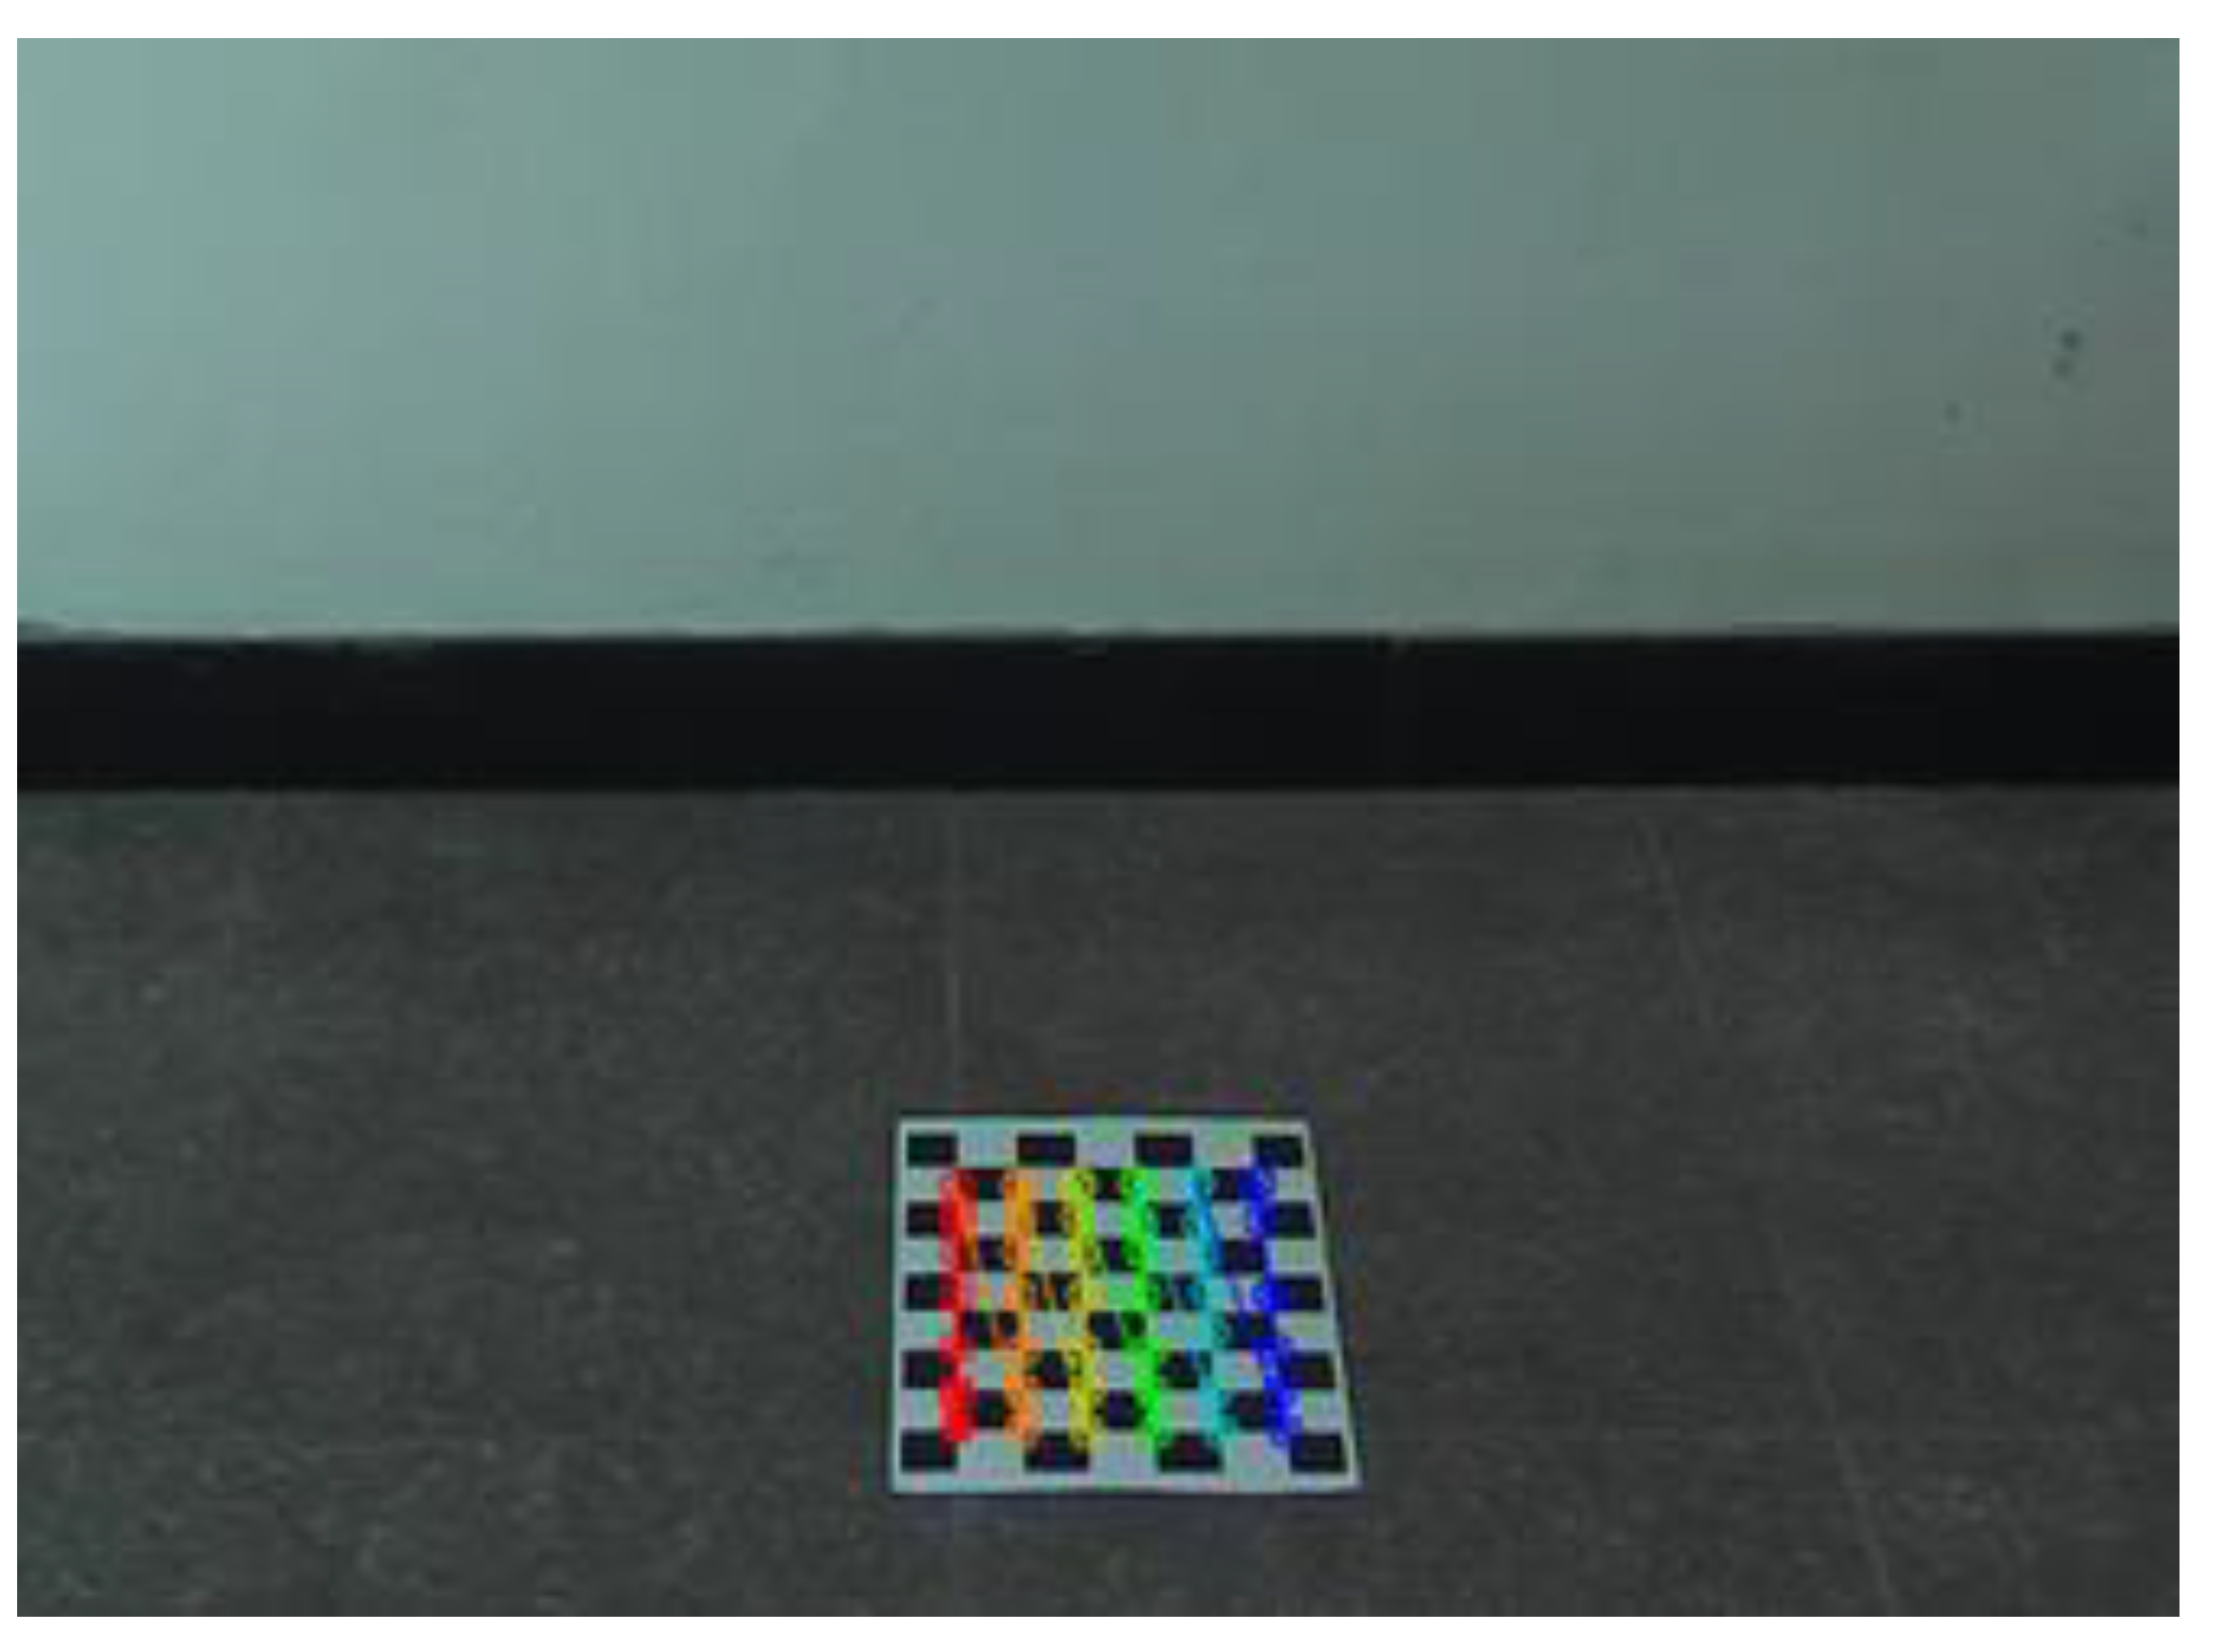
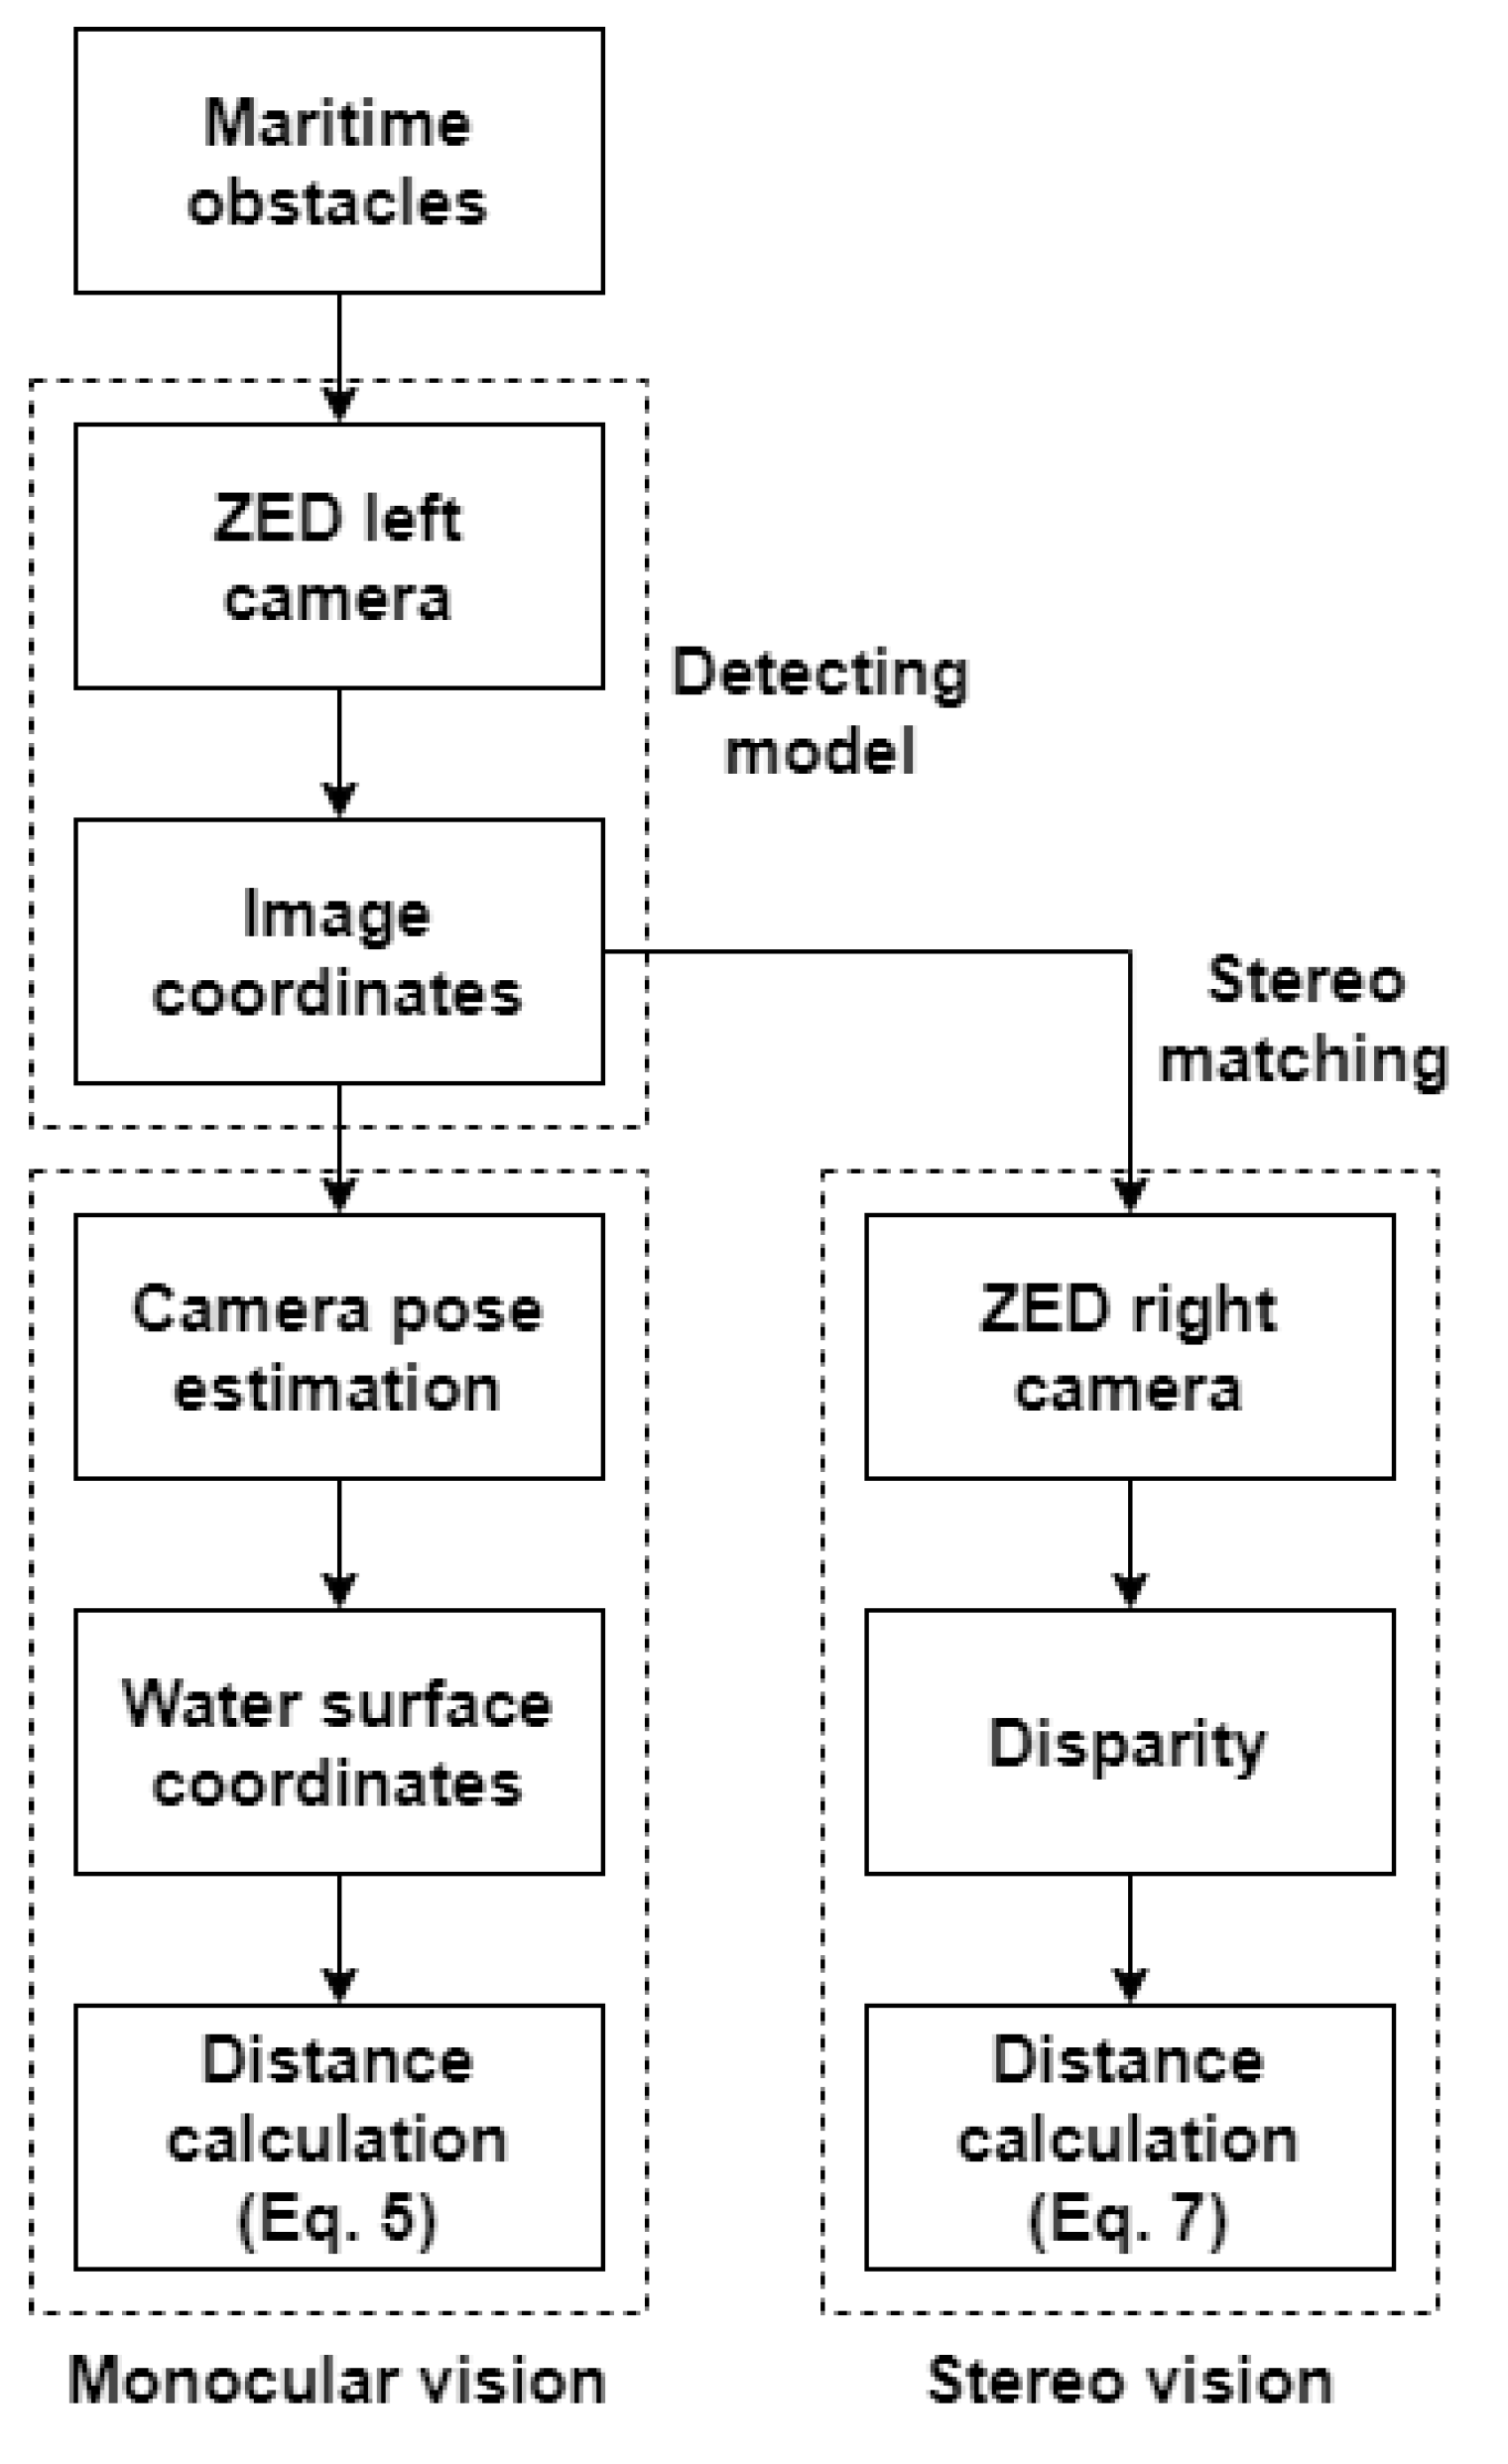
The distance calculated based on monocular vision used the left-eye camera of the ZED. The rotation matrix (R) and translation vector (T) in Table 5 represent the conversion of position and direction of the left-eye and right-eye cameras. A checkerboard was used in monocular vision because R and T between WCS and CCS are needed. Each checkerboard corner was found using the findchessboardcorners function of OpenCV, as shown in Figure 12. The corresponding 3D coordinates were input to estimate the camera position, resembling a PnP problem. POSIT [39] is widely used for solving the PnP problem [40]. In this study, R and T were estimated for the point where the center of the camera lens vertically intersects the water surface. They become the WCS reference, based on 2D and 3D coordinates of each corner found using the solvePnP function of OpenCV, to which POSIT [39] is applied, as shown in Table 6. The values in Table 6 were used for Experiment A. In Experiment B, however, the distance from the sea to the experimental equipment was measured using a laser distance measuring device and applied to the 3D z-axis coordinates of each checkerboard corner. R and T were re-estimated for the point where the camera lens center vertically intersects the water surface and becomes the reference of WCS. Figure 13 shows the summary of all the processing steps of the experiments.

3.2.3. Experiment A

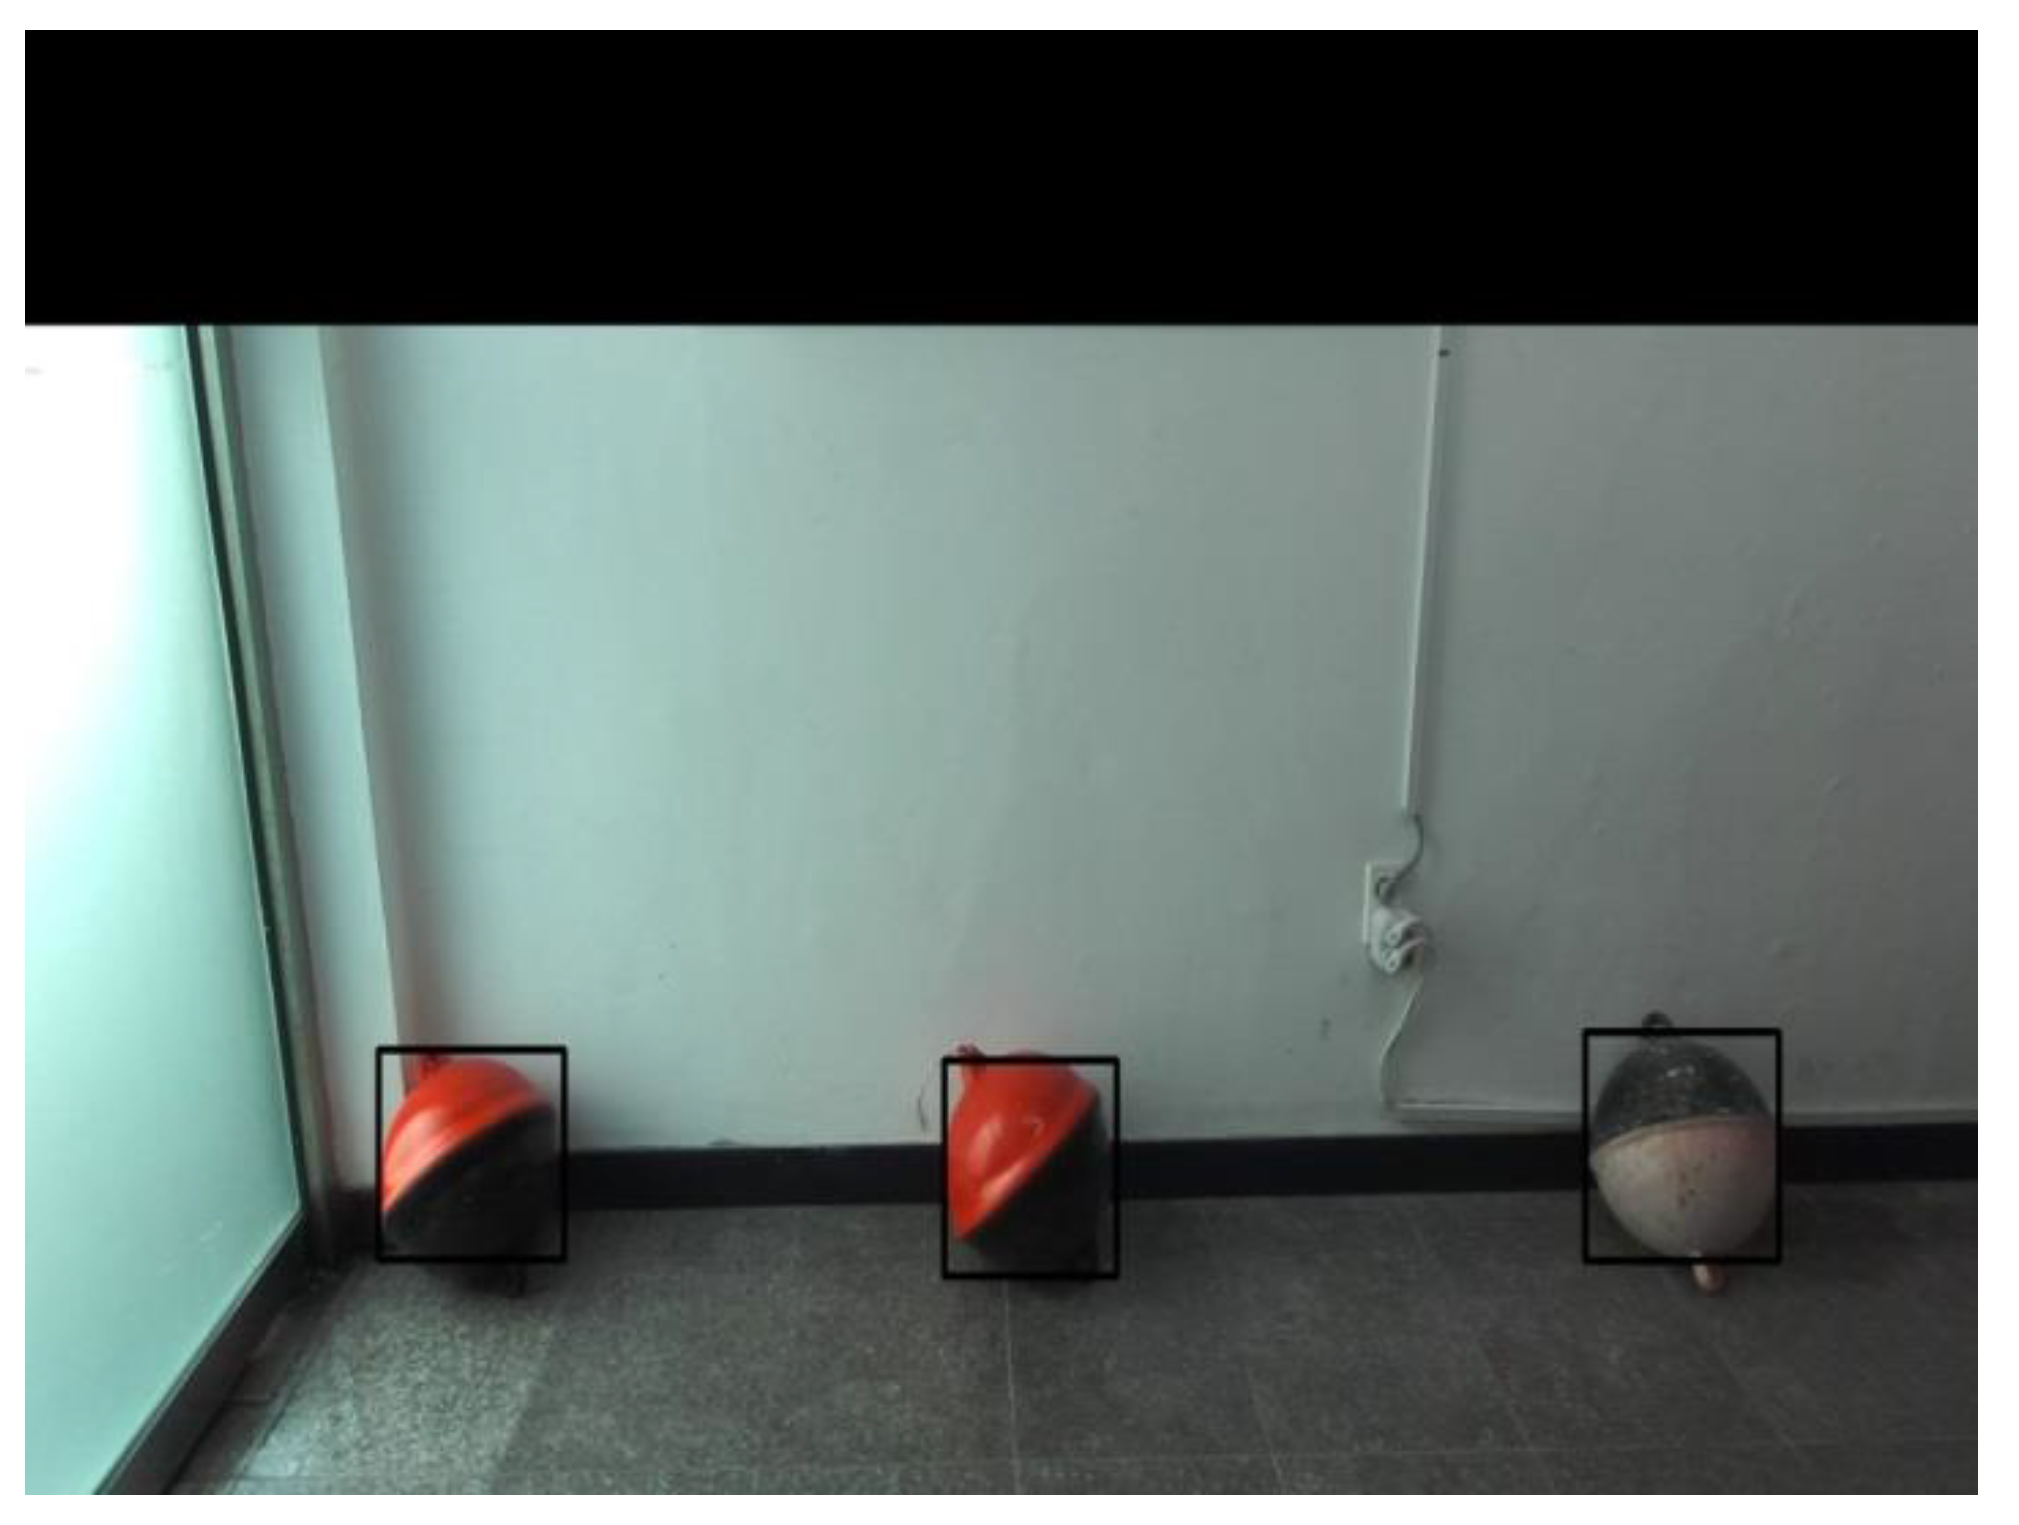
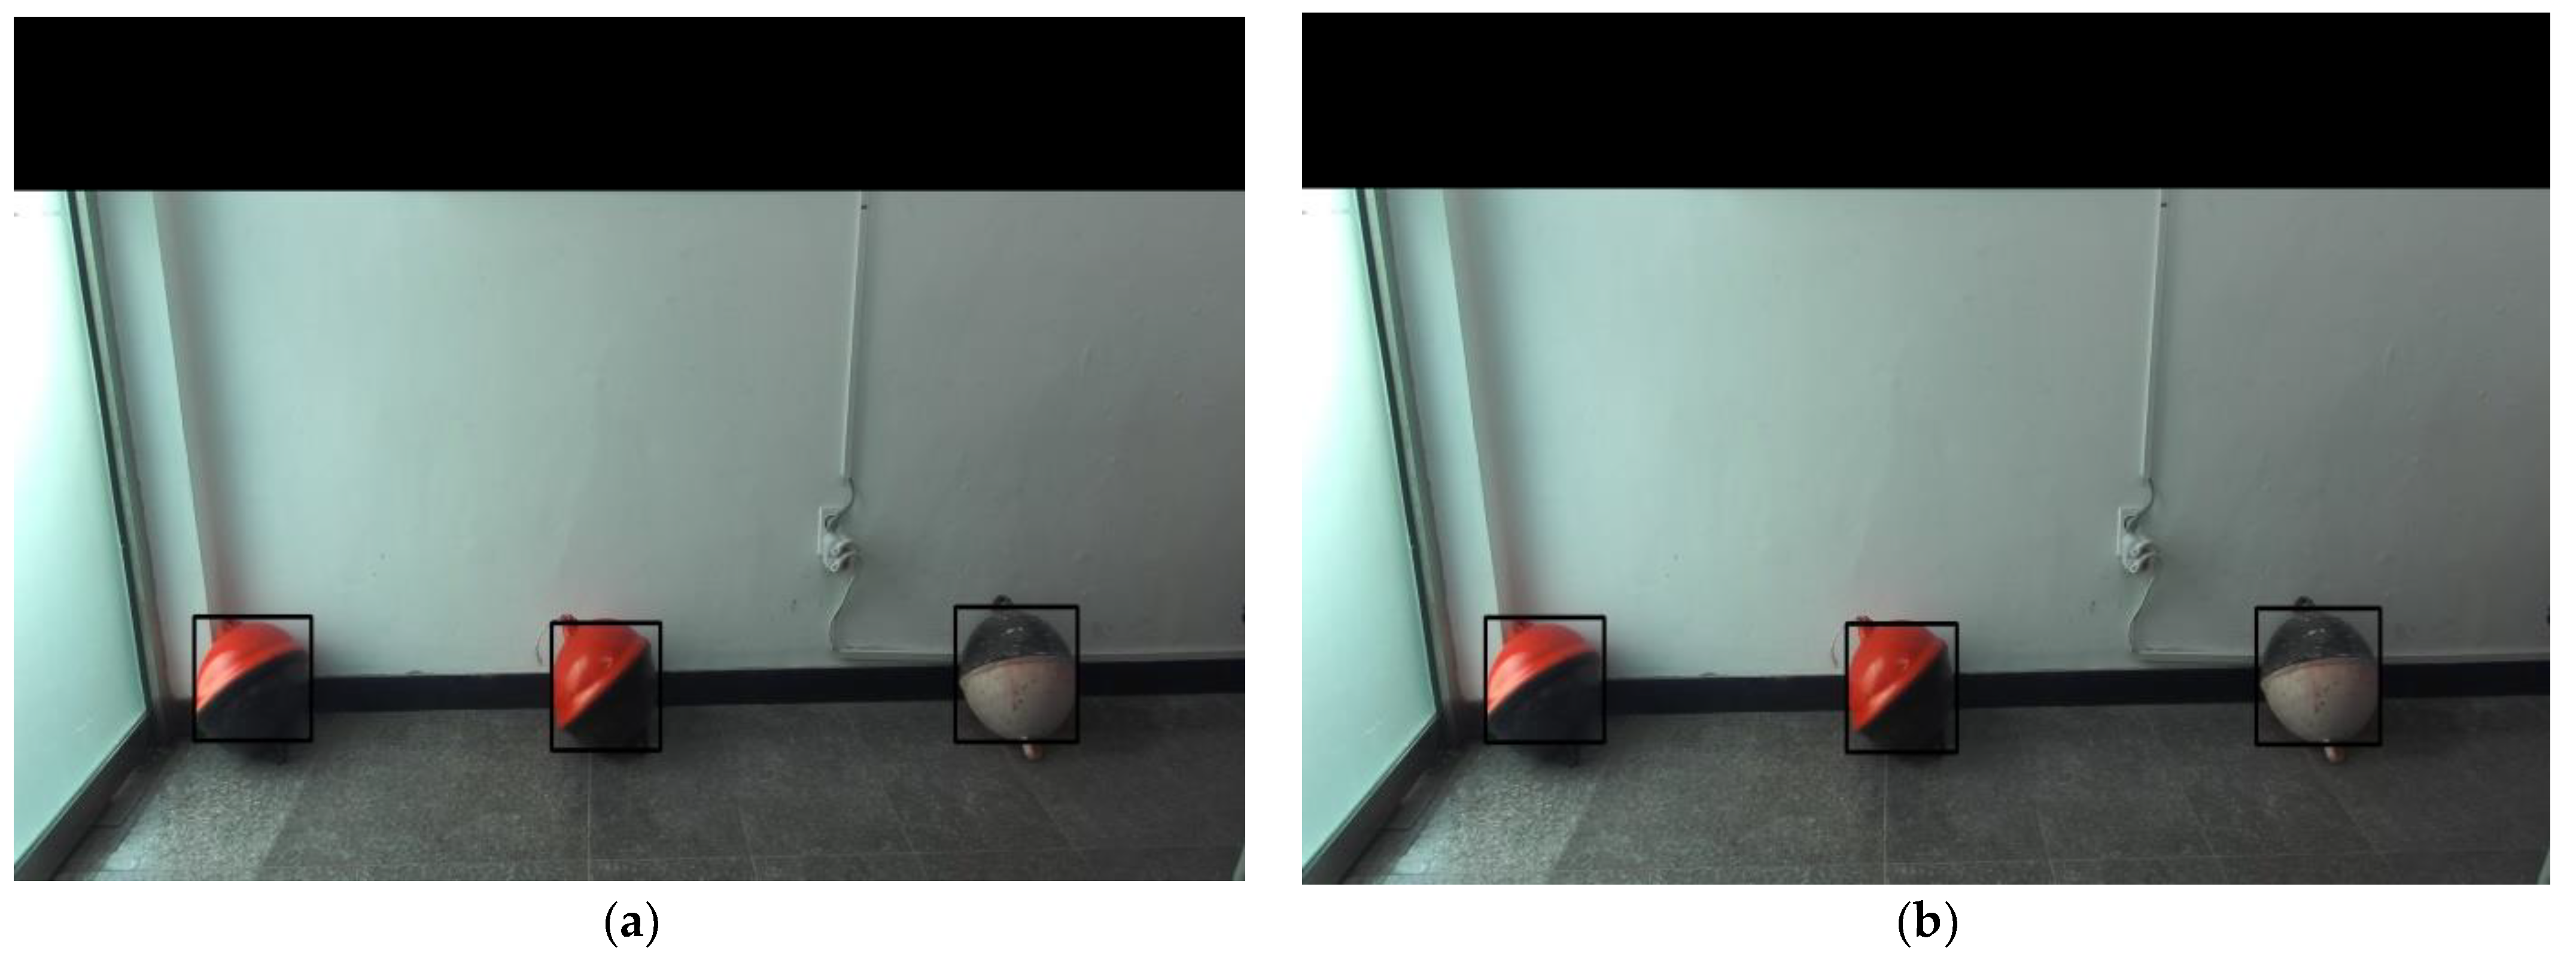
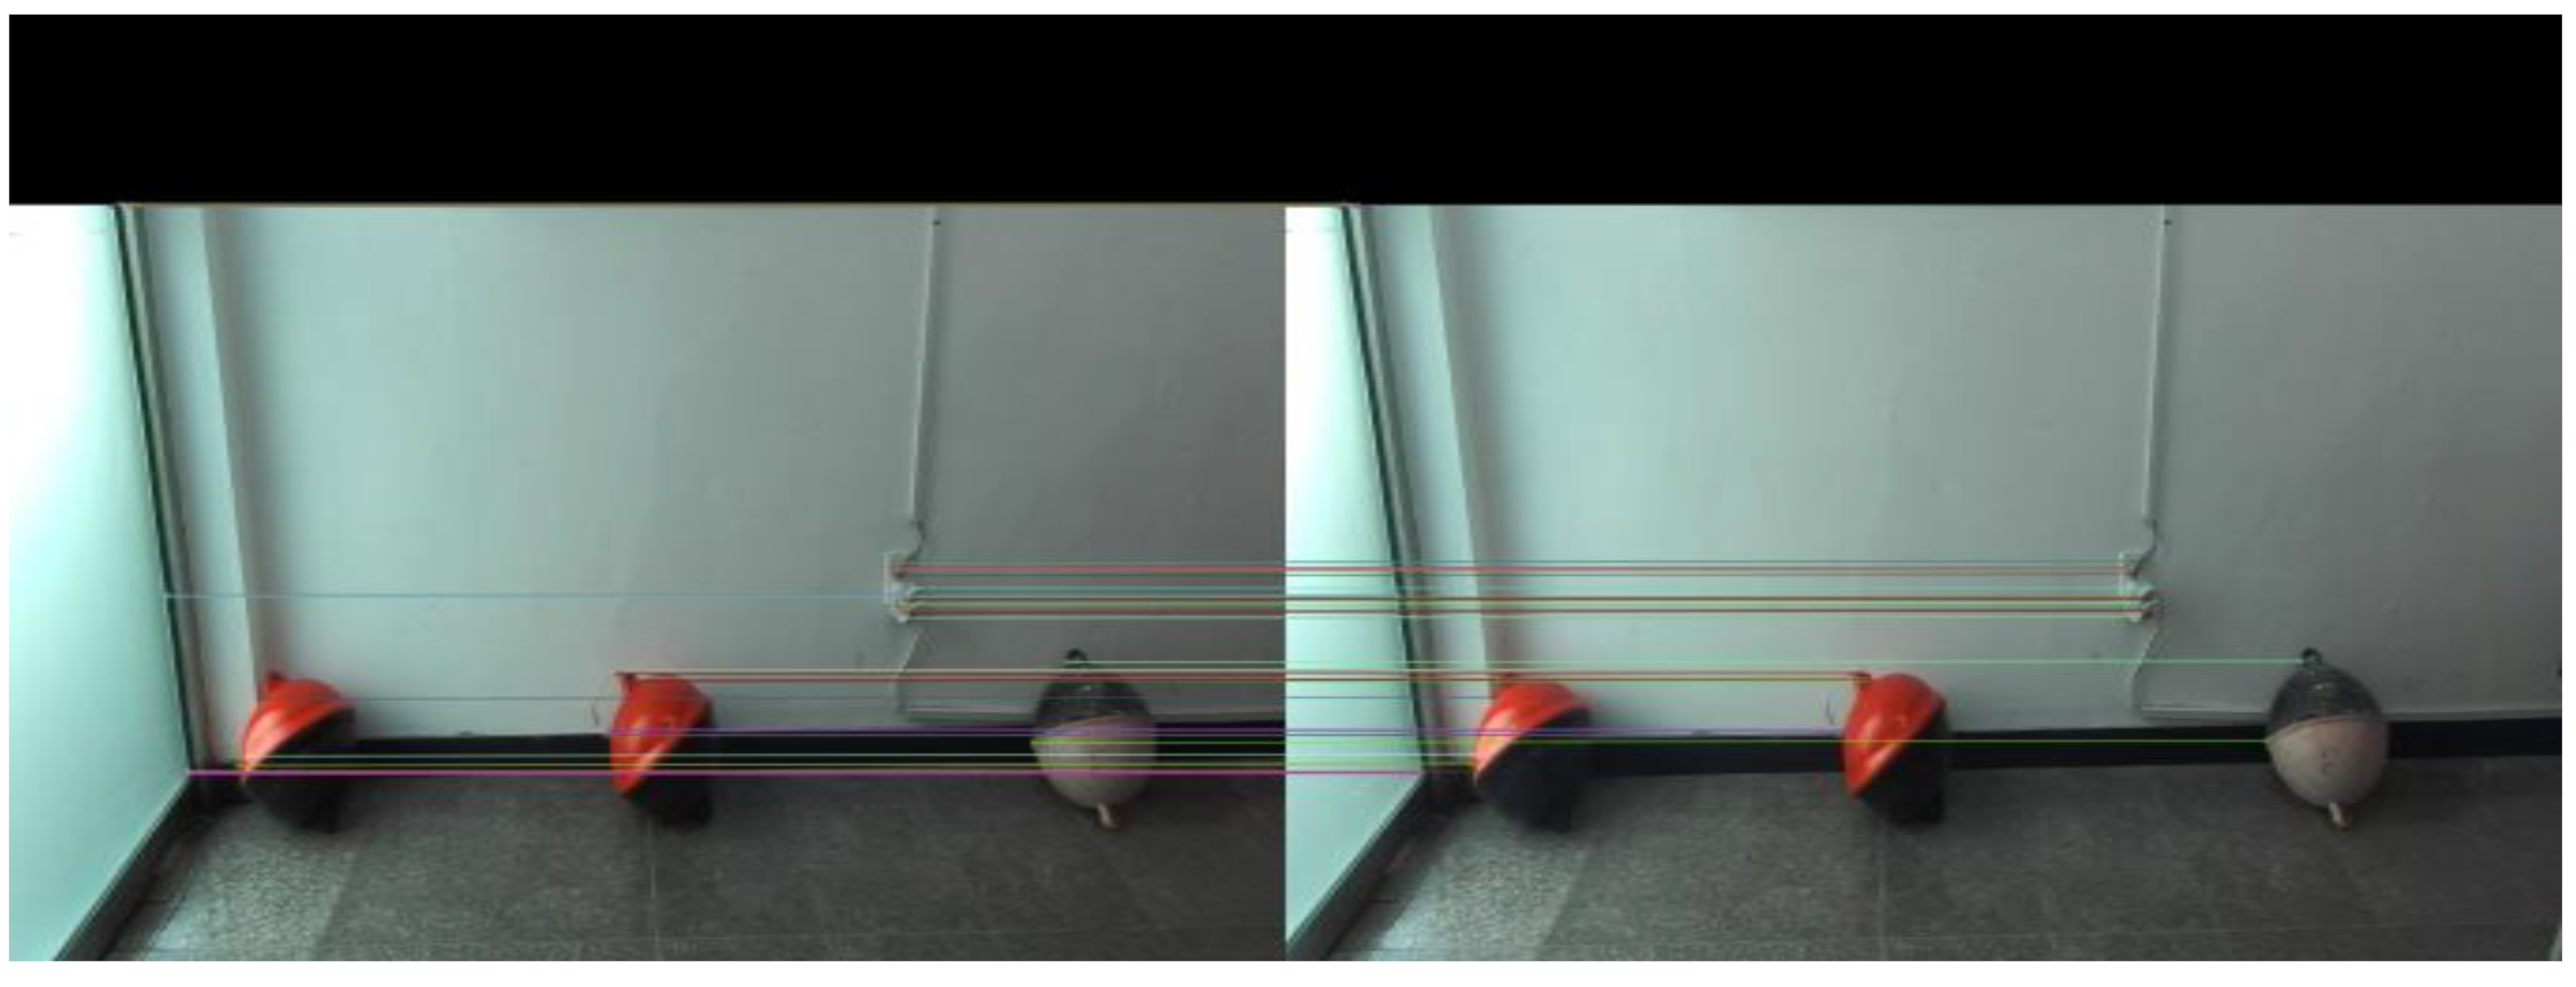
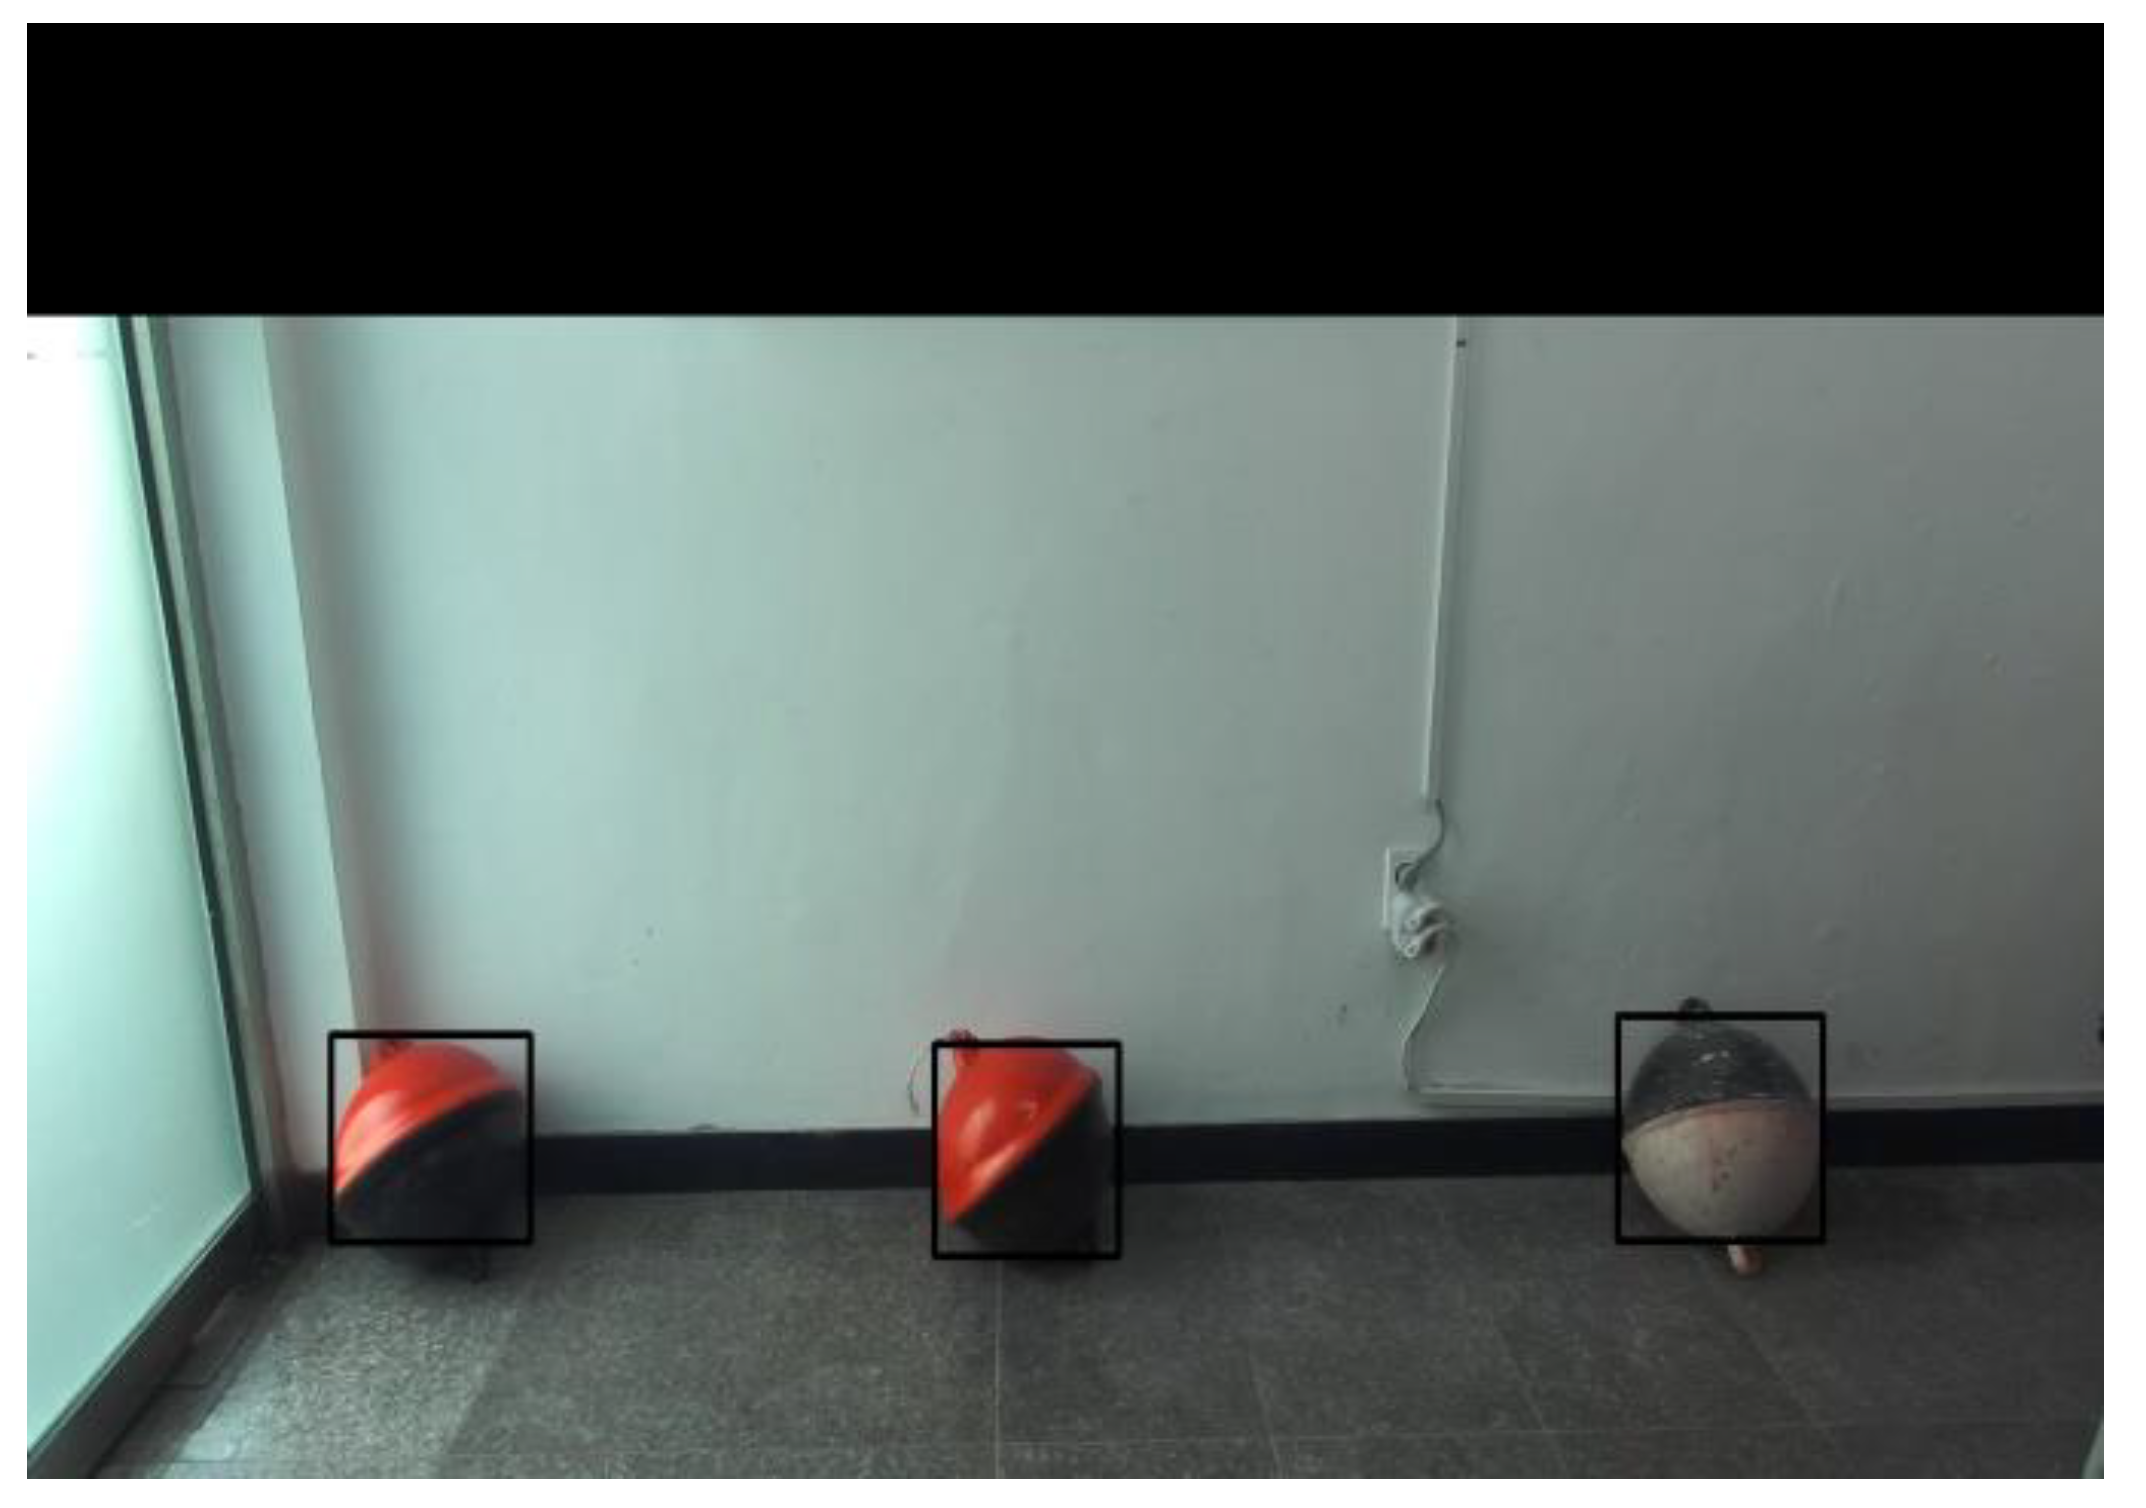
When the results of Figure 11a were input into the detection model, all buoys were detected, as shown in Figure 14. The results of applying stereo matching to the ZED right camera image by the SSD and NCC methods, using the bounding box of buoys as a window, are shown in Figure 15a,b, respectively. Feature points could not be sufficiently extracted from the images of the buoys within the bounding box. Hence, feature points were found using ORB from the ZED left camera image and matched with the ZED right camera image, as shown in Figure 16. The homography matrix was then extracted, and stereo matching was performed by applying a perspective transformation to the bounding box, as shown in Figure 17.
The distance from the buoys to the camera based on the monocular vision was calculated by extracting the bottom center point of the bounding box from the ZED left camera image. The distance from the buoys to the camera based on stereo vision was calculated using the disparity, which is the image coordinates’ difference of the bottom center point of the bounding box between the ZED left and right camera image results from stereo matching. The results were compared with the distance between buoys and the camera measured using a laser distance measuring device, as shown in Table 7.
The matching using the NCC demonstrated the best performance of those based on stereo vision. However, the measured distance based on monocular vision demonstrated higher accuracy than stereo vision.

3.2.4. Experiment B

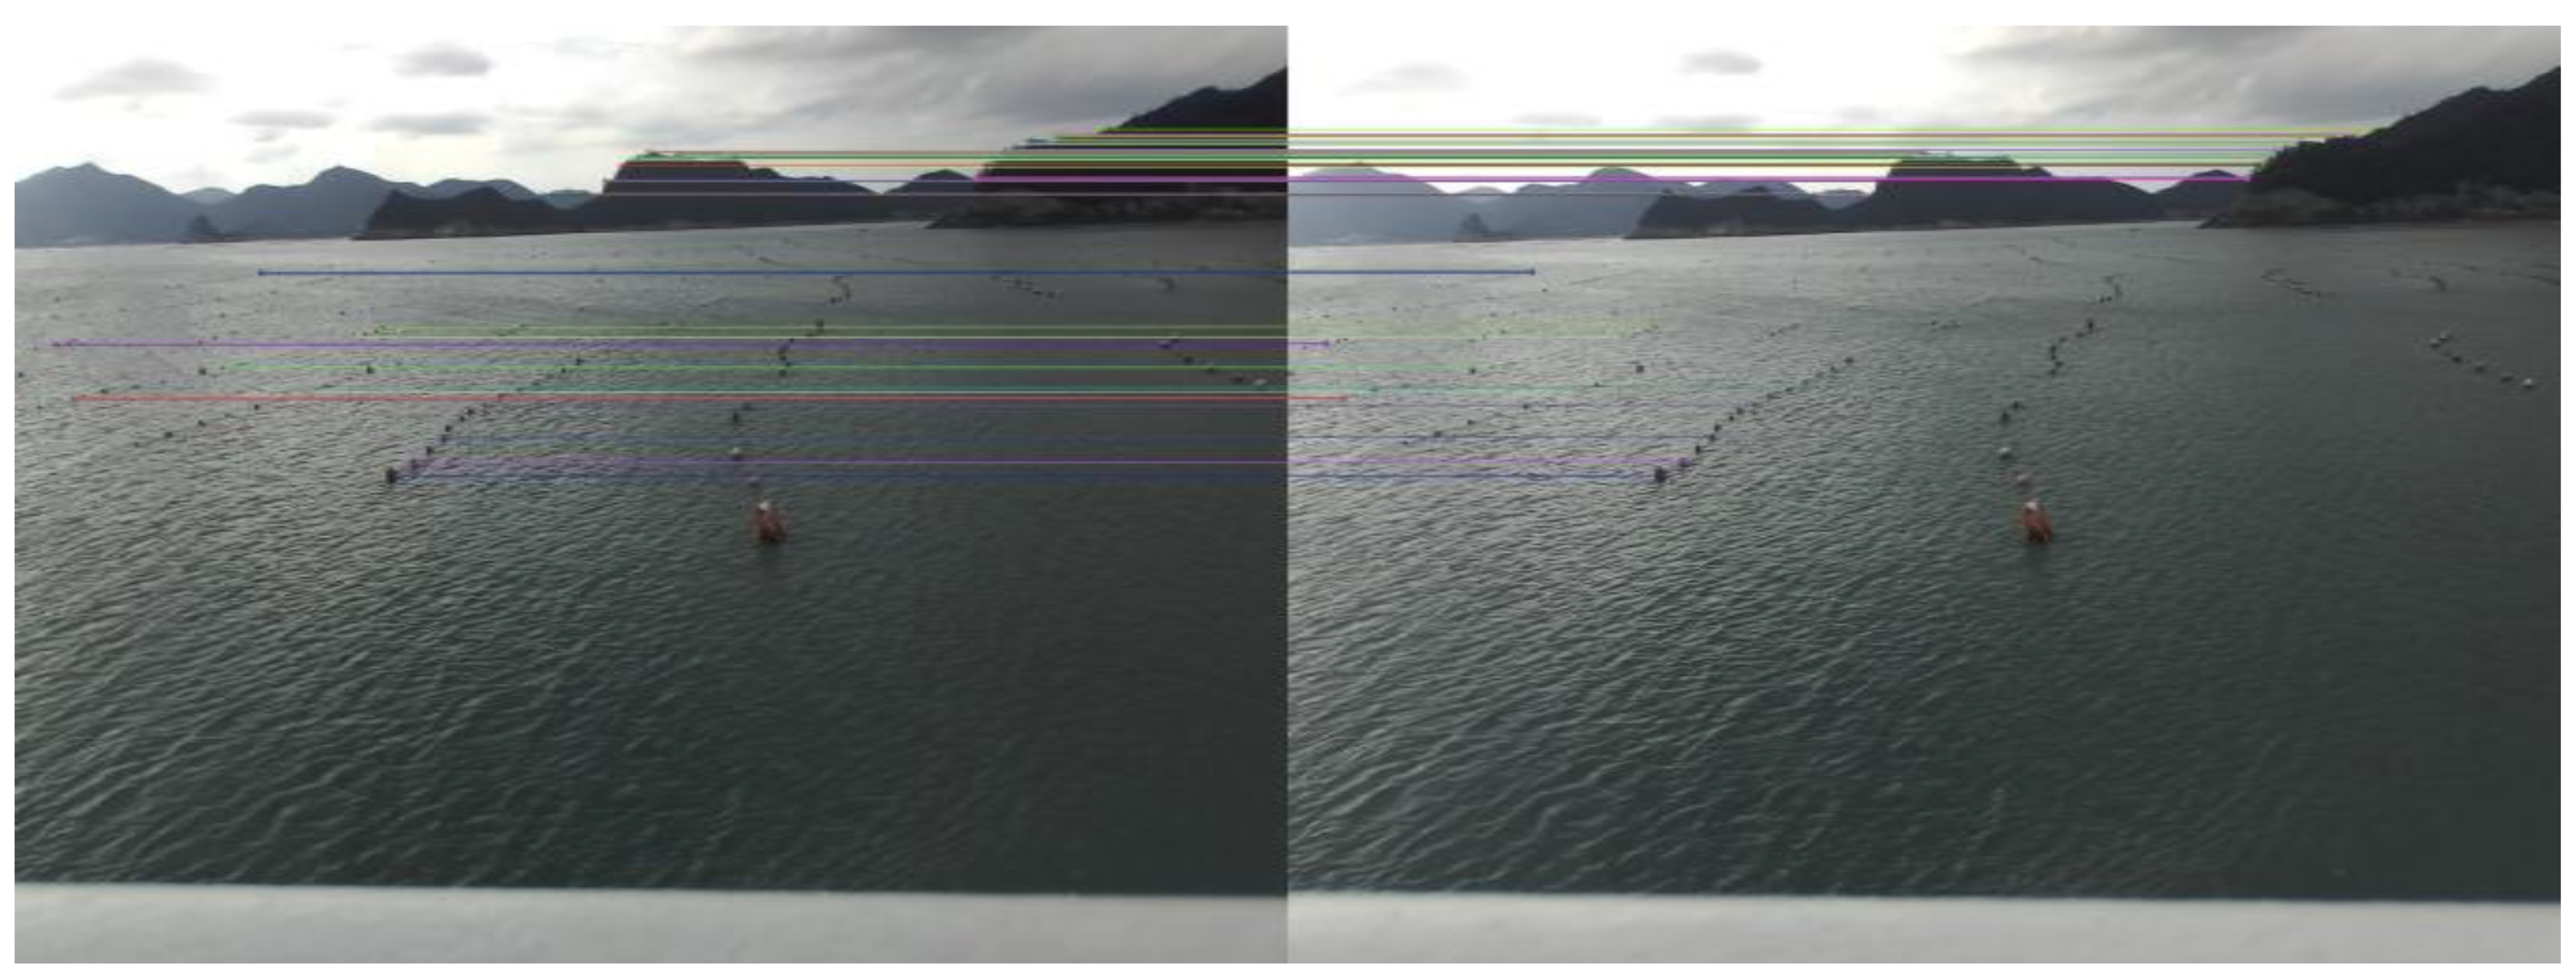
When the results of Figure 11b were input into the detection model, only 30 buoys were detected, as shown in Figure 18a. Therefore, the input image size was changed from 640 to the original size of 2208, and 149 buoys (buoy 1: black, buoy 2: red) were detected, as shown in Figure 18b. The results of applying stereo matching to the ZED right camera image using the SSD and NCC methods, with the bounding box of buoys as a window, are shown in Figure 19a,b, respectively. Owing to the small window size, 73 (49.0%) and 51 (34.3%) of the 149 buoys were incorrectly matched with the SSD and NCC methods, respectively. Similar to Experiment A, the feature points were extracted using ORB from the entire image and then matched with the ZED right camera image, as shown in Figure 20. The homography matrix was then extracted, and perspective transformation was applied to the bounding box, as shown in Figure 21. As a result, all buoys were correctly matched.
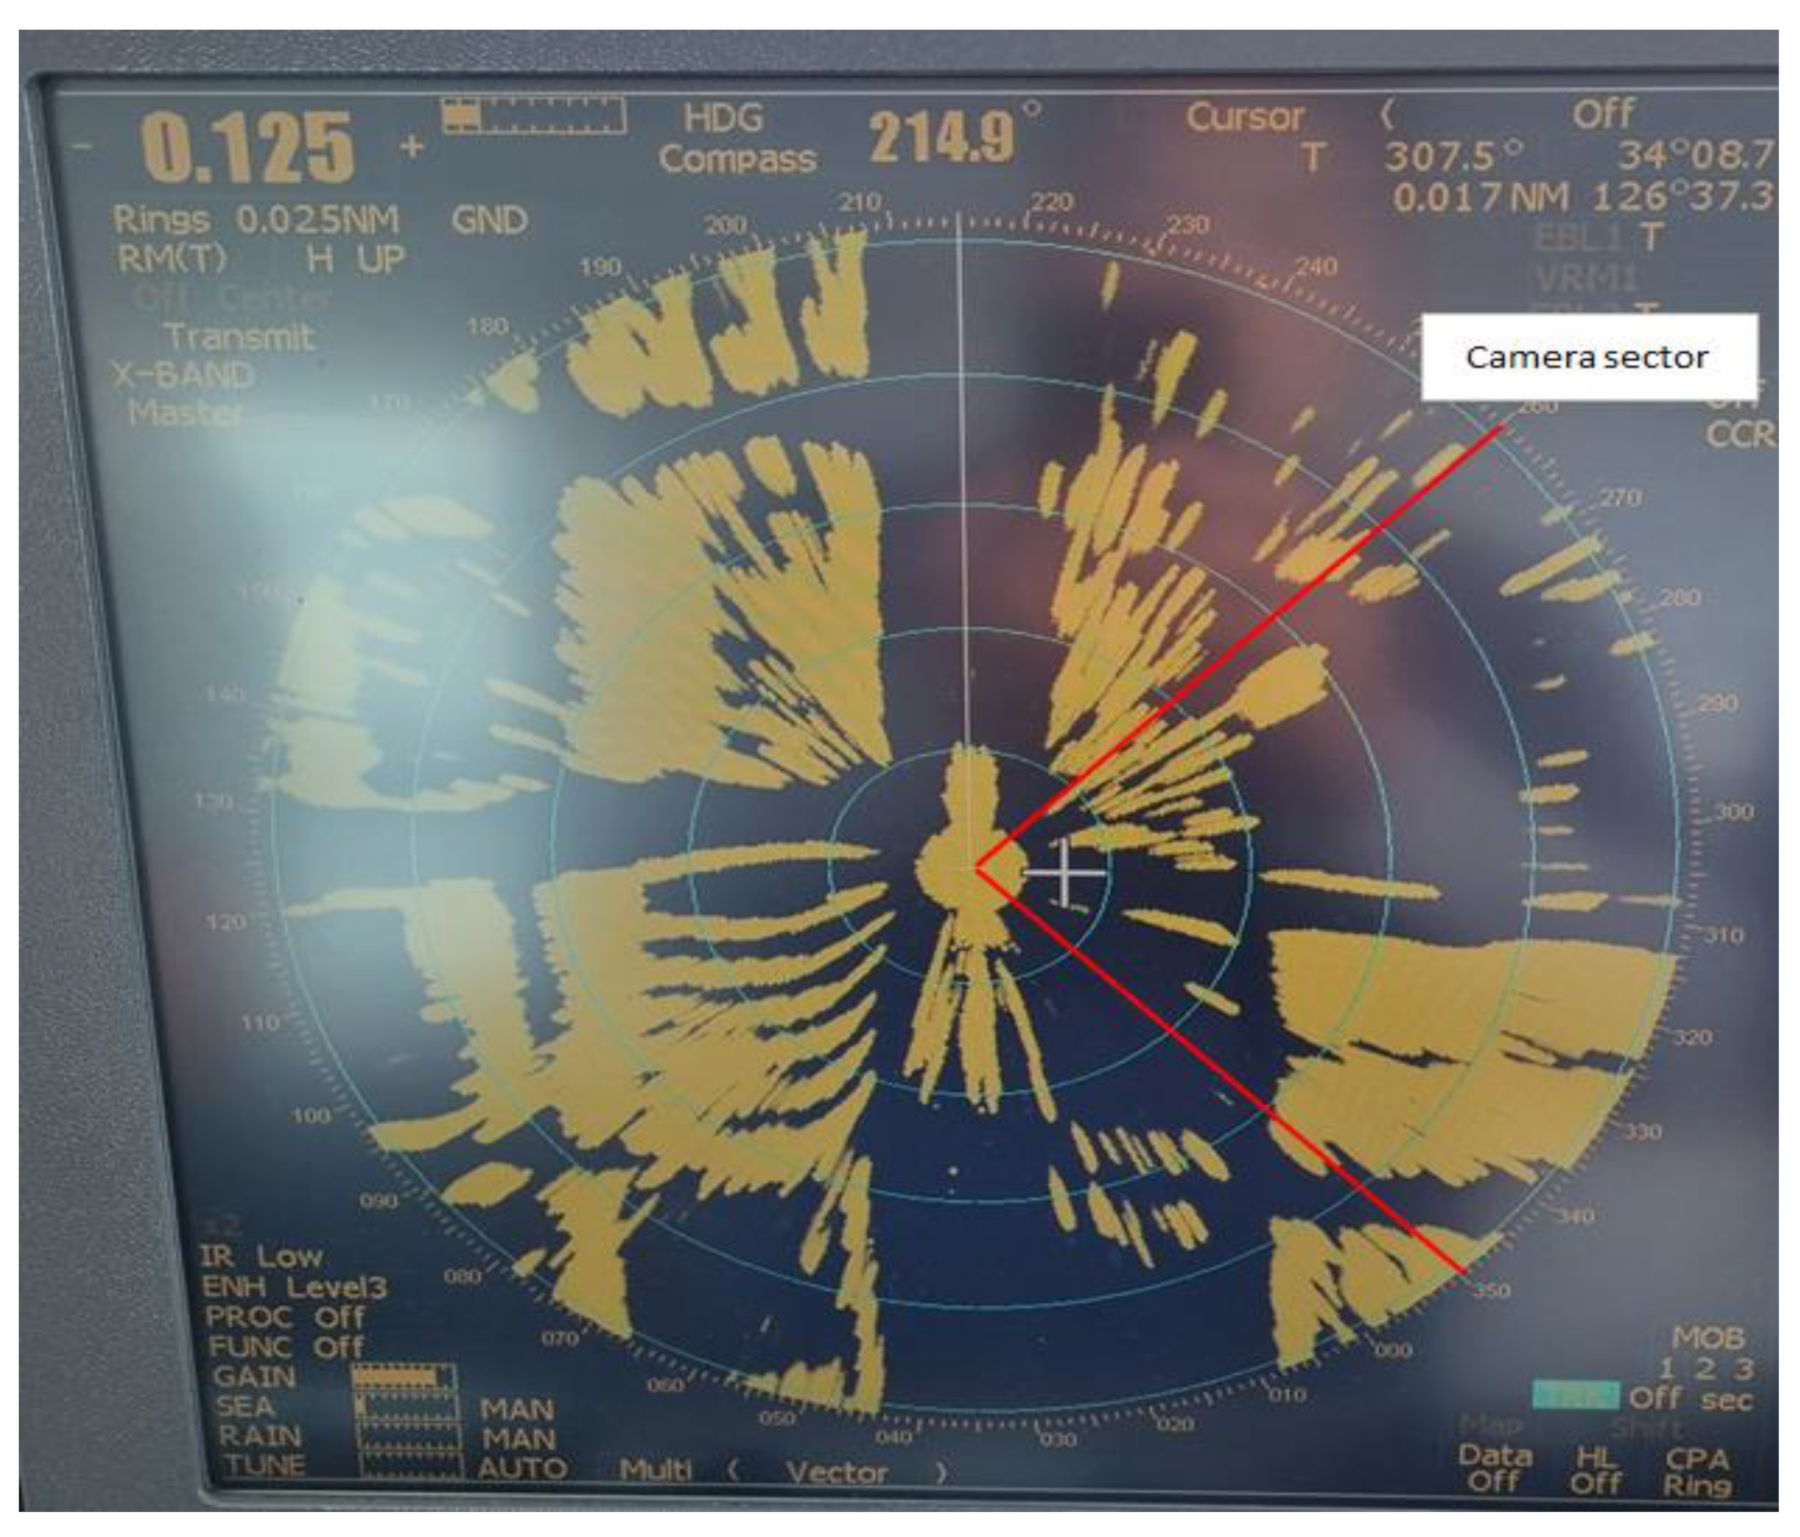
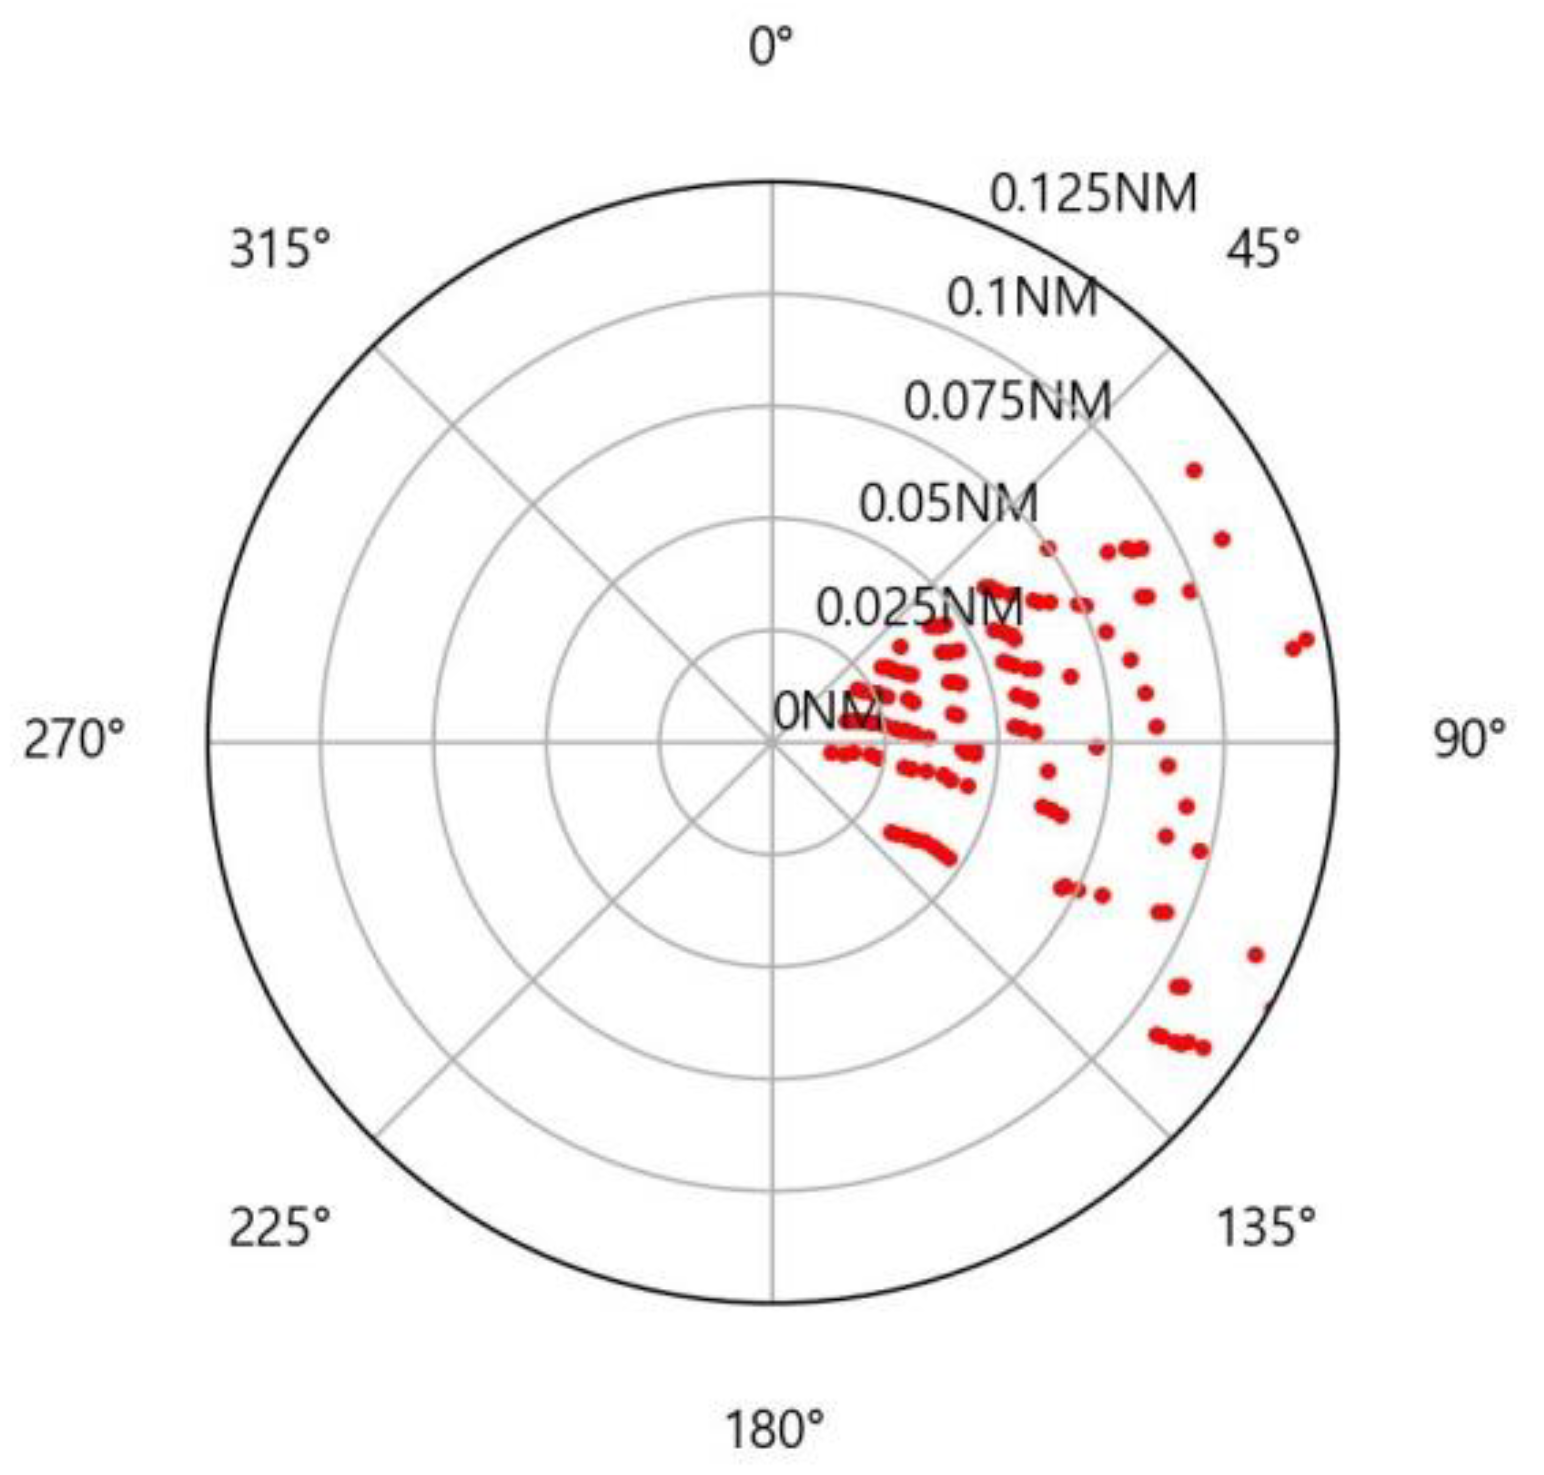
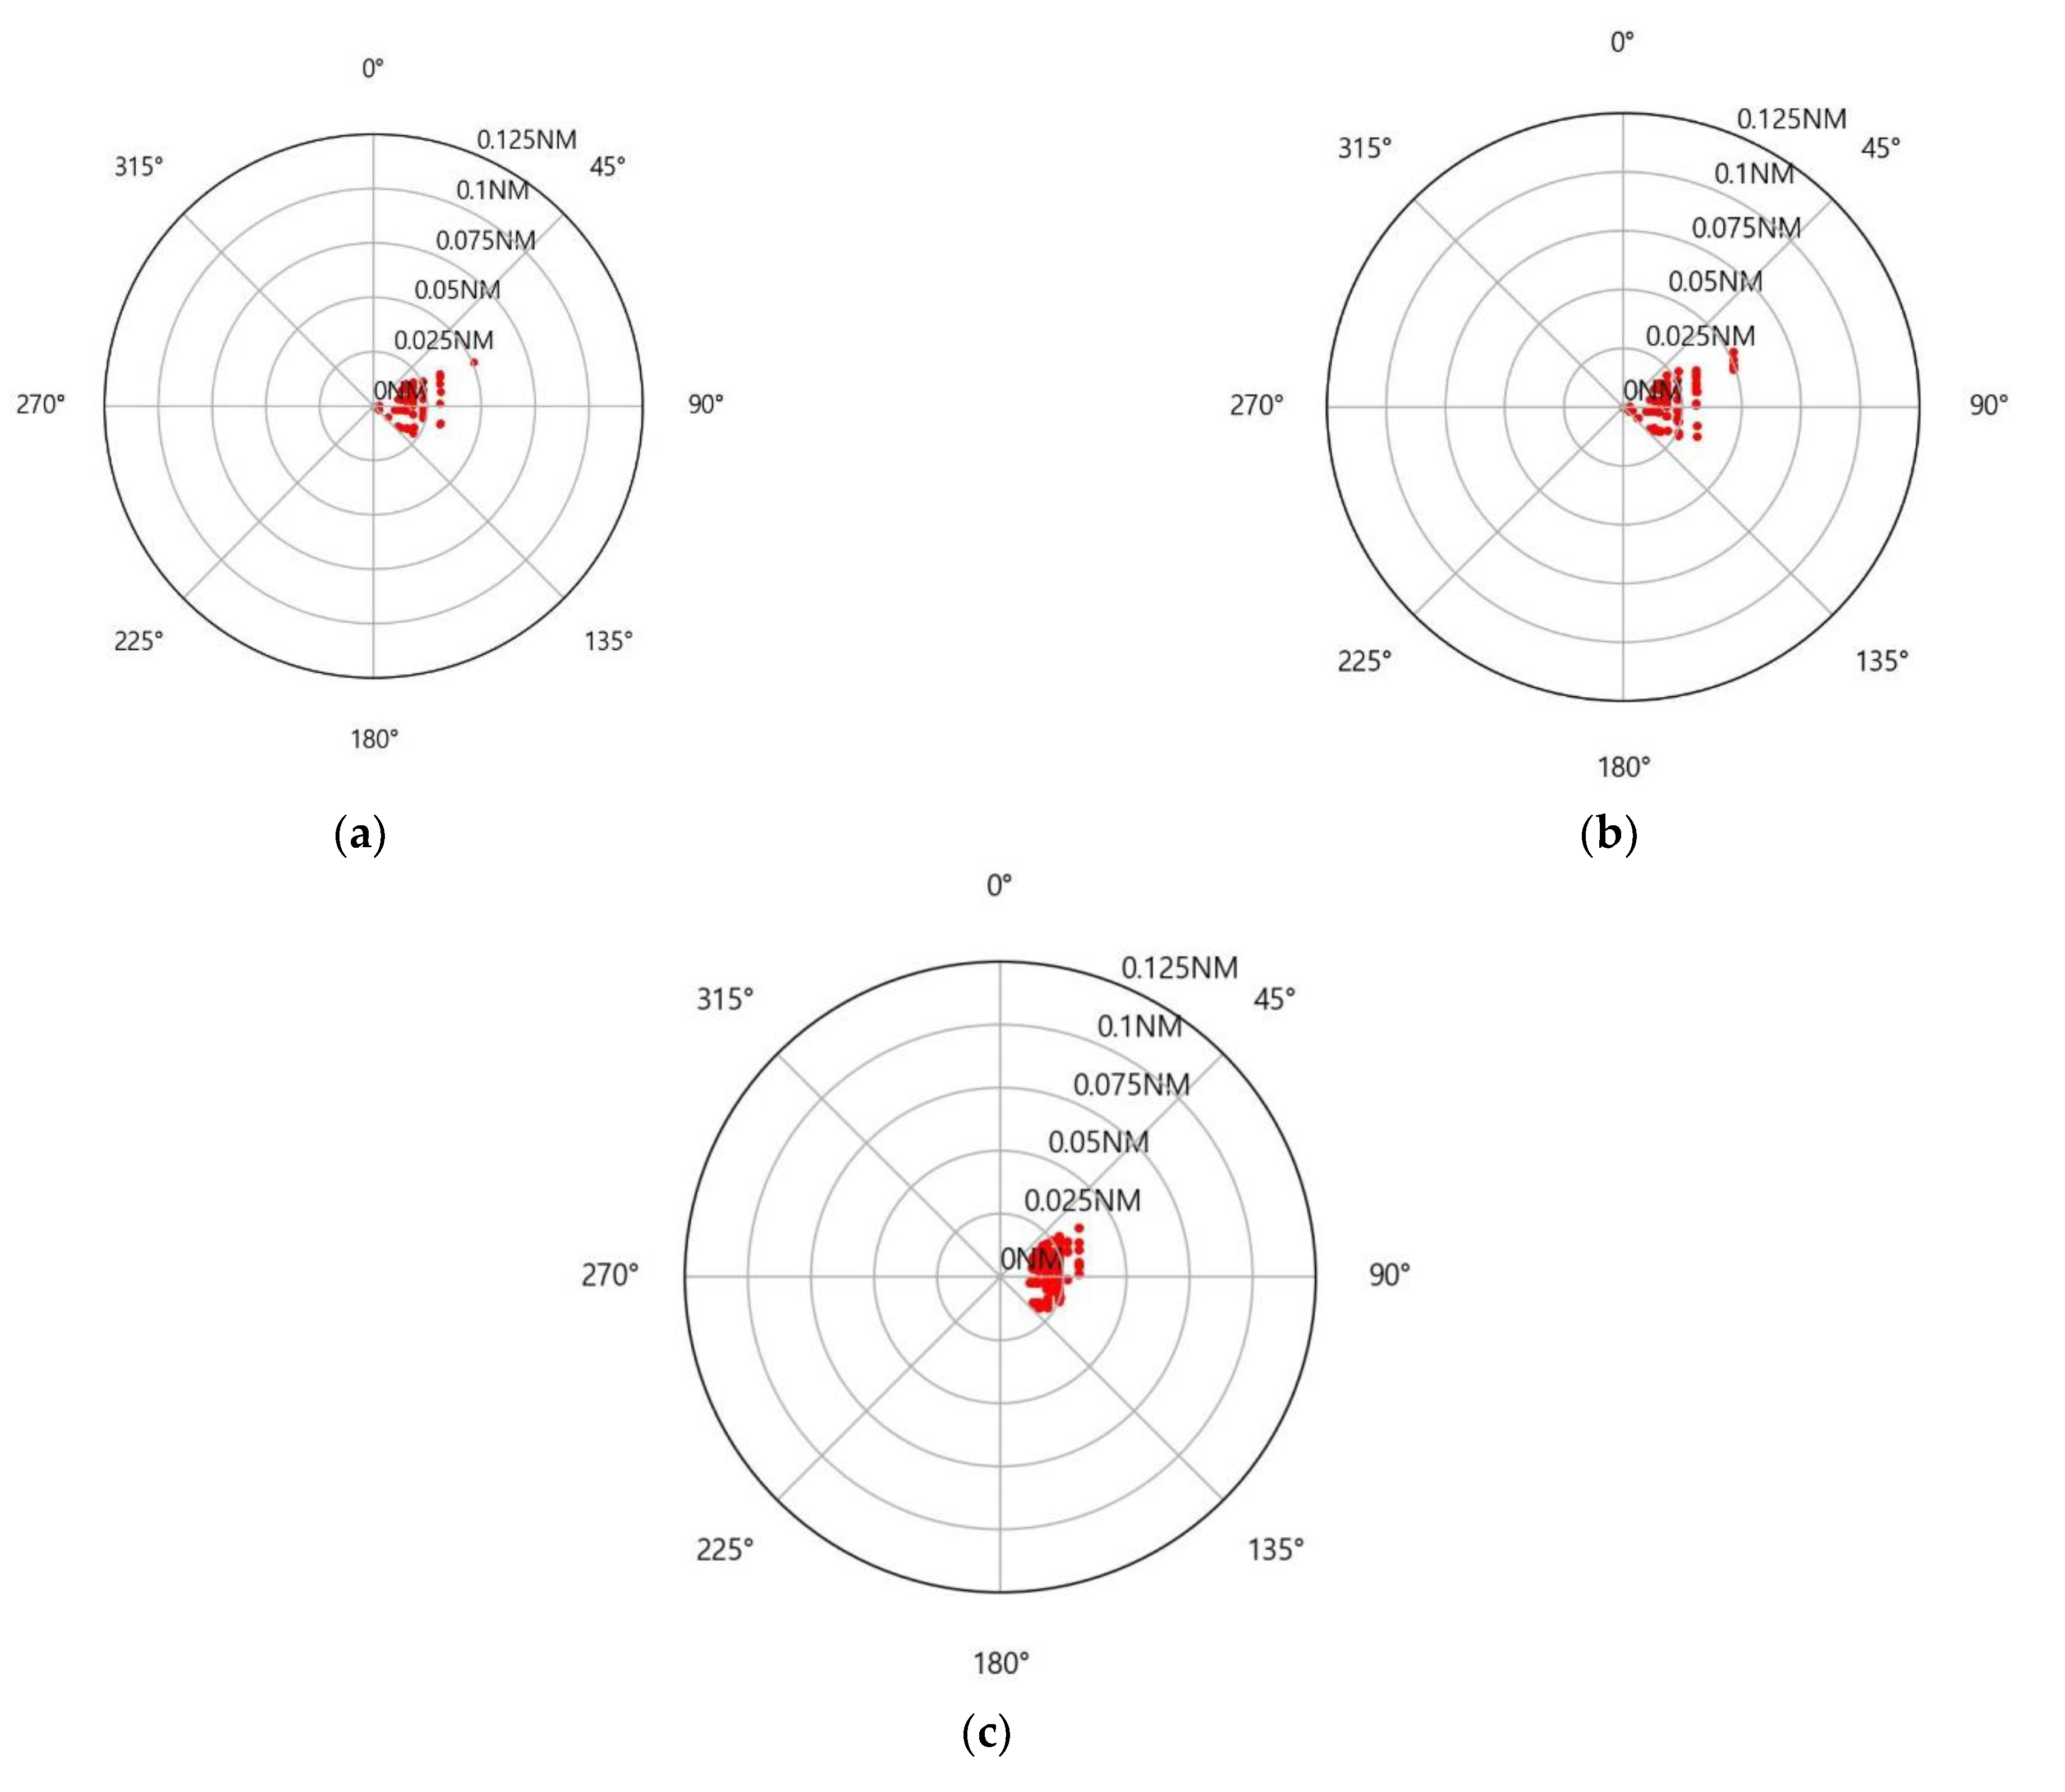
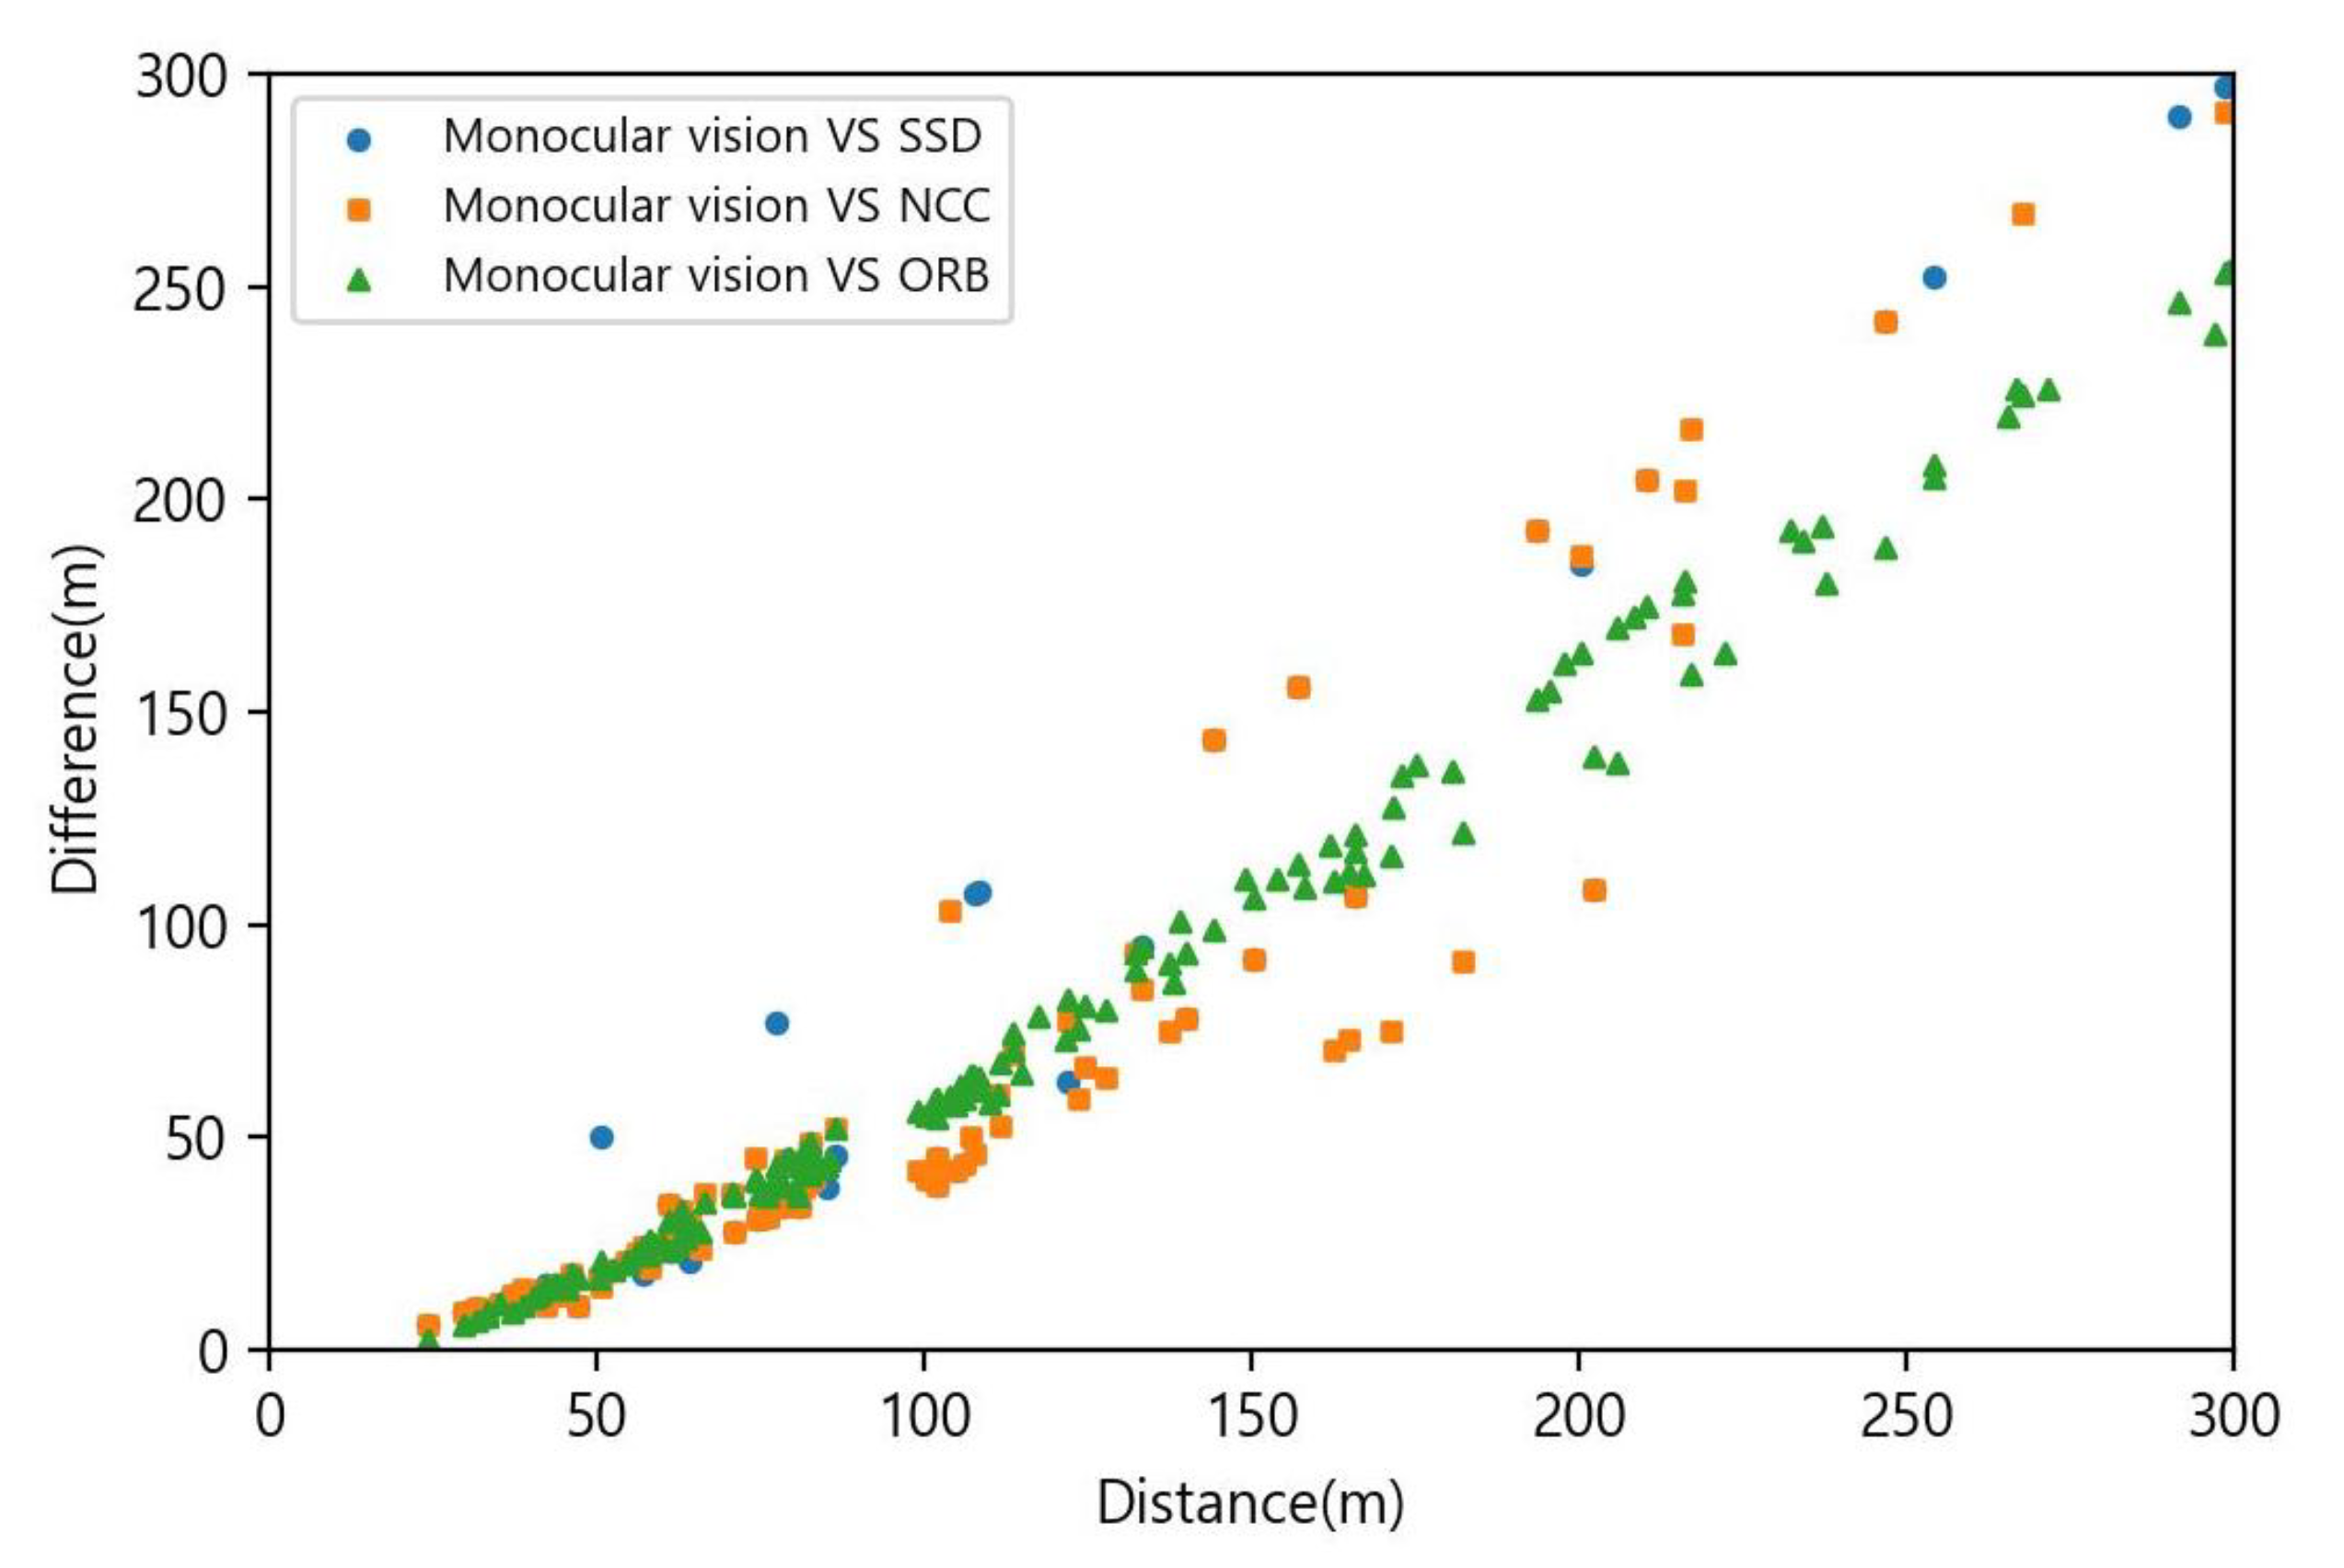
Figure 22 shows the radar screen when capturing the aqua farms. Figure 11b is an image captured from the ship’s starboard side, corresponding to the camera sector in Figure 22. When calculating the distance from the buoys to the camera based on monocular vision and then visualizing using the same scale as a radar, small objects were more accurately detected than the radar, as shown in Figure 23. After measuring and visualizing the distance from the camera, the buoys were correctly matched when using SSD, NCC, and ORB, as shown in Figure 24a–c, respectively. A difference in the calculated distances was observed between the stereo and monocular vision, as shown in Figure 25. From 20 m, the difference in the calculation results increased with the increasing distance from the camera. The result of comparing the distance of the buoy in the closest red bounding box in Figure 11b, calculated based on monocular and stereo vision with the radar measurement result, is summarized in Table 8.
When the distance was calculated based on stereo vision, the ORB method had the lowest error. However, the distance calculated based on monocular vision was closer to the radar measurement than that based on stereo vision.

4. Discussion

Autonomous ship technology is gaining increasing attention worldwide for developing safe, reliable, efficient, and environmentally friendly ships. Numerous studies have been conducted on the self-induced collision-avoidance actions of ships with other ships. However, there are other obstacles at sea, and there is an urgent need to develop a technology that can detect obstacles from the surrounding environment of ships. Appropriate collision-avoidance strategies can only be developed if the distance and bearing of an obstacle from a ship are accurately identified. This study, therefore, created a model for detecting aquaculture buoys commonly observed in the coastal region of Korea. The distance from the detected buoys to the ship was calculated based on monocular vision and stereo vision for comparison. In previous studies, monocular vision needed prior 3D information about the object used to match 2D–3D correspondences. Therefore, we proposed a method for calculating the distance based on camera position estimation and water surface coordinates of maritime objects with monocular vision without knowing the 3D information.
The experiments revealed that stereo vision resulted in greater errors during distance calculation as the objects are smaller and far apart. This result is reasonable considering that the depth range of the ZED is 0.5–25 m. Therefore, a different camera lens must be used, or the baseline needs to be adjusted to calculate longer distances using stereo vision; however, the calculation region can become extremely limited, or a short distance can become invisible. In addition, stereo vision requires extensive computation for stereo matching after applying rectification to left and right camera images. In contrast, monocular vision requires far less computation since the distance is calculated through camera position estimation and water surface coordinates of maritime objects. Moreover, monocular vision demonstrated higher accuracy than stereo vision in calculating short distances and detecting small objects more accurately than radar. Therefore, monocular vision is more effective than stereo vision for detecting maritime obstacles and can be employed as auxiliary sailing equipment with radar for the safe navigation of autonomous ships in the coast of Korea.
The detection model proposed in this study can only detect aquaculture buoys among numerous maritime obstacles, and the performance in limited visibility environments such as rain, fog, and nighttime is unknown. Monocular vision used in this study was affected by camera position estimation. Therefore, a three-axis gimbal was used to eliminate hull motion caused by wind and waves; however, errors due to heave were not considered. In view of these limitations, further research will be performed in the next work.

5. Conclusions

In this study, we proposed a model that detects aquaculture buoys based on YOLOv5 and the most effective method for detecting maritime obstacles by comparing the distances measured through monocular and stereo vision based on image coordinates. This paper is mainly divided into two parts: object recognition and distance calculation. In the object recognition stage, for designing the detection model, 2700 images of aqua farms (buoy 1: 22,422, buoy 2: 2744) were used to create the training data and were divided in the ratio of 8:2 between training and testing. Mosaic augmentation was applied when training the model with YOLOv5 to accurately identify small objects and increase the batch size during training. Model training resulted in a precision of 0.936, recall of 0.903, mAP of 94.3%, and FPS of 39.1. In the distance calculation stage, monocular vision calculates the distance based on camera position estimation and water surface coordinates of maritime objects, while stereo vision calculates the distance by finding corresponding points using SSD, NCC, and ORB and then calculating the disparity. Stereo vision had small error rates of −3.16% and −14.81% for short (NCC) and long distances (ORB); however, stereo vision resulted in greater errors during distance calculation as the objects were smaller and far apart. Monocular vision had error rates of 2.86% and −4.00% for short and long distances, respectively, and was more capable of detecting small objects than radar. The monocular vision proposed in this paper improved the ship’s ability to recognize its external environment and the safety of coastal navigation. Furthermore, it has important research significance for the development of autonomous ships in the future.

Author Contributions

Conceptualization, B.-S.K.; methodology, B.-S.K.; software, B.-S.K.; validation, B.-S.K. and C.-H.J.; formal analysis, B.-S.K.; investigation, B.-S.K.; resources, B.-S.K.; data curation, B.-S.K.; writing—original draft preparation, B.-S.K.; writing—review and editing, B.-S.K. and C.-H.J.; visualization, B.-S.K.; supervision, C.-H.J.; project administration, B.-S.K. and C.-H.J.; funding acquisition, B.-S.K. and C.-H.J. All authors have read and agreed to the published version of the manuscript.

Funding

This research was funded by the “LINC 3.0 (Leaders in INdustry–university Cooperation 3.0)” Project supported by the Ministry of Education and the National Research Foundation of Korea, 1345356152.

Institutional Review Board Statement

Not applicable.

Informed Consent Statement

Not applicable.

Data Availability Statement

Not applicable.

Conflicts of Interest

The authors declare no conflict of interest.

References

  1. Ma, C.M.; Lee, S.C.; Kim, S.I.; Yoon, M.G. A Study on Environmental Improvements of Aquaculture Farms; Korea Maritime Institute: Busan, Korea, 2018; pp. 22–24. [Google Scholar]
  2. Zhao, Z.Q.; Zheng, P.; Xu, S.T.; Wu, X. Object detection with deep learning: A review. IEEE Trans. Neural Netw. Learn. Syst. 2019, 11, 3212–3232. [Google Scholar] [CrossRef] [PubMed] [Green Version]
  3. Liu, W.; Anguelov, D.; Erhan, D.; Szegedy, C.; Reed, S.; Fu, C.Y.; Berg, A.C. Ssd: Single shot multibox detector. In Proceedings of the European Conference on Computer Vision, Amsterdam, The Netherlands, 11–14 October 2016; pp. 21–37. [Google Scholar]
  4. Redmon, J.; Divvala, S.; Girshick, R.; Farhadi, A. You only look once: Unified, real-time object detection. In Proceedings of the IEEE Conference on Computer Vision and Pattern Recognition, Las Vegas, NV, USA, 27–30 June 2016; pp. 779–788. [Google Scholar]
  5. Redmon, J.; Farhadi, A. YOLO9000: Better, faster, stronger. In Proceedings of the IEEE Conference on Computer Vision and Pattern Recognition, Honolulu, HI, USA, 21–26 July 2017; pp. 7263–7271. [Google Scholar]
  6. Redmon, J.; Farhadi, A. Yolov3: An incremental improvement. arXiv 2018, arXiv:1804.02767. [Google Scholar]
  7. Bochkovskiy, A.; Wang, C.Y.; Liao, H.Y.M. Yolov4: Optimal speed and accuracy of object detection. arXiv 2020, arXiv:2004.10934. [Google Scholar]
  8. Lin, T.Y.; Goyal, P.; Girshick, R.; He, K.; Dollár, P. Focal loss for dense object detection. In Proceedings of the IEEE International Conference on Computer Vision, Venice, Italy, 22–29 October 2017; pp. 2980–2988. [Google Scholar]
  9. Girshick, R.; Donahue, J.; Darrell, T.; Malik, J. Rich feature hierarchies for accurate object detection and semantic segmentation. In Proceedings of the IEEE Conference on Computer Vision and Pattern Recognition, Columbus, OH, USA, 23–28 June 2014; pp. 580–587. [Google Scholar]
  10. Ren, S.; He, K.; Girshick, R.; Sun, J. Faster r-cnn: Towards real-time object detection with region proposal networks. IEEE Trans. Pattern Anal. Mach. Intell. 2017, 17, 1137–1149. [Google Scholar] [CrossRef] [Green Version]
  11. Cai, Z.; Vasconcelos, N. Cascade r-cnn: Delving into high quality object detection. In Proceedings of the IEEE Conference on Computer Vision and Pattern Recognition, Salt Lake City, UT, USA, 18–23 June 2018; pp. 6154–6162. [Google Scholar]
  12. Lee, Y.H.; Kim, Y.S. Comparison of CNN and YOLO for object detection. J. Semicond. Display Technol. 2020, 19, 85–92. [Google Scholar]
  13. Li, Q.; Ding, X.; Wang, X.; Chen, L.; Son, J.; Song, J.Y. Detection and identification of moving objects at busy traffic road based on YOLO v4. J. Inst. Internet Broadcast. Commun. 2021, 21, 141–148. [Google Scholar]
  14. Kim, J.; Cho, J. YOLO-based real time object detection scheme combining RGB image with LiDAR point cloud. J. KIIT 2019, 17, 93–105. [Google Scholar] [CrossRef]
  15. Zhang, Z.; Hang, Y.; Zhou, Y.; Dai, M. A novel absolute localization estimation of a target with monocular vision. Optik-Int. J. Light Electron Opt. 2012, 124, 1218–1223. [Google Scholar] [CrossRef]
  16. Yang, Y.; Cao, Q.Z. Monocular vision based 6D object localization for service robots intelligent grasping. Comput. Math. Appl. 2012, 64, 1235–1241. [Google Scholar] [CrossRef] [Green Version]
  17. Qi, S.H.; Sun, Z.P.; Zhang, J.T.; Sun, Y. Distance estimation of monocular based on vehicle pose information. J. Phys. Conf. Ser. 2019, 1168, 1–8. [Google Scholar] [CrossRef]
  18. Dhall, A. Real-time 3D posed estimation with a monocular camera using deep learning and object priors on an autonomous racecar. arXiv 2018, arXiv:1809.10548. [Google Scholar]
  19. Fusiello, A.; Roberto, V.; Trucco, E. Efficient stereo with multiple windowing. In Proceedings of the IEEE Conference on Computer Vision and Pattern Recognition, San Juan, Puerto Rico, 17–19 June 1997; pp. 858–868. [Google Scholar]
  20. Gong, M.; Yang, M. Fast unambiguous stereo matching using reliability-based dynamic programming. IEEE Trans. Pattern Anal. March. Intell. 2005, 27, 998–1003. [Google Scholar] [CrossRef]
  21. Klaus, A.; Sormann, M.; Karner, K. Segment-based stereo matching using belief propagation and a self-adapting dissimilarity measure. In Proceedings of the International Conference on Pattern Recognition, Hong Kong, China, 20–24 August 2006; pp. 15–18. [Google Scholar]
  22. Kim, J.C.; Lee, K.M.; Choi, B.T.; Lee, S.U. A dense stereo matching using two-pass dynamic programming with generalized ground control points. In Proceedings of the IEEE Computer Society Conference on Computer Vision and Pattern Recognition, San Diego, CA, USA, 20–25 June 2005; pp. 1075–1082. [Google Scholar]
  23. Hirschmuller, H. Stereo processing by semiglobal matching and mutual information. IEEE Trans. Pattern Anal. March. Intell. 2008, 30, 328–341. [Google Scholar] [CrossRef]
  24. Hamzah, R.A.; Ibrahim, H. Literature survey on stereo vision disparity map algorithms. J. Sens. 2016, 2016, 1–23. [Google Scholar] [CrossRef] [Green Version]
  25. Lowe, D.G. Distinctive image feature from scale-invariant keypoints. Int. J. Comput. Vis. 2004, 60, 91–110. [Google Scholar] [CrossRef]
  26. Bay, H.; Tuytelaars, T.; Van Gool, L. SURF: Speeded Up Robust Features. In Proceedings of the European Conference on Computer Vision, Graz, Austria, 7–13 May 2006; pp. 404–417. [Google Scholar]
  27. Alcantarilla, P.F.; Bartoli, A.; Davison, A.J. KAZE Features. In Proceedings of the European Conference on Computer Vision, Florence, Italy, 7–13 October 2012; pp. 214–227. [Google Scholar]
  28. Rublee, E.; Rabaud, V.; Konolige, K.; Bradski, G. ORB: An efficient alternative to SIFT or SURF. In Proceedings of the IEEE International Conference on Computer Vision, Barcelona, Spain, 6–13 November 2011; pp. 2564–2571. [Google Scholar]
  29. Yang, Y.; Lu, C. A stereo matching method for 3D image measurement of long-distance sea surface. J. Mar. Sci. Eng. 2021, 9, 1281. [Google Scholar] [CrossRef]
  30. Zheng, Y.; Liu, P.; Qian, L.; Qin, S.; Liu, X.; Ma, Y.; Cheng, G. Recognition and depth estimation of ships based on binocular stereo vision. J. Mar. Sci. Eng. 2022, 10, 1153. [Google Scholar] [CrossRef]
  31. GitHub. YOLO V5-Master. Available online: https://github.com/ultralytics/yolov5.git/ (accessed on 11 September 2022).
  32. Bloomenthal, J.; Rokne, J. Homogeneous coordinates. Vis. Comput. 1994, 11, 15–26. [Google Scholar] [CrossRef]
  33. Hartley, R.; Zisserman, Z. Multiple View Geometry in Computer Vision, 2nd ed.; Cambridge University Press: Cambridge, UK, 2003; pp. 151–176. [Google Scholar]
  34. Taryudi; Wang, M.S. Eye to hand calibration using ANFIS for stereo vision-based object manipulation system. Microsyst. Technol. 2018, 24, 305–317. [Google Scholar] [CrossRef]
  35. Bennamoun, M.; Mamic, G.J. Object Recognition Fundamentals and Case Studies, 1st ed.; Springer: London, UK; Berlin/Heidelberg, Germany, 2002; pp. 34–38. [Google Scholar]
  36. Rosten, E.; Drummond, T. Machine learning for high speed corner detection. In Proceedings of the European Conference on Computer Vision, Graz, Austria, 7–13 May 2006; pp. 430–443. [Google Scholar]
  37. Calondar, M.; Lepetit, V.; Strecha, C.; Fua, P. BRIEF: Binary Robust Independent Elementary Features. In Proceedings of the European Conference on Computer Vision, Crete, Greece, 5–11 September 2010; pp. 778–792. [Google Scholar]
  38. Fischler, M.A.; Bolles, R.C. Random sample consensus: A paradigm for model fitting with applications to image analysis and automated cartography. Commun. ACM 1981, 24, 381–395. [Google Scholar] [CrossRef]
  39. Oberkampf, D.; Dementhon, D.F.; Davis, L.S. Iterative pose estimation using coplanar feature points. Comput. Vis. Image Underst. 1996, 63, 495–511. [Google Scholar] [CrossRef] [Green Version]
  40. Marchang, E.; Uchiyama, H.; Spindler, F. Pose estimation for augmented reality: A hands-on survey. IEEE Trans. Vis. Comput. Graph. 2016, 22, 2633–2651. [Google Scholar] [CrossRef]
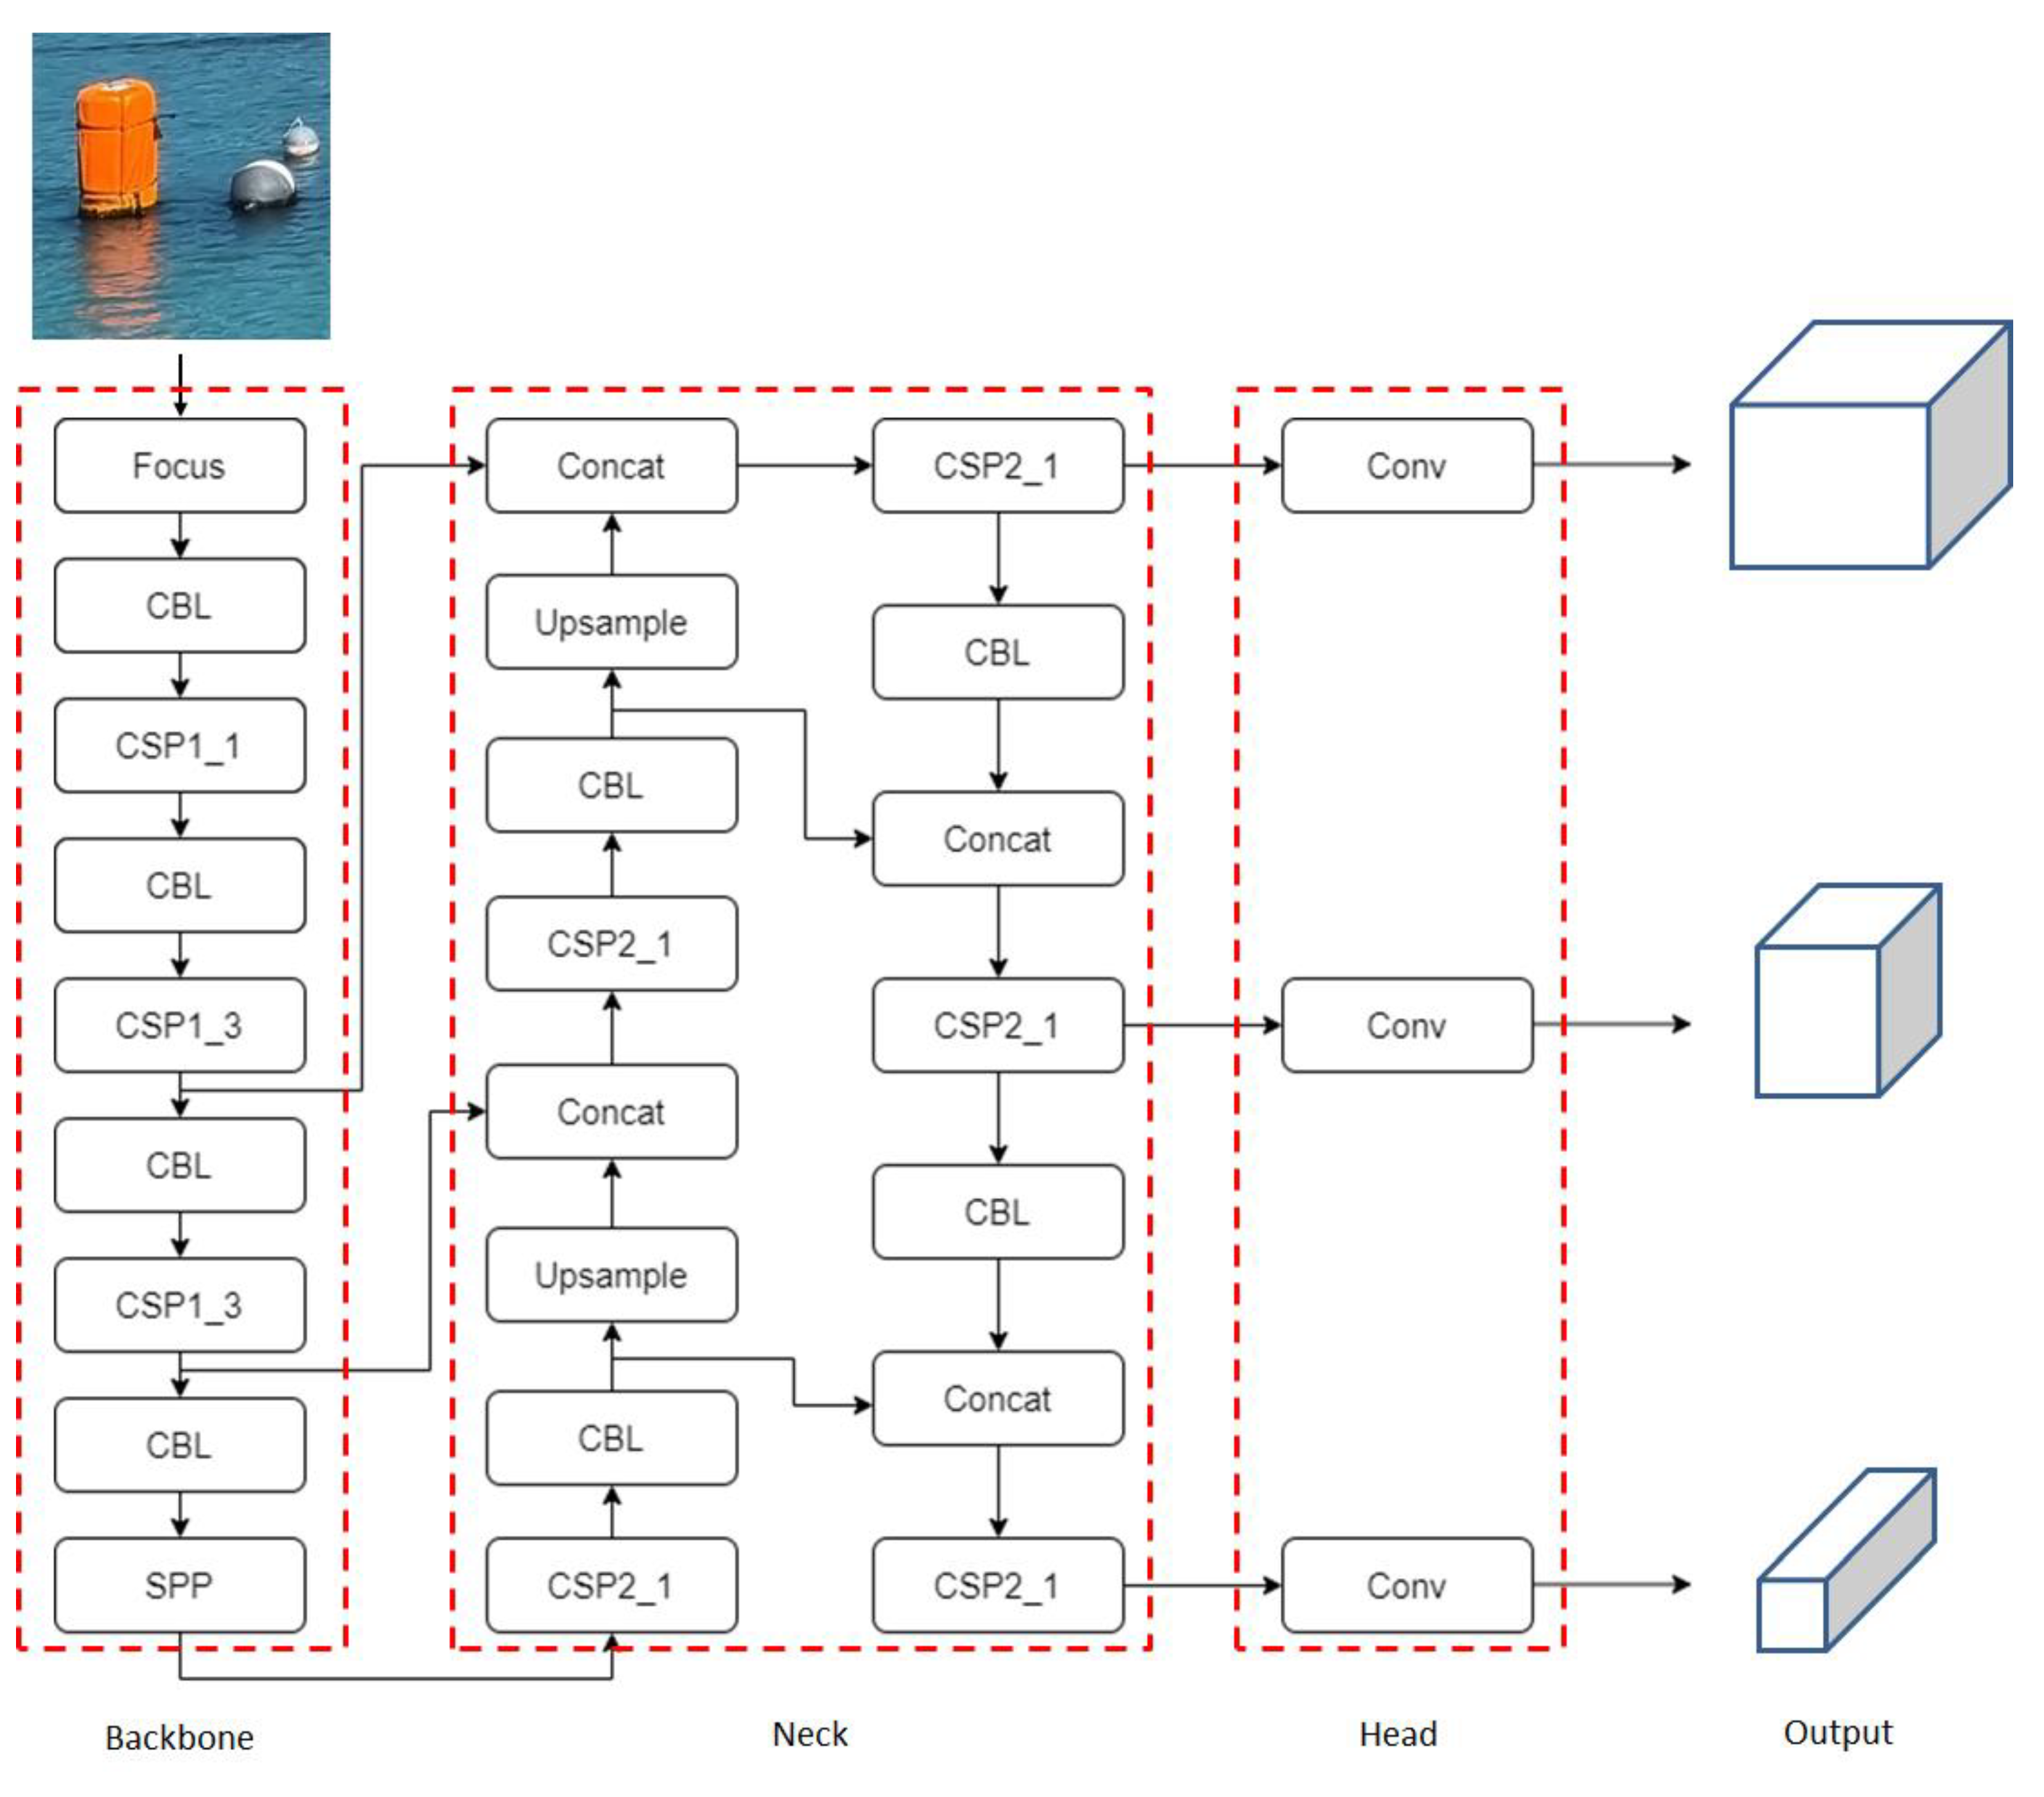
Figure 1. YOLOv5 architecture.
Jmse 10 01528 g001
Figure 2. Coordinate system.
Jmse 10 01528 g002
Figure 3. Relationship between world, camera, image plane, and normalized image plane coordinate systems.
Jmse 10 01528 g003
Figure 4. Configuration of stereo vision.
Jmse 10 01528 g004
Figure 5. Stereo vision distance perception.
Jmse 10 01528 g005
Figure 6. Epipolar geometry.
Jmse 10 01528 g006
Figure 7. Homography.
Jmse 10 01528 g007
Figure 8. Learning data.
Jmse 10 01528 g008
Figure 9. Mosaic image augmentation.
Jmse 10 01528 g009
Figure 10. Experimental site (a) and equipment (b).
Jmse 10 01528 g010
Figure 11. Aquaculture buoy: (a) Experiment A and (b) Experiment B.
Jmse 10 01528 g011
Figure 12. Detecting checkerboard corners.
Jmse 10 01528 g012
Figure 13. Summary of the experimental processing steps.
Jmse 10 01528 g013
Figure 14. Detecting results (Experiment A).
Jmse 10 01528 g014
Figure 15. Area-based stereo matching results (Experiment A): (a) SSD and (b) NCC.
Jmse 10 01528 g015
Figure 16. Key point matching by ORB (Experiment A).
Jmse 10 01528 g016
Figure 17. Feature-based stereo matching results (Experiment A).
Jmse 10 01528 g017
Figure 18. Detecting results (Experiment B): (a) input size 640 and (b) input size 2208.
Jmse 10 01528 g018
Figure 19. Area-based stereo matching results (Experiment B): (a) SSD and (b) NCC.
Jmse 10 01528 g019
Figure 20. Key point matching by ORB (Experiment B).
Jmse 10 01528 g020
Figure 21. Feature-based stereo matching results (Experiment B).
Jmse 10 01528 g021
Figure 22. Radar screen (Experiment B).
Jmse 10 01528 g022
Figure 23. Visualization of distance calculation results by monocular vision (Experiment B).
Jmse 10 01528 g023
Figure 24. Visualization of distance calculation results by stereo vision (Experiment B): (a) SSD, (b) NCC, and (c) ORB.
Jmse 10 01528 g024
Figure 25. Difference in distance calculation between monocular and stereo vision.
Jmse 10 01528 g025
Table 1. Definition of technical terms.
TermDefinition
World Coordinate System (WCS)3D coordinate system used to provide an object’s location—can be arbitrarily set.
Camera Coordinate System (CCS)3D coordinate system with respect to the camera focus. The center of the camera lens is the origin, the front direction is the z-axis, the downward direction is the y-axis, and the right direction is the x-axis.
Image Coordinate System (ICS)2D coordinate system for an image obtained with a camera. The top-left corner of the image is the origin, the right direction is the x-axis, and the downward direction is the y-axis.
Normalized Image Coordinate System (NICS)2D coordinate system for a virtual image plane. The distance from the camera focus is 1 and the effects of a camera’s intrinsic parameters are removed. The center of the plane is the origin.
Table 2. The information of dataset.
ClassInstancesPercentage
buoy 122,42289.1%
buoy 2274410.9%
Table 3. Detection results on dataset.
ClassPrecisionRecallAPmAPFPS
Buoy 10.9380.90294.0%94.3%39.1
Buoy 20.9340.90494.6%
Table 4. Technical specifications of the ZED stereo camera.
ParameterInformation
Sensor type1/3” 4MP CMOS
Output resolution2 × (2208 × 1242) @ 15 fps
2 × (1920 × 1080) @ 30 fps
2 × (1280 × 720) @ 60 fps
2 × (672 × 376) @ 100 fps
Field of viewMax. 90° (H) × 60° (V) × 100° (D)
Focal length2.8 mm
Baseline120 mm
Table 5. Camera parameter information.
ParameterLeft CameraRight Camera
Internal parameter matrix 1398.43 0 1078.26 0 1398.57 665.981 0 0 1 1397.56 0 1075.45 0 1397.51 630.608 0 0 1
Extrinsic parameter matrix R = 1 0.0006 0.0069 0.0006 1 0.003 0.0069 0.003 1 T = 119.909 0.171 0.1046
Distortion coefficient matrix Left   1.75 × 10 1 2.80 × 10 2 2.21 × 10 4 2.84 × 10 4 4.58 × 10 11
Right   1.74 × 10 1 2.70 × 10 2 3.07 × 10 4 1.67 × 10 4 2.14 × 10 11
Table 6. Camera extrinsic parameter information by solvePnP.
ParameterValue
Rotation matrix R = 0.0158 0.2614 0.9651 0.9999 0.0027 0.0156 0.0015 0.9652 0.2614
Translation vector T = 0.0153 6.6996 1.8602
Table 7. Comparison of distance calculation with distance measurement (Experiment A).
BuoyLaser (mm) D m   ( mm ) Error Rate D s   ( mm )
SSDError RateNCCError RateORBError Rate
A22542245−0.40%2157−4.50%2185−3.16%2157−4.50%
B20372001−1.80%1997−2.00%1971−3.35%2010−1.34%
C237824482.86%2335−1.84%2356−0.93%24362.38%
Table 8. Comparison of distance calculation with distance measurement (Experiment B).
Radar (mm) D m   ( mm ) Error Rate D s   ( mm )
SSDError RateNCCError RateORBError Rate
25,09324,129−4.00%18,214−37.77%18,214−37.77%21,857−14.81%
Publisher’s Note: MDPI stays neutral with regard to jurisdictional claims in published maps and institutional affiliations.