Article

Experimental Investigation on Juncture Flow Associated with a Surface-Mounted Circular Cylinder Trailed by a Backward-Facing Step

1
Shih Yen-Ping Center for Underwater Technology, National Taiwan Ocean University, Keelung 202301, Taiwan
2
Department of Systems Engineering and Naval Architecture, National Taiwan Ocean University, Keelung 202301, Taiwan
*
Author to whom correspondence should be addressed.
J. Mar. Sci. Eng. 2022, 10(10), 1494; https://doi.org/10.3390/jmse10101494
Submission received: 22 August 2022 / Revised: 5 October 2022 / Accepted: 11 October 2022 / Published: 14 October 2022
(This article belongs to the Section Ocean Engineering)

Abstract

:
Juncture flows associated with surface-mounted obstacles can be characterized by a U-shaped tubular vortical flow known as a horseshoe vortex (HSV). Horseshoe vortices are usually detrimental to engineering applications. In order to identify a boundary geometry that may effectively reduce a HSV’s strength for further design of HSV-reduction devices, or otherwise enhance it for further disaster prevention by avoiding such a geometry in design, the characteristics of HSVs influenced by external boundary geometries must first be understood. Thus, we experimentally investigated a juncture flow field associated with a fundamental geometry—a circular cylinder mounted perpendicular to a plane surface—with a trailing backward-facing step (BFS) representing a novel idea of downstream effects on upstream-formed flow structures. This setup is not only one of the simplest nonplanar geometries that generates flow features such as an unsteady separated shear layer that may considerably affect an HSV, but it is also a new attempt without prior knowledge. We used the particle image velocimetry (PIV) and PIV-based flow visualization techniques combined with a vortex-fitting algorithm to measure the juncture flow and identify the HSV and its kinematic modes at the low Reynolds number of 1166. We observed from the flow-visualization results regarding HSV’s kinematic modes and their duration percentages as follows: (1) without the BFS: “oscillation with a small displacement” (98.6%) and “breakaway to roll-up” (1.4%); (2) with the BFS (step height/cylinder diameter = 1.5): “oscillation with a small displacement” (83.3%), “merging” (4.5%), and “mixed” (12.2%). It is clearly evident that the BFS increased the number and complexity of kinematic modes, i.e., the unsteadiness of the HSV. Moreover, the PIV results show that the BFS reduced HSV stretching, which resulted in increased vortex diameter by 8.24% and increased circulation by 6.37%, i.e., the strength of the HSV was enhanced by the BFS.

1. Introduction

In many engineering applications, a strong vortical flow structure caused by a fluid flow passing a junction with a surface-mounted obstacle is often observed. This U-shaped tubular flow structure was first called a “horseshoe vortex” (HSV) by Schwind [1]. An HSV often causes detrimental effects, including noise, vibrations, scouring, and fluid–structure interactions, which affect the human living environment and may even cause damage to structures, thereby reducing safety. In military applications, especially for surface-mounted structures on submarines, such as the sail and control surfaces, HSVs are formed at associated juncture regions and extended far downstream with a high likelihood of inducing noise and reducing propulsion performance and the performance of maneuvering systems. Therefore, reducing the strength of HSVs is not only of academic interest but is also a critical engineering problem. To achieve this goal, a knowledge base regarding the characteristics of HSVs must be constructed, especially in terms of how external boundary geometries and the flow structures induced by them affect HSVs. Even though some boundary geometries under investigation may exhibit the opposite effect on HSVs, i.e., enhancing HSV strength, such results are still valuable in that these geometries can be avoided beforehand in design in order to prevent future disasters caused by HSVs.
Numerous studies have investigated HSV characteristics; most approaches to suppressing HSVs are based on these characteristics. Some relevant studies are described as follows:
  • Kubendran and Harvey [2] and Pierce and Shin [3] used fillers in the junction zone of a surface-mounted foil-section cylinder to control HSVs. Their experimental results revealed that fillers are effective in reducing the number of HSVs; however, an oversized filler is unsuitable for suppressing HSVs.
  • Wei et al. [4] experimentally studied the HSVs associated with surface-mounted square-, circular-, and diamond-shaped cylinders. They found that the size and strength of the HSV and its distance from, wall shear stresses at, and pressures near the cylinder’s leading edge (LE) decreased as the cylinder’s geometry was modified from a square to a circle and a diamond with leading vertex angles of 90°, 60°, and 30°. The aforementioned authors attributed this result to the decreasing adverse pressure gradient formed in front of the cylinder because of the decreased blockage effect of superior cylinder geometries.
  • Liu et al. [5] used a submarine model and examined the HSV induced by the sail, which is known to cause nonuniformities in the trailing wake flow and thus result in unwanted noise, vibration, and performance reductions. They installed a rectangular baffler on either side of the sail to generate an attached vortex that counter-rotated against the HSV to weaken it and rectify the trailing wake flow.
  • Younis et al. [6] generated a vortex counter-rotating against the HSV of a surface-mounted circular cylinder by using a triangular vortex generator. They reported that with the vortex generator, the circulation of the HSV decreased to approximately 4.7% of its original value, and the pressure gradient formed in front of the circular cylinder considerably reduced.
  • Huang et al. [7] studied the effects of junction fillers’ geometric parameters on the HSV upstream a surface-mounted circular cylinder. They found that as the axial length of the filler increased, the flow structure in the junction area was varied from the vortical-flow mode to the forward-flow mode when the separation of the upstream boundary layer did not occur.
In summary, methods for reducing HSV strength can be categorized into three types: methods involving (1) changing the location of the separation point of the incoming boundary layer at which the HSV forms, (2) reducing the adverse pressure gradient formed in front of the surface-mounted obstacle, and (3) generating a vortex counter-rotating against the HSV. It is evident that all these methods focus on altering the flow field upstream of the obstacle. In other words, little attention (if any) has been paid to the effects of the flow field downstream of the obstacle on the HSV.
Therefore, we experimentally examined this novel idea of how the characteristics of an HSV formed upstream, including its kinematic mode, strength (circulation), and size, are affected by flow effects caused by the downstream boundary geometry. A circular cylinder was selected as the surface-mounted obstacle in this study because the flows associated with this geometry alone have been well-studied (Huang et al. [7]; Zdravkovich [8,9]; Coutanceau and Bouard [10,11]). Trailing the circular cylinder, a backward-facing step was placed to cause the passing flow to form an unsteady separated shear layer at its edge. This layer reattached to the bottom surface and enclosed a recirculation region (Eaton and Johnston [12]; Rinoie et al. [13]). The aforementioned downstream boundary geometry was selected because the backward-facing step is not only a simple nonplanar surface that can generate multiple flow features but is also a brand-new attempt to the authors’ best knowledge. A flow visualization technique based on particle image velocimetry (PIV) was first used to identify the HSV and its kinematic modes; then, the PIV flow measurements combined with in-house vortex-fitting algorithms were used to measure the HSV’s flow characteristics. For clearly observing and precisely measuring the detailed flow characteristics of the HSV, a low-Reynolds-number flow regime (much smaller than the full-scale Reynolds number 10 7 ) in which the HSV’s kinematic mode was reported to be quasi-steady was selected for the experiment, which was performed in a closed-loop water tunnel.

2. Experimental Setup and Methods

2.1. Water Tunnel and Experimental Conditions

Qualitative flow visualizations and quantitative flow measurements based on the PIV technique were performed in a closed-loop water tunnel, whose rectangular test section had a length, width, and height of 124, 25, and 25 cm, respectively. The sidewalls, ceiling, and floor of the test section were made of transparent glass to enable optical observations of the flow phenomena. A circular cylinder was used as our experimental model because the fundamental flow fields of a surface-mounted circular cylinder are well-understood in the literature as follows. The inflow PIV measurement at the symmetric plane of z = 0 cm was performed as depicted in Figure 1. The profiles of dimensionless ensemble-averaged velocity and turbulent kinetic energy at 39 cm (x/D = −39) upstream of the circular cylinder’s leading edge are shown in Figure 2. The measured ensemble-averaged free-stream velocity Uo and boundary layer thickness δ0.99Uo were 11.66 cm/s and 0.491 cm, respectively. According to Wei et al. [14] and Baker [15], the quasi-steady mode (oscillating with a small displacement) of HSVs dominated at a low Reynolds number (ReD < 2000). Similar findings were reported by Praisner and Smith [16,17] and Hada et al. [18] with more details that HSVs were susceptible to the near-wall reverse flow. Therefore, to measure the HSV at such a stable mode, a low Reynolds number of 1166 calculated with the diameter (D = 1 cm) and the free-stream velocity (Uo = 11.66 cm/s) was used for the present experiment.
The experimental setup is illustrated in Figure 1. Two acrylic base flat-plates were used; the first was placed closer to the inlet side of the test section. The second base flat-plate was first placed next to the first one to form a continuous flat bottom surface and then removed to form a backward-facing step of height H = 1.5 cm. Both base flat-plates had a length, width, and thickness of 50, 25, and 1.5 cm, respectively, and the first base flat-plate had a 15° sharp LE. The circular cylinder was made of aluminum alloy and had a diameter of 1 cm and height of 23.5 cm. Matte black spray paint was used on the surface of the circular cylinder to reduce unwanted glare reflections. This cylinder was mounted perpendicularly on the first base flat-plate and in the symmetry plane of the test section, which ensured that the circular cylinder was located at a distance of 12 × D from the side walls to avoid wall effects. The dimensionless parameter H/D was 0 and 1.5 with and without the second base flat-plate, respectively.
The origin of the adopted Cartesian coordinate system (x, y, z) was located at the LE of the circular cylinder. The x-, y-, and z-coordinates were in the axial, vertical, and spanwise directions of the test section, respectively, as depicted in Figure 1.

2.2. PIV Techniques

The PIV techniques were used to investigate the flow characteristics of the HSV upstream of the circular cylinder. Hollow glass spheres (HGSs) with a mean diameter of 10 μm and a density of 1.1 g/cm3 were adopted for flow tracing purposes. We used a 5 W continuous-wave diode-pumped solid-state (532 nm wavelength) laser as the light source. When the laser beam was passed through the optical lens setup, a laser light sheet with a thickness of 1 mm was produced to illuminate seeding HGSs. A high-speed CMOS camera (Phantom V310, Vision Research, Wayne, NJ, USA), whose maximum sampling rate at the full resolution of 1280 × 800 pixels reaches 3250 frames per second (fps), was used to record particle images.
In the present paper, two major uncertainty sources of PIV measurements were considered, namely, calibration procedures and cross-correlation analysis, both of which were performed using LaVision’s DaVis FlowMaster (LaVision GmbH, Göttingen, Germany) software package, i.e., DaVis 10.2. For the calibration procedures carried out with a calibration target board in the present experiment, the root-mean-square value of the re-projection error, i.e., calibration fit error, yielded by DaVis 10.2 after correcting oblique viewing, barrel distortion, and cushion distortion, was 0.07 pixels. For the cross-correlation analysis, according to the DaVis 10.2 manual [19], the accuracy of its cross-correlation peak detection can attain 0.05 pixels. As a result, the combined uncertainty, ε = 0.07 2 + 0.05 2 0.09 (pixels), for the particle image displacement in the present experiment can be estimated.
The mean particle image displacement in the HSV region was estimated to be 3.81 pixels (corresponding to 2.5 cm/s). Therefore, the relative uncertainty ε% of instantaneous velocity vectors in the present experiment could be calculated as 0.09/3.81 = 2.36%.
The qualitative PIV-based flow visualizations and the quantitative PIV flow measurements shared the same field of view of 25.2 × 15.7 mm2 with a spatial resolution of 1.96 pixel/mm in the z = 0 cm, z = 0.4 cm, and z = 0.8 cm planes, as shown in Figure 1a,b. The other experimental parameters, including their sampling rates, exposure times, and locations of fields of view, are described in detail as follows:
A.
The qualitative PIV-based flow visualizations were used to capture the kinematic behaviors of the HSVs associated with the circular cylinder. The clear flow structures, including vortical structures, were visualized using the pathlines of the seeding particles at a prolonged exposure time of 42,000 µs. The high-speed CMOS camera captured 1440 frames at the sampling rate of 24 fps for 60 s in each plane when z = 0, 0.4, and 0.8 cm. Even though the z = 0.4 and 0.8 cm planes did not cut perpendicular to the axis of the HSV as done approximately by Praisner and Smith [16,17], the HSV’s kinematic modes and its approximate center positions to show the spanwise development could still be investigated with the flow visualizations at these three z-planes.
B.
The quantitative PIV flow measurements at the symmetric plane of z = 0 cm were performed to investigate the HSV’s flow characteristics. A sequence of 3000 frames of the particle images was recorded using a high-speed CMOS camera at a sampling rate of 170 fps with an exposure time of 125 μs. The time series of instantaneous velocity vector maps were then yielded from the consecutive particle images using the cross-correlation analysis performed with LaVision’s DaVis FlowMaster software package. The HSV’s flow characteristics, namely, its radius, core vorticity, and circulation, could be determined using the in-house vortex-fitting algorithms (details follow) with the vorticity distributions calculated from the measured velocity vector maps.

2.3. Vortex-Fitting Algorithms

From the calculated vorticity distributions based on the PIV flow measurements, we could use a theoretical vortex model to deduce representative flow characteristics of the HSV. However, vortical flows are affected by close-by solid boundaries and intense shear layer flows; thus, they are easily distorted and deformed in junction regions. The HSV did not easily retain a circular shape, and the associated vortex characteristics were not easy to define. To quantitatively describe the flow characteristics of the HSV, such as its radius, core position, and circulation, we used a modified mathematical model based on Burgers’ vortex model [20] with a Gaussian distribution to produce a numerical fit of vorticity distribution. This distribution was used to determine the flow characteristics of the HSV.
The vortex-fitting algorithm involved four steps:
(1)
defining the range of the search for the vortex core position as a region near an initial reference vortex core position using the particle pathlines associated with the HSV found in the PIV-based flow visualizations;
(2)
expanding an 11 × 11 grid centered at the reference vortex core position to compute the vorticity distribution;
(3)
adjusting this computed vorticity distribution using the vortex radius, standard deviation of the Gaussian distribution, and circulation strength, as shown in the equations listed below;
(4)
determining a suitable combination of these three parameters mentioned in (3) by minimizing the root-mean-square deviation between the actual vorticity distribution obtained in the PIV measurement and the computed vorticity distribution.
In Burgers’ vortex model [20], the circumferential velocity vθ of a three-dimensional vortex is presented in cylindrical (r, θ, z) coordinates as follows:
v θ r = Γ 2 π r 1 e 1.256 r 2 a 2
where the radius a at which the maximal vθ occurs and the circulation Γ are constants to be given. The vorticity ωz derived from Equation (1) can be calculated as follows:
ω z r = Γ π a 2 1.256 e 1.256 r 2 a 2
However, in contrast to the vorticity distribution in Burgers’ vortex model (computed from Equation (2)), the vorticity distribution in the real flows was more concentrated toward the vortex core region, and the outlying vorticity was relatively weak because of the shear layer effect. Therefore, the Gaussian distribution used to adjust the concentration distribution of vorticity was determined as follows:
p ( r ) r d r d θ = 1 2 π σ 2 e r 2 2 σ 2 r d r d θ
r 2 = r 2 + r 2 2 r r cos θ
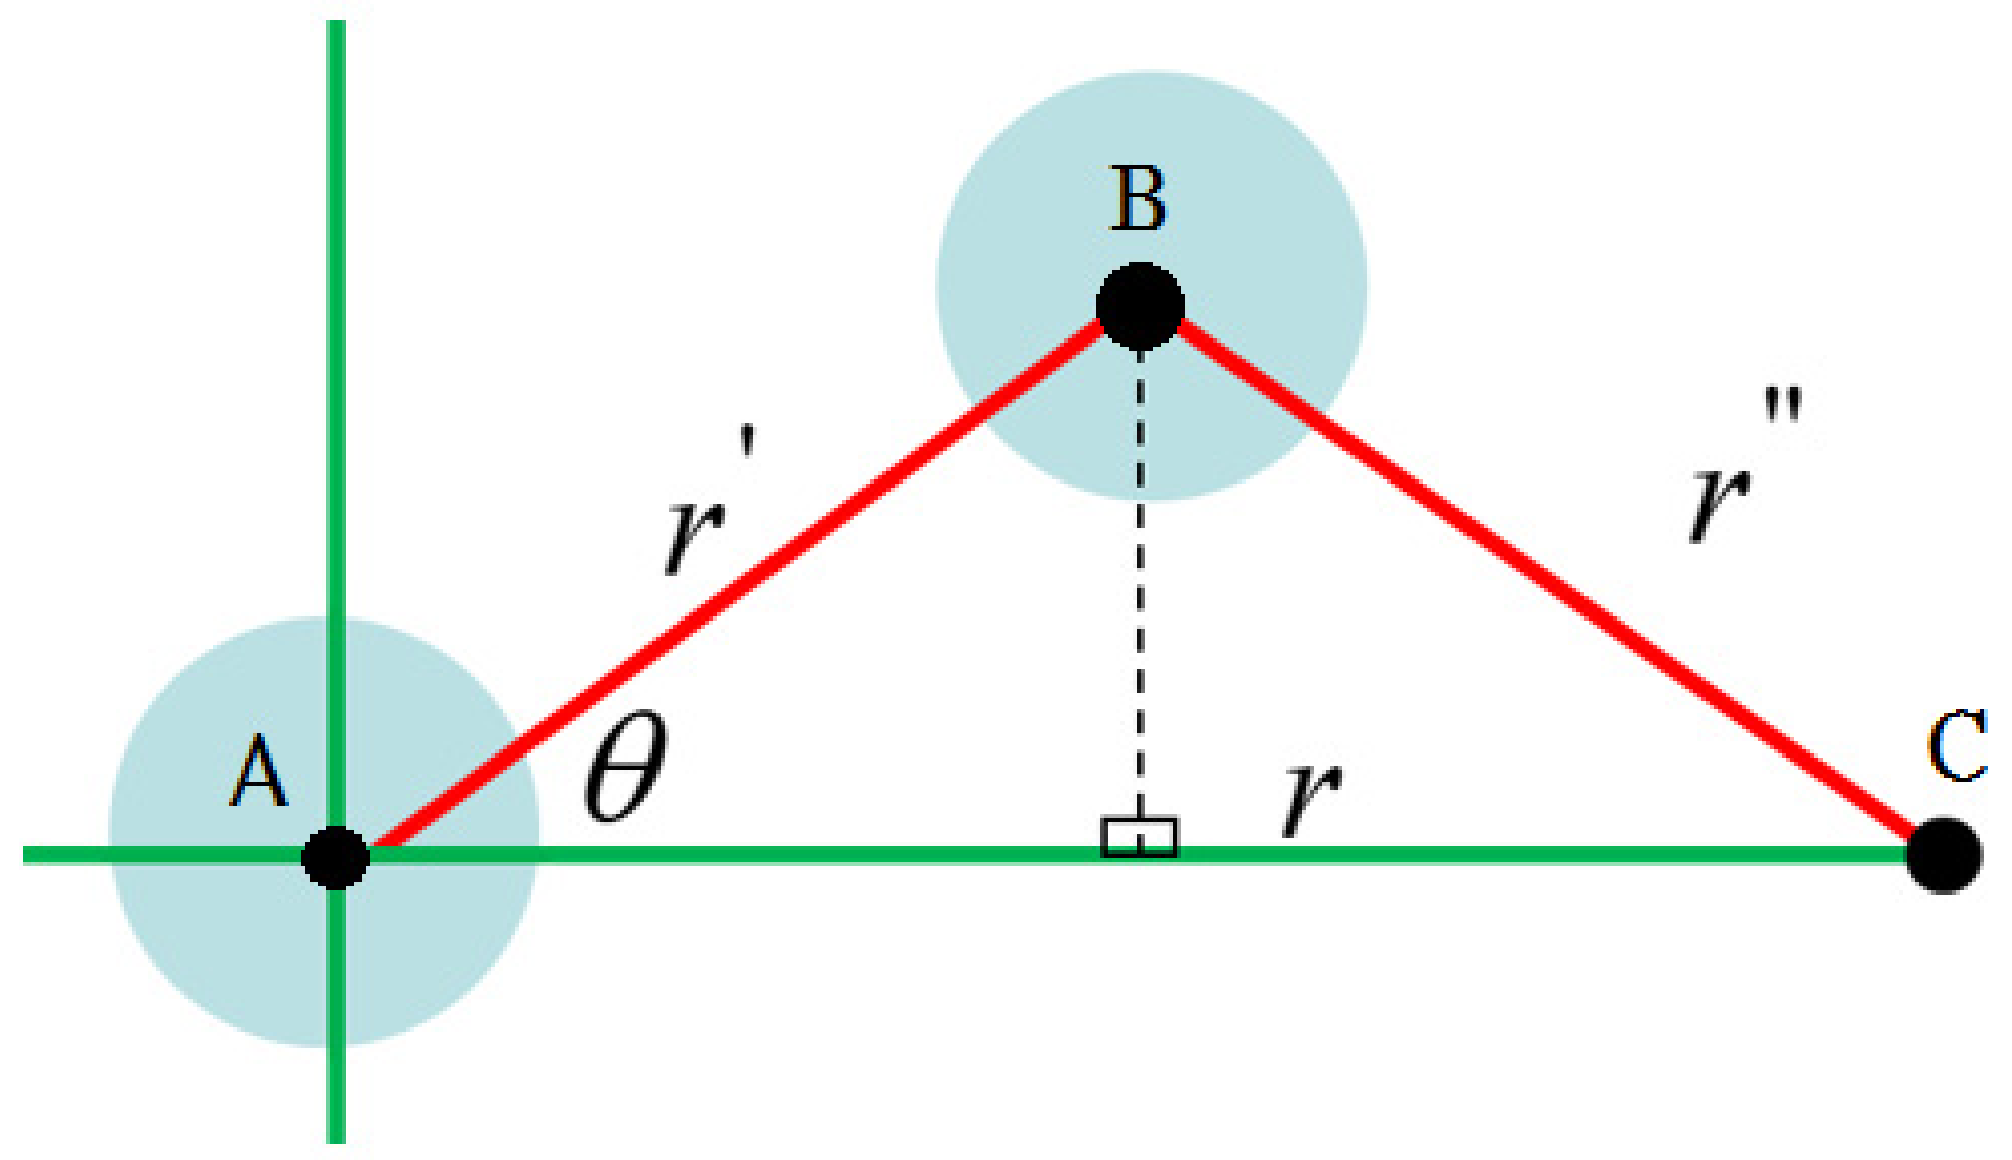
In Equations (3) and (4), p(r′) is the probability density function, σ is the standard deviation, r′ is the distance between the averaged vortex core position (A) and the discrete vortex core position (B), r″ is the distance between the discrete vortex core position (B) and an arbitrary position (C), and r is the distance between the averaged vortex core position (A) and an arbitrary position (C) (Figure 3). By substituting the Gaussian distribution in Equation (3) into the Burger vortex model presented in Equation (2), the following equation is obtained:
ω ¯ z B r = 0 2 π 0 ω z B r p ( r ) r d r d θ
To simplify this equation, constant terms can be replaced by h and q as follows:
ω ¯ z B r = Γ π a 2 e 1.256 r 2 a 2 1 . 256 2 π σ 2 0 2 π 0 e h r 2 + q r r d r d θ
where
h = 1.256 a 2 + 1 2 σ 2
q = 2.512 r cos θ a 2
and the second integral in Equation (6) can be calculated as
0 e h r 2 + q r r d r = π q e q 2 4 h 4 h 3 / 2 e r f 2 h r q 2 h 0 + 1 2 h
where erf denotes the error function. Substituting Equation (9) into Equation (6) finally yields
ω ¯ z B r = Γ π a 2 e 1.256 r 2 a 2 1 . 256 σ 2 π q e q 2 4 h 4 h 3 / 2 e r f 2 h r q 2 h 0 + 1 2 h

3. Results and Discussion

3.1. Flow Visualization for the HSVs When H/D = 0

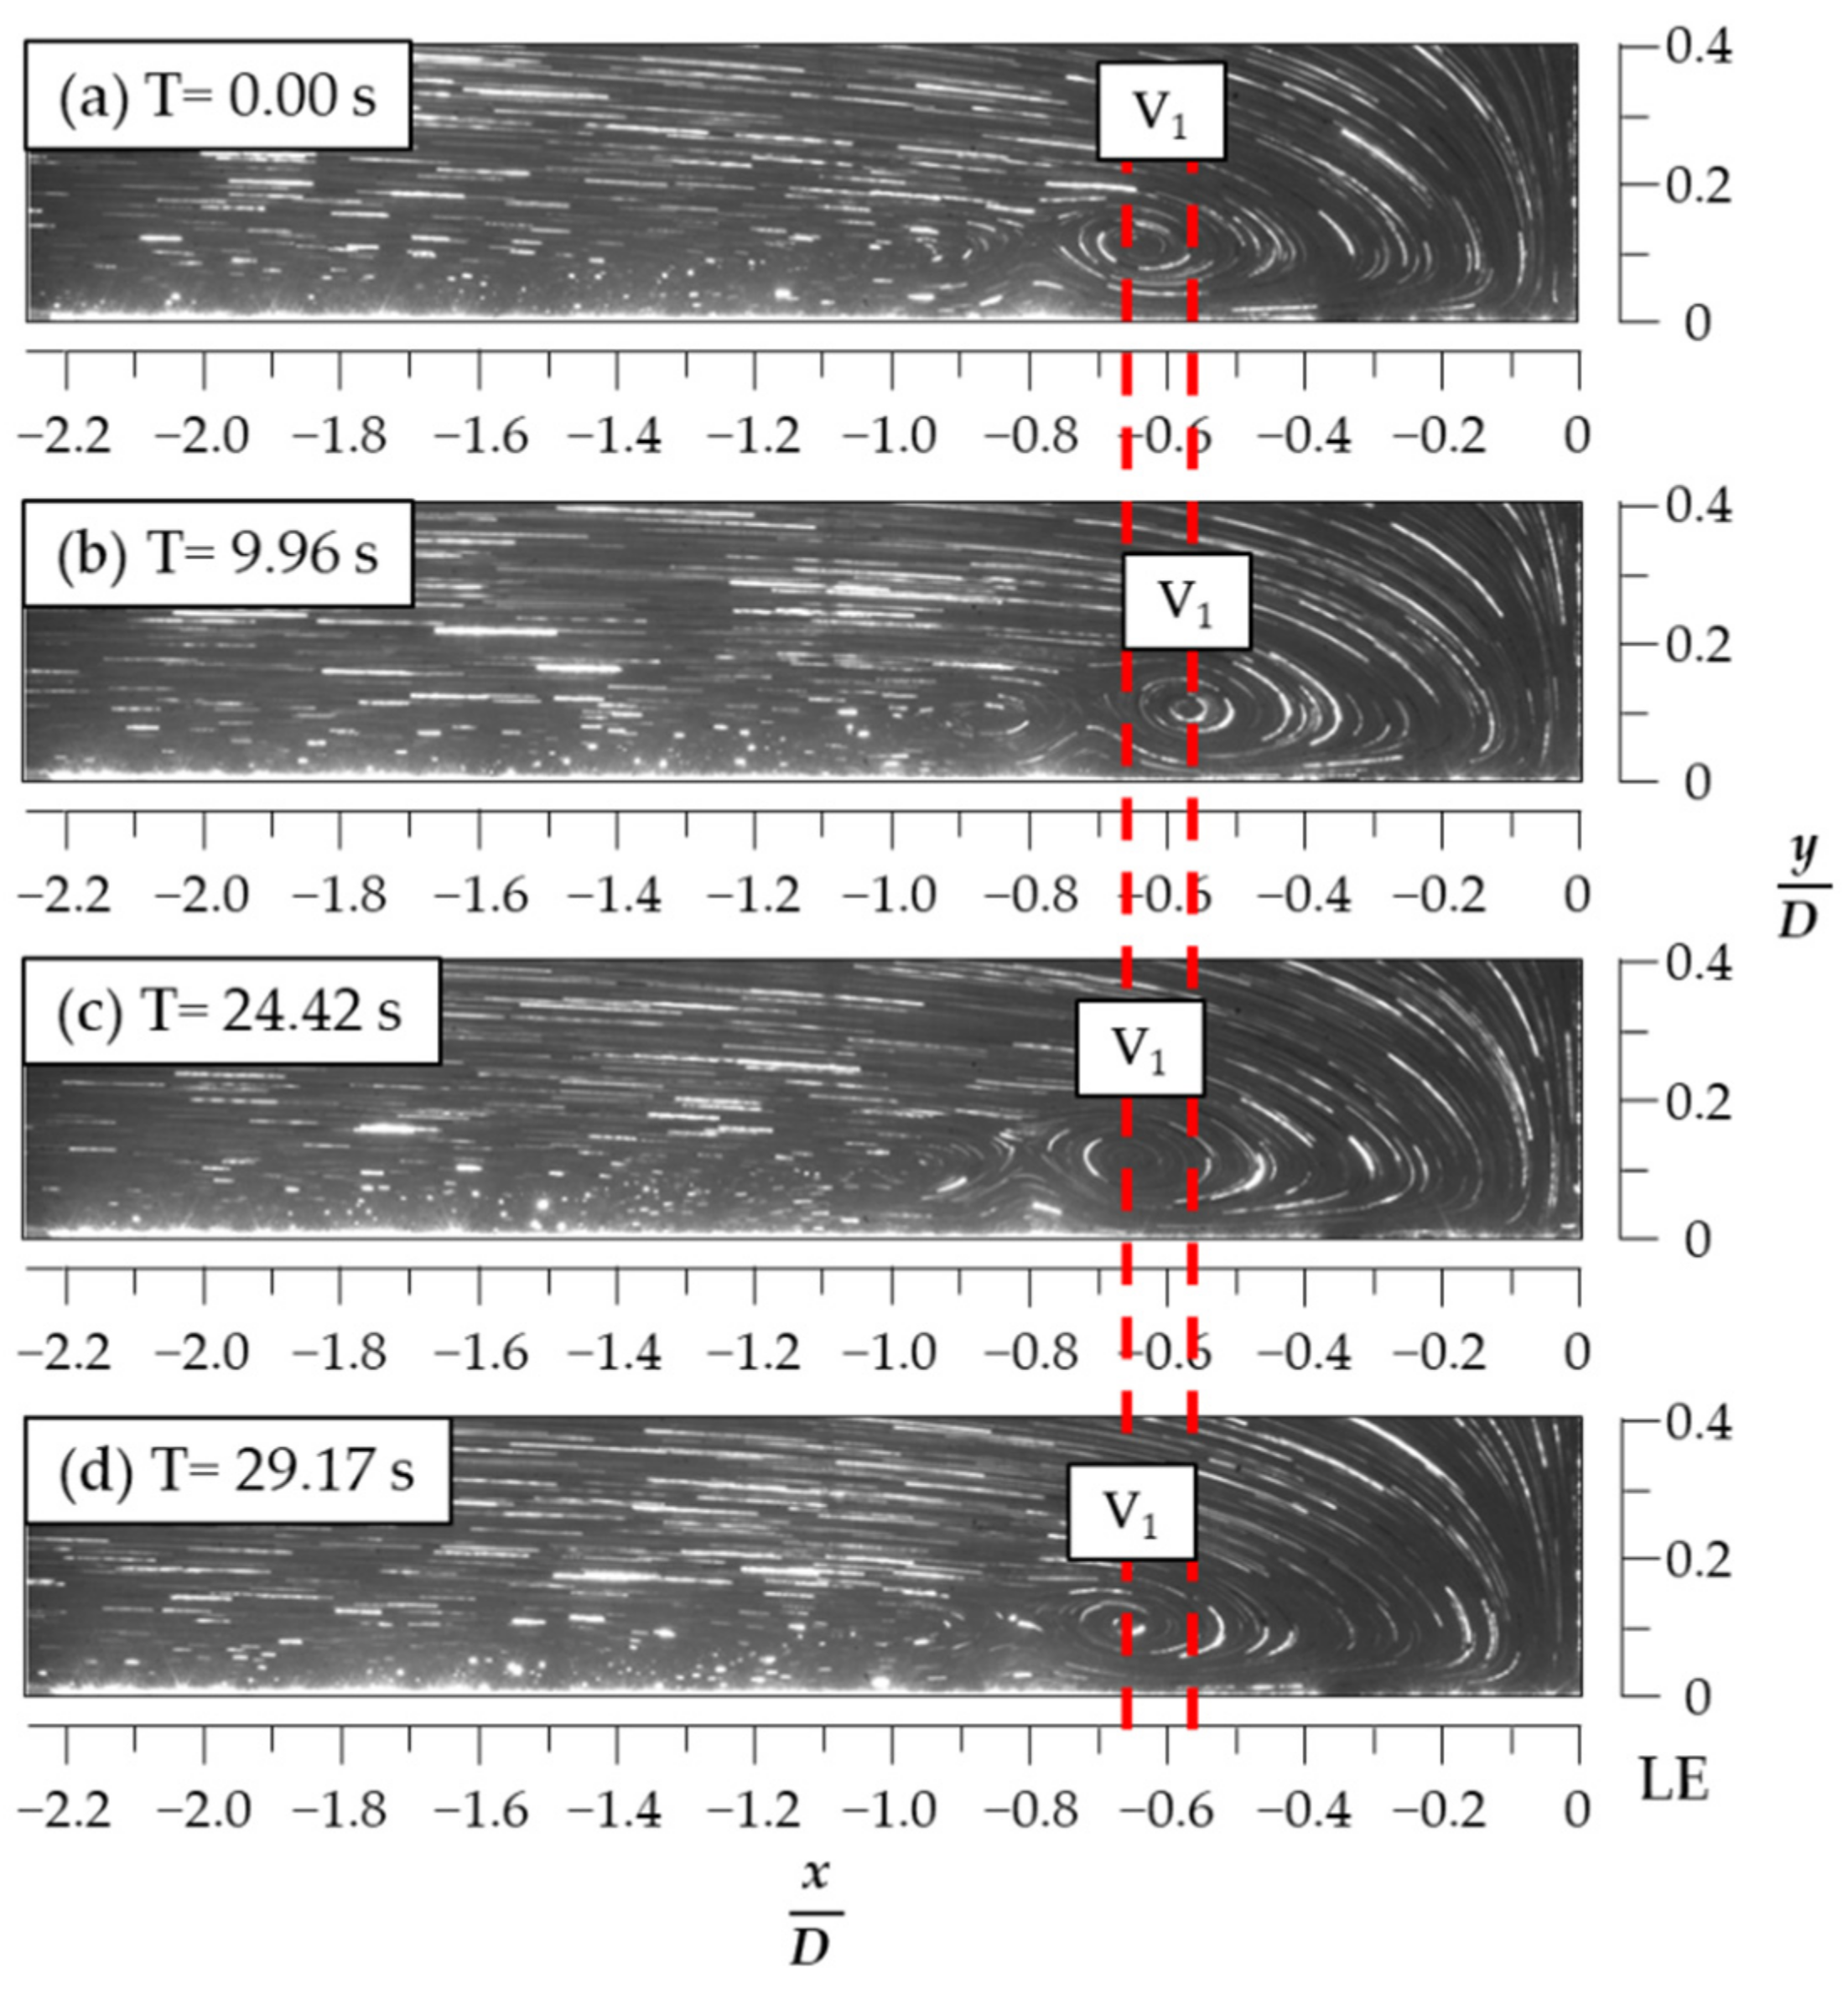
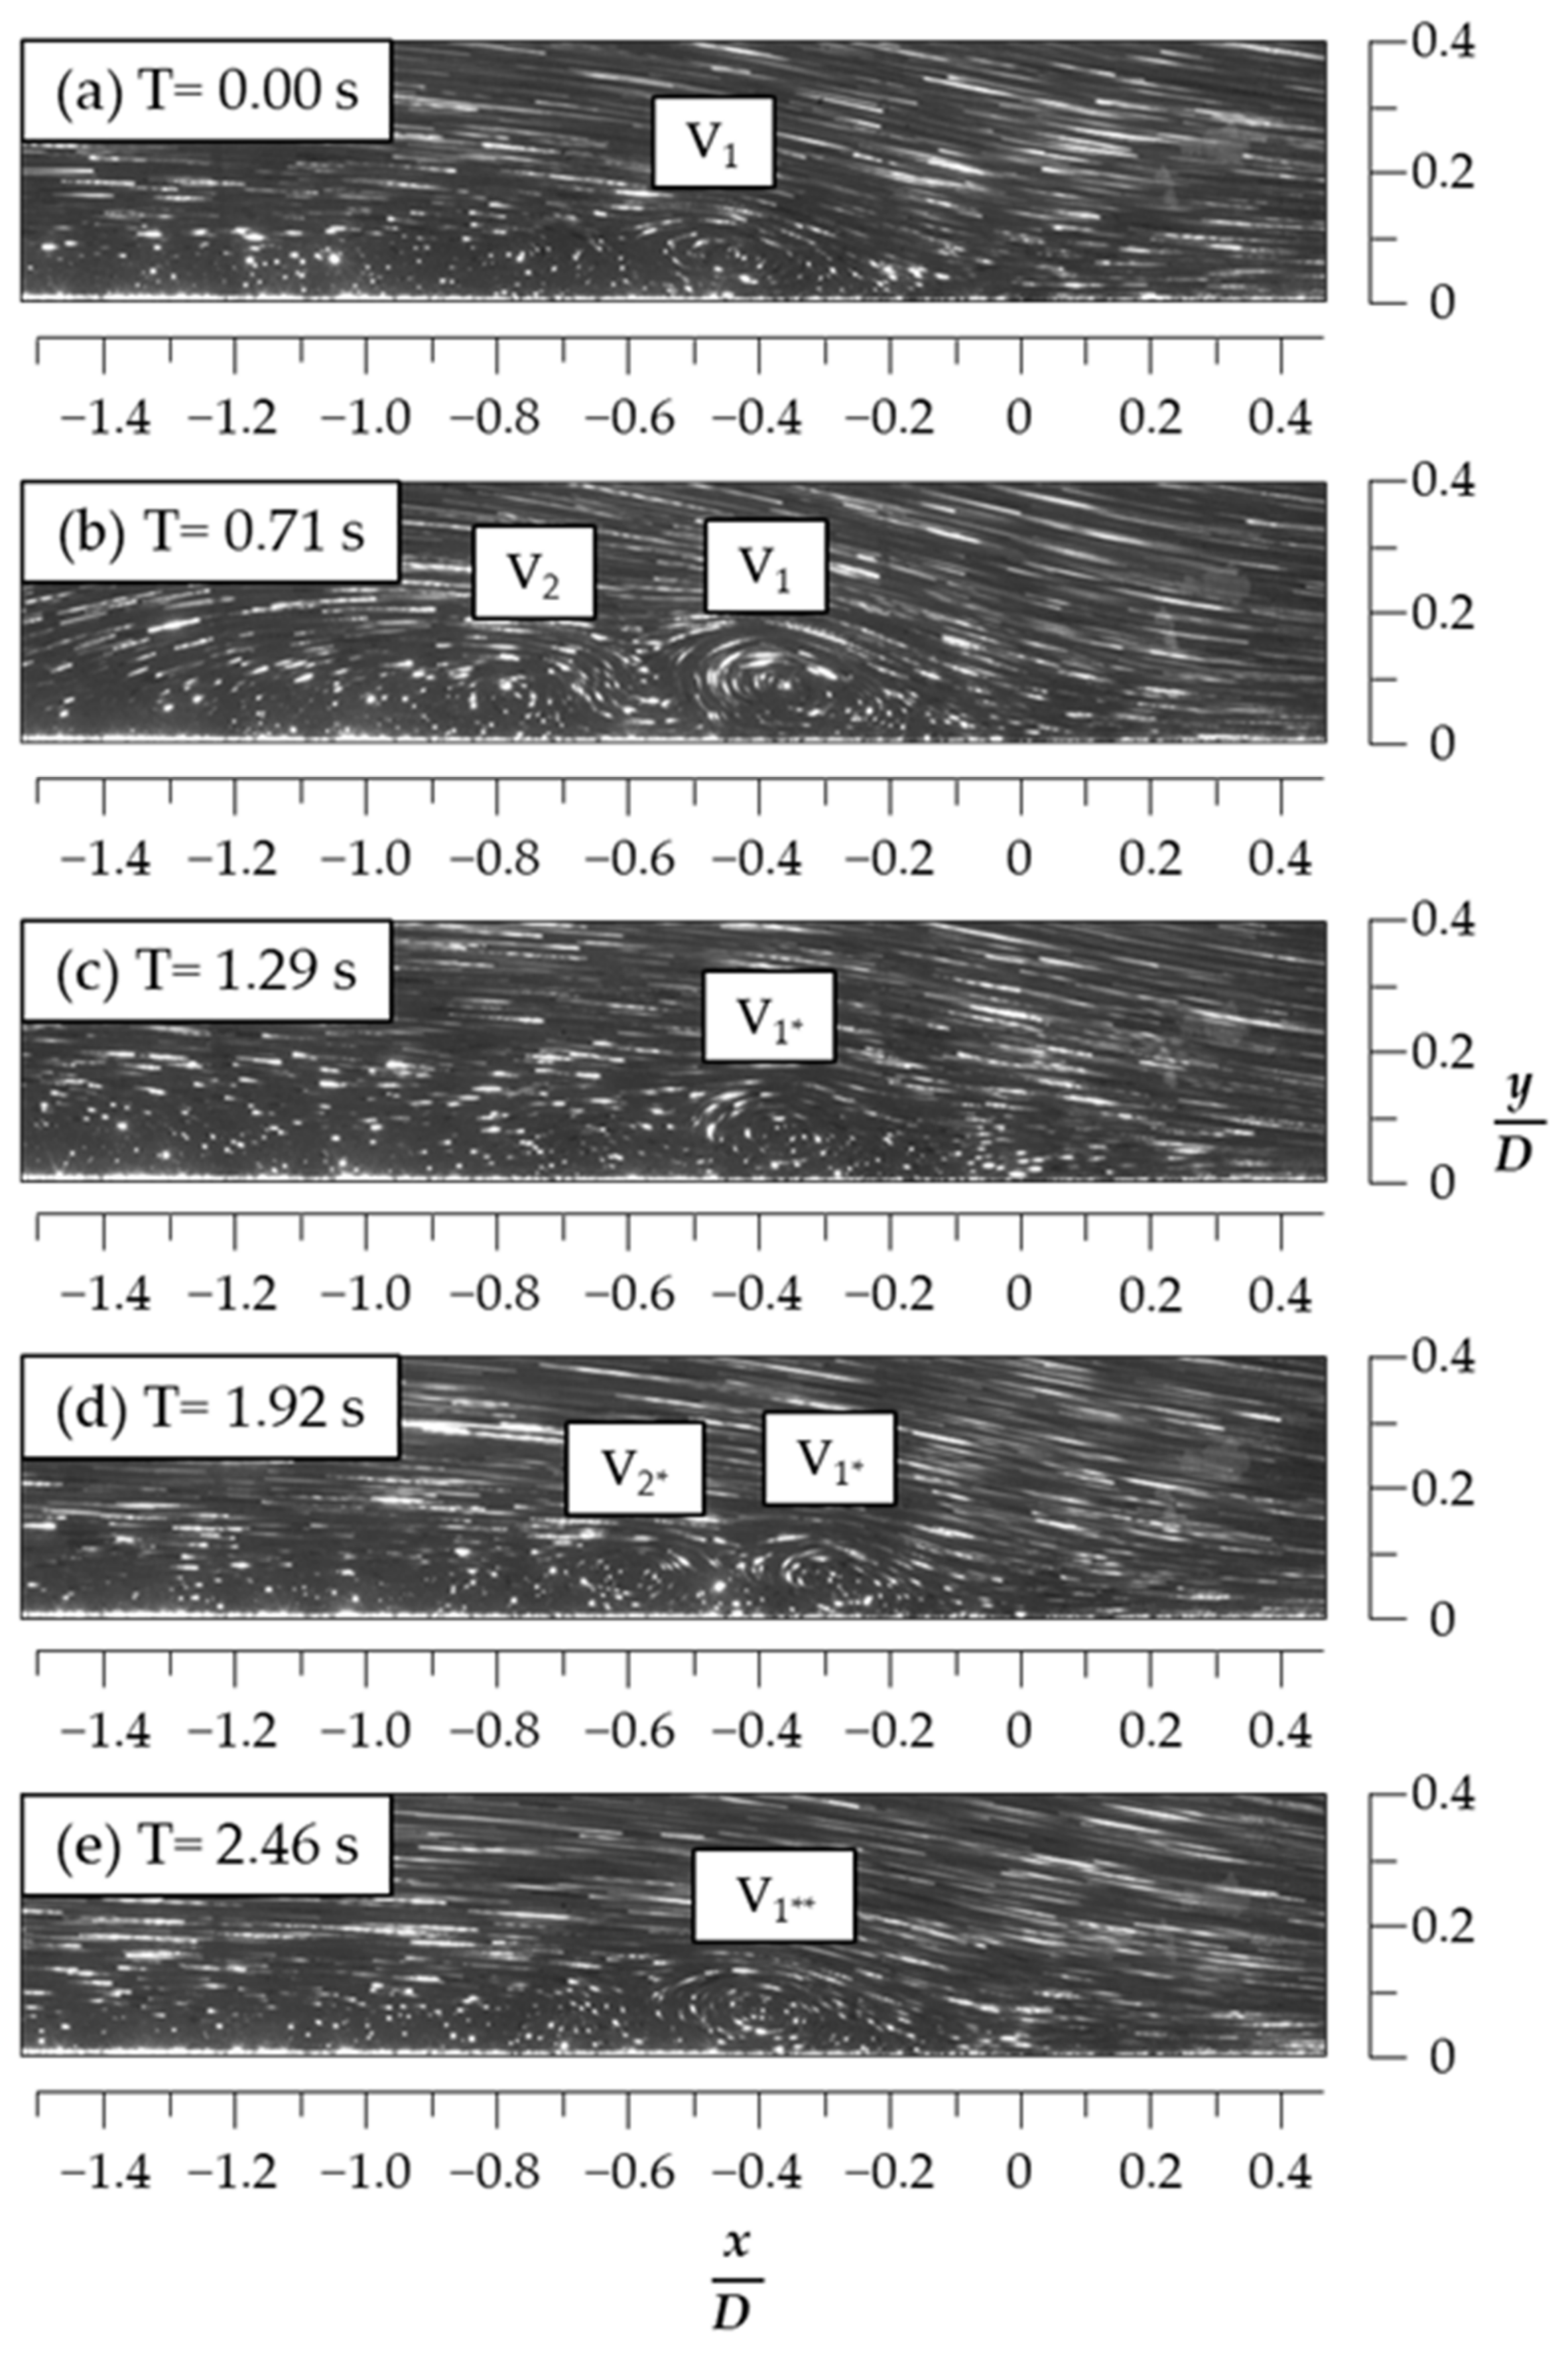
Figure 4, Figure 5, Figure 6 and Figure 7 present characteristic time-series samples of the flow visualization for the HSVs imaged upstream of the LE of the circular cylinder in the z = 0 cm, z = 0.4 cm, and z = 0.8 cm planes, when H/D = 0, i.e., no backward-facing step is present. As shown in Figure 4 and Figure 5, with the flow visualizations in the z = 0 cm and z = 0.4 cm planes, respectively, to represent all the visualization data acquired when H/D = 0, it was found that the dominant (details follow) kinematic mode of the HSV(s) was the “oscillation with a small displacement”. The two red dashed lines in Figure 4 indicate the oscillation range of the core of the HSV closest to the LE (labeled V1) in the z = 0 cm plane between x/D = −0.57 and −0.67, i.e., a small displacement of the HSV within a range of approximately 0.10 D. The mean x-position (xm) of the V1′s core was at about xm/D = −0.64.
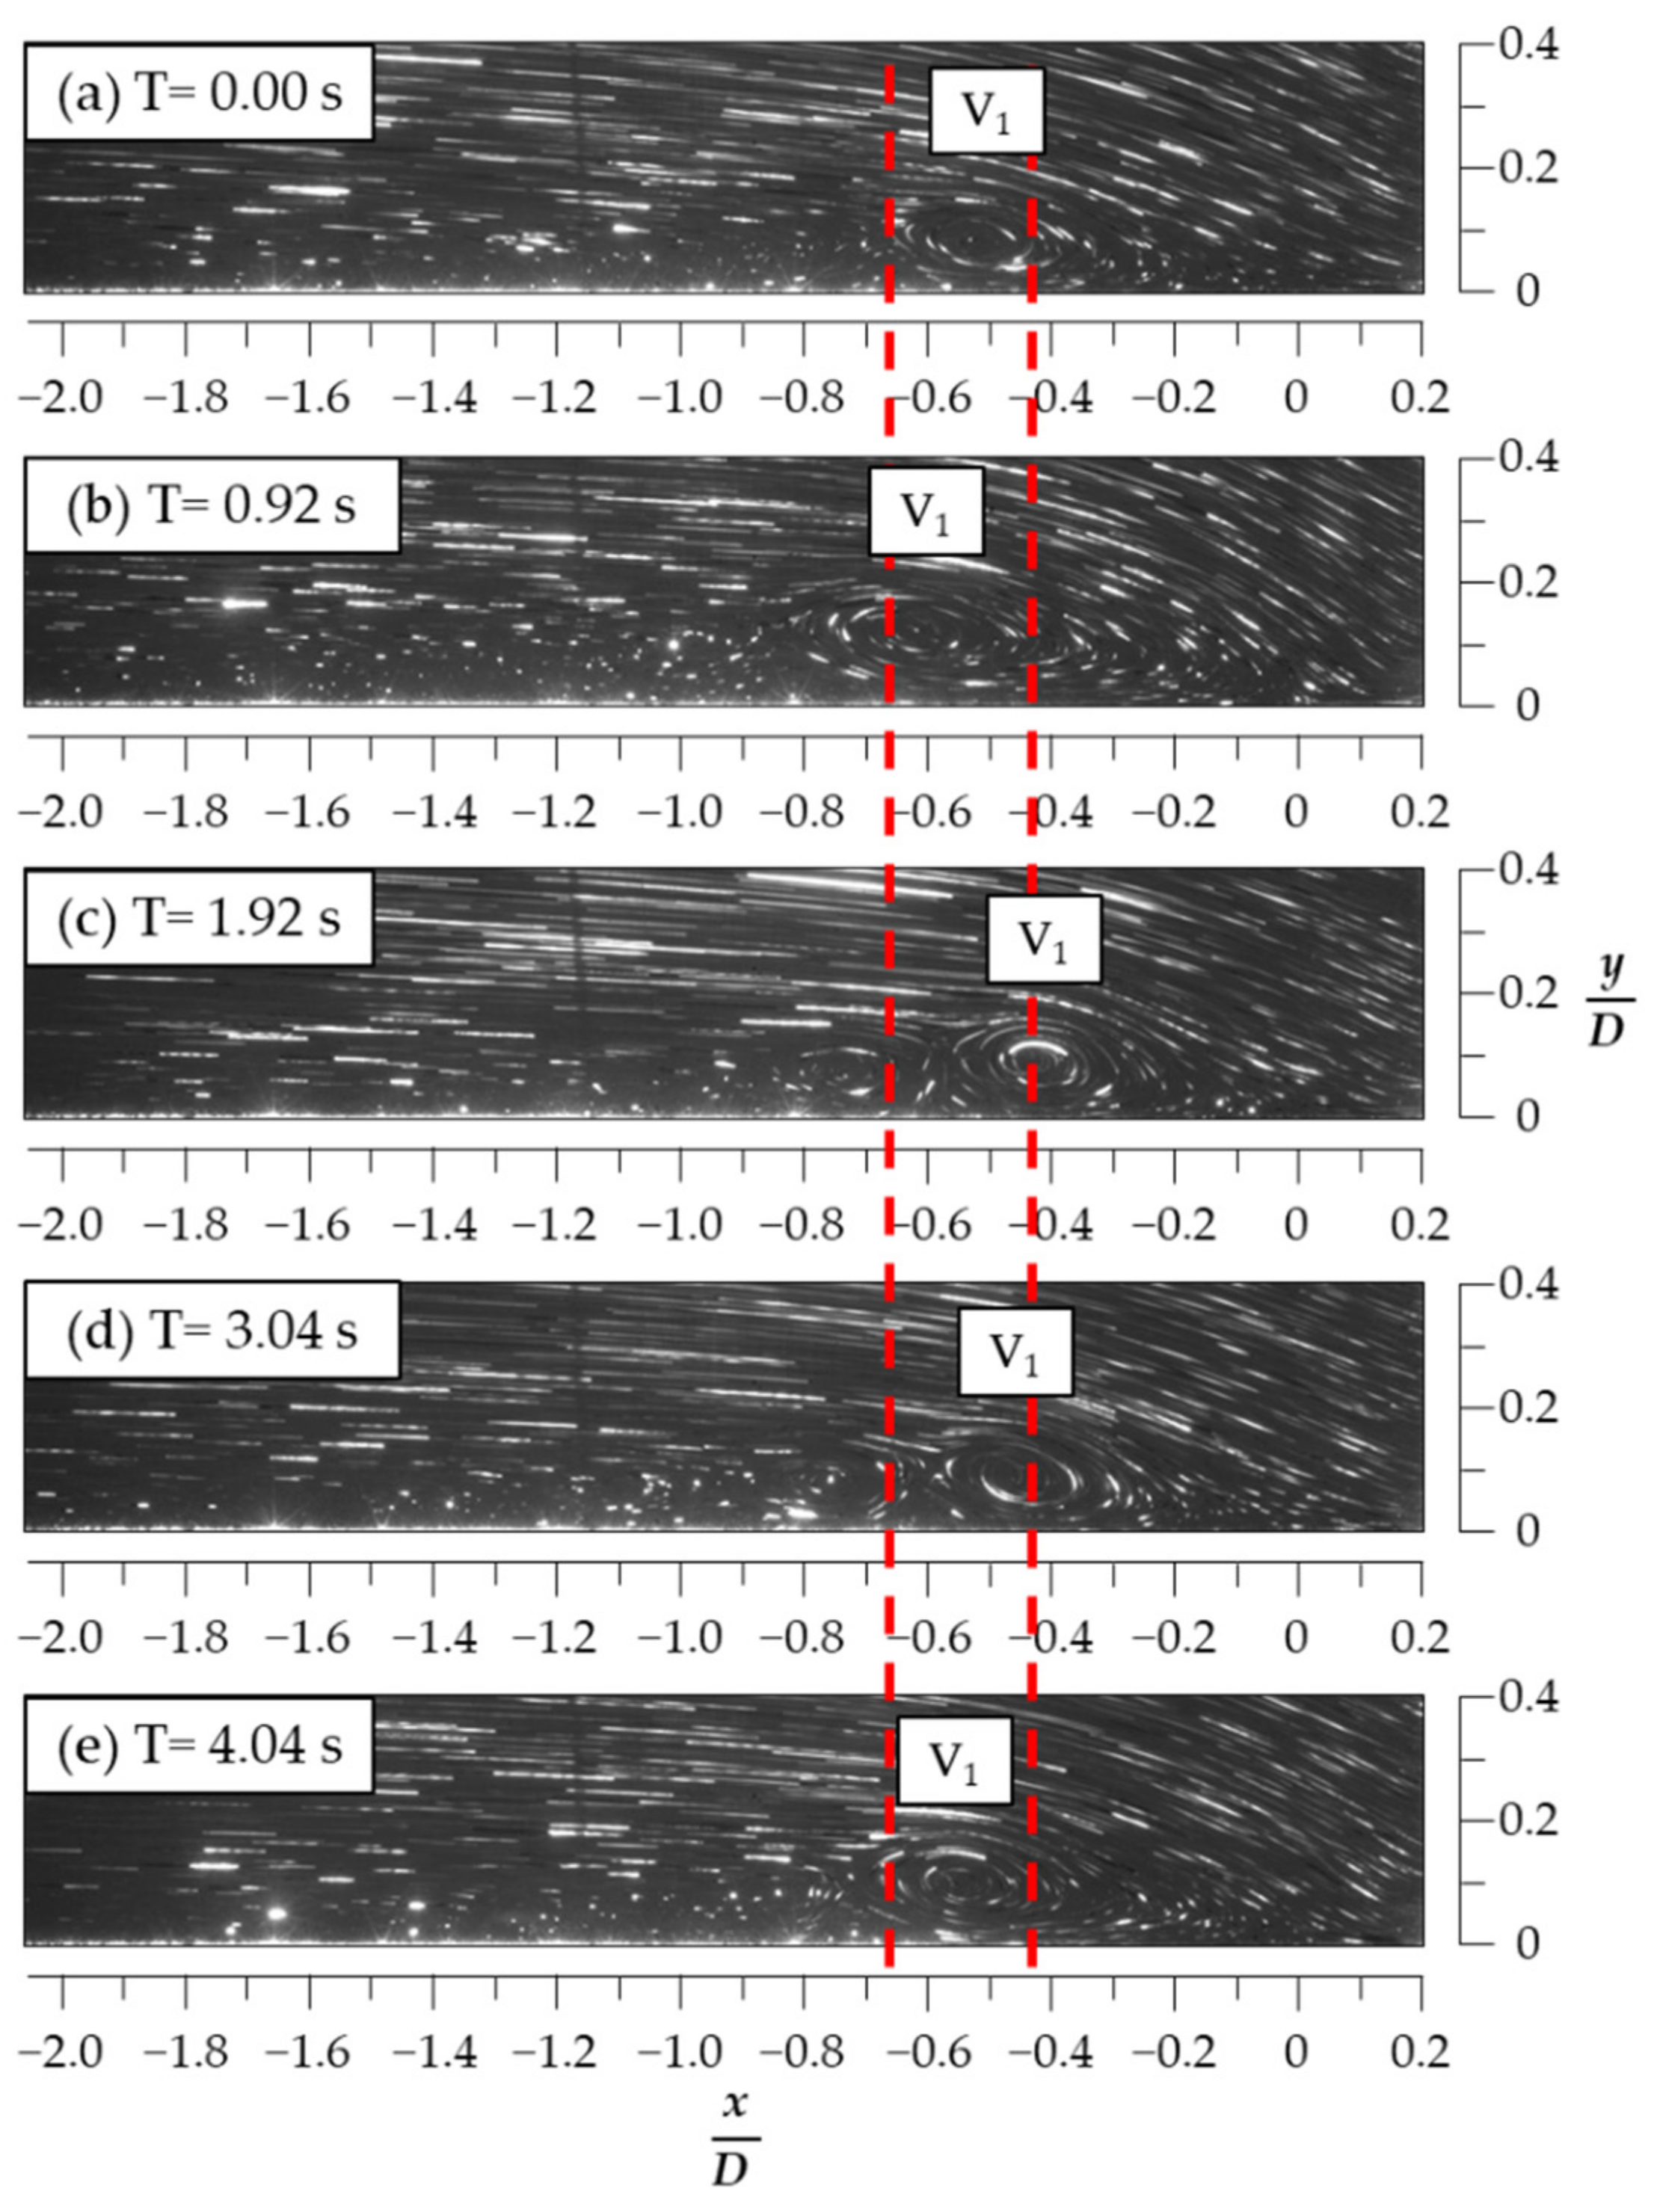
Similarly, the two red dashed lines in Figure 5 also indicate the oscillation range of the V1′s core in the z = 0.4 cm plane between x/D = −0.43 and −0.64 (a range of approximately 0.21 D) with the mean x-position at about xm/D = −0.51. It is interesting to observe that the oscillation range of the HSV in the z = 0.4 cm plane was approximately two times larger than that in the z = 0 cm plane, implying that the top-viewed U-shape of the HSV was not only translating but also changing (stretching or shrinking) from time to time.
A rare (details follow) but striking kinematic mode(s), the “breakaway to roll-up”, was only captured in the flow visualization in the z = 0.4 cm plane, i.e., this mode was not observed during the flow visualizations in the other two z-planes. The depiction of this kinematic mode is as follows. Figure 6a shows that the core of the HSV (labeled V1) was initially located at (x/D, y/D) = (−0.57, 0.13). Then, V1 was undergoing a process where it was moving downstream to the LE and gradually decreasing in size from (x/D, y/D) = (−0.57, 0.13) in Figure 6a to (x/D, y/D) = (−0.36, 0.06) in Figure 6c because of the vortex stretching over time. This process (mode) was referred to as the “breakaway” in previous literature (e.g., Lin et al. [21,22]; Rodriguez y Dominguez et al. [23]). At a later time, as shown in Figure 6d, V1 was stopping its downstream movement and vanishing at about x/D = −0.31 because of the viscous dissipation, and at the same time a new HSV (labeled V2) was seen to be rolling up in a process (mode), which is referred to as the “roll-up” in the present paper, at about x/D = −0.05. To the authors’ best knowledge, this “roll-up” mode has never been reported in the previous literature. In a later period, as shown in Figure 6e–g, V2 was increasing in size and moving upstream from (x/D, y/D) = (−0.15, 0.06) in Figure 6e to (x/D, y/D) = (−0.46, 0.13) in Figure 6g, and becoming a V1 in the next mode that occurred.
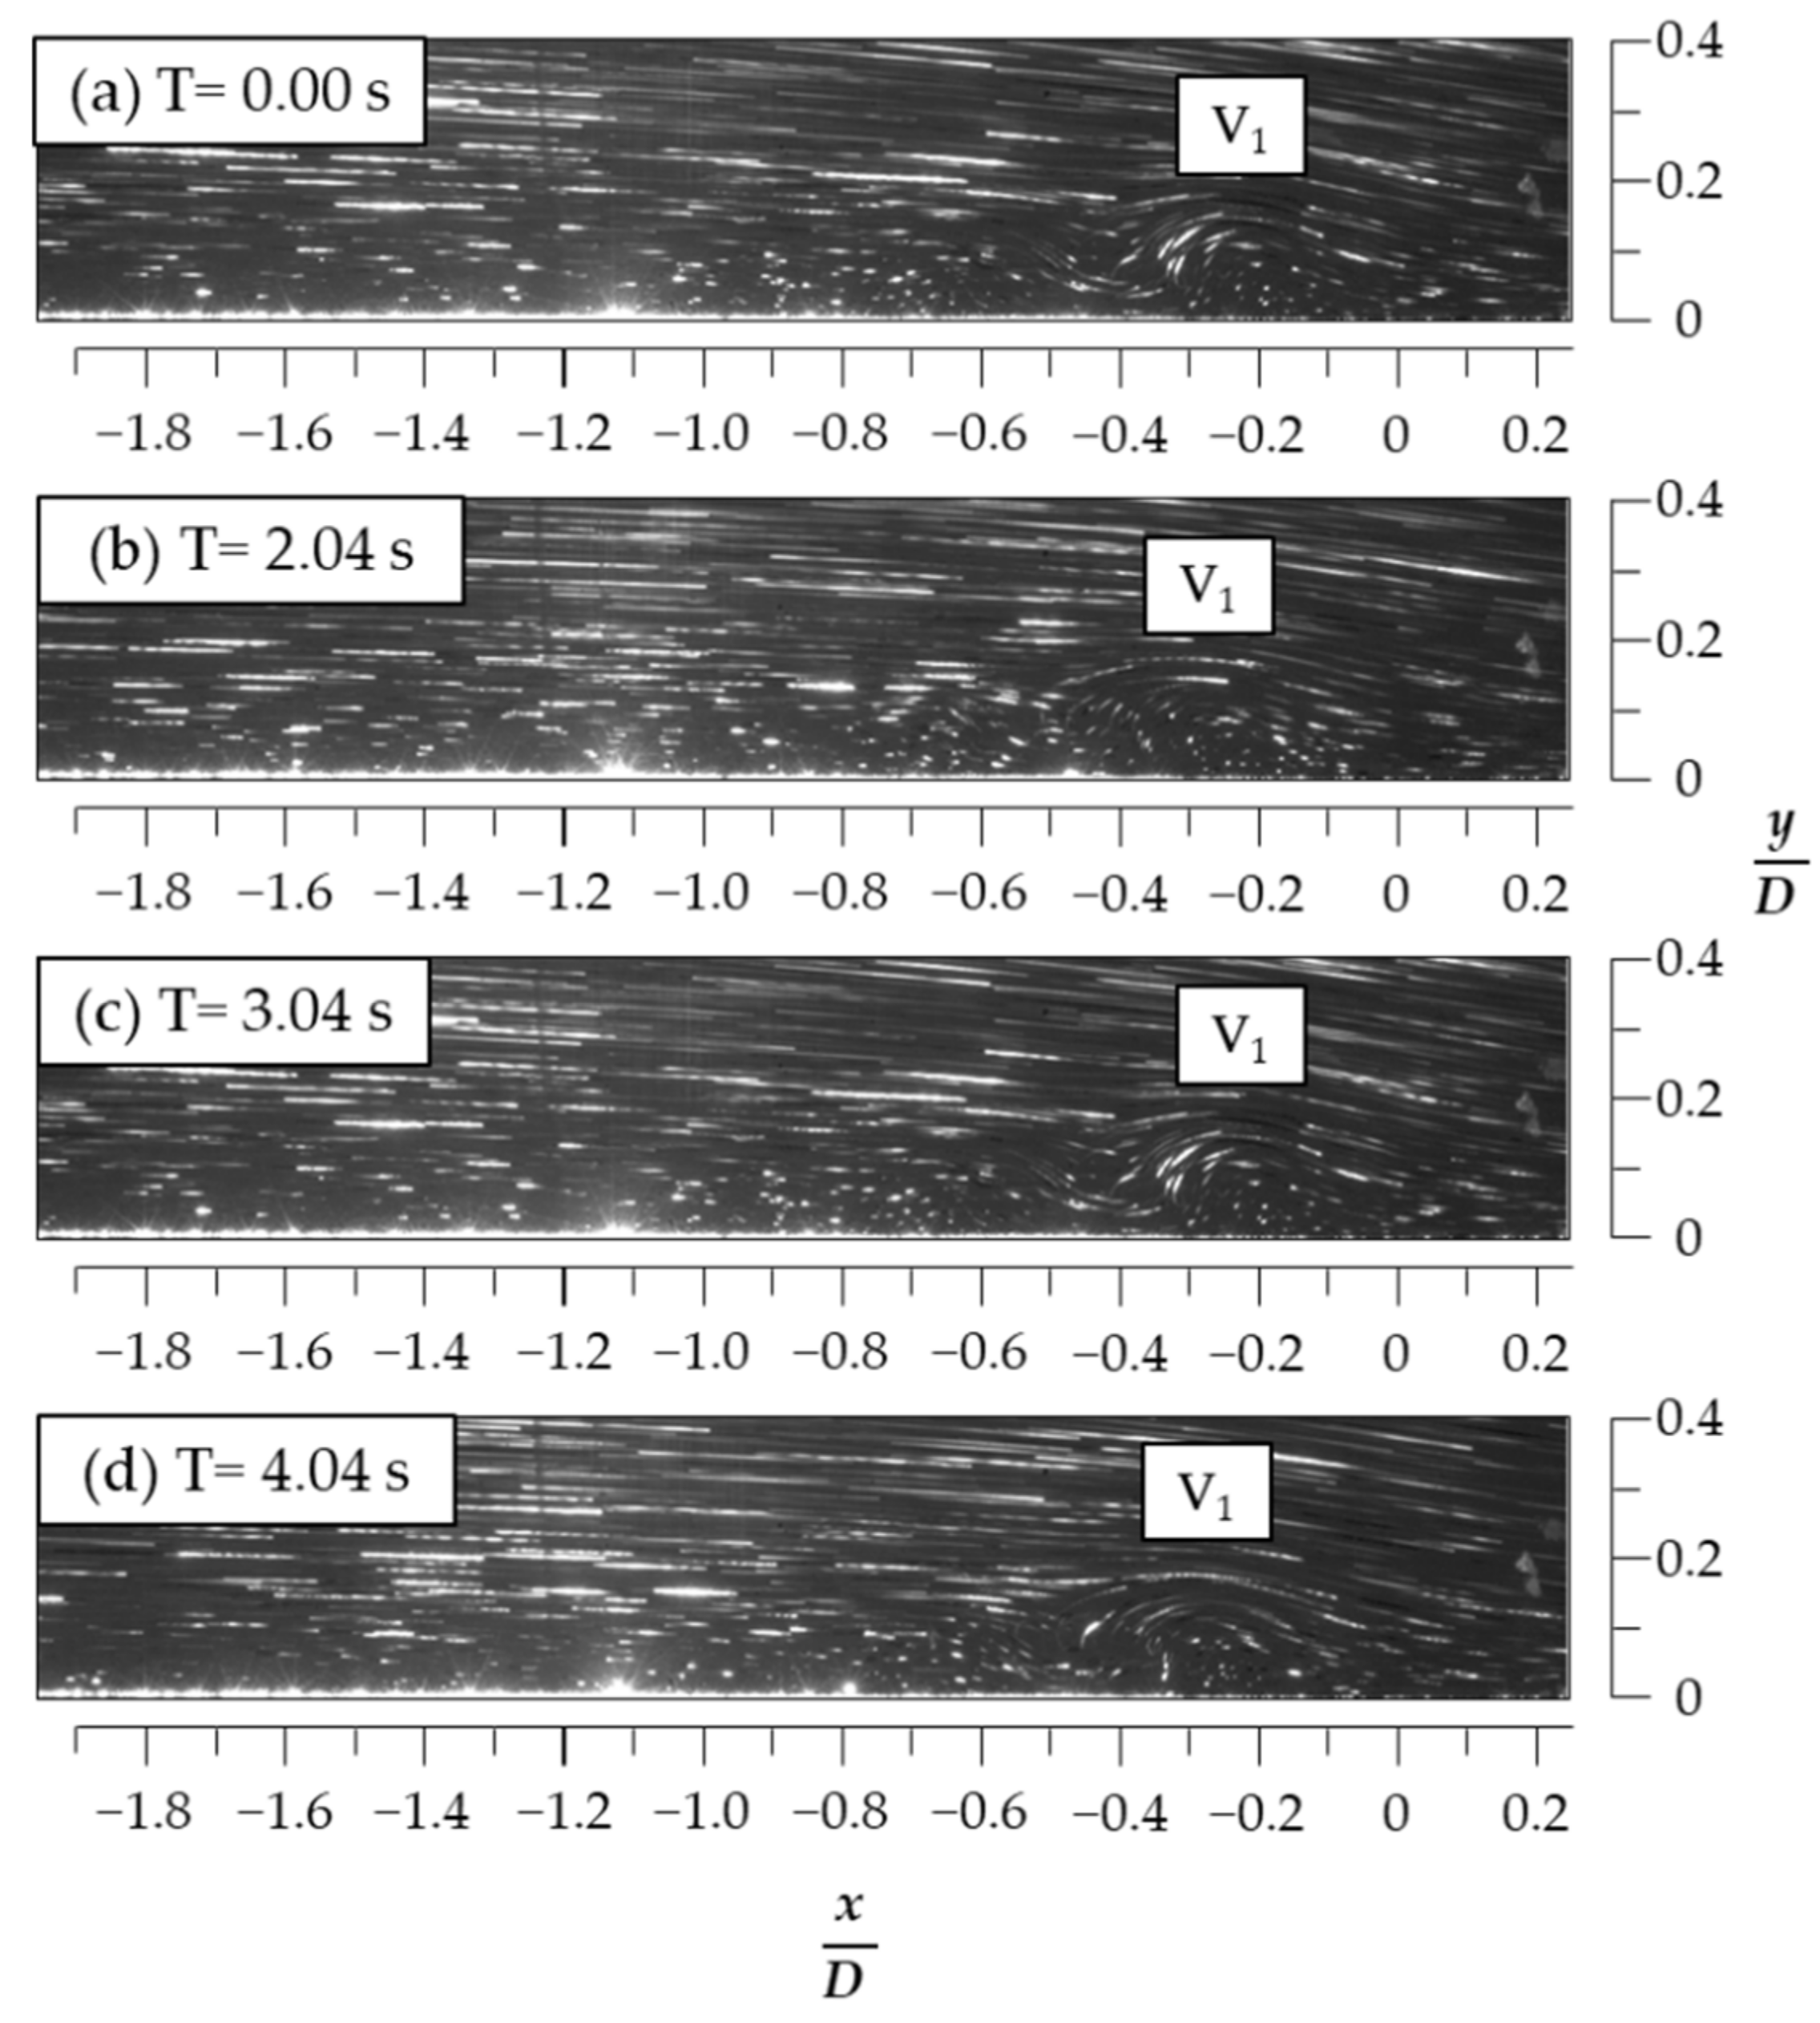
Figure 7 presents the cross-section of the leg portion of the HSV’s top-viewed U-shape using the flow visualization in the z = 0.8 cm plane. The leg portion of the HSV can be regarded as the extension of the HSV originating from the frontal junction of the circular cylinder in the z = 0 cm plane. Figure 7a–d reveal that the HSV structure (labeled V1) near x/D = −0.23 was not as clear as shown in the other two z-planes. Moreover, V1 was decreasing in size, and its core was near the floor at about y/D = 0.05. These observations imply that the imaging field of view in the z = 0.8 cm plane was cut at and was almost aligned with the leg portion of the HSV.

3.2. Flow Visualization for the HSVs When H/D = 1.5

Figure 8, Figure 9, Figure 10, Figure 11, Figure 12, Figure 13, Figure 14, Figure 15 and Figure 16 present characteristic time-series samples of the flow visualization for the HSVs imaged upstream of the LE of the circular cylinder in the z = 0, 0.4, and 0.8 cm planes, when H/D = 1.5, i.e., with the external flow shearing generated in the presence of a backward-facing step. The kinematic behaviors (modes) of the HSV when H/D = 1.5 were more dynamic than that when H/D = 0, as three modes were observed in the flow visualizations in all three z-planes: “oscillation with a small displacement”, “merging”, and “mixed”.
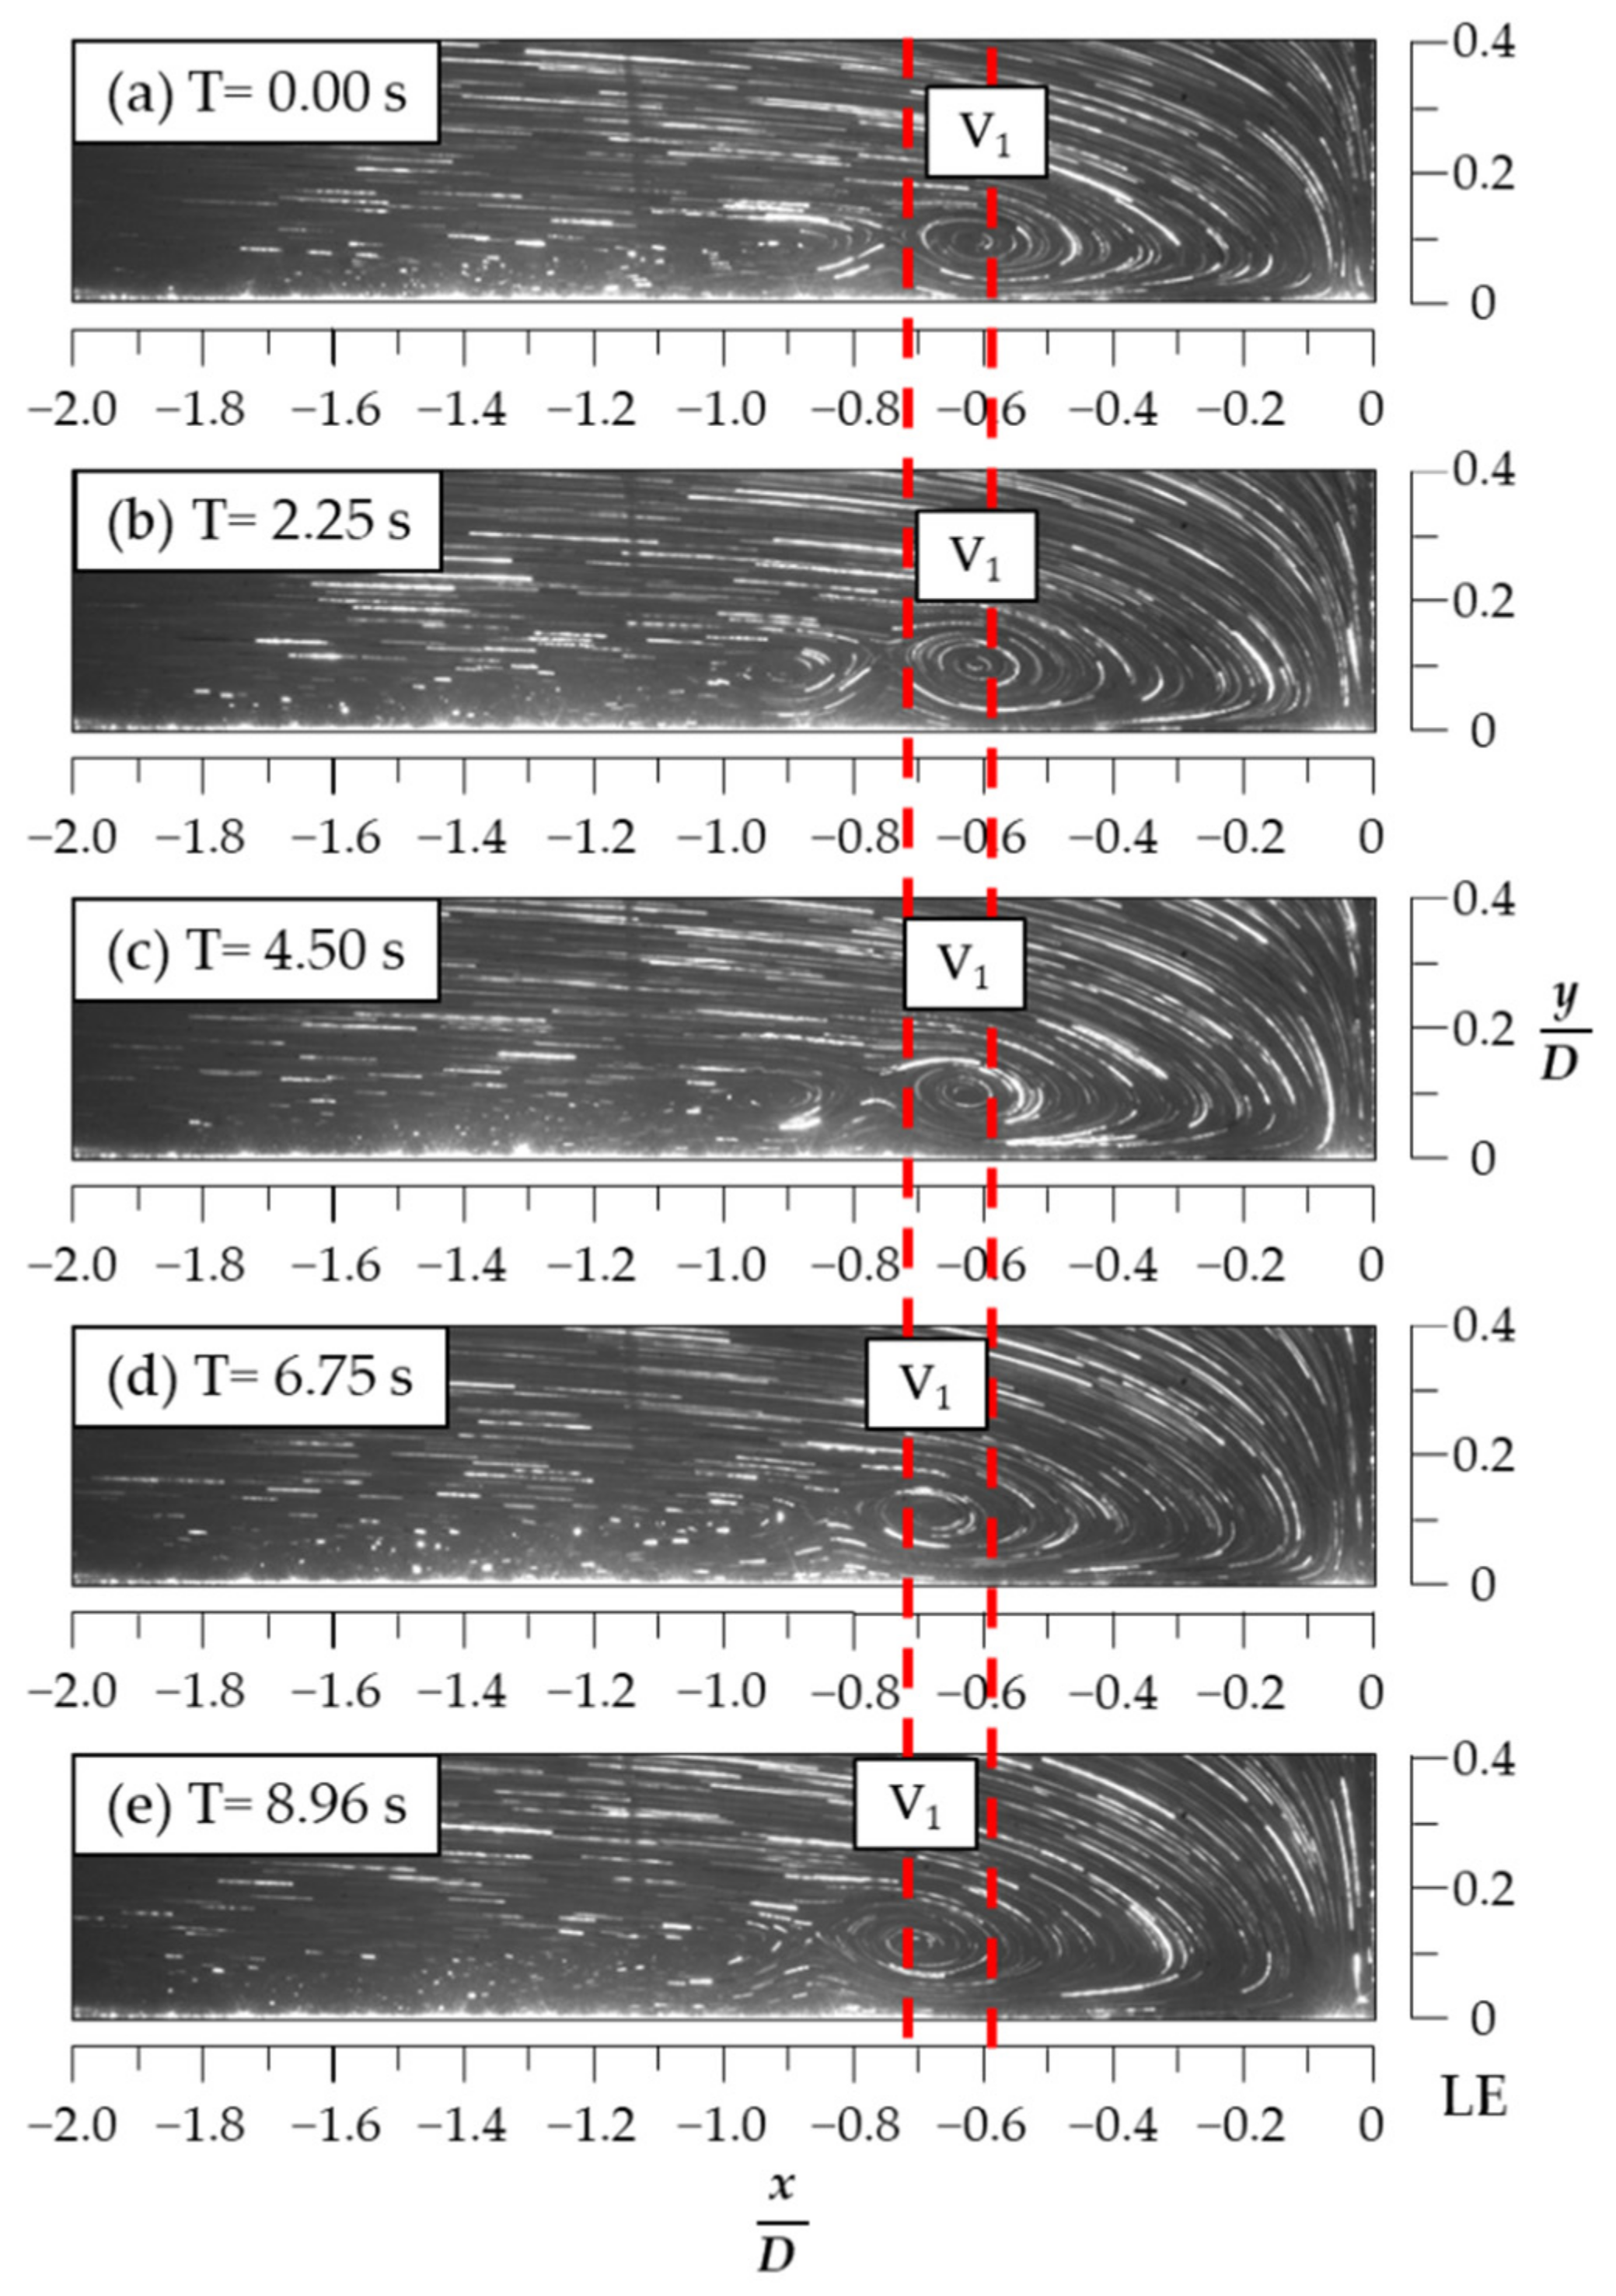
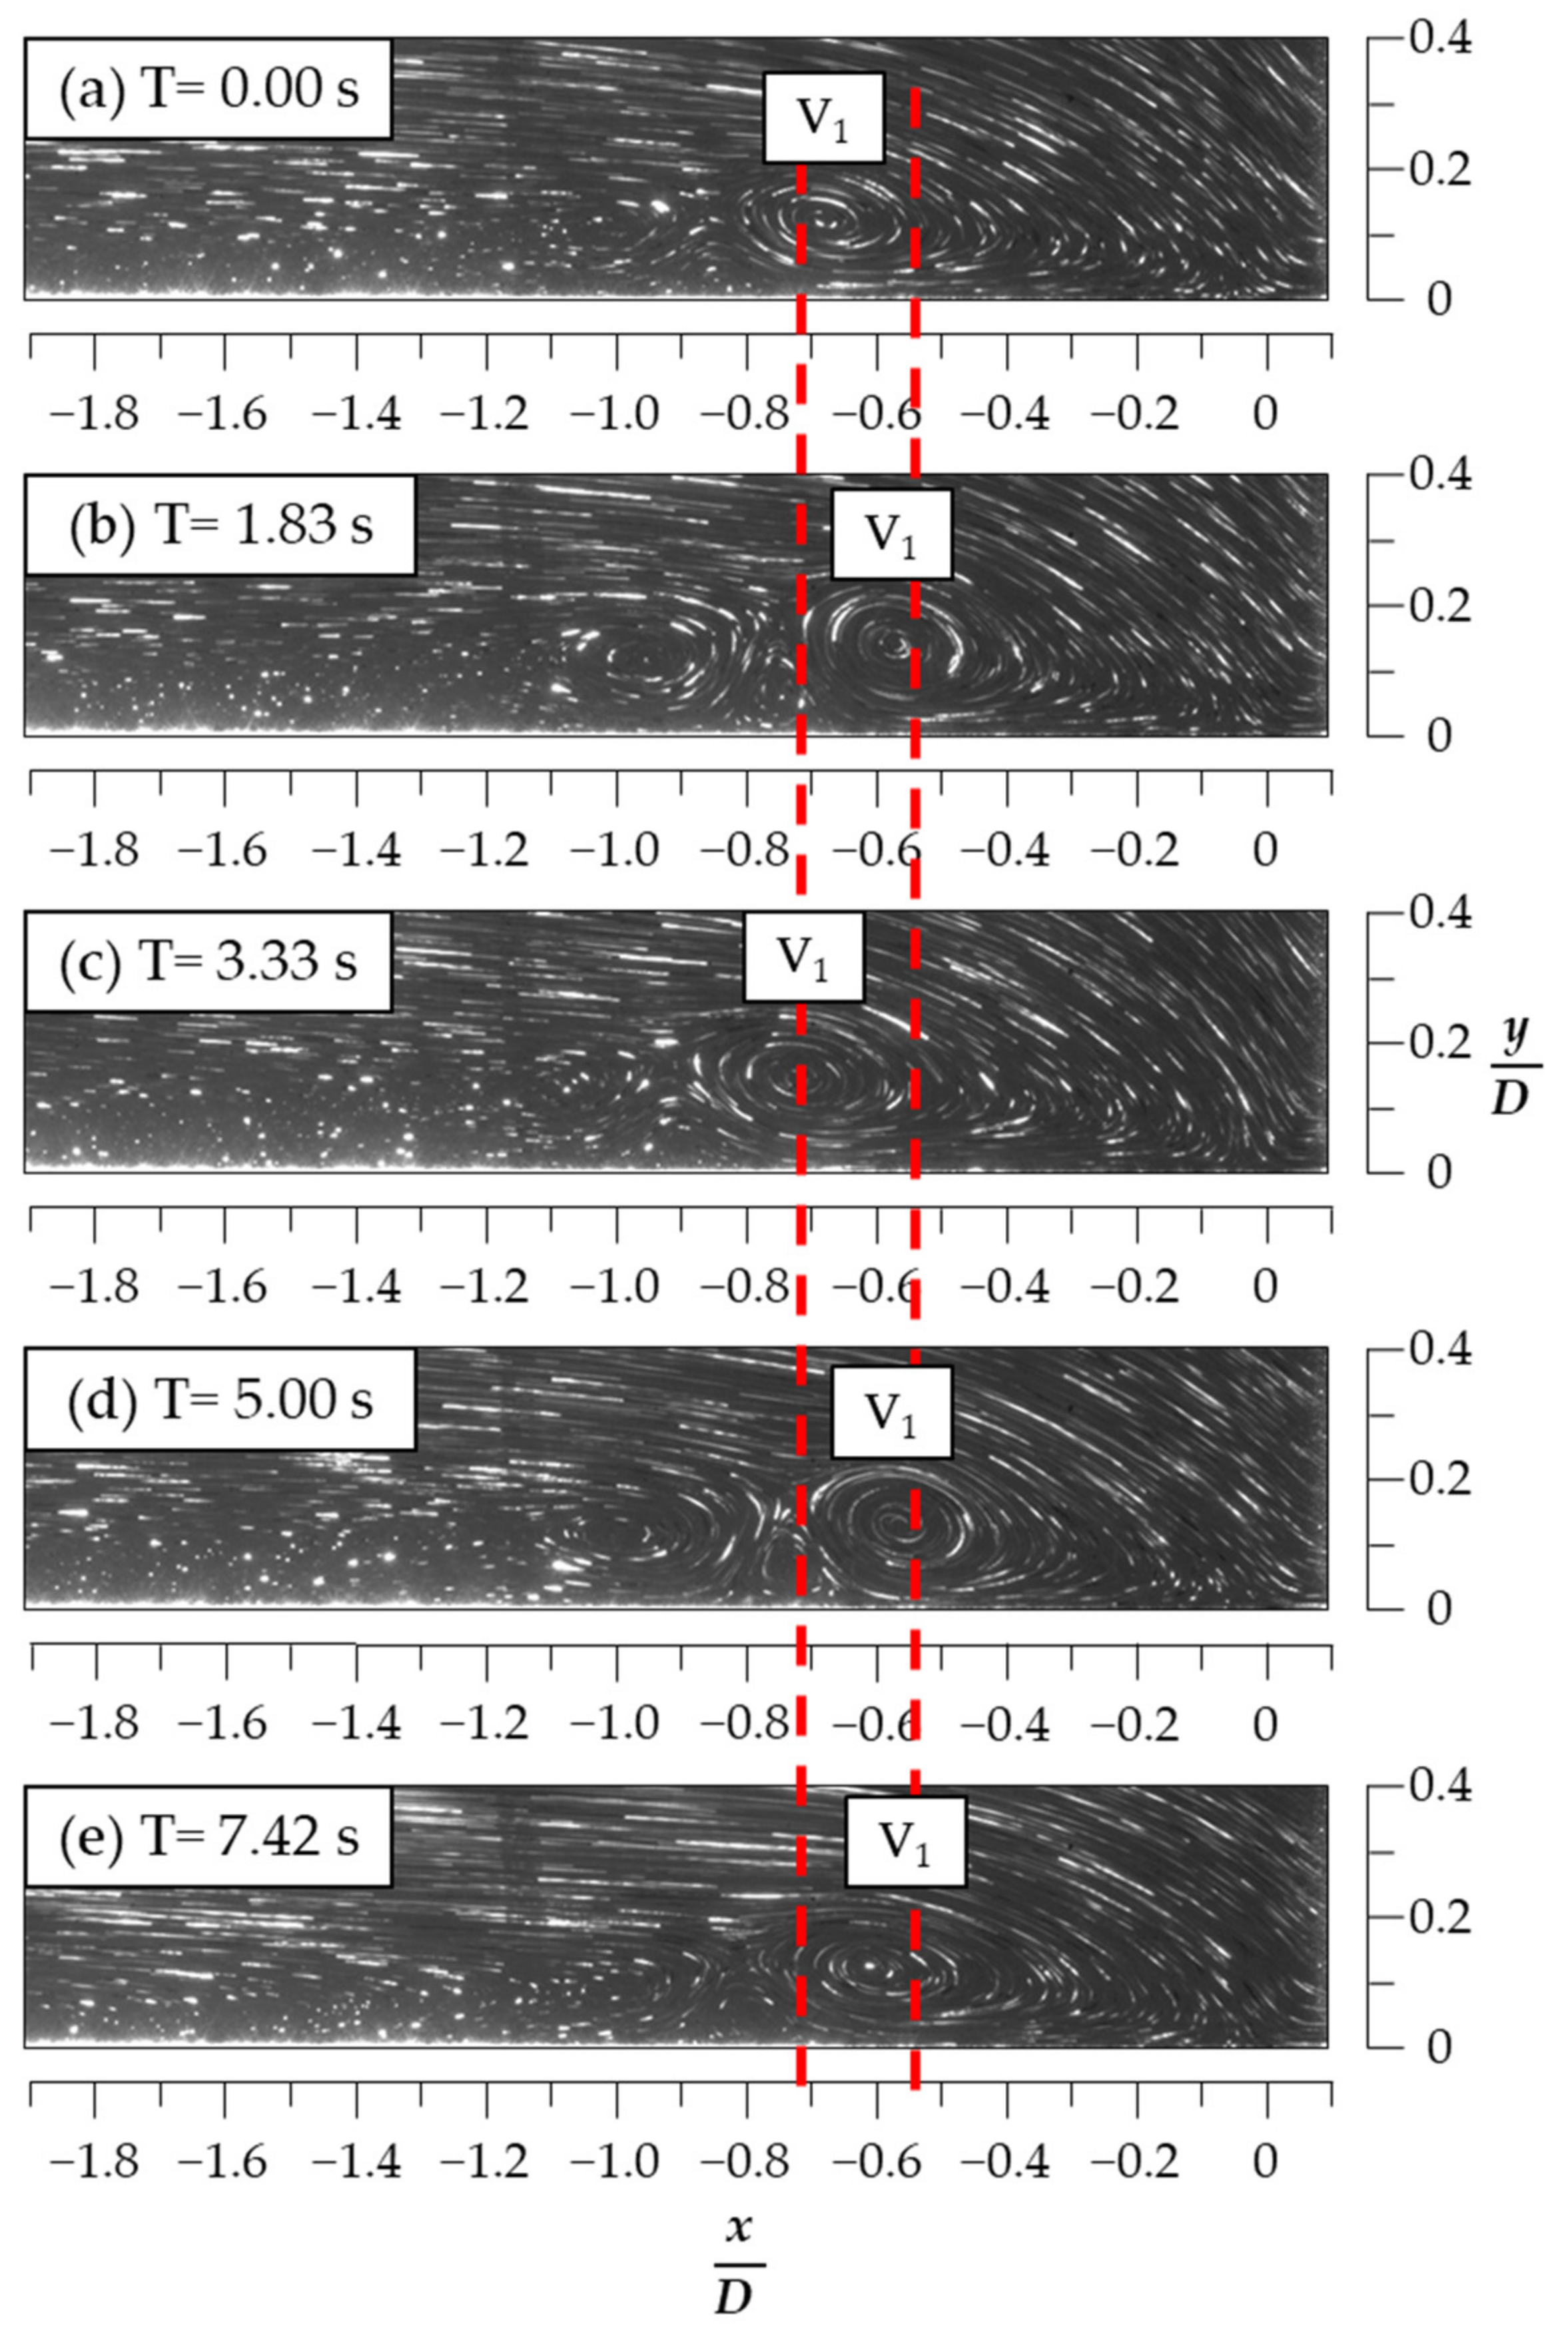
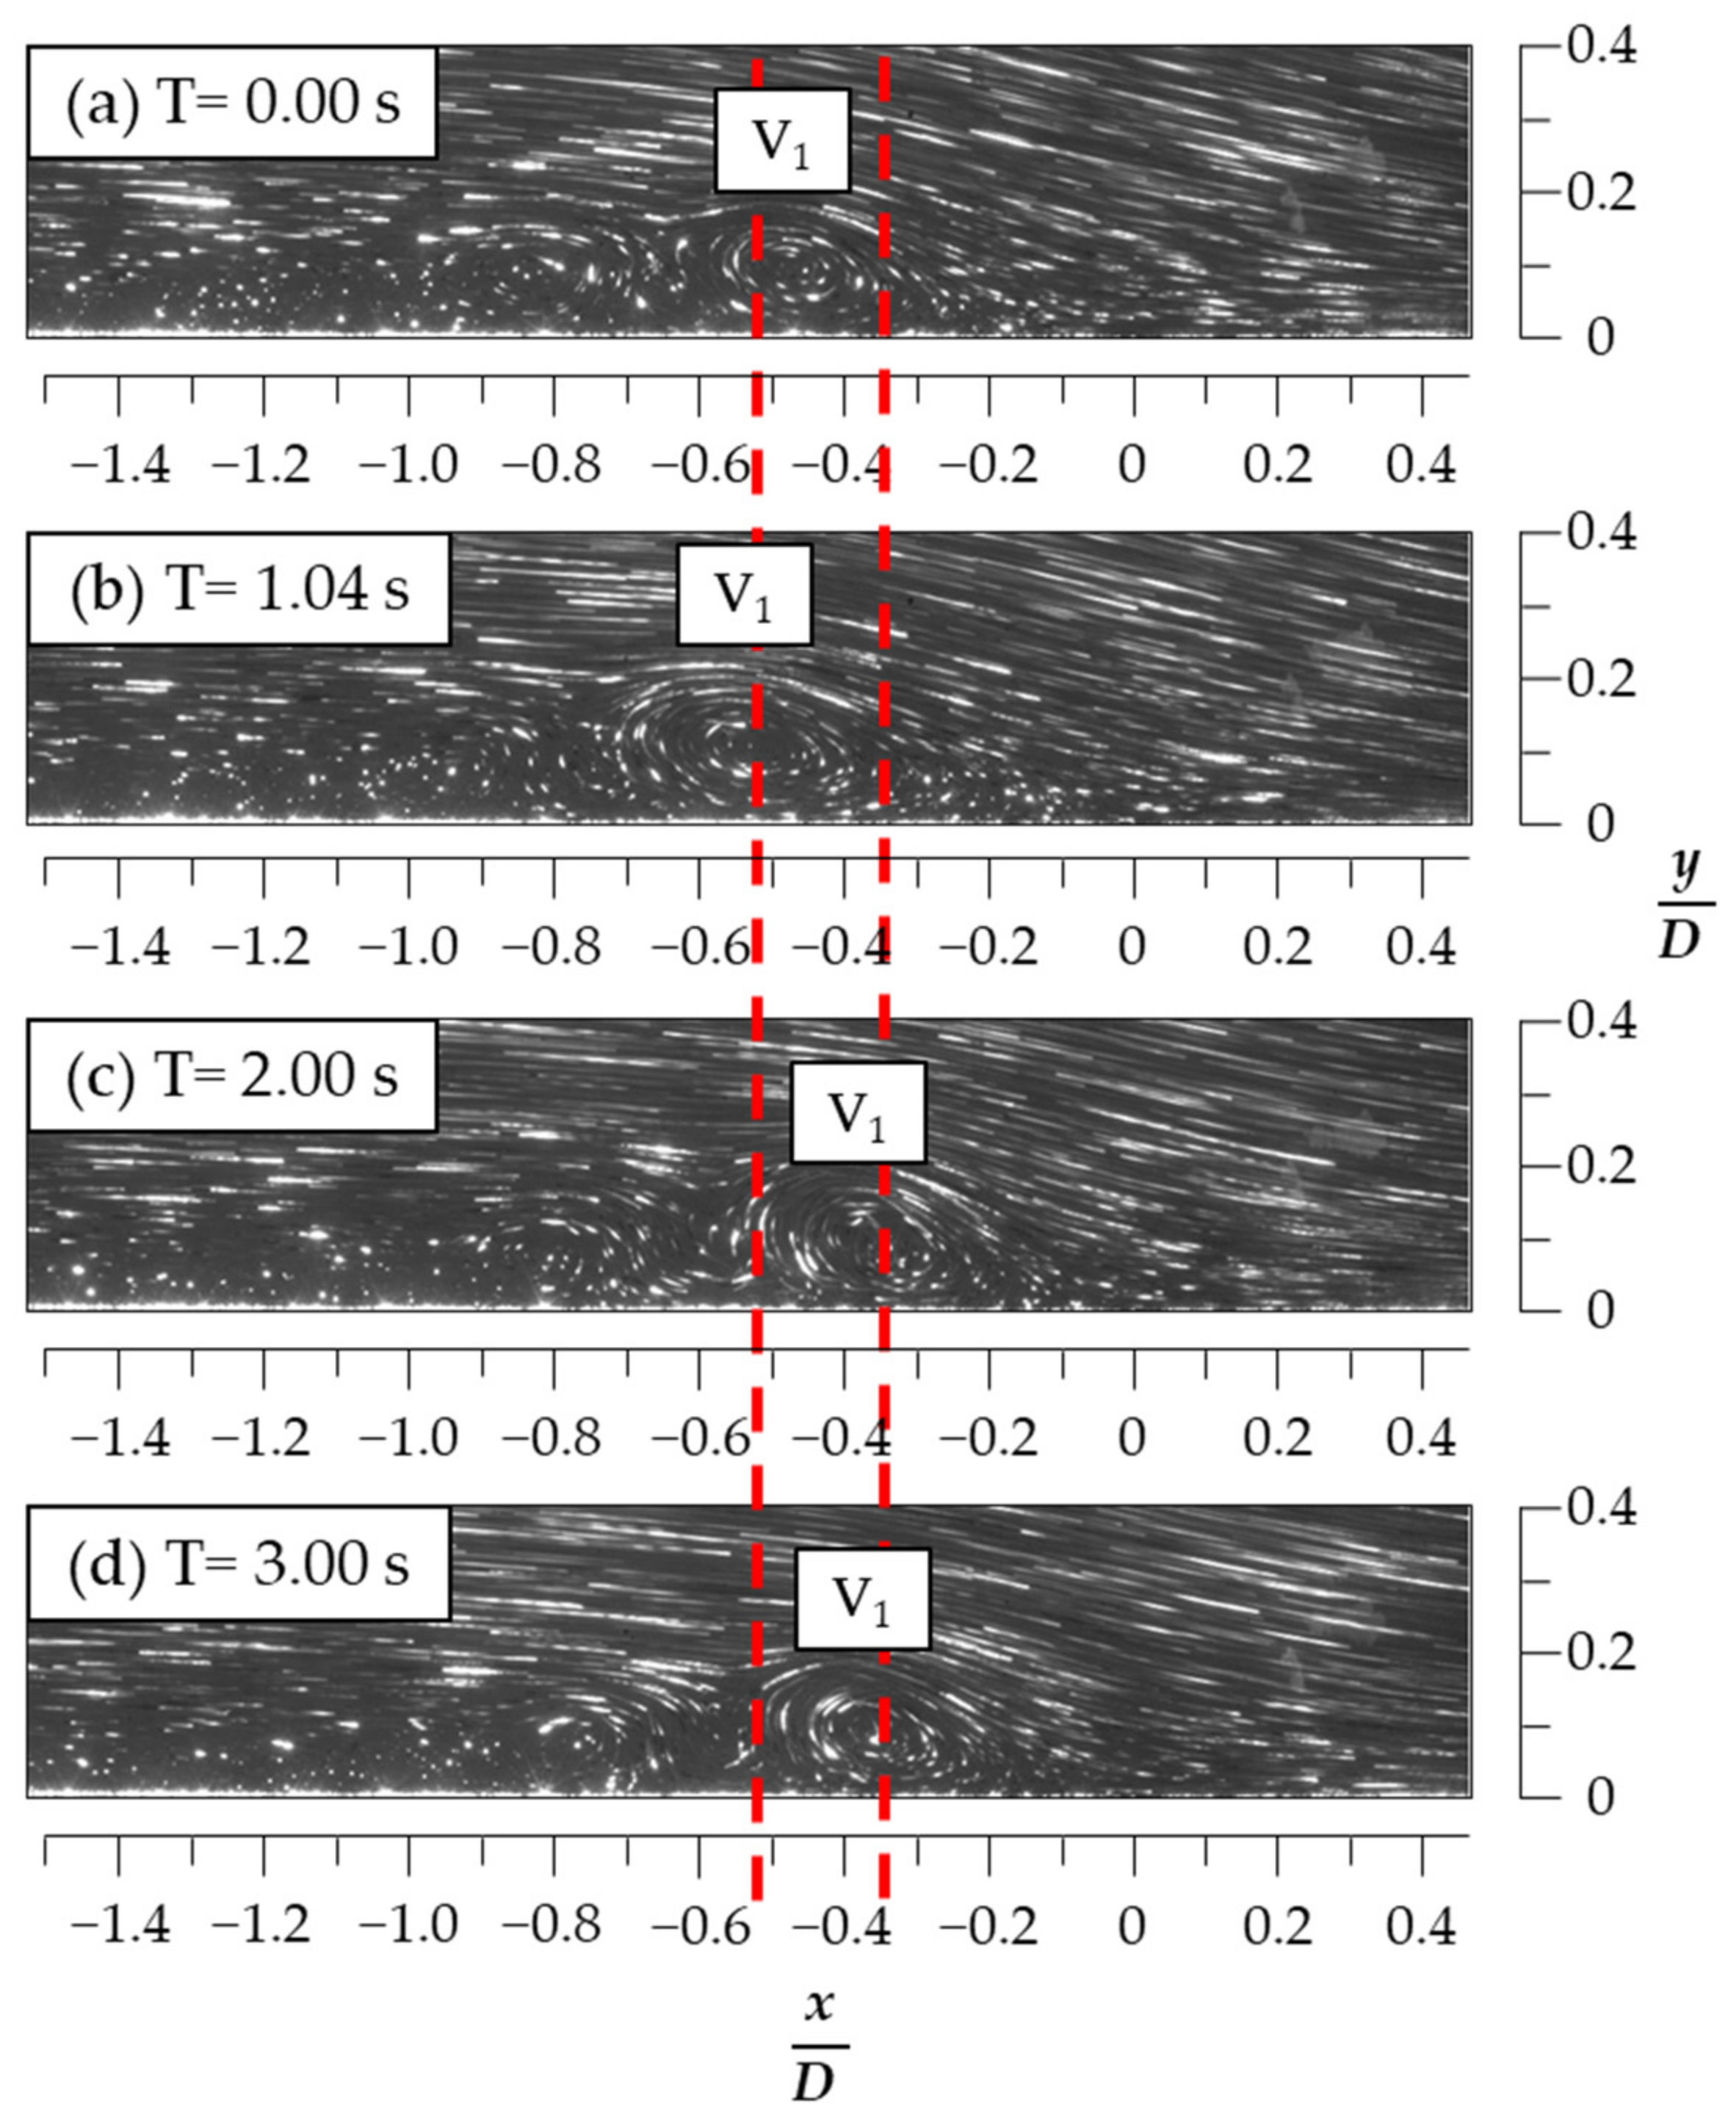
As shown in Figure 8, Figure 9 and Figure 10, with the flow visualizations in the z = 0, 0.4, and 0.8 cm planes, respectively, it was found that the dominant (details follow) kinematic mode of the HSV(s) was the “oscillation with a small displacement” as well as that when H/D = 0. The oscillation range of the core of the HSV closest to the LE (labeled V1) indicated with the two red dashed lines the range length and the mean x-position (xm) of the V1′s core, as shown in Figure 8, Figure 9 and Figure 10, were (x/D = −0.59 to −0.72, 0.13 D, xm/D = −0.66), (x/D = −0.56 to −0.72, 0.16 D, xm/D = −0.62), and (x/D = −0.34 to −0.52, 0.18 D, xm/D = −0.41), respectively. The oscillation range of the HSV in the z = 0.4 cm plane (also in the z = 0.8 cm plane) was slightly larger than that in the z = 0 cm plane, implying that the top-viewed U-shape of the HSV was basically translating from time to time with a much smaller stretch or shrink than that when H/D = 0. It is also evident that the HSV structure that formed when H/D = 1.5 in the z = 0.8 cm plane (Figure 10) was more recognizable than that formed when H/D = 0 in the z = 0.8 cm plane (Figure 7), indicating that the imaging field of view in the z = 0.8 cm plane when H/D = 1.5 did not cut at the leg portion of the HSV.
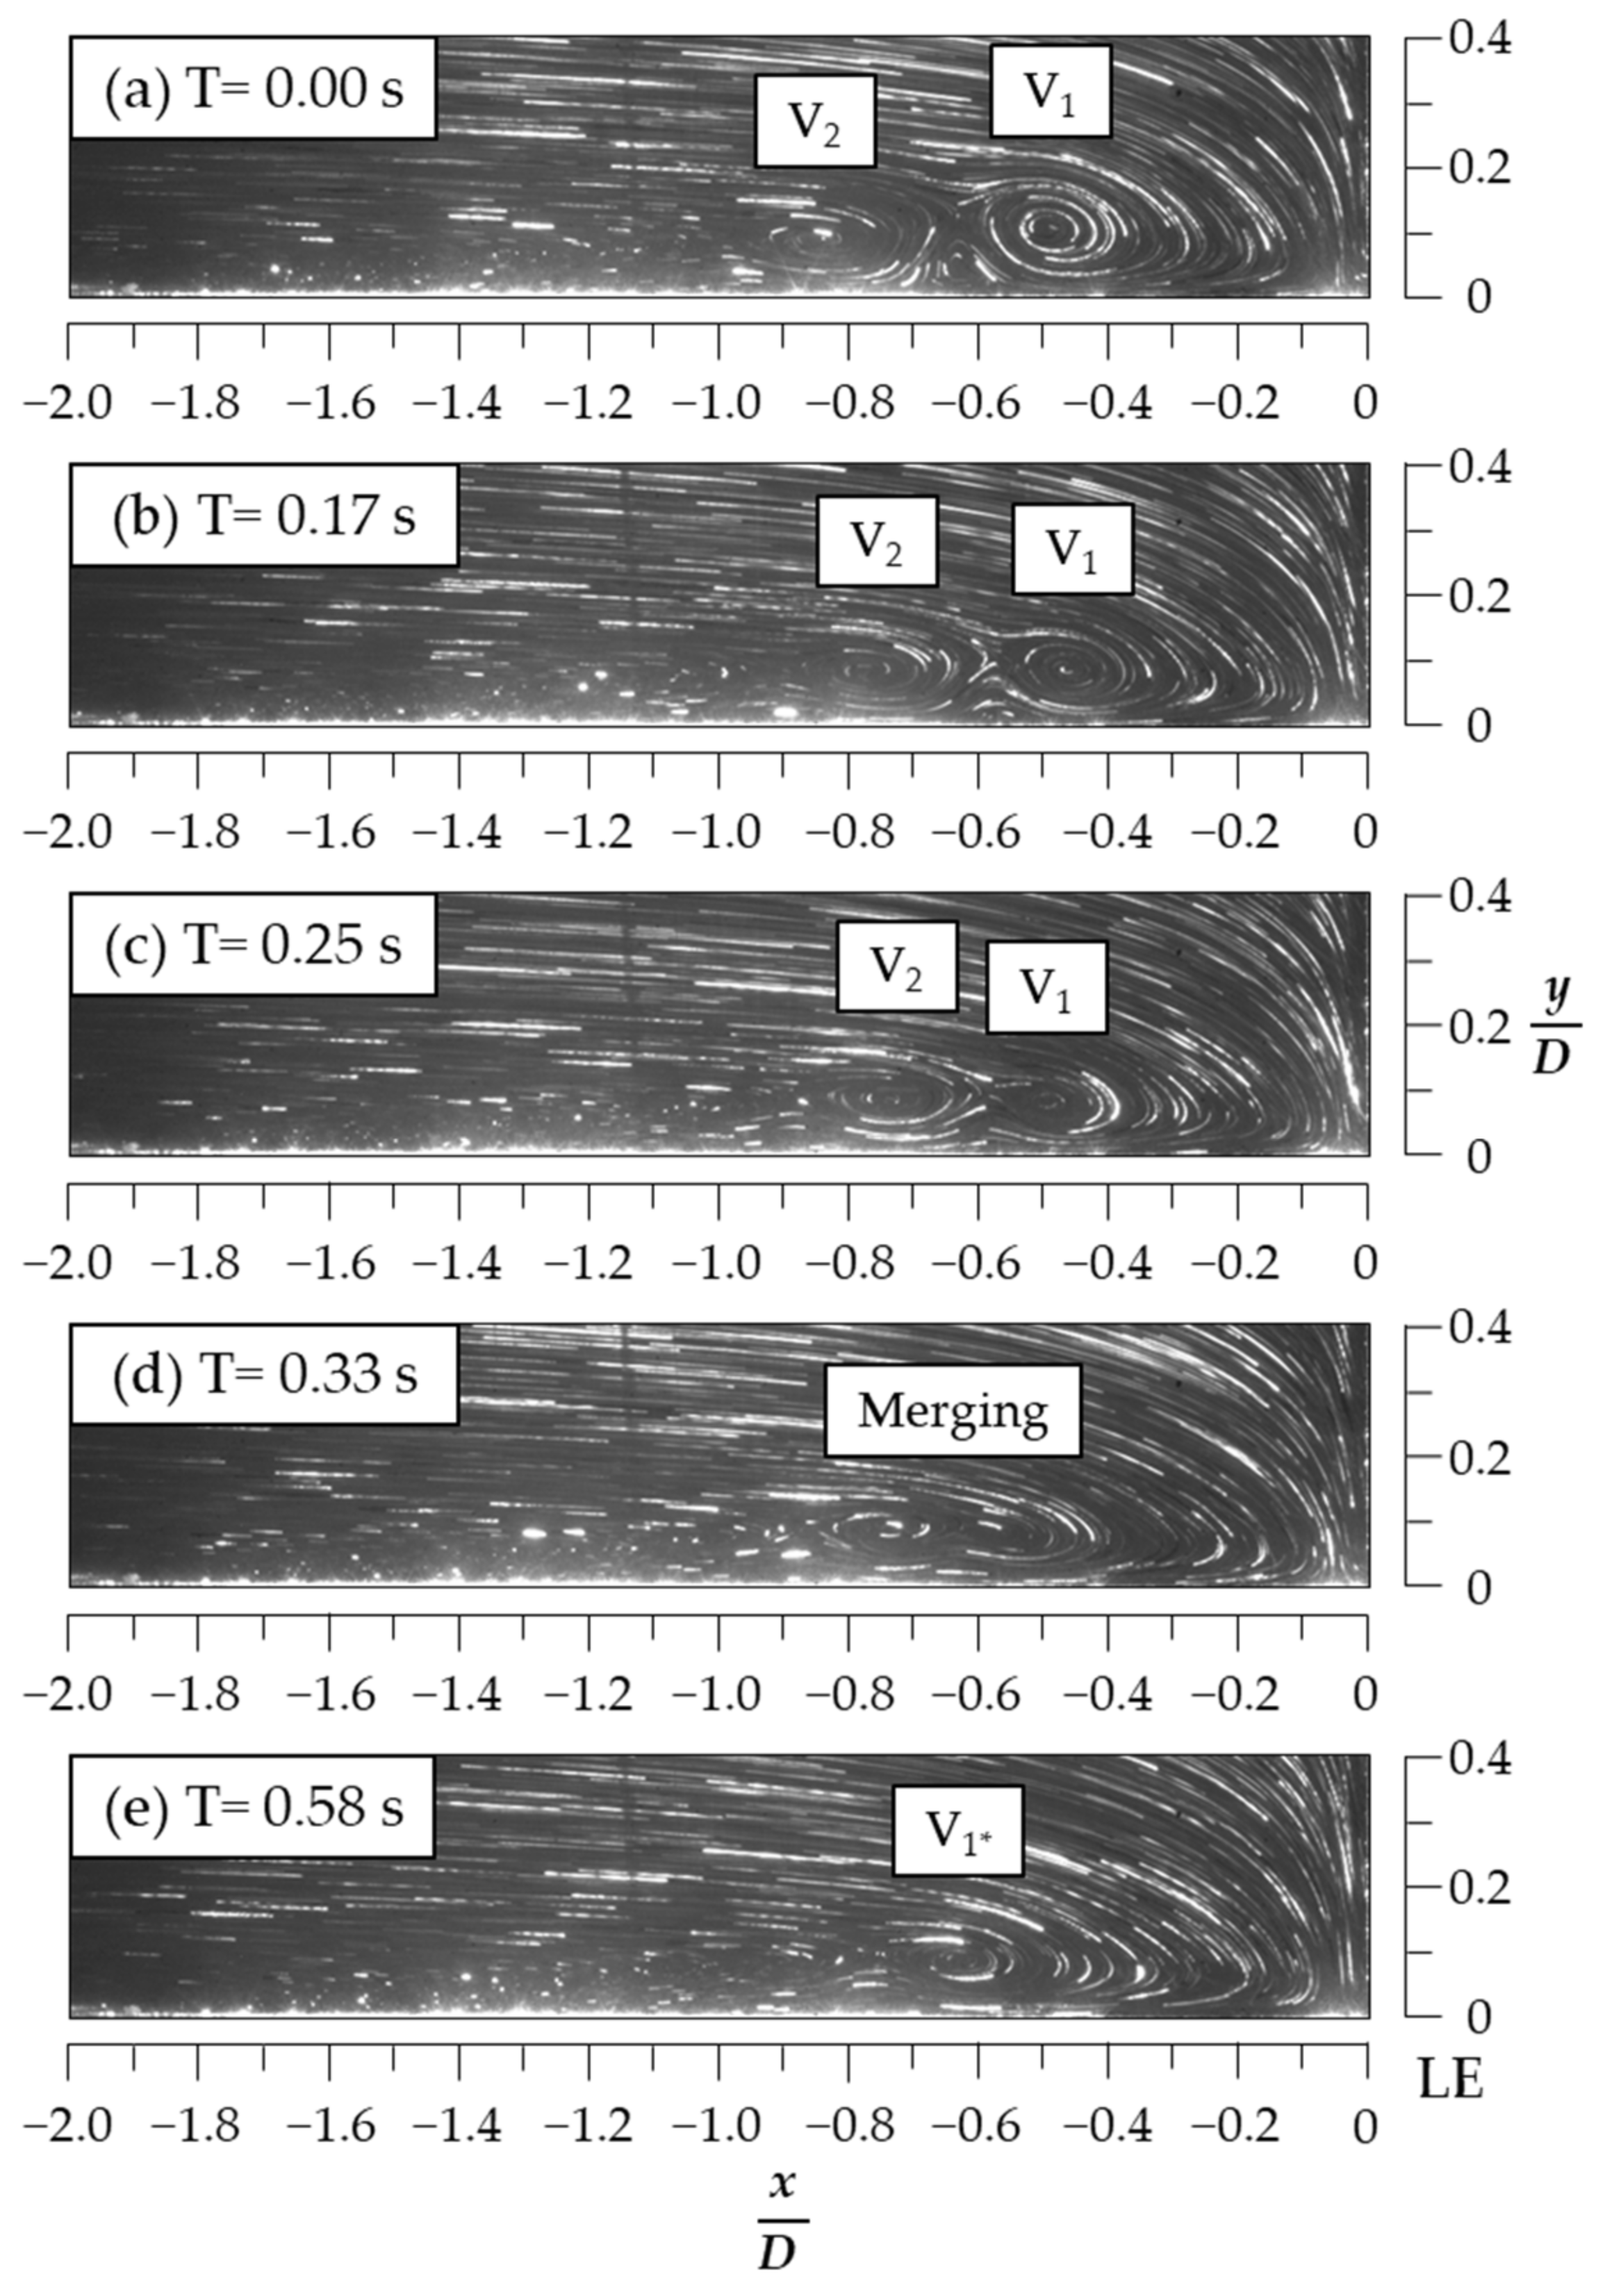
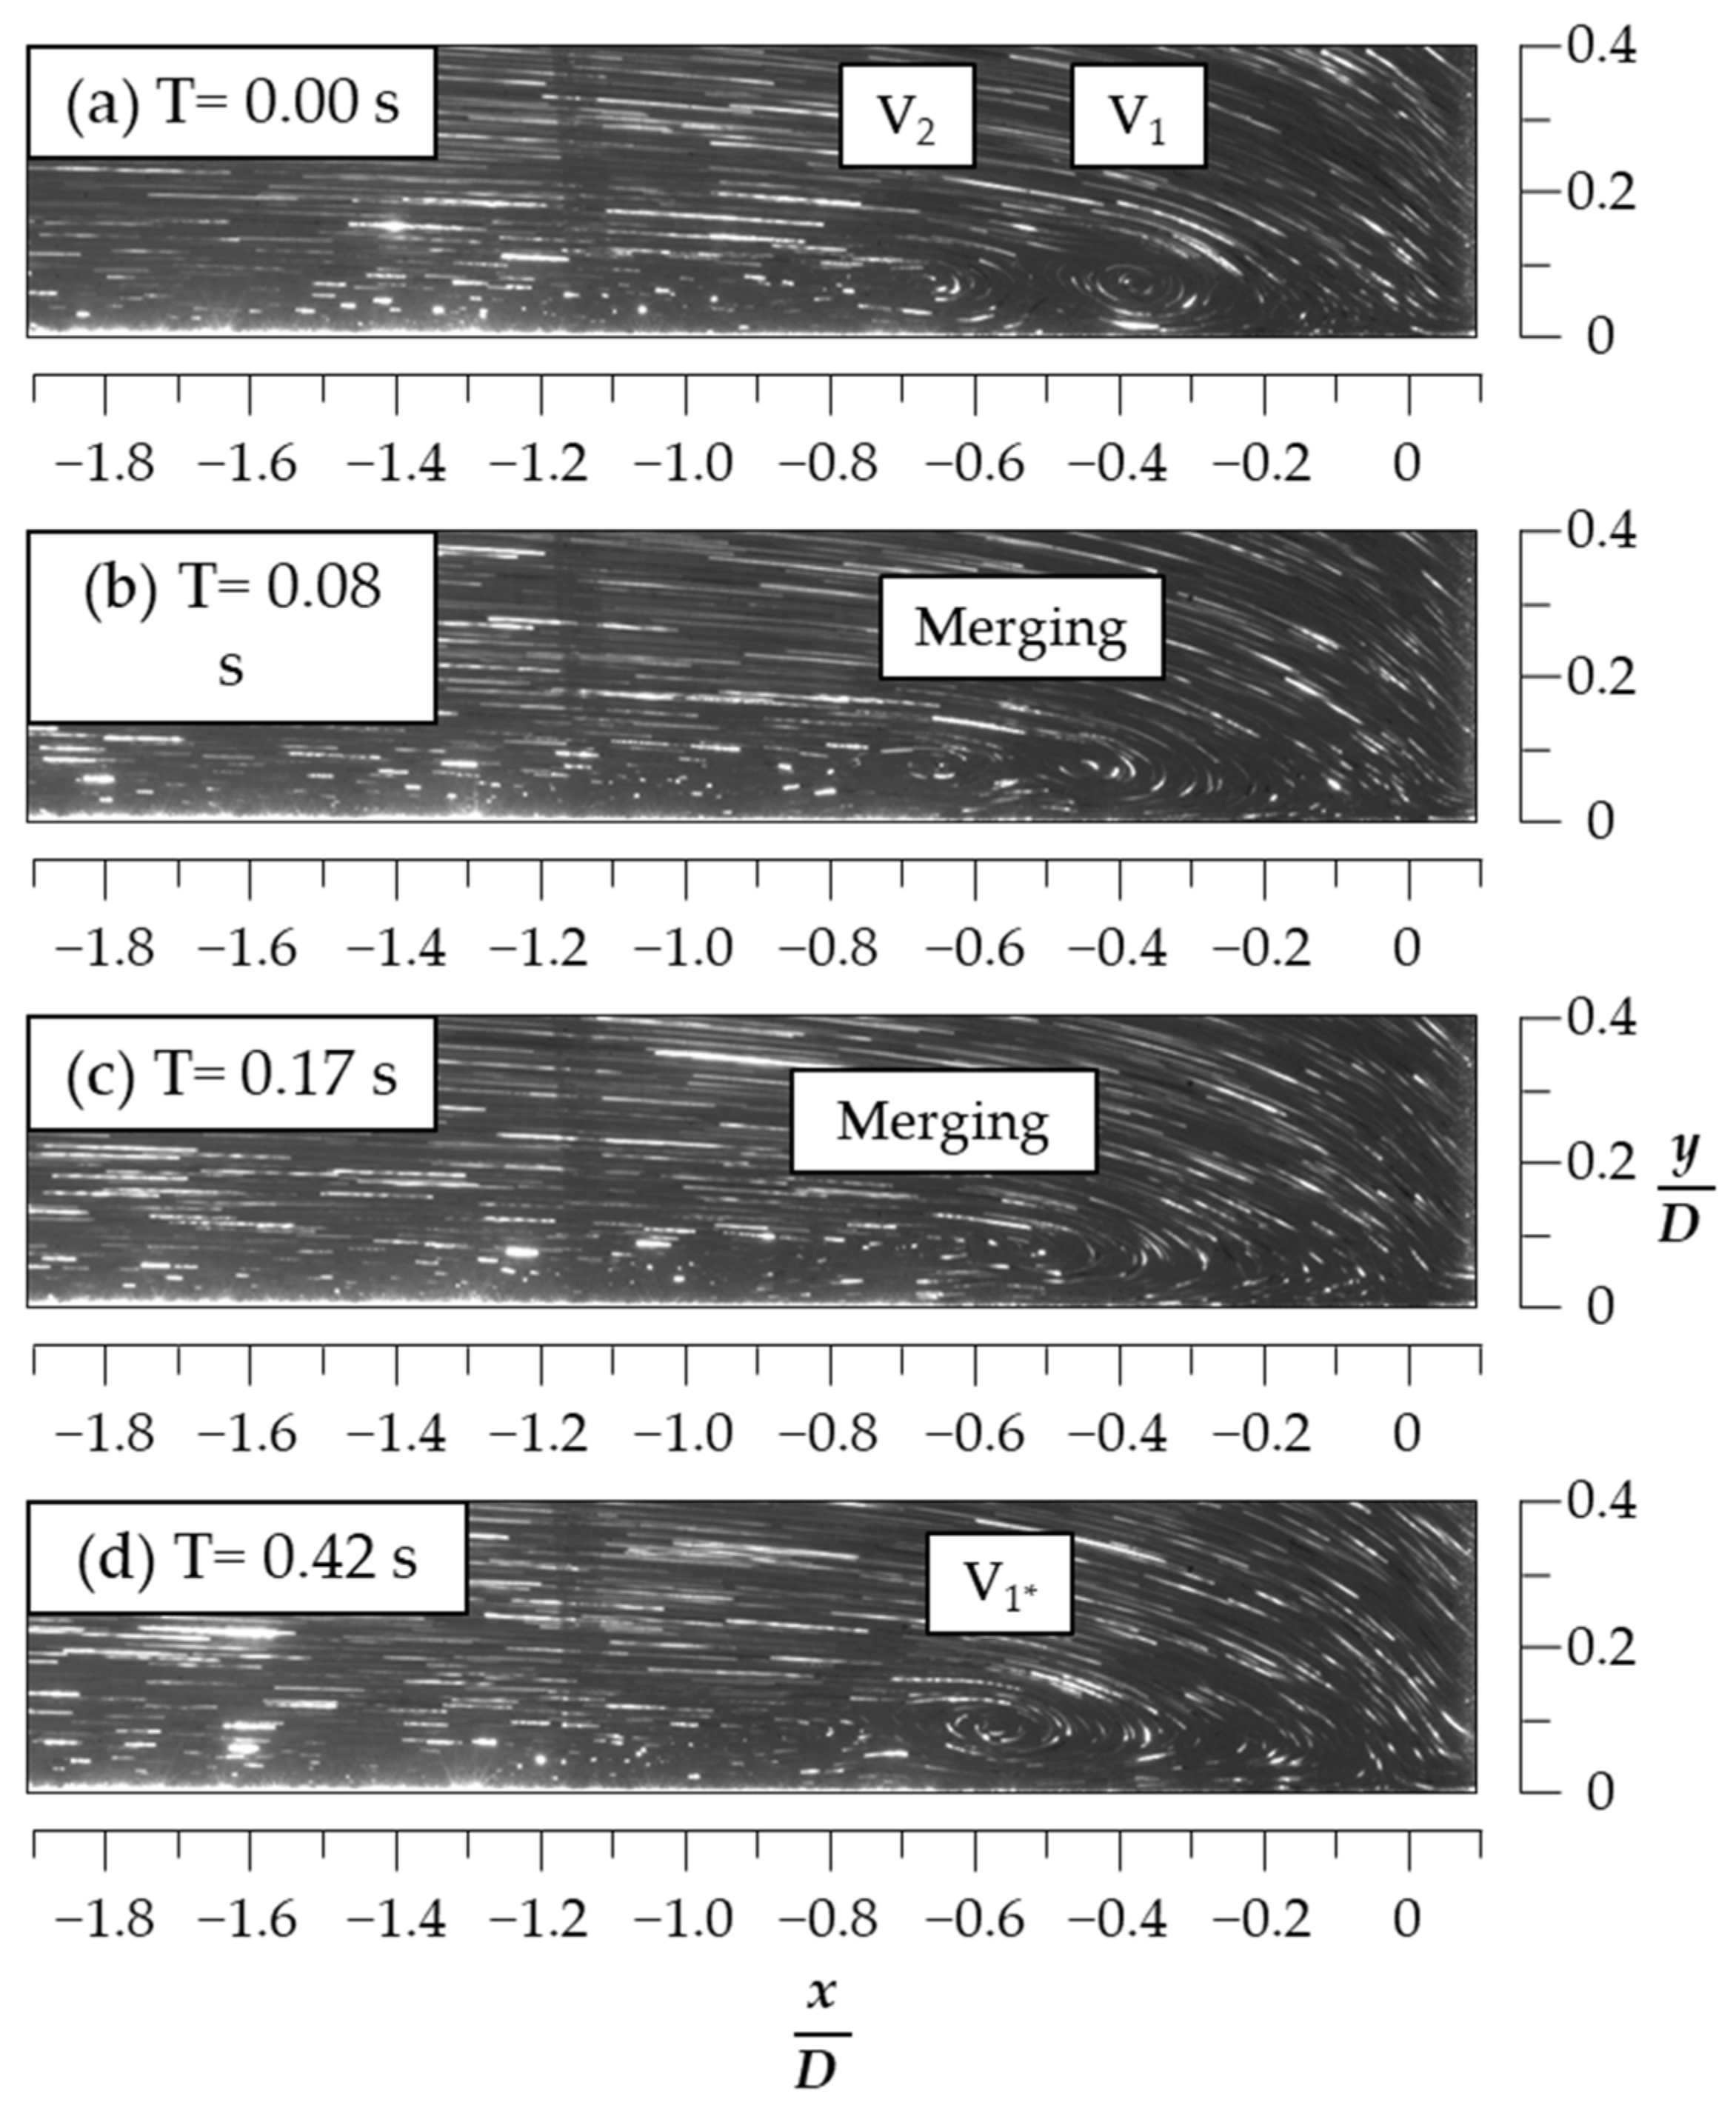
As shown in Figure 11, Figure 12 and Figure 13, the rarest (details follow) but striking kinematic mode, the “merging”, was captured in the flow visualizations in all three z-planes. Figure 11 (z = 0 cm plane) as an example is used to describe the “merging” process (mode) as follows. Figure 11a reveals that a pair of two primary HSVs (labeled V1 and V2) existed in front of the LE of the circular cylinder. The cores of V1 and V2 were located at (x/D, y/D) = (−0.49, 0.11) and (−0.85, 0.09), respectively. As shown from Figure 11a–d, the upstream vortex V2 and downstream vortex V1 were approaching each other, and some particle pathlines depicting one vortex of the pair were beginning to connect with that depicting the other as the two vortices were “merging” with each other. Finally, as illustrated in Figure 11e, a new primary vortex V1* formed, with its core located at (x/D, y/D) = (−0.63, 0.09).
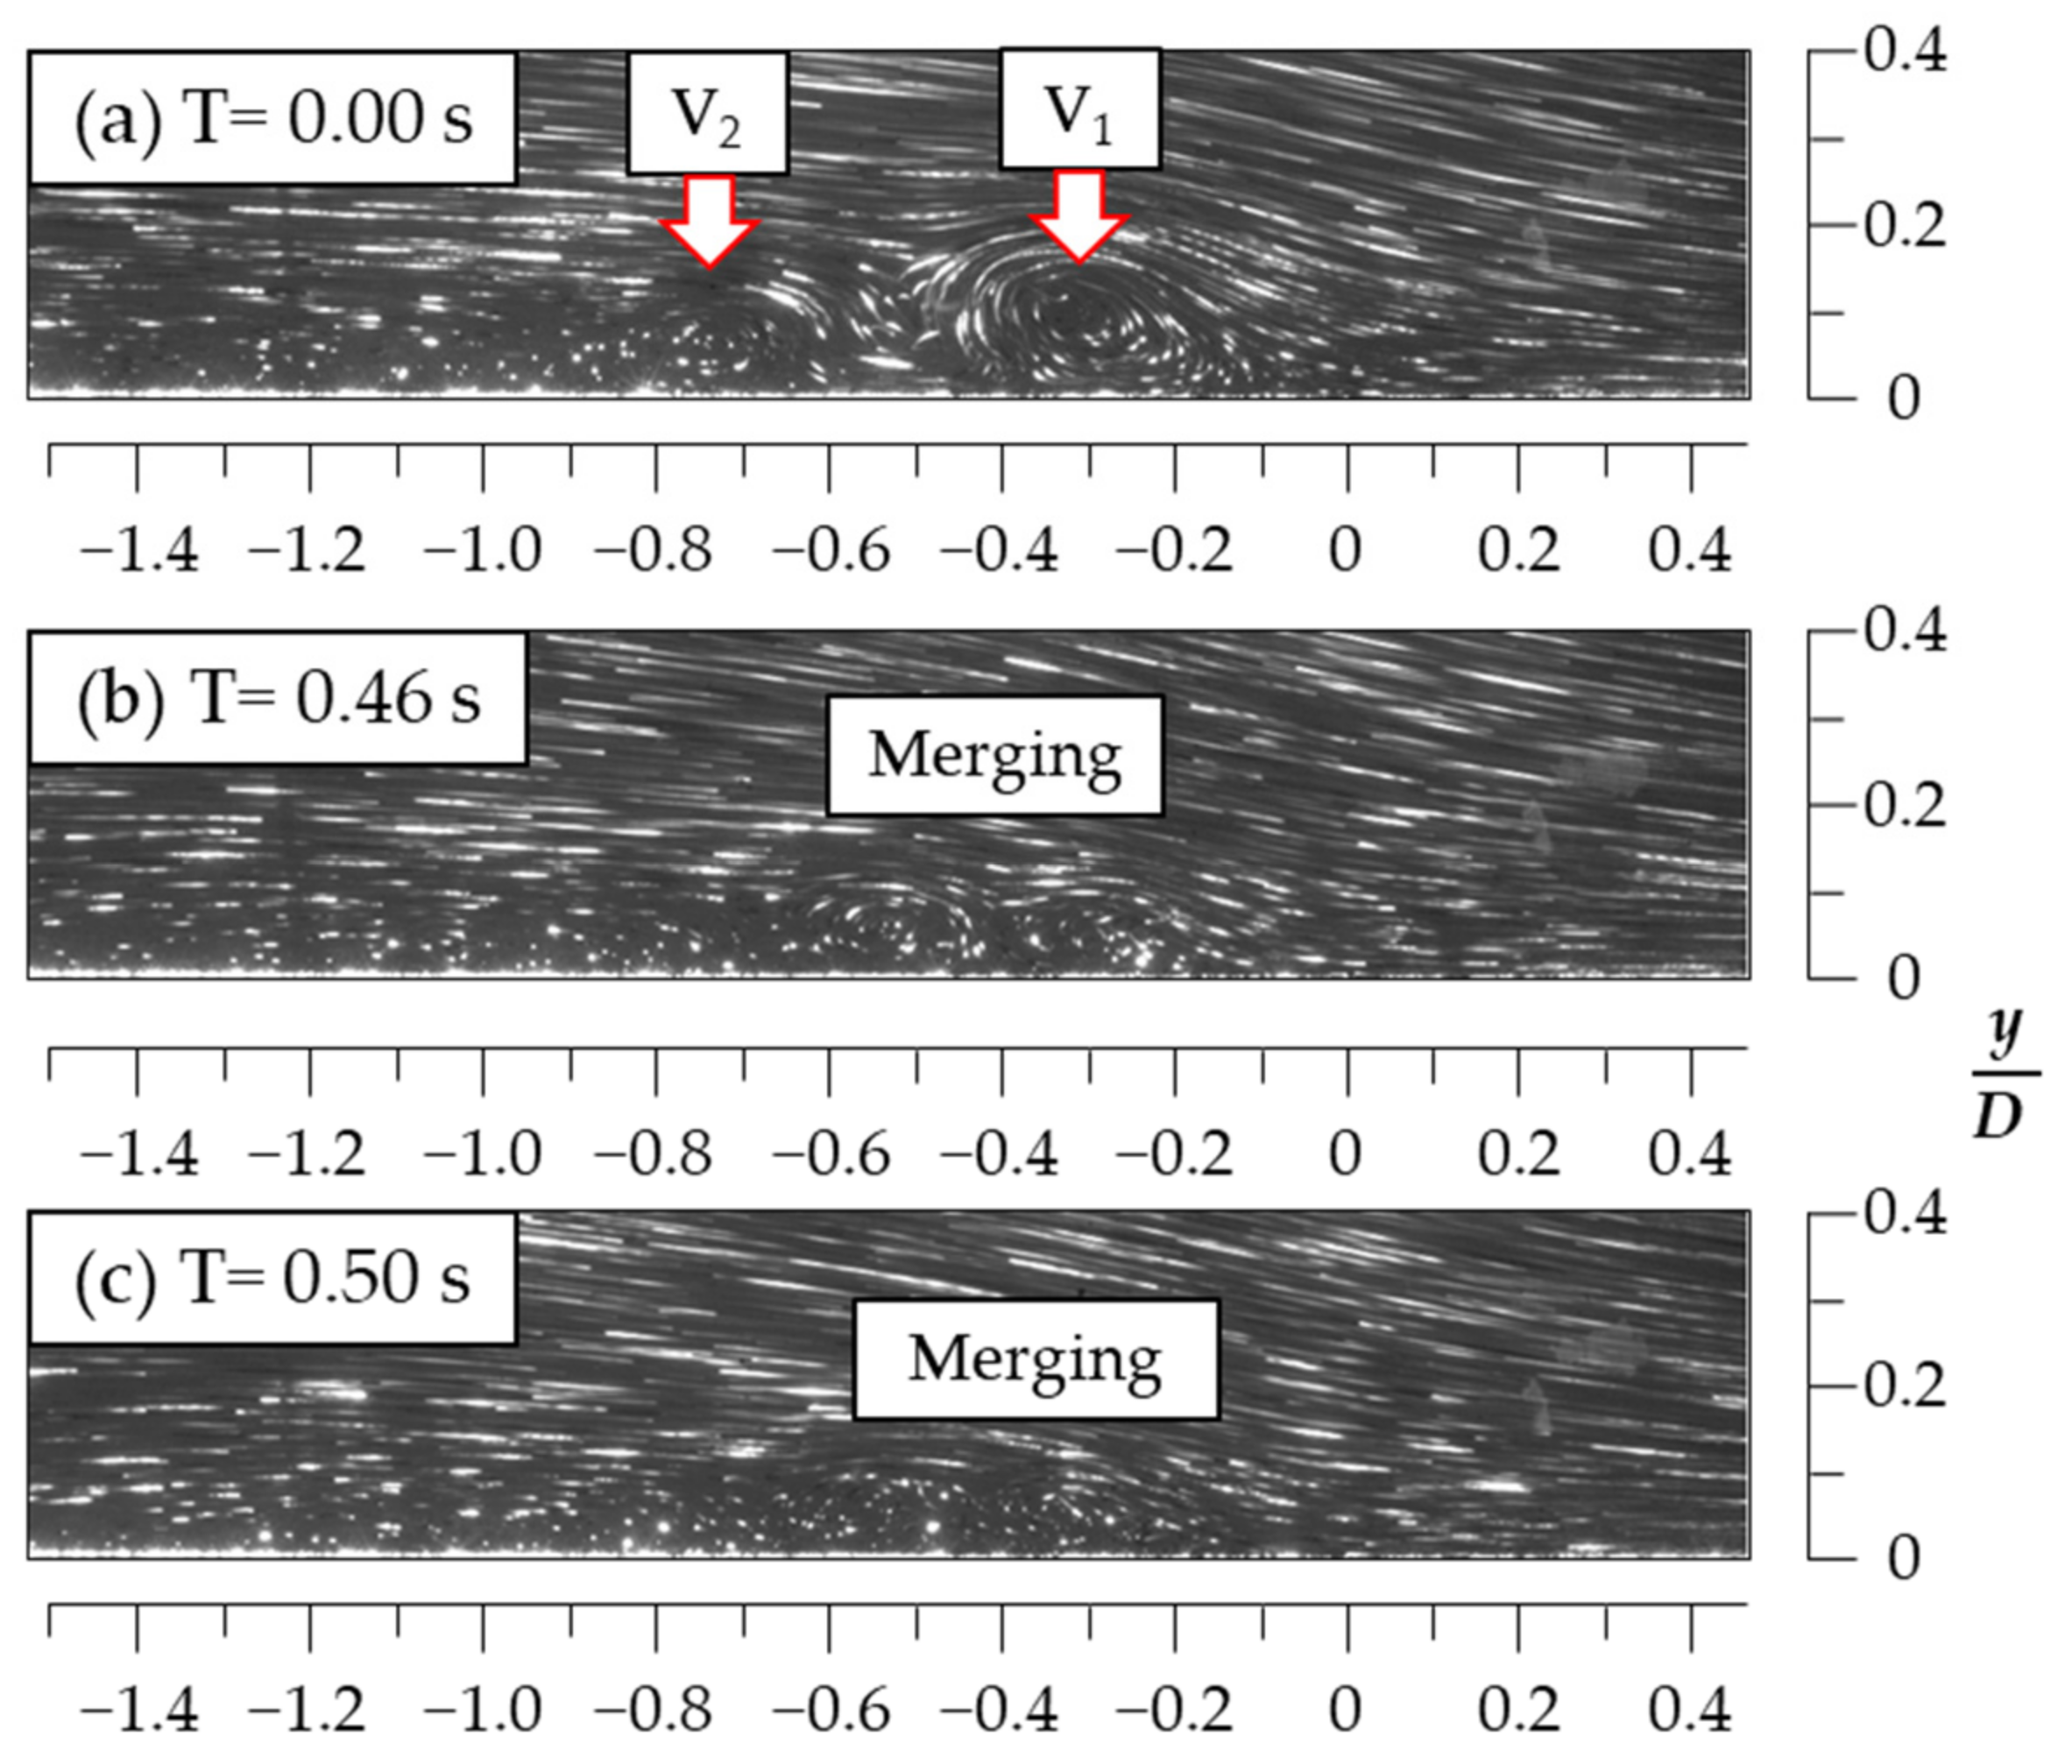
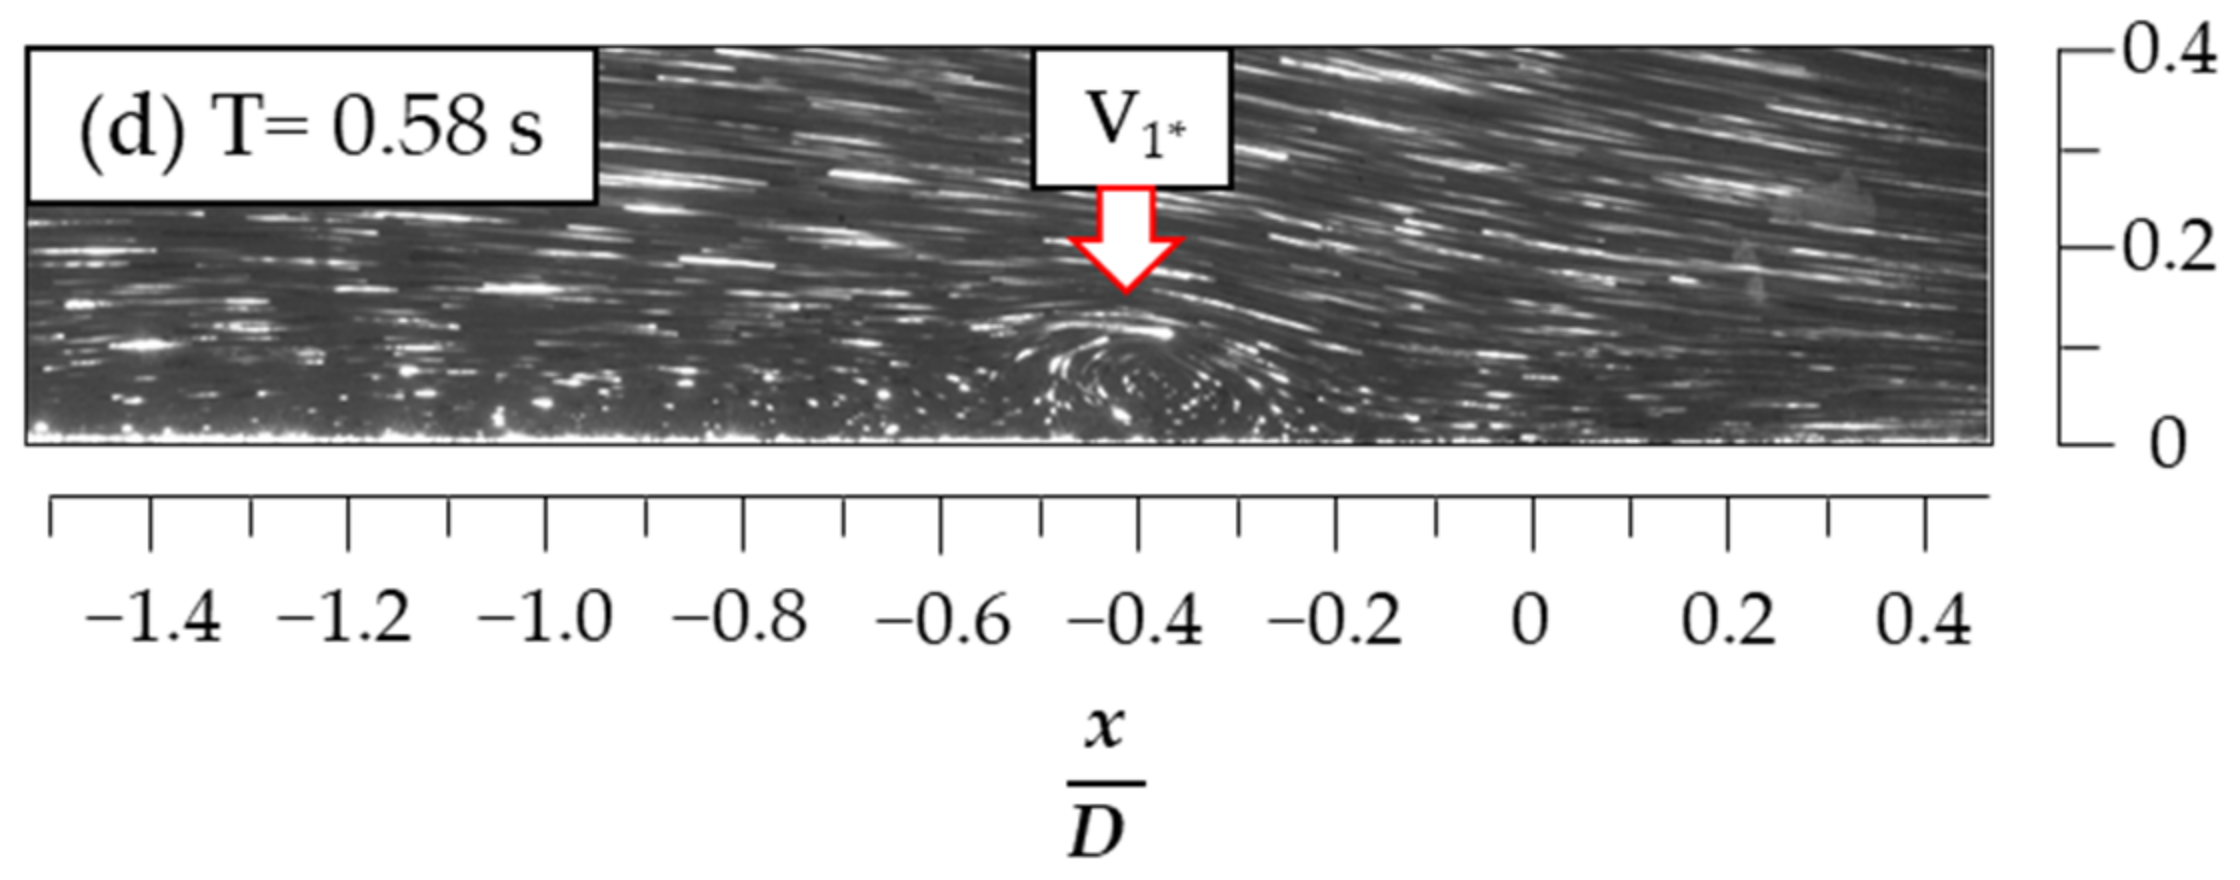
Similar data sets describing the “merging” process (mode), as observed in Figure 12 (z = 0.4 cm plane) and Figure 13 (z = 0.8 cm plane), are listed, respectively, as follows: the cores of V1 were initially located at (x/D, y/D) = (−0.37, 0.07) and (−0.31, 0.10); the cores of V2 were initially located at (x/D, y/D) = (−0.66, 0.08) and (−0.73, 0.06); the cores of the new primary vortex V1* forming after the “merging” process were located at (x/D, y/D) = (−0.57, 0.09) and (−0.38, 0.06).
As shown in Figure 14, Figure 15 and Figure 16, the second rarest (details follow) kinematic mode(s), the “mixed”, was captured in the flow visualizations in all three z-planes. The process of the mixed mode involves three steps: “HSV disturbed”, “roll-up”, and “multiple-vortices merging”, respectively. The second and third steps occur repeatedly during the process of the mixed mode.
Figure 14 (z = 0 cm plane) as an example is used to describe this most complicated process (mode) ever observed in the present study as follows. Initially, as shown in Figure 14a, the primary HSV (V1) was in the “oscillation with a small displacement” mode, and its core was at (x/D, y/D) = (−0.65, 0.10). At a later time, as shown in Figure 14b, an unexpected bulk of “flow disturbances” suddenly appeared (red dotted box). As shown from Figure 14b–e for the “HSV disturbed” step, this bulk of flow disturbances was moving with the flow into the HSV region and thereby distorting the flow structure near the vortex V1, leading to rolling up a new vortex V2 (Figure 14f). Next, between V1 and the cylinder’s leading edge, a newly roll-up vortex V3 was formed (Figure 14g). Subsequently, as shown from Figure 14h–j, all of the primary vortices (V1, V2, and V3) were “merging” with one another to finally form a new primary vortex V1*. The core of V1* was at (x/D, y/D) = (−0.62, 0.12), as shown in Figure 14j. To the authors’ best knowledge, this “mixed” mode has also never been reported in the previous literatures.
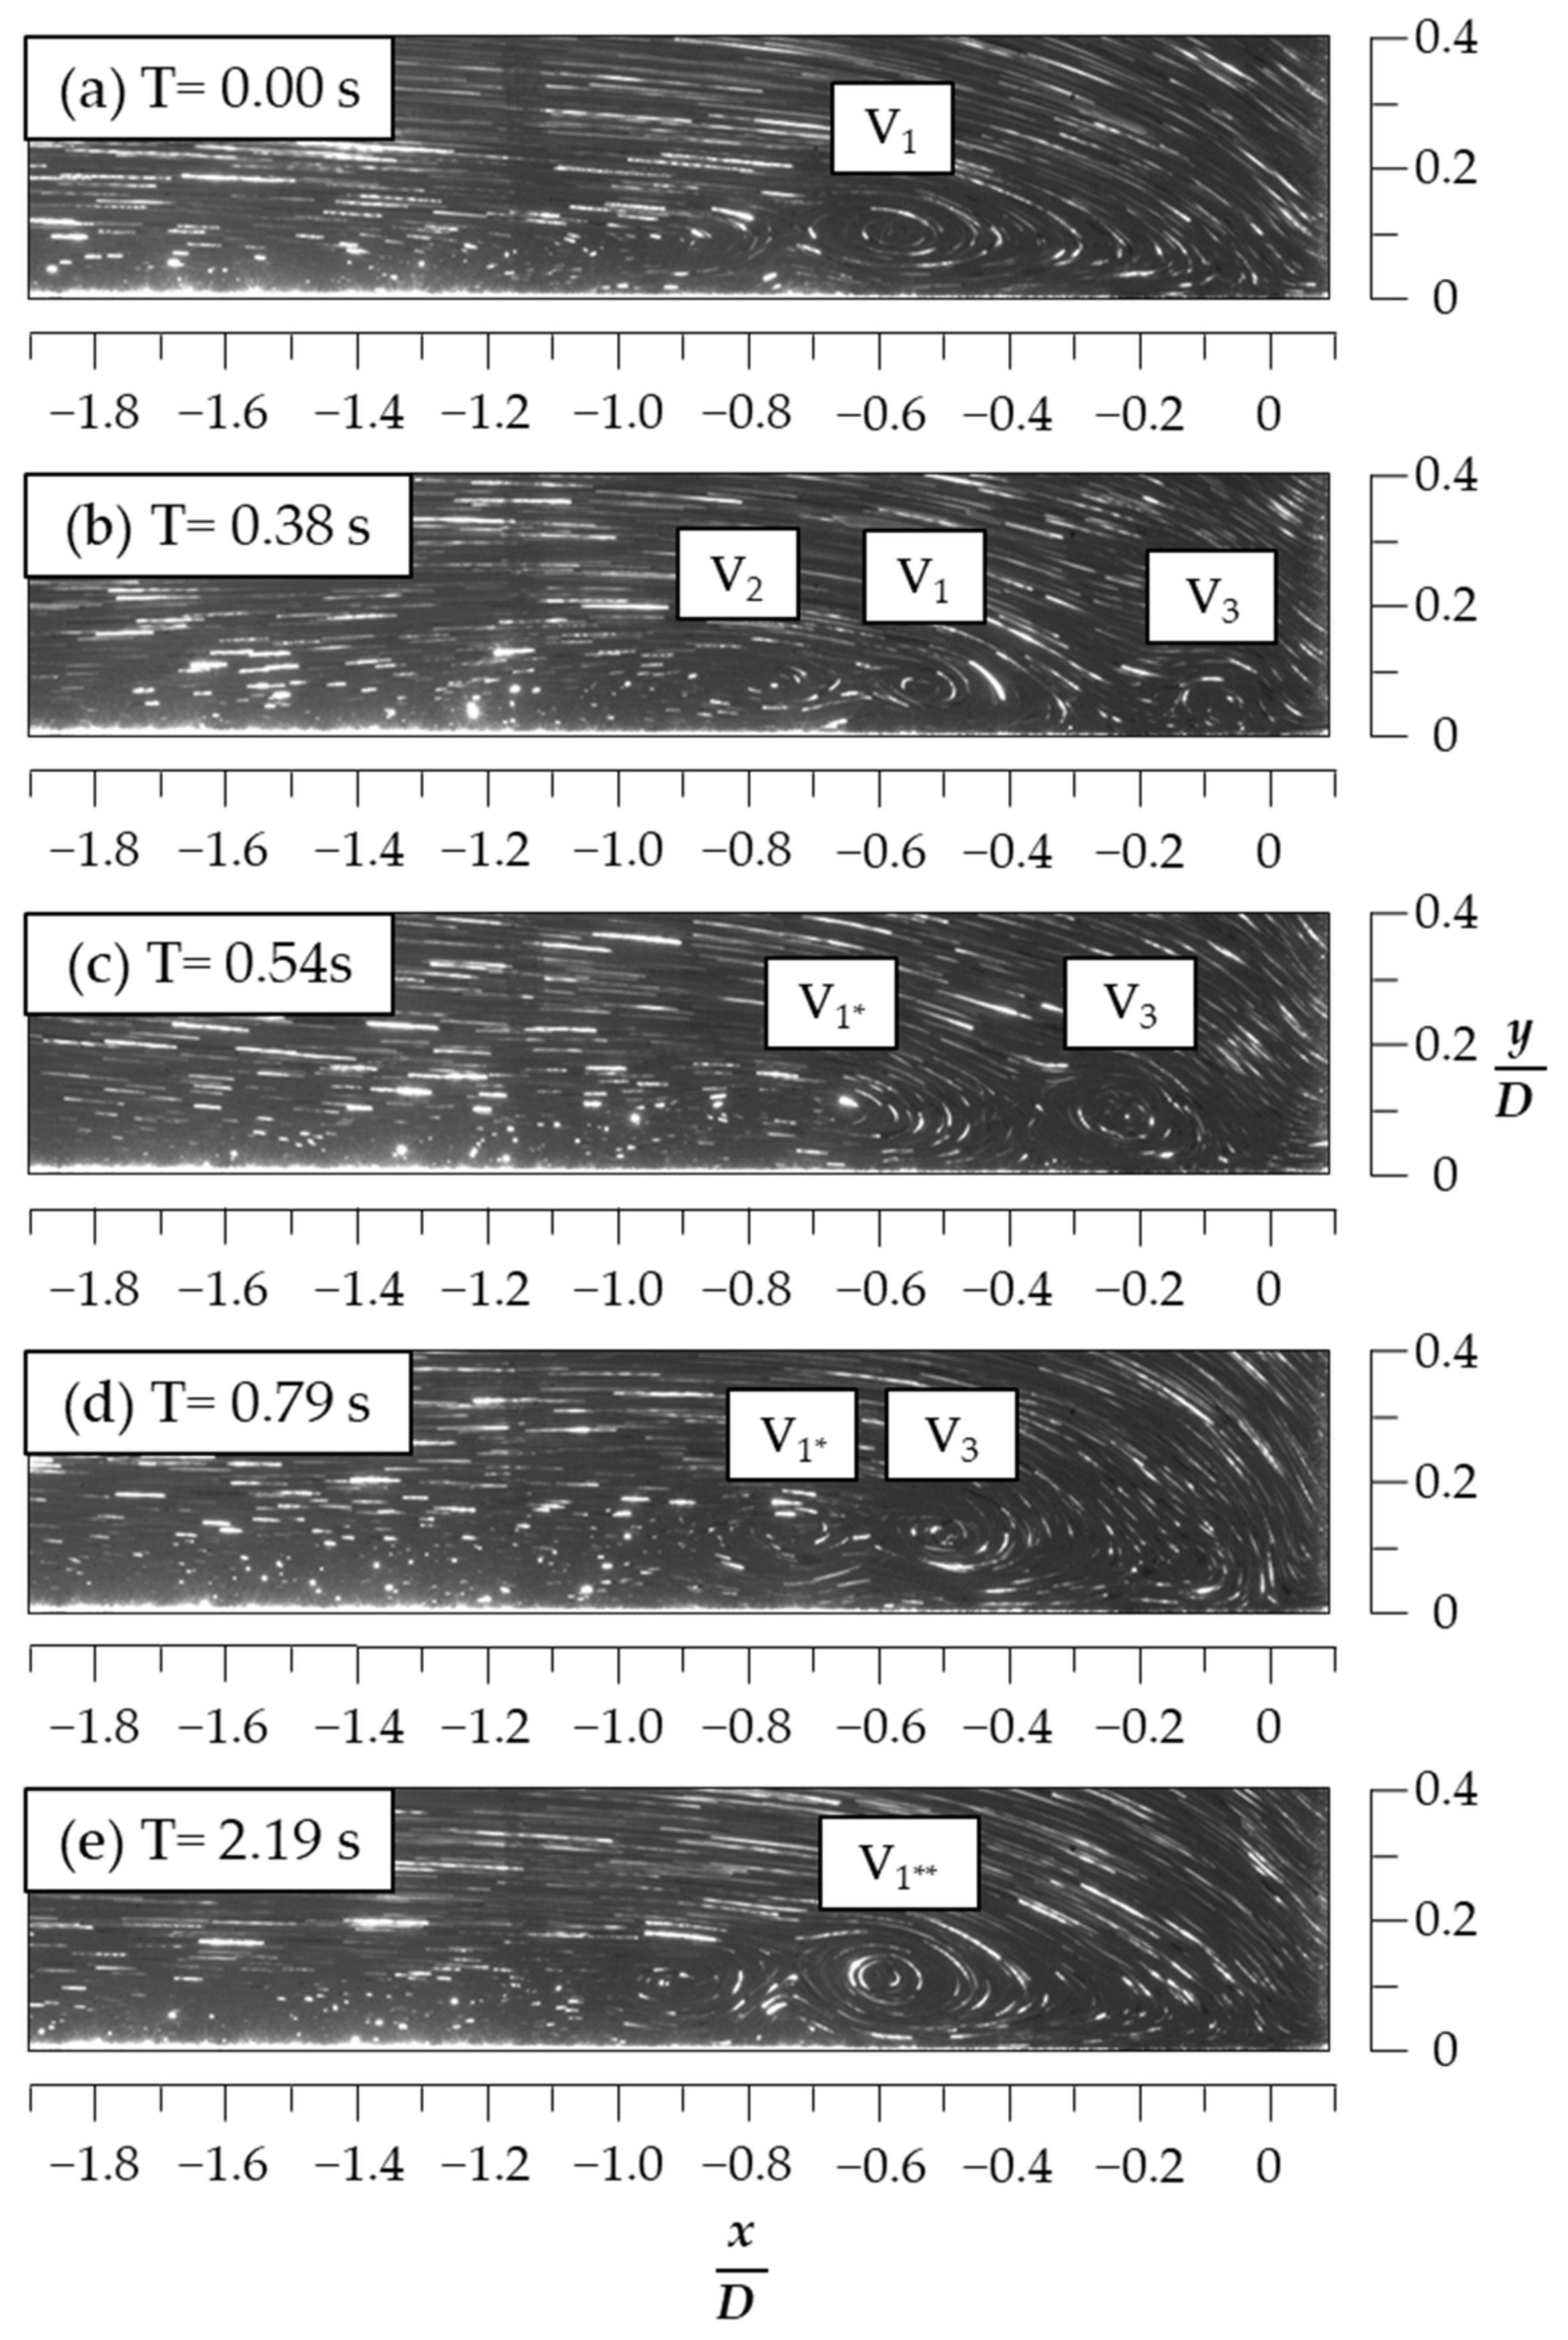
Similar data sets describing the “mixed” process (mode) as observed in Figure 15 (z = 0.4 cm plane) and Figure 16 (z = 0.8 cm plane) are listed, respectively, as follows: the cores of V1 were initially located at (x/D, y/D) = (−0.57, 0.10) and (−0.42, 0.07); the cores of the new vortex V1** forming after the “mixed” process were located at (x/D, y/D) = (−0.59, 0.11) and (−0.37, 0.06).

3.3. Mode Duration and Spanwise Extension of the HSV

All the mode classifications and their duration percentages of HSV’s kinematic behaviors are presented in Table 1. It is clearly evident that the kinematic mode “oscillation with a small displacement” was dominant for both H/D = 0 and 1.5 with the most duration percentages of 98.6% and 83.3% in the respective flow visualizations. For H/D = 0, the only other mode was the “breakaway to roll up” mode with an almost negligible duration percentage of 1.4%. For H/D = 1.5, that two more modes with appreciable duration percentages (4.5% for the “merging” mode and 12.2% for the “mixed” mode) existed indicates that the kinematic behavior of the HSV when H/D = 1.5 (i.e., the case with the backward-facing step) was less stable than that when H/D = 0 (i.e., the case without the backward-facing step). In summary, the downstream backward-facing step enhances flow instabilities (probably because of the unsteady separated shear layer at the step’s edge) that complicate the kinematic behaviors of upstream-formed HSVs.
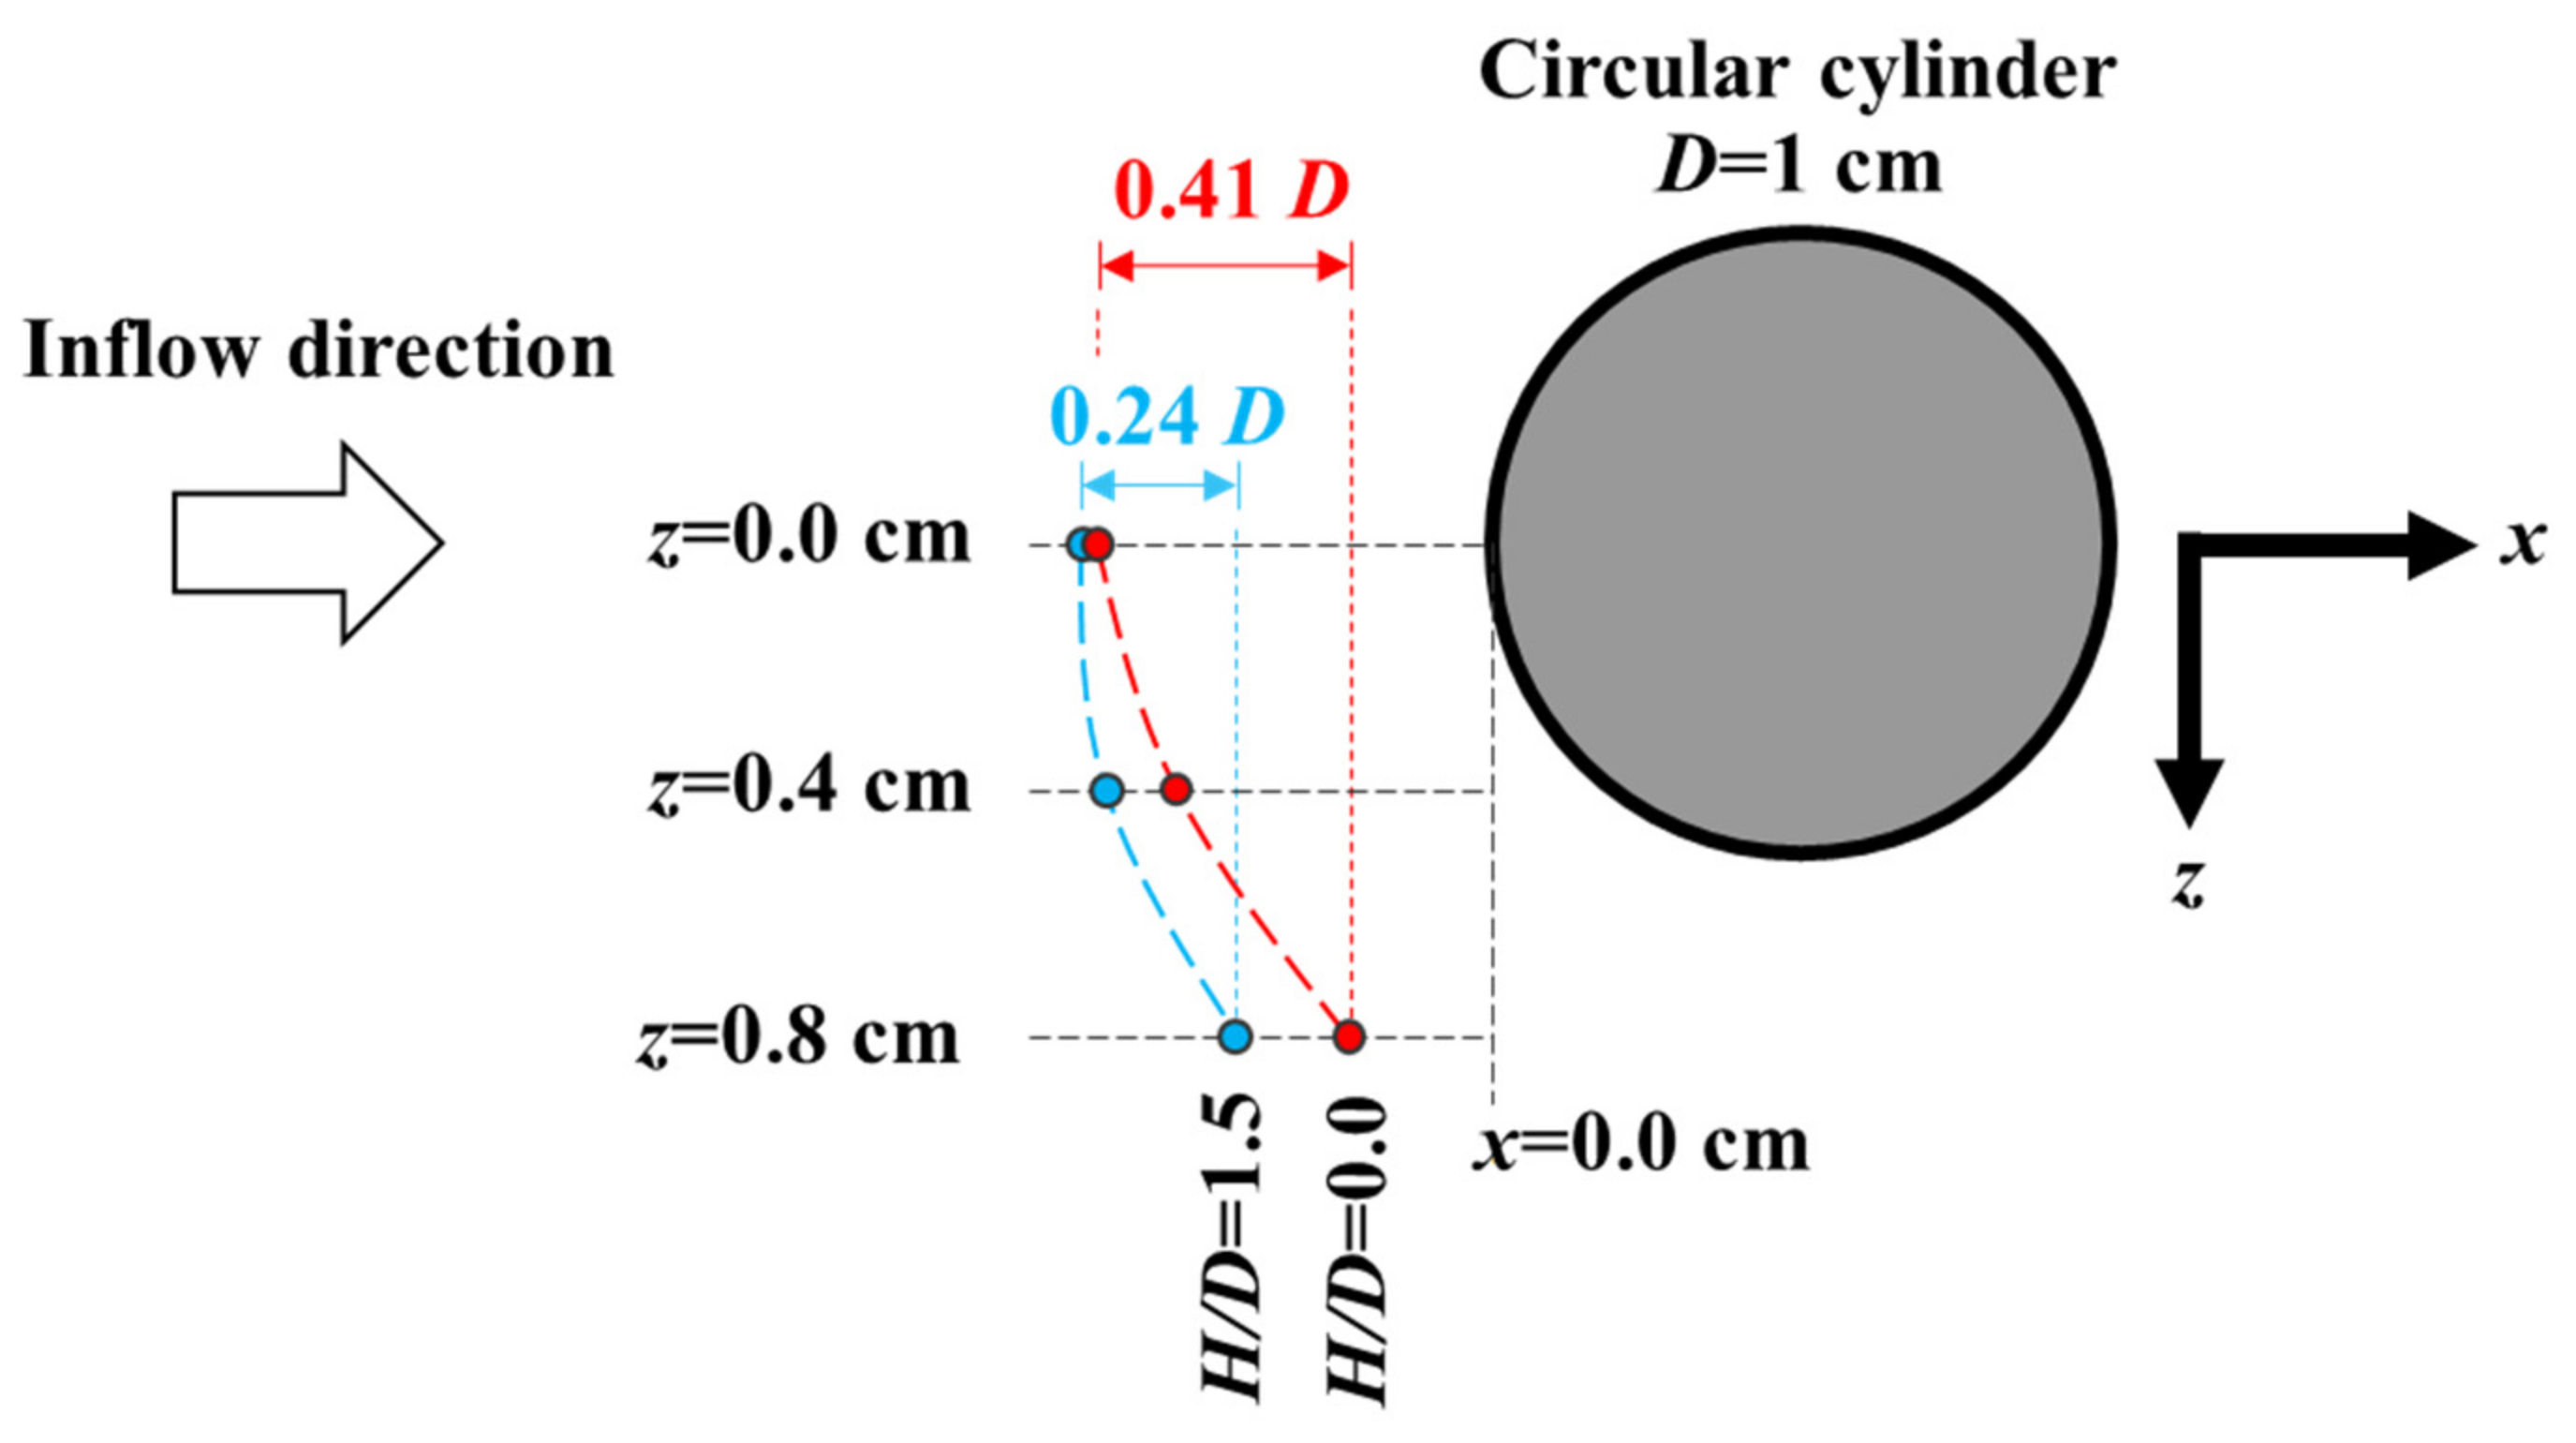
The oscillation center positions of the “oscillation with a small displacement” mode are presented in Table 2, which also represent the averaged locations of the HSV when H/D = 0 and 1.5 in the z = 0, 0.4, and 0.8 cm planes. As shown in Table 2 and Figure 17, the mean x-positions of the HSV were almost the same when H/D = 0 (xm/D = −0.64) and 1.5 (xm/D = −0.66) in the z = 0 cm plane. However, the streamwise extension (x-direction) of the oscillation center position of the HSV from the z = 0 to 0.8 cm planes were 0.41 D and 0.24 D, respectively, when H/D = 0 and 1.5. Therefore, as depicted in Figure 17, the spanwise extension (z-direction) of the oscillation center position of the HSV (i.e., the HSV’s breadth) when H/D = 1.5 appeared to be greater than that when H/D = 0. Thus, this implies that the downstream backward-facing step has an effect on increasing the upstream-formed HSV’s breadth.

3.4. Flow Characteristics of the HSV When H/D = 0 and 1.5 (z = 0 cm Plane)

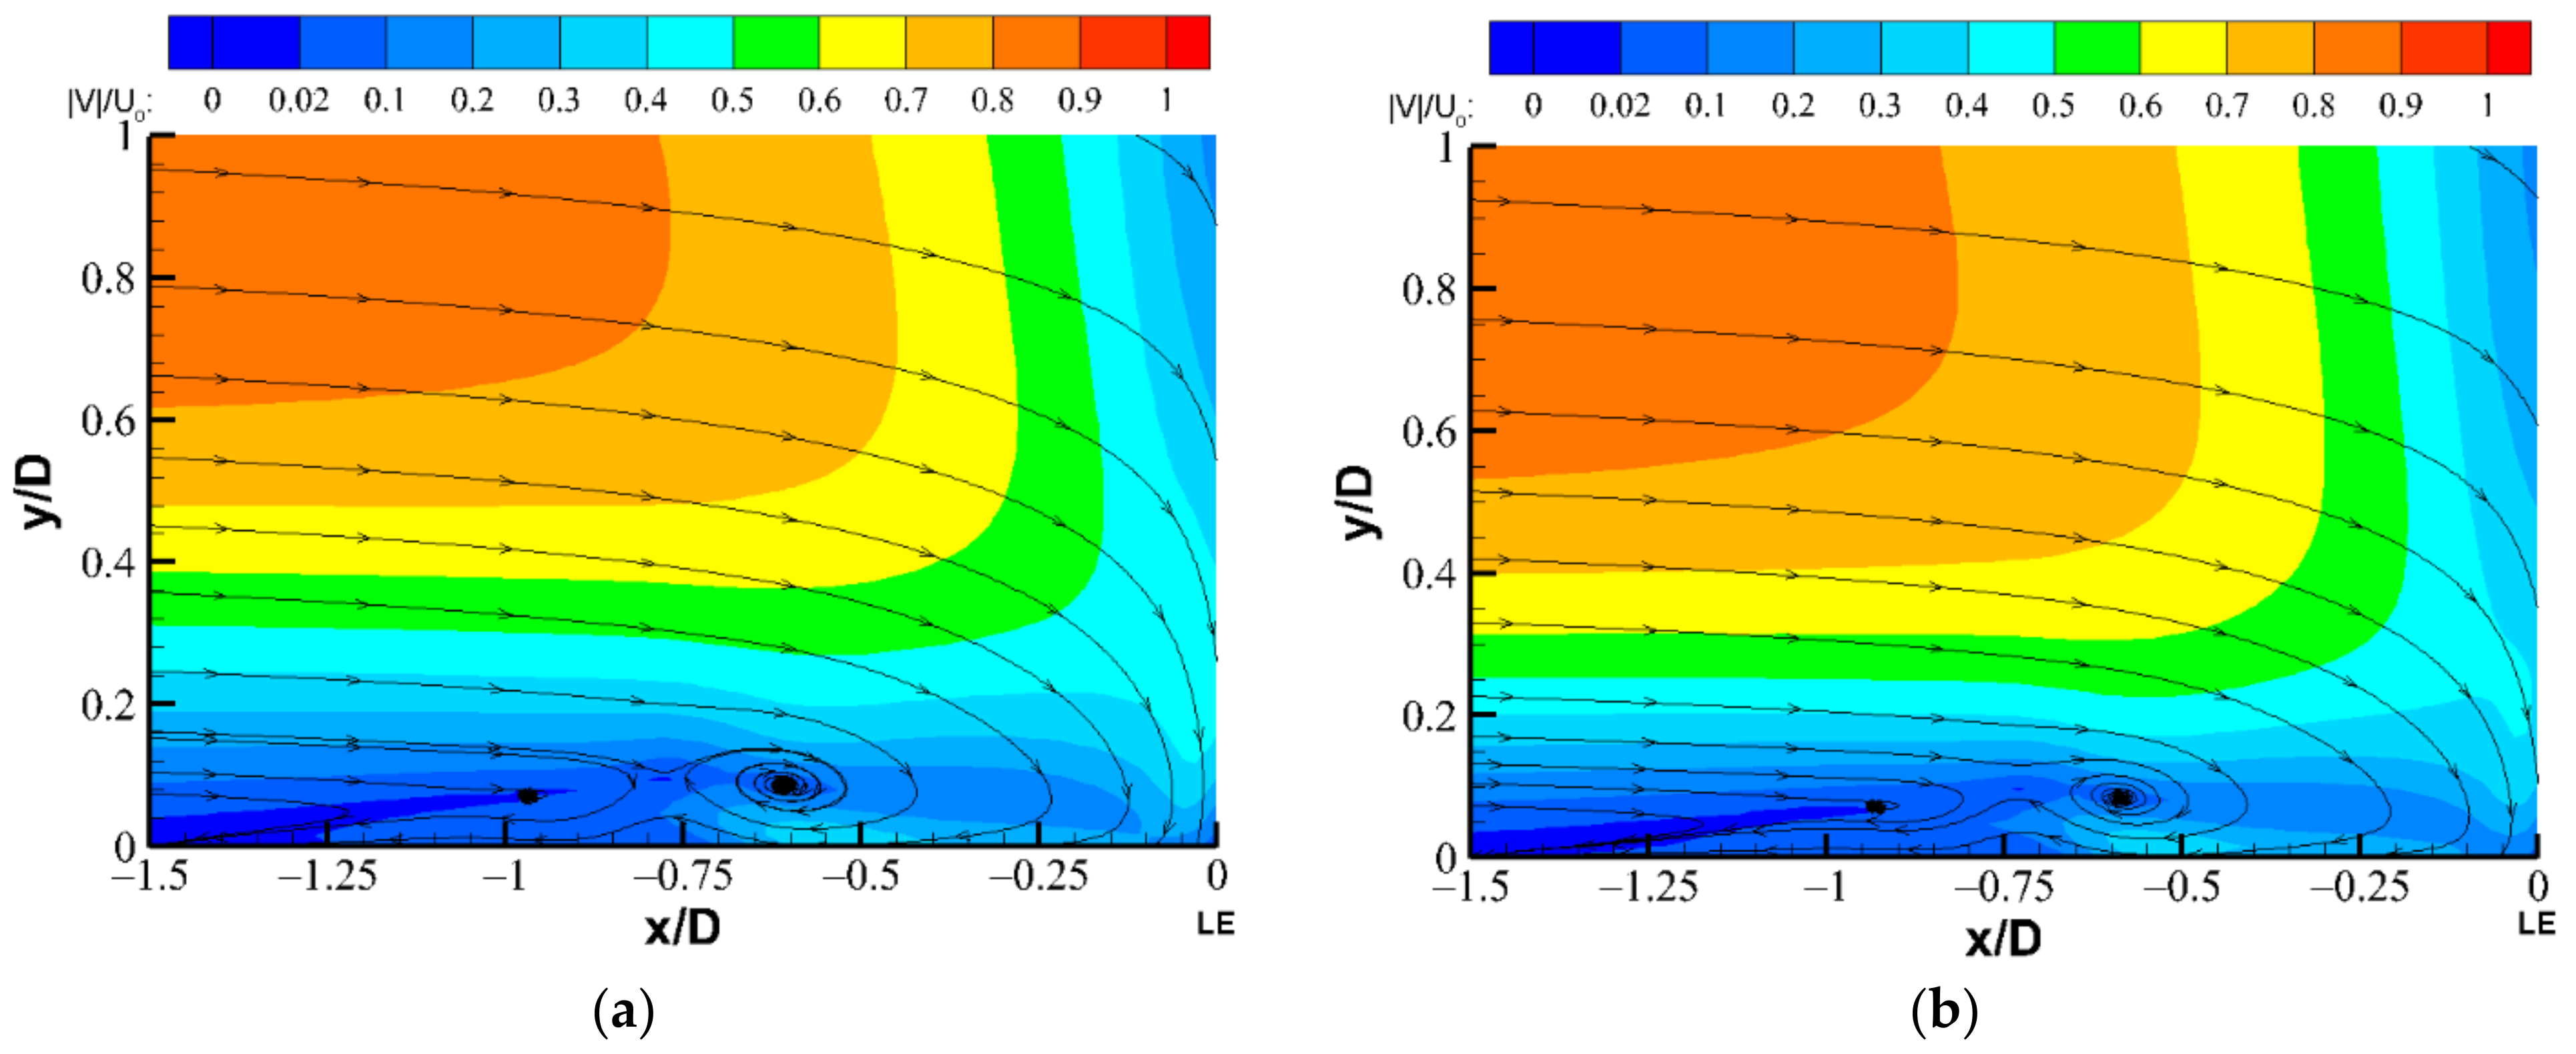
Figure 18 and Figure 19 present ensemble-averaged flow characteristics, which were determined with 3000 instantaneous velocity vector maps, upstream of the circular cylinder at the z = 0 cm plane when H/D = 0 and 1.5. Figure 18a,b present the contours of the ensemble-averaged velocity magnitude |V| when H/D = 0 and 1.5, respectively. They both show the clear presence of HSVs and similar trends that the flow velocity magnitudes were decreasing as the flow was approaching the circular cylinder because of the adverse pressure gradient caused by the obstacle (i.e., the circular cylinder). In order to highlight the effect of the backward-facing step on this adverse pressure gradient, the contours of the ensemble-averaged x-normal strain rate du/dx with and without the backward-facing step are presented in Figure 19. Figure 19b (i.e., when H/D = 1.5) clearly shows wider bands of negative-value contours in the free-stream region (above y/D = 0.5) and less positive-value contours in the separated-boundary-layer region (below y/D = 0.5) upstream of the HSV than that of Figure 19a (i.e., when H/D = 0), indicating that the downstream backward-facing step tended to increase the upstream adverse pressure gradient that led to the strengthening of the HSV (details follow).
To elucidate the effects of the backward-facing step on the strength of the HSV, the vortex-fitting algorithm was used to determine the vortical flow characteristics of the HSV undergoing the dominant kinematic mode, i.e., the “oscillation with a small displacement” mode. Three ensemble-averaged dimensionless variables of V1 (i.e., the HSV nearest the cylinder’s leading edge), namely, radius (R/D), core vorticity (ωzD/Uo), and circulation (Γ/Uo D), were determined with 1000 realizations when H/D = 0 and 1.5 (Table 3).
It was found that the ensemble-averaged dimensionless radius and circulation of the HSV when H/D = 0 were 8.24% and 6.37% lower than those when H/D = 1.5, respectively. However, the ensemble-averaged dimensionless core vorticity of the HSV when H/D = 0 was 7.35% higher than that when H/D = 1.5. This phenomenon indicates that the flow-shearing effect of the downstream backward-facing step (H/D = 1.5) due to low-momentum flow in the recirculation region actually reduced the magnitude of vortex stretching associated with the upstream-formed HSV. As a result, the HSV’s size (radius) and core vorticity was larger and lower than that when H/D = 0, respectively. In addition, because of this reduction in the magnitude of vortex stretching, the HSV became larger in size and slower in rotation and tended to inhibit viscous dissipation, resulting in higher strength (circulation). In summary, the downstream backward-facing step tends to increase the size and strength of the upstream-formed HSV.

4. Conclusions

In this study, we experimentally investigated the juncture flow of a surface-mounted circular cylinder with or without a trailing backward-facing step at a low Reynolds number of 1166 using PIV-based flow visualization and measurement techniques incorporated with a vortex-fitting algorithm. This work originated from a novel idea of downstream effects on upstream-formed flow structures. The selection of the backward-facing step as the downstream boundary geometry was based on two facts: (1) it is one of the simplest nonplanar geometries that generates multiple flow features, and (2) it is a brand-new attempt to the authors’ best knowledge.
The results of the PIV-based flow visualizations in the z = 0, 0.4, and 0.8 cm planes when H/D = 0 (without the downstream backward-facing step) and 1.5 (with the downstream backward-facing step) revealed that the kinematic behavior of the HSV when H/D = 0 was more stable than that when H/D = 1.5. When H/D = 0, two kinematic modes of the HSV were observed, and the “oscillation with a small displacement” mode (duration percentage of 98.6%) was absolutely dominant over the “breakaway to roll-up” mode (duration percentage of 1.4%); when H/D = 1.5, the “oscillation with a small displacement” mode was still dominant (duration percentage of 83.3%), but the other two modes with much more complexities (i.e., being much more unstable), namely, “merging” (duration percentage of 4.5%) and “mixed” (duration percentage of 12.2%), showed appreciable unsteady shearing effects caused by the downstream backward-facing step on the upstream-formed HSV. Furthermore, the results of the mean streamwise position of the HSV at the “oscillation with a small displacement” mode implies that downstream backward-facing step causes the increase of upstream-formed HSV’s breadth.
Through a comparison of the radius, core vorticity, and circulation of the HSV at the “oscillation with a small displacement” mode between the cases of H/D = 0 and 1.5, it can be evidently concluded that with the presence of the downstream backward-facing step (H/D = 1.5), the HSV undergoes a reduction in the magnitude of vortex stretching, resulting in a larger size by 8.24% and a higher strength (circulation) by 6.37% than that of the case without the presence of the downstream backward-facing step (H/D = 0). Therefore, the downstream backward-facing step actually tends to strengthen the upstream-formed HSV. This result draws the concluding remark that the backward-facing step downstream of a surface-mounted obstacle should be avoided in order to prevent the HSV from being strengthened to cause probable disasters. In the future, more step heights (especially those larger than the present one) will be experimentally tested in order to quantify the effects of the downstream backward-facing step on the characteristics of upstream-formed HSV.

Author Contributions

Conceptualization, Y.-C.C.; methodology, Y.-C.C. and C.-Y.Y.; software, C.-Y.Y.; formal analysis, Y.-C.C. and C.-Y.Y.; investigation, C.-Y.Y.; resources, Y.-C.C.; data curation, Y.-C.C. and C.-Y.Y.; writing—original draft preparation, C.-Y.Y.; writing—review and editing, Y.-C.C.; visualization, C.-Y.Y.; supervision, Y.-C.C.; project administration, Y.-C.C.; funding acquisition, Y.-C.C. All authors have read and agreed to the published version of the manuscript.

Funding

This work was supported by the Ministry of Science and Technology (now the National Science and Technology Council) of Taiwan (MOST 105-2221-E-019-036-).

Institutional Review Board Statement

Not applicable.

Informed Consent Statement

Not applicable.

Data Availability Statement

Not applicable.

Acknowledgments

The authors wish to thank Yaw-Huei Lee of the PIV Lab at the National Taiwan Ocean University for his help in developing the in-house vortex-fitting algorithms.

Conflicts of Interest

The authors declare no conflict of interest.

Nomenclature

δ0.99UoBoundary layer thickness
ReReynolds number
DDiameter of the circular cylinder
UoFree-stream velocity
HHeight of the backward-facing step
x, y, zCartesian coordinate system
εCombined uncertainty for particle image displacement
r, θ, zCylindrical coordinate system
vθCircumferential velocity
ΓCirculation
aRadius of vortex
ωzVorticity parallel to z-direction
pProbability density function
σStandard deviation
rDistance between the averaged vortex core position
rDistance between the discrete vortex core position and an arbitrary position
rDistance between the averaged vortex core position and an arbitrary position
xmMean position of the vortex’s core in the x-direction
|V|Velocity magnitude
du/dxx-normal strain rate

References

  1. Schwind, R. The Three Dimensional Boundary Layer Near a Strut; Gas Turbine Laboratory Report; Massachusetts Institute of Technology: Cambridge, MA, USA, 1962. [Google Scholar]
  2. Kubendran, L.R.; Harvey, W.D. Juncture flow control using leading-edge fillets. In Proceedings of the 3rd Applied Aerodynamics Conference, Colorado Springs, CO, USA, 14–16 October 1985; p. 4097. [Google Scholar]
  3. Pierce, F.J.; Shin, J. An experimental investigation of effects of leading-edge fillets on a turbulent junction vortex. In Proceedings of the 2nd International Symposium on Performance Enhancement for Marine Application, University of Rhode Island, Kingston, RI, USA, October 1990; pp. 61–71. [Google Scholar]
  4. Wei, Q.D.; Wang, J.M.; Chen, G.; Lu, Z.B.; Bi, W.T. Modification of junction flows by altering the section shapes of the cylinders. J. Vis. 2008, 11, 115–124. [Google Scholar] [CrossRef]
  5. Liu, Z.H.; Xiong, Y.; Wang, Z.Z.; Wang, S.; Tu, C.X. Experimental study on effect of a new vortex control baffler and its influencing factor. China Ocean Eng. 2011, 25, 83–96. [Google Scholar] [CrossRef]
  6. Younis, M.Y.; Zhang, H.; Zhu, R.; Muhammad, Z. Horseshoe vortex control using streamwise vortices. Procedia Eng. 2015, 126, 139–144. [Google Scholar] [CrossRef] [Green Version]
  7. Huang, R.F.; Hsu, C.M.; Chen, C. Effects of an upstream tetrahedron on the circular cylinder-flat plate juncture flow. Exp. Fluid 2015, 56, 146. [Google Scholar] [CrossRef]
  8. Zdravkovich, M.M. Flow around Circular Cylinder; Oxford University Press: New York, NY, USA, 1997; Volume 1. [Google Scholar]
  9. Zdravkovich, M.M. Flow around Circular Cylinder; Oxford University Press: New York, NY, USA, 2003; Volume 2. [Google Scholar]
  10. Coutanceau, M.; Bouard, R. Experimental determination of the main features of the viscous flow in the wake of a circular cylinder in uniform translation. Part 1. Steady flow. J. Fluid Mech. 1977, 79, 231–256. [Google Scholar] [CrossRef]
  11. Coutanceau, M.; Bouard, R. Experimental determination of the main features of the viscous flow in the wake of a circular cylinder in uniform translation. Part 2. Unsteady flow. J. Fluid Mech. 1977, 79, 257–272. [Google Scholar] [CrossRef]
  12. Eaton, J.K.; Johnston, J.P. A review of research on subsonic turbulent flow reattachment. AIAA J. 1981, 19, 1093–1100. [Google Scholar] [CrossRef]
  13. Rinoie, K.; Shirai, Y.; Sunada, Y. Behavior of separated and reattaching flow formed over a backward facing step. Trans. Jpn. Soc. Aeronaut. Space Sci. 2002, 45, 20–27. [Google Scholar] [CrossRef] [Green Version]
  14. Wei, Q.D.; Chen, G.; Du, X.D. Experimental Study on the Structure of Juncture Flows. J. Vis. 2001, 3, 341–348. [Google Scholar] [CrossRef]
  15. Baker, C.J. The laminar horseshoe vortex. J. Fluid Mech. 1979, 95, 347–367. [Google Scholar] [CrossRef]
  16. Praisner, T.J.; Smith, C.R. The dynamics of the horse shoe vortex and associated endwall heat transfer, Part 1—Temporal behavior. J. Turbomach. 2005, 128, 747–754. [Google Scholar] [CrossRef]
  17. Praisner, T.J.; Smith, C.R. The dynamics of the horse shoe vortex and associated endwall heat transfer, Part 2—Time mean behavior. J. Turbomach. 2005, 128, 755–762. [Google Scholar] [CrossRef]
  18. Hada, S.; Takeishi, K.; Oda, Y.; Mori, S.; Nuta, Y. The effect of leading-edge diameter on the horse shoe vortex and endwall heat transfer. In Proceedings of the ASME Turbo Expo 2008, Berlin, Germany, 9–13 June 2008. [Google Scholar]
  19. 1003005_Flowmaster_D10.2. Product Manual for DaVis 10.2; LaVision GmbH: Göttingen, Germany, 2021.
  20. Burgers, J.M. A mathematical model illustrating the theory of turbulence. In Advances in Applied Mechanics; New York, NY, USA, 1948; Volume 1, pp. 171–199. [Google Scholar]
  21. Lin, C.; Chiu, P.H.; Shieh, S.J. Characteristics of horseshoe vortex system near a vertical plate-base plate juncture. Exp. Therm. Fluid Sci. 2002, 27, 25–46. [Google Scholar] [CrossRef]
  22. Lin, C.; Ho, T.C.; Dey, S. Characteristics of steady horseshoe vortex system near junction of square cylinder and base plate. J. Eng. Mech. 2008, 134, 184–197. [Google Scholar] [CrossRef]
  23. Rodriguez y Dominguez, M.M.; Romero-Mendez, R.; De Lange, D.F.; Hernández-Guerrero, A. Laminar horseshoe vortices upstream of a short cylinder normal to a flat plate. Ing. Mecánica Tecnol. Y Desarro. 2011, 3, 219–228. [Google Scholar]
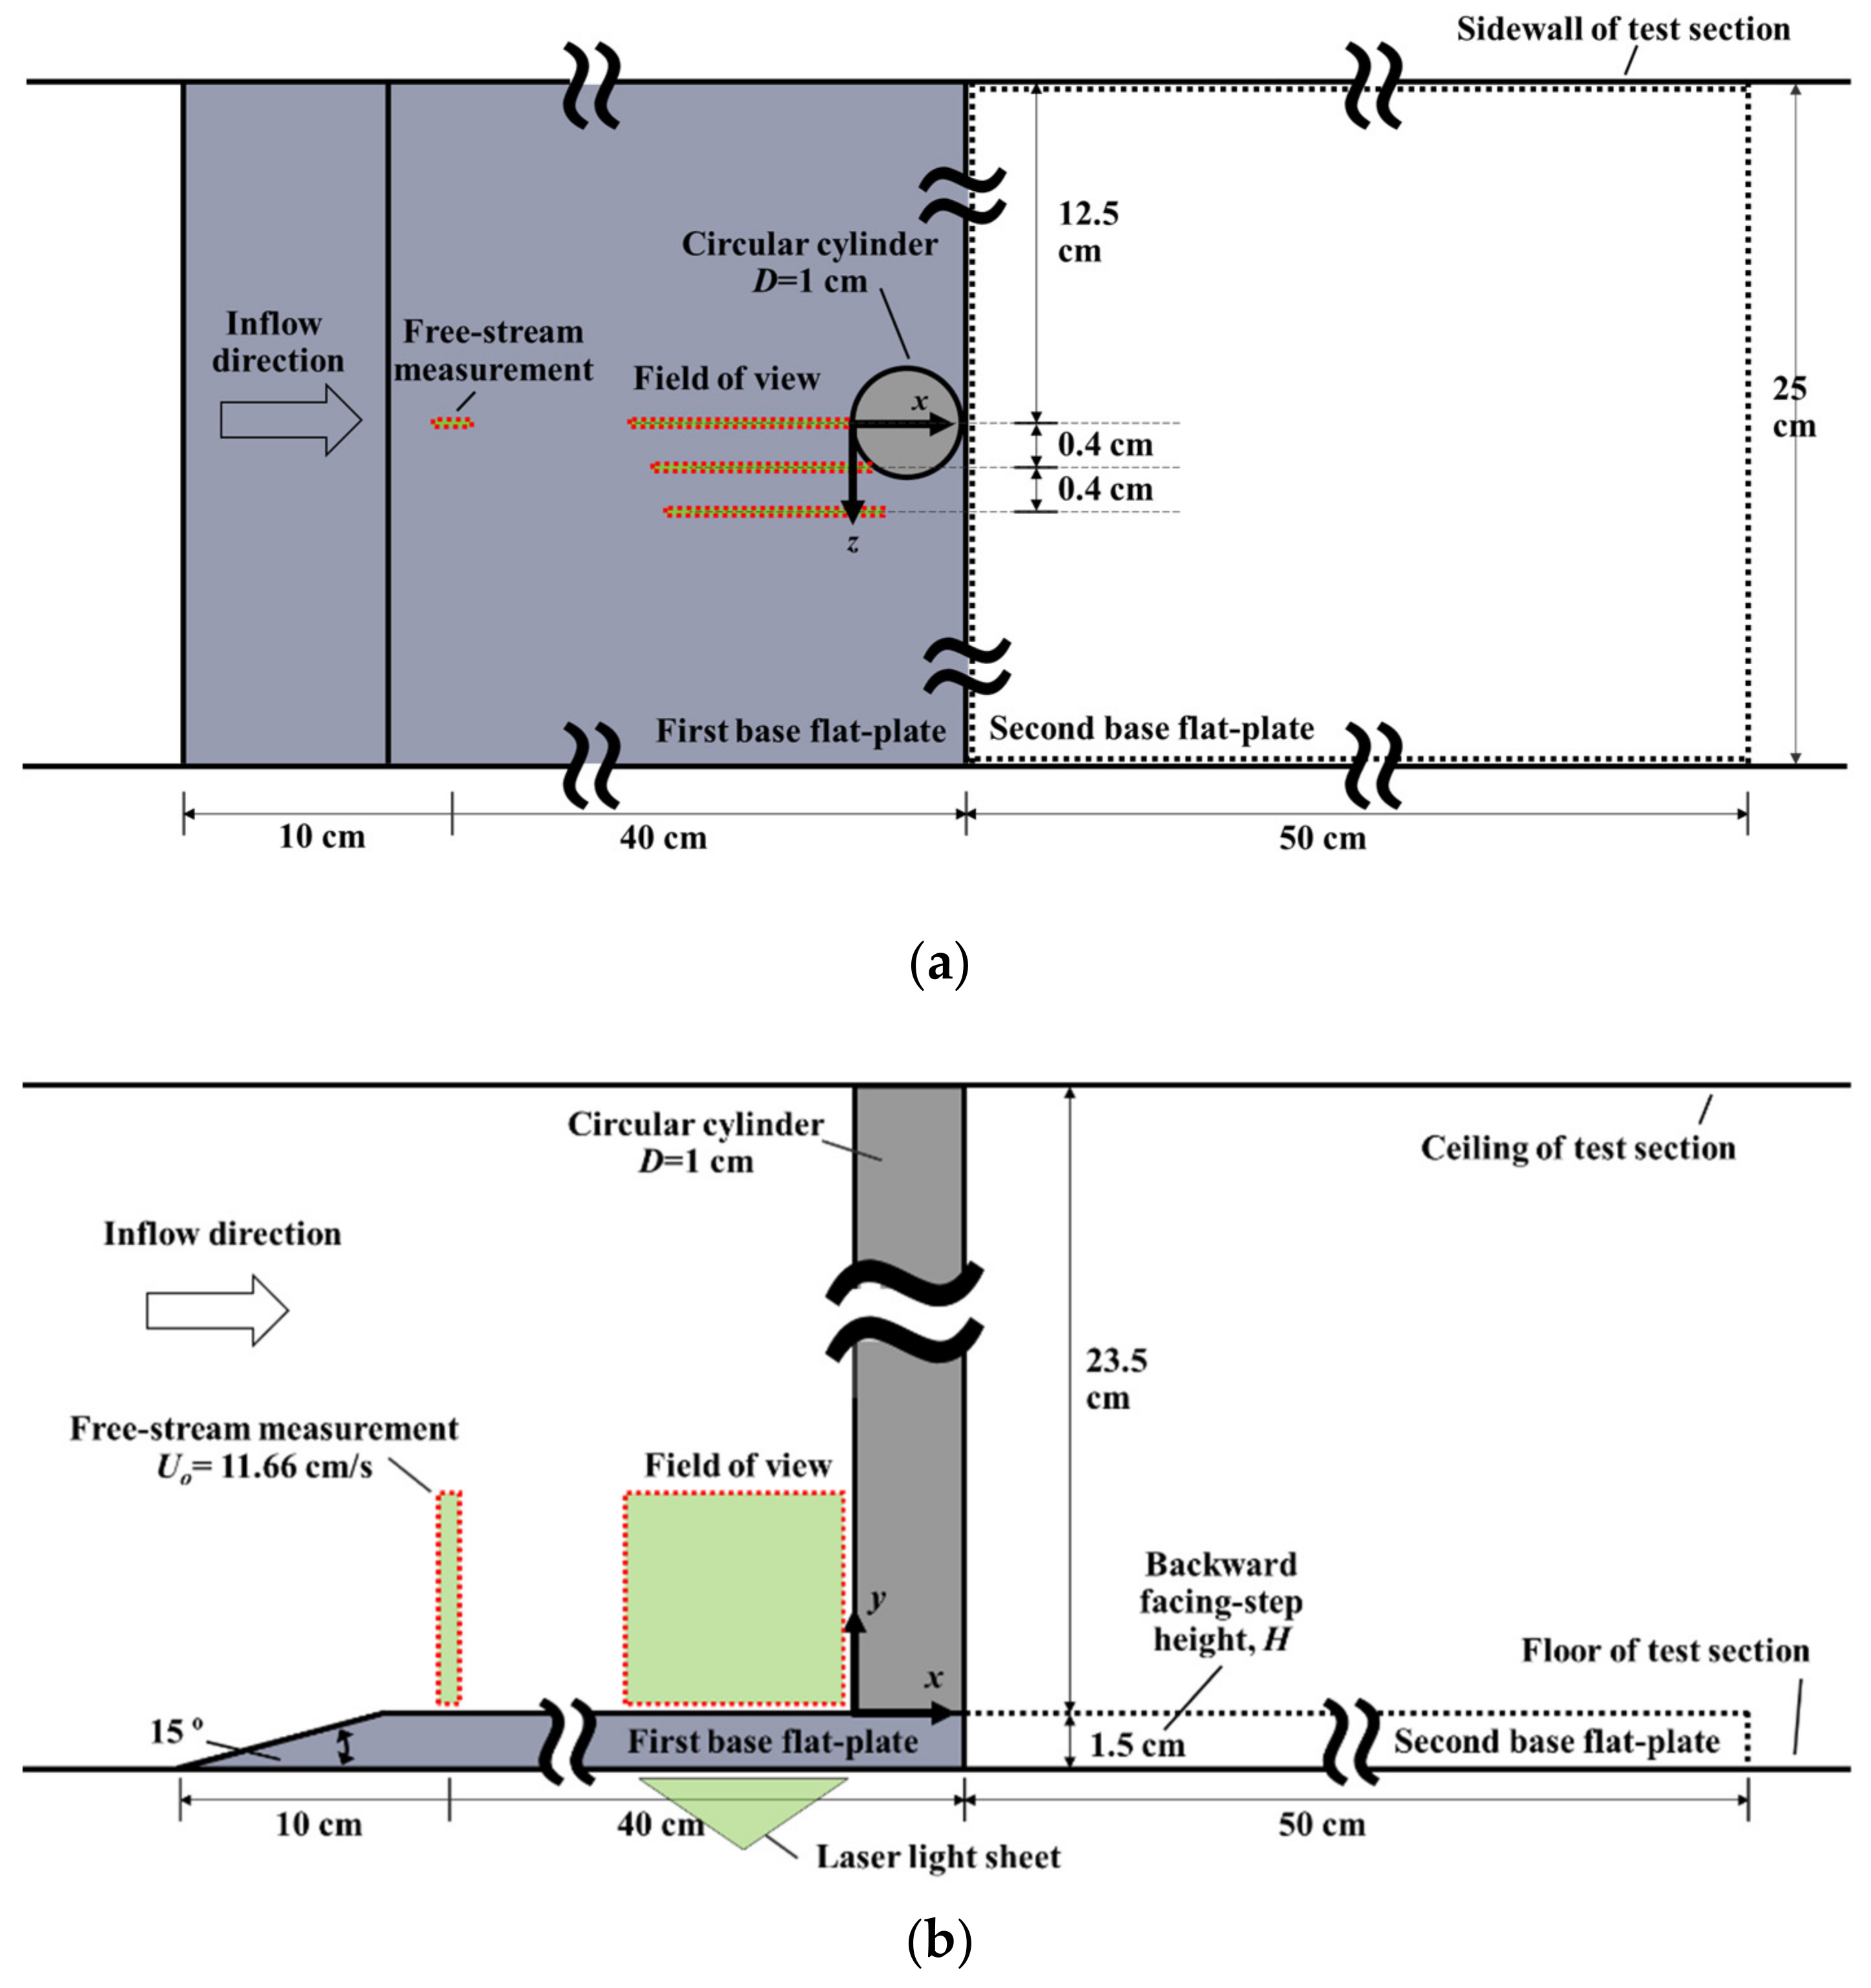
Figure 1. Experimental setup for H/D = 0 and 1.5 (with and without the second base flat-plate in place, respectively): (a) top view and (b) side view.
Jmse 10 01494 g001
Figure 2. Inflow PIV measurement results at the symmetric plane of z = 0 cm and x/D = −39: (a) dimensionless ensemble-averaged velocity, and (b) dimensionless turbulent kinetic energy. The dotted lines indicate the boundary layer thickness δ0.99Uo/D = 0.491.
Jmse 10 01494 g002
Figure 3. Vortex core position adjusted using the Gaussian distribution.
Jmse 10 01494 g003
Figure 4. Time-series flow visualization of the HSV’s kinematic mode: “oscillation with a small displacement” in the z = 0 cm plane when H/D = 0. The two red dashed lines indicate the oscillation range of the core of the HSV closest to the LE (labeled V1) between x/D = −0.57 and −0.67.
Jmse 10 01494 g004
Figure 5. Time-series flow visualization of the HSV’s kinematic mode: “oscillation with a small displacement” in the z = 0.4 cm plane when H/D = 0. The two red dashed lines indicate the oscillation range of the core of the HSV closest to the LE (labeled V1) between x/D = −0.43 and −0.64.
Jmse 10 01494 g005
Figure 6. Time-series flow visualization of the HSV’s kinematic mode(s): “breakaway to roll-up” in the z = 0.4 cm plane when H/D = 0. From (a) to (d), the HSV denoted as V1 was undergoing the “breakaway” process (mode); from (d) to (g), the HSV denoted as V2 was rolling up and moving upstream to become a V1 in the next mode that occurred.
Jmse 10 01494 g006aJmse 10 01494 g006b
Figure 7. Time-series flow visualization of the cross-section of HSV’s leg portion in the z = 0.8 cm plane when H/D = 0. The HSV structure (labeled V1) near x/D = −0.23 was not as clear as shown in the other two z-planes.
Jmse 10 01494 g007
Figure 8. Time-series flow visualization of the HSV’s kinematic mode: “oscillation with a small displacement” in the z = 0 cm plane when H/D = 1.5. The two red dashed lines indicate the oscillation range of the core of the HSV closest to the LE (labeled V1) between x/D = −0.59 and −0.72.
Jmse 10 01494 g008
Figure 9. Time-series flow visualization of the HSV’s kinematic mode: “oscillation with a small displacement” in the z = 0.4 cm plane when H/D = 1.5. The two red dashed lines indicate the oscillation range of the core of the HSV closest to the LE (labeled V1) between x/D = −0.56 and −0.72.
Jmse 10 01494 g009
Figure 10. Time-series flow visualization of the HSV’s kinematic mode: “oscillation with a small displacement” in the z = 0.8 cm plane when H/D = 1.5. The two red dashed lines indicate the oscillation range of the core of the HSV closest to the LE (labeled V1) between x/D = −0.34 and −0.52.
Jmse 10 01494 g010
Figure 11. Time-series flow visualization of the HSV’s kinematic mode: “merging” in the z = 0 cm plane when H/D = 1.5. (a) The cores of two primary vortices V1 and V2 were initially located at (x/D, y/D) = (−0.49, 0.11) and (−0.85, 0.09), respectively; from (b) to (d), V2 and V1 were approaching and merging with each other; (e) a new primary vortex V1* formed with its core located at (x/D, y/D) = (−0.63, 0.09).
Jmse 10 01494 g011
Figure 12. Time-series flow visualization of the HSV’s kinematic mode: “merging” in the z = 0.4 cm plane when H/D = 1.5. (a) The cores of two primary vortices V1 and V2 were initially located at (x/D, y/D) = (−0.37, 0.07) and (−0.66, 0.08), respectively; from (b) to (c), V2 and V1 were approaching and merging with each other; (d) a new primary vortex V1* formed with its core located at (x/D, y/D) = (−0.57, 0.09).
Jmse 10 01494 g012
Figure 13. Time-series flow visualization of the HSV’s kinematic mode: “merging” in the z = 0.8 cm plane when H/D = 1.5. (a) The cores of two primary vortices V1 and V2 were initially located at (x/D, y/D) = (−0.31, 0.10) and (−0.73, 0.06), respectively; from (b) to (c), V2 and V1 were approaching and merging with each other; (d) a new primary vortex V1* formed with its core located at (x/D, y/D) = (−0.38, 0.06).
Jmse 10 01494 g013aJmse 10 01494 g013b
Figure 14. Time-series flow visualization of the HSV’s kinematic mode: “mixed” in the z = 0 cm plane when H/D = 1.5. (a) The core of the primary vortex V1 was initially located at (x/D, y/D) = (−0.65, 0.10); from (b) to (e), an unexpected bulk of “flow disturbances“ (red dotted box) was moving into V1‘s region and distorting the flow structure near the vortex V1; (f) a new roll-up vortex V2 was formed upstream V1; (g) a new roll-up vortex V3 was formed downstream V1; from (h) to (j), all of the primary vortices (V1, V2, and V3) were “merging” with one another to finally form a new primary vortex V1* with its core located at (x/D, y/D) = (−0.62, 0.12).
Jmse 10 01494 g014
Figure 15. Time-series flow visualization of the HSV’s kinematic mode: “mixed” in the z = 0.4 cm plane when H/D = 1.5. (a) The core of the primary vortex V1 was initially located at (x/D, y/D) = (−0.57, 0.10); (b) two new roll-up vortices V2 and V3 were formed after a bulk of “flow disturbances“ was moving into V1‘s region; from (b) to (c), V1 and V2 were merging with each other to form a new primary vortex V1* while the V3 was moving upstream; from (d) to (e), V1* and V3 were merging with each other, and finally a new primary vortex V1** was formed with its core located at (x/D, y/D) = (−0.59, 0.11).
Jmse 10 01494 g015
Figure 16. Time-series flow visualization of the HSV’s kinematic mode: “mixed” in the z = 0.8 cm plane when H/D = 1.5. (a) The core of the primary vortex V1 was initially located at (x/D, y/D) = (−0.42, 0.07); (b) a new roll-up vortex V2 formed due to flow disturbances; from (b) to (c), V1 and V2 were merging with each other to form a new primary vortex V1*; from (d) to (e), a similar process to that from (b) to (c), a roll-up vortex V2* was formed, and then V1* was merging with V2* to form a new primary vortex V1** with its core located at (x/D, y/D) = (−0.37, 0.06).
Jmse 10 01494 g016
Figure 17. Comparison between spanwise extensions (breadths) of the HSV for H/D = 0 (in red) and 1.5 (in blue).
Jmse 10 01494 g017
Figure 18. Ensemble-averaged velocity magnitude |V| at the z = 0 cm plane when (a) H/D = 0, and (b) H/D = 1.5.
Jmse 10 01494 g018
Figure 19. Ensemble-averaged x-normal strain rate du/dx at the z = 0 cm plane when (a) H/D = 0, and (b) H/D = 1.5.
Jmse 10 01494 g019
Table 1. Classifications and duration percentages of kinematic modes of the HSV when H/D = 0 and 1.5.
H/DKinematic ModesDuration (%)
0Oscillations with a small displacement98.6
Breakaway to roll-up1.4
1.5Oscillations with a small displacement83.3
Merging4.5
Mixed12.2
Table 2. Mean x-positions of the HSV at the “oscillation with a small displacement” mode when H/D = 0 and 1.5.
H/Dz (cm)Mean x-Position of the V1s Core
(xm/D)
00−0.64
0.4−0.51
0.8−0.23
1.50−0.66
0.4−0.62
0.8−0.42
Table 3. Flow characteristics of the HSV: ensemble-averaged radius (R/D), core vorticity (ωzD/Uo), and circulation (Γ/Uo D) at the “oscillation with a small displacement” mode when H/D = 0 and 1.5.
H/DR/DωzD/Uo Γ/Uo D
00.0859.6770.251
1.50.0928.9660.267
Differences (% with respect to H/D = 0)8.24−7.356.37
Publisher’s Note: MDPI stays neutral with regard to jurisdictional claims in published maps and institutional affiliations.