

The Preliminary Investigation of Communication Characteristics Using Evaporation Duct across the Taiwan Strait


Abstract
:1. Introduction
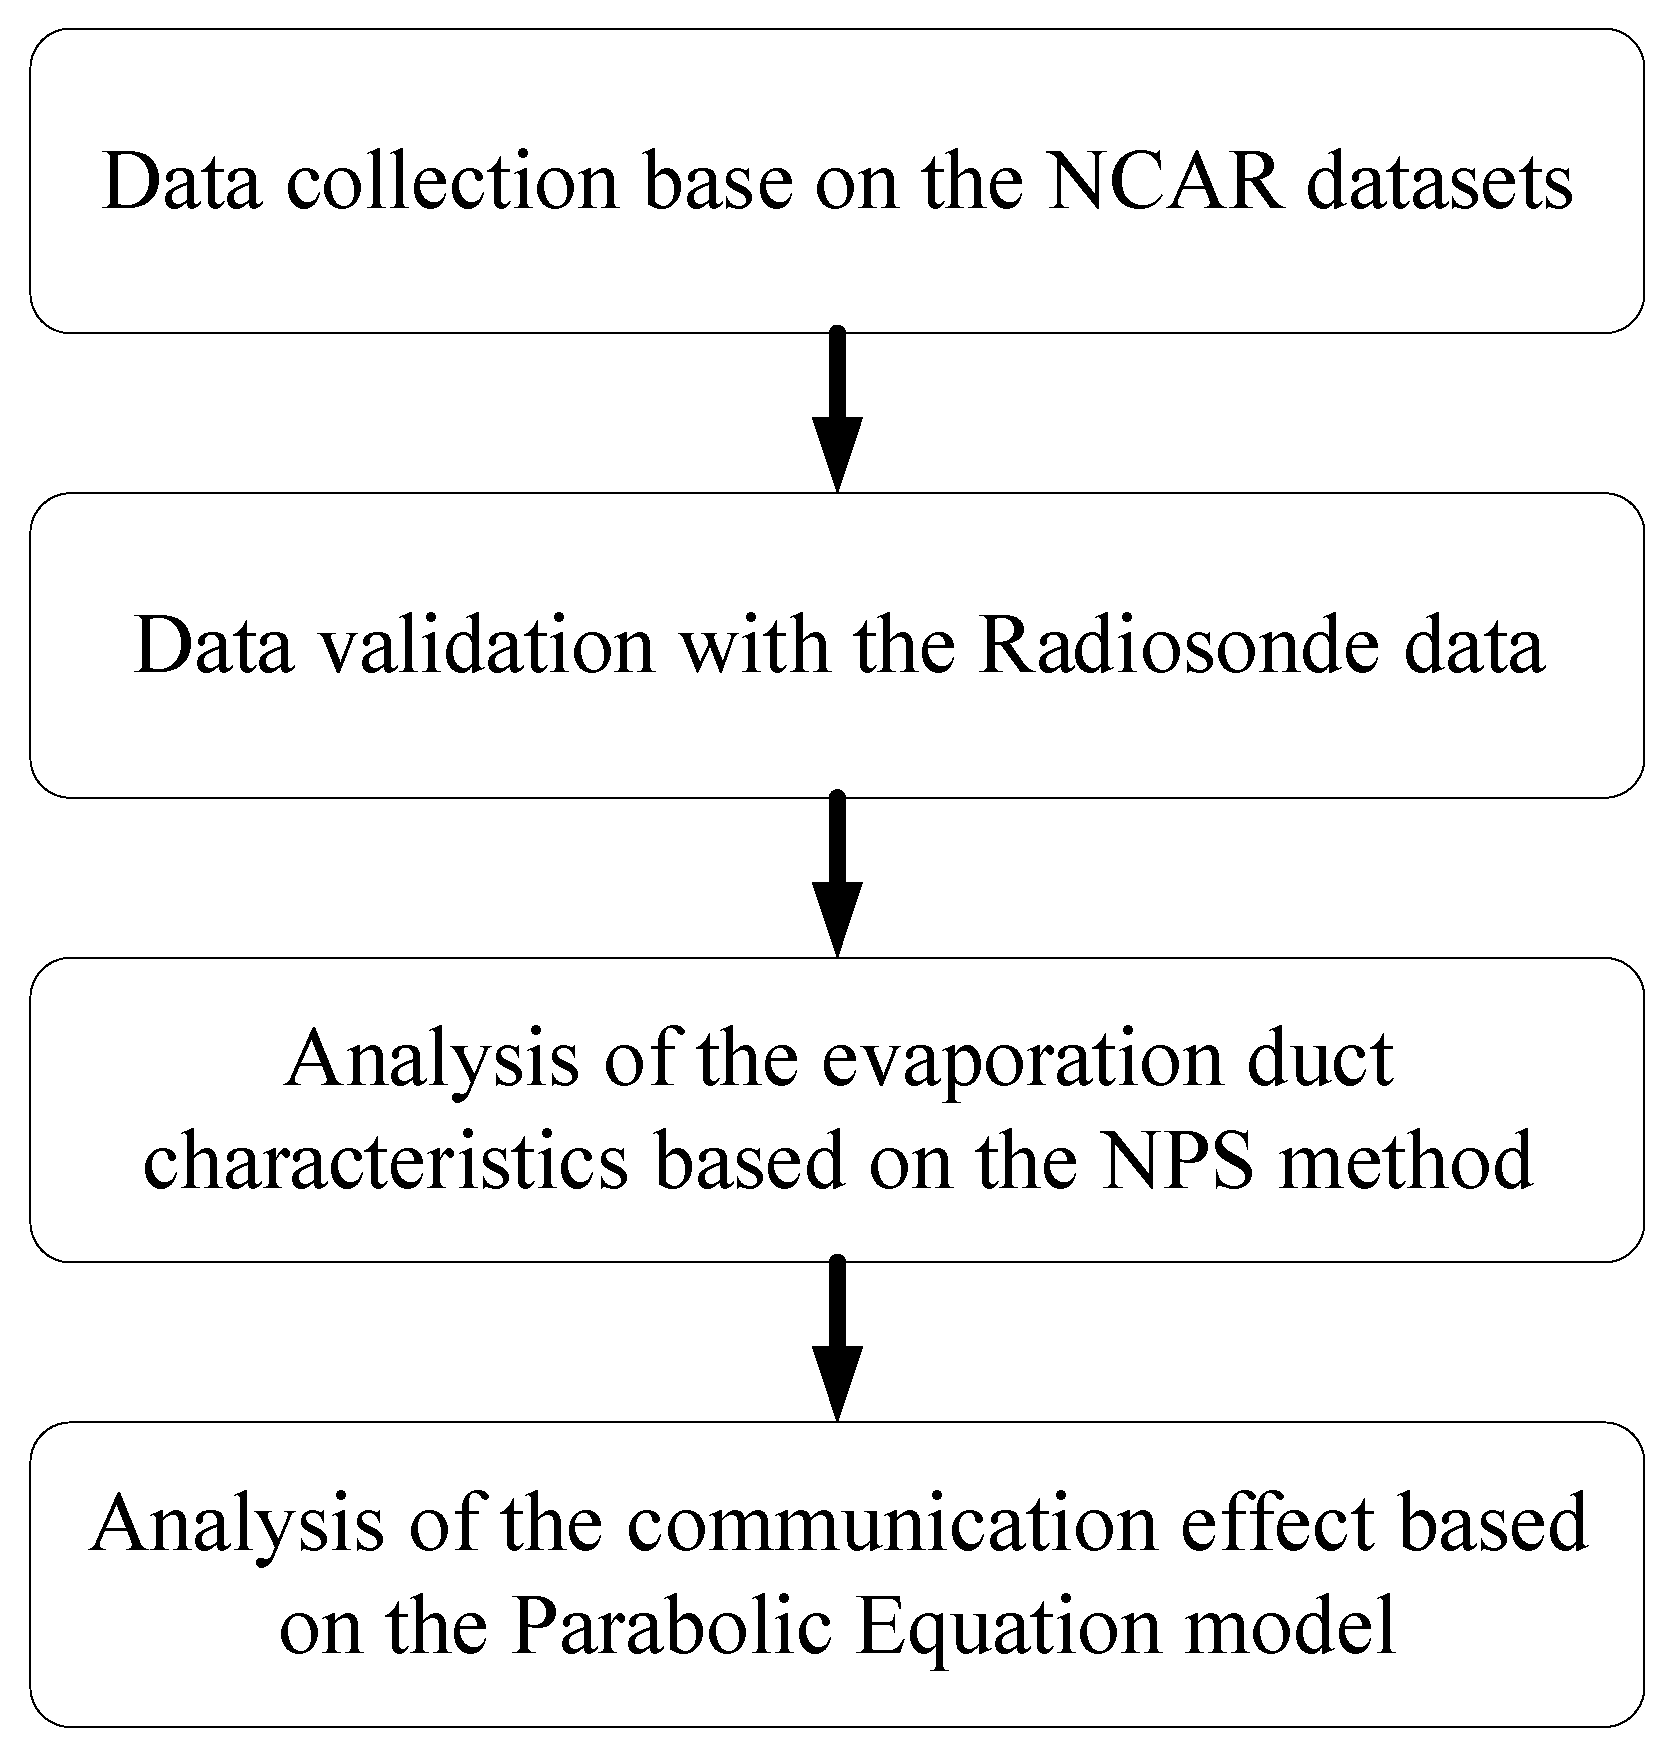
2. Methodology
2.1. Data Collection and Validation
2.2. Modeling Method of the Evaporation Duct Characteristics
2.3. Modeling Method of the Communication Effect
3. Results and Discussion
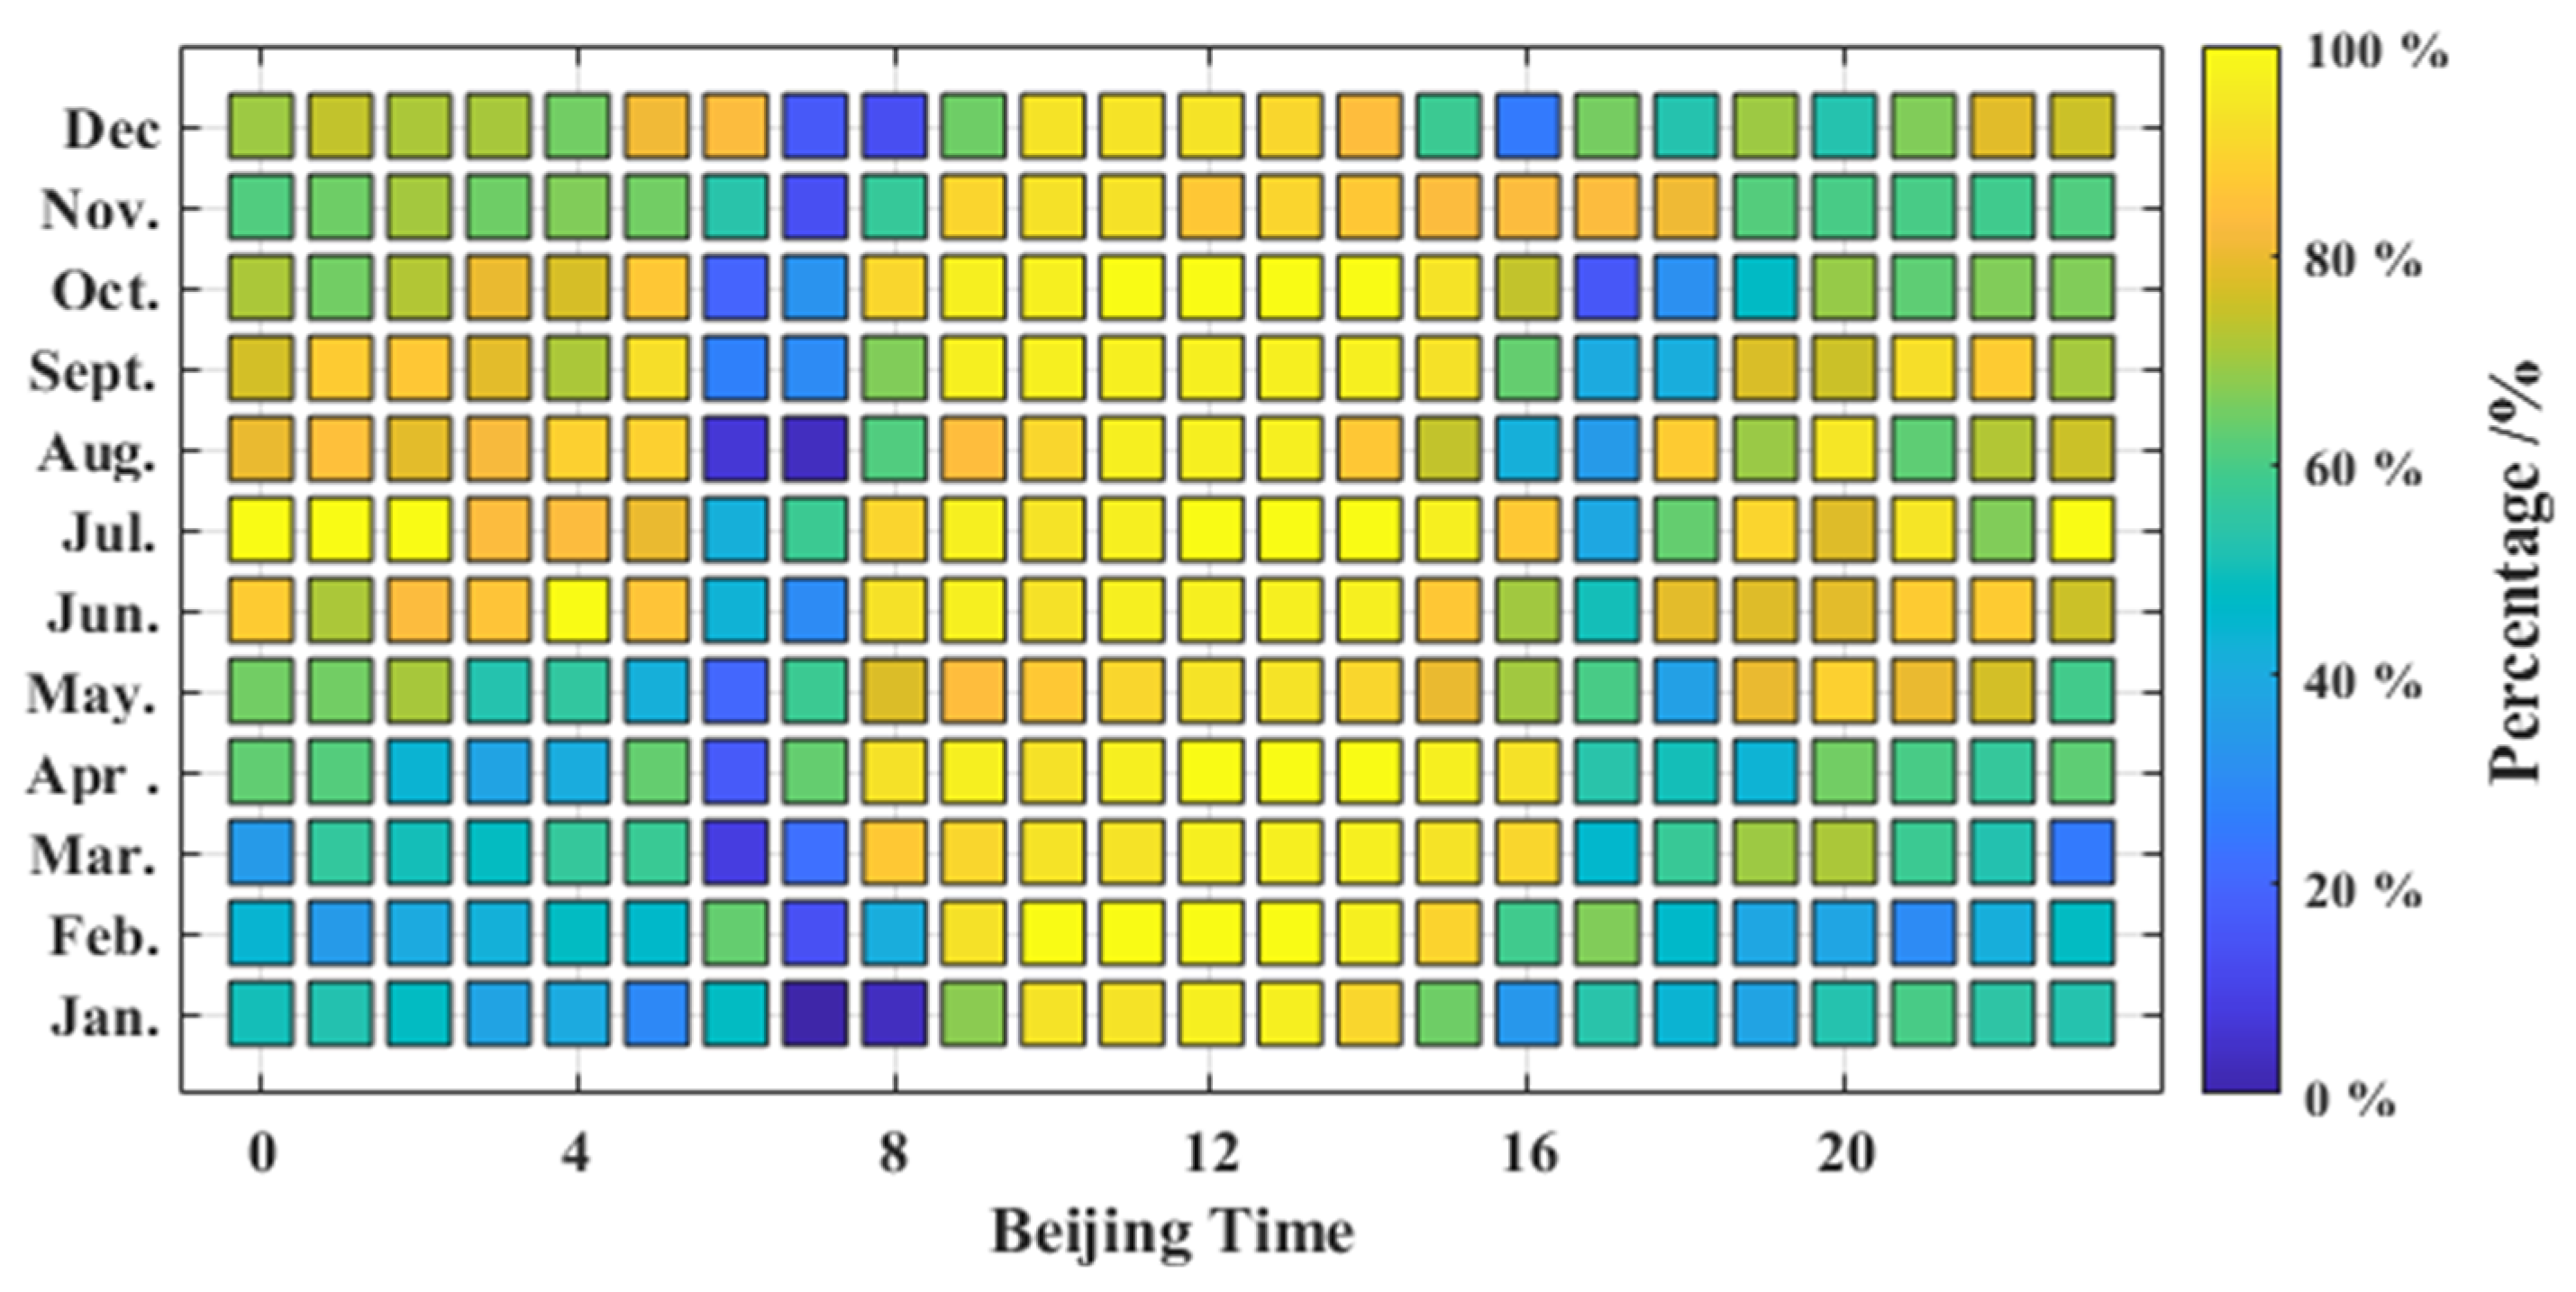
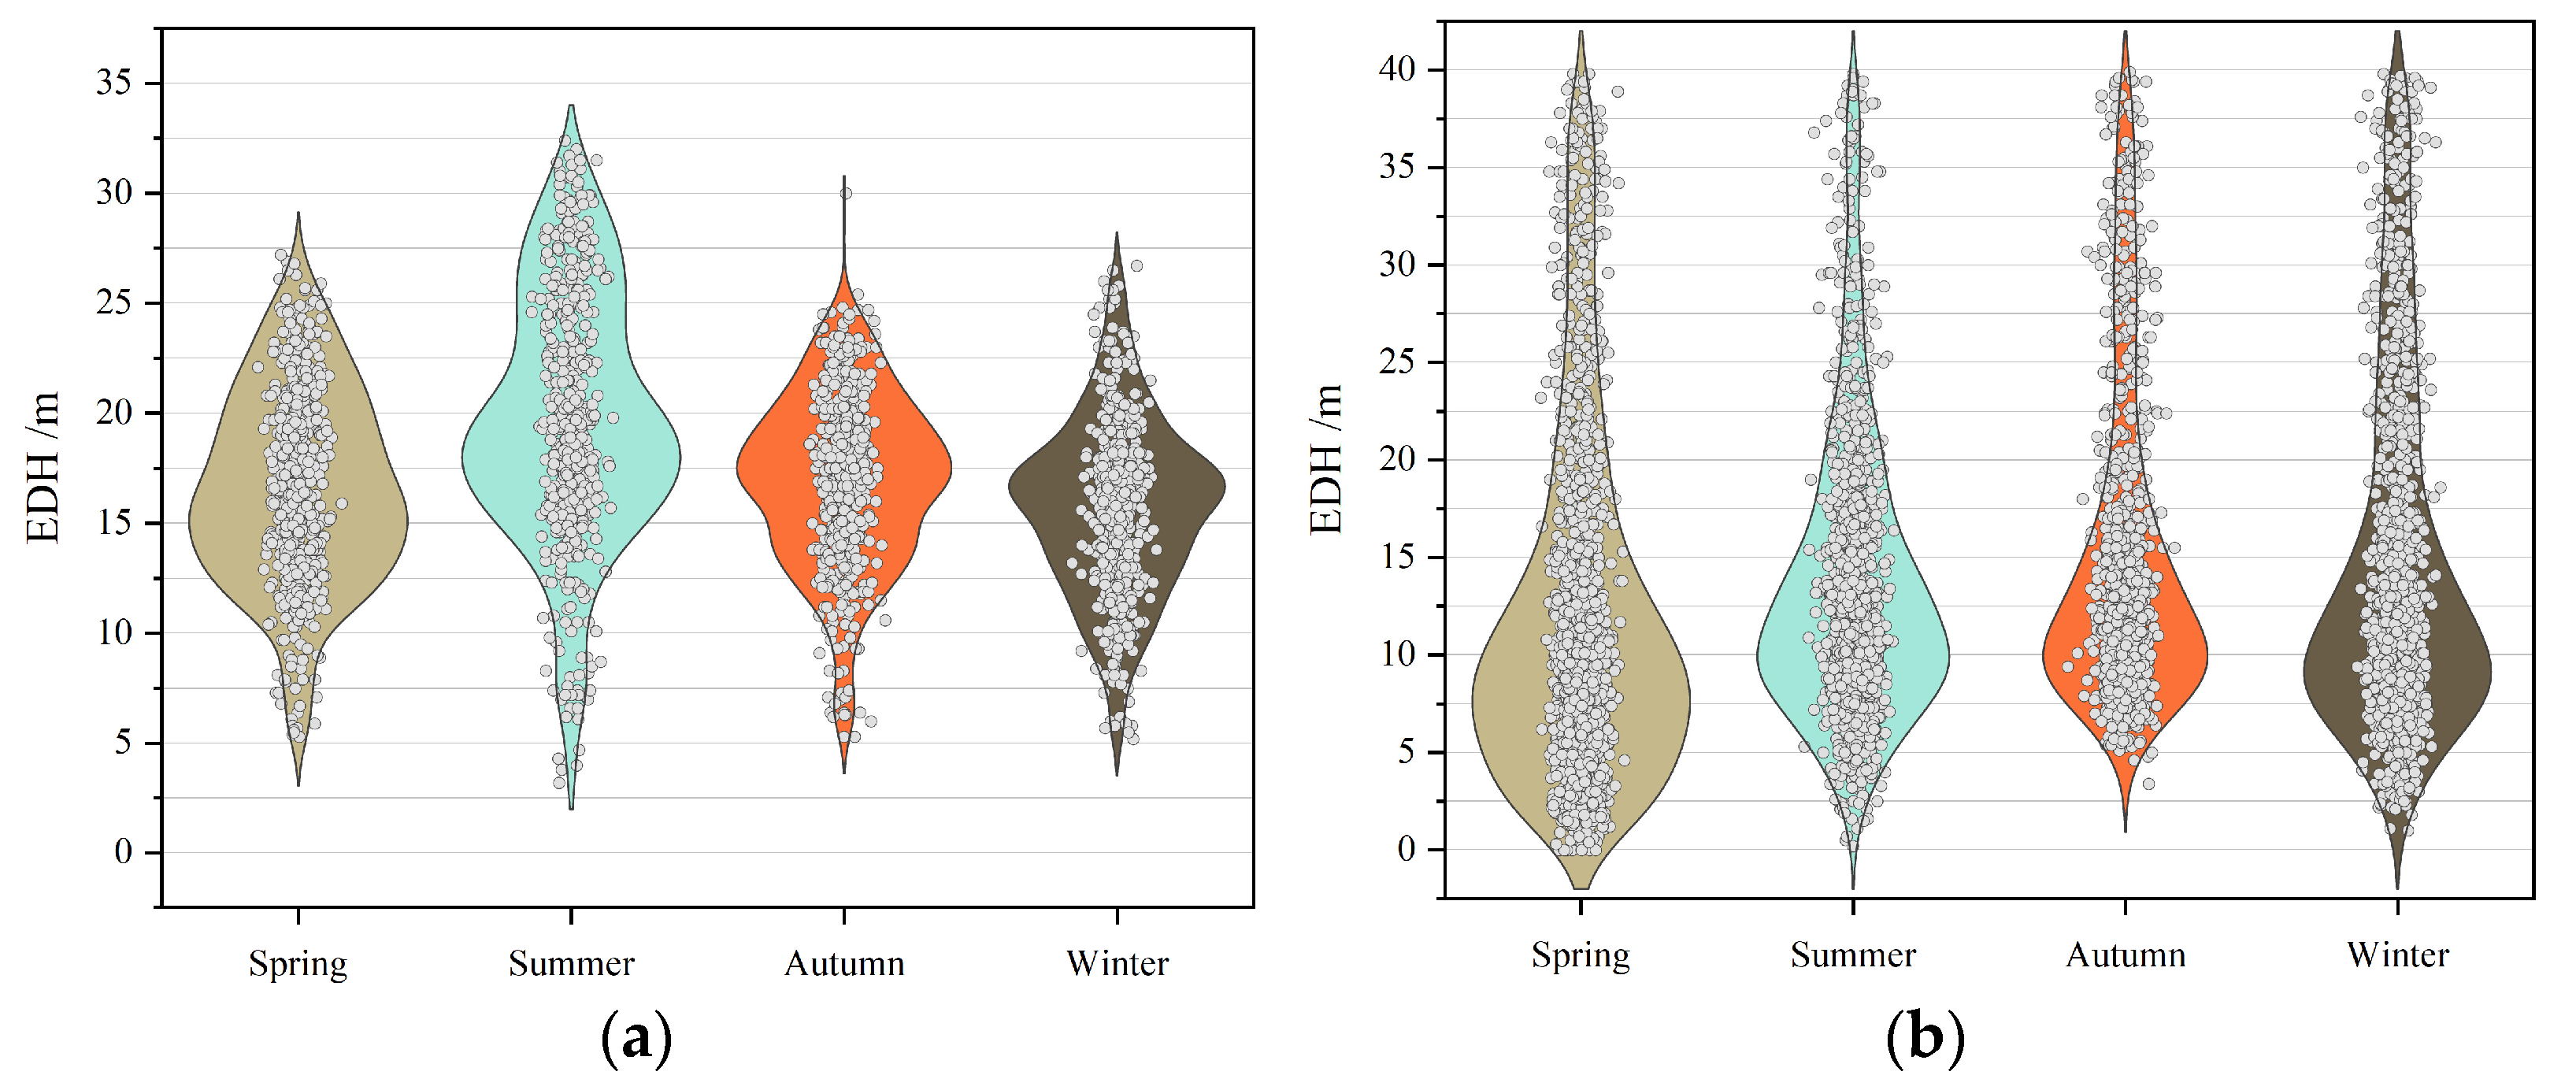
3.1. Analysis of the Evaporation Duct Characteristics
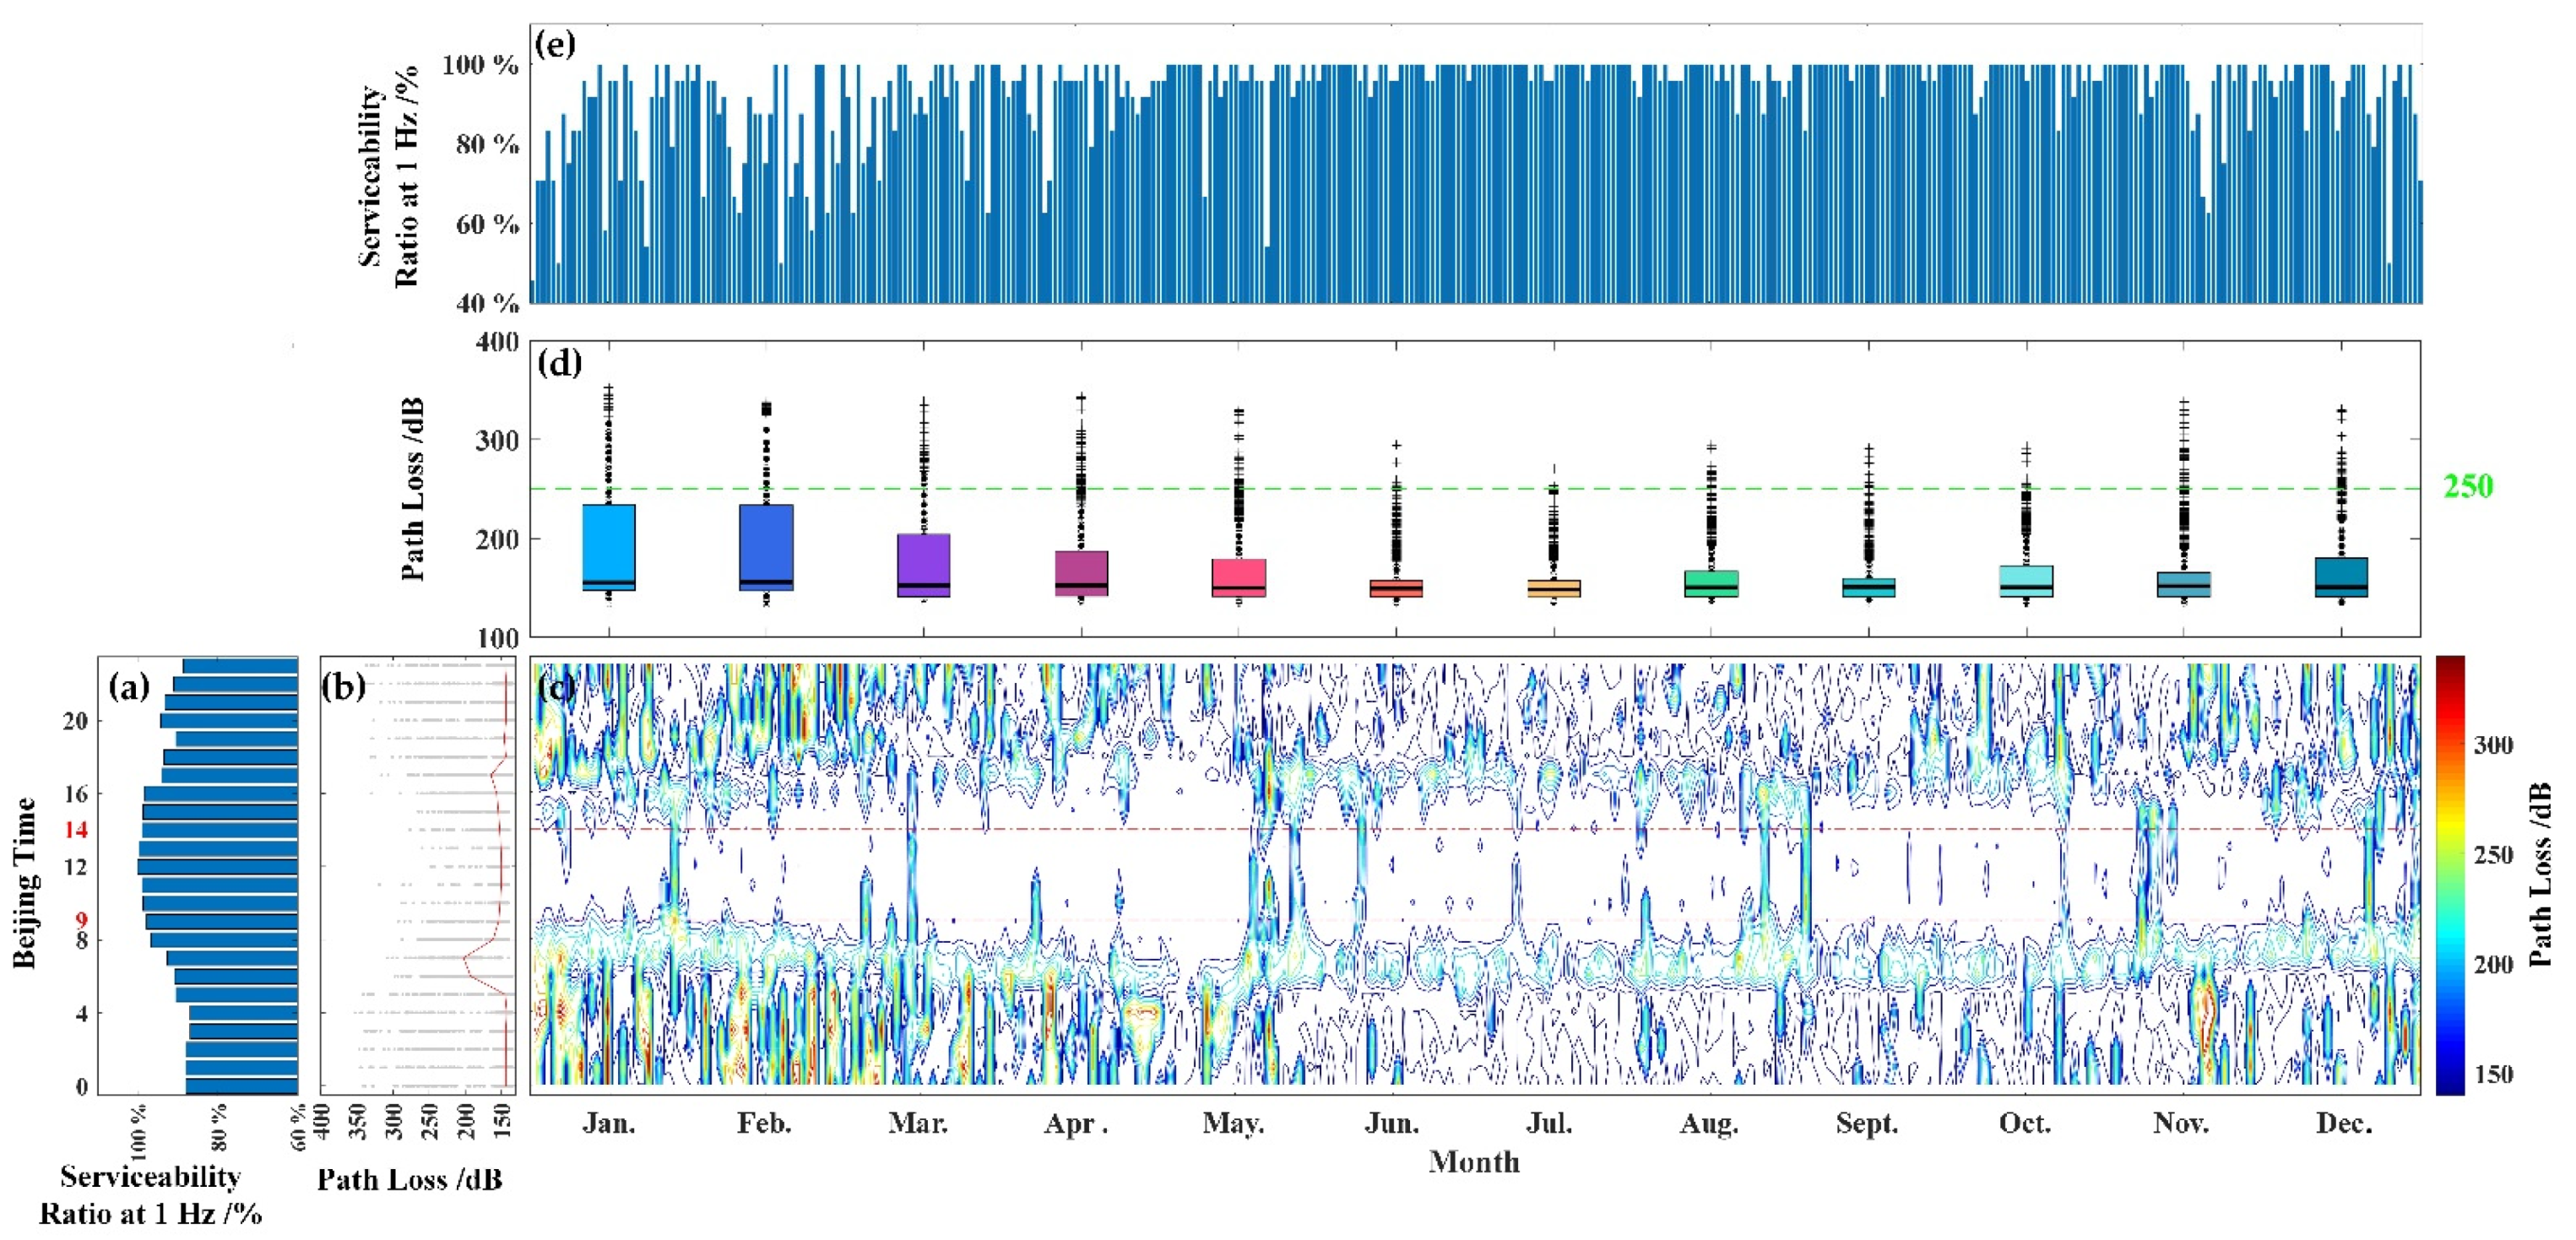
3.2. Analysis of the Communication under Evaporation Ducts
3.2.1. Propagation Effect
3.2.2. Communication Effect
4. Conclusions
Author Contributions
Funding
Institutional Review Board Statement
Informed Consent Statement
Data Availability Statement
Conflicts of Interest
References
- Li, Y.; Wang, J.; Zhang, S.; Bao, Z.; Wang, J. Efficient Coastal Communications with Sparse Network Coding. IEEE Netw. 2018, 32, 122–128. [Google Scholar] [CrossRef]
- Pensieri, S.; Viti, F.; Moser, G.; Serpico, S.B.; Maggiolo, L.; Pastorino, M.; Solarna, D.; Cambiaso, A.; Carraro, C.; Degano, C.; et al. Evaluating LoRaWAN Connectivity in a Marine Scenario. J. Mar. Sci. Eng. 2021, 9, 1218. [Google Scholar] [CrossRef]
- Wang, J.; Yang, C.; Yan, N.N. Study on digital twin channel for the B5G and 6G communication. Chin. J. Radio Sci. 2021, 36, 340–348. [Google Scholar]
- Report on the Universal Undersea Navigation/Communication Gateway Platforms Workshop. Available online: https://www.whoi.edu/science/AOPE/ael/webonrwk/workshop_home.htm (accessed on 12 May 2021).
- Dinc, E.; Akan, O.B. Channel Model for the Surface Ducts: Large-Scale Path-Loss, Delay Spread, and AOA. IEEE Trans. Antennas Propag. 2015, 63, 2728–2738. [Google Scholar] [CrossRef] [Green Version]
- Wang, Q.; Burkholder, R.J.; Yardim, C.; Xu, L.Y.; Pozderac, J.; Fernando, H.J.S.; Alappattu, D.P.; Wang, Q. Range and Height Measurement of X-Band EM Propagation in the Marine Atmospheric Boundary Layer. IEEE Trans. Antennas Propag. 2019, 67, 2063–2073. [Google Scholar] [CrossRef]
- Wang, J.; Zhou, H.; Ye, L.; Qiang, S.; Chen, X. Wireless Channel Models for Maritime Communications. IEEE Access 2018, 6, 68070–68088. [Google Scholar] [CrossRef]
- Yang, C.; Wang, J.; Ma, J.G. Exploration of X-band Communication for Maritime Applications in the South China Sea. IEEE Antennas Wirel. Propag. Lett. 2021, 21, 481–485. [Google Scholar] [CrossRef]
- Woods, G.S.; Ruxton, A.; Huddlestone-Holmes, C.; Gigan, G. High-Capacity, Long-Range, Over Ocean Microwave Link Using the Evaporation Duct. IEEE J. Ocean. Eng. 2009, 34, 323–330. [Google Scholar] [CrossRef]
- Yang, C.; Wang, J. The Investigation of Cooperation Diversity for Communication exploiting Evaporation Ducts in the South China Sea. IEEE Trans. Antennas Propag. 2021, 70, 8337–8347. [Google Scholar] [CrossRef]
- Zhao, X.F.; Wang, D.X.; Huang, S.X.; Huang, K.; Chen, J. Statistical estimations of atmospheric duct over the South China Sea and the Tropical Eastern Indian Ocean. Chin. Sci. Bull. 2013, 58, 2794–2797. [Google Scholar] [CrossRef] [Green Version]
- Lin, F.J.; Liu, C.G.; Cheng, S.; Yang, Y.P. Statistical analysis of marine atmospheric duct. Chin. J. Radio Sci. 2005, 20, 64–68. [Google Scholar]
- Ding, J.L.; Fei, J.F.; Huang, X.G.; Cheng, X.; Hu, X. Observational occurrence of tropical cyclone ducts from GPS dropsonde data. J. Appl. Meteorol. Climatol. 2013, 52, 221–236. [Google Scholar] [CrossRef]
- Bean, B.R.; Dutton, E.J. Radio Meteorology; Technical Report Archive & Image Library: Mineola, NY, USA, 1966. [Google Scholar]
- Wang, H.; Wu, Z.; Kang, S.; Zhao, Z. Monitoring the Marine Atmospheric Refractivity Profiles by Ground-Based GPS Occultation. IEEE Geosci. Remote Sens. Lett. 2013, 10, 962–965. [Google Scholar] [CrossRef]
- Yang, C.; Shi, Y.; Wang, J.; Feng, F. Regional Spatiotemporal Statistical Database of Evaporation Ducts Over the South China Sea for Future Long-Range Radio Application. IEEE J. Sel. Top. Appl. Earth Obs. Remote Sens. 2022, 15, 6432–6444. [Google Scholar] [CrossRef]
- Guan, B. The "Counter-Wind" Current in the Southeast China Sea in Winter; Ocean University of China Press: Qingdao, China, 2002. [Google Scholar]
- Lian, E.; Yang, S.; Wu, H.; Yang, C.; Li, C.; Liu, J.T. Kuroshio subsurface water feeds the wintertime Taiwan Warm Current on the inner East China Sea shelf. J. Geophys. Res. Oceans 2016, 121, 4790–4803. [Google Scholar] [CrossRef] [Green Version]
- Shi, Y.; Zhang, Q.; Wang, S.; Yang, K.; Ma, Y. Impact of Typhoon on Evaporation Duct in the Northwest Pacific Ocean. IEEE Access 2019, 7, 109111–109119. [Google Scholar] [CrossRef]
- Saha, S. NCEP Climate Forecast System Version 2 (CFSv2) Monthly Products. In Research Data Archive at the National Center for Atmospheric Research; Computational and Information Systems Laboratory: College Park, MD, USA, 2012. [Google Scholar]
- Alappattu, D.P.; Wang, Q.; Kalogiros, J. Anomalous propagation conditions over eastern Pacific Ocean derived from MAGIC data. Radio Sci. 2016, 51, 1142–1156. [Google Scholar] [CrossRef] [Green Version]
- Paulus, R.A. Practical application of an evaporation duct model. Radio Sci. 1985, 20, 887–896. [Google Scholar] [CrossRef]
- Musson-Genon, L.; Gauthier, S.; Bruth, E. A simple method to determine evaporation duct height in the sea surface boundary layer. Radio Sci. 1992, 27, 635–644. [Google Scholar] [CrossRef]
- Babin, S.M.; Young, G.S.; Carton, J.A. A new model of the oceanic evaporation duct. J. Appl. Meteorol. 1997, 36, 193–204. [Google Scholar] [CrossRef]
- Frederickson, P.A.; Davidson, K.L.; Goroch, A.K. Operational Bulk Evaporation Duct Model for MORIAH Version 1.2; Naval Postgraduate School: Monterey, CA, USA, 2000. [Google Scholar]
- Babin, S.M.; Dockery, G.D. LKB-Based Evaporation Duct Model Comparison with Buoy Data. J. Appl. Meteorol. 2002, 41, 434–446. [Google Scholar] [CrossRef]
- Fairall, C.W.; Bradley, E.F.; Hare, J.E.; Grachev, A.A.; Edson, J.B. Bulk parameterization of air-sea fluxes: Updates and verification for the COARE algorithm. J. Clim. 2003, 16, 571–591. [Google Scholar] [CrossRef]
- Burk, S.D.; Haack, T.; Rogers, L.T.; Wagner, L.J. Island Wake Dynamics and Wake Influence on the Evaporation Duct and Radar Propagation. J. Appl. Meteorol. Climatol. 2003, 42, 349–367. [Google Scholar] [CrossRef]
- Tian, B.; Han, L.; Kong, D.W.; Liu, C.G.; Zhou, M.; Yu, M.H. Study on Wireless Detection Using the Pseudo-Refractivity Model. In Proceedings of the 2012 8th International Conference on Wireless Communications, Networking and Mobile Computing, Shanghai, China, 21–23 September 2012; pp. 1–4. [Google Scholar]
- Ozgun, O.; Sahin, V.; Erguden, M.E.; Apaydin, G.; Yilmaz, A.E.; Kuzuoglu, M.; Sevgi, L. PETOOL v2.0: Parabolic Equation Toolbox with evaporation duct models and real environment data. Comput. Phys. Commun. 2020, 256, 107454. [Google Scholar] [CrossRef]
- Dockery, G.D.; Kuttler, J.R. An improved impedance-boundary algorithm for Fourier split-step solutions of the parabolic wave equation. IEEE Trans. Antennas Propag. 1996, 44, 1592–1599. [Google Scholar] [CrossRef]
- Ramazannia Tuloti, S.H.; Rezaei, P.; Tavakkol Hamedani, F. High-Efficient Wideband Transmitarray Antenna. IEEE Antennas Wirel. Propag. Lett. 2018, 17, 817–820. [Google Scholar] [CrossRef]
- R&S®FSW Signal and Spectrum Analyzer, Product Brochure Version 11.00. Available online: https://cdn.rohde-schwarz.com.cn/pws/dl_downloads/dl_common_library/dl_brochures_and_datasheets/pdf_1/FSW_bro_en_5215-6749-12_v1100.pdf (accessed on 4 March 2022).


Publisher’s Note: MDPI stays neutral with regard to jurisdictional claims in published maps and institutional affiliations. |
© 2022 by the authors. Licensee MDPI, Basel, Switzerland. This article is an open access article distributed under the terms and conditions of the Creative Commons Attribution (CC BY) license (https://creativecommons.org/licenses/by/4.0/).
Share and Cite
Yang, C.; Shi, Y.; Wang, J. The Preliminary Investigation of Communication Characteristics Using Evaporation Duct across the Taiwan Strait. J. Mar. Sci. Eng. 2022, 10, 1493. https://doi.org/10.3390/jmse10101493
Yang C, Shi Y, Wang J. The Preliminary Investigation of Communication Characteristics Using Evaporation Duct across the Taiwan Strait. Journal of Marine Science and Engineering. 2022; 10(10):1493. https://doi.org/10.3390/jmse10101493
Chicago/Turabian StyleYang, Cheng, Yafei Shi, and Jian Wang. 2022. "The Preliminary Investigation of Communication Characteristics Using Evaporation Duct across the Taiwan Strait" Journal of Marine Science and Engineering 10, no. 10: 1493. https://doi.org/10.3390/jmse10101493
APA StyleYang, C., Shi, Y., & Wang, J. (2022). The Preliminary Investigation of Communication Characteristics Using Evaporation Duct across the Taiwan Strait. Journal of Marine Science and Engineering, 10(10), 1493. https://doi.org/10.3390/jmse10101493