
Study on the Cumulative Effects of Using a High-Efficiency Turbocharger and Biodiesel B20 Fuelling on Performance and Emissions of a Large Marine Diesel Engine


Abstract
:1. Introduction
2. Materials and Methods
| cumulative heat release for the mixture controlled combustion [kJ] | |
| combustion constant [kJ/kg/deg CA] | |
| mixing rate constant [s] | |
| local density of turbulent kinetic energy [m2/s2] | |
| vaporized fuel mass (actual) [kg] | |
| lower heating value [kJ/kg] | |
| cylinder volume [m3] | |
| crank angle [deg CA] | |
| mass fraction of available oxygen (aspirated and in EGR) at SOI [-] | |
| EGR influence constant [-] |
| kinetic jet energy [J] | |
| turbulent energy production constant [-] | |
| dissipation constant; ‘Revised’: [J−0.5/s]; ‘Default’: [1/s] | |
| injected fuel mass (actual) [kg] | |
| injection velocity [m/s] | |
| effective nozzle hole area [m2] | |
| fuel density [kg/m3] | |
| engine speed [rpm] | |
| stoichiometric mass of fresh charge [kg/kg] | |
| air excess ratio for diffusion burning [-] | |
| time [s] |
3. Results and Discussions
4. Conclusions
- -
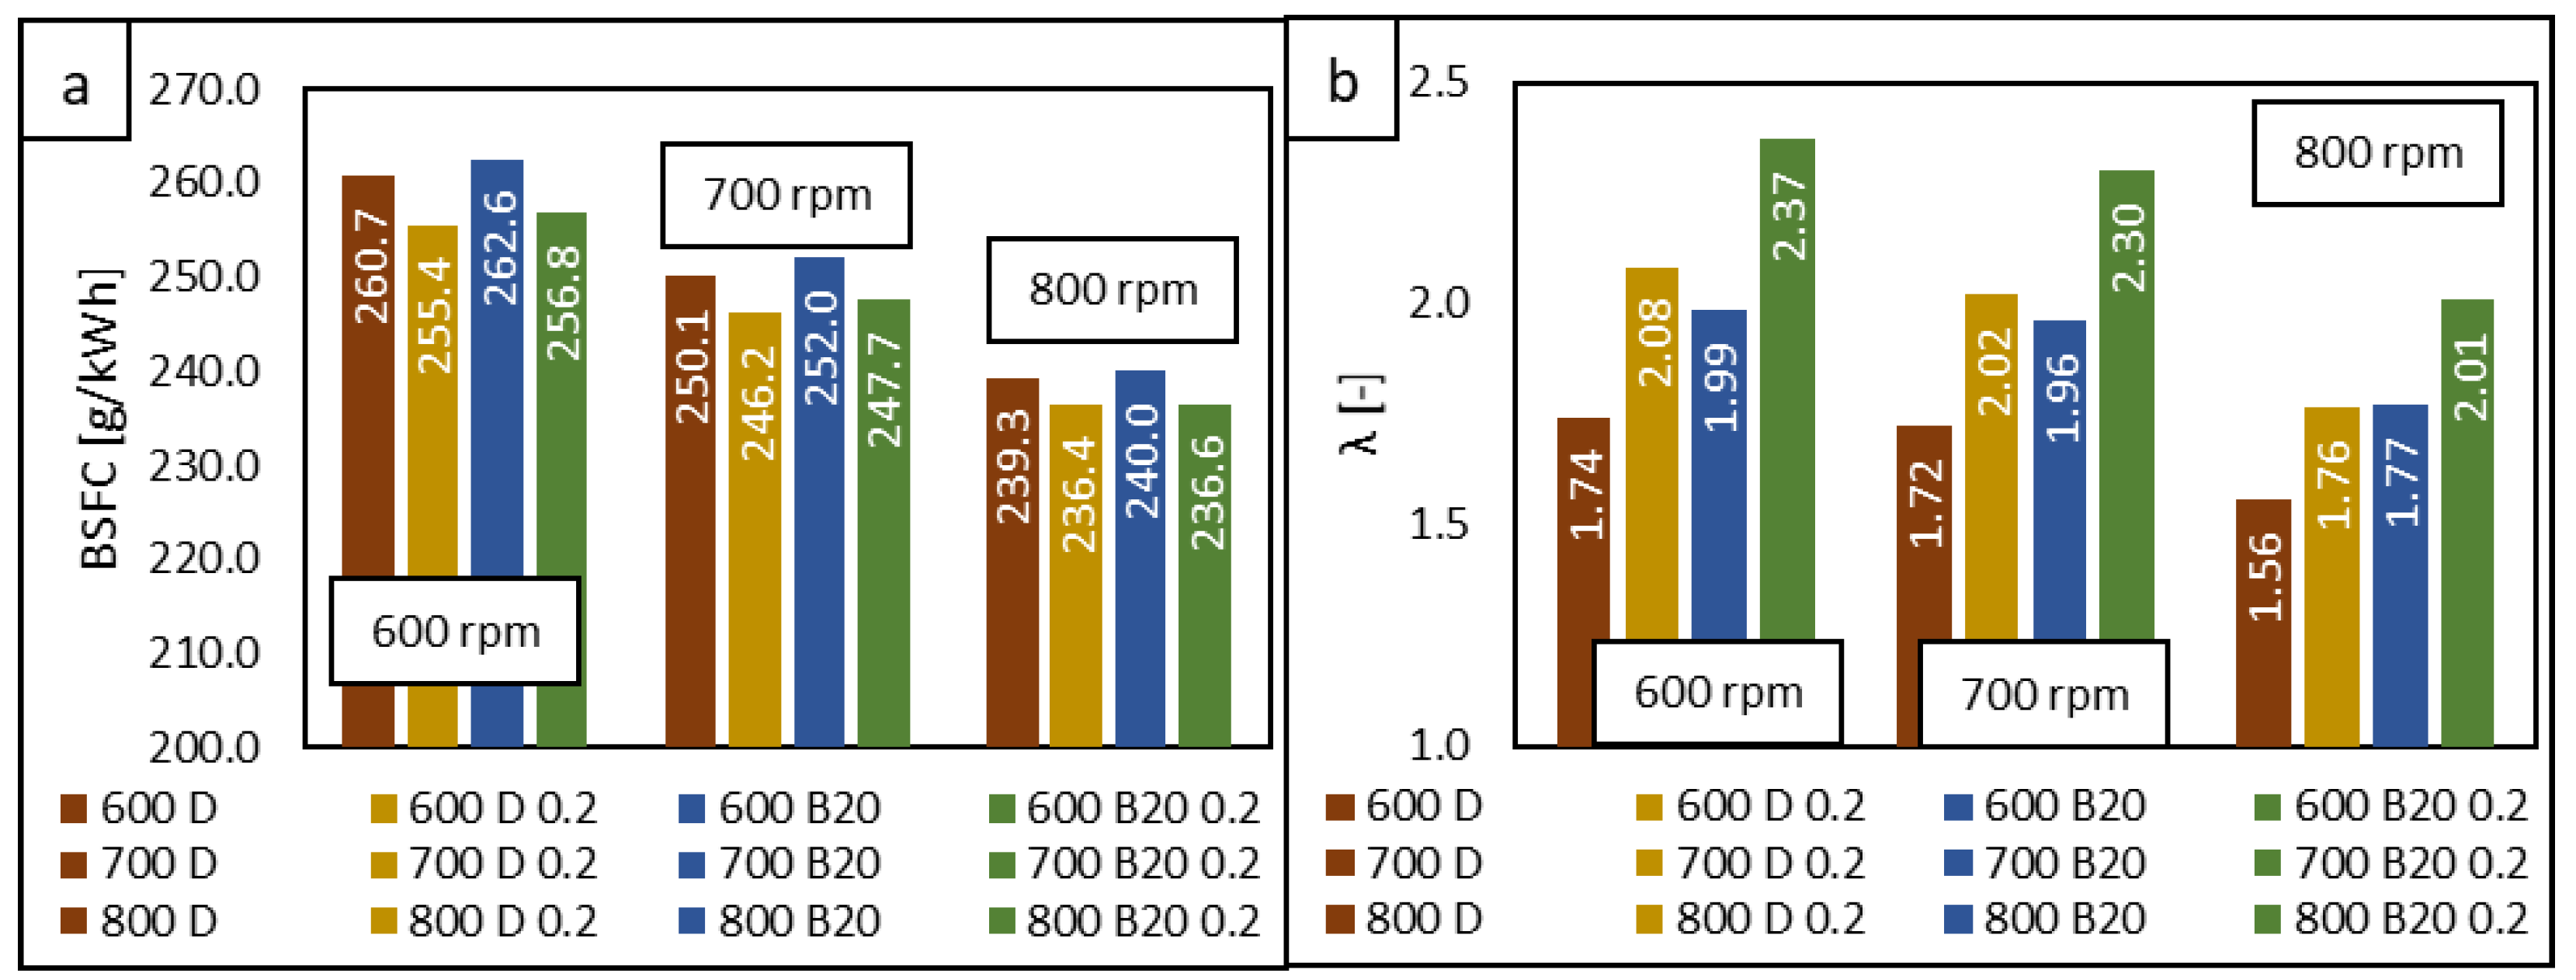
- The engine operation with a high-efficiency turbocharger having improved efficiency by 0.5% and higher compression pressure ratio by 0.2 relative to the original turbocharger specifications enhances the engine performance and efficiency by around 1.5% regardless of the fuel used for engine fuelling,
- -
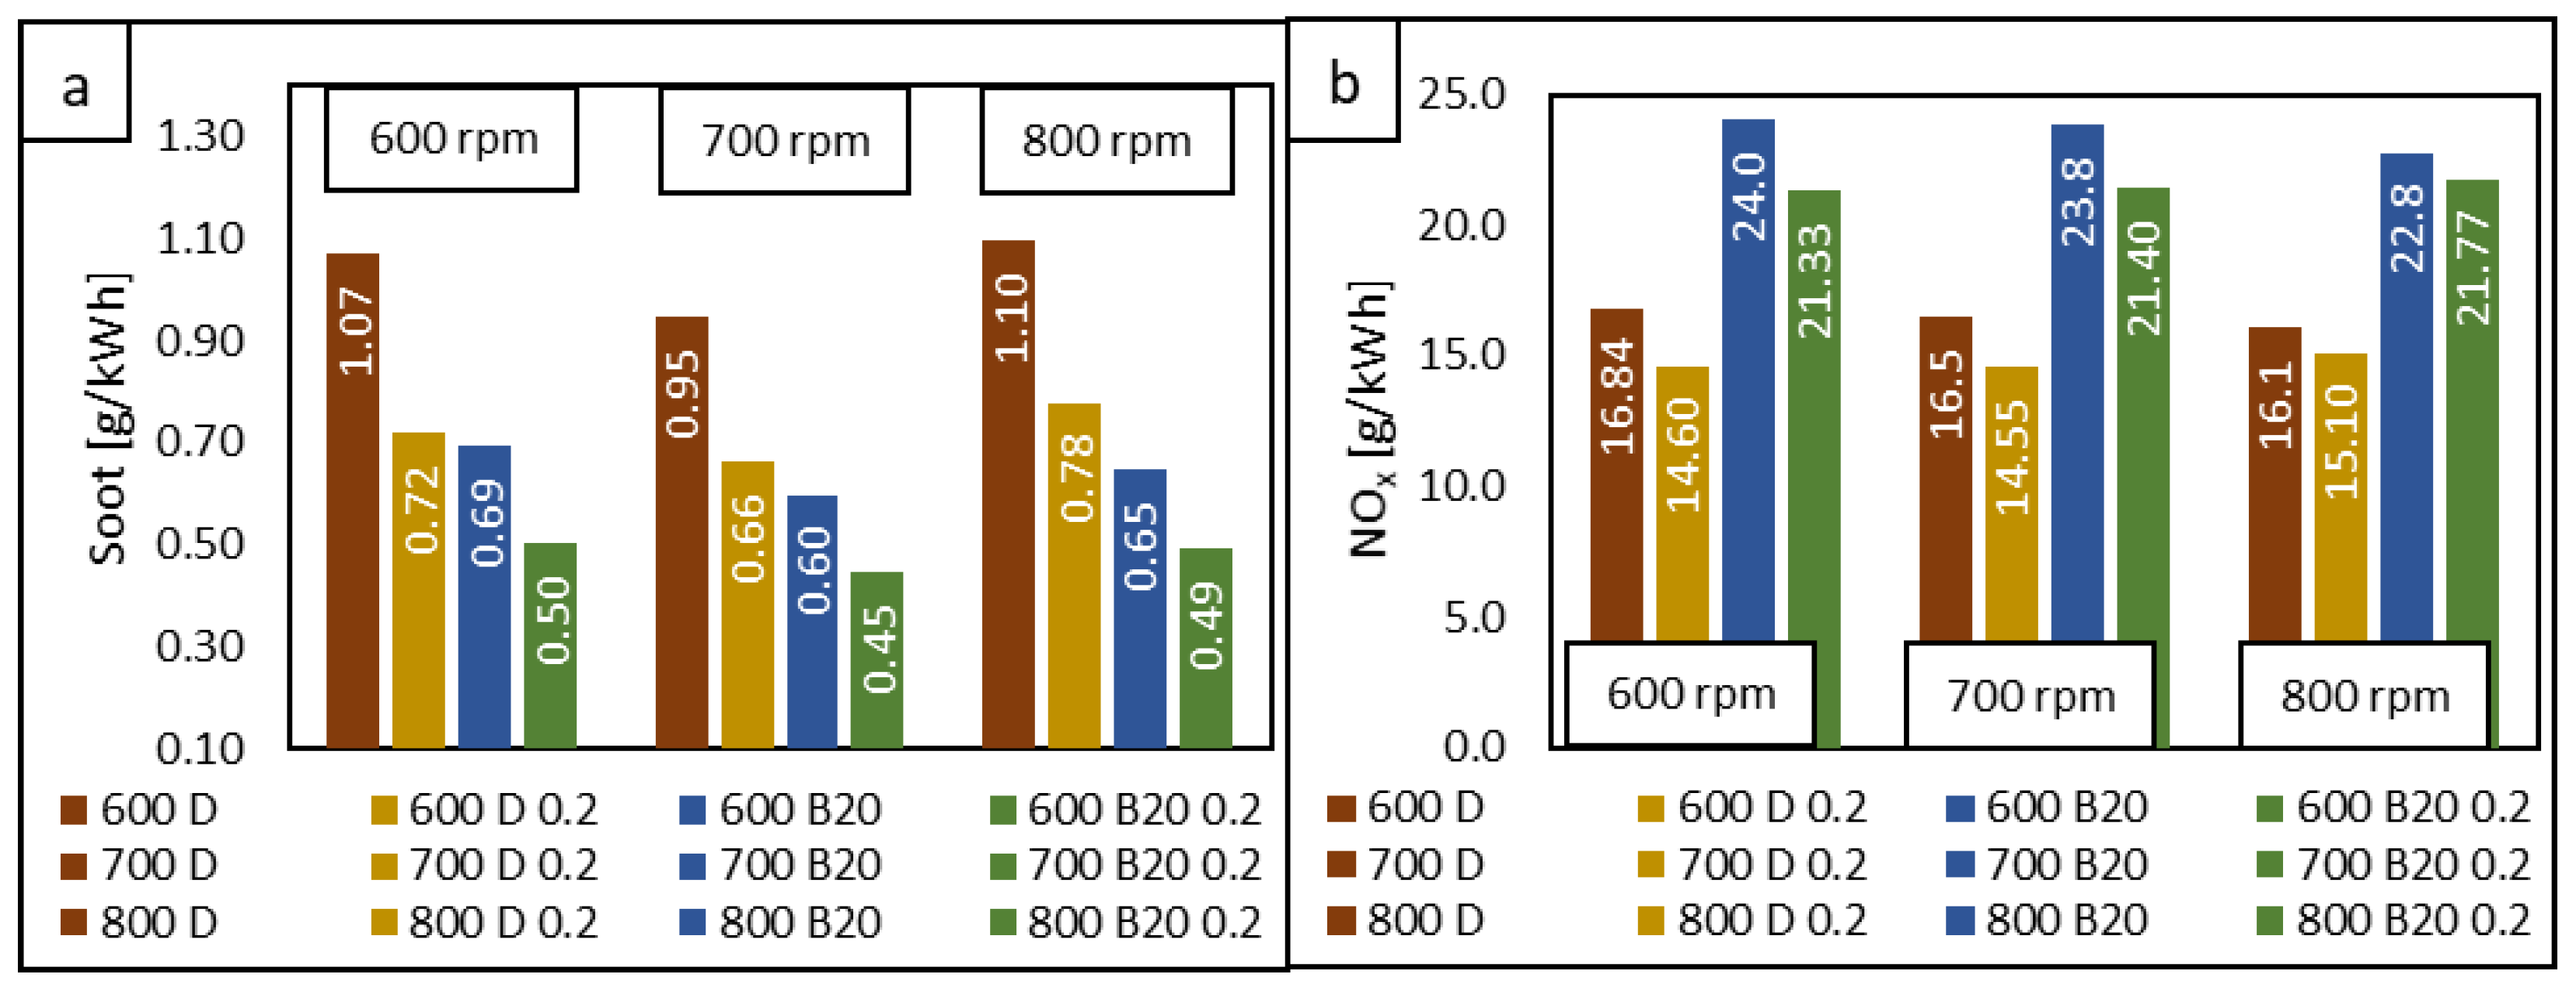
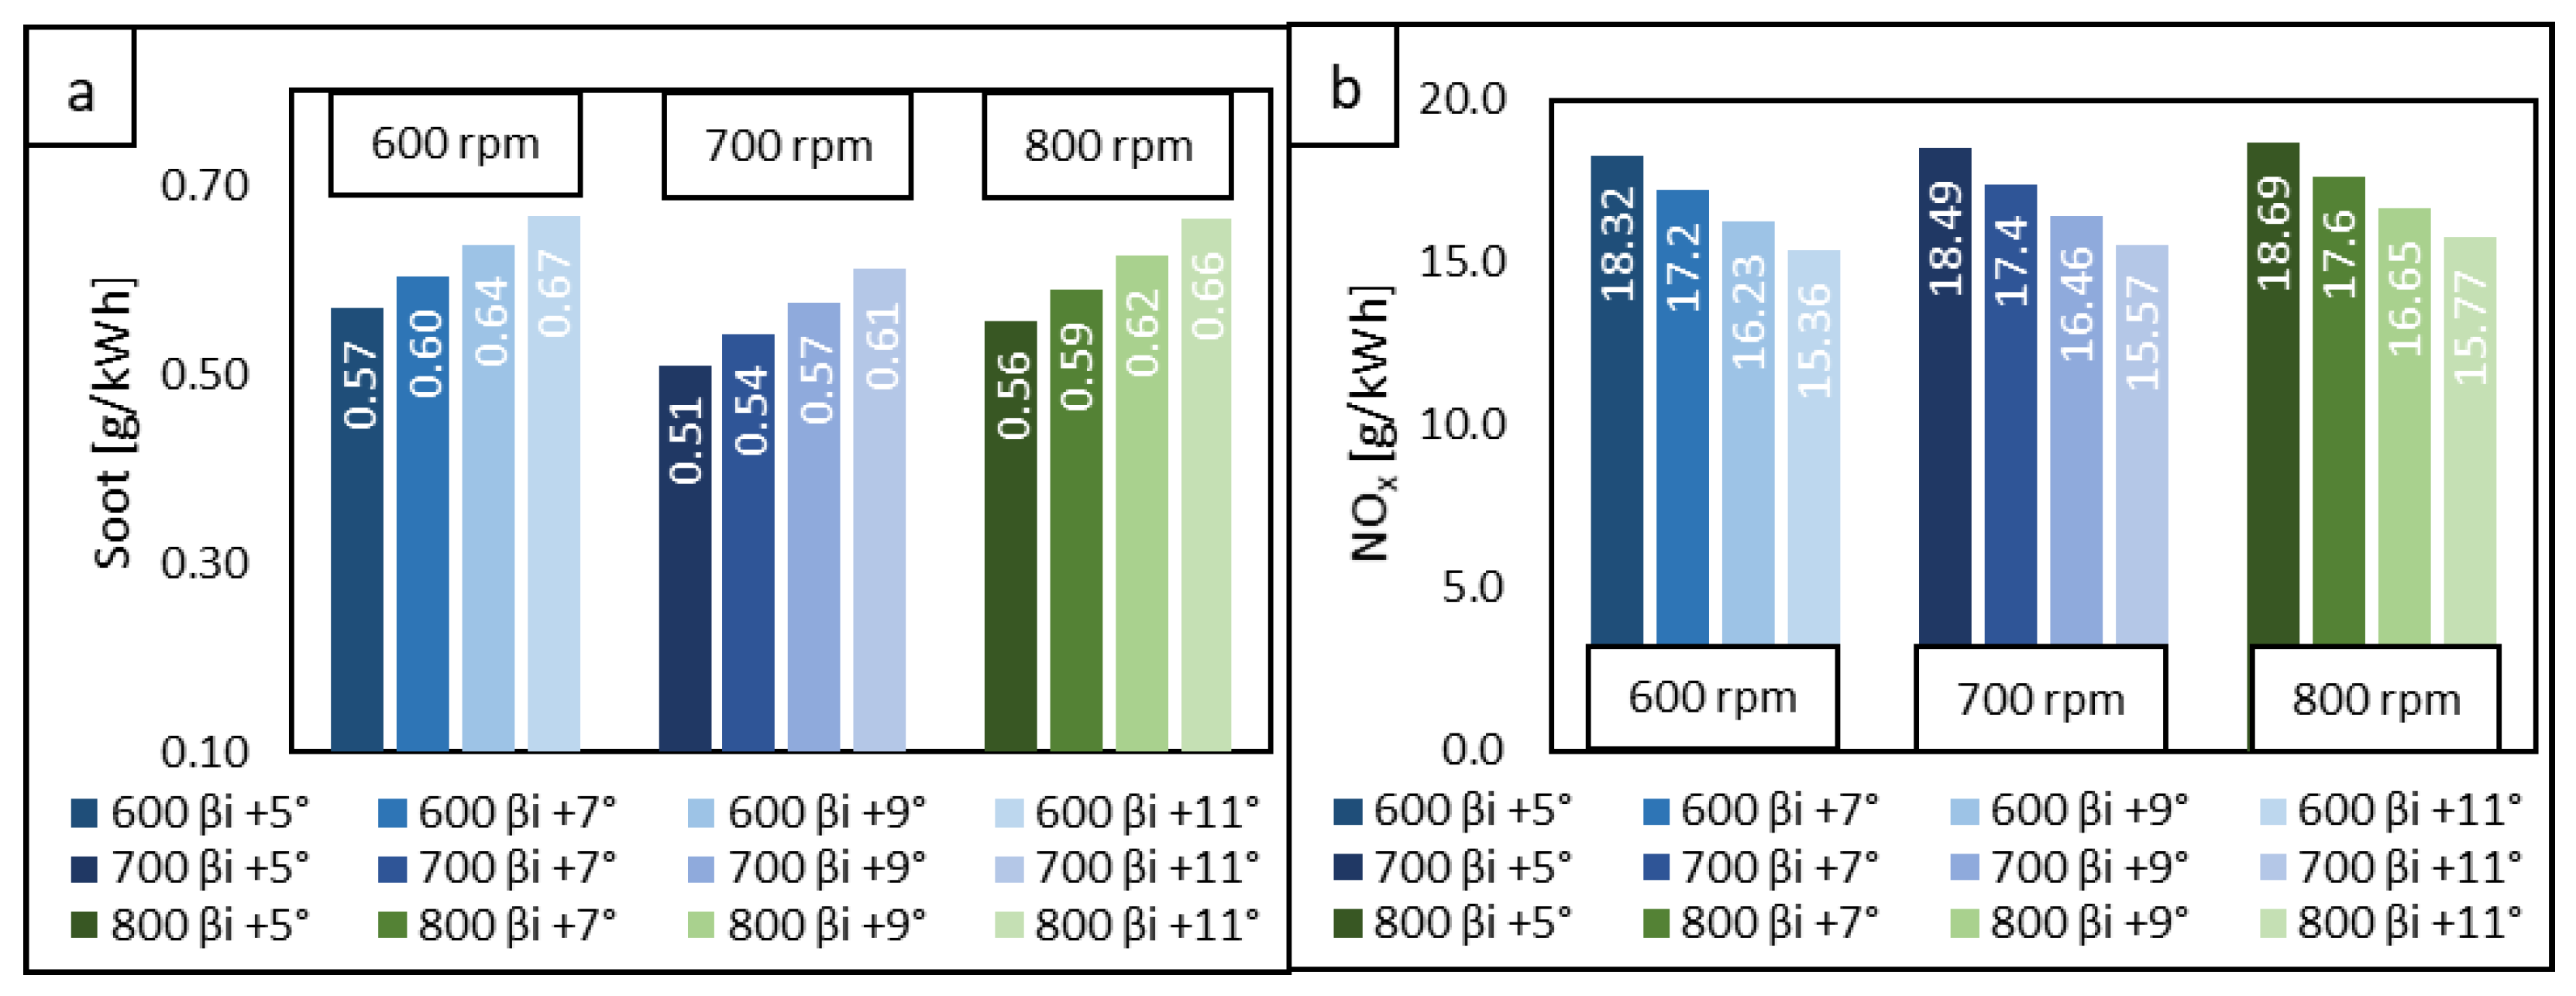
- Soot and NOx emissions are reduced by around 30% and 10% regardless of the fuel used for engine operation,
- -
- The substitution of the classical diesel fuel with biodiesel B20 mitigates the engine output and efficiency by around 0.8% for the original turbocharger operation, while the soot emissions are reduced by 37% and NOx increased by 43%,
- -
- The cumulative effects of using a high-efficiency turbocharger and biodiesel B20 for the original engine adjustments of injection timings are related to the engine performance and efficiency increasing by 1.2%, soot emissions reduction by 53% and NOx emissions increasing by 21%,
- -
- At the optimized injection timing, the cumulative effects are still an important reduction of soot by 45% and a small increase of NOx by 5% for practically the same engine performance obtained on diesel fuel operation,
- -
- When a slight derating of 3% for the engine output is accepted, then a simultaneous reduction of soot by 37% and NOx by 6% could be reached.
- ▪
- The properties of B20 were calculated starting from the properties of the conventional diesel fuel and biofuel B100;
- ▪
- The properties of B100 were considered for rapeseed oil;
- ▪
- The amount of fuel injected was kept constant for all the simulation conditions;
- ▪
- The retarding of fuel injection was not verified in the experimental activities where experimental data for model calibration was recorded.
Author Contributions
Funding
Institutional Review Board Statement
Informed Consent Statement
Acknowledgments
Conflicts of Interest
Nomenclature
| IMO | International Maritime Organization |
| Me | Brake torque |
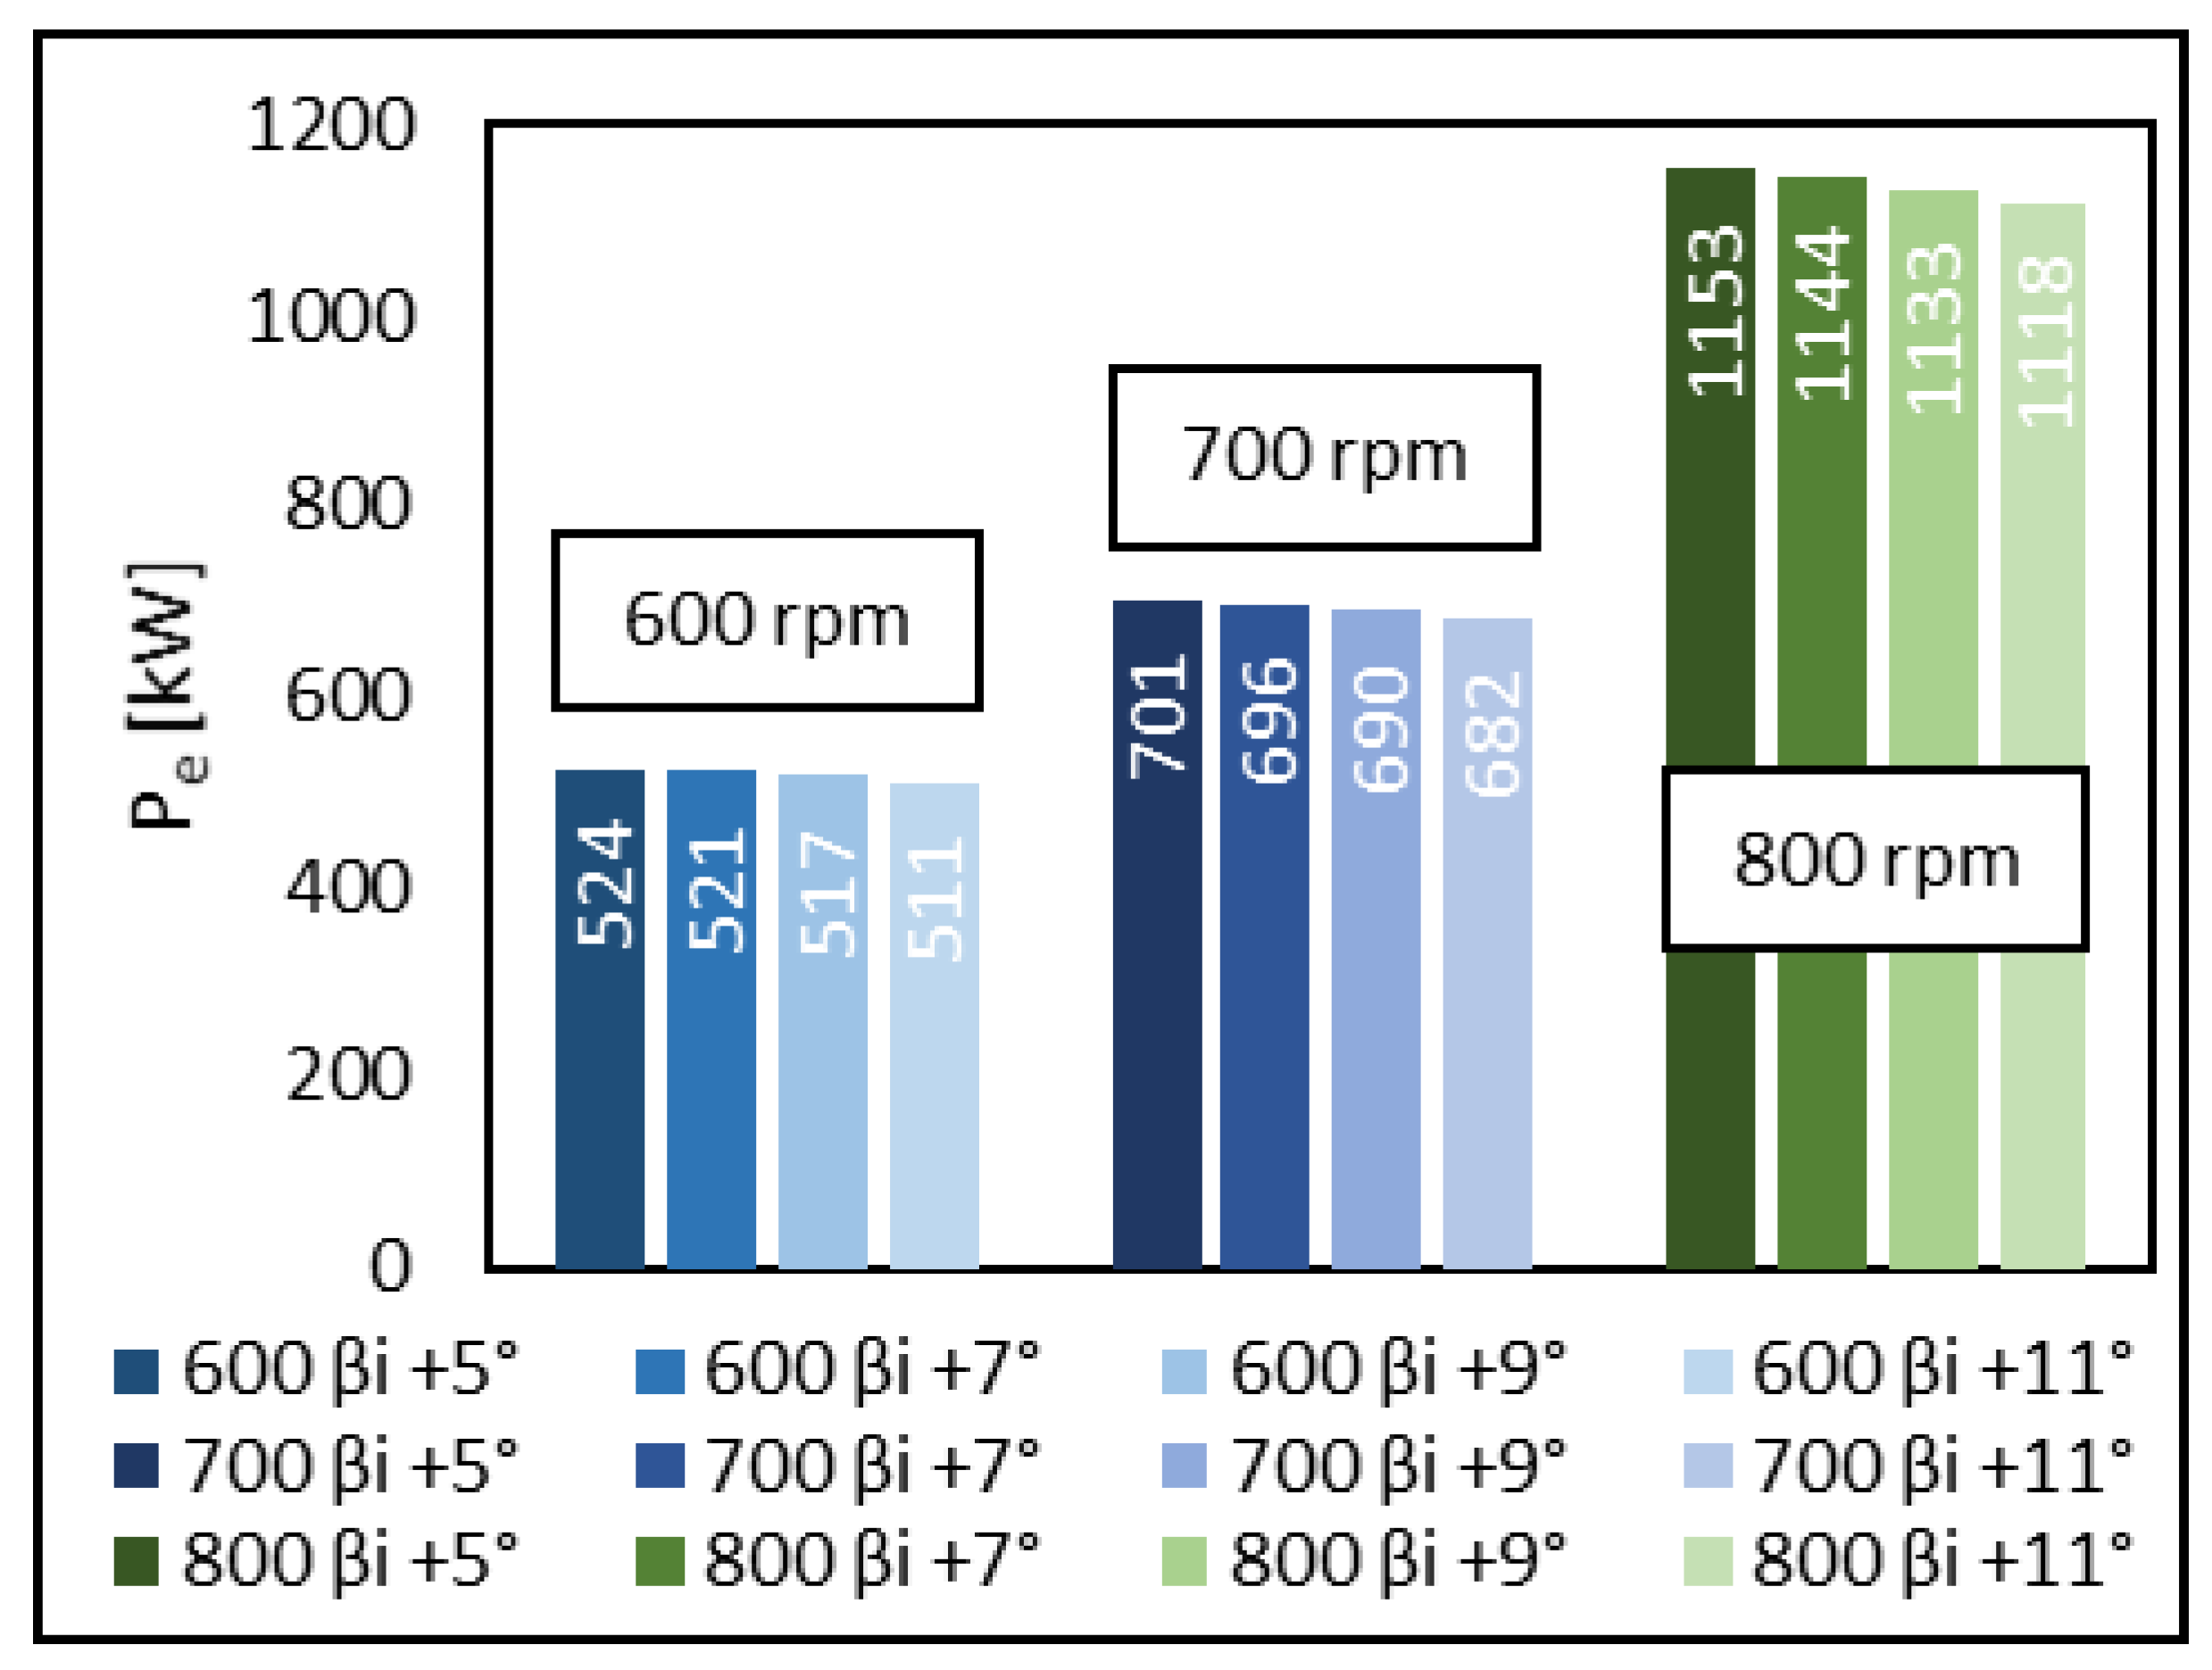
| Pe | Brake power |
| CO | Carbon monoxide |
| CO2 | Carbon dioxide |
| HC | Unburned hydrocarbons |
| NOx | Nitrous oxides nitrogen oxides |
| PM | Particulate matter |
| BSFC | Brake specific fuel consumption |
| CA | Crank angle |
| B20 | Biodiesel with 20% vol biofuel in diesel |
| LHV | Lower heating value |
| Λ | Relative air–fuel ratio |
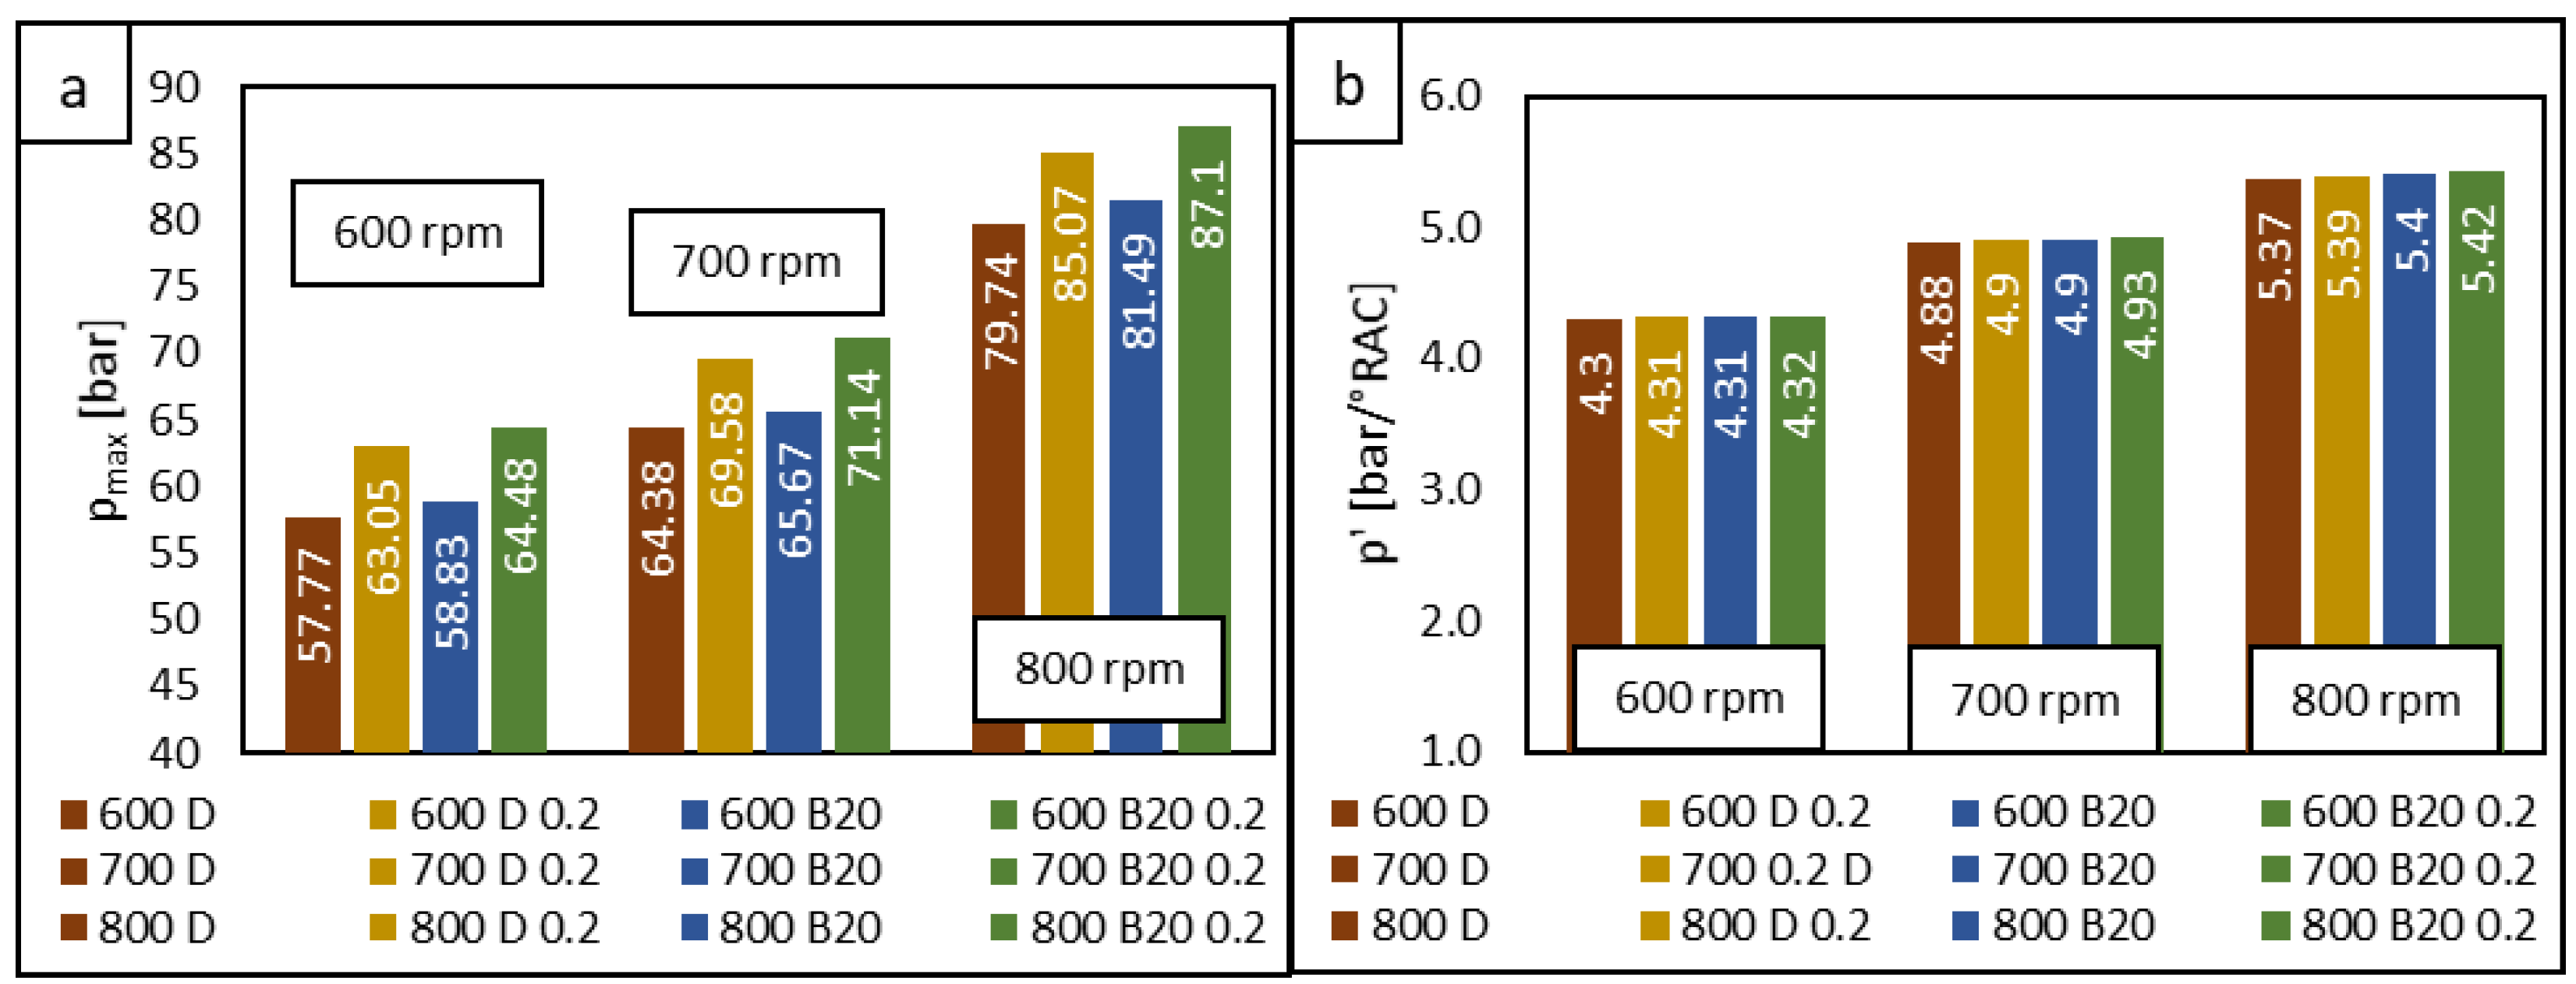
| pmax | Maximum pressure |
| p’ | Peak pressure rise rate |
| EGR | Exhaust gas recirculation |
| VGT | Variable geometry turbine |
| VNT | Variable nozzles turbine |
| IGV | Inlet guided vane |
| VDG | Variable diffuser geometry |
| CFD | Computation fluid dynamics |
| ICE | Internal combustion engine |
| PMC | Premixed combustion |
| MCC | Mixing controlling combustion |
| TKE | Turbulent kinetic energy |
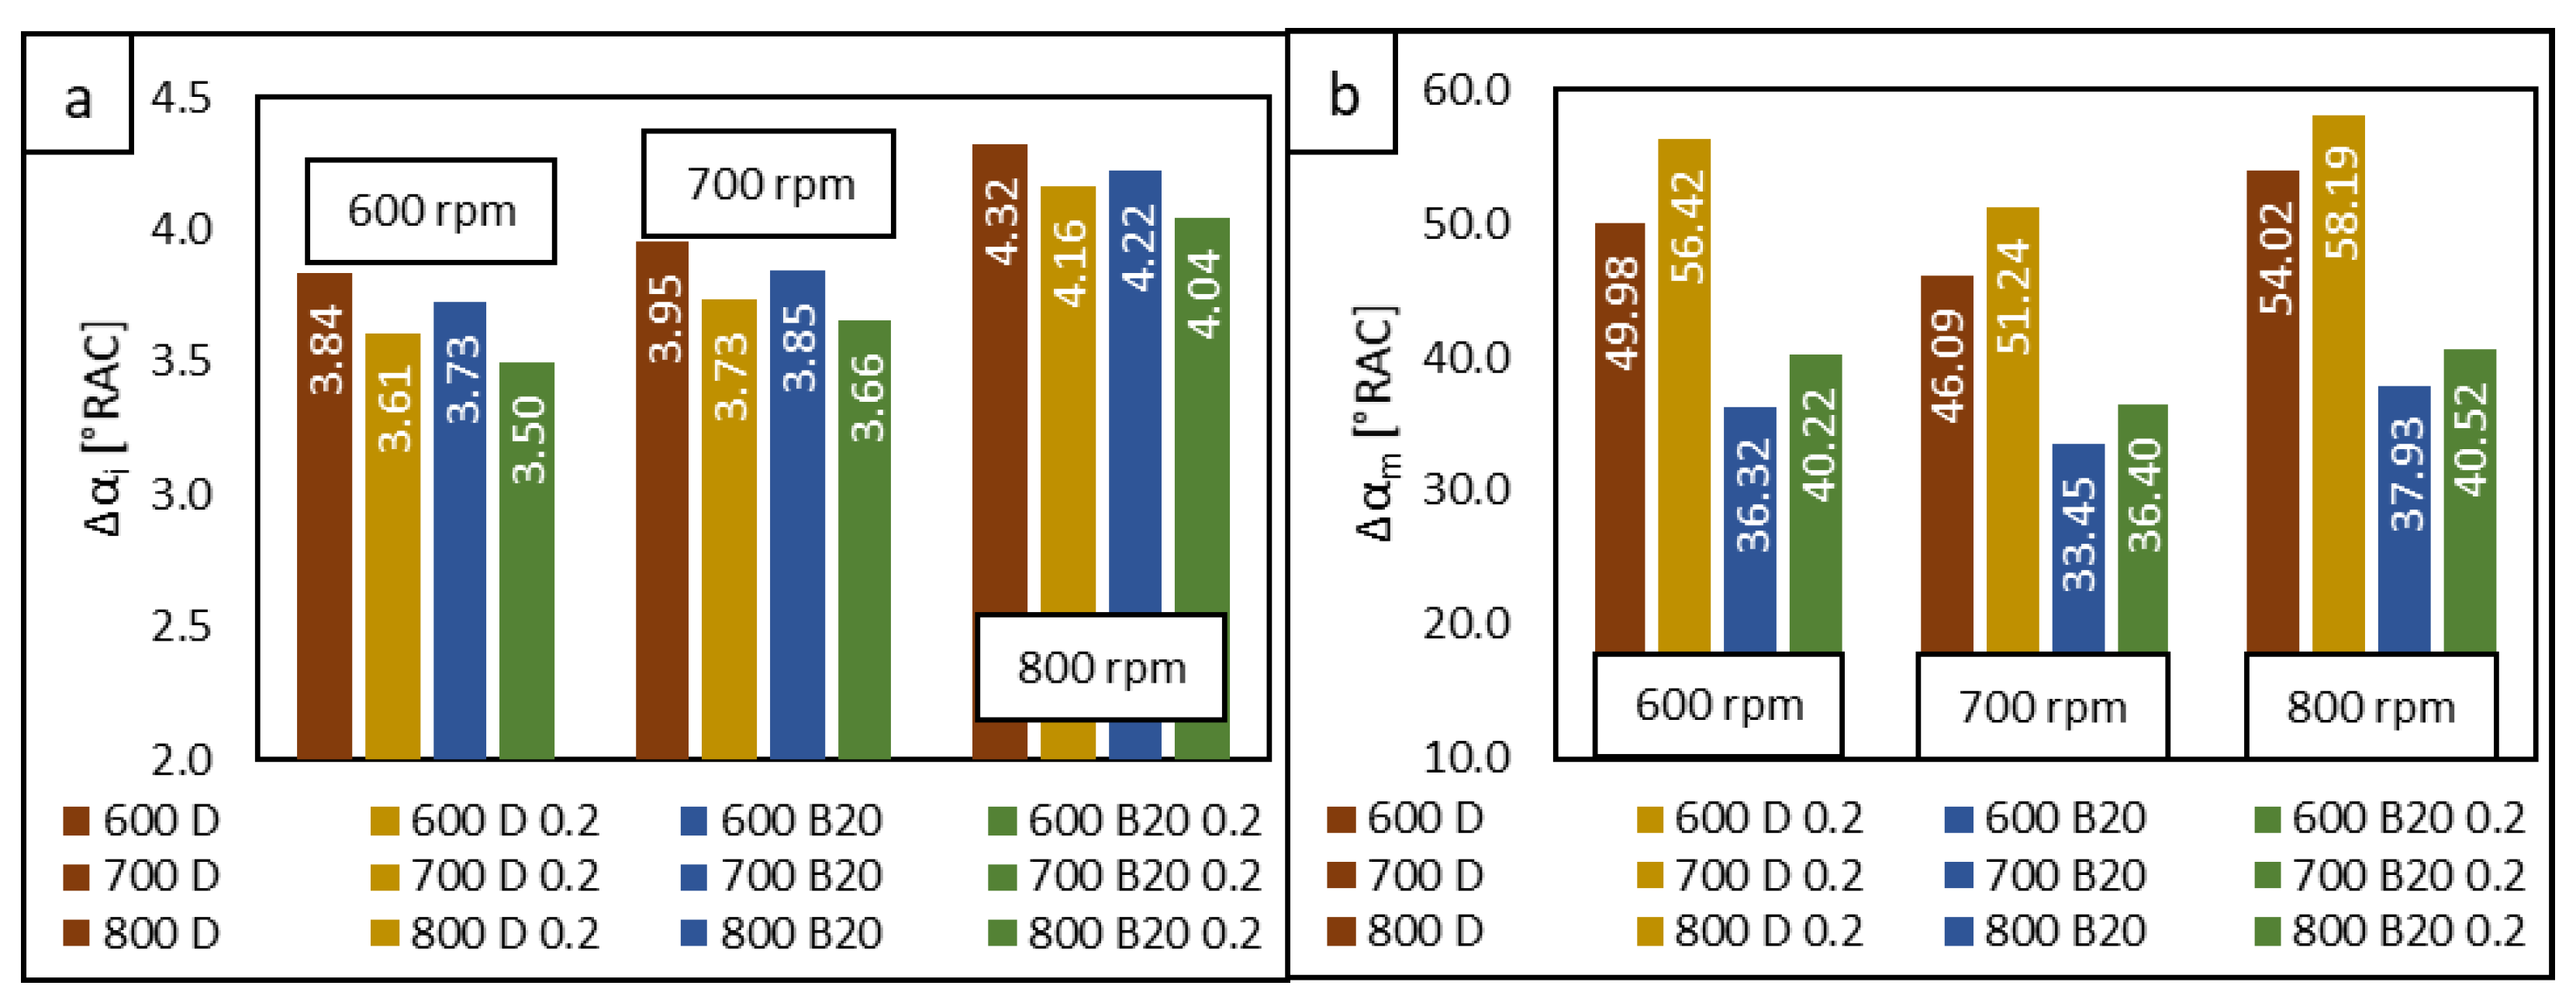
| Δαi | Initial phase of combustion |
| Δαm | Main phase of combustion |
| βi | Original injection timing |
References
- Vedachalam, S.; Baquerizo, N.; Dalai, A.K. Review on impacts of low sulfur regulations on marine fuels and compliance options. Fuel 2022, 310, 122243. [Google Scholar] [CrossRef]
- Psaraftis, H.N. Decarbonization of maritime transport: To be or not to be? Marit. Econ. Logist. 2019, 21, 353–371. [Google Scholar] [CrossRef]
- Czermański, E.; Pawłowska, B.; Oniszczuk-Jastrząbek, A.; Cirella, G.T. Decarbonization of Maritime Transport: Analysis of External Costs. Front. Energy Res. 2020, 8, 28. [Google Scholar] [CrossRef] [Green Version]
- Povarov, V.G.; Efimov, I.; Smyshlyaeva, K.I.; Rudko, V.A. Application of the UNIFAC Model for the Low-Sulfur Residue Marine Fuel Asphaltenes Solubility Calculation. J. Mar. Sci. Eng. 2022, 10, 1017. [Google Scholar] [CrossRef]
- Feneley, A.J.; Pesiridis, A.; Andwari, A.M. Variable Geometry Turbocharger Technologies for Exhaust Energy Recovery and Boosting—A Review. Renew. Sustain. Energy Rev. 2017, 71, 959–975. [Google Scholar] [CrossRef]
- Klassen, H.A.; Wood, J.R.; Schumann, L.F. Experimental Performance of a 13.65-Centimeter-Tip-Diameter Tandembladed Sweptback Centrifugal Compressor Designed for a Pressure Ratio of 6; NASA Center for AeroSpace Information (CASI), NASA-TP-1091; NASA: Washington, DC, USA, 1977; p. 1101.
- Minasyan, A.; Bradshaw, J.; Pesyridis, A. Design and Performance Evaluation of an AxialInflow Turbocharger Turbine. Energies 2018, 11, 278. [Google Scholar] [CrossRef] [Green Version]
- Tetu, L.G. Improving Centrifugal Compressor Performance By Optimizing Diffuser Surge Control (Variable Diffuser Geometry) and Flow Control (Inlet Guide Vane) Device Settings. Int. Compress. Eng. Conf. 2004, 1719. [Google Scholar]
- Zamboni, G.; Moggia, S.; Capobianco, M. Hybrid EGR and turbocharging systems control for low NOX and fuel consumption in an automotive diesel engine. Appl. Energy 2016, 165, 839–848. [Google Scholar] [CrossRef]
- Young, M.Y.; Struble, A.G. Compressor Impeller with DisplacedSplitter Blades. U.S. Patent 5,002,461, 26 March 1991. [Google Scholar]
- Noman Danish, S.; Ud-Din Khan, S.; Umer, U.; Rehman Qureshi, S.; Ma, C. Performance Evaluation Of Tandem Bladed Centrifugal Compressor. Eng. Appl. Comput. Fluid Mech. 2014, 8, 382–395. [Google Scholar] [CrossRef]
- Wallace, F.J.; Whitfield, A.; Atkey, R.C. Experimental and theoretical performance of a radial flow turbocharger compressor with inlet prewhirl. Proc. Inst. Mech. Eng. Part A J. Power Energy 1975, 189, 177–186. [Google Scholar] [CrossRef]
- Whitfield, A.; Abdullah, A.H. The Performance of a Centrifugal Compressor With High Inlet Prewhirl. J. Turbomach. 1998, 120, 487–493. [Google Scholar] [CrossRef]
- Mohseni, A.; Goldhahn, E.; Van den Braembussche, R.A.; Seume, J.R. Designs for Centrifugal Compressors and Their Interaction With the Impeller. J. Turbomach. 2012, 134, 021006. [Google Scholar] [CrossRef]
- Dudam, T. Turbocharger Performance and Surge Definition on a Steady Flow Turbocharger Test Stand. Ph.D. Thesis, Department of Mechanical Engineering University of Bath, Faculty of Engineering and Design, Bath, UK. Available online: https://researchportal.bath.ac.uk/en/studentTheses/turbocharger-performance-and-surge-definition-on-a-steady-flow-tu (accessed on 13 May 2022).
- McMullen, R.; Pino, Y. Conditioning Turbocharger Compressor Map Data for Use in Engine Performance Simulation. SAE Int. J. Engines 2018, 11, 491–507. [Google Scholar] [CrossRef]
- Burkinshaw, M.; Mukhtar, U.; Sullivan, L. The development of a long route EGR turbocharger for commercial engine applications. In Proceedings of the 12th International Conference on Turbochargers and Turbocharging, London, UK, 17–18 May 2016. [Google Scholar]
- Munz, S.; Schmidt, P.; Romuss, C.; Brune, H.; Schiffer, H.P. Turbocharger for Emission Concepts with Low-Pressure-End Exhaust-Gas Recirculation; Borg Warner: Auburn Hills, MI, USA, 2007. [Google Scholar]
- Buyukkaya, E. Effects of biodiesel on a DI diesel engine performance, emission and combustion characteristics. Fuel 2010, 89, 3099–3105. [Google Scholar] [CrossRef]
- Smyshlyaeva, K.I.; Rudko, V.A.; Kuzmin, K.A.; Povarov, V.G. Asphaltene genesis influence on the low-sulfur residual marine fuel sedimentation stability. Fuel 2022, 328, 125291. [Google Scholar] [CrossRef]
- Song, H.; Tompkins, B.T.; Bittle, J.A.; Jacobs, T.J. Jacobs Comparisons of NO emissions and soot concentrations from biodiesel-fuelled diesel engine. Fuel 2012, 96, 446–453. [Google Scholar] [CrossRef]
- Tan, P.Q.; Hu, Z.Y.; Lou, D.M.; Li, Z.J. Exhaust emissions from a light-duty diesel engine with Jatropha biodiesel fuel. Energy 2012, 39, 356–362. [Google Scholar] [CrossRef]
- Hajlari, S.A.; Najafi, B.; Ardabili, S.F. Castor oil, a source for biodiesel production and its impact on the diesel engine performance. Renew. Energy Focus 2019, 28, 1–10. [Google Scholar] [CrossRef]
- An, H.; Yang, W.M.; Chou, S.K.; Chua, K.J. Combustion and emissions characteristics of diesel engine fueled by biodiesel at partial load conditions. Appl. Energy 2012, 99, 363–371. [Google Scholar] [CrossRef]
- Rahman, M.M.; Pourkhesalian, A.M.; Jahirul, M.I.; Stevanovic, S.; Pham, P.X.; Wang, H.; Ristovski, Z.D. Particle emissions from biodiesels with different physical properties and chemical composition. Fuel 2014, 134, 201–208. [Google Scholar] [CrossRef]
- Özener, O.; Yüksek, L.; Ergenç, A.T.; Özkan, M. Effects of soybean biodiesel on a DI diesel engine performance, emission and combustion characteristics. Fuel 2014, 115, 875–883. [Google Scholar] [CrossRef]
- Mofijur, M.; Masjuki, H.H.; Kalam, M.A.; Atabani, A.E.; Arbab, M.I.; Cheng, S.F.; Gouk, S.W. Properties and use of Moringa oleifera biodiesel and diesel fuel blends in a multi-cylinder diesel engine. Energy Convers. Manag. 2014, 82, 169–176. [Google Scholar] [CrossRef]
- Nabi, M.N.; Zare, A.; Hossain, F.M.; Ristovski, Z.D.; Brown, R.J. Reductions in diesel emissions including PM and PN emissions with diesel-biodiesel blends. J. Clean. Prod. 2017, 166, 860–868. [Google Scholar] [CrossRef] [Green Version]
- Ogunkunle, O.; Ahmed, N.A. Exhaust emissions and engine performance analysis of a marine diesel engine fuelled with Parinari polyandra biodiesel–diesel blends. Energy Rep. 2020, 6, 2999–3007. [Google Scholar] [CrossRef]
- Yusop, A.F.; Hafizil, M.; Yasin, M.; Mamat, R.; Abdullah, A.A.; Aziz, A. PM emission of diesel engines using ester-ethanol-diesel blended fuel. Procedia Eng. 2013, 53, 530–535. [Google Scholar] [CrossRef] [Green Version]
- Kousoulidou, M.; Ntziachristos, L.; Fontaras, G.; Martini, G.; Dilara, P.; Samaras, Z. Impact of biodiesel application at various blending ratios on passenger cars of different fueling technologies. Fuel 2012, 98, 88–94. [Google Scholar] [CrossRef]
- AVL BOOST Theory 2021; AVL List GmbH: Graz, Austria, 2021.
- Shi, X.; Pang, X.; Mu, Y.; He, H.; Shuai, S.; Wang, J.; Chen, H.; Li, R. Emission reduction potential of using ethanol–biodiesel–diesel fuel blend on a heavy-duty diesel engine. Atmos. Environ. 2006, 40, 2567–2574. [Google Scholar] [CrossRef]
- Isık, M.Z.; Aydın, H. Analysis of ethanol RCCI application with safflower biodiesel blends in a high load diesel power generator. Fuel 2016, 184, 248–260. [Google Scholar] [CrossRef]
- Perumal, V.; Ilangkumaran, M. Experimental analysis of engine performance, combustion and emission using pongamia biodiesel as fuel in CI engine. Energy 2017, 129, 228–236. [Google Scholar] [CrossRef]
- Mishra, S.R.; Mohanty, M.K.; Panigrahi, N.; Pattanaik, A.K. Impact of Simarouba glauca biodiesel blends as a fuel on the performance and emission analysis in an unmodified DICI engine. Renew. Energy Focus 2018, 26, 11–16. [Google Scholar] [CrossRef]
- Adrian, V.N.; Catalin, N.D.; Radu, C. On some possible effects of using renewable oxygenated fuels in a large marine diesel engine. Energy Rep. 2022, 8, 966–977. [Google Scholar] [CrossRef]


| Application | Marine |
|---|---|
| Brake power | 3900 HP |
| Rated speed | 1100 rpm |
| BSFC@1100 rpm | 224.7 g/kWh |
| BMEP | 17.93 bar |
| Bore | 228.6 mm |
| Stroke | 266.7 mm |
| Configuration | V16 |
| Displacement | 175.1 L |
| Compression ratio | 11.5 |
| Valve timing | Fixed, Camshaft driven |
| Valve overlap | 140° |
| Injection System | Mechanical, pump-injector system |
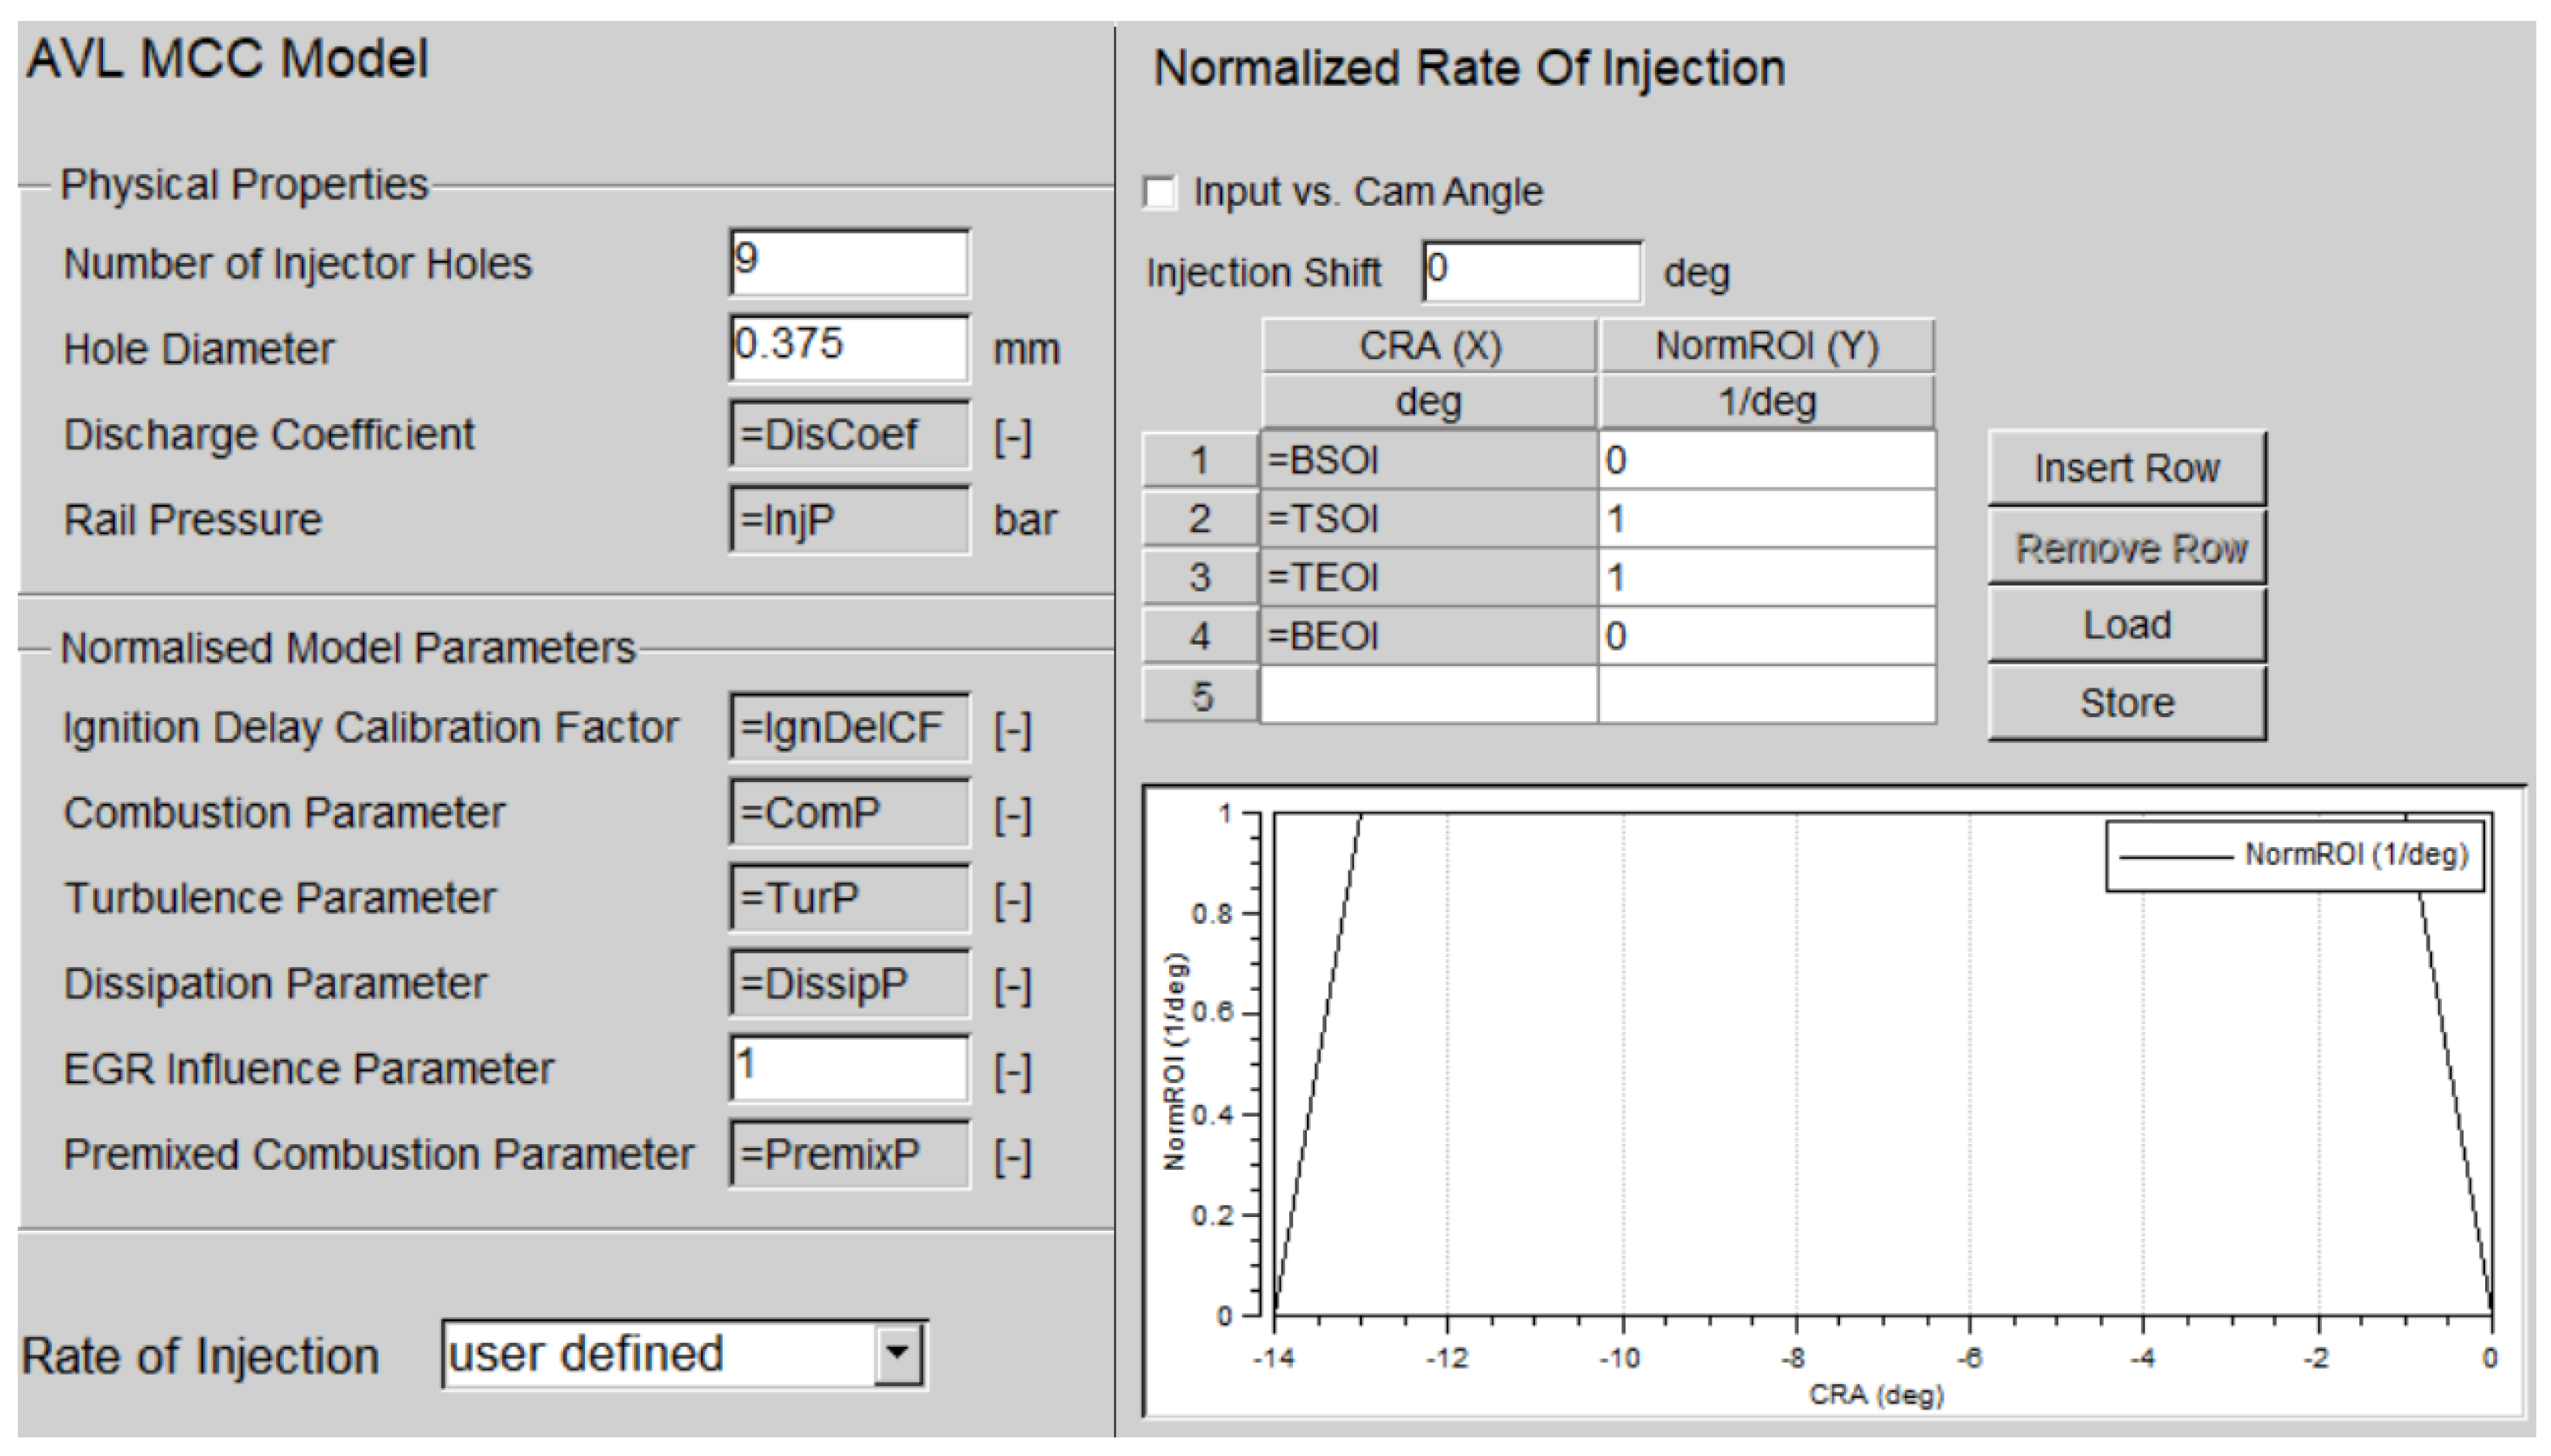
| Injector | 9 holes × 0.375 mm |
| Injection pressure | 260 bar |
| Engine Speed | BSOI | TSOI | TEOI | BEOI |
|---|---|---|---|---|
| 600 | −14 | −13 | −1 | 0 |
| 700 | −14 | −13 | −1 | 0 |
| 800 | −15 | −14 | 2 | 3 |
| Properties | Diesel Fuel | Biofuel | Biodiesel B20 |
|---|---|---|---|
| Chemical formula | C12H26-C14H30 | C19H36O2 | C15H23O |
| Molecular weight (g/mol) | 170–220 | 292.6 | 219 |
| Density @ 20 °C (kg/m3) | 810–880 | 887 | 857.4 |
| Boiling Point (°C) | 125i–400f | 330 | 200 |
| Viscosity (20 °C) (cSt) | 3.35 | 8.06 | 5.12 |
| Flash Point (°C) | 65–88 | 140 | 85 |
| Autoignition Temperature (°C) | 204–340 | 380 | - |
| Cetane number | 40–55 | 55–56 | 52.5 |
| Air/Fuel ratio at Stoichiometric | 14.7 | 12.6 | 14.2 |
| Lower heating value (MJ/kg) | 42.5 | 38.8 | 40.5 |
| Heat of vaporization (kJ/kg) | 260 | 350 | 277 |
| Carbon content (%wt) | 87 | 76.9 | 82.2 |
| Hydrogen content (%wt) | 12.6 | 12.4 | 10.5 |
| Oxygen content (%wt) | 0.004 | 10.7 | 7.3 |
| Water content (mg/kg) | 50 | 300 | 120 |
| Carbon residue in % | 0.001 | 0.1 | 0.032 |
| Ash (% by mass) | 0.016 | 0.087 | 0.023 |
| Flame temperature (°C) | 2054 | - | - |
Publisher’s Note: MDPI stays neutral with regard to jurisdictional claims in published maps and institutional affiliations. |
© 2022 by the authors. Licensee MDPI, Basel, Switzerland. This article is an open access article distributed under the terms and conditions of the Creative Commons Attribution (CC BY) license (https://creativecommons.org/licenses/by/4.0/).
Share and Cite
Visan, N.A.; Carlanescu, R.; Niculescu, D.C.; Chiriac, R. Study on the Cumulative Effects of Using a High-Efficiency Turbocharger and Biodiesel B20 Fuelling on Performance and Emissions of a Large Marine Diesel Engine. J. Mar. Sci. Eng. 2022, 10, 1403. https://doi.org/10.3390/jmse10101403
Visan NA, Carlanescu R, Niculescu DC, Chiriac R. Study on the Cumulative Effects of Using a High-Efficiency Turbocharger and Biodiesel B20 Fuelling on Performance and Emissions of a Large Marine Diesel Engine. Journal of Marine Science and Engineering. 2022; 10(10):1403. https://doi.org/10.3390/jmse10101403
Chicago/Turabian StyleVisan, Nicolae Adrian, Razvan Carlanescu, Dan Catalin Niculescu, and Radu Chiriac. 2022. "Study on the Cumulative Effects of Using a High-Efficiency Turbocharger and Biodiesel B20 Fuelling on Performance and Emissions of a Large Marine Diesel Engine" Journal of Marine Science and Engineering 10, no. 10: 1403. https://doi.org/10.3390/jmse10101403
APA StyleVisan, N. A., Carlanescu, R., Niculescu, D. C., & Chiriac, R. (2022). Study on the Cumulative Effects of Using a High-Efficiency Turbocharger and Biodiesel B20 Fuelling on Performance and Emissions of a Large Marine Diesel Engine. Journal of Marine Science and Engineering, 10(10), 1403. https://doi.org/10.3390/jmse10101403