
Sustainable Approaches to Realize Carbon Neutrality in China: A Case Study of Zhejiang Province


Abstract
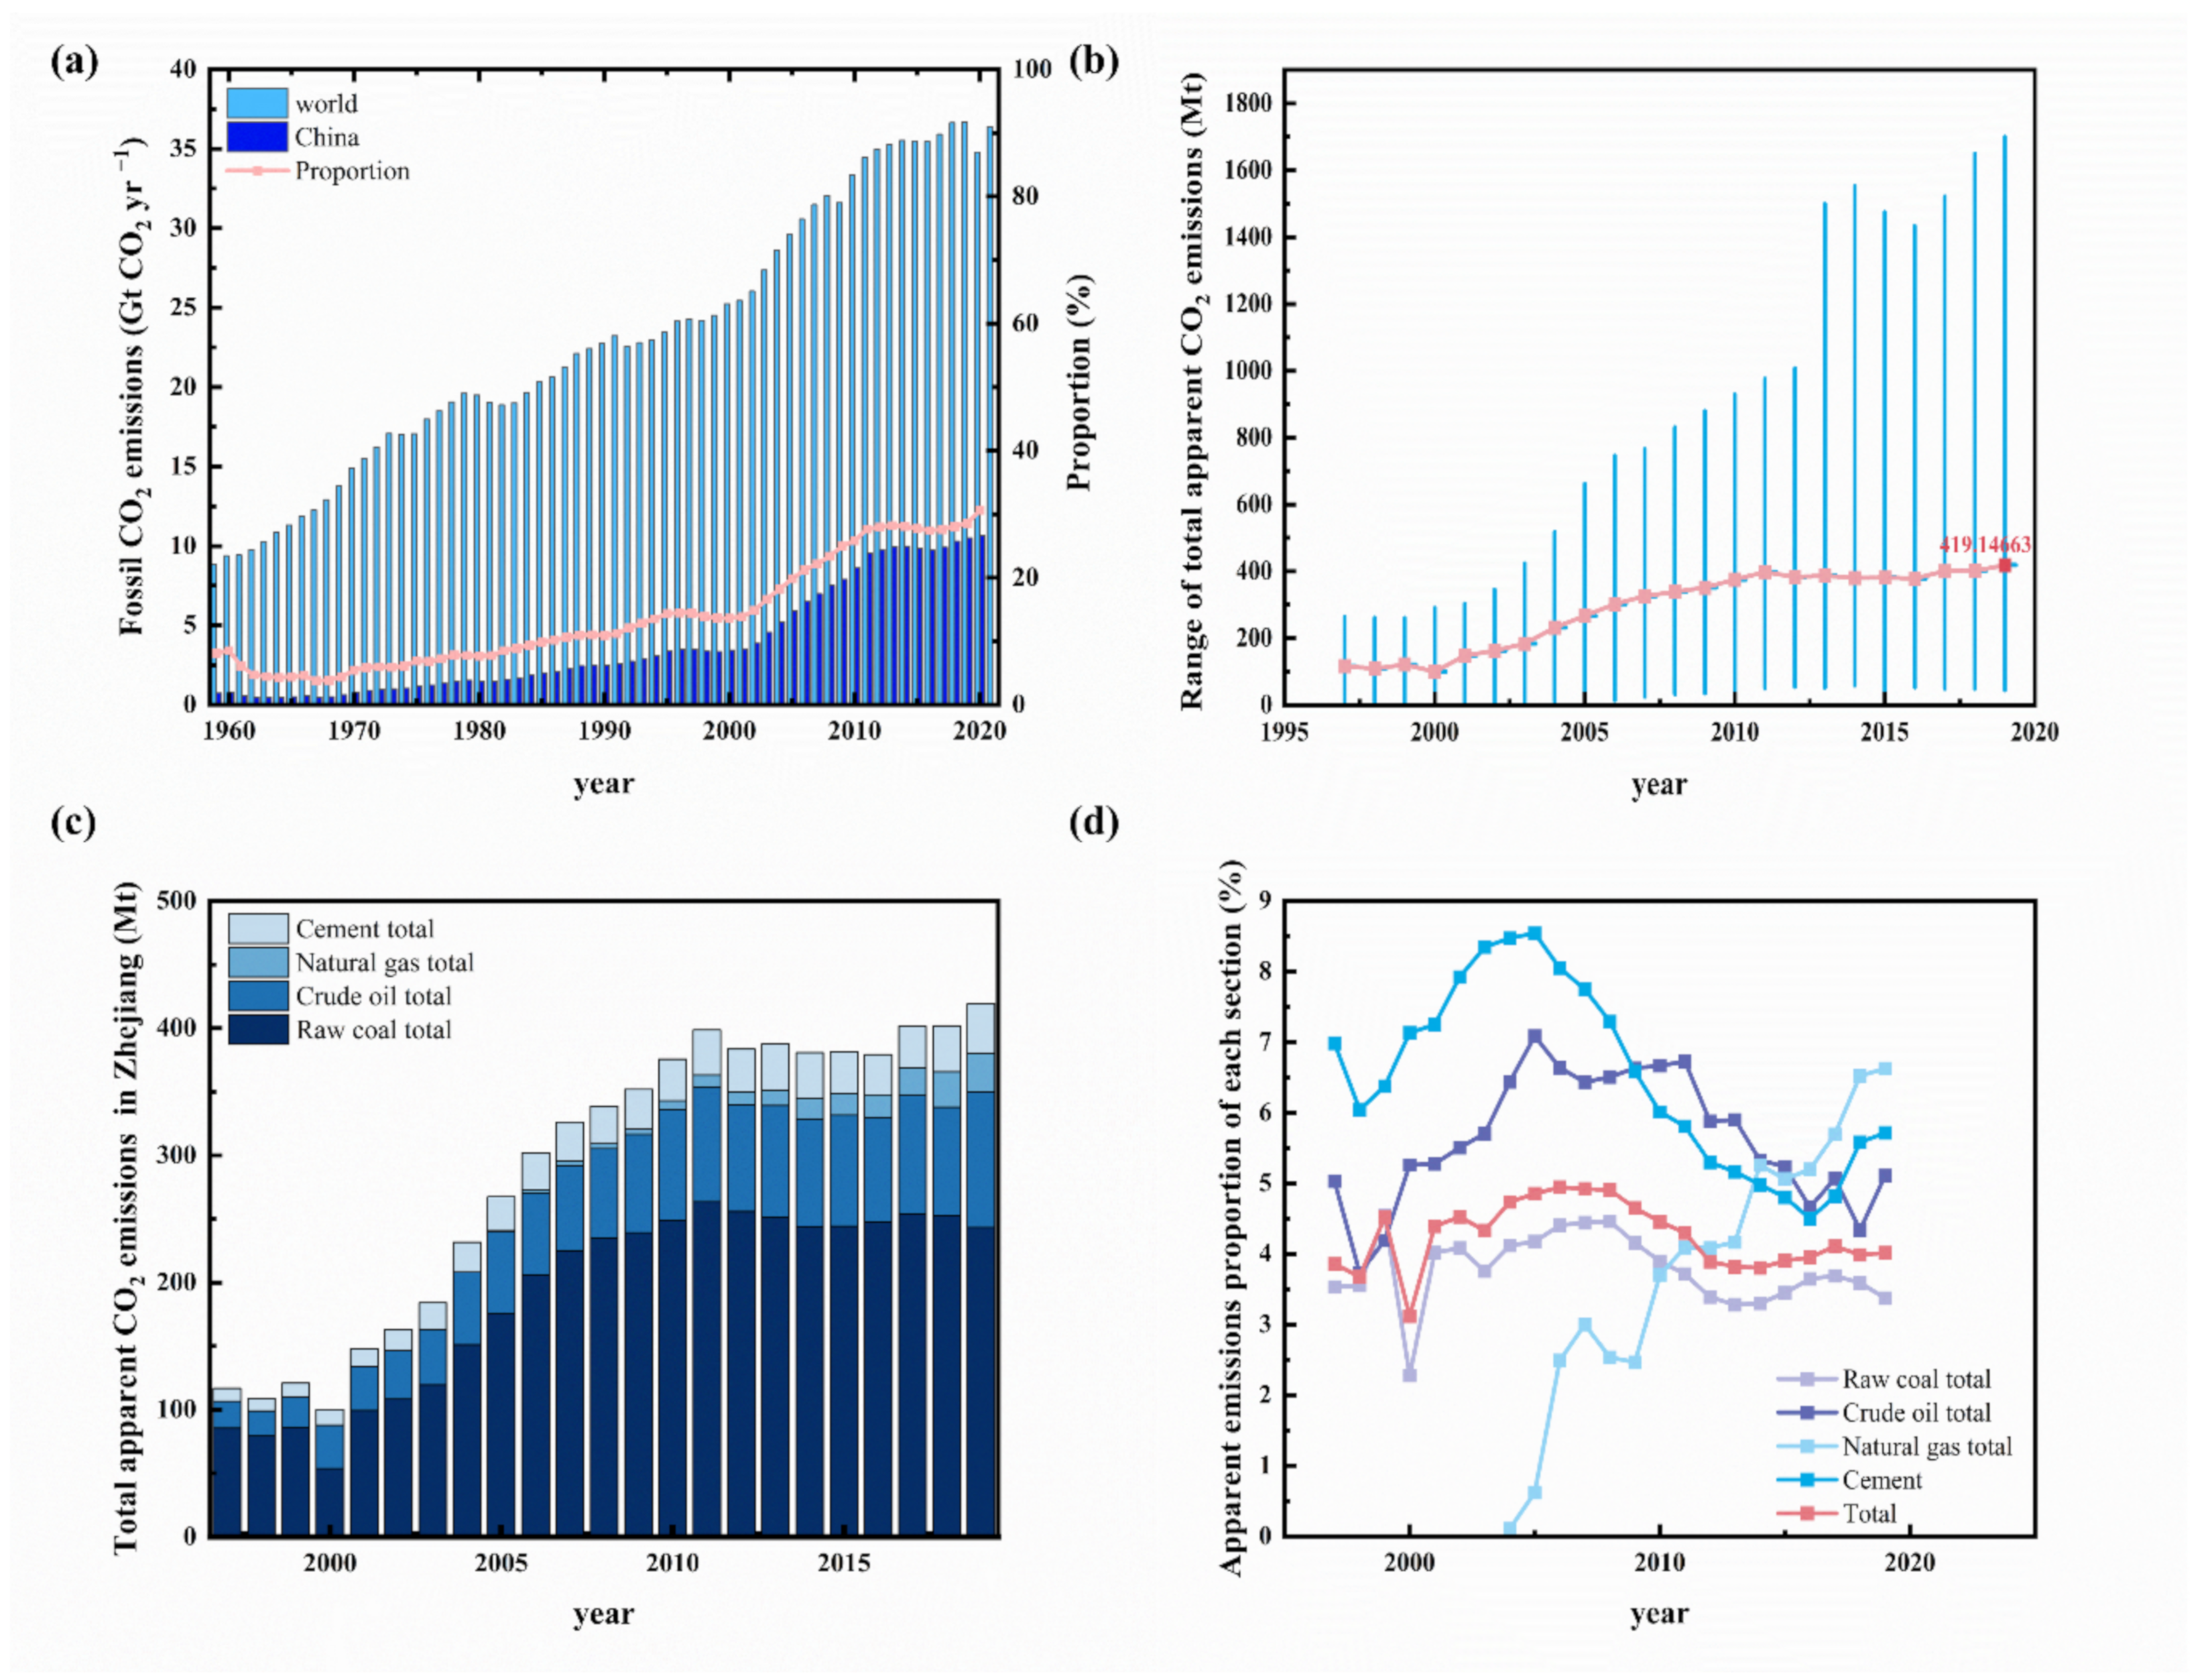
:1. Introduction
2. De-Carbonization by Nature
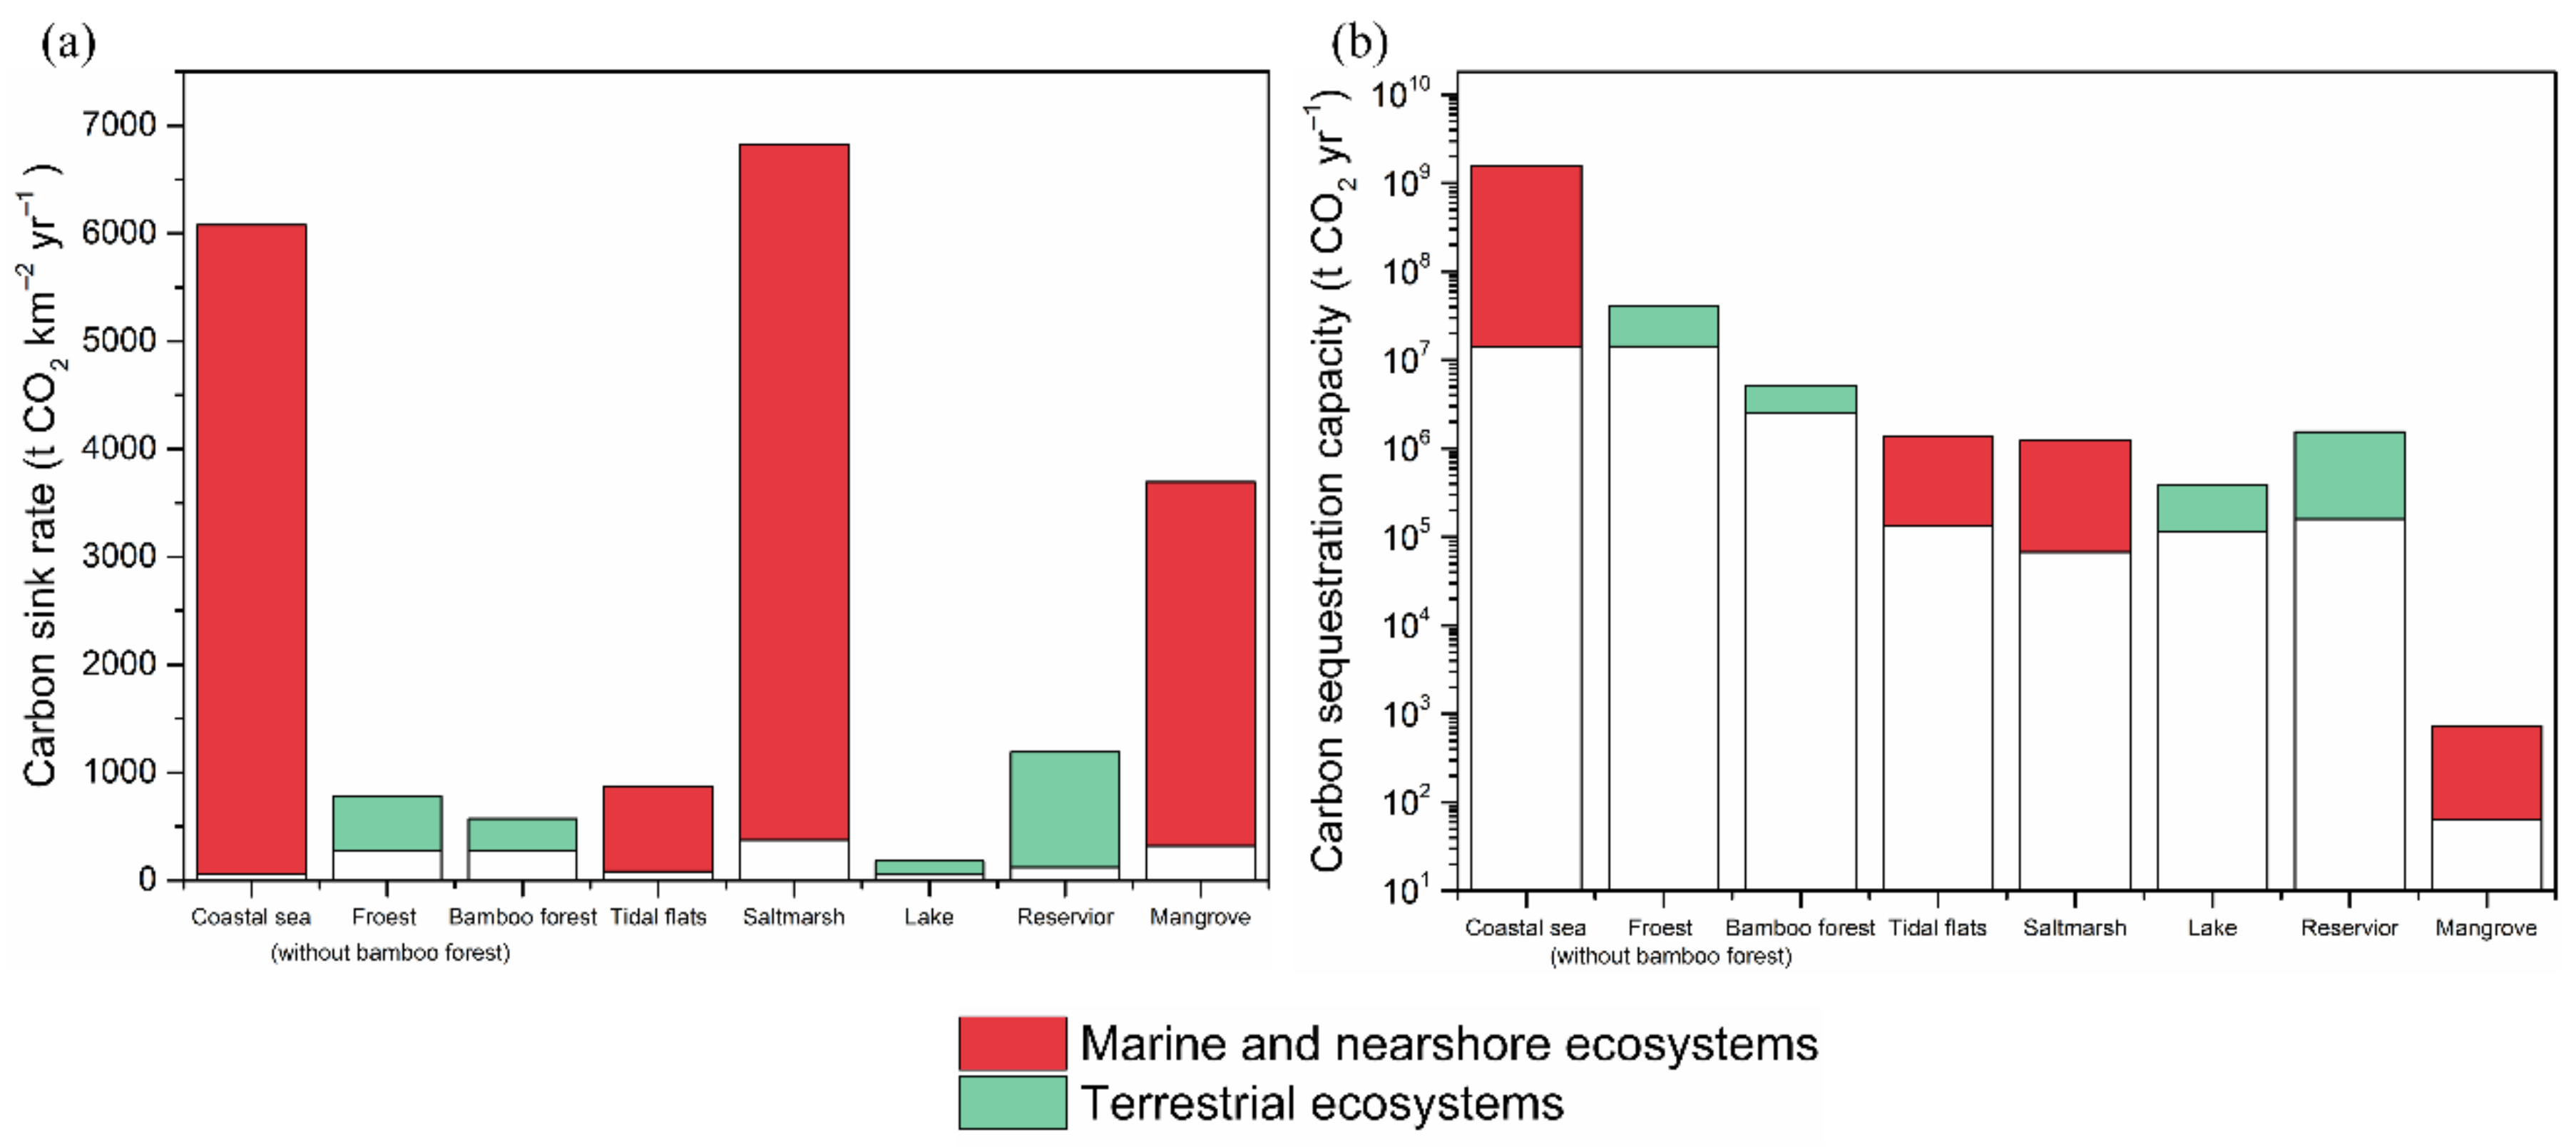
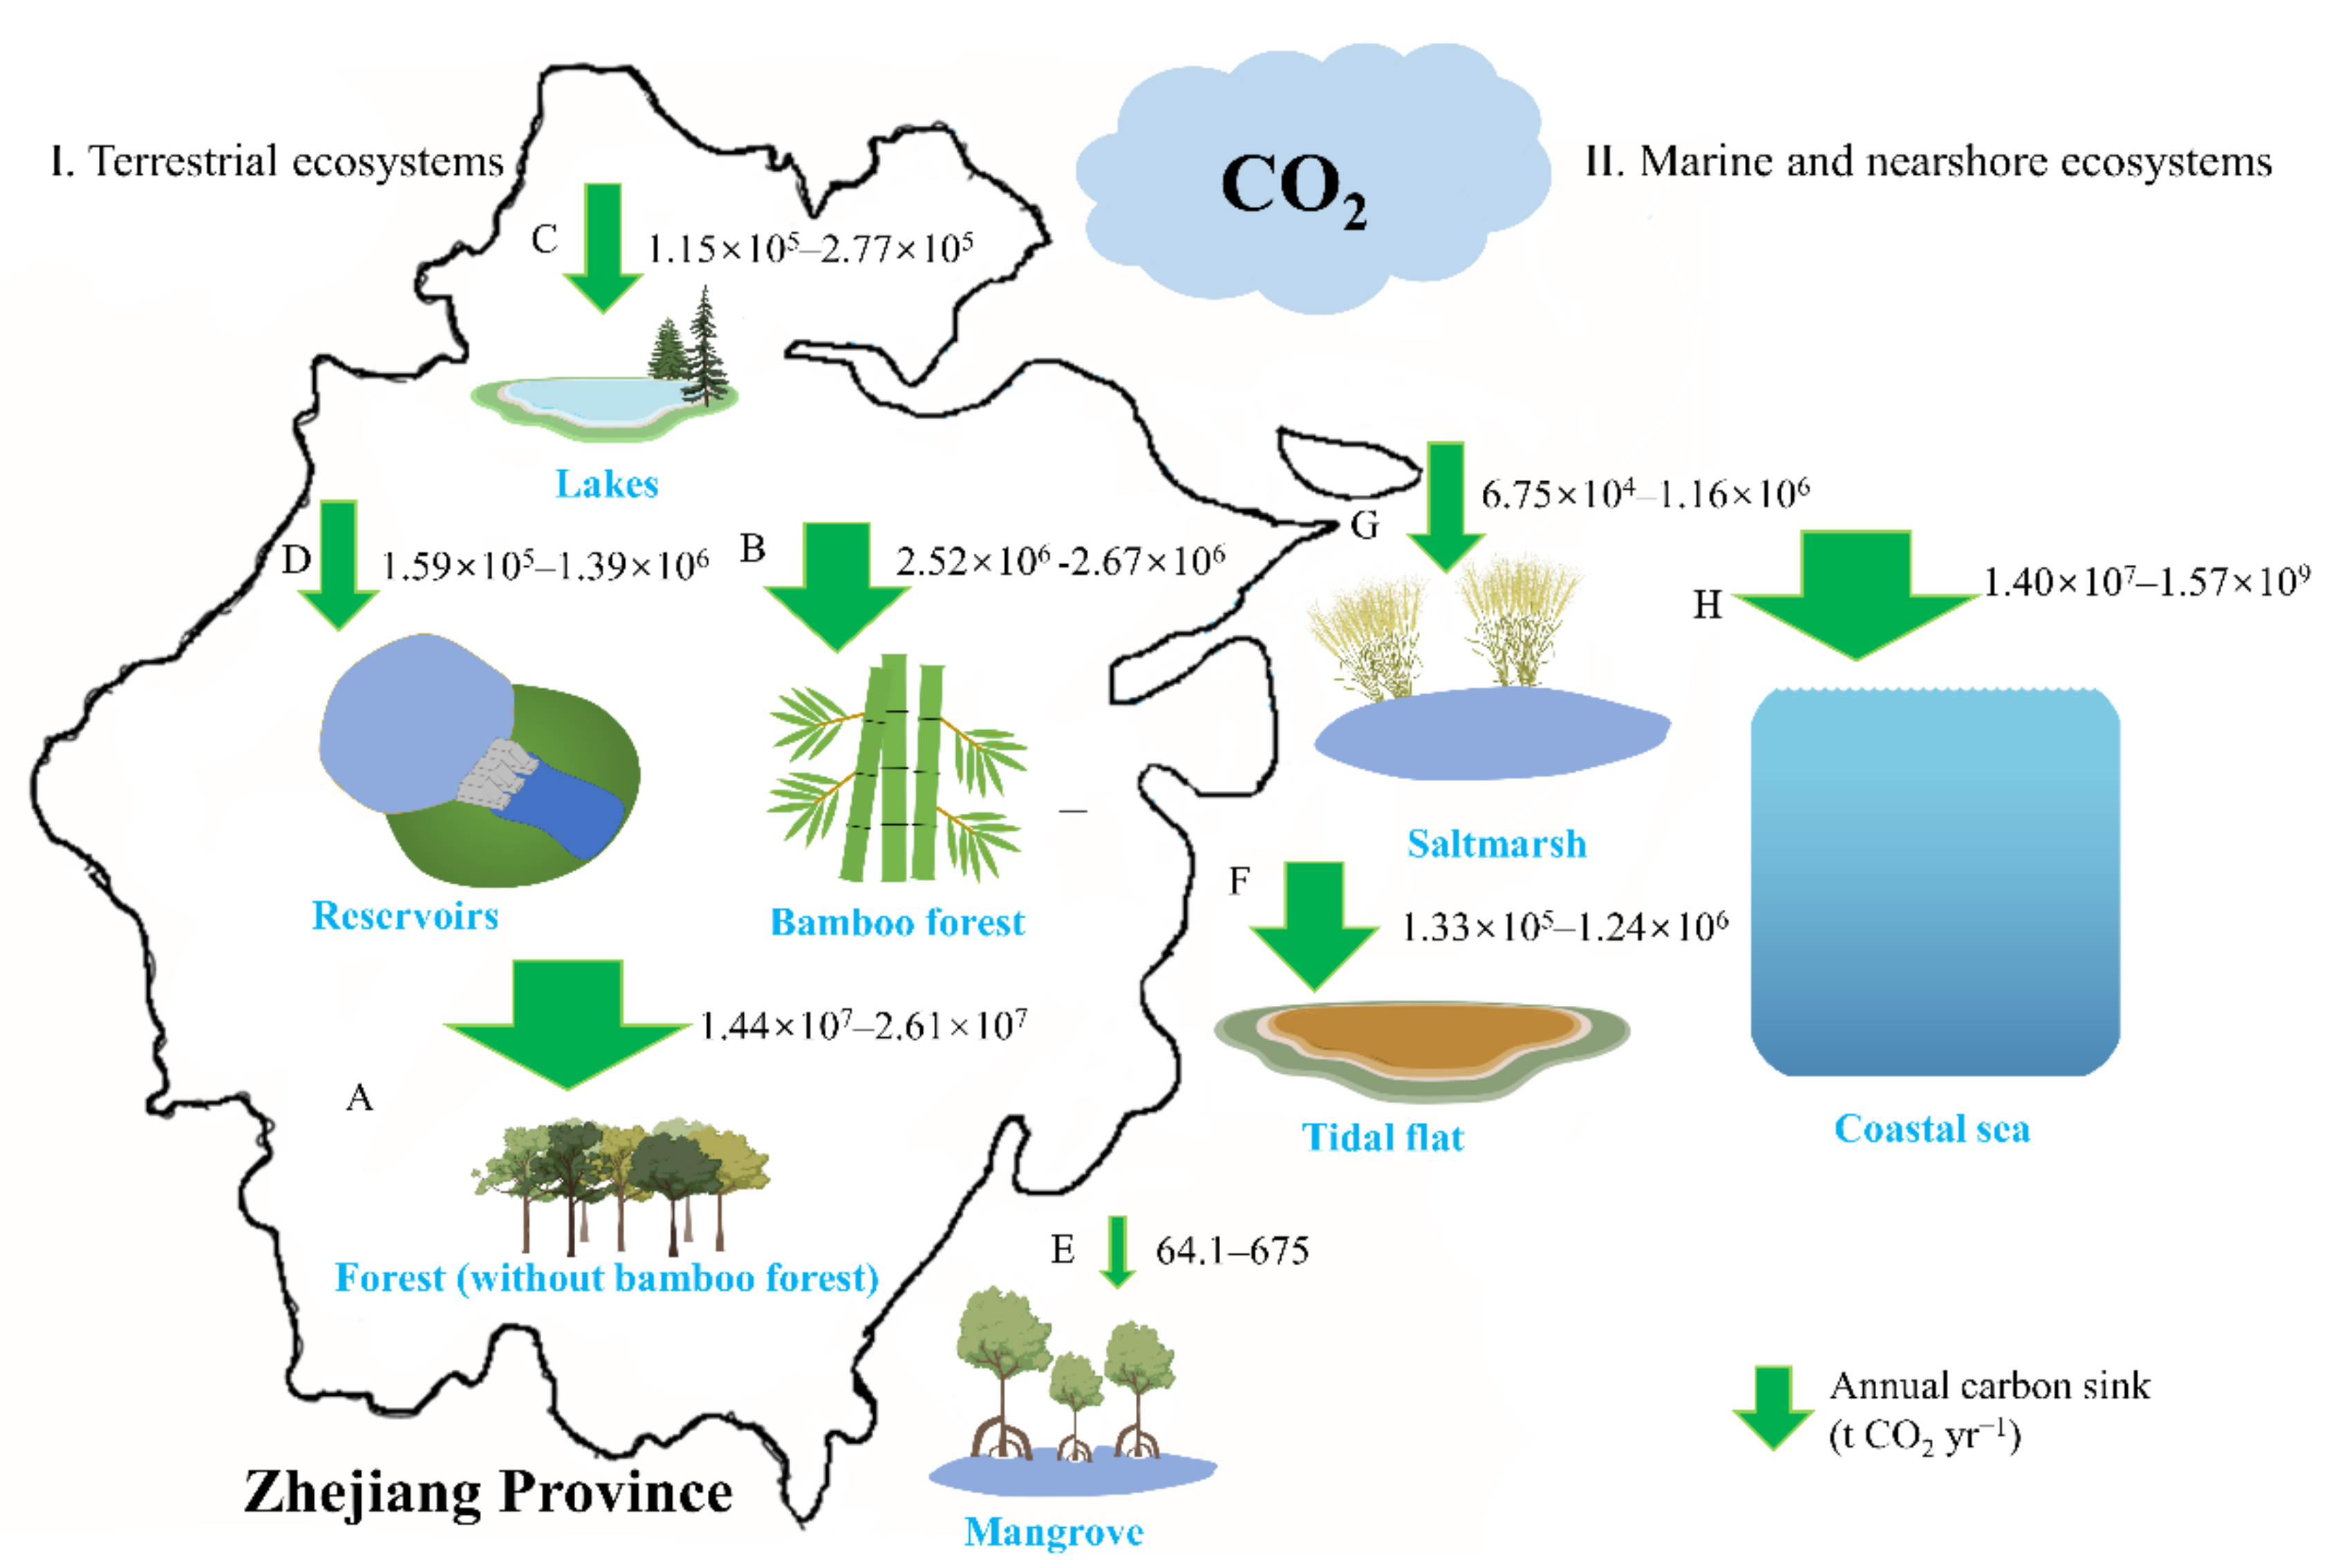
2.1. Understanding of Carbon Sink: The Current Status of the Natural Environment
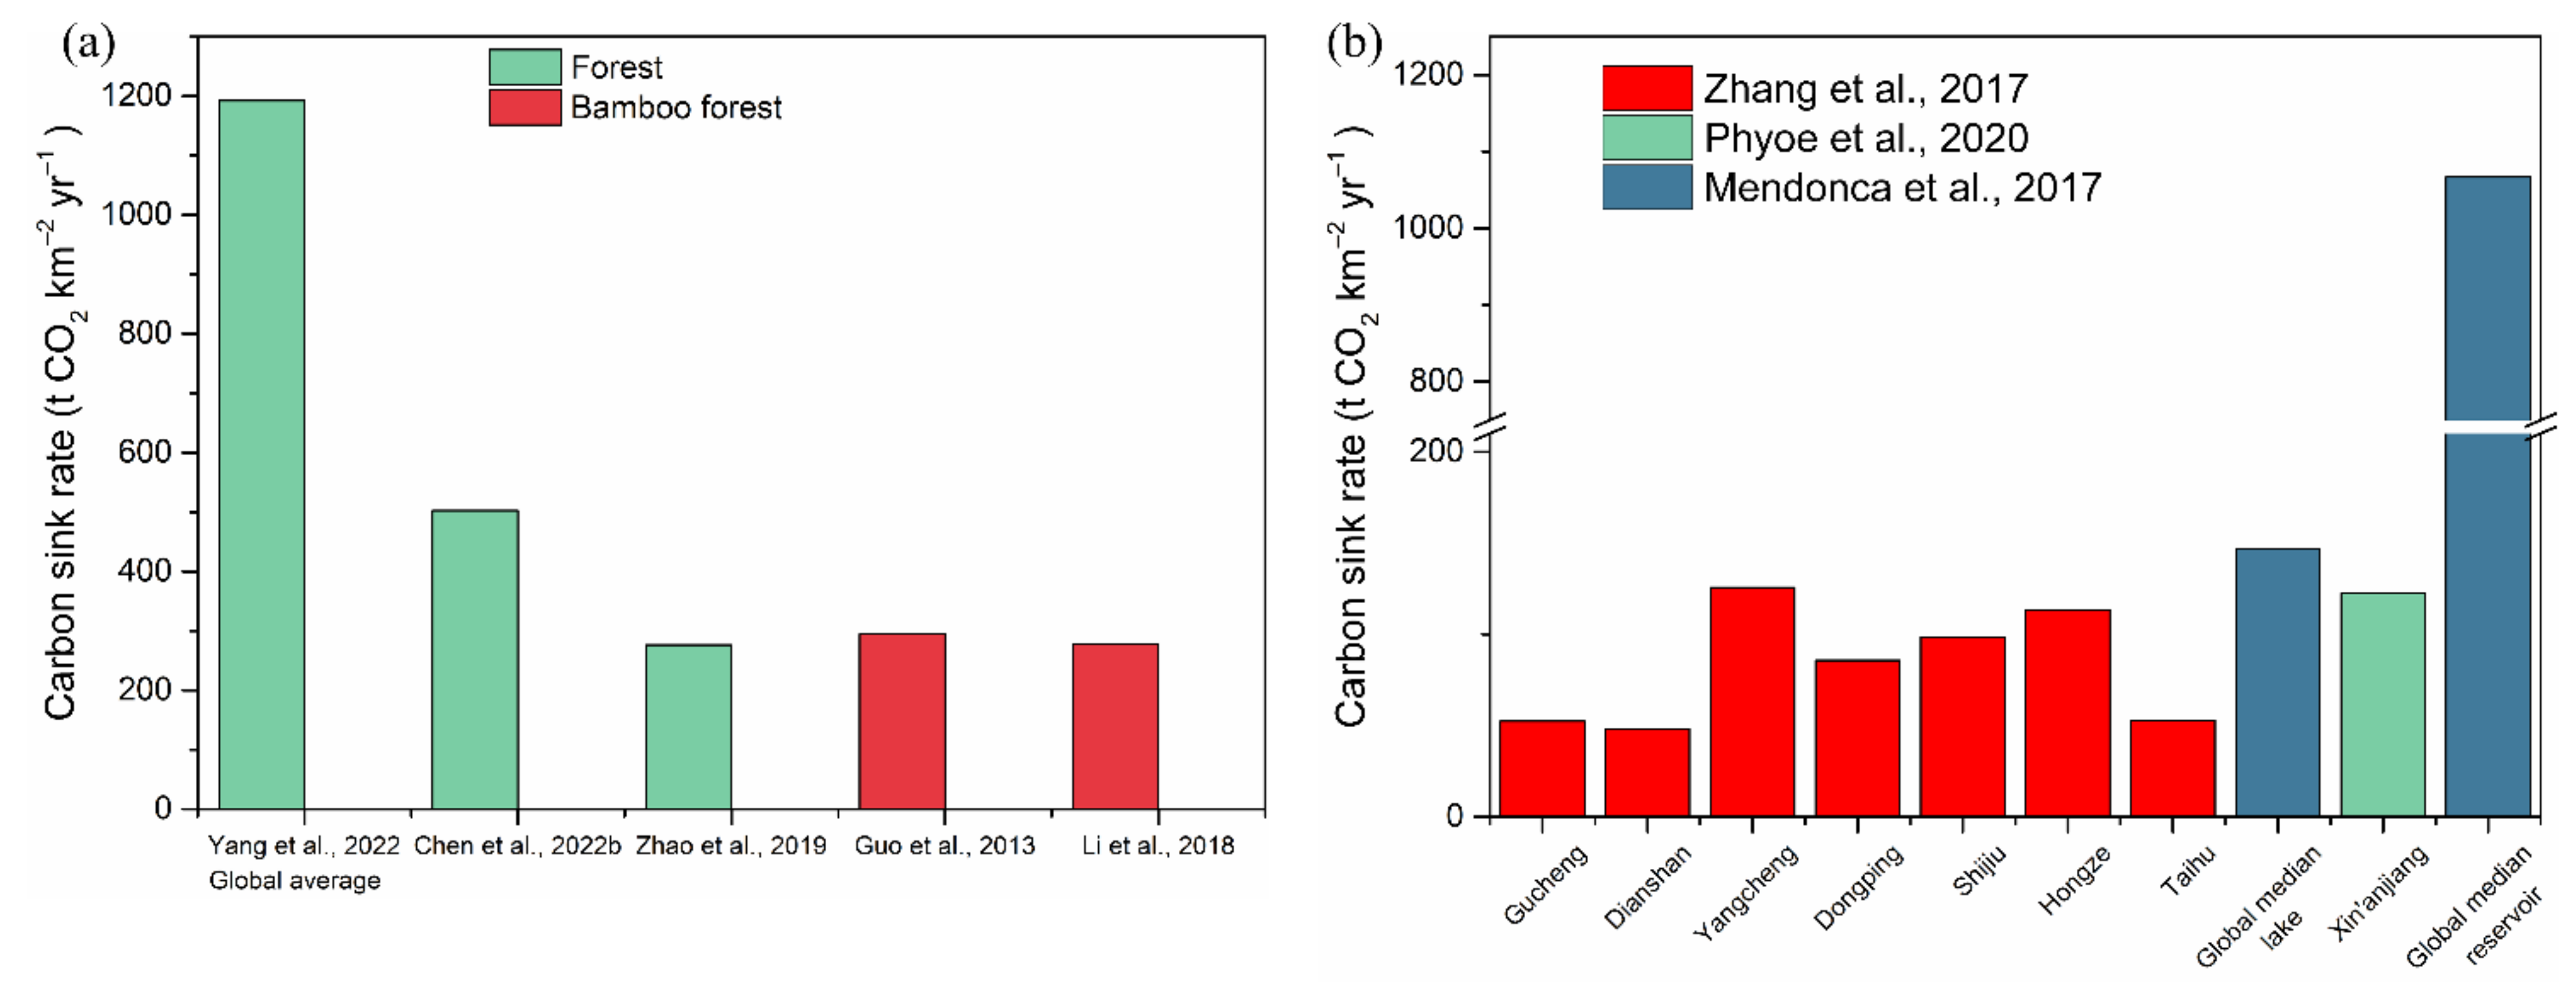
2.1.1. Terrestrial Ecosystem
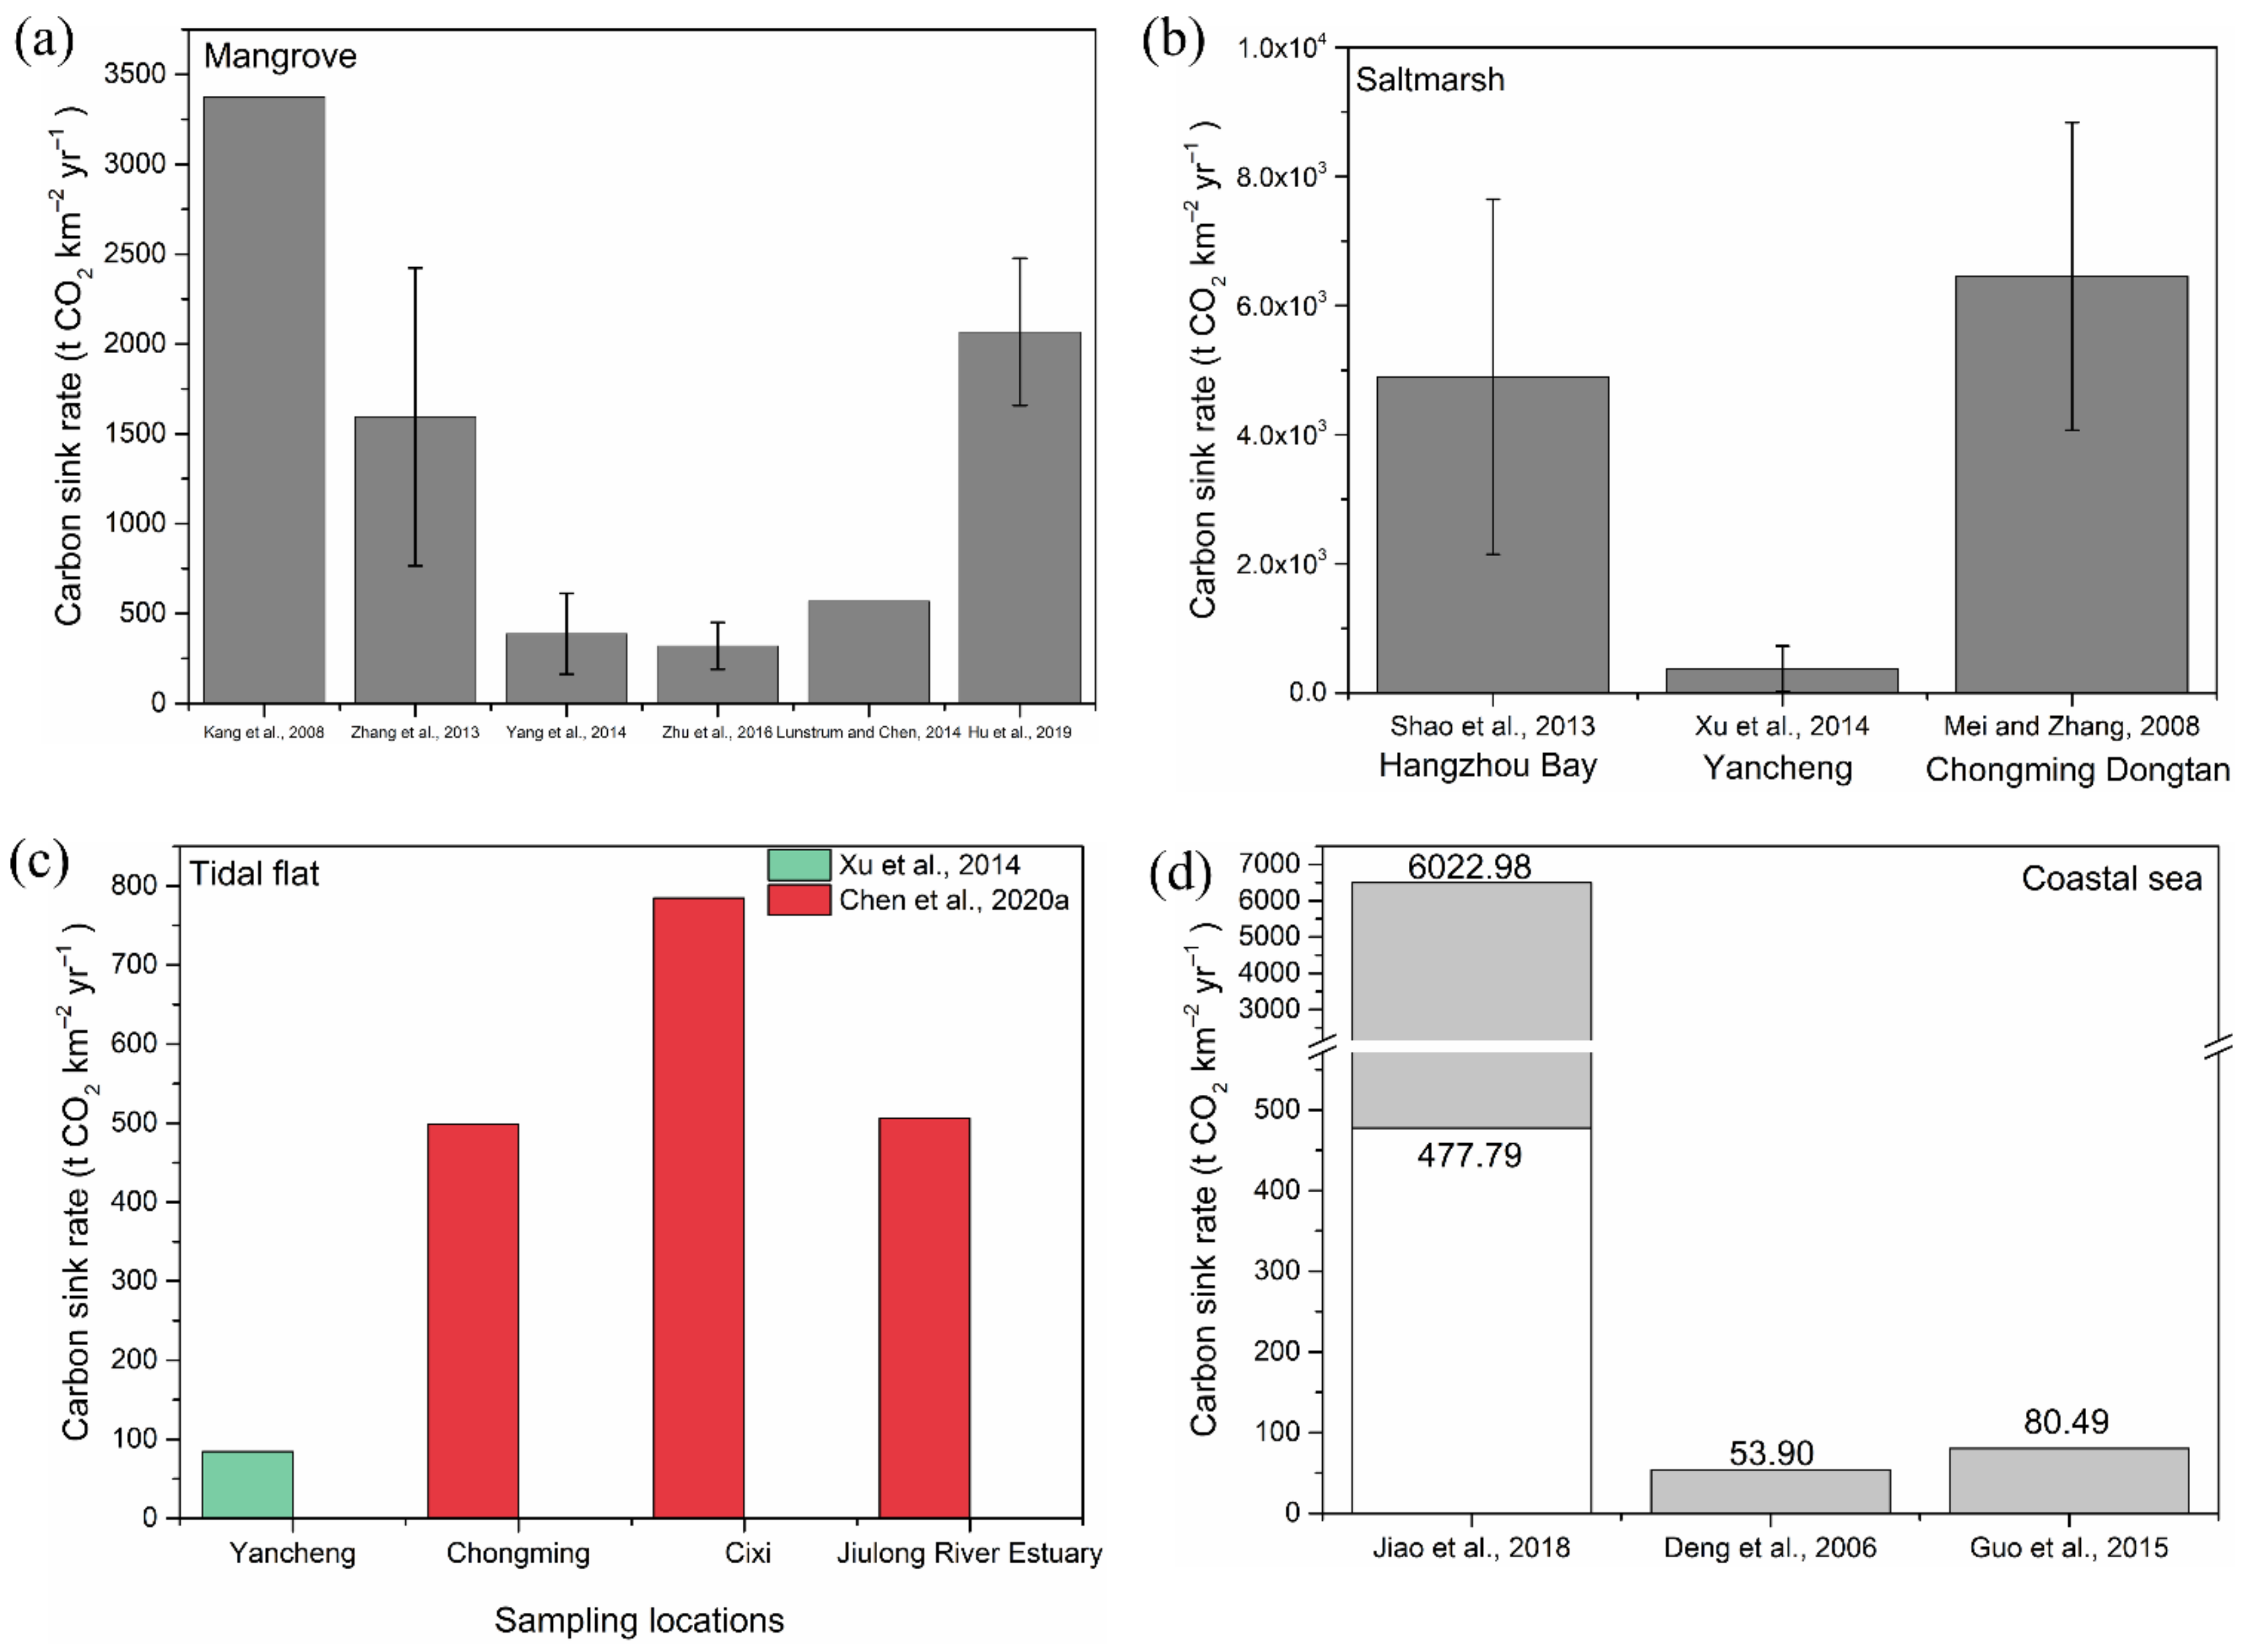
2.1.2. Marine and Nearshore Ecosystems
2.2. Increasing Carbon Sink: Strategies and Approaches
2.2.1. Terrestrial Ecosystem
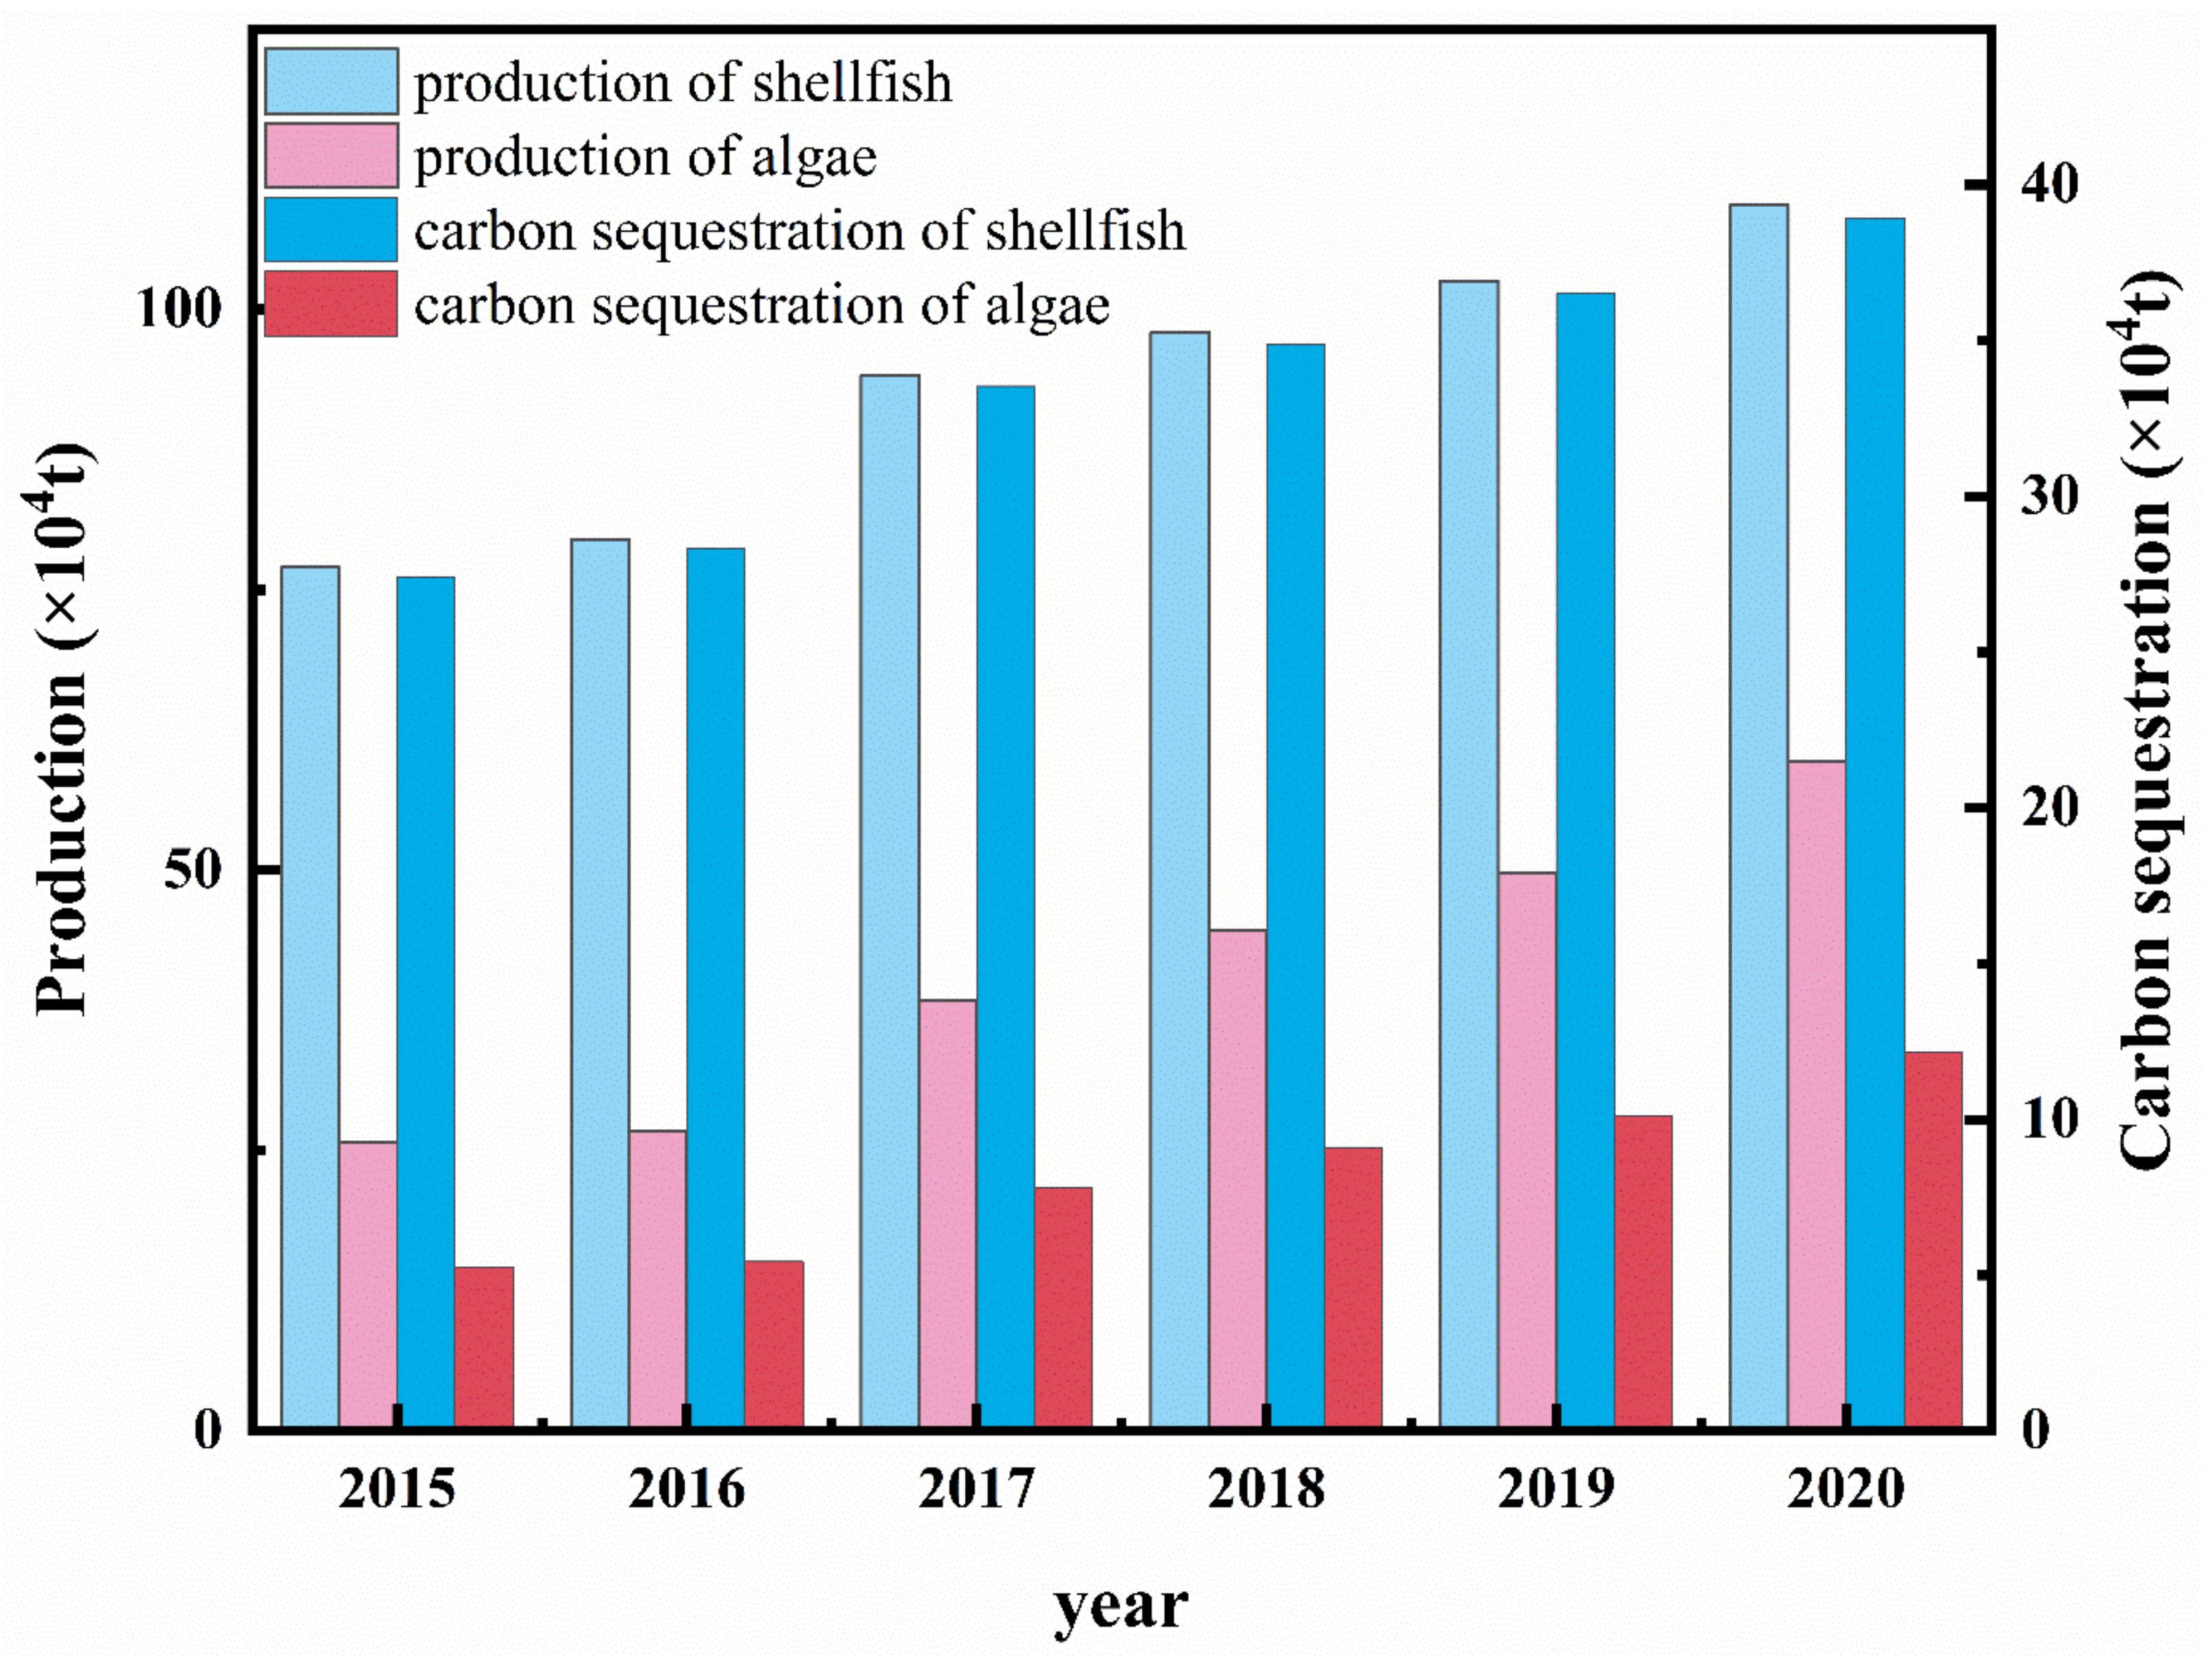
2.2.2. Marine Ecosystems
3. Innovative Technologies for CO2 Emission Reduction
3.1. Low-Carbon Technologies
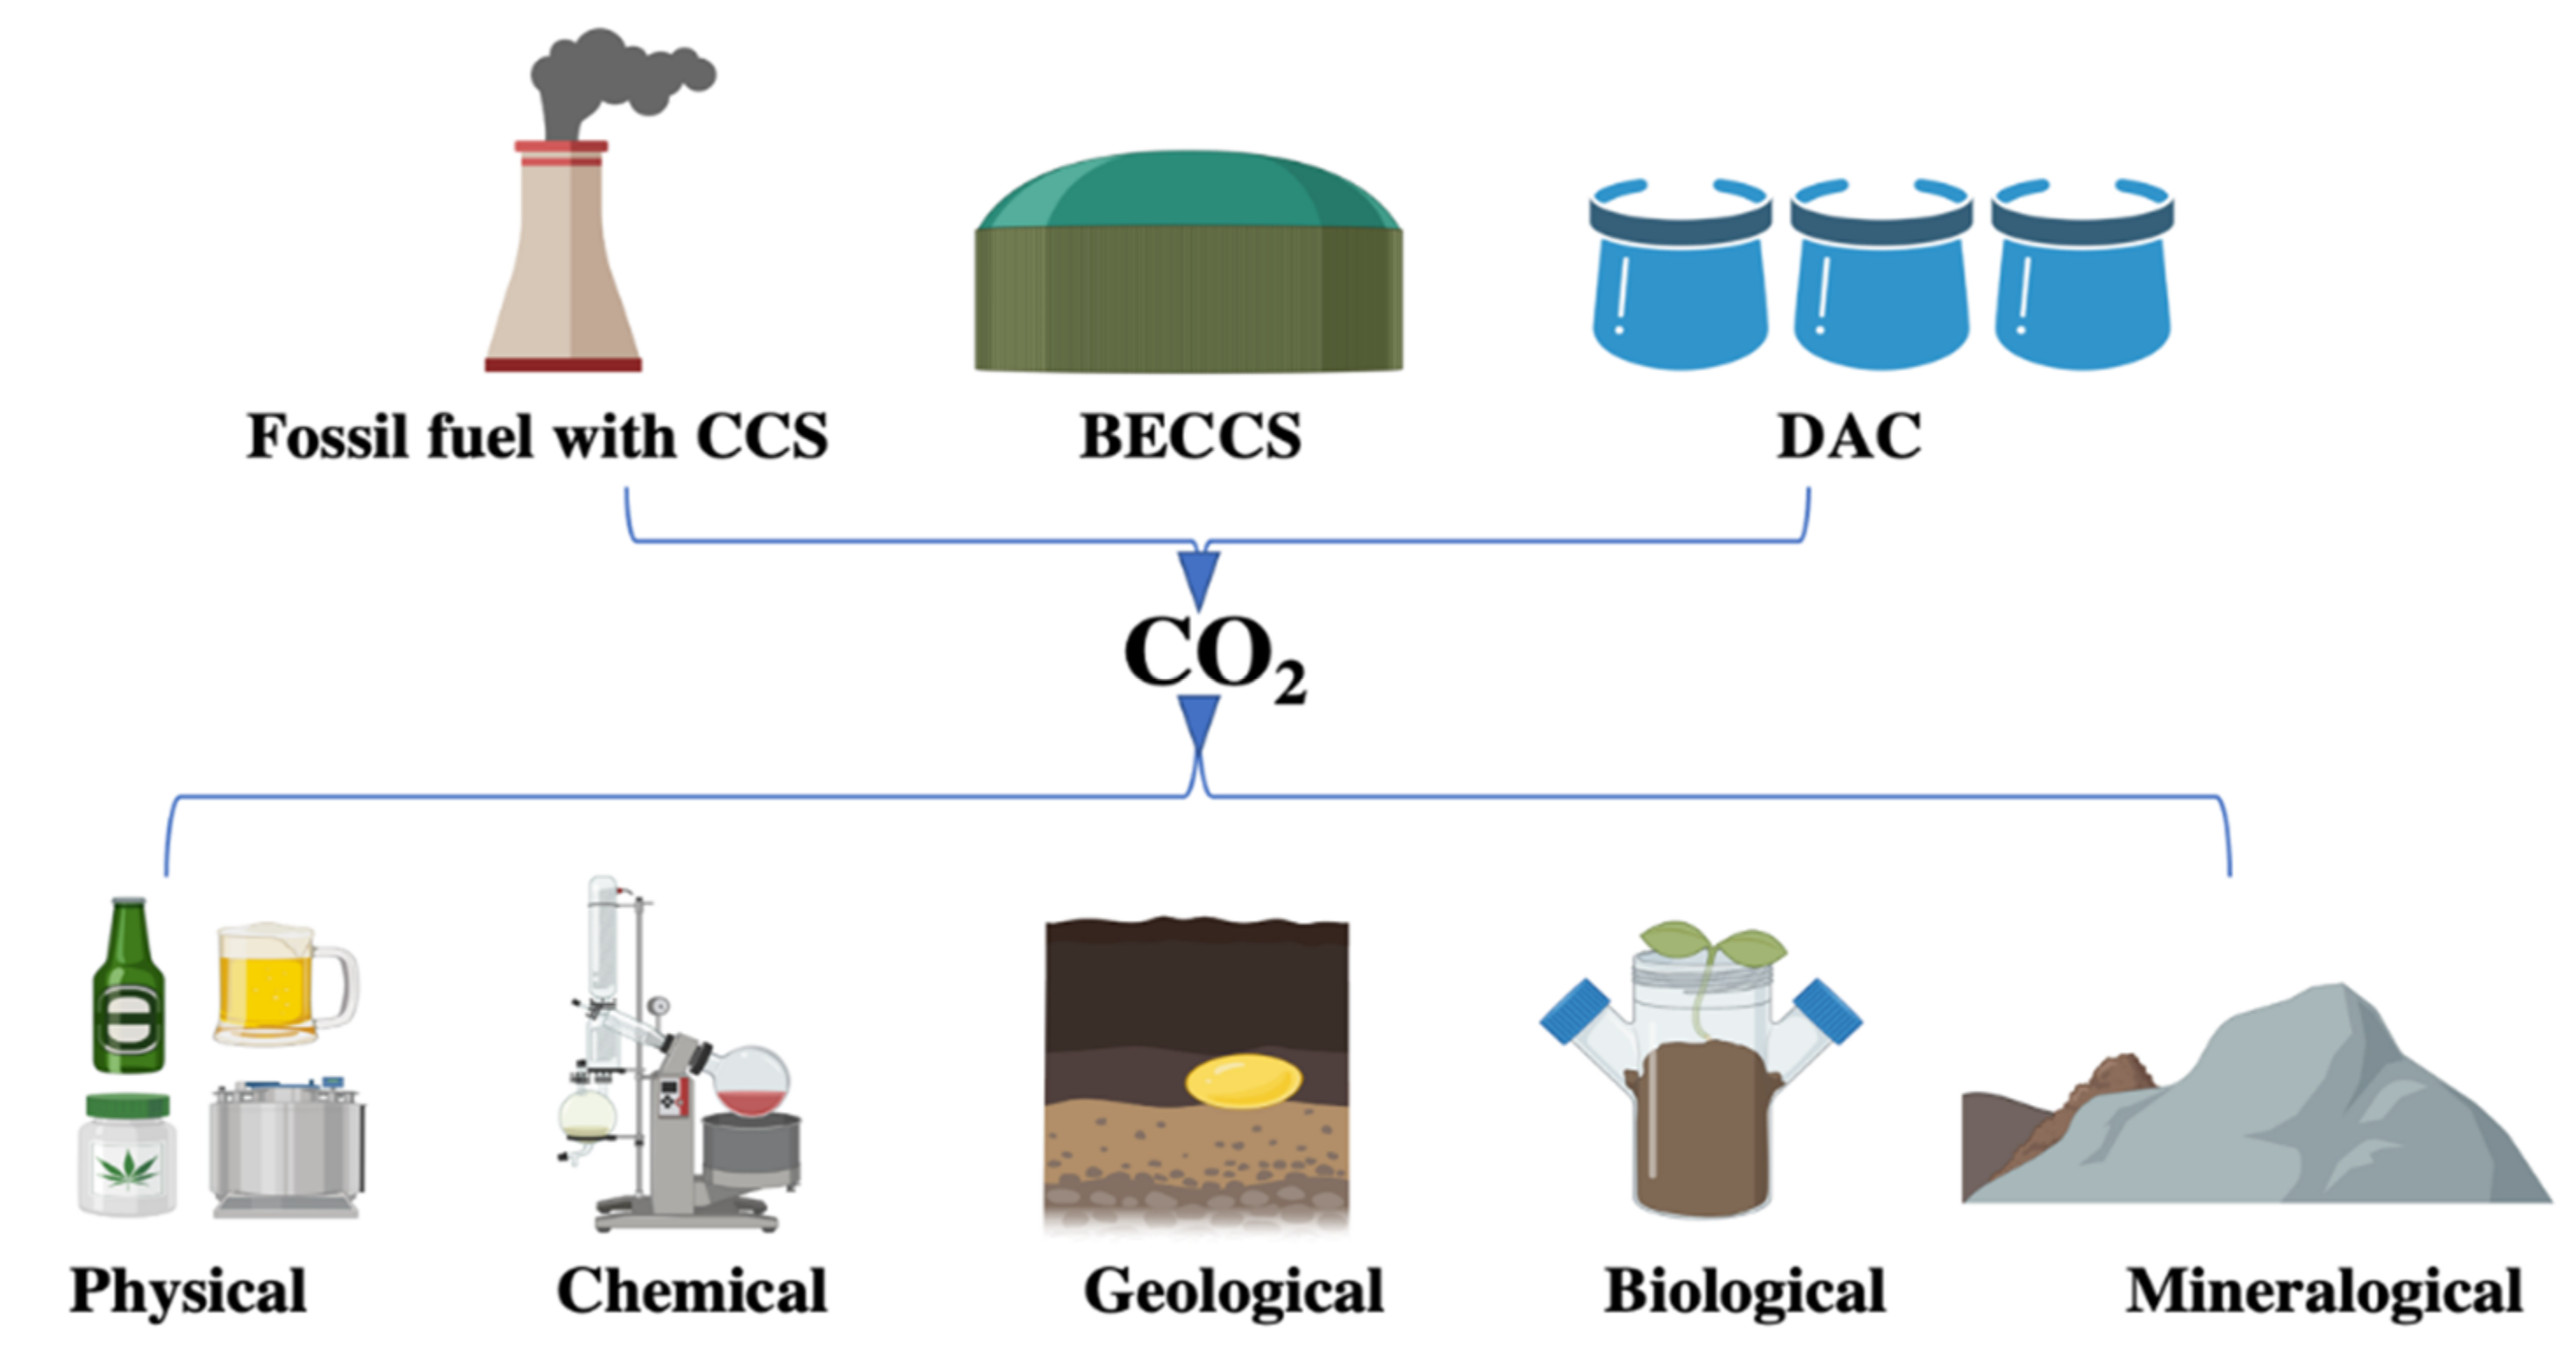
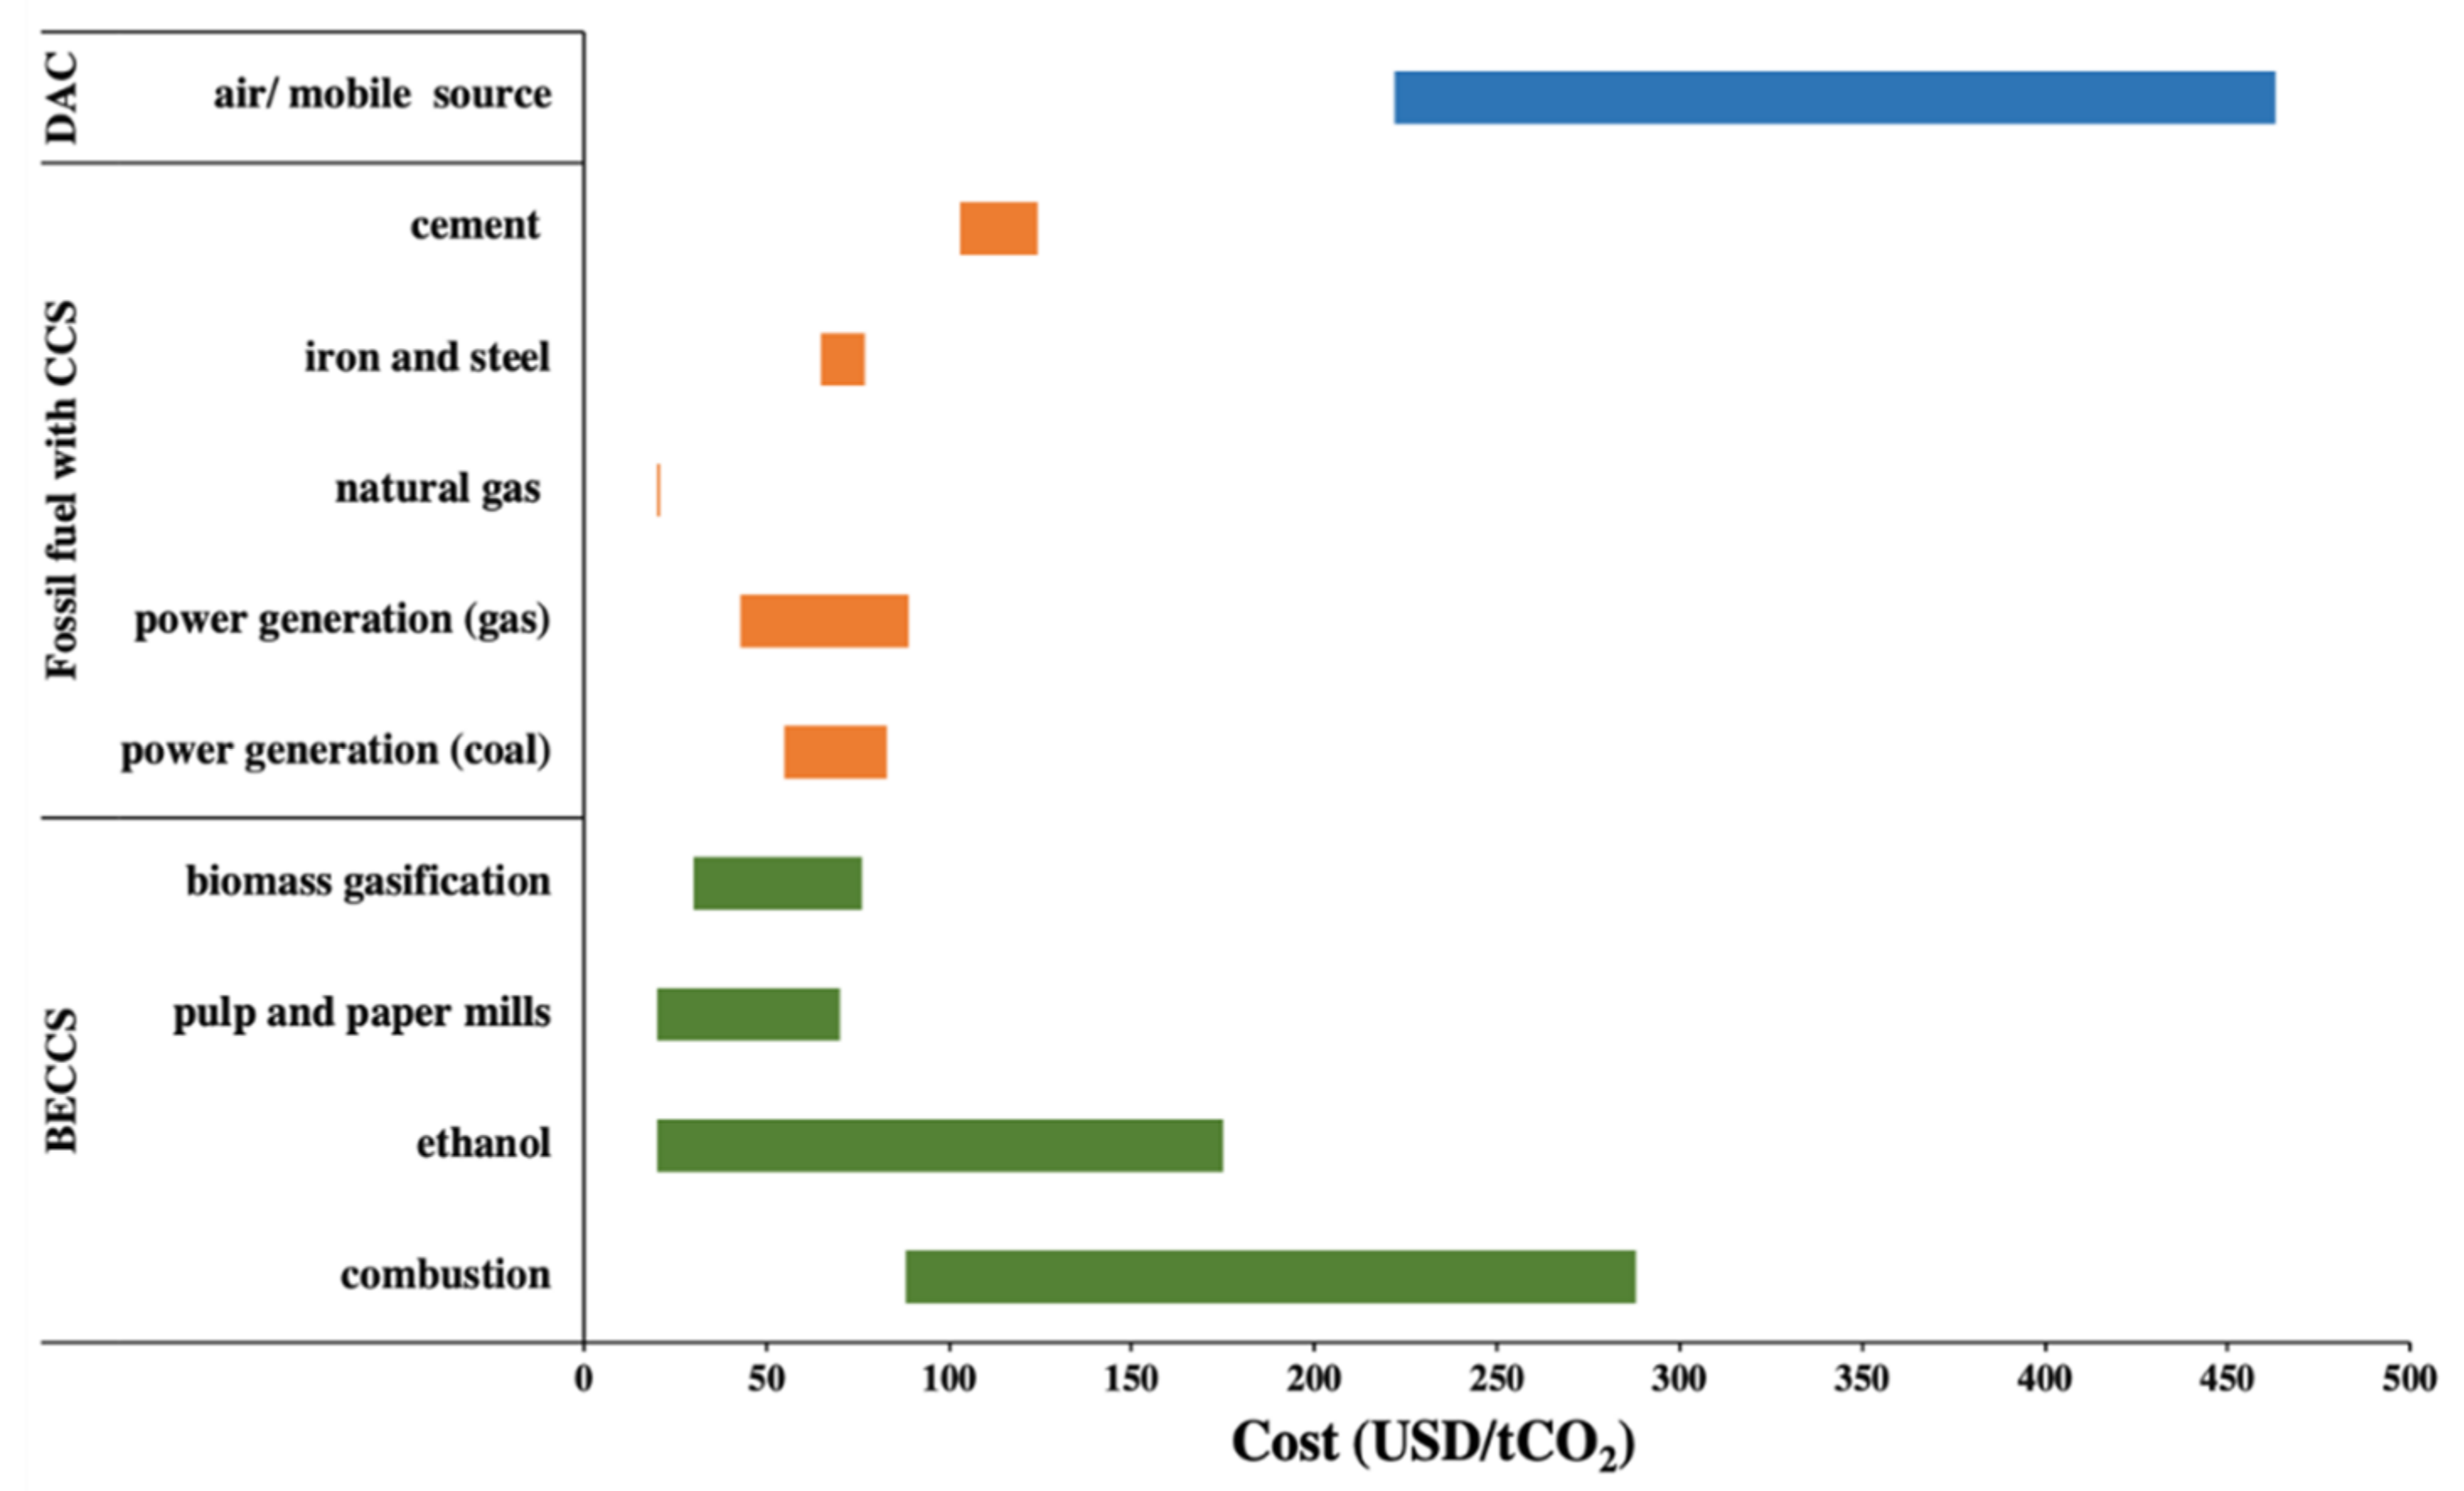
3.2. Negative Emissions Technologies (NETs)
4. Concluding Remarks and Future Perspectives
Author Contributions
Funding
Institutional Review Board Statement
Informed Consent Statement
Data Availability Statement
Conflicts of Interest
References
- Friedlingstein, P.; Jones, M.W.; O’Sullivan, M.; Andrew, R.M.; Bakker, D.C.E.; Hauck, J.; Le Quéré, C.; Peters, G.P.; Peters, W.; Pongratz, J.; et al. Global Carbon Budget 2021. Earth Syst. Sci. Data 2022, 14, 1917–2005. [Google Scholar] [CrossRef]
- Chen, F.; Yang, Q.; Zheng, N.; Wang, Y.; Huang, J.; Xing, L.; Li, J.; Feng, S.; Chen, G.; Kleissl, J. Assessment of concentrated solar power generation potential in China based on Geographic Information System (GIS). Appl. Energy 2022, 315, 119045. [Google Scholar] [CrossRef]
- He, J.; Li, Z.; Zhang, X.; Wang, H.; Dong, W.; Du, E.; Chang, S.; Ou, X.; Guo, S.; Tian, Z.; et al. Towards carbon neutrality: A study on China’s long-term low-carbon transition pathways and strategies. Environ. Sci. Ecotechnol. 2022, 9, 100134. [Google Scholar] [CrossRef]
- Chen, L.; Msigwa, G.; Yang, M.; Osman, A.I.; Fawzy, S.; Rooney, D.W.; Yap, P.-S. Strategies to achieve a carbon neutral society: A review. Environ. Chem. Lett. 2022, 20, 2277–2310. [Google Scholar] [CrossRef]
- Wang, Y.; Liu, Y.; Gu, B. COP26: Progress, Challenges, and Outlook. Adv. Atmos. Sci. 2022, 39, 1209–1216. [Google Scholar] [CrossRef]
- Sun, L.; Chen, W. Development and application of a multi-stage CCUS source–sink matching model. Appl. Energy 2017, 185, 1424–1432. [Google Scholar] [CrossRef]
- Global Carbon Project. Supplemental data of Global Carbon Budget 2021 (Version 1.0) [Data set]. Glob. Carbon Proj. 2021. [Google Scholar] [CrossRef]
- Chen, S.; Lu, N.; Fu, B.; Wang, S.; Deng, L.; Wang, L. Current and future carbon stocks of natural forests in China. For. Ecol. Manag. 2022, 511, 120137. [Google Scholar] [CrossRef]
- Piao, S.; He, Y.; Wang, X.; Chen, F. Estimation of China’s terrestrial ecosystem carbon sink: Methods, progress and prospects. Sci. China-Earth Sci. 2022, 65, 641–651. [Google Scholar] [CrossRef]
- Li, Y.; Chen, G.-K.; Lin, D.-M.; Chen, B.; Gao, L.-M.; Jian, X.; Yang, B.; Xu, W.-B.; Su, H.-X.; Lai, J.-S.; et al. Carbon storage and its distribution of forest ecosystems in Zhejiang Province, China. Chin. J. Plant Ecol. 2016, 40, 354–363. [Google Scholar] [CrossRef]
- Lu, F.; Hu, H.F.; Sun, W.J.; Zhu, J.J.; Liu, G.B.; Zhou, W.M.; Zhang, Q.F.; Shi, P.L.; Liu, X.P.; Wu, X.; et al. Effects of national ecological restoration projects on carbon sequestration in China from 2001 to 2010. Proc. Natl. Acad. Sci. USA 2018, 115, 4039–4044. [Google Scholar] [CrossRef] [PubMed]
- Zhao, M.; Yang, J.; Zhao, N.; Liu, Y.; Wang, Y.; Wilson, J.P.; Yue, T. Estimation of China’s forest stand biomass carbon sequestration based on the continuous biomass expansion factor model and seven forest inventories from 1977 to 2013. For. Ecol. Manag. 2019, 448, 528–534. [Google Scholar] [CrossRef]
- Yang, Y.; Shi, Y.; Sun, W.; Chang, J.; Zhu, J.; Chen, L.; Wang, X.; Guo, Y.; Zhang, H.; Yu, L.; et al. Terrestrial carbon sinks in China and around the world and their contribution to carbon neutrality. Sci. China-Life Sci. 2022, 65, 861–895. [Google Scholar] [CrossRef]
- Guo, Z.; Hu, H.; Li, P.; Li, N.; Fang, J. Spatio-temporal changes in biomass carbon sinks in China’s forests from 1977 to 2008. Sci. China Life Sci. 2013, 56, 661–671. [Google Scholar] [CrossRef]
- Li, Y.; Han, N.; Li, X.; Du, H.; Mao, F.; Cui, L.; Liu, T.; Xing, L. Spatiotemporal Estimation of Bamboo Forest Aboveground Carbon Storage Based on Landsat Data in Zhejiang, China. Remote Sens. 2018, 10, 898. [Google Scholar] [CrossRef]
- Zhang, F.J.; Yao, S.C.; Xue, B.; Lu, X.X.; Gui, Z.F. Organic carbon burial in Chinese lakes over the past 150 years. Quat. Int. 2017, 438, 94–103. [Google Scholar] [CrossRef]
- Phyoe, W.W.; Qin, Y.; Yu, N.X.; Wang, F.S. Sediment distribution and organic carbon burial in a subtropical hydroelectric reservoir. Aquat. Sci. 2020, 82, 13. [Google Scholar] [CrossRef]
- Mendonca, R.; Muller, R.A.; Clow, D.; Verpoorter, C.; Raymond, P.; Tranvik, L.J.; Sobek, S. Organic carbon burial in global lakes and reservoirs. Nat. Commun. 2017, 8, 1694. [Google Scholar] [CrossRef]
- Chen, C.; Huang, Z.; Jiang, P.; Chen, J.; Wu, J. Belowground Phytolith-Occluded Carbon of Monopodial Bamboo in China: An Overlooked Carbon Stock. Front. Plant Sci. 2018, 9, 1615. [Google Scholar] [CrossRef]
- Yang, C.; Ni, H.; Zhong, Z.; Zhang, X.; Bian, F. Changes in soil carbon pools and components induced by replacing secondary evergreen broadleaf forest with Moso bamboo plantations in subtropical China. Catena 2019, 180, 309–319. [Google Scholar] [CrossRef]
- Wingfield, M.J.; Brockerhoff, E.G.; Wingfield, B.D.; Slippers, B. Planted forest health: The need for a global strategy. Science 2015, 349, 832–836. [Google Scholar] [CrossRef] [PubMed]
- Luo, J.; Hong, W.; Yang, J.; Jiang, K.; Tan, Z.; He, Q.; Zhang, H.; Cui, J. Bombax ceiba is a Good Native Tree Species for Performing Reforestation to Restore Highly Degraded Tropical Forests in Hainan Island, China. Front. Environ. Sci. 2021, 9, 569428. [Google Scholar] [CrossRef]
- Pittau, F.; Krause, F.; Lumia, G.; Habert, G. Fast-growing bio-based materials as an opportunity for storing carbon in exterior walls. Build. Environ. 2018, 129, 117–129. [Google Scholar] [CrossRef]
- Osman, A.I.; Fawzy, S.; Farghali, M.; El-Azazy, M.; Elgarahy, A.M.; Fahim, R.A.; Maksoud, M.I.A.A.; Ajlan, A.A.; Yousry, M.; Saleem, Y.; et al. Biochar for agronomy, animal farming, anaerobic digestion, composting, water treatment, soil remediation, construction, energy storage, and carbon sequestration: A review. Environ. Chem. Lett. 2022, 20, 2385–2485. [Google Scholar] [CrossRef]
- Phyoe, W.W.; Wang, F. A review of carbon sink or source effect on artificial reservoirs. Int. J. Environ. Sci. Technol. 2019, 16, 2161–2174. [Google Scholar] [CrossRef]
- Mendonça, R.; Kosten, S.; Sobek, S.; Barros, N.; Cole, J.J.; Tranvik, L.; Roland, F. Hydroelectric carbon sequestration. Nat. Geosci. 2012, 5, 838–840. [Google Scholar] [CrossRef]
- Zhao, B.; Yao, P.; Li, D.; Yu, Z.G. Effects of river damming and delta erosion on organic carbon burial in the Changjiang Estuary and adjacent East China Sea inner shelf. Sci. Total Environ. 2021, 793, 14. [Google Scholar] [CrossRef]
- Keller, P.S.; Marce, R.; Obrador, B.; Koschorreck, M. Global carbon budget of reservoirs is overturned by the quantification of drawdown areas. Nat. Geosci. 2021, 14, 402–408. [Google Scholar] [CrossRef]
- Wang, M.; Wu, J.H.; Chen, H.; Yu, Z.C.; Zhu, Q.A.; Peng, C.H.; Anderson, N.J.; Luan, J.W. Temporal-spatial pattern of organic carbon sequestration by Chinese lakes since 1850. Limnol. Oceanogr. 2018, 63, 1283–1297. [Google Scholar] [CrossRef]
- Liu, C.; Liu, G.; Casazza, M.; Yan, N.; Xu, L.; Hao, Y.; Franzese, P.P.; Yang, Z. Current Status and Potential Assessment of China’s Ocean Carbon Sinks. Environ. Sci. Technol. 2022, 56, 6584–6595. [Google Scholar] [CrossRef]
- Chen, J.; Wang, D.; Li, Y.; Yu, Z.; Chen, S.; Hou, X.; White, J.R.; Chen, Z. The Carbon Stock and Sequestration Rate in Tidal Flats From Coastal China. Glob. Biogeochem. Cycles 2020, 34, e2020GB006772. [Google Scholar] [CrossRef]
- Kang, W.-X.; Zhao, Z.-H.; Tian, D.-L.; He, J.-N.; Deng, X.-W. CO2 exchanges between mangrove- and shoal wetland ecosystems and atmosphere in Guangzhou. J. Appl. Ecol. 2008, 19, 2605–2610. [Google Scholar]
- Zhang, L.; Guo, Z.-H.; Li, Z.-Y. Carbon storage and carbon sink of mangrove wetland: Research progress. J. Appl. Ecol. 2013, 24, 1153–1159. [Google Scholar]
- Yang, J.; Gao, J.; Liu, B.; Zhang, W. Sediment deposits and organic carbon sequestration along mangrove coasts of the Leizhou Peninsula, southern China. Estuar. Coast. Shelf Sci. 2014, 136, 3–10. [Google Scholar] [CrossRef]
- Zhu, Y.; Zhao, F.; Guo, J.; Wu, G.; Lin, G. Below-ground organic carbon distribution and burial characteristics of the Gaoqiao mangrove area in Zhanjiang, Guangdong, Southern China. Acta Ecol. Sin. 2016, 36, 7841–7849. [Google Scholar]
- Lunstrum, A.; Chen, L. Soil carbon stocks and accumulation in young mangrove forests. Soil Biol. Biochem. 2014, 75, 223–232. [Google Scholar] [CrossRef]
- Hu, Y.; Zhu, N.; Liao, B.; You, Y.; Tang, H. Carbon density and carbon fixation rate of mangroves of different restoration types in Qiao island. J. Cent. South Univ. For. Technol. 2019, 39, 101–107. [Google Scholar]
- Shao, X.-X.; Li, W.-H.; Wu, M.; Yang, W.-Y.; Jiang, K.-Y.; Ye, X.-Q. Dynamics of Carbon, Nitrogen and Phosphorus Storage of Three Dominant Marsh Plants in Hangzhou Bay Coastal Wetland. Environ. Sci. 2013, 34, 3451–3457. [Google Scholar]
- Xu, Z.; Zuo, P.; Wang, J.; Du, J. Effects of land use changes on the organic carbon storage of the soil in Yancheng coastal wetlands. Mar. Sci. Bull. 2014, 33, 444–450. [Google Scholar]
- Mei, X.; Zhang, X. Carbon storage and fixation by a typical wetland vegetation in Changjiang River Estuary—A case study of Phragmites australis in east beach of Chongming Island. Chin. J. Eco-Agric. 2008, 16, 269–272. [Google Scholar] [CrossRef]
- Jiao, N.; Liang, Y.; Zhang, Y.; Liu, J.; Zhang, Y.; Zhang, R.; Zhao, M.; Dai, M.; Zhai, W.; Gao, K.; et al. Carbon pools and fluxes in the China Seas and adjacent oceans. Sci. China Earth Sci. 2018, 61, 1535–1563. [Google Scholar] [CrossRef]
- Deng, B.; Zhang, J.; Wu, Y. Recent sediment accumulation and carbon burial in the East China Sea. Glob. Biogeochem. Cycles 2006, 20, GB3014. [Google Scholar] [CrossRef]
- Guo, X.H.; Zhai, W.D.; Dai, M.H.; Zhang, C.; Bai, Y.; Xu, Y.; Li, Q.; Wang, G.Z. Air–sea CO2 fluxes in the East China Sea based on multiple-year underway observations. Biogeosciences 2015, 12, 5495–5514. [Google Scholar] [CrossRef]
- Macreadie, P.I.; Costa, M.D.P.; Atwood, T.B.; Friess, D.A.; Kelleway, J.J.; Kennedy, H.; Lovelock, C.E.; Serrano, O.; Duarte, C.M. Blue carbon as a natural climate solution. Nat. Rev. Earth Environ. 2021, 2, 826–839. [Google Scholar] [CrossRef]
- Wang, Y.Y.; Dong, P.; Hu, W.J.; Chen, G.C.; Zhang, D.; Chen, B.; Lei, G.C. Modeling the Climate Suitability of Northernmost Mangroves in China under Climate Change Scenarios. Forests 2022, 13, 16. [Google Scholar] [CrossRef]
- He, Q.; Silliman, B.R. Climate Change, Human Impacts, and Coastal Ecosystems in the Anthropocene. Curr. Biol. 2019, 29, R1021–R1035. [Google Scholar] [CrossRef]
- Tang, J.; Ye, S.; Chen, X.; Yang, H.; Sun, X.; Wang, F.; Wen, Q.; Chen, S. Coastal blue carbon: Concept, study method, and the application to ecological restoration. Sci. China Earth Sci. 2018, 61, 637–646. [Google Scholar] [CrossRef]
- Zhang, M.; Cheng, Y.; Bao, Y.; Zhao, C.; Wang, G.; Zhang, Y.; Song, Z.; Wu, Z.; Qiao, F. Seasonal to decadal spatiotemporal variations of the global ocean carbon sink. Glob. Chang. Biol. 2022, 28, 1786–1797. [Google Scholar] [CrossRef] [PubMed]
- McKinley, G.A.; Fay, A.R.; Lovenduski, N.S.; Pilcher, D.J.; Annual, R. Natural Variability and Anthropogenic Trends in the Ocean Carbon Sink. Annu. Rev. Mar. Sci. 2017, 9, 125–150. [Google Scholar] [CrossRef]
- Saba, G.K.; Burd, A.B.; Dunne, J.P.; Hernández-León, S.; Martin, A.H.; Rose, K.A.; Salisbury, J.; Steinberg, D.K.; Trueman, C.N.; Wilson, R.W.; et al. Toward a better understanding of fish-based contribution to ocean carbon flux. Limnol. Oceanogr. 2021, 66, 1639–1664. [Google Scholar] [CrossRef]
- Tseng, C.-M.; Liu, K.K.; Gong, G.C.; Shen, P.Y.; Cai, W.J. CO2 uptake in the East China Sea relying on Changjiang runoff is prone to change. Geophys. Res. Lett. 2011, 38, L24609. [Google Scholar] [CrossRef]
- Liu, Q.; Guo, X.; Yin, Z.; Zhou, K.; Roberts, E.G.; Dai, M. Carbon fluxes in the China Seas: An overview and perspective. Sci. China Earth Sci. 2018, 61, 1564–1582. [Google Scholar] [CrossRef]
- Song, J.; Qu, B.; Li, X.; Yuan, H.; Li, N.; Duan, L. Carbon sinks/sources in the Yellow and East China Seas—Air-sea interface exchange, dissolution in seawater, and burial in sediments. Sci. China Earth Sci. 2018, 61, 1583–1593. [Google Scholar] [CrossRef]
- Zhu, E.; Deng, J.; Zhou, M.; Gan, M.; Jiang, R.; Wang, K.; Shahtahmassebi, A. Carbon emissions induced by land-use and land-cover change from 1970 to 2010 in Zhejiang, China. Sci. Total Environ. 2019, 646, 930–939. [Google Scholar] [CrossRef]
- Zhang, P.; He, J.; Hong, X.; Zhang, W.; Qin, C.; Pang, B.; Li, Y.; Liu, Y. Carbon sources/sinks analysis of land use changes in China based on data envelopment analysis. J. Clean. Prod. 2018, 204, 702–711. [Google Scholar] [CrossRef]
- Deng, L.; Liu, S.; Kim, D.G.; Peng, C.; Sweeney, S.; Shangguan, Z. Past and future carbon sequestration benefits of China’s grain for green program. Glob. Environ. Chang. 2017, 47, 13–20. [Google Scholar] [CrossRef]
- National Bureau of Statistics of China. National Statistical Yearbook—2021; China Statistics Press: Beijing, China, 2022. [Google Scholar]
- Curtis, P.S.; Gough, C.M. Forest aging, disturbance and the carbon cycle. New Phytol. 2018, 219, 1188–1193. [Google Scholar] [CrossRef] [PubMed]
- Pugh, T.A.M.; Lindeskog, M.; Smith, B.; Poulter, B.; Arneth, A.; Haverd, V.; Calle, L. Role of forest regrowth in global carbon sink dynamics. Proc. Natl. Acad. Sci. USA 2019, 116, 4382–4387. [Google Scholar] [CrossRef] [PubMed]
- National Bureau of Statistics of China (Ed.) China Statistical Yearbook on Environment 2021; China Statistics Press: Beijing, China, 2022. [Google Scholar]
- Cook-Patton, S.C.; Leavitt, S.M.; Gibbs, D.; Harris, N.L.; Lister, K.; Anderson-Teixeira, K.J.; Briggs, R.D.; Chazdon, R.L.; Crowther, T.W.; Ellis, P.W.; et al. Mapping carbon accumulation potential from global natural forest regrowth. Nature 2020, 585, 545–550. [Google Scholar] [CrossRef]
- Lu, X.A.-O.; Vitousek, P.A.-O.; Mao, Q.; Gilliam, F.S.; Luo, Y.; Turner, B.L.; Zhou, G.; Mo, J. Nitrogen deposition accelerates soil carbon sequestration in tropical forests. Proc. Natl. Acad. Sci. USA 2021, 118, e2020790118. [Google Scholar] [CrossRef]
- Du, E.; de Vries, W. Nitrogen-induced new net primary production and carbon sequestration in global forests. Environ. Pollut. 2018, 242, 1476–1487. [Google Scholar] [CrossRef] [PubMed]
- Yu, Y.; Guo, Z.; Wu, H.; Kahmann, J.A.; Oldfield, F. Spatial changes in soil organic carbon density and storage of cultivated soils in China from 1980 to 2000. Glob. Biogeochem. Cycles 2009, 23, GB2021. [Google Scholar] [CrossRef]
- Gao, B.; Huang, T.; Ju, X.; Gu, B.; Huang, W.; Xu, L.; Rees, R.M.; Powlson, D.S.; Smith, P.; Cui, S. Chinese cropping systems are a net source of greenhouse gases despite soil carbon sequestration. Glob. Chang. Biol. 2018, 24, 5590–5606. [Google Scholar] [CrossRef] [PubMed]
- Chen, P.; Yang, J.; Jiang, Z.; Zhu, E.; Mo, C. Prediction of future carbon footprint and ecosystem service value of carbon sequestration response to nitrogen fertilizer rates in rice production. Sci. Total Environ. 2020, 735, 139506. [Google Scholar] [CrossRef] [PubMed]
- Wang, H.; Wang, S.; Yu, Q.; Zhang, Y.; Wang, R.; Li, J.; Wang, X. No tillage increases soil organic carbon storage and decreases carbon dioxide emission in the crop residue-returned farming system. J. Environ. Manag. 2020, 261, 110261. [Google Scholar] [CrossRef]
- Khatiwala, S.; Primeau, F.; Hall, T. Reconstruction of the history of anthropogenic CO2 concentrations in the ocean. Nature 2009, 462, 346–349. [Google Scholar] [CrossRef] [Green Version]
- Jankowska, E.; Pelc, R.; Alvarez, J.; Mehra, M.; Frischmann, C.J. Climate benefits from establishing marine protected areas targeted at blue carbon solutions. Proc. Natl. Acad. Sci. USA 2022, 119, e2121705119. [Google Scholar] [CrossRef]
- Wang, F.; Harindintwali, J.D.; Yuan, Z.; Wang, M.; Wang, F.; Li, S.; Yin, Z.; Huang, L.; Fu, Y.; Li, L.; et al. Technologies and perspectives for achieving carbon neutrality. Innovation 2021, 2, 100180. [Google Scholar] [CrossRef]
- Hu, W.; Wang, Y.; Zhang, D.; Yu, W.; Chen, G.; Xie, T.; Liu, Z.; Ma, Z.; Du, J.; Chao, B.; et al. Mapping the potential of mangrove forest restoration based on species distribution models: A case study in China. Sci. Total Environ. 2020, 748, 142321. [Google Scholar] [CrossRef]
- Shao, G.; Liu, B.; Li, C. Evaluation of carbon dioxide capacity and the effects of decomposition and spatiotemporal differentiation of seawater in China’s main sea area based on panel data from 9 coastal provinces in China. Acta Ecol. Sin. 2019, 39, 2614–2625. [Google Scholar]
- Gu, H.; Yin, K. Forecasting algae and shellfish carbon sink capability on fractional order accumulation grey model. Math. Biosci. Eng. 2022, 19, 5409–5427. [Google Scholar] [CrossRef]
- Statistics Bureau of Zhejiang Province (Ed.) Zhejiang Statistical Yearbook 2021; China Statistics Press: Beijing, China, 2022. [Google Scholar]
- Tréguer, P.; Bowler, C.; Moriceau, B.; Dutkiewicz, S.; Gehlen, M.; Aumont, O.; Bittner, L.; Dugdale, R.; Finkel, Z.; Iudicone, D.; et al. Influence of diatom diversity on the ocean biological carbon pump. Nat. Geosci. 2018, 11, 27–37. [Google Scholar] [CrossRef]
- Yan, Z.; Shen, T.; Li, W.; Cheng, W.; Wang, X.; Zhu, M.; Yu, Q.; Xiao, Y.; Yu, L. Contribution of microalgae to carbon sequestration in a natural karst wetland aquatic ecosystem: An in-situ mesocosm study. Sci. Total Environ. 2021, 768, 144387. [Google Scholar] [CrossRef] [PubMed]
- Qiu, Y.; Laws, E.A.; Wang, L.; Wang, D.; Liu, X.; Huang, B. The potential contributions of phytoplankton cells and zooplankton fecal pellets to POC export fluxes during a spring bloom in the East China Sea. Cont. Shelf Res. 2018, 167, 32–45. [Google Scholar] [CrossRef]
- Martin, P.; van der Loeff, M.R.; Cassar, N.; Vandromme, P.; d’Ovidio, F.; Stemmann, L.; Rengarajan, R.; Soares, M.; González, H.E.; Ebersbach, F.; et al. Iron fertilization enhanced net community production but not downward particle flux during the Southern Ocean iron fertilization experiment LOHAFEX. Glob. Biogeochem. Cycles 2013, 27, 871–881. [Google Scholar] [CrossRef]
- Wang, Y.; Zhou, S.; Wang, Y.; Qin, X.; Chen, F.; Ou, X. Comprehensive assessment of the environmental impact of China’s nuclear and other power generation technologies. J. Tsinghua Univ. (Sci. Technol.) 2021, 61, 377–384. [Google Scholar] [CrossRef]
- Sutherland, B.R. Pricing CO2 Direct Air Capture. Joule 2019, 3, 1571–1573. [Google Scholar] [CrossRef]
- Chen, W.; Lu, X.; Lei, Y.; Chen, J.-F. A Comparison of Incentive Policies for the Optimal Layout of CCUS Clusters in China’s Coal-Fired Power Plants Toward Carbon Neutrality. Engineering 2021, 7, 1692–1695. [Google Scholar] [CrossRef]
- National Academies of Sciences, Engineering, and Medicine; Division on Earth and Life Studies; Ocean Studies Board; Board on Chemical Sciences and Technology; Board on Earth Sciences and Resources; Board on Agriculture and Natural Resources; Board on Energy and Environmental Systems; Board on Atmospheric Sciences and Climate; Committee on Developing a Research Agenda for Carbon Dioxide Removal and Reliable Sequestration. Negative Emissions Technologies and Reliable Sequestration: A Research Agenda; National Academies Press: Washington, DC, USA, 2018. [Google Scholar]
- Fuss, S.; Lamb, W.F.; Callaghan, M.W.; Hilaire, J.; Creutzig, F.; Amann, T.; Beringer, T.; de Oliveira Garcia, W.; Hartmann, J.; Khanna, T.; et al. Negative emissions—Part 2: Costs, potentials and side effects. Environ. Res. Lett. 2018, 13, 063002. [Google Scholar] [CrossRef]
- Vaughan, N.E.; Gough, C.; Mander, S.; Littleton, E.W.; Welfle, A.; Gernaat, D.E.H.J.; van Vuuren, D.P. Evaluating the use of biomass energy with carbon capture and storage in low emission scenarios. Environ. Res. Lett. 2018, 13, 044014. [Google Scholar] [CrossRef]

| Type | Area (km2) | Carbon Sink Rate (t CO2 km−2 yr−1) | Carbon Sequestration Capacity (t CO2 yr−1) |
|---|---|---|---|
| Coastal sea | 260,000 | 53.90–6022.98 | 1.40 × 10⁷–1.57 × 10⁹ |
| Forest (without bamboo forests) | 52,000 | 275.35–502.33 | 1.44 × 10⁷–2.61 × 10⁷ |
| Bamboo forest | 9060 | 277.90–294.40 | 2.52 × 10⁶–2.67 × 10⁶ |
| Tidal flat | 1580 | 84.33–784.67 | 1.33 × 10⁵–1.24 × 10⁶ |
| Saltmarsh | 180 | 375.22–6453.33 | 6.75 × 10⁴–1.16 × 10⁶ |
| Lakes | 2200 | 52.40–125.77 | 1.15 × 10⁵–2.77 × 10⁵ |
| Reservoirs | 1300 | 122.47–1067 | 1.59 × 10⁵–1.39 × 10⁶ |
| Mangrove | 0.2 | 320.28–3374 | 64.1–675 |
| Ecosystem | Method | Carbon Sink (CO2-eq) per Unit | Increasing Carbon Sink (Mt CO2-eq yr−1) | ||
|---|---|---|---|---|---|
| By 2030 | By 2060 | Maximum | |||
| Farmland | Proper N fertilizer | 97.7 t km−2 yr−1 | 1.26 | 1.26 | 1.26 |
| No tillage | 195 t km−2 yr−1 | 2.51 | 2.51 | 2.51 | |
| Forest | Rehabilitated abandoned mines | 1158 t km−2 yr−1 | 0.08 | 0.08 | 0.08 |
| New N inputs | 175.08 t km−2 yr−1 | 10.67 | 10.67 | 10.67 | |
| Mangroves | Planting mangroves | 599.51 t km−2 yr−1 | 0.004 | 0.016 | 0.028 |
| Shellfish | Increase the production | 0.3561 t/t shellfish (wet weight) | 0.17 | 0.71 | 1.29 |
| Algae | Increase the production | 0.2034 t/t algae (wet weight) | 0.14 | 0.40 | 0.40 |
| Phytoplankton | Fertilizing | 2896 t CO2-eq km−2 yr–1 | NA | NA | 7.31 |
| Total | 14.84 | 15.65 | 23.54 | ||
| Program | Solar Power | Wind Power | Hydropower | Biomass Power | Nuclear Power | Ocean Power |
|---|---|---|---|---|---|---|
| Example | Wanxiang Solar PV | ZNG Jiaxing No.1 Offshore Wind Farm | Xin’anjiang Hydropower Station | ZNG Longquan Biomass Power Plant | Qinshan Nuclear Power Plant | LHD Tidal Power Generation Project |
| Total Capacity in 2020 (Million kW) | 15.17 | 1.86 | 11.71 | 2.40 | 9.11 | 0.0058 |
| Targets in 2025 (Million kW) | 27.50 | 6.41 | 15.26 | 3.00 | 10.31 | 0.0058 |
| Electrical Share in 2020 (%) | 14.90 | 1.80 | 11.50 | 2.40 | 9.00 | 0.0057 |
| CO2 emissions per unit (gCO2/kWh) | 15.9–29.2 | 7.1–8.6 | 40.6–44.4 | 20.0–70.0 | 10.9 | 8 |
Publisher’s Note: MDPI stays neutral with regard to jurisdictional claims in published maps and institutional affiliations. |
© 2022 by the authors. Licensee MDPI, Basel, Switzerland. This article is an open access article distributed under the terms and conditions of the Creative Commons Attribution (CC BY) license (https://creativecommons.org/licenses/by/4.0/).
Share and Cite
Shu, Y.; Chen, J.; Huang, Y.; Fu, W. Sustainable Approaches to Realize Carbon Neutrality in China: A Case Study of Zhejiang Province. J. Mar. Sci. Eng. 2022, 10, 1351. https://doi.org/10.3390/jmse10101351
Shu Y, Chen J, Huang Y, Fu W. Sustainable Approaches to Realize Carbon Neutrality in China: A Case Study of Zhejiang Province. Journal of Marine Science and Engineering. 2022; 10(10):1351. https://doi.org/10.3390/jmse10101351
Chicago/Turabian StyleShu, Yuexuan, Jiwei Chen, Yifan Huang, and Weiqi Fu. 2022. "Sustainable Approaches to Realize Carbon Neutrality in China: A Case Study of Zhejiang Province" Journal of Marine Science and Engineering 10, no. 10: 1351. https://doi.org/10.3390/jmse10101351
APA StyleShu, Y., Chen, J., Huang, Y., & Fu, W. (2022). Sustainable Approaches to Realize Carbon Neutrality in China: A Case Study of Zhejiang Province. Journal of Marine Science and Engineering, 10(10), 1351. https://doi.org/10.3390/jmse10101351