Article

Features of the Field of Internal Waves on the Abkhazian Shelf of the Black Sea according to Remote Sensing Data and In Situ Measurements

1
AEROCOSMOS Research Institute for Aerospace Monitoring, 105064 Moscow, Russia
2
Shirshov Institute of Oceanology, Russian Academy of Sciences, 117997 Moscow, Russia
3
Andreyev Acoustics Institute, 117036 Moscow, Russia
4
Obukhov Institute of Atmospheric Physics, Russian Academy of Sciences, 119017 Moscow, Russia
*
Author to whom correspondence should be addressed.
J. Mar. Sci. Eng. 2022, 10(10), 1342; https://doi.org/10.3390/jmse10101342
Submission received: 9 August 2022 / Revised: 11 September 2022 / Accepted: 18 September 2022 / Published: 21 September 2022
(This article belongs to the Special Issue Satellite Monitoring of Ocean)

Abstract

:
The field of internal waves in the Black Sea is quite significant. The Black Sea shelf is of particular interest, but it has not been studied enough in some specific regions. For example, a narrow and steep shelf of Abkhazia has been poorly explored. Particularly unexplored are the actual parameters and causes of the generation of internal waves in this area. In this article, we have attempted to fill this gap by analyzing remote sensing data and in situ data. An analysis of a set of optical multispectral satellite images (Sentinel-2, Landsat-8) and a collection of sea-truth data of the shelf zone of Abkhazia was carried out to identify features of internal wave fields of this region. In situ data were acquired over 9 years using ADCP, CTD, and SVP probes and moored stations with point and line temperature sensors. It is shown that internal waves are widespread on the Abkhazian shelf. They appear as trains of short-period waves (as a rule, soliton-like). The quantitative parameters and features of internal waves are shown and analyzed. The form of manifestation and direction of internal wave trains’ travel depend on the mechanisms of their origin, among which are the transformations of inertial internal waves, generation by river plumes, and submesoscale structures. In general, the article is the most complete and relevant study of the field of internal waves on the shelf of Abkhazia.

1. Introduction

Studies of internal waves in the Black Sea have been carried out for a long time. A comparison of the measured frequency spectra with the Garrett–Munk model spectrum showed a reduced energy level of Black Sea internal waves in comparison with ocean waves [1], which is explained by the absence of the main source of internal waves (tides) in the closed Black Sea. The absence of tides here is compensated by the presence of various other sources of internal waves. As a result, the field of internal waves in the Black Sea is quite significant. It contains packets of intense nonlinear internal waves even with heights of 10 m or more [2,3].
The Black Sea shelf is of particular interest. This area has been actively studied for many years using both conventional field methods and remote sensing methods [4,5,6,7,8,9,10]. The use of remote sensing to study internal waves in the Black Sea shelf zone, which has become widespread in the last decade due to the availability of time series of decameter-resolution satellite images (first of all, Landsat and Sentinel), has made it possible to obtain new important results [11,12,13,14].
In this article, we analyze three regions of the Abkhazian shelf (see Figure 1). These are the water areas near Cape Sukhumsky (Figure 1, mark A), the water areas near the mouth of the Kodor River (Figure 1, mark B) as well as the shelf area adjacent to the Galsky region (Figure 1, mark C). We have been performing a series of preliminary studies of internal waves and currents in the northeastern section of the shelf zone of the Black Sea (which includes the Gelendzhik and Abkhazian shelves) for almost two decades [15]. Compared to the Gelendzhik shelf, the shelf of Abkhazia has been little explored. Particularly unexplored are the actual parameters and causes of the generation of internal waves in this area.
The specific features of the shelf, which help to use remote sensing in the optical range productively, are desalinated plumes propagating from the plumes of rivers flowing into the sea [16,17,18,19]. The Abkhazian shelf is quite narrow and has a steep bottom slope. In the area of Cape Sukhumsky, it reaches 23–25°, almost from the coastline [20]. This circumstance impacts the field of internal waves.
The field of internal waves at this shelf, as in the ocean, consists of long-period components and short-period internal waves. The range of long internal waves includes internal inertial waves with a period close to 17 h. Short-period waves have a period from several minutes to tens of minutes. Internal inertial waves play a significant role in the Black Sea, creating regular thermocline shifts, most pronounced after strong wind impacts [21]. A feature of the inertial internal waves of the Abkhazian shelf is their large amplitudes, the maximum on the entire Black Sea shelf [15]. Figure 2 shows an example of a multi-day record near Cape Sukhumsky (mark A in Figure 1). Analysis of Figure 2 shows that inertial oscillations cover the entire water column, shifting the thermocline vertically by 15–20 m.
The purpose of this effort is to reveal and analyze the differential peculiarities of the internal wave field of the Abkhazian shelf based on our accumulated in situ and remote sensing data. The mere fact of the measurement and presentation of internal wave parameters to the scientific community seems to be an important work as internal waves in this region of the Black Sea have been previously studied very scantily. The paper presents an analysis of satellite images of decameter-resolution, which makes it possible to accurately determine the number of parameters of internal waves and the geometric dimensions of trains. Separately, an analysis of quasi-synchronous imagery of internal wave packets made by different satellites is carried out; the difference in the times of surveys allows us to make estimates of propagation velocities of those waves. The work is not limited to fixing the actual parameters of internal waves. The problem of identifying the directions of wave train travel in the shelf zone is solved based on the analysis of a set of satellite images of the three studied regions, followed by the identification of mechanisms for generating internal waves. The revealed generalized features of the internal wave field are interpreted from a scientific point of view, taking into account state-of-the-art theoretical ideas about the phenomena under study. The analyzed material is related to expeditionary work at sea on the shelf of Abkhazia, and this is a costly work that we have carried out systematically since 2013. Based on the aforesaid, the presented results and their analysis are relevant and have scientific significance and novelty.

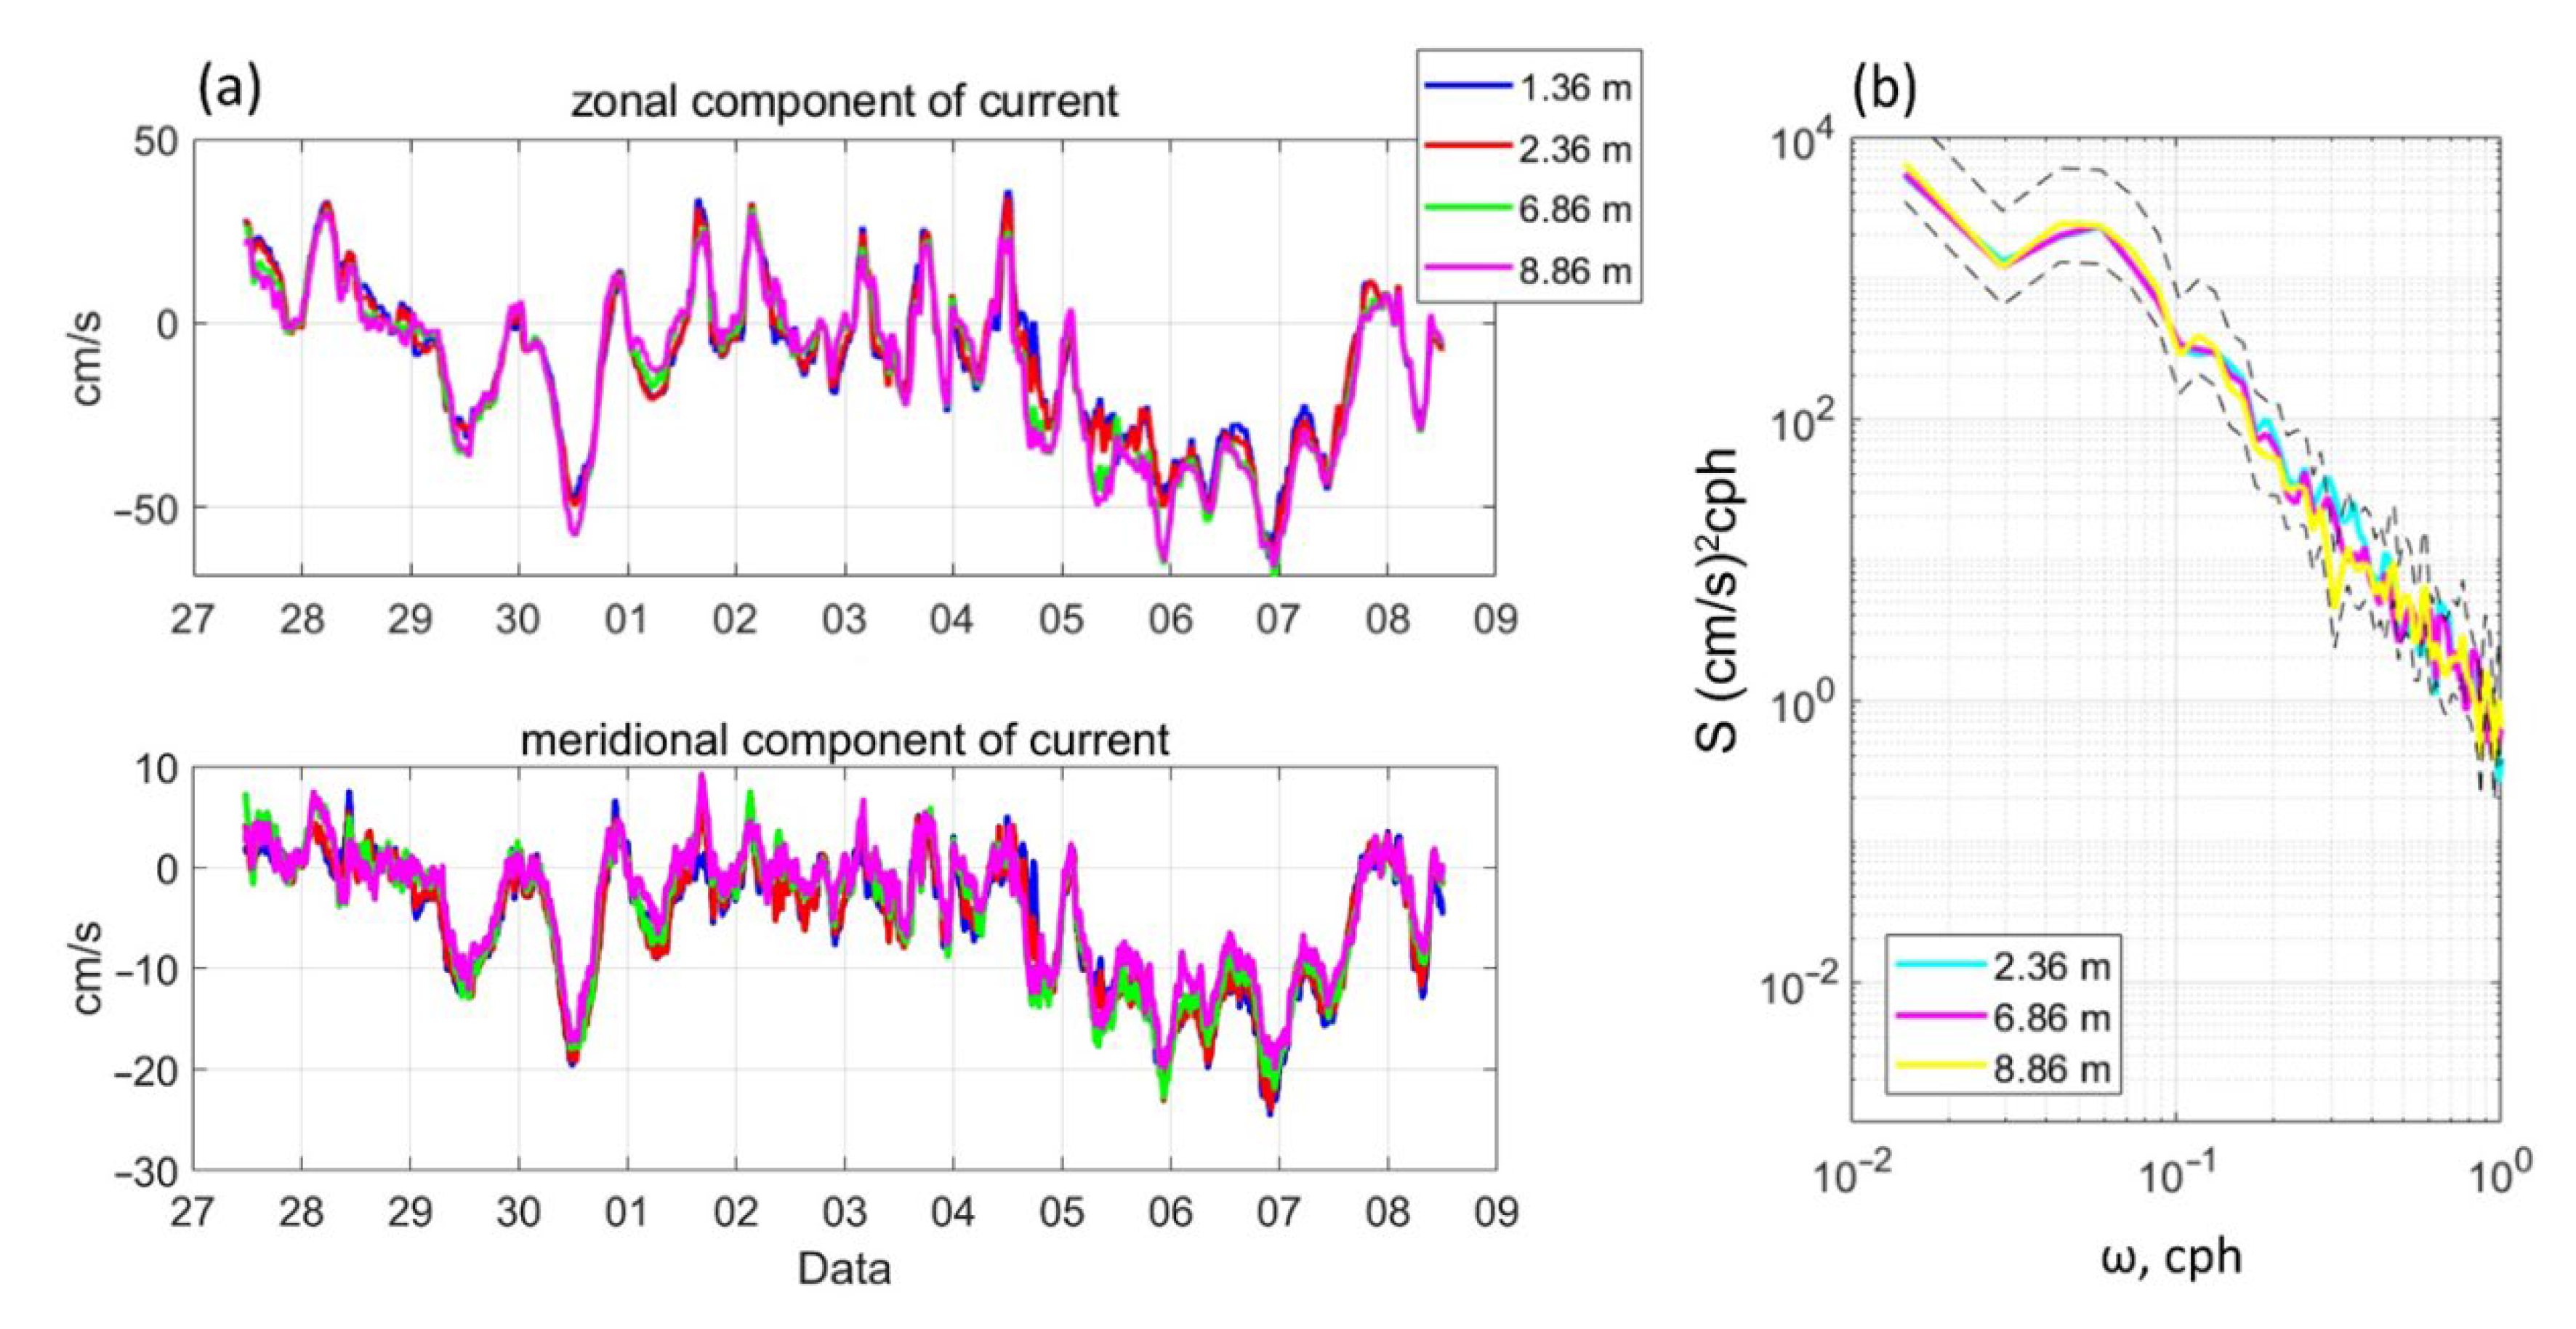
2. Methods for Measuring and Processing the Obtained Data

The main region of field measurements refers to the water area near Cape Sukhumsky (see Figure 1, mark A). In the sea, internal wave meters were installed, i.e., vertical chains of thermistors and autonomous line temperature sensors (LTS) [22]. Unlike point temperature sensors, an LTS measures the average temperature of the layer it covers by tracking fluctuations caused by internal waves. Multi-day continuous recording of currents was carried out using an ADCP Rio Grande 600 kHz current meter lowered from a stationary platform located on the shelf at a depth of 13 m. The vertical shift of temperature and sound velocity in the coastal zone was monitored using CTD and SVP probes. A more detailed description of such measurements in this area is given in [23].
The most useful are contact (in situ) measurements of sea parameters compared with satellite images of the sea surface. However, cases of obtaining quasi-synchronous satellite and in situ sea truth data are rare. Nevertheless, the article will present data from measurements performed simultaneously by in situ and remote sensing methods when a cyclonic submesoscale eddy was recorded near Cape Sukhumsky. This eddy is well identified on two optical satellite images obtained one after the other with an interval of ~16 min. Satellite images that are not accompanied by contact measurements are valuable; nevertheless, we used interesting samples of such images to analyze both the parameters of internal waves and the mechanisms of their generation.
In this study, we used optical multispectral decameter-resolution imagery obtained by the Landsat-8 [24] and Sentinel-2 [25] satellite systems. Image acquisition and preprocessing were performed using the Google Earth Engine [26] cloud environment (see Table 1 and Table 2 and Appendix A, which shows aspects of satellite images and their preprocessing, as well as the code used). Further processing was carried out using the ENVI 4.4 (ITT VIS, Boulder, Colorado, United States) [27] and QGIS 3.0.1 (QGIS.ORG, association Grüt, Switzerland) [28] software.
It is known [16,29,30] that internal waves of various origins lead to local changes in fields of current velocity and modulation of the spatial structure of surface waves, which can be recorded by both optical and radar remote sensing systems. The mechanisms and features of the appearance of optical contrasts in satellite images of the sea surface associated with internal waves have been discussed in numerous works (see, for example, [29,31,32,33,34]). Summarizing these mechanisms and features, we can point out that orbital currents of internal waves form areas of convergence and divergence of waters in the near-surface layer of the sea, which in turn creates alternating “strips” of smoothed slicks and rips [35], which in turn leads to the appearance of corresponding contrasts [16,33,34]. Such “strips” have a characteristic structure and can be interpreted [32,36,37,38,39].
In this study, the surface manifestations of internal waves were recorded and studied using satellite data. The location of the detected wave trains, the distances between the wave crests, and the direction of wave propagation were determined. These actual data were used afterward in discussions and analysis performed in conjunction with sea truth observations. For a better interpretation of surface manifestations of internal waves, the histogram of image brightness was transformed (transformation parameters were selected by the operator in an interactive mode) [26,27]. To determine the wavelengths, there were estimated the distances between the lines, which correspond to the brightest areas of the surface manifestations of internal waves in optical multispectral true color images.
In addition, an experiment was carried out to study the displacement of trains of internal waves recorded from satellite images obtained with a time difference of ~16 min. In this experiment, a map of the position of the crests of internal waves recorded at various points in time was constructed. Using this map, approximate values of the velocity and direction of propagation of internal waves were estimated and analyzed.

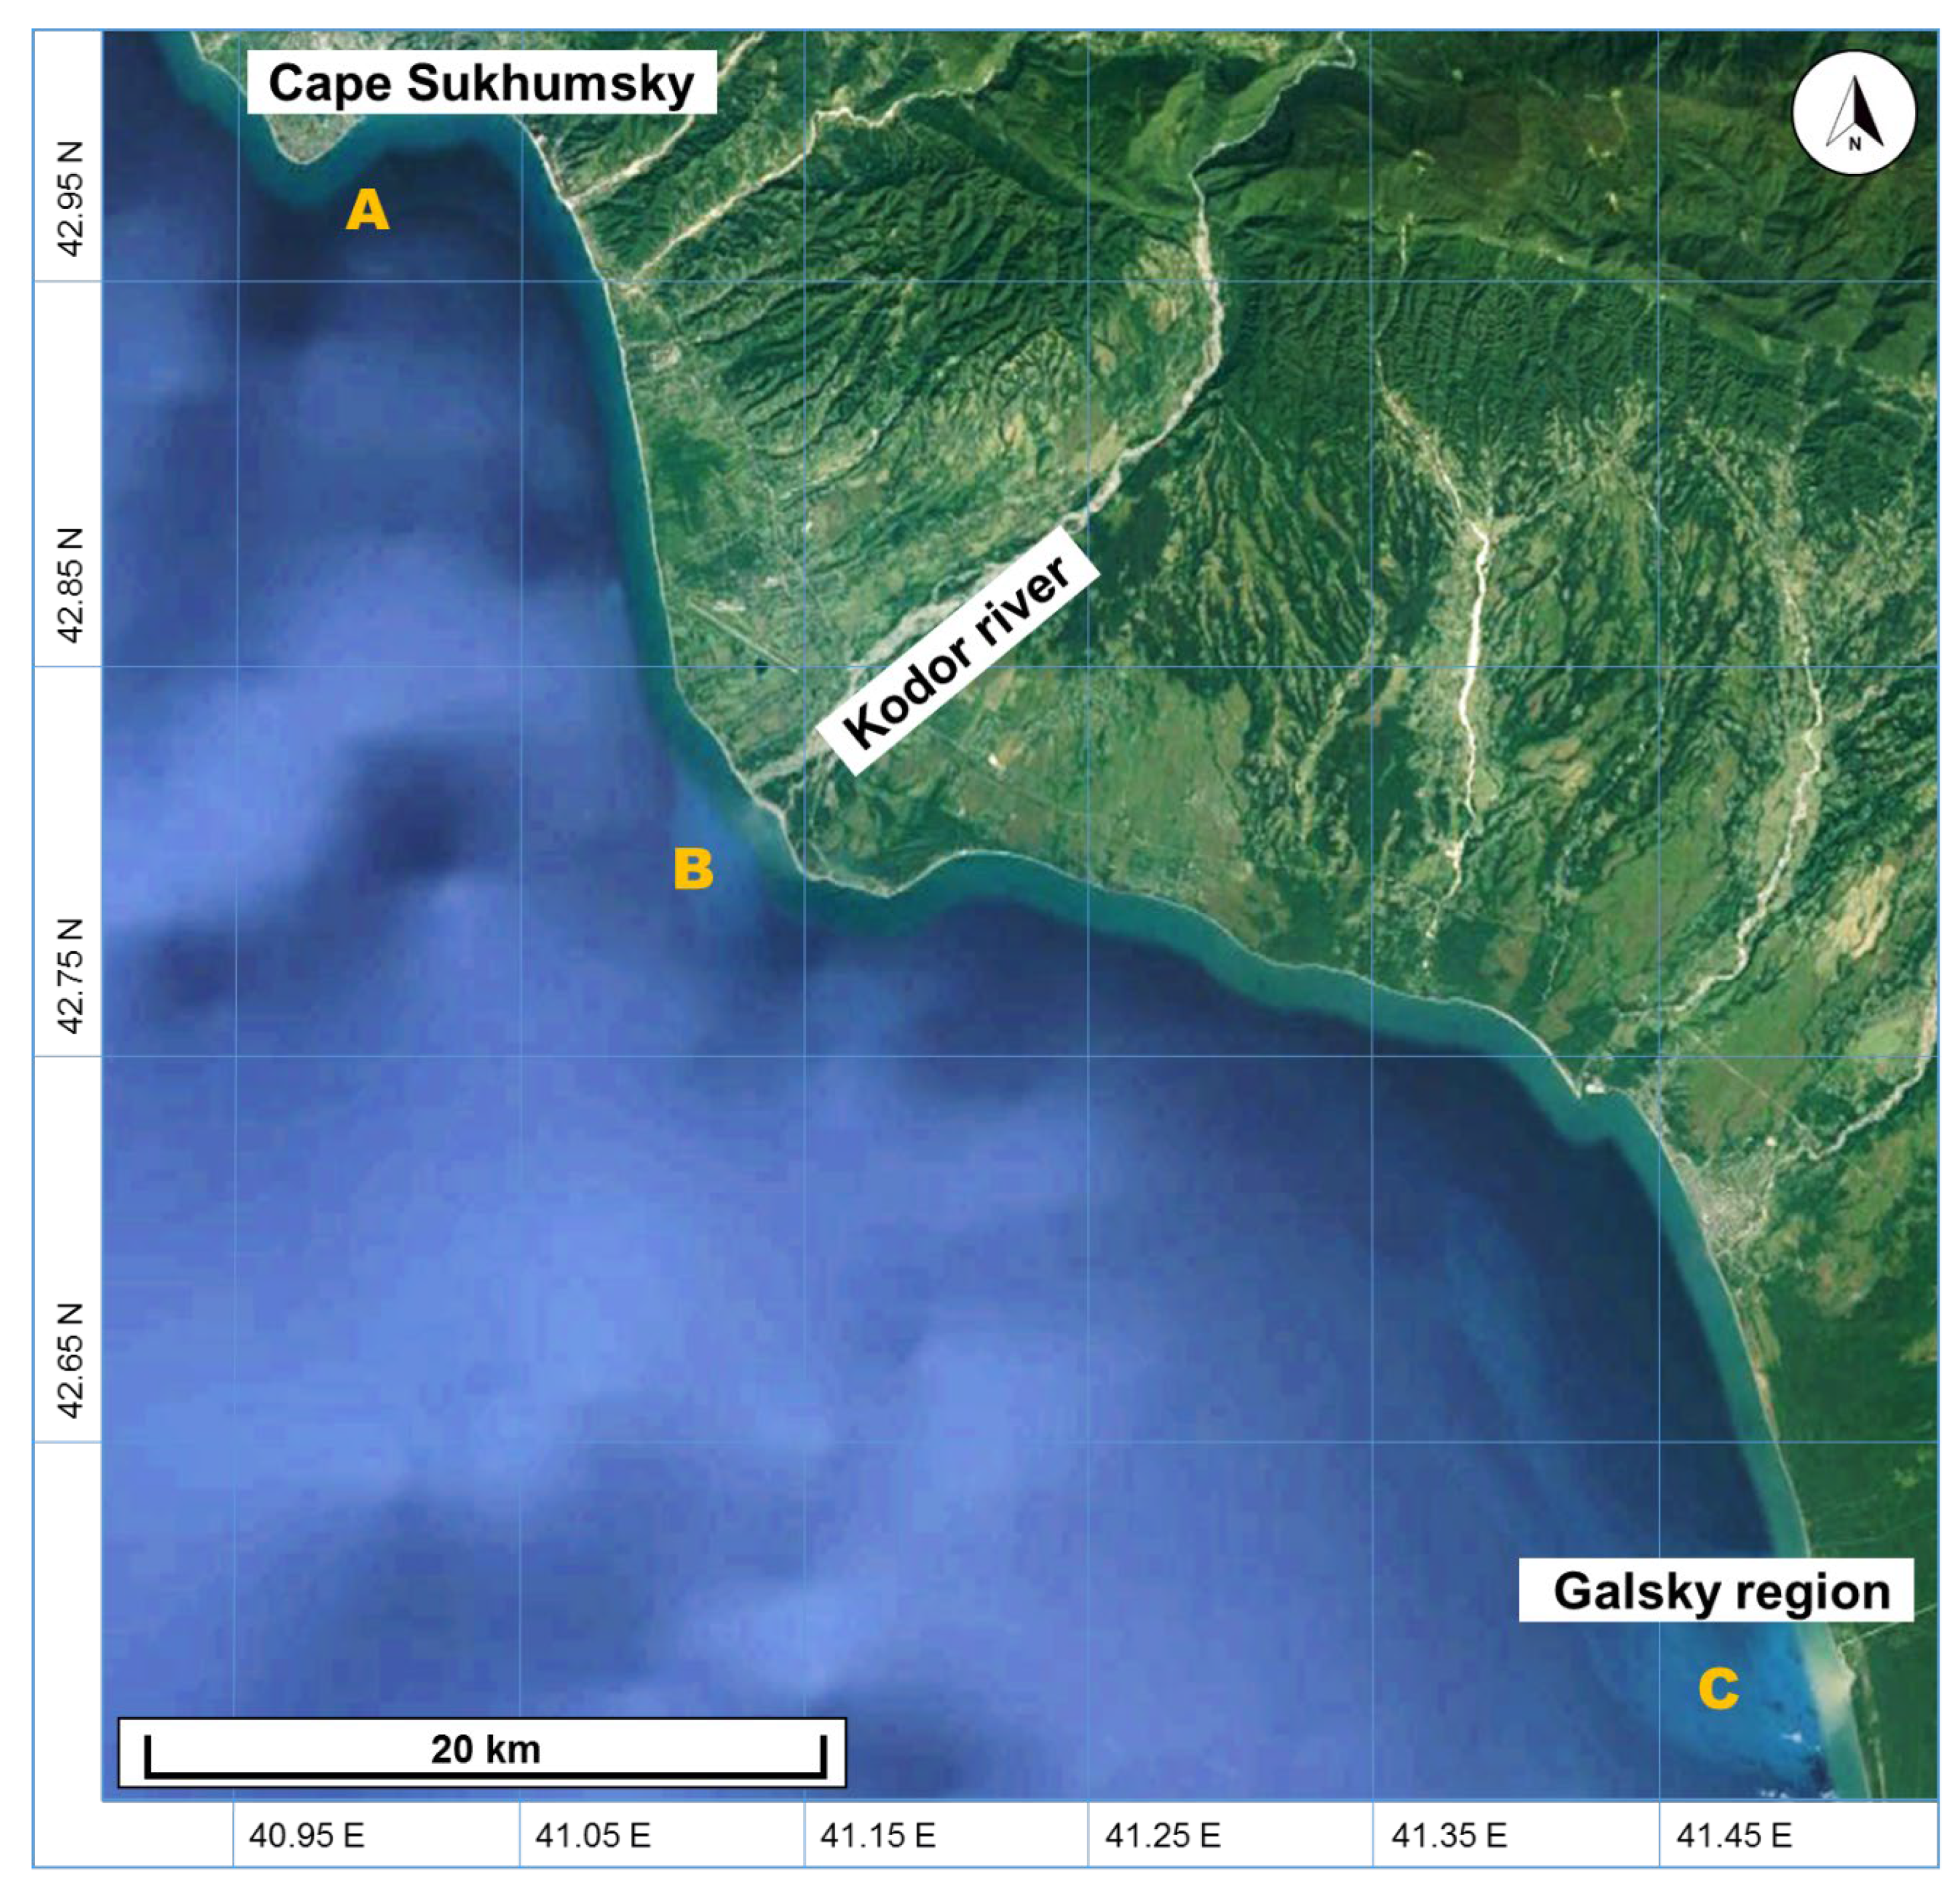
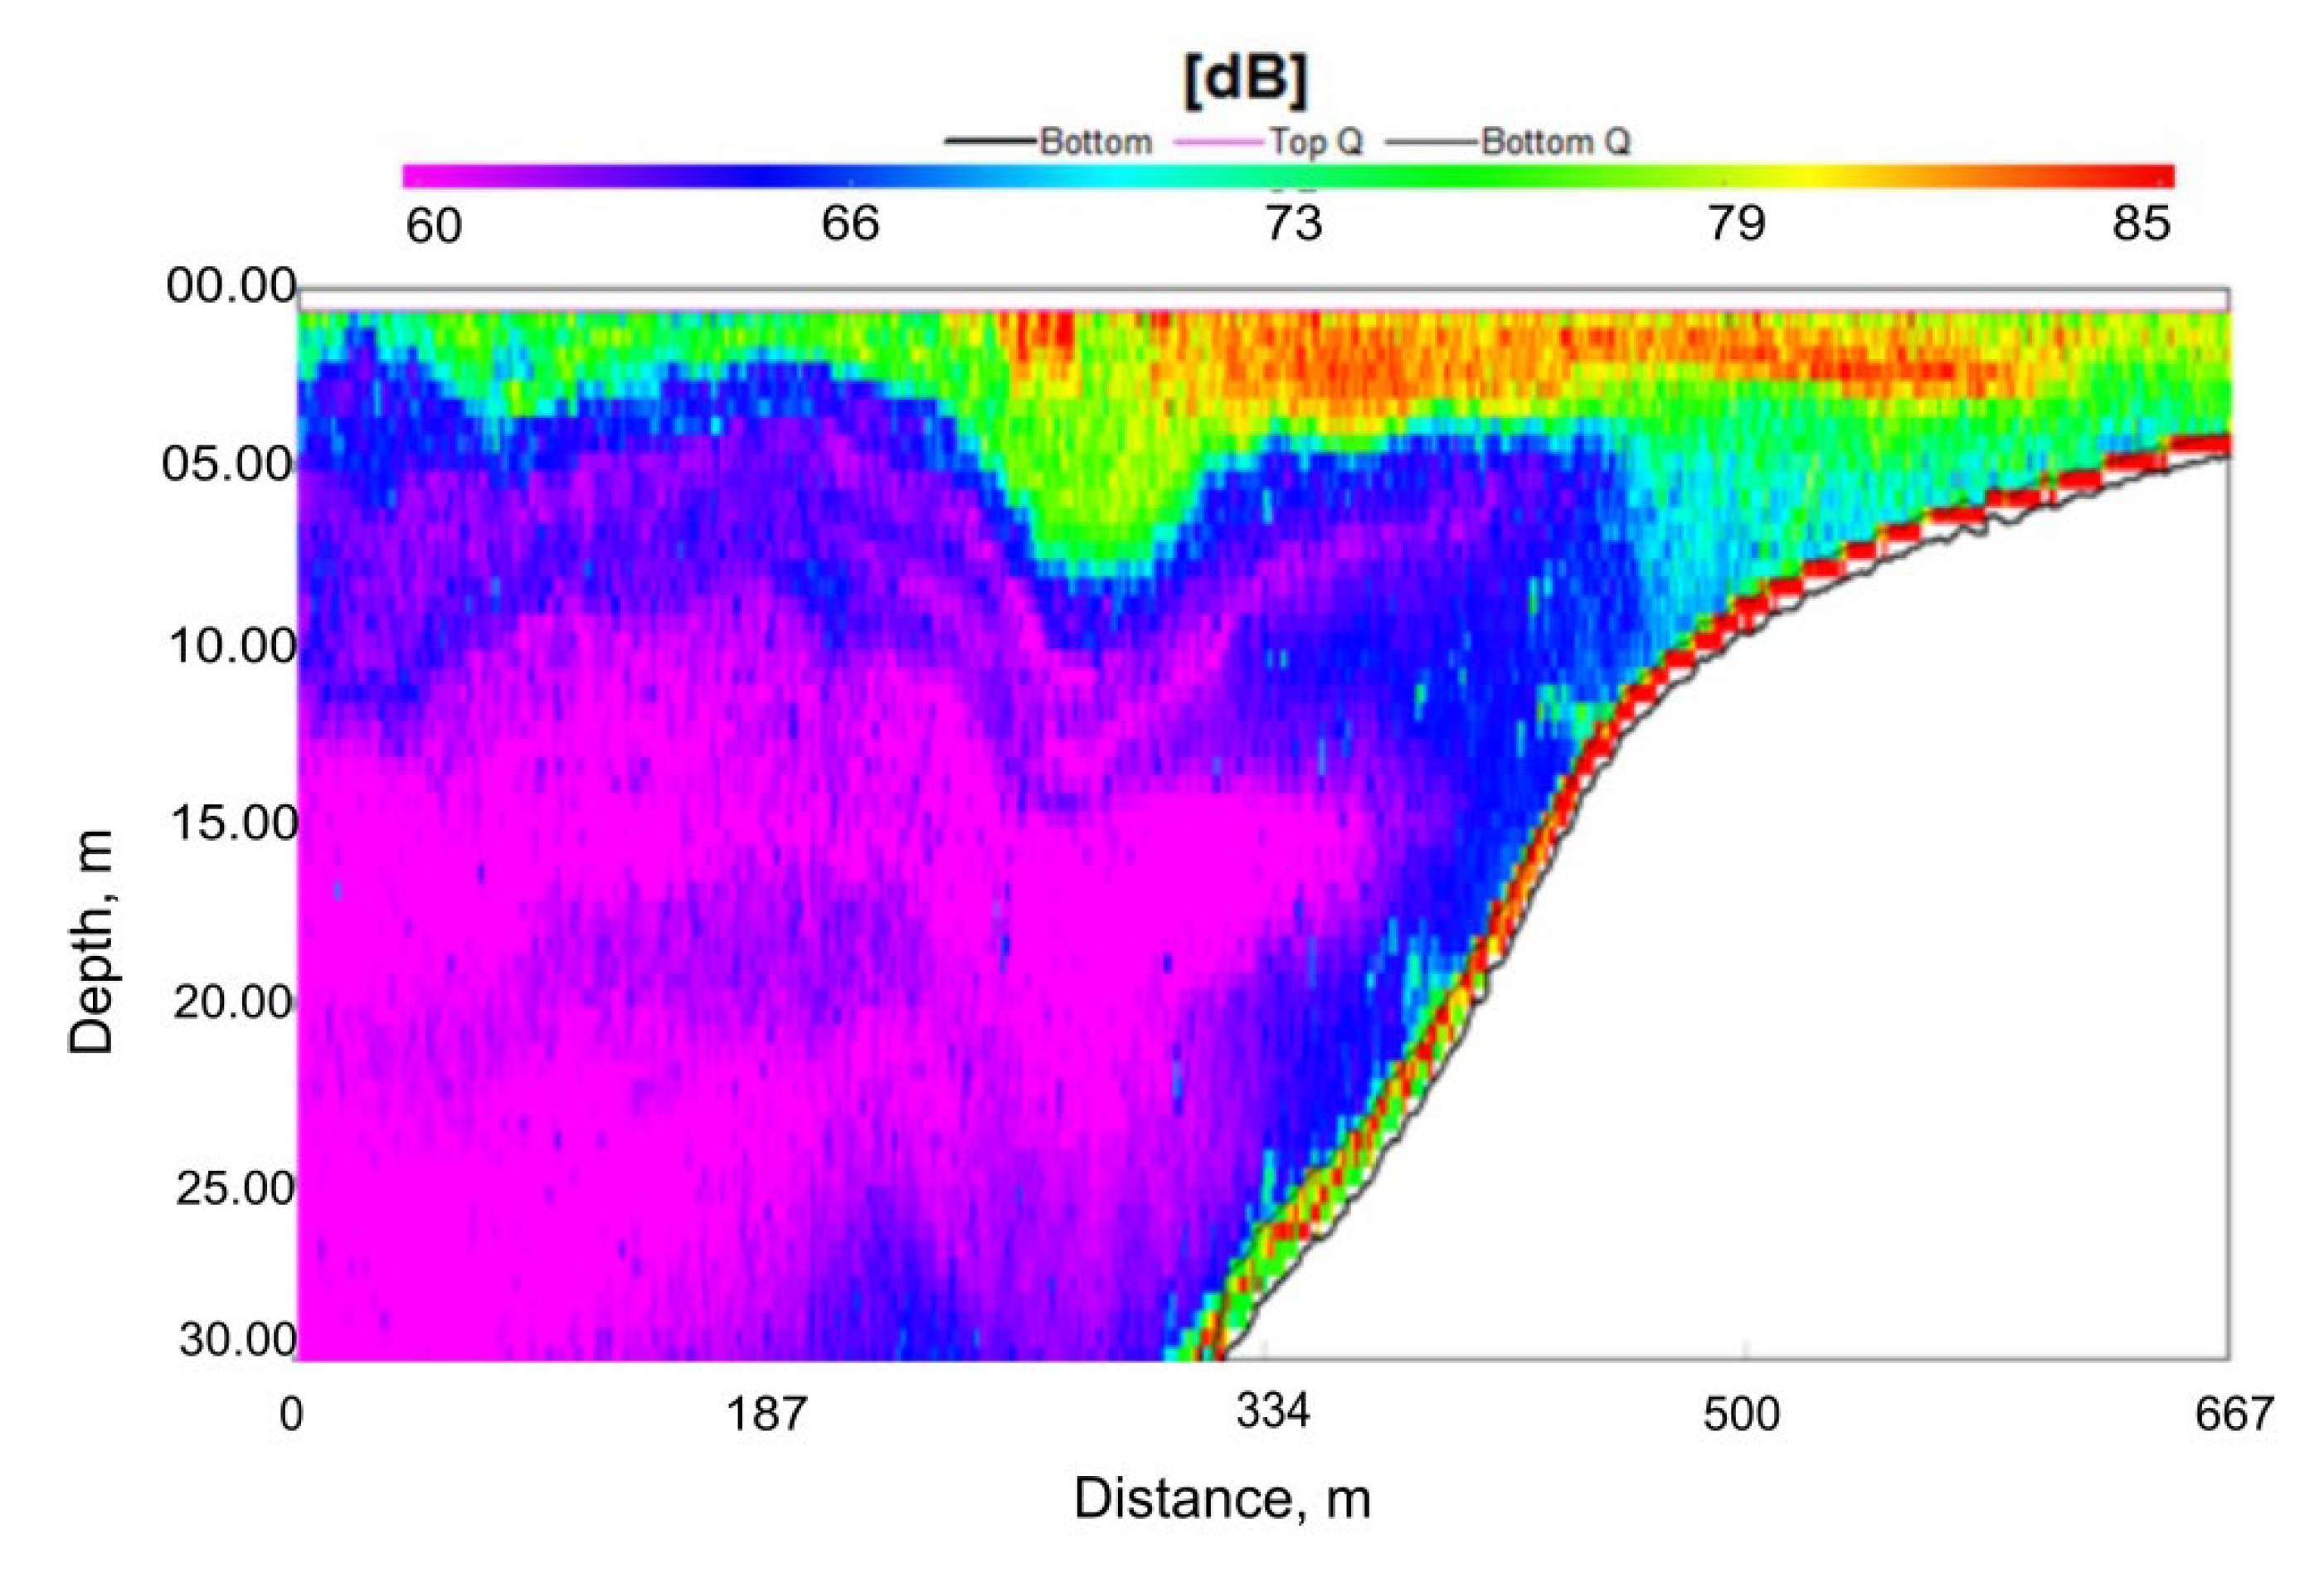
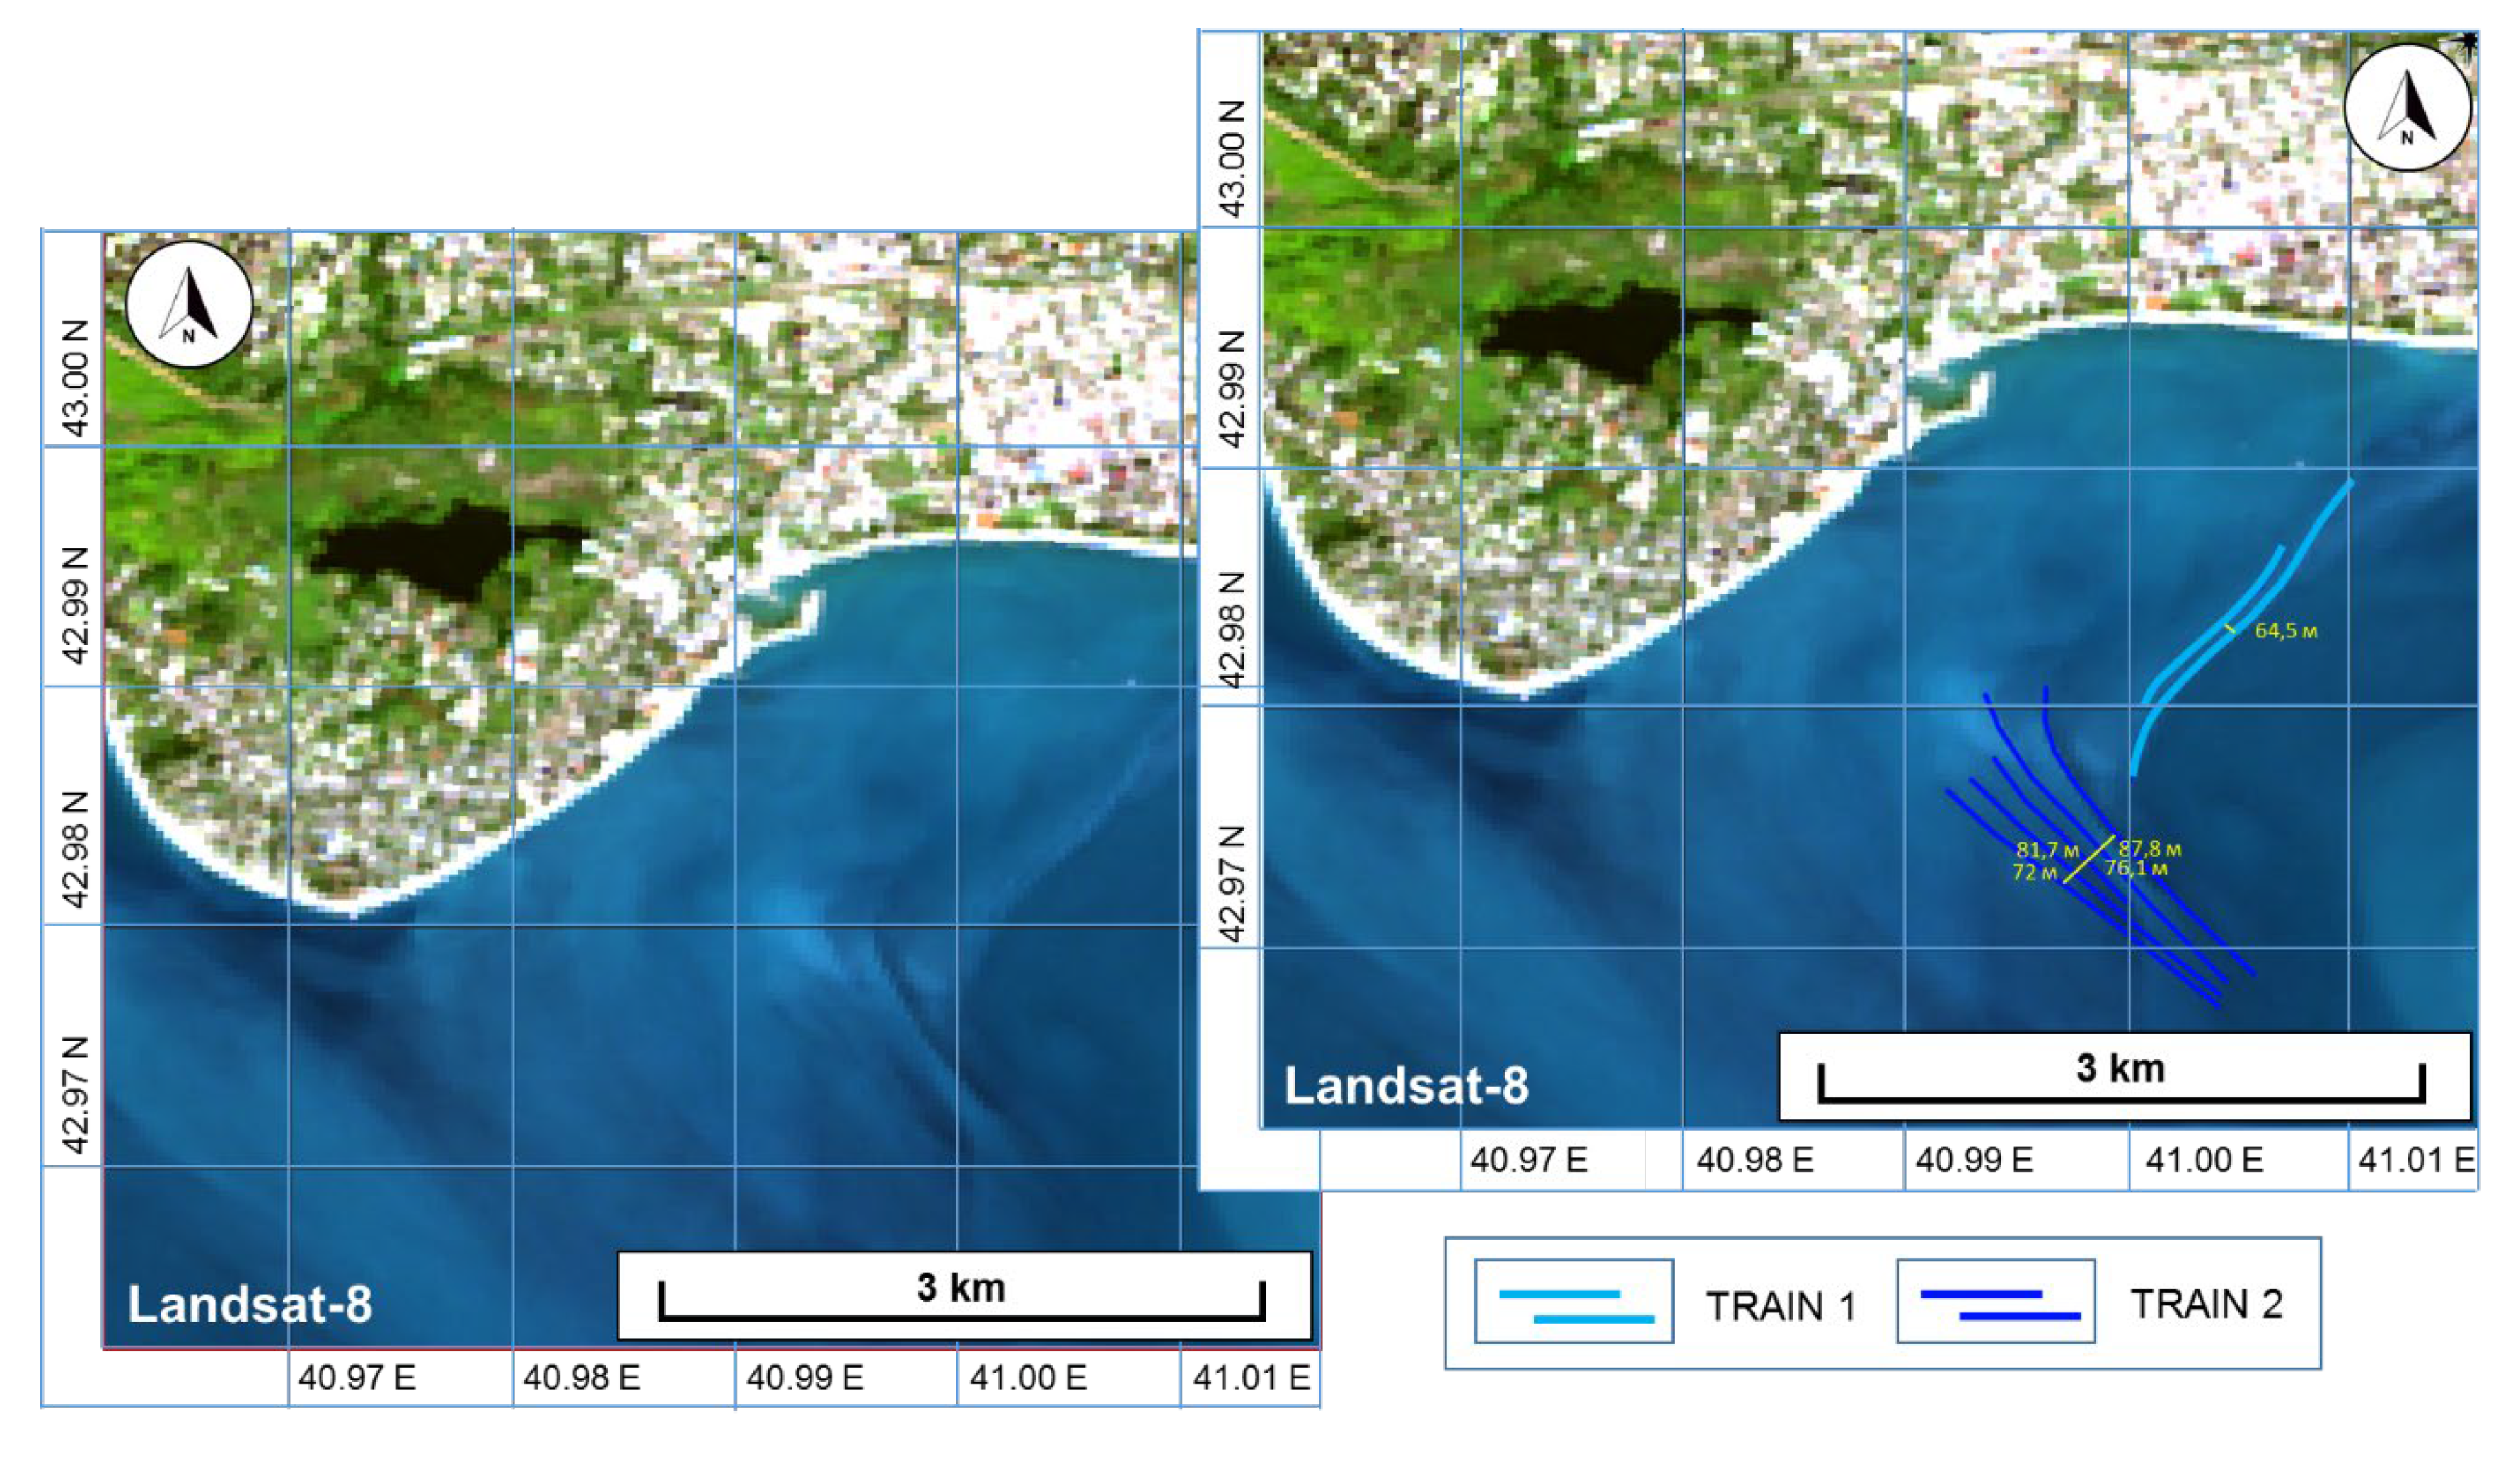
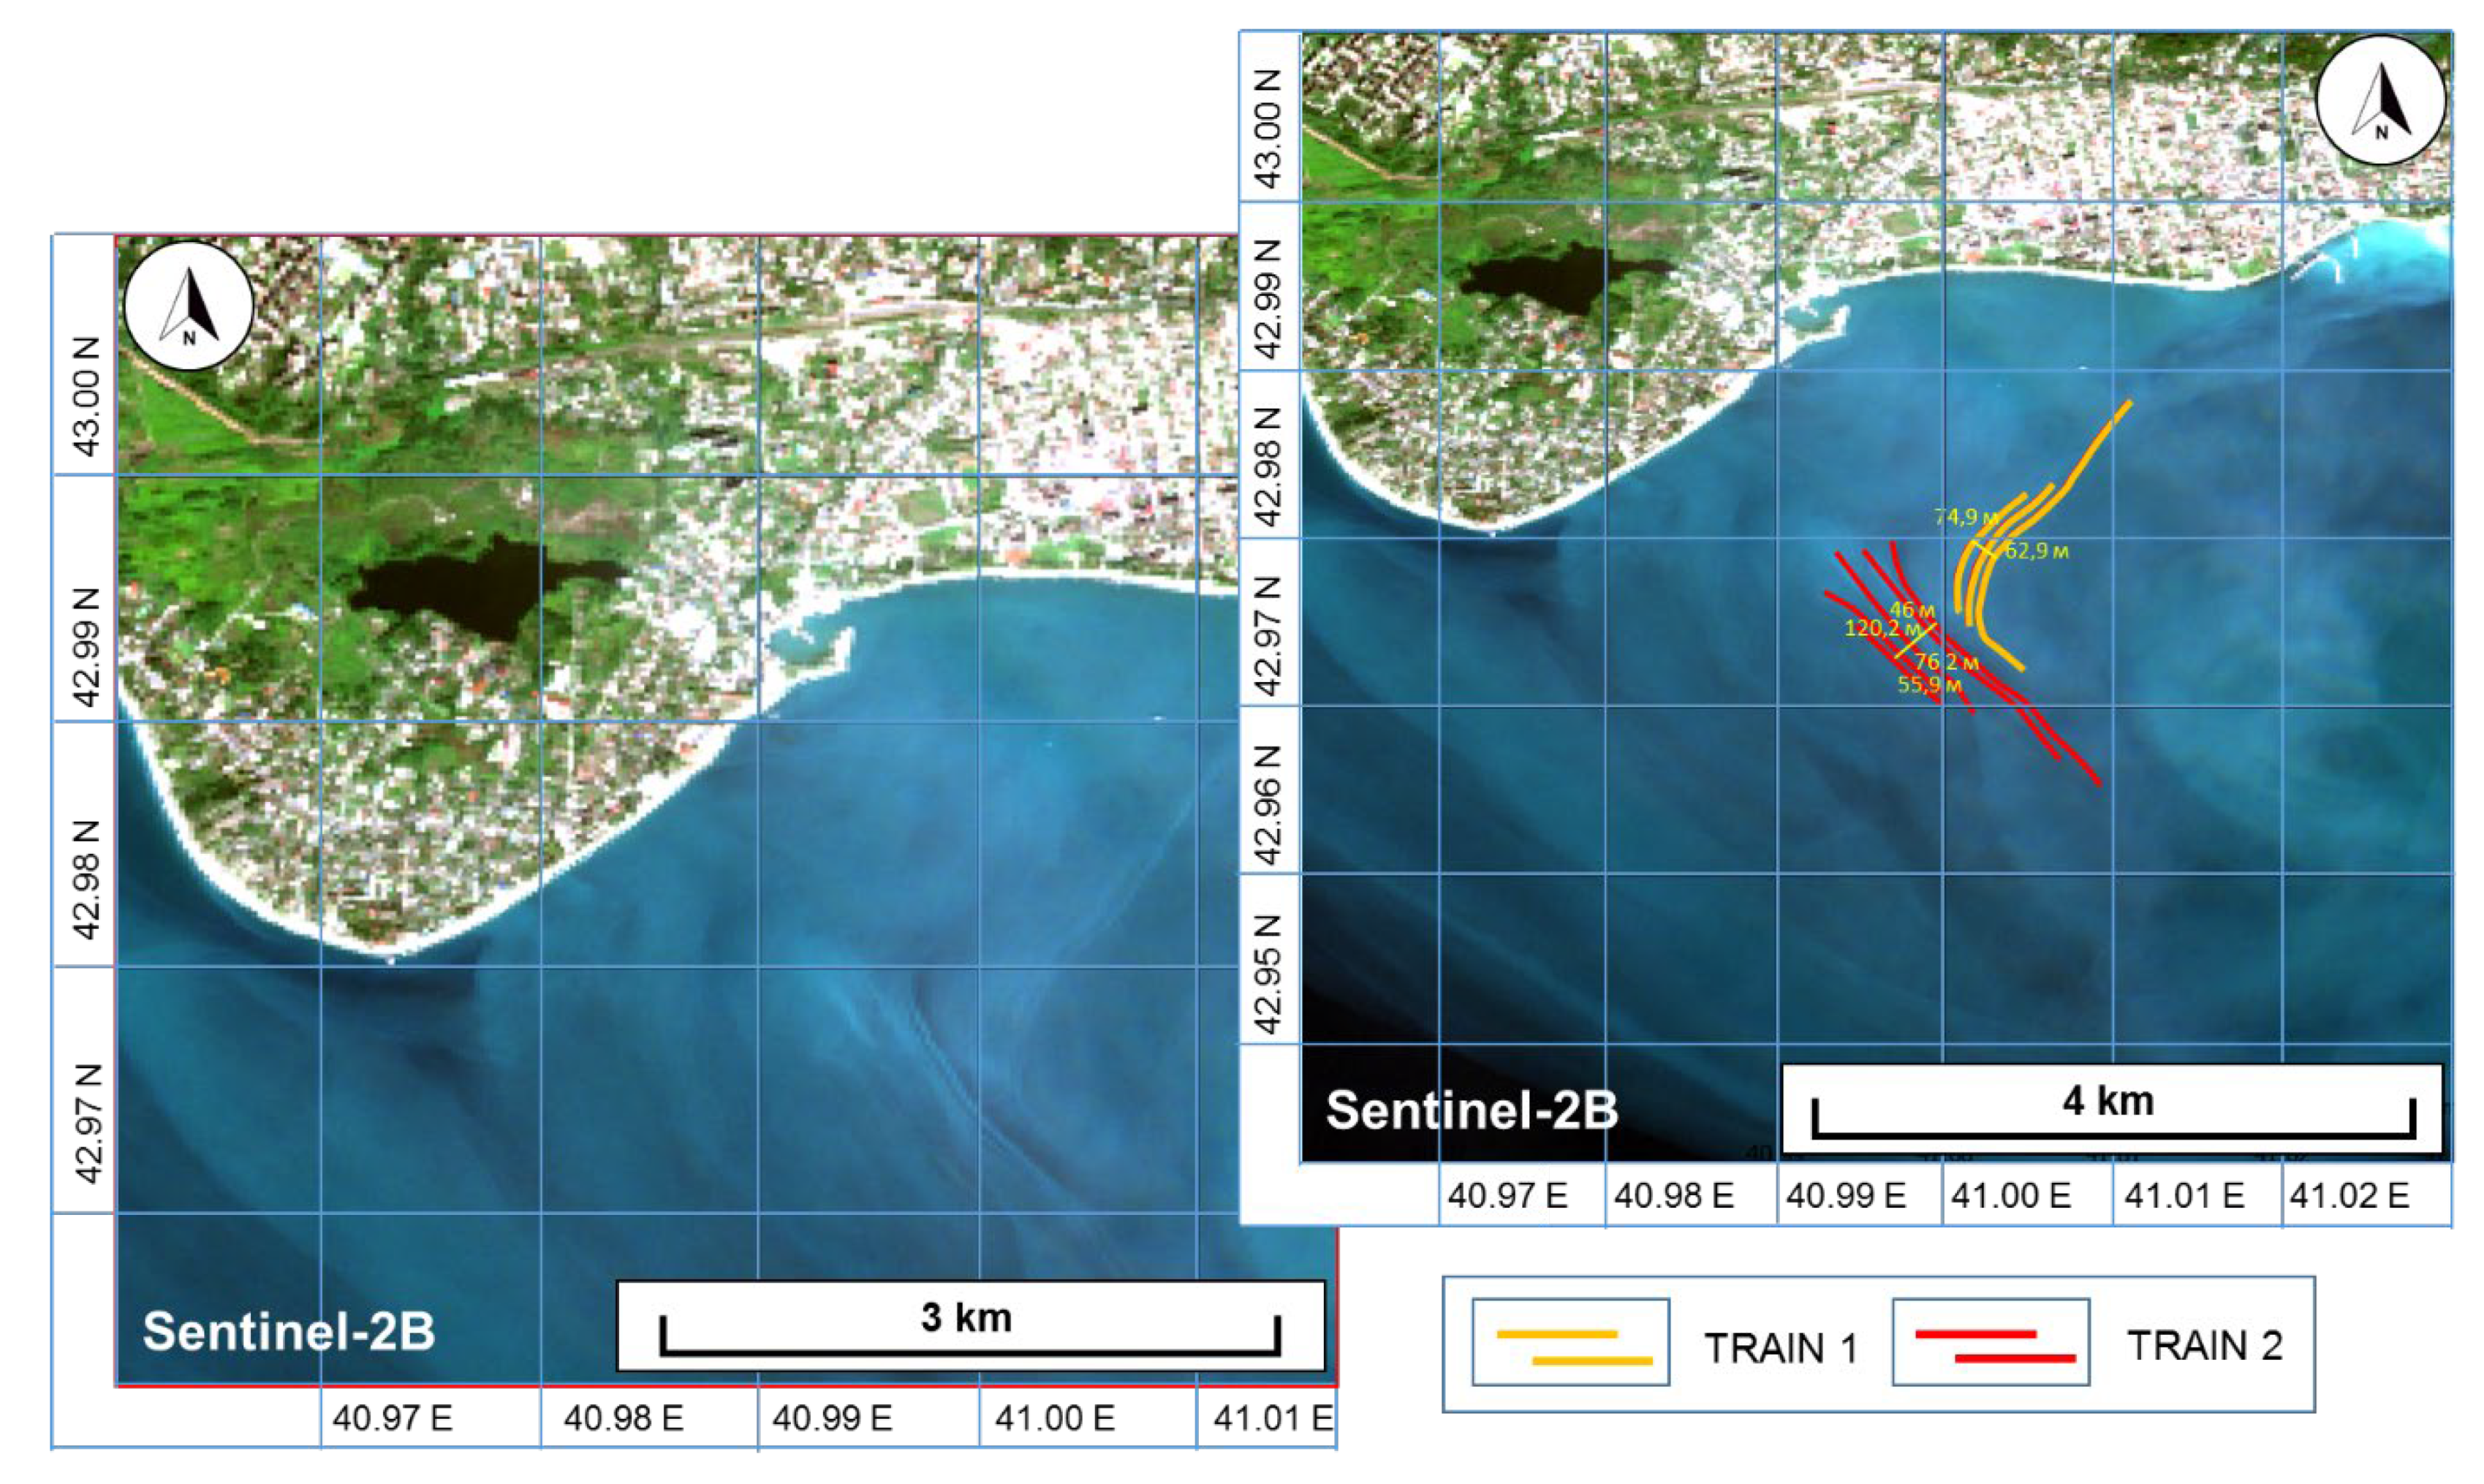
3. Concentric Structures near the Mouth of the Kodor River

Internal waves come to Cape Sukhumsky from the southeast, picked up by a plume of desalinated water from the Kodor River [40]. Figure 3 shows an optical satellite image (Sentinel-2, 10 September 2017) illustrating one characteristic case of surface wave generation and two characteristic cases of the existence of internal wave packets, whose generation is associated with the Kodor River (see Figure 1). These cases are discussed in detail below.
Figure 4 shows an example illustrating ring structures where a river flows into the sea (see Figure 3I). The Kodor River flows into the sea in two branches. The right branch carries the main flow of the river, and the left branch carries the reduced one. Near the branches of the river, wave structures diverging in concentric circles are formed. More intense waves are formed from the right flow. The entire range of the intense wave field extends to 1.5 km into the sea and beyond. The number of waves in this train is about 30. Their lengths generally decrease from the generation point towards the open sea, being in the range from ~120 m to ~60 m (see Figure 4).
Despite a clear picture of ring structures and several attempts to relate them to internal waves using sea truth in situ measurements, we have not yet been able to prove their relation to internal waves. The point is that these ring structures do not show up in radar images though they are clearly visible in optical images. This gives reason to consider them as a manifestation of surface waves arising on a plume of desalinated water flowing into the sea. Nevertheless, several times we managed to register internal waves, the origin of which is associated precisely with the jet of river water flowing into the sea.

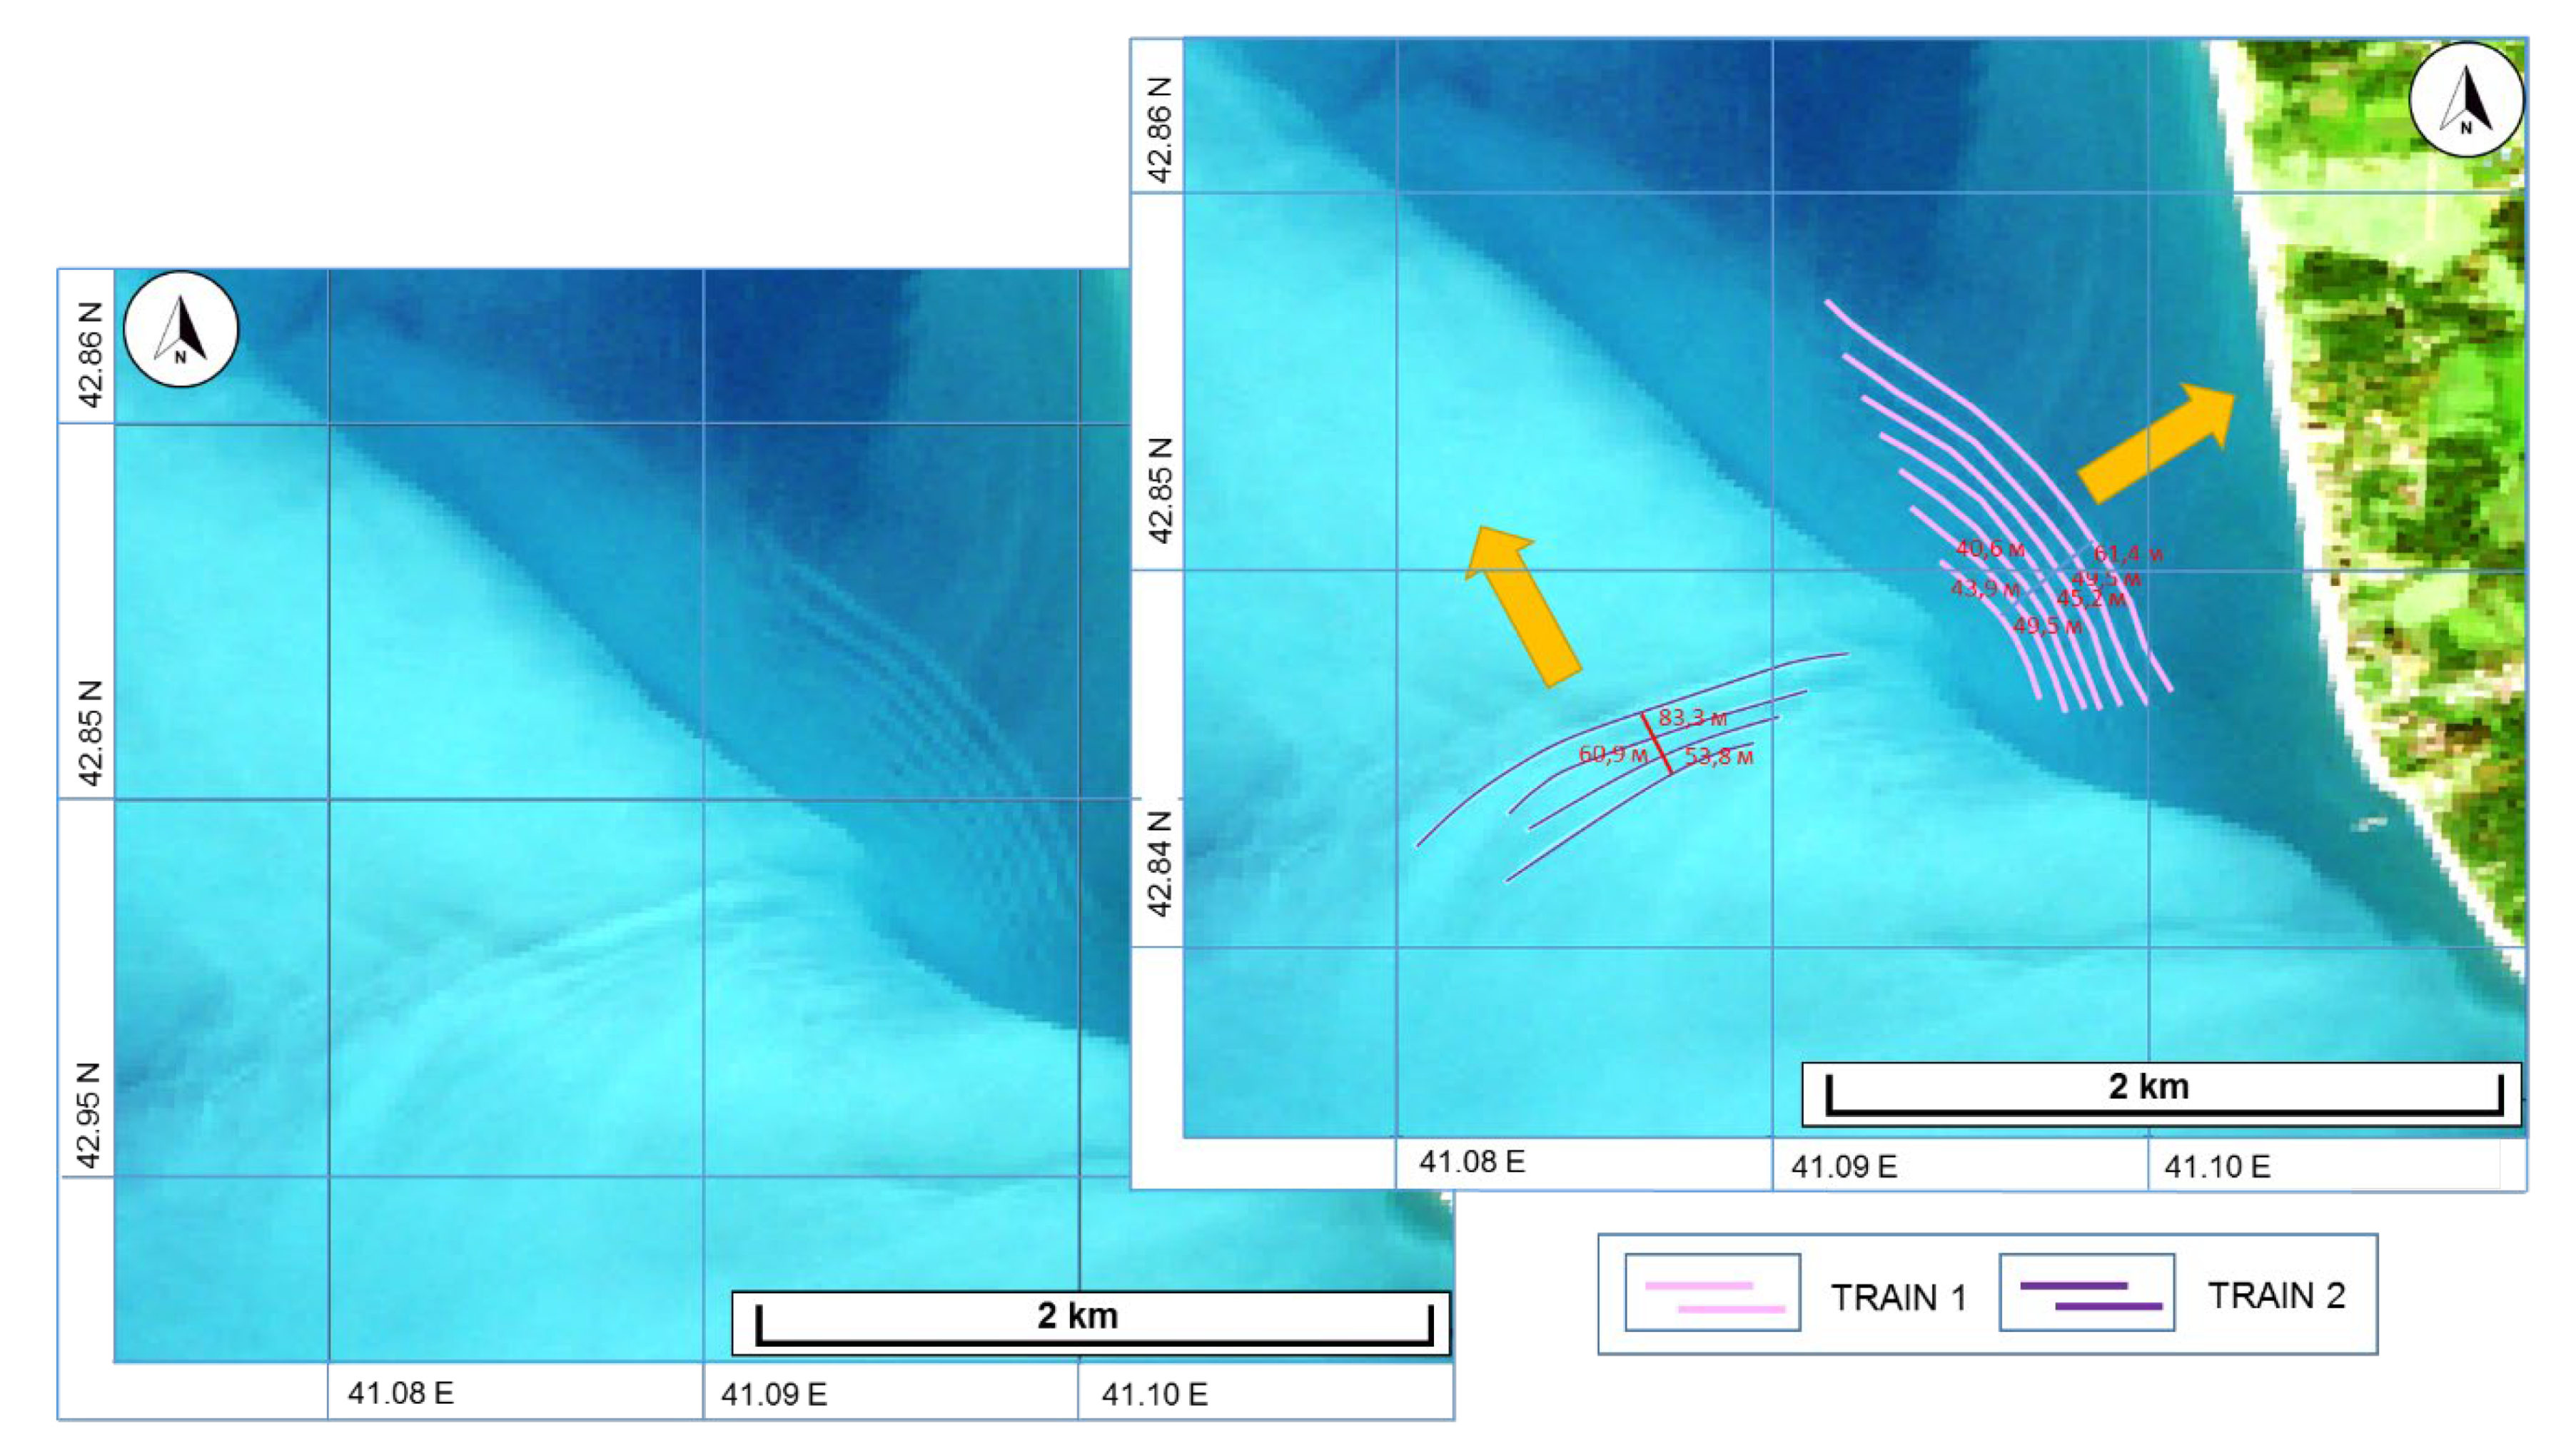
4. Internal Waves Generated by the Plume of the Kodor River

Figure 5 shows the ADCP record for ship measurements on a track made perpendicular to the coastline at a location opposite the river mouth. Internal waves are clearly visible on the pycnocline formed by river waters. Estimates of wave parameters: they have the form of depression on the thermocline; height 3–6 m; length 200 m; orbital speed (vertical component) 0.2 m/s. The parameters and shape of the waves indicate their non-linear nature.
A moving plume of river waters is capable of emitting packets of short-period internal waves at its boundaries. Figure 6 shows fragment II of the satellite image (Sentinel-2, 10 September 2017), which shows trains of internal waves generated by the plume of the Kodor River (wave movement to the northwest) and its front (wave movement towards the coast).
The analysis of Figure 6 shows that at the beginning of the plume, two trains of internal waves were observed, located almost perpendicular to each other. One train of 5–6 waves was located directly in the plume of muddy desalinated water and moved along with it to the northwest. The front of the head wave of this train, when interacting with the plume boundary facing the coast, generated a train of ~10 small-scale internal waves propagating towards the coast to the northeast. The head wave was at a distance of 415 m from the coast and had a length of 75 m. The wavefront had a convex shape towards the coast and extended for 2.6 km. The lengths of other waves in the train gradually decreased to 50–30 m. The mechanism of generation of these waves is similar to the mechanism of generation of waves by the surface intrusion of desalinated water, observed in [41].
Figure 7 shows fragment III of the studied satellite image, which shows manifestations of a packet of internal waves moving towards Cape Sukhumsky. As can be seen from Figure 7, the internal waves closest to the cape were located at a distance of 3.1 km from the coast, moving almost along the normal to it. The wavelengths ranged from 67 to 107 m. There were more than 14 waves on the train. The genesis of these waves is associated with the joint action (decay) of an inertial internal wave approaching the cape and the frontal zone from a freshwater plume.
A freshwater plume can also generate short-period internal waves moving into the open sea. Figure 8 depicts fragments of the Sentinel-2 optical satellite image dated 25 August 2021, which show short-period internal waves moving seaward from the freshwater front of the Kodor River plume.
In addition to the considered mechanisms for the formation of internal waves in the study area, it is also possible for inertial internal waves to enter the coastal zone with the generation of packets of short-period waves moving ashore. Due to the steep slope of the bottom, a large part of the short waves are reflected in this place. These features are described in [23].

5. Cyclonic Eddy Near Cape Sukhumsky and Internal Waves That It Generated

The situations of generation of internal wave packets considered above were related to the presence of a northwestern current on the shelf. Like the entire Black Sea, the Abkhazian shelf is characterized by a bimodal regime of currents. In addition to the northwestern current, a southwestern current is observed. A similar situation was observed at the beginning of October 2020, when we performed sea truth observations near Cape Sukhumsky. During in situ measurements on 4 October 2020, two optical satellite images were obtained with a time shift of ~16 min (OLI Landsat-8, 08:02:03 GMT and MSI Sentinel-2, 08:18:11 GMT). A coastal cyclonic eddy was observed in the water area at that time. This eddy was well identified in satellite images (see further materials of the article) due to desalinated water carrying suspended matter from the Gumista River located west of Cape Sukhumsky.
Inertial oscillations manifest in vertical displacements of the thermocline (as shown in Figure 2), as well as in current velocity measurements, and have a frequency equal to the Coriolis parameter at the observation latitude [42]. The simplest theory of inertial oscillations gives a circular anticyclonic rotation of the velocity vector measured at a given point [43]. In the coastal zone of the sea, the velocity hodograph changes. From 27 September to 8 October 2020, an ADCP was operating on a stationary platform located near Cape Sukhumsky at a point of 13 m depth. The current meter recorded the regular passages of currents through the observation point. Figure 9 shows the records of the meridional and zonal components of the current. Both components are characterized by amplitude variability with inertial periodicity, but the range of current amplitudes of the zonal component is much larger (up to 0.5 m/s). Frequency spectra (see Figure 9b) confirm the predominance of inertial oscillations of the currents due to a peak near the inertial frequency.
A combination of such factors as the observed inertial motions, horizontal shear instability of the alongshore current, and uneven characteristics of the surface desalinated layer led to the formation of a cyclonic eddy in the study area.
On 04 October, a cyclonic eddy passed in the sea through the traverse of Cape Sukhumsky at about 08 AM local time (LT). The speed of the eddy was 0.34 m/s. It was formed from a plume of moderately turbid cold water (outflowing from the Gumista River) and transformed into a plume flowing around the cape. At this time, the direction of the flow of the inertial period coincided with the eastern one (See Figure 10). The passage of the eddy was accompanied by the cooling of the entire water column. An LTS, located at a distance of 60 m from the coast at a depth of 50 m, showed a decrease in the average temperature of the layer it covered from 23 °C to 18 °C (Figure 11). The moment of the beginning of the water column cooling could be associated with the center of the eddy passage of the cape’s traverse.
Satellite optical surveys were made 3 h later (Landsat 8, 11:02:03 LT and Sentinel-2: 11:18:11 LT). At that time, the core of the eddy was at a distance of about 2 km from the shoreline. Banded structures were visible on the periphery of the eddy due to surface manifestations of short-period internal waves (see Figure 12 and Figure 13). The weather was clear at that time and slick bands were visible eastward from the platform (Figure 14).
Comprehensive analysis of the data shown in Figure 12 and Figure 13, as well as the results of in situ measurements, allows us to give the following characteristics of the observed processes. Wave train No. 1 consisted of 3 internal waves with wavelengths of 50–70 m. The surface manifestations of waves shifted to the southeast by approximately 200 m in 16 min, which gives an estimate of their velocity of about 0.21 m/s. Train No. 2 included 5–6 waves of southwest direction. According to the comparison of satellite images, the train practically did not shift (Figure 12 and Figure 13). This effect may be explained by the alongshore shear current. This current intensifies at a distance from the coast, and wave train No. 2 is locked by the current as the speed of the generated internal waves is close to the speed of the oncoming flow of currents at this site. Wave train No. 1, oriented to the southeast, is under the strong influence of the east current. Therefore, the speed of train No. 1 (originally directed against the oncoming current component) cannot overcome this current, and the packet moves at an angle away from the coast.
It should be noted that eddies can serve as a source of generation of internal waves on the shelf. There are few reports of this phenomenon. For the Black Sea, the authors of [44] reported this when they found packets of internal waves near the eddies in satellite images. Recently, the generation of intense internal waves associated with an anticyclonic submesoscale eddy in the Barents Sea near Cape Svyatoy Nos was discovered [45]. In the scientific literature, there are theoretical works predicting eddies as a source of generation of internal waves in the sea [46,47], as well as the interaction of internal tides with an eddy [48].

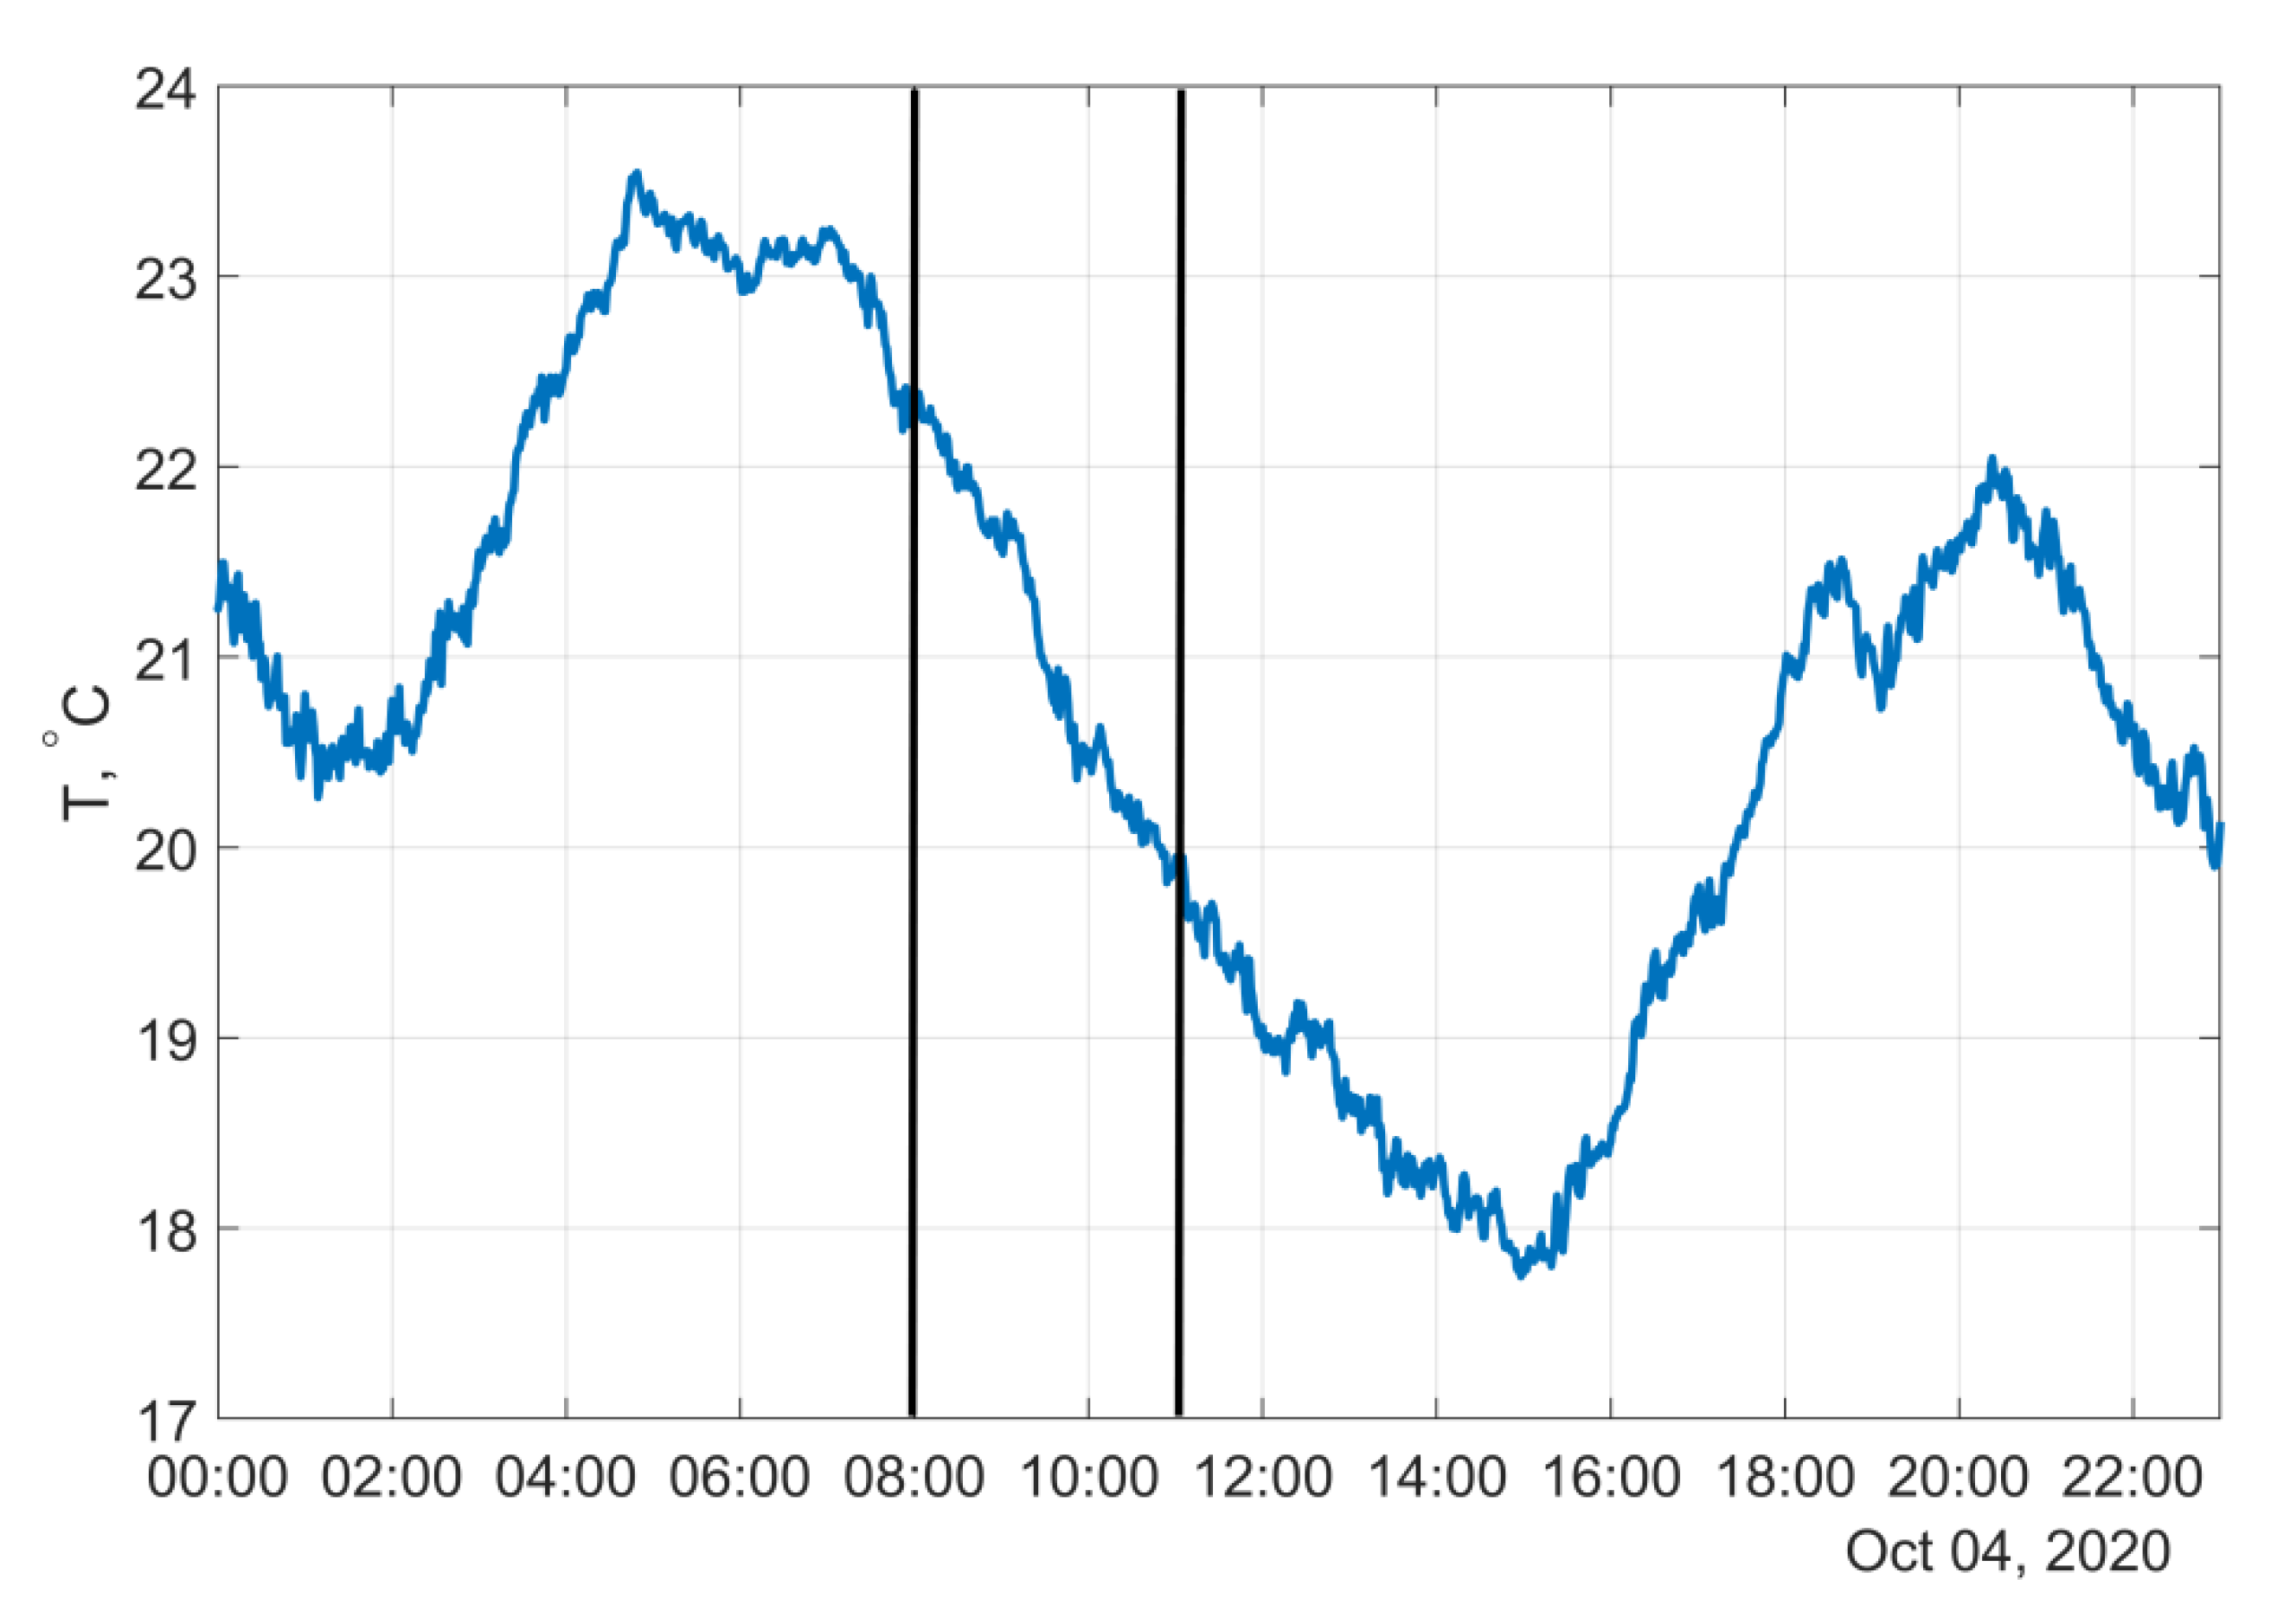
6. Generation of Internal Wave Packets Associated with a Plume of River Waters and Decay of Inertial Waves in the Galsky Region

Examples of registration of surface manifestations of internal waves in the Galsky region (see Figure 1, mark C) are given in this final part of the article. In this region, trains of waves moving both from the coast and towards the coast are clearly visible. Their origin is associated with the decay of inertial internal waves, as well as the generation of packets by a plume of river waters.
The discharge channel of the Eristskali River, running from the Galsky water reservoir to the Black Sea, is the most powerful source of suspended matter for the coastal water of Abkhazia. This circumstance makes it possible to better identify the field of generated internal waves in optical satellite images of the shelf area (see Figure 15).
The plume of the discharge channel of the Eristskali River can be traced clearly (Figure 15). The packet of internal waves moves from the west landward (wavelengths from 95 to 25 m). These waves propagate on the shelf in a wide front. They owe their origin to nonlinear effects that accumulate in an inertial internal wave during its propagation to the shore (trains Nos. 2 and 3). Train No. 1 (wavelength 60–50 m) generated by the moving frontal zone of the freshwater plume is propagating towards the front of train No. 2. The fronts of wave packet No. 1 are curved and follow the contours of the plume boundaries. Trains meet and cross at a distance of 2.7 km from the coast. It should also be noted that inertial internal waves on the Abkhazian shelf approach quite close to the coast, which is confirmed by in situ observations (see Figure 9). The inertial wave approaching the steep coast undergoes other changes, which lead to the generation of short-period internal waves on its crest [23].

7. Conclusions

The analyzed material is the most complete generalization of modern ideas about the field of internal waves on the shelf of Abkhazia. The work was carried out on the basis of a large array of satellite images and sub-satellite measurement data to identify and study the features of the field of internal waves in this region. We highlight the main results.
  • It is shown that internal waves are widespread on the Abkhazian shelf. They appear as trains of short-period waves (as a rule, soliton-like) that move in different directions, in contrast to trains on wide shelves, which are characterized by movement towards the coast.
  • The direction of internal wave trains’ travel depends on the sources of their generation. The prevailing direction of internal wave propagation is to the shore. Inertial internal waves move in this direction. These waves came from the open part of the sea to shallow water, where they, being transformed, generate trains of short-period waves, which also move ashore. Moreover, movement ashore is possible when waves are generated by the lateral front of a plume of desalinated river waters moving along the coast.
  • The cases of the moving of internal wave trains offshore are revealed. This is due to the generation of internal waves by the river plume front moving from the coast. Nonlinear internal waves moving from the shore can be generated by a jet of river water flowing into the sea, as well as by reflecting short-period waves incident on the shore in the case of a very steep shelf.
  • The effect of the generation of multidirectional internal waves by a cyclonic submesoscale eddy is shown using the example of a detailed analysis of a set of quasi-synchronous satellite and sea truth data, and the impacts of currents on the propagation of such waves are analyzed.
Thus, a number of new results were obtained that advance knowledge about the field of internal waves of the shelf zone of the northeastern part of the Black Sea, as well as in general about the mechanisms of generation of internal waves on a steep shelf and the possibilities of their monitoring by remote sensing and field methods.

Author Contributions

Conceptualization, A.S.; methodology, A.S., V.Z., E.K. and O.P.; software, E.K. and V.Z.; data analysis, A.S., O.P., V.Z. and E.K.; investigation, A.S., E.K., O.P. and V.Z.; writing—original draft preparation, A.S., V.Z. and E.K. All authors have read and agreed to the published version of the manuscript.

Funding

This work was carried out under the financial support of the Ministry of Science and Higher Education of the Russian Federation within the framework of Agreement # 075-15-2020-776.

Institutional Review Board Statement

Not applicable.

Informed Consent Statement

Not applicable.

Data Availability Statement

Experimental data are archived at the Ocean Acoustics Laboratory (Shirshov Institute of Oceanology, Russian Academy of Sciences) and available upon request. The program codes for requesting satellite data from Google Earth Engine are given in Appendix A.

Acknowledgments

The authors would like to thank L. Tarasov, D. Belov, and V. Chekayda of Andreyev Acoustics Institute for their help in carrying out measurements in the sea. We are grateful to our colleagues from the Institute of Ecology for their help in taking continuous measurements from a stationary platform. We thank V. Kharchenko from AEROCOSMOS for satellite data preliminary processing. Landsat-8 and Sentinel-2 imagery courtesy of the U.S. Geological Survey and Copernicus, respectively.

Conflicts of Interest

The authors declare no conflict of interest.

Appendix A. Google Earth Engine Code for Satellite Data Request

//04 Oct 2020 eddy case example
//region
var geometry =
/* color: #98ff00 */
/* shown: false */
/* displayProperties: [
{
“type”: “rectangle”
}
] */
ee.Geometry.Polygon(
[[[40.80234939589657, 43.016516226192536],
[40.80234939589657, 42.44962527591389],
[41.55388290419735, 42.44962527591389],
[41.55388290419735, 43.016516226192536]]], null, false);
 
var DayStart = ‘2020-10-04’;
var parameter = [‘B4’,’B3’,’B2’];
 
//Sentinel-2
var datasetA = ee.ImageCollection(‘COPERNICUS/S2’)
.filterDate(DayStart,DayStart+’T23:59’)
.filterBounds(geometry)
.select(parameter);
print(datasetA);
var datasetAbands= datasetA.toBands();
var imageA=ee.Image(datasetAbands).float();
 
var mapVis = {
min: 0,
max: 500,
};
Map.addLayer(datasetA, mapVis,’SENTINEL-2’);
 
//more than 3 bands can be downloaded depending on the configuration of granules
 
Export.image.toDrive({
image: imageA,
description: DayStart+’_SENTINEL-2_TRUEcolor’,
scale: 10,
folder: ‘ABHAZIA_SENTINEL-2’,
region: geometry,
crs: ‘EPSG:32637’
});
 
//Landsat-8
var datasetB = ee.ImageCollection(‘LANDSAT/LC08/C01/T1_TOA’)
.filterDate(DayStart,DayStart+’T23:59’)
.filterBounds(geometry)
.select(parameter);
print(datasetB);
var datasetBbands= datasetB.toBands();
var imageB=ee.Image(datasetBbands).float();
 
var mapVis = {
min: 0,
max: 0.15,
};
 
Map.addLayer(datasetB, mapVis,’LANDSAT-8’);
 
Export.image.toDrive({
image: imageB,
description: DayStart+’_LANDSAT-8_TRUEcolor’,
scale: 30,
folder: ‘ABHAZIA_LANDSAT-8’,
region: geometry,
crs: ‘EPSG:32637’
});

References

  1. Ivanov, V.A.; Serebryany, A.N. Frequency Spectra of Short-Period Internal Waves in a Nontidal Sea. Izv. Atmos. Ocean. Phys. 1982, 18, 527–529. [Google Scholar]
  2. Bondur, V.G.; Serebryany, A.N.; Zamshin, V.V.; Tarasov, L.L.; Khimchenko, E.E. Intensive internal waves with anomalous heights in the Black Sea shelf area. Izvestiya. Atmos. Ocean. Phys. 2019, 55, 99–109. [Google Scholar] [CrossRef]
  3. Bondur, V.G.; Serebryany, A.N.; Zamshin, V.V. An anomalous record-high internal wave train on the Black Sea shelf, generated by an atmospheric front. Dokl. Earth Sci. 2018, 483, 1519–1523. [Google Scholar] [CrossRef]
  4. Blatov, A.S.; Bulgakov, N.P.; Ivanov, V.A. Variability of Hydrophysical Fields of the Black Sea; Nelepo, B.A., Ed.; Gidrometeoizdat: Leningrad, Russia, 1984; 240p. [Google Scholar]
  5. Serebryany, A.N.; Lavrova, O.Y. Anticyclonic eddy on the north-east shelf of the Black Sea: Joint analysis of satellite images and acoustic sounding data of the water column. Sovrem. Probl. Distantsionnogo Zondirovaniya Zemli Iz Kosm. 2008, 5, 206–215. [Google Scholar]
  6. Lavrova, O.; Serebryany, A.; Bocharova, T.; Mityagina, M. Investigation of fine spatial structure of currents and submesoscale eddies based on satellite radar data and concurrent acoustic measurements. In Remote Sensing of the Ocean, Sea Ice, Coastal Waters, and Large Water Regions 2012; SPIE: Edinburgh, UK, 2012; pp. 155–168. [Google Scholar] [CrossRef]
  7. Serebryany, A.N.; Ivanov, V.A. Study of internal waves in the Black Sea from MGI oceanographic platform. Fundam. Prikl. Gidrofiz. 2013, 6, 34–45. [Google Scholar]
  8. Dreschler-Fischer, L.; Lavrova, O.; Seppke, B.; Gade, M.; Bocharova, T.; Serebryany, A.; Bestmann, O. Detecting and tracking small scale eddies in the black sea and the Baltic Sea using high-resolution Radarsat-2 and TerraSAR-X imagery (DTeddie). In Proceedings of the International Geoscience and Remote Sensing Symposium (IGARSS), Energy and Our Changing Planet, Quebec City, QC, Canada, 13–18 July 2014; pp. 1214–1217. [Google Scholar] [CrossRef]
  9. Lavrova, O.J.; Mitjagina, M.I.; Sabinin, K.D.; Serebrjanyj, A.N. Study of hydrodynamic processes in the shelf zone based on satellite data and subsatellite measurements. Sovrem. Probl. Distantsionnogo Zondirovaniya Zemli Iz Kosm. 2015, 12, 98–129. [Google Scholar]
  10. Kuznetsov, A.S. Mean Long-Term Seasonal Variability of the Coastal Current at the Crimea Southern Coast in 2002–2020. Phys. Oceanogr. 2022, 29, 139–151. [Google Scholar] [CrossRef]
  11. Lavrova, O.; Mityagina, M. Satellite Survey of Internal Waves in the Black and Caspian Seas. Remote Sens. 2017, 9, 892. [Google Scholar] [CrossRef]
  12. Lavrova, O.Y.; Mityagina, M.I.; Serebryany, A.N.; Sabinin, K.D.; Kalashnikova, N.A.; Krayushkin, E.V.; Khymchenko, I. Internal waves in the Black Sea: Satellite observations and in-situ measurements. In Remote Sensing of the Ocean, Sea Ice, Coastal Waters, and Large Water Regions 2014; SPIE: Amsterdam, The Netherlands, 2014; pp. 248–260. [Google Scholar] [CrossRef]
  13. Lavrova, O.Y. Internal waves observed in satellite images of the northeastern Black Sea in July 2017. Sovrem. Probl. Distantsionnogo Zondirovaniya Zemli Iz Kosm. 2018, 15, 309–315. [Google Scholar] [CrossRef]
  14. Goncharov, V.V.; Kuryanov, B.F.; Serebryany, A.N. Acoustic Diagnosis of Internal Waves on the Black Sea Shelf According to Tomographic Experiment Data. Acoust. Phys. 2022, 68, 348–356. [Google Scholar] [CrossRef]
  15. Himchenko, E.E.; Serebrjanyj, A.N. Vnutrennie volny na kavkazskom i krymskom shel’fah Chernogo morja (po letne-osennim nabljudenijam 2011-2016 gg). Okeanol. Issled. 2018, 46, 69–87. [Google Scholar] [CrossRef]
  16. Bondur, V.G. Aerokosmicheskie metody v sovremennoy okeanologii (Aerospace methods in modern oceanology). New ideas in oceanology V.1. In Physics. Chemistry. Biology; Nauka: Moscow, Russia, 2004; pp. 55–117. [Google Scholar]
  17. Robinson, I.S. Discovering the Ocean from Space: The Unique Applications of Satellite Oceanography; Springer: Berlin/Heidelberg, Germany, 2010; 638p. [Google Scholar]
  18. Bondur, V.G.; Vorobjev, V.E.; Grebenjuk, Y.V.; Sabinin, K.D.; Serebryany, A.N. Study of fields of currents and pollution of the coastal waters on the Gelendzhik shelf of the Black Sea with space data. Izv. Atmos. Ocean. Phys. 2013, 49, 886–896. [Google Scholar] [CrossRef]
  19. Monitoring of the Coastal Zone in the Black Sea Experimental Sub-Satellite Testing Area; Academician of NASU; Ivanov, V.A.; Dulov, V.A.; NAS of Ukraine (Eds.) Marine Hydrophysical Institute: Sevastopol, Russia, 2014; 526p. [Google Scholar]
  20. Goncharov, V.P.; Neprochnov, Y.P.; Neprochnova, A.F. Bottom Relief and Deep Structure of the Black Sea Depression; Nauka: Moscow, Russia, 1972; 158p. [Google Scholar]
  21. Serebryany, A.N.; Khimchenko, E.E. Strong Variability of Sound Velocity in the Black Sea Shelf Zone Caused by Inertial Internal Waves. Acoust. Phys. 2018, 64, 580–589. [Google Scholar] [CrossRef]
  22. Denisov, D.M.; Serebrjanyj, A.N. Avtonomnyj izmeritel’ vnutrennih voln na osnove raspredelennogo datchika temperatury. Prib. Teh. Jeksperimenta 2019, 2, 159–160. [Google Scholar]
  23. Serebryany, A.; Khimchenko, E.; Popov, O.; Denisov, D.; Kenigsberger, G. Internal Waves Study on a Narrow Steep Shelf of the Black Sea Using the Spatial Antenna of Line Temperature Sensors. J. Mar. Sci. Eng. 2020, 8, 833. [Google Scholar] [CrossRef]
  24. Landsat 8 (L8) Data Users Handbook; USGS: Sioux Falls, SD, USA, 2019; Volume 5, 114p.
  25. SENTINEL-2 User Handbook [Electronic Resource]. Available online: https://sentinel.esa.int/documents/247904/685211/Sentinel-2_User_Handbook.pdf/8869acdf-fd84-43ec-ae8c-3e80a436a16c?t=1438278087000 (accessed on 20 September 2021).
  26. Google Earth Engine [Electronic Resource]. Available online: https://earthengine.google.com/ (accessed on 20 September 2020).
  27. ENVI Environment for Visualizing Images—Reference Guide [Electronic Resource]. Available online: http://aviris.gl.fcen.uba.ar/315D6827-B07B-4DA5-8D0B-B41EAEE753BD/FinalDownload/DownloadId-7EB14A8CE5A719F93DEC443016AE2ED6/315D6827-B07B-4DA5-8D0B-B41EAEE753BD/Curso_SR/biblio_sr/ENVI_userguid.pdf (accessed on 1 August 2022).
  28. QGIS. A Free and Open Source Geographic Information System [Electronic Resource]. Available online: https://docs.qgis.org (accessed on 1 August 2022).
  29. Serebryany, A.N. Slick- and suloy generating processes in the sea. Internal waves. Sovrem. Probl. Distantsionnogo Zondirovaniya Zemli Iz Kosm. 2012, 9, 275–286. [Google Scholar]
  30. Serebryany, A.N. Slick- and suloy generating processes in the sea. Fronts of different origin. Sovremennye Problemy Distantsionnogo Zondirovaniya Zemli iz Kosmosa 2012, 9, 231–240. [Google Scholar]
  31. Bondur, V.G.; Grebenuk, Y.V. Remote indication of anthropogenic influence on marine environment caused by depth wastewater plume: Modelling, experiments. Issled. Zemli Iz Kosm. 2001, 6, 49–67. [Google Scholar]
  32. Bondur, V.G.; Grebenyuk, Y.V.; Morozov, E.G. Satellite recording and modeling of short internal waves in coastal zones of the ocean. Dokl. Earth. Sci. 2008, 418, 191–195. [Google Scholar] [CrossRef]
  33. Bondur, V.G.; Grebenyuk, Y.V.; Ezhova, E.V.; Kazakov, V.I.; Sergeev, D.A.; Soustova, I.A.; Troitskaya, Y.I. Surface manifestations of internal waves investigated by a subsurface buoyant jet: 3. Surface manifestations of internal waves. Izv. Atmos. Ocean. Phys. 2010, 46, 482–491. [Google Scholar] [CrossRef]
  34. Bondur Valery, G. Satellite monitoring and mathematical modelling of deep runoff turbulent jets in coastal water areas. In Waste Water Evaluation and Management; InTech: Rijeka, Croatia, 2011; pp. 155–180. ISBN 978-953-307-233-3. [Google Scholar] [CrossRef]
  35. Serebryany, A.N.; Furduev, A.V.; Aredov, A.A.; Okhrimenko, N.N. Generation of Underwater Noise by the Rip Zone of a Large-Amplitude Internal Wave in the Ocean. Acoust. Phys. 2022, 68, 272–281. [Google Scholar] [CrossRef]
  36. Apel, J.R. Oceanic Internal Waves and Solitons. Global Ocean Associates 2002, 40p. Available online: https://www.internalwaveatlas.com/Atlas2_PDF/IWAtlas_Pg001_Background&Theory.pdf (accessed on 31 July 2022).
  37. Jackson, C.R.; Apel, J.R. An Atlas of Internal Solitary-Like Waves and Their Properties [Electronic Resource]. Available online: https://www.internalwaveatlas.com/Atlas_index.html (accessed on 3 March 2021).
  38. SAR Marine Users Manual; Jackson, C.; Apel, J. (Eds.) NOAA: Washington, DC, USA, 2004; 464p. Available online: https://www.star.nesdis.noaa.gov/socd/mecb/sar/PUBLICATIONS/SARUsersManual/NOAA_SARMarineUsersManual_Dec2004,pdf (accessed on 8 August 2022).
  39. Bondur, V.G.; Grebenyuk, Y.V.; Sabinin, K.D. The spectral characteristics and kinematics of short-period internal waves on the Hawaiian shelf. Izv. Atmos. Ocean. Phys. 2009, 45, 598. [Google Scholar] [CrossRef]
  40. Serebryany, A.N.; Popov, O.E.; Kenigsberger, G.V.; Elistratov, V.P.; Khimchenko, E.E. Front in the coastal zone of the sea with a narrow shelf: Surface manifestations and internal dynamics. Sovrem. Probl. Distantsionnogo Zondirovaniya Zemli Iz Kosm. 2018, 15, 167–183. [Google Scholar] [CrossRef]
  41. Ivanov, V.A.; Serebryany, A.N. Internal waves on a shallow water shelf of a non-tidal sea. Izv. Atmos. Ocean. Phys. 1983, 19, 661–665. [Google Scholar]
  42. Korotaev, G.K.; Sabinin, K.D. Inertial oscillations on the sheared current of an arbitrary profile. Dokl. Earth Sci. 2017, 475, 816–817. [Google Scholar] [CrossRef]
  43. Sabinin, K.D.; Korotaev, G.K. Inertial oscillations over the background of shear currents in the ocean. Izv. Atmos. Ocean. Phys. 2017, 53, 352–358. [Google Scholar] [CrossRef]
  44. Mityagina, M.I.; Lavrova, O.Y. Vortex structures and wave processes in the coastal zone of the northeastern part of the Black Sea, identified during satellite monitoring. Mod. Probl. Remote Sens. Earth Space 2008, 2, 155–164. [Google Scholar]
  45. Serebryany, A.N.; Khimchenko, E.E.; Zamshin, V.V. Submesoscale eddy-generated internal waves near cape Svyatoy Nos in the Barents Sea. Dokl. Earth Sci. 2022, in press. [Google Scholar]
  46. Dohan, K.; Sutherland, B.R. Numerical and laboratory generation of internal waves from turbulence. Dyn. Atmos. Ocean. 2005, 40, 43–56. [Google Scholar] [CrossRef]
  47. Plougonven, R.; Zeitlin, V. Internal gravity wave emission from a pancake vortex: An example of wave–vortex interaction in strongly stratified flows. Phys. Fluids 2002, 14, 1259–1268. [Google Scholar] [CrossRef]
  48. Dunphy, M.; Lamb, K.G. Focusing and vertical mode scattering of the first mode internal tide by mesoscale eddy interaction. J. Geophys. Res. Oceans 2014, 119, 1–14. [Google Scholar] [CrossRef]
Figure 1. A schematic map (Google Earth) of the studied water areas indicating the analyzed areas (AC), of the Abkhazian shelf.
Jmse 10 01342 g001
Figure 2. The record of a moored thermistor string near Cape Sukhumsky from 3 November to 13 November 2013 shows inertial internal waves with amplitudes up to 15–20 m.
Jmse 10 01342 g002
Figure 3. Plume from the Kodor River and examples (IIII) of manifestations of periodic structures on the sea surface associated with both internal and surface waves (Sentinel-2, 10 September 2017).
Jmse 10 01342 g003
Figure 4. Fragment I of a satellite image (Sentinel-2, 10 September 2017) showing concentric ring structures at the confluence of the Kodor River into the sea.
Jmse 10 01342 g004
Figure 5. Manifestations of internal waves on the backscattering coefficient on the ship tack near the Kodor River (ADCP record, 20 June 2021).
Jmse 10 01342 g005
Figure 6. Fragment II of the satellite image (Sentinel-2, 10 September 2017) shows the trains of internal waves generated by the plume of the Kodor River (arrows show the direction of movement of the trains).
Jmse 10 01342 g006
Figure 7. Fragment III of the satellite image (Sentinel-2, 10 September 2017) shows manifestations of a packet of internal waves moving towards Cape Sukhumsky.
Jmse 10 01342 g007
Figure 8. A train of internal waves moving from the plume of the Kodor River into the open sea (Sentinel-2, 25 August 2021).
Jmse 10 01342 g008
Figure 9. (a) Variability of the velocity components on 27 September–8 October 2020. (b) Frequency spectra according to the data of zonal velocity component at several depths. Dashed lines show the 95% confidence interval.
Jmse 10 01342 g009
Figure 10. Velocity (below) and direction of current (above) according to ADCP data for the record on 04 October 07:22–19:12 (LT).
Jmse 10 01342 g010
Figure 11. The temperature variability during the eddy passage, according to LTS records. The time axis is LT.
Jmse 10 01342 g011
Figure 12. Optical satellite images obtained sequentially with a time interval of ~16 min on 4 October 2020, above—Landsat-8, below—Sentinel-2. The results of the registration of surface manifestations of internal waves showed on the right.
Jmse 10 01342 g012aJmse 10 01342 g012b
Figure 13. A generalized scheme of registration of surface manifestations of internal waves from satellite images obtained on 4 October 2020 (left) and a general view of the eddy (right) near Cape Sukhumsky.
Jmse 10 01342 g013
Figure 14. The photography of the sea surface taken on 4 October 2020 at 09:53 LT by E. Khimchenko towards Cape Kodor to the southeast of the platform. Slick bands associated with internal waves are visible in the sea at a distance of 2–3 km.
Jmse 10 01342 g014
Figure 15. Examples of internal waves generated in the Galsky region near the mouth of the Eristskali channel (optical satellite image fragment, Sentinel-2A, 24 October 2020).
Jmse 10 01342 g015
Table 1. The main features of satellite image preprocessing.
Landsat-8Sentinel-2A/B
Sensor, type of source information productOLI, Collection 1 Tier 1 TOA ReflectanceMSI, Level-1C
The channel sequence usedRGB (B4, B3, B2)
Pixel spacing (m)3010
Projection used, EPSGUTM NORTH 37, 32637
Optimal brightness adjustmentStretch: “2 sigma”Stretch: “3 sigma”
Table 2. The specifications of the satellite images used.
No.DateSatelliteGranule ID
110 September 2017Sentinel-2 B20170910T080959_20170910T081359_T37TFH
20170910T080959_20170910T081359_T37TGH
24 October 2020Landsat-8LC08_173030_20201004
LC08_173031_20201004
34 October 2020Sentinel-2 B20201004T080759_20201004T081240_T37TFH
20201004T080759_20201004T081240_T37TGH
424 October 2020Sentinel-2 B20201024T081009_20201024T081240_T37TFH
20201024T081009_20201024T081240_T37TGH
525 August 2021Sentinel-2 A20210825T080611_20210825T080832_T37TFH
20210825T080611_20210825T080832_T37TGH
Publisher’s Note: MDPI stays neutral with regard to jurisdictional claims in published maps and institutional affiliations.

