Abstract
To improve the overall understanding of the fish diversity and spatial patterns of major coral reefs in the South China Sea, fish assemblage composition, dominant species, biodiversity indices, and multivariate analysis of community structure were reported for four major coral reefs based on hand-line survey data in May and September 2018. A total of five orders, 21 families, 45 genera and 121 species of fish were recorded with Perciformes (78.5%) being the most diverse. The highest number (5) of dominant species was found near Chenhang Island while the lowest (2) number was detected at Zhubi Reef. The highest abundance index (7.21) occurred at Zhubi Reef, while the Shannon–Wiener diversity (4.80), Pielou’s evenness (0.81), and Simpson’s dominance (0.95) indexes were all highest at Qiliangyu Island. Based on cluster analysis and non-metric multi-dimensional scaling (NMDS), fish communities varied more spatially than seasonally. Our results led us to hypothesize that the habitat complexity and level of anthropogenic disturbance were the main factors affecting the composition of reef-dwelling fish on each coral reef. Topography was likely responsible for most variation in the spatial pattern of fish diversity.
1. Introduction
Coral reefs are highly biodiverse and productive environments, and among the most obvious of the ecosystems to be affected by global climate change and anthropogenic disturbance. The conservation of coral reef ecosystems and reef fish diversity is a topical and internationally important issue in the field of marine environmental science [1], with the decreased biodiversity and functional degradation of coral reef habitats attracting considerable attention [2,3,4].
Coral reefs are the most important and distinctive ecosystems in the South China Sea (SCS), and are of great significance in the maintenance of biodiversity in this region and as fishing grounds for coral reef fisheries [5,6]. Various surveys of reef fish in this region have been performed [7,8,9,10], and extensive information regarding coral reef fish biodiversity is widely available [11,12,13,14]. New records of species and the feeding and biology of coral reef fish in the SCS have improved knowledge of species diversity, structure and function [10,12,15,16,17,18,19].
Climate change and ocean acidification can affect coral reef fish [20,21,22,23]. For example, coral bleaching can lead to diversity loss and changes in the structure of fish assemblages [24,25,26], and loss of coral reef fish biodiversity can affect ecosystem functioning and services [27]. Therefore, research on coral reef fish diversity improves our understanding of reef fish succession and their vulnerability to environmental changes and anthropogenic disturbance [28,29]. In particular, after repeat coral bleaching and long-term anthropogenic disturbance, the composition and diversity of coral reef fish in the SCS needs to be determined in order to conserve remaining coral reefs and their fish resources. Most previous studies on coral reef fish in the South China Sea have focused on the archipelagic scale, with few studies reporting the characteristics of fish diversity on the individual reef level and the differences among reefs [6,9,11,12]. To improve the overall understanding of coral reef fish diversity in the South China Sea, in this study we analyzed the composition, dominant species, biodiversity indices, and multivariate analysis of fish assemblages from four major coral reefs of the Nansha Islands and Xisha Islands in the SCS (Qilianyu and Chenhang Islands and Zhubi and Meiji Reefs), and investigated their spatial distribution and the differences among the coral reefs. In the four coral reefs of our study, there were two previous surveys on the coral reef fish of Meiji Reef, but the investigation efforts and sample sizes were very small, and the data were very poor and there was no diversity information available. For the other three study sites, there were no survey data available on fish biodiversity. Therefore, our research is very meaningful for understanding the diversity of fish in these coral reefs.
2. Materials and Methods
2.1. Study Site
Reef fish assemblages were surveyed at four coral reefs in the SCS (Qilianyu and Chenhang Islands and Zhubi and Meiji Reefs; Figure 1) in the boreal spring (May) and autumn (September) of 2018. The northeast monsoon prevails from October to March of the following year, and the southwest monsoon prevails from May to September. In Chenhang Island, Zhubi Reef and Meiji Reef, the water ecosystems are being measured, and commercial fishing is strictly prohibited except for scientific fishing, but in Qilianyu Island commercial coral reef fishing is allowed by gillnet, hand-line and diving fishing. The four study sites are not currently included in the MPA.
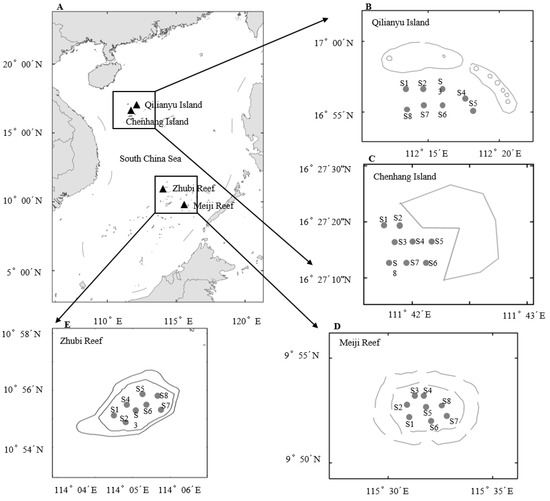
Figure 1.
(A) Area map of the four islands and reefs in the South China Sea. (B) Qilianyu Island, (C) Chenhang Island, (D) Meiji Reef, (E) Zhubi Reef.
Zhubi (10°54′ N, 114°03′ E) and Meiji (9°55′ N, 115°32′ E) Reefs are both part of the Nansha Islands. Zhubi Reef is a closed and approximately pear-shaped atoll, with a central lagoon approximately 9.5 km2 in area, mostly 20 m deep, and 24 m at its deepest [30]. Meiji Reef is a semi-closed, oval-shaped atoll with a lagoon of maximum depth 30 m, surrounded by a ring of reef flat of approximately 30.62 km2 [31]. The straight-line distance between Zhubi and Meiji reefs is nearly 194 km, but both are located in tropical regions with no obvious seasonal fluctuation in weather conditions.
Qilianyu (16°55–17°00′ N, 112°12–21′ E) and Chenhang (16°27′ N, 111°43′ E) Islands are both part of the Xisha Islands. Qilianyu Island is composed of seven very small islets and sandbanks, including Zhaoshu, North, Middle, and South Islets, and North, Middle and South Sandbanks. Qilianyu Island is an open coral reef of maximum depth 40 m, with a lagoon of approximately 2 km2 area. The center of Chenhang Island lies lower in latitude; it is surrounded by sandbanks, has a curved triangular shape and a land area of 0.43 km2, and most of its coral reef is 5–30 m deep (maximum 45 m). The straight-line distance between Qilianyu Island and Chenhang Island is approximately 81 km. Both islands experience high temperatures throughout the year, without obvious seasonal distinction.
Water temperature and salinity were determined at each reef using an YSI ProPlus meter (YSI Inc., Yellow Springs, OH, USA). In spring and autumn, the mean temperatures of Zhubi Reef in the upper 5 m of the water column were 28.69 ± 0.09 °C and 29.08 ± 0.12 °C, respectively, and for Meiji Reef, 27.95 ± 0.10 °C, and 28.50 ± 0.05 °C, respectively. Mean temperatures in the upper 5 m at Qilianyu Island in spring and autumn were 28.88 ± 0.11 °C and 29.28 ± 0.08 °C, respectively, and at Chenhang Island, 28.82 ± 0.08 °C and 29.10 ± 0.07 °C, respectively.
2.2. Fish Surveys
The R/V NanFeng (66.66 m length, 12.40 m width, 1537 t GT), equipped with a motorboat, was used to perform surveys. Fish were collected by hand-line from an outboard gasoline-powered motorboat (7.85 m length, 1.50 m width).
Hand-line gear included small (hook size: 26.0 mm total length, 10.0 mm gape size, 1.0 mm thickness, 0.330 mm diameter nylon wire) and big (hook size: 35.0 mm total length, 15.0 mm gape size, 1.21 mm thickness, 0.405 mm diameter nylon wire) hooks with barbs. In both May and September, eight stations (5 m, 2 stations; 10 m, 4 stations, 20 m, 2 stations) were surveyed in the lagoon of each reef, covering the area of each reef. At each station, the same five fishers used 10 hooks (5 small, 5 big) and sampled synchronously for 3 h (07:00–08:00, 13:00–14:00, 19:00–20:00) using fresh shrimp as bait.
Each fish specimen caught was identified to the lowest taxonomic category using morphological characteristics, then frozen (−20 °C) for further shore-based analysis. The wet body mass was measured using electronic scales to the nearest 0.01 g (Sunny Hengping Instrument, Shanghai, China). The total number of catches collected was 2282 individuals.
2.3. Diversity Indices
The data were standardized according to the weight and number of the specimens per unit hook by time, and kg/(100 hooks·h) and individuals/(100 hooks·h) were used to represent the standardized catch per unit effort (CPUE) based on the weight and number of specimens. An index of relative importance [32], Margalef’s richness index (D) [33], Shannon–Wiener diversity index (H′) [34,35], Simpson’s diversity index (C) [36], Pielou’s evenness index (J′) [37], and Jaccard similarity coefficient (Js) [38] were calculated to evaluate the structure of coral reef fish assemblages. Among them, in order not to be influenced by inter- and intra-species individual differences in fish species, and to calculate the results more closely relative to the inter-species energy distribution, a method proposed by Wilhm [34] was used to calculate fish species diversity by replacing the number of individuals with biomass.
The index of relative importance (IRI) was calculated as:
where Ni is a percentage, the number of the ith species divided by the total number of all individuals of all species; Wi is a percentage, the weight of ith species divided by the total weight of all specimens of all species; and Fi is a percentage, the number of stations with the ith species divided by the total number of surveyed stations. Species with IRI ≥ 500, 100 ≤ IRI < 500, 10 ≤ IRI < 100, and IRI < 10 are classified as dominant, common, general, and rare, respectively [39].
D, H′, C, J′, and Js are calculated as follows [34,35,36,37,38]:
where S is the total number of species; N is the total number of individuals in the sample; Wi is the wet weight of the ith species; W is total wet weight of the species divided by the total wet weight of all specimens of all species; H′max is equal to log2 S; a is the number of species on one reef (nominally “reef A”); b is the number of species on another reef (nominally “reef B”); and c is the number of species common to reefs A and B. When 0 ≤ Js < 0.25, 0.25 ≤ Js < 0.50, 0.50 ≤ Js < 0.75, and 0.75 ≤ Js < 1.00, the composition of species on reefs A and B are considered extremely dissimilar, moderately dissimilar, moderately similar, and very similar, respectively [40].
2.4. Multivariable Statistical Analysis of Community Structure
The data were processed and analyzed using ArcGIS 10.3 and R (version 3.6.3). The dominance and diversity indices of fish assemblages were calculated depending on regions and seasons to compare spatio-temporal differences. One-way analysis of similarities (ANOSIM) was used to test the differences in species composition among assemblage structures in different regions, and the significance among the communities was described by cluster analysis. ANOSIM was followed with a SIMPER routine to identify which species is/are the most responsible for the observed spatial or temporal differences. The Bray–Curtis similarity coefficients were calculated using the fourth root-transformed data to construct a similarity matrix among the islands in different seasons. Group average clustering and non-metric multidimensional scaling (NMDS) were used to analyze the heterogeneity of fish composition between seasons in the four regions [41]. Because of the complementary nature of these two methods, they could be used together to validate each other’s analytical results and to elucidate community patterns more effectively [42]. The above multivariate analysis was conducted in PRIMER 5.0 software. The strength of the NMDS analysis was measured by the stress coefficient (stress), where coefficients < 0.2, 0.1 and 0.05 indicated acceptable representation, good ranking and good representation of ranking, respectively [43].
3. Results
3.1. Species Composition
On the four coral reefs, 121 fish species were caught and identified, attributed to five orders, 21 families, and 45 genera (Appendix A). The most species occurred at Qiliangyu Island, where 60 species belonging to four orders and 14 families were recorded; Meiji Reef included 53 species belonging to 14 families and four orders, and Zhubi Reef encompassed 49 species from 15 families and five orders; 38 species from 21 families and five orders were registered near Chenhang Island. There were seasonal differences in fish composition between regions. In Meiji Reef, the number of species, genera and families was lower in May than in September. In Zhubi Reef, the number in May was equal to that in September. In Qilianyu and Chenhang Islands, the numbers in May were both higher than in September (Table 1).

Table 1.
Number of fish species in Meiji Reef, Zhubi Reef, Qilianyu Island and Chenhang Island in the South China Sea in May and September.
Perciformes dominated, with 95 species in 16 families accounting for 78.5% of all species, followed by Beryciformes (13 species), Tetraodontiformes (7 species), Aulopiformes (3 species), and Clupeiformes (2 species). Some 21 families were reported (Figure 2).
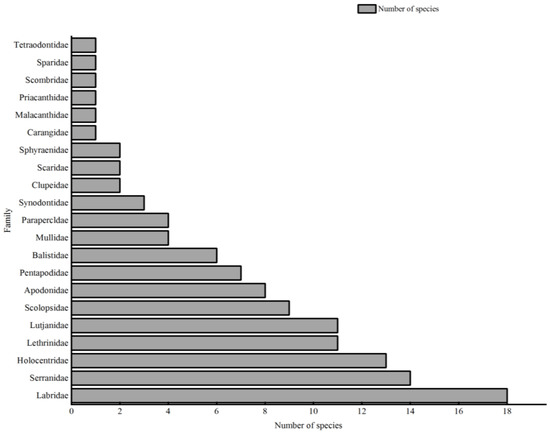
Figure 2.
The total species number by family in the four coral reefs.
3.2. Dominance Degree
For all four coral reefs, the seasonal differences in the composition of dominant species of fish assemblages were significant (Table 2). Reef fish with IRI ≥ 100 are presented in Table 3.
Table 2.
Dominant species at four coral reefs in the South China Sea in different seasons.
Table 3.
Dominant and common species at four coral reefs in the South China Sea regardless of the season.
At Meiji Reef, four species were dominant, 11 were common, 19 were general and 19 were rare. Catches of dominant, common, general, and rare species accounted for 46%, 36%, 14%, and 4% of the total catch, respectively. There were four dominant species in both May and September, and two species among them were recurrent.
At Zhubi Reef, two species were dominant, seven were common, 23 were general and 18 were rare. Catches of dominant, common, general, and rare species accounted for 58%, 22%, 16%, and 4% of the total catch, respectively. There were seven dominant species in both May and September, and four species among them were recurrent.
At Qilianyu Island, four species were dominant, 18 were common, 34 were general and four were rare. Catch of the dominant, common, general, and rare species accounted for 35.1%, 48.5%, 16.1% and 0.3% of the total catch, respectively. There were eight dominant species in both May and September, and two species among them were recurrent.
At Chenhang Island, five species were dominant, seven were common, 12 were general and 14 were rare. Catches of dominant, common, general, and rare species accounted for 77%, 15%, 6% and 2% of the total catch, respectively. There were four dominant species in May, six dominant species in September, and four species among both were recurrent.
3.3. Diversity Indices
In terms of season (Table 4), the mean D and H′ of the four coral reefs were higher in May than September for the four reefs, but the mean J′ of the four coral reefs was lower in May than September. In terms of spatial distribution (Table 5), D values among reefs ranged 3.915–7.064, with that for Zhubi Reef being highest, and that for Chenhang Island lowest; Hʹ values ranged 3.158–4.801, with that for Qiliangyu Island being highest and that for Chenhang Island lowest; Jʹ values ranged 0.580–0.813, with that for Qiliangyu Island being highest and that for Zhubi Reef being lowest; and C values ranged 0.729–0.946, with that for Qiliangyu Island being highest and that for Zhubi Reef being lowest. Js values ranged 0.172–0.273, with that between Chenhang and Qiliangyu islands being the greatest, and that between Qiliangyu Island and Zhubi Reef being the least (Table 6).
Table 4.
Richness, diversity and evenness indices of fish assemblages in Zhubi Reef, Meiji Reef, Qilianyu Island and Chenhang Island in May and September.
Table 5.
Diversity indices of fish in Meiji Reef, Zhubi Reef, Qilianyu Island and Chenhang Island.
Table 6.
Jaccard similarity indices (Js) of fish assemblages among Meiji Reef, Zhubi Reef, Qilianyu Island and Chenhang Island.
3.4. Community Patterns
The results of the cluster analysis among the different seasons and coral reefs showed that the fish could be divided into three communities: Community I, Community II and Community III (Figure 3). Moreover, differences among seasons and coral reefs were also visualized through non-metric multi-dimensional scaling (NMDS) ordination (Figure 4). The overall stress coefficient was 0.14, and the stress coefficient of sorting result was less than 0.2, which indicated that the graphs had interpretative meaning. The ANOSIM test showed that the difference between communities was significant (R2 = 0.729, p < 0.05), indicating that community division was feasible.
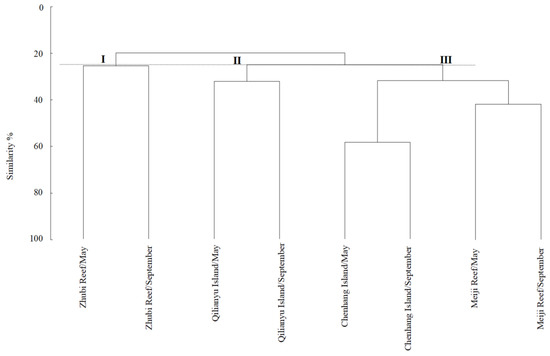
Figure 3.
Group average clustering among fish communities at Meiji Reef, Zhubi Reef, Qilianyu Island and Chenhang Island in May and September.
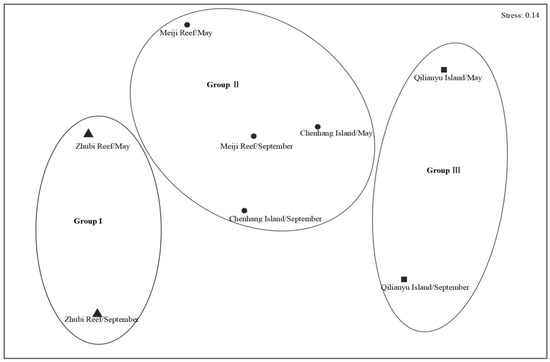
Figure 4.
Ordination of non-metric multidimensional scaling (NMDS) among fish communities at Meiji Reef, Zhubi Reef, Qilianyu Island and Chenhang Island in May and September.
The species contribution was calculated by combining the ANOSIM and SIMPER programs, and species contributing more than 10% were identified as being most responsible for the observed spatial or temporal differences. Epinephelus merra (11.41%) was the main contributor at Meiji Reef; four species of Parupeneus trifasciatus (18.94%), Cheilinus fasciatus (18.19%), Parapercis hexophtalma (14.83%) and Cephalopholis urodeta (13.54%) were the main contributors at Zhubi Reef; two species of Lethrinus rubrioperculatus (11.70%) and Gnathodentex aureolineatus (11.55%) were the main contributors at Qilianyu Island; and four species of Pentapodus caninus (11.57%), Cephalopholis spiloparaea (10.67%), Gnathodentex aureolineatus (10.51%) and Parupeneus trifasciatuswere (10.39%) the main contributors at Chenhang Island.
4. Discussion
4.1. Species Composition
Species richness is the most direct and fundamental expression of the degree of species diversity [44]. We reported the total number of fish species on four coral reefs in the SCS to be much lower than that previously recorded for these areas [15,16,45,46], but higher than the number of species in the Weizhou Island Coral Reef Sea [47], possibly because of differences in the timing, duration, frequency, and season of sampling. Qilianyu Island had the most species, and Chenhang Island the least, with the number of species at Meiji and Zhubi reefs being similar.
Differences in the numbers of fish species at different coral reefs may be related to reef size, habitat complexity, reef status, and different levels of anthropogenic disturbance [48,49,50]. Sandin et al. [51] found classic positive relationships between reef fish abundance and habitat area, and others have shown that increased isolation from terrestrial disturbance leads to increased biomass and abundance [52,53,54,55,56]. Meiji Reef is a semi-enclosed lagoon, with water exchange within and outside the lagoon. Zhubi Reef is a closed atoll, which, together with the reef flat barrier, prevents seawater exchange between the lagoon and the sea. Qilianyu Island comprises a series of smaller open islands. Chenhang Island is an atoll, on the same reef as Guangjin Island, with a lagoon within the atoll, with the northern part of the atoll connected to the outer sea. Differences in habitat structure among coral reefs and human activities (including pollution and overfishing) strongly influence the abundance and distribution of fish [57,58,59,60,61]. Our results led us to hypothesize that the habitat complexity and level of anthropogenic disturbance were the main factors affecting the composition of reef-dwelling fish on each coral reef. At the same time, compared with Zhubi Reef and Meiji Reef, there was obvious seasonality in the fish compositions at Qiliangyu Island and Chenhang Island, which also belong to the Xisha Islands. Qiliangyu Island and Chenhang Island are located in the northwestern part of the South China Sea, and are influenced by southwesterly and northeasterly winds and have obvious seasonal climate changes, while the sea temperature changes are jointly influenced by the ENSO and East Asian monsoon (EAM), so the fish composition showed obvious seasonal differences [62,63].
Theory suggests that the community in an undisturbed habitat will often include morphologically distinct species belonging to different phyla, while a heavily disturbed habitat has communities often comprising a few closely related species [64]. The influence of animal bait (i.e., shrimp) may bias sampling toward carnivorous fish and exclude herbivorous or omnivorous species, which can also affect fish composition in biodiversity surveys [65]. The fish species of southeastern Brazil and the Brazilian coast are dominated by the order Perciformes [66,67]. Fish in our study were also dominated by Perciformes, with the proportion on each reef being relatively high. This may be an important feature of coral reef fish community composition in the SCS. However, to determine whether the high proportion of Perciformes on the reef is a natural feature or because the habitat or sampling deviation has been disturbed would need further exploration.
4.2. Dominant Species
There were obvious differences in the dominant species of each island reef in different seasons, especially in Qilianyu Island. Dominant species occupy an important position in the ecosystem, and any changes in them can affect community structure, status and energy flow, and stability [68,69]. We reported that the dominant species on Meiji and Zhubi reefs belonged to the families Serranidae, Lutjanidae, Pentapodidae, Lethrinidae, Mullidae, and Scaridae, which is generally consistent with the types of dominant taxa found in coral reef habitats around the Nansha Islands [70]. However, the number of dominant species on Meiji Reef was lower than reported by [71], possibly because of differences in methods, duration and survey effort; Li et al. [15] did not report representatives of either the Labridae (which play an important role in maintaining reef stability) or Pomacentridae (which indicate living coral cover) on Zhubi Reef. Being a closed atoll, Zhubi Reef is more susceptible to deterioration, decline of coral cover, and habitat destruction.
Dominant species at Qiliangyu and Chenhang islands belonged to the Pentapodidae, Lethrinidae, Mullidae, and Serranidae. Based on a gillnet survey, Sun et al. [72] reported more coral reef fish at the Xisha Islands in families such as the Chaetodontidae, Labridae, Scaridae, and Acanthuridae than we did. Compared with Sun et al. [72], we reported an obvious difference in dominant taxa, especially in the Chaetodontidae, probably because of differences in sampling methods. The smaller number of advantageous categories and higher IRI at Chenhang Island affects the survival of less competitive fish, and reduces the ability of the fish community to cope with external threats, to the detriment of community stability [73,74]. Recent studies have shown that coral reefs in the Xisha Islands have deteriorated, with reduced habitat and food resources for reef fish, and with reef fish densities generally declining because of anthropogenic disturbance [15,75]. The loss of coral cover was very serious in the South China Sea. According to studies, live coral cover declined from an average of approximately 65% to approximately 20% during 1998–2007 in the major offshore atolls of the Nansha Islands and Xisha Islands [76]. In the Xisha Islands, the coral cover in 2016 was approximately 5.44% [77]. The carrying capacity of the Xisha Islands ecosystem may have been reduced because of environmental change and anthropogenic disturbance, and fish assemblages may have responded to habitat change by altering community structure, especially of dominant species.
4.3. Coral Reef Fish Diversity
Species diversity is influenced by a number of factors, and is necessary for maintaining ecosystem stability [78,79,80,81]. Fish diversity varies among regions and years [29]. We reported significant differences in fish diversity among coral reefs in the SCS, which may be a function of spatial differences among reef habitats and their fish assemblages in this region. Values of H′ exceeding 3 usually occur only in healthy ecosystems with high biodiversity [82]. We reported H′ values ranging 3.16–4.80, which was indicative of extremely high coral reef biodiversity in the SCS.
The highest values of species richness, H′, J′ and C, occurred at Qilianyu Island, and D was second only to that at Zhubi Reef, on which basis we inferred that this environment was highly heterogeneous with many ecological niches, resulting in higher species diversity. Species richness and evenness in distribution influence biodiversity indices: the higher the evenness and richness, the higher the biodiversity [37,83]. Additionally, according to “island effect” theory, habitat area is extremely important for determining the diversity of coral reef fish [84]. As an open coral reef comprising a series of islets, Qilianyu Island has more habitat than the other enclosed or semi-enclosed atolls, and can accommodate more species. Fish assemblages at Zhubi Reef had the highest D, but H′, J′ and C were lower. As a closed atoll, Zhubi Reef is vulnerable to environmental change and anthropogenic disturbance [16], its ecosystem is fragile, and it warrants protection. Zhang [71] and Chen et al. [39] reported fish assemblage H′ values at Meiji Reef of 3.58 and 0.92, while we reported a higher value of 4.37. It has been suggested that a proportion of both non-seasonal and seasonal resident fish occurs at Meiji Reef, and H′ values are also associated with a large number of seasonal and incidental species [29,71]. Further investigation is necessary to determine whether the higher H′ values of fish assemblages at Meiji Reef were because of seasonal effects. Fish assemblages at Chenhang Island had low D, H′, J′ and C values, and the lowest species richness among reefs. A recent tendency for some Xisha Island coral reefs to eutrophicate because of anthropogenic disturbance may affect fish diversity [18,85,86]. Differences in H′ values across islands suggested that topographic structure might be one of the main causes of differences in spatial distribution.
The recent concept of “ecological memory” maintains that coral adaptation may be difficult because of the cumulative thermal stresses of long-term warming [61]. Long-term seawater warming has not promoted thermal adaptation of corals in the SCS, and future coral growth will be less suited to warmer conditions [87]. The cumulative thermal stress of long-term warming and regional environmental stresses caused by anthropogenic disturbance (increased terrestrial sedimentation, deteriorating water quality, etc.) may weaken coral thermal adaptation, reduce resistance and resilience, exacerbate declines in growth, and contribute to an overall decline in coral growth in the SCS. This inevitably weakens the functions of coral reef ecosystems that provide food, habitat, and breeding grounds for fish, and reduces the diversity of coral reef fish. Concurrently, changes in evenness appear to drive differences in species richness on different reefs—that is, the effects of anthropogenic disturbance may be reversible over time but may also simultaneously accumulate and significantly alter diversity at various spatial scales [88].
4.4. Community Structure
Fish species composition showed some spatial and temporal heterogeneity, which is very closely related to complex physicochemical factors and seafloor geomorphology [89]. The community structure is directly related to the ecological function of the habitat [90]. Community I was in the Zhubi Reef, which is a typical closed atoll in the northern part of the Nansha Islands in the South China Sea, with no connection to the outer sea except limited water exchange between the lagoon and the outer ocean at high tide [91]. The special geographical, topographical and hydrological environment brought a unique community pattern. Community II was in the Meiji Reef and Chenhang Island. Although they were relatively far apart and differed in fish composition, there were many common dominant species. Although fish aggregation patterns can define the composition of aggregations in different areas, changes are gradual and there are no clear aggregation boundaries, with most fish occurring in two or more communities simultaneously [92]. Community III was at Qilianyu Island, which consists mainly of a series of smaller open reefs and is distinctly different from Zhubi Reef. Among the four coral reefs, the habitat of Qilianyu is relatively more favorable. Therefore, the species richness of coral reef fish in the Qilianyu was also relatively high. In the study, for the four coral reefs, the variation among fish communities by space was greater than that by season, based on cluster analysis. The four coral reefs are all located in tropical waters, and their natural environment, such as water temperature, monsoon, salinity, has relatively small seasonal differences, but the differences among coral reefs in the complexity, depth and area are relatively greater. Therefore, the influence of geomorphology on fish communities was greater than that of season.
5. Conclusions
We reported fish composition, dominant species, biodiversity indices, and assemblage structures at four coral reefs in the Nansha Islands (Meji Reef and Zhubi Reef) and Xisha Islands (Chenhang Island and Qilianyu Island) in the South China Sea based on hand-line survey data in May and September 2018. Of the four reefs, a total of five orders, 21 families, 45 genera and 121 species of fish were recorded with Perciformes (78.5%) being the most diverse. The highest number (5) of dominant species was found near Chenhang Island and the lowest (2) number was detected on Zhubi Reef. The highest abundance index (7.21) occurred at Zhubi Reef, while the Shannon–Wiener diversity (4.80), Pielou’s evenness (0.81), and Simpson’s dominance (0.95) indexes were all highest at Qiliangyu Island. Based on cluster analysis and NMDS, the spatial distribution of fish assemblages among the reefs in different seasons could be divided into three communities. The ANOSIM test showed that the differences in fish composition among different assemblages were significant (R2 = 0.729, p < 0.05). The variation in assemblage structures by space was greater than that by season. Our results led us to hypothesize that the habitat complexity and level of anthropogenic disturbance were the main factors affecting the composition of reef-dwelling fish on each coral reef. Topography was likely responsible for most variation in the spatial pattern of fish diversity.
Author Contributions
Conceptualization, Z.C. and J.Z.; methodology, Z.C.; formal analysis, Y.L. and J.Z.; resources, Z.C.; data curation, Y.L.; writing—original draft preparation, Y.L.; writing—review and editing, all authors. All authors have read and agreed to the published version of the manuscript.
Funding
This work was supported by the Key Special Project for Introduced Talents Team of Southern Marine Science and Engineering Guangdong Laboratory (Guangzhou) (GML2019ZD0605), the National Natural Science Foundation of China (31902374), the Central Public-Interest Scientific Institution Basal Research Fund (2020TD05 and 2021SD01).
Institutional Review Board Statement
The animal study was reviewed and approved by the South China Sea Fisheries Research Institute animal welfare committee.
Informed Consent Statement
Not applicable.
Data Availability Statement
The data presented in this study are available on request from the corresponding author.
Acknowledgments
We are grateful to Captain Wenming Yu and the entire crew of the Nanfeng for their participation in the sampling. We thank Yan’e Jiang, Yuyan Gong and Yutao Yang for their collaboration on the experiments.
Conflicts of Interest
The authors declare no conflict of interest.
Appendix A
Table A1.
Distribution of fish in the coral islands/reefs in the South China Sea.
Table A1.
Distribution of fish in the coral islands/reefs in the South China Sea.
| Species | Distribution Region | |||
|---|---|---|---|---|
| Meiji Reef | Zhubi Reef | Qilianyu Island | Chenhang Island | |
| Aulopiformes | ||||
| Synodontidae | ||||
| Synodus | ||||
| Synodus variegatus | + | |||
| Synodus hoshinonis | + | + | ||
| Synodus rubromarmoratus | + | + | + | |
| Beryciformes | ||||
| Holocentridae | ||||
| Myripristis | ||||
| Myripristis murdjan | + | |||
| Myripristis vittata | + | + | ||
| Neoniphon | ||||
| Neoniphon sammara | + | + | + | |
| Neoniphon opercularis | + | |||
| Neoniphon argenteus | + | |||
| Sargocentron | ||||
| Dispinus ruber | + | + | ||
| Sargocentron caudimaculatum | + | + | ||
| Sargocentron cornutum | + | + | + | |
| Sargocentron diadema | + | + | + | |
| Sargocentron punctatissimum | + | |||
| Sargocentron rubrum | + | + | ||
| Sargocentron spiniferum | + | |||
| Sargocentron tiere | + | |||
| Clupeiformes | ||||
| Clupeidae | ||||
| Amblygaster | ||||
| Amblygaster leiogaster | + | |||
| Amblygaster sirm | + | |||
| Perciformes | ||||
| Apodonidae | ||||
| Pristicon | ||||
| Pristicon trimaculatus | + | + | ||
| Pristicon rhodopterus | + | |||
| Ostorhinchus | ||||
| Ostorhinchus fleurieu | + | |||
| Nectamia | ||||
| Nectamia fusca | + | |||
| Pristiapogon | ||||
| Pristiapogon kallopterus | + | |||
| Apogonichthyoides | ||||
| Apogonichthyoides taeniatus | + | |||
| Cheilodipterus | ||||
| Cheilodipterus macrodon | + | + | ||
| Gymnapogon | ||||
| Gymnapogon urospilotus | + | |||
| Carangidae | ||||
| Decapterus | ||||
| Decapterus macarellus | + | |||
| Labridae | ||||
| Bodianus | ||||
| Bodianus bimaculatus | + | |||
| Cheilinus | ||||
| Cheilinus chlorourus | + | + | + | |
| Cheilinus fasciatus | + | + | + | |
| Cheilinus oxycephalus | + | + | ||
| Oxycheilinus | ||||
| Oxycheilinus celebicus | + | + | ||
| Oxycheilinus digramma | + | + | ||
| Oxycheilinus orientalis | + | + | + | + |
| Gomphosus | ||||
| Gomphosus varius | + | |||
| Halichoeres | ||||
| Halichoeres trimaculatus | + | + | ||
| Halichoeres nebulosus | + | + | ||
| Hologymnosus | ||||
| Hologymnosus annulatus | + | |||
| Pseudocheilinus | ||||
| Pseudocheilinus octotaenia | + | |||
| Wetmorella nigropinnata | + | |||
| Thalassoma | ||||
| Thalassoma lunare | + | + | ||
| Thalassoma purpureum | + | |||
| Thalassoma quinquevittatum | + | |||
| Iniistius | ||||
| Iniistius aneitensis | + | |||
| Lethrinidae | ||||
| Lethrinus | ||||
| Lethrinus atkinsoni | + | + | ||
| Lethrinus erythropterus | + | |||
| Lethrinus haematopterus | + | |||
| Lethrinus erythracanthus | + | + | ||
| Lethrinus lentjan | + | |||
| Lethrinus microdon | + | + | + | |
| Lethrinus miniatus | + | |||
| Lethrinus nebulosus | + | |||
| Lethrinus obsoletus | + | + | ||
| Lethrinus rubrioperculatus | + | + | + | + |
| Lethrinus semicinctus | + | + | ||
| Lutjanidae | ||||
| Aphareus | ||||
| Aphareus rutilans | + | |||
| Aprion | ||||
| Aprion virescens | + | |||
| Etelis | ||||
| Etelis carbunculus | + | |||
| Aprion virescens | + | |||
| Lutjanus | ||||
| Lutjanus bohar | + | + | ||
| Lutjanus erythropterus | + | |||
| Lutjanus fulviflamma | + | + | + | |
| Lutjanus gibbus | + | + | ||
| Lutjanus kasmira | + | + | + | |
| Lutjanus quinquelineatus | + | |||
| Lutjanus sebae | + | |||
| Pristipomoides | ||||
| Pristipomoides multidens | + | |||
| Malacanthidae | ||||
| Malacanthus | ||||
| Malacanthus brevirostris | + | |||
| Mullidae | ||||
| Mulloidichthys | ||||
| Mulloidichthys vanicolensis | + | + | ||
| Parupeneus | ||||
| Parupeneus ciliatus | + | |||
| Parupeneus cyclostomus | + | + | + | |
| Parupeneus trifasciatus | + | + | + | + |
| Parapercldae | ||||
| Parapercis | ||||
| Parapercis hexophtalma | + | + | + | |
| Parapercis tetracantha | + | |||
| Pentapodidae | ||||
| Gnathodentex | ||||
| Gnathodentex aureolineatus | + | + | + | |
| Gymnocranius | ||||
| Gymnocranius euanus | + | |||
| Gymnocranius griseus | + | |||
| Gymnocranius grandoculis | + | |||
| Pentapodus | ||||
| Pentapodus caninus | + | + | ||
| Pentapodus nagasakiensis | + | |||
| Pentapodus emeryii | + | |||
| Pinguipedidae | ||||
| Parapercis | ||||
| Parapercis hexophtalma | + | |||
| Parapercis millepunctata | + | + | ||
| Priacanthidae | ||||
| Priacanthus | ||||
| Priacanthus hamrur | + | |||
| Scaridae | ||||
| Leptoscarus | ||||
| Leptoscarus vaigiensis | + | |||
| Calotomus | ||||
| Bolbometopon muricatum | + | |||
| Scolopsidae | ||||
| Scolopsis | ||||
| Scolopsis affinis | + | + | ||
| Scolopsis bilineata | + | + | ||
| Scolopsis bimaculata | + | + | ||
| Scolopsis Cuvier | + | |||
| Scolopsis lineata | + | + | ||
| Scolopsis margaritifera | + | + | ||
| Scolopsis monogramma | + | + | ||
| Scolopsis xenochrous | + | |||
| Parascolopsis | ||||
| Parascolopsis inermis | + | |||
| Scombridae | ||||
| Rastrelliger | ||||
| Rastrelliger kanagurta | + | |||
| Serranidae | ||||
| Cephalopholis | ||||
| Cephalopholis argus | + | |||
| Cephalopholis leopardus | + | + | ||
| Cephalopholis spiloparaea | + | + | + | + |
| Cephalopholis urodeta | + | + | + | + |
| Epinephelus | ||||
| Epinephelus coioides | + | + | ||
| Epinephelus fasciatus | + | |||
| Epinephelus corallicola | + | |||
| Epinephelus trimaculatus | + | |||
| Epinephelus fasciatomaculosus | + | |||
| Epinephelus merra | + | + | + | |
| Epinephelus quoyanus | + | + | + | |
| Variola | ||||
| Variola albimarginata | + | + | ||
| Variola louti | + | |||
| Aethaloperca | ||||
| Aethaloperca rogaa | + | |||
| Sparidae | ||||
| Dentex | ||||
| Monotaxis grandoculis | + | |||
| Sphyraenidae | ||||
| Sphyraena | ||||
| Sphyraena pinguis | + | |||
| Sphyraena forsteri | + | |||
| Tetraodontiformes | ||||
| Balistidae | ||||
| Melichthys | ||||
| Melichthys vidua | + | |||
| Abalistes | ||||
| Abalistes stellatus | + | |||
| Rhinecanthus | ||||
| Rhinecanthus aculeatus | + | |||
| Rhinecanthus rectangulus | + | |||
| Sufflamen | ||||
| Sufflamen chrysopterum | + | + | + | |
| Balistapus | ||||
| Balistapus undulatus | + | + | + | + |
| Tetraodontidae | ||||
| Arothron | ||||
| Arothron nigropunctatus | + | |||
References
- Cowman, P.F.; Bellwood, D.R. Coral reefs as drivers of cladogenesis: Expanding coral reefs, cryptic extinction events, and the development of biodiversity hotspots. J. Evol. Biol. 2011, 24, 2543–2562. [Google Scholar] [CrossRef] [PubMed]
- Shen, G.Y.; Huang, L.F.; Guo, F.; Shi, B.Z. Marine Ecology, 3rd ed.; Science Press: Beijing, China, 2010. [Google Scholar]
- Rogers, A.; Blanchard, J.L.; Mumby, P.J. Fisheries productivity under progressive coral reef degradation. J. Appl. Ecol. 2018, 55, 1041–1049. [Google Scholar] [CrossRef]
- Mccormick, M.I.; Chivers, D.P.; Allan, B.J.M.; Ferrari, M.C.O. Habitat degradation disrupts neophobia in juvenile coral reef fish. Glob. Change Biol. 2016, 23, 719–727. [Google Scholar] [CrossRef] [PubMed]
- Yang, W.D.; Hu, J.T.; Lin, B.A.; Huang, H.; Liu, M. Species diversity of coral reef fishes in Zhaoshu Island waters, Xisha Islands. J. Xiamen Univ. (Nat. Sci.) 2018, 57, 819–826. [Google Scholar]
- Li, Y.Z.; Lin, Z.J.; Chen, P.M.; Sun, D.R.; Chen, Y.; Chen, G.B.; Zhang, X.F. Survey for coral reef fish resources in the center & north waters of the Nansha Islands. J. Fish. China 2003, 27, 315–321. [Google Scholar]
- Sun, D.R.; Qiu, Y.S.; Lin, Z.J.; Wang, X.H. Preliminary studies on the composition of coral reef fish resources in the waters of Zhongsha Island in spring. Trans. Oceanol. Limnol. 2006, 3, 85–92. [Google Scholar]
- Shu, L.M.; Li, Y.Z.; Chen, G.B. Composition and Distribution of Chondrichthyes in the Main Coral Reef Waters of the South China Sea. J. Ocean Univ. China 2006, 36, 277–280. [Google Scholar]
- Chen, G.B.; Li, Y.Z.; Chen, X.J.; Shu, L.M. Composition and distribution of Cartilaginous fishes in the adjacent waters area of main Islands and reefs of South China Sea. J. Shanghai Ocean Univ. 2006, 15, 461–467. [Google Scholar]
- Arai, T. Diversity and conservation of coral reef fishes in the Malaysian South China Sea. Rev. Fish. Biol. Fish. 2015, 25, 85–101. [Google Scholar] [CrossRef]
- Shi, Y.R.; Li, Y.Z.; Lu, W.H.; Sun, D.F. Taxonomic diversity of fish species in coral reef area from Dongsha Islands. South China Fish. Sci. 2009, 5, 10–16. [Google Scholar]
- Li, Y.Z.; Shi, Y.R.; Ai, H.; Dong, L.N.; Li, N.N.; Li, X.; Zhang, X.F. Large scale distribution patterns of taxonomic diversity of fish in coral reef waters, South China Sea. J. Fish. Sci. China 2011, 18, 619–628. [Google Scholar] [CrossRef]
- Wang, X.H.; Du, F.Y.; Lin, Z.J.; Sun, D.R.; Qiu, Y.S.; Huang, S.L. Fish species diversity and community pattern in coral reefs of the Xisha Islands, South China Sea. Biodivers. Sci. 2011, 19, 463–504. [Google Scholar]
- Xu, L.; Wang, X.H.; Kay, V.D.; Huang, D.L.; Li, Y.F.; Wang, L.G.; Ning, J.J.; Du, F.Y. Assessment of fish diversity in the South China Sea using DNA taxonomy. Fish. Res. 2021, 233, 105771. [Google Scholar] [CrossRef]
- Li, Y.J.; Chen, Z.Z.; Zhang, J.; Jiang, Y.E.; Gong, Y.Y.; Cai, Y.C.; Yang, Y.T. Species and taxonomic diversity of Qilianyu island reef fish in the Xisha Islands. J. Fish. Sci. China 2020, 27, 815–823. [Google Scholar]
- Li, Y.J.; Zhang, J.; Chen, Z.Z.; Jiang, Y.E.; Gong, Y.Y.; Cai, Y.C.; Yang, Y.T. Study on taxonomic diversity of fish in Zhubi Reef of Nansha Islands. South China Fish. Sci. 2020, 16, 36–41. [Google Scholar]
- Zhang, Y.P.; Chen, P.M.; Liang, X.Y. Relationship Between Food and Food Habits for Main Fish Species in the Transitional Waters Around Coral Reefs in the South China Sea. J. Ocean Univ. China 2006, 36, 635–638. [Google Scholar] [CrossRef]
- Gao, Y.L.; Huang, H.; Lian, J.S.; Yang, J.H. The species diversity and trophic structure of reef fishes in the waters of the Xisha Archipelago. Biodivers. Sci. 2014, 22, 618–623. [Google Scholar]
- Zhang, J.; Chen, Z.Z.; Chen, G.B. A preliminary study on biology of Glowfish (Gnathodentex aureolineatus) in Yongshu Reef of Nansha area in the South China Sea. South China Fish. Sci. 2015, 11, 108–116. [Google Scholar]
- Munday, P.L.; Donelson, J.M.; Domingos, J.A. Potential for adaptation to climate change in a coral reef fish. Glob. Change Biol. 2017, 23, 307–317. [Google Scholar] [CrossRef]
- Harborne, A.R. The ecology, behaviour and physiology of fishes on coral reef flats, and the potential impacts of climate change. J. Fish. Biol. 2013, 83, 417–447. [Google Scholar] [CrossRef]
- Monaco, C.J.; Bradshaw, C.J.A.; Booth, D.J.; Gillanders, B.M.; Schoeman, D.S.; Nagelkerken, I. Dietary generalism accelerates arrival and persistence of coral-reef fishes in their novel ranges under climate change. Glob. Change Biol. 2020, 26, 5564–5573. [Google Scholar] [CrossRef]
- Genin, A.; Levy, L.; Sharon, G.; Raitsos, D.E.; Diamant, A. Rapid onsets of warming events trigger mass mortality of coral reef fish. Proc. Natl. Acad. Sci. USA 2020, 117, 25378–25385. [Google Scholar] [CrossRef]
- Eakin, C.M.; Sweatman, H.P.A.; Brainard, R.E. The 2014-2017 global-scale coral bleaching event: Insights and impacts. Coral Reefs 2019, 38, 539–545. [Google Scholar] [CrossRef] [Green Version]
- Johnston, M.A.; Hickerson, E.L.; Nuttall, M.F.; Blakeway, R.D.; Sterne, T.K.; Eckert, R.J.; Schmahl, G.P. Coral bleaching and recovery from 2016 to 2017 at East and West Flower Garden Banks, Gulf of Mexico. Coral Reefs 2019, 38, 787–799. [Google Scholar] [CrossRef] [Green Version]
- Jörgensen, T.L.; Martin, E.C.; Burt, A.J. Spatial variability in habitat structure and heterogenic coral reef fish assemblages inside a small-scale marine reserve after a coral mass mortality event. Ocean Coast. Manag. 2015, 114, 32–41. [Google Scholar] [CrossRef]
- Hector, A.; Bagchi, R. Biodiversity and ecosystem multifunctionality. Nature 2007, 448, 188. [Google Scholar] [CrossRef]
- Barjau-González, E.; Rodríguez-Romero, J.; Galván-Magaña, F.; Emelio, B.G.; Jesús, R.R.; Felipe, G.M.; López-Martínez, J. Changes in the taxonomic diversity of the reef fish community of San José Island, Gulf of California, Mexico. Biodivers. Conserv. 2012, 21, 3543–3554. [Google Scholar] [CrossRef]
- Jayaprabha, N.; Purusothaman, S.; Srinivasan, M. Biodiversity of coral reef associated fishes along southeast coast of India. Reg. Stud. Mar. Sci. 2018, 18, 97–105. [Google Scholar] [CrossRef]
- Zhang, J.; Chen, G.; Chen, Z.; Qiu, Y.; Xiong, D. Application of hydroacoustics to investigate the distribution, diel movement, and abundance of fish on Zhubi Reef, Nansha Islands, South China Sea. Chin. J. Oceanol. Limn. 2016, 34, 964–976. [Google Scholar] [CrossRef]
- Du, F.Y.; Wang, X.H.; Lin, Z.J. Characteristics of summer zooplankton community in Meiji Reef, Nansha Islands. Acta Ecol. Sin. 2015, 35, 1014–1021. [Google Scholar]
- Pinkas, L.; Oliphant, M.S.; Iverson, I.L.K. Food habits of albacore, bluefin tuna, and bonito in California waters. Fish. Bull. 1971, 152, 1–105. [Google Scholar]
- Margalef, R. Information theory in ecology. Gen. Syst. 1958, 3, 36–71. [Google Scholar]
- Wilhm, J.L. Use of Biomass Units in Shannon’s Formula. Ecology 1968, 49, 153–156. [Google Scholar] [CrossRef]
- Krebs, C.J. Ecological Methodology; HarperCollins Press: New York, NY, USA, 1989; pp. 37–98. [Google Scholar]
- Simpson, E.H. Measurement of diversity. Nature 1949, 163, 688. [Google Scholar] [CrossRef]
- Pielou, E.C.J. The measurement of diversity in different types of biological collections. J. Theor. Biol. 1966, 13, 131–144. [Google Scholar] [CrossRef]
- Jaccard, P. The distribution of the flora in the alpine zone. New Phytol. 1912, 11, 37–50. [Google Scholar] [CrossRef]
- Chen, G.B.; Li, Y.Z.; Chen, X.J. Species diversity of fishes in the coral reefs of South China Sea. Biodivers. Sci. 2007, 15, 373–381. [Google Scholar]
- Kong, F.Z.; Yu, R.C.; Xu, Z.J.; Zhou, M.J. Application of excel in calculation of biodiversity indices. Mar. Sci. 2012, 36, 57–62. [Google Scholar]
- Field, J.G.; Clarke, K.R.; Warwick, R.M. A practical strategy for analysing multispecies distribution patterns. Mar. Ecol. Prog. Ser. 1982, 8, 37–52. [Google Scholar] [CrossRef]
- Brazner, J.C.; Beals, E.W. Patterns in fish assemblages from coastal wetland and beach habitats in Green Bay, Lake Michigan: A multivariate analysis of abiotic and biotic forcing factors. Can. J. Fish. Aquat. Sci. 1997, 54, 1743–1761. [Google Scholar] [CrossRef]
- Khalaf, M.A.; Kochzius, M. Changes in trophic community structure of shore fishes at an industrial site in the Gulf of Aqaba, Red Sea. Mar. Ecol. Prog. 2002, 239, 287–299. [Google Scholar] [CrossRef]
- Hu, J.H.; Hu, H.J.; Jiang, Z.G. Distribution regularities of species diversity at large spatial scale. Chin. J. Appl. Environ. Biol. 2007, 13, 731–735. [Google Scholar]
- Zhang, J. Long-Term Trends in Fish Composition and Biological Characteristics of Typical Coral Reefs in the South China Sea; University of Chinese Academy of Sciences: Beijing, China, 2020; pp. 1–173. [Google Scholar]
- Shi, Y.R.; Li, Y.Z.; Ai, H.; Chen, G.B.; Lu, W.H.; Li, X.G.; Li, N.N.; Yu, J.; Dong, L.N.; Cui, K.; et al. Fish taxonomic diversity of coral reef areas in Xisha Islands. J. Fish. China 2010, 34, 1753–1761. [Google Scholar]
- Zou, Q.; Wu, Z.Q.; Huang, L.L.; Ding, Y.; Huang, X. Coral reef fish species composition in Weizhou Island, Guangxi. J. South. Agric. 2020, 51, 1–10. [Google Scholar]
- Bellwood, D.R.; Hughes, T.P. Regional-scale assembly rules and biodiversity of coral reefs. Science 2001, 292, 1532–1534. [Google Scholar] [CrossRef] [Green Version]
- Bellwood, D.R.; Wainwright, P.C. The history and biogeography of fishes on coral reefs. Coral Reef Fishes 2002, 5, 32. [Google Scholar]
- Mellin, C.; Mouillot, D.; Kulbicki, M.; Mcclanahan, T.R.; Vigliola, L.; Bradshaw, C.J.A.; Chabanet, P.; Edgar, G.J.; Fordham, G.A. Humans and seasonal climate variability threaten large-bodied coral reef fish with small ranges. Nat. Commun. 2016, 7, 216–219. [Google Scholar] [CrossRef]
- Sandin, S.; Vermeij, M.J.; Hurlbert, A. Island biogeography of Caribbean coral reef fish. Glob. Ecol. Biogeogr. 2008, 17, 770–777. [Google Scholar] [CrossRef]
- DeMartini, E.E.; Friedlander, A.M.; Sandin, S.A.; Sala, E. Differences in fish-assemblage structure between fished and unfished atolls in the northern Line Islands, central Pacific. Mar. Ecol. Prog. Ser. 2008, 365, 199–215. [Google Scholar] [CrossRef]
- Stallings, C.D. Fishery-Independent data reveal negative effect of human population density on caribbean predatory fish communities. PLoS ONE 2009, 4, e5333. [Google Scholar] [CrossRef]
- Williams, I.D.; Richards, B.L.; Sandin, S.A.; Baum, J.K.; Schroeder, R.E.; Nadon, M.O.; Zgliczynski, B.; Craig, P.; Mcilwain, J.L.; Brainard, R.E. Differences in reef fish assemblages between populated and remote reefs spanning multiple archipelagos across the central and Western Pacific. J. Mar. Biol. 2011, 2011, 1–14. [Google Scholar] [CrossRef] [Green Version]
- Brewer, T.D.; Cinner, J.E.; Fisher, R.; Green, A.; Wilson, S.K. Market access, population density, and socioeconomic development explain diversity and functional group biomass of coral reef fish assemblages. Glob. Environ. Chang. 2012, 22, 399–406. [Google Scholar] [CrossRef] [Green Version]
- Kattan, A.; Coker, D.J.; Berumen, M.L. Reef fish communities in the central Red Sea show evidence of asymmetrical fishing pressure. Mar. Biodivers. 2017, 47, 1227–1238. [Google Scholar] [CrossRef] [Green Version]
- Jones, G.P.; McCormick, M.I.; Srinivasan, M.; Eagle, J.V. Coral decline threatens fish biodiversity in marine reserves. Proc. Natl. Acad. Sci. USA 2004, 101, 8251–8253. [Google Scholar] [CrossRef] [Green Version]
- Coker, D.J.; Wilson, S.K.; Pratchett, M.S. Importance of live coral habitat for reef fishes. Rev. Fish. Biol. Fish. 2014, 24, 89–126. [Google Scholar] [CrossRef]
- Pratchett, M.S. Feeding Preferences and Dietary Specialization among Obligate Coral-Feeding Butterflyfishes; CRC Press: Boca Raton, FL, USA, 2014; pp. 140–179. [Google Scholar]
- Albright, R.; Caldeira, L.; Hosfelt, J.; Kwiatkowski, L.; Maclaren, J.K.; Mason, B.M.; Nebuchina, Y.; Ninokawa, A.; Pongratz, J.; Ricke, K.L.; et al. Reversal of ocean acidification enhances net coral reef calcification. Nature 2016, 531, 362. [Google Scholar] [CrossRef]
- Hughes, T.P.; Kerry, J.T.; Connolly, S.R.; Baid, A.H.; Eakin, C.M.; Heron, S.F.; Hoogenboom, M.O.; Jacobson, M.; Liu, G.; Pratchett, M.S.; et al. Ecological memory modifies the cumulative impact of recurrent climate extremes. Nat. Clim. Chang. 2019, 9, 40–43. [Google Scholar] [CrossRef]
- Jiang, L.L.; Yu, K.F.; Han, T.; Tao, S.C.; Zhang, H.L. Coral perspective on temperature seasonality and interannual variability in the northern South China Sea during the Roman Warm Period, Global. Planet. Chang. 2021, 207, 103675. [Google Scholar] [CrossRef]
- Wyrtki, K. Physical Oceanography of the Southeast Asian Waters: Scientific Results of Marine Investigations of the South China Sea and the Gulf of Thailand; Naga Report; The University of California Press: San Diego, CA, USA, 1961; pp. 1959–1961. [Google Scholar]
- Wu, H.L.; Zhong, J.S. Chinese Zoology, Order Perciformes (V), Suborder Gobiidae; Science Press: Beijing, China, 2008; pp. 497–499. [Google Scholar]
- Harvey, E.S.; Cappo, M.; Butler, J.J.; Hall, N.; Kendrick, G.A. Bait attraction affects the performance of remote underwater video stations in assessment of demersal fish community structure. Mar. Ecol. Prog. Ser. 2007, 350, 245–254. [Google Scholar] [CrossRef] [Green Version]
- Costa, A.M.C.; Gomes-Goncalves, R.S.; Mattos, T.M.; Uehara, W.; Soares Guedes, G.H.; Araújo, F.G. Taxonomic and functional distinctness of the fish assemblages in three coastal environments (bays, coastal lagoons and oceanic beaches) in Southeastern Brazil. Mar. Environ. Res. 2017, 129, 180–188. [Google Scholar] [CrossRef]
- Araújo, F.G.; Rodrigues, F.L.; Teixeira-Neves, T.P.; Vieira, J.P.; Azevedo, M.C.C.; Penha Guedes, A.P.; Garcia, A.M.; Pessanha, A.L.M. Regional patterns in species richness and taxonomic diversity of the nearshore fish community in the Brazilian coast. Estuar. Coast. Shelf. Sci. 2018, 208, 9–22. [Google Scholar] [CrossRef]
- Smith, M.D.; Knapp, A.K. Dominant species maintain ecosystem function with non-random species loss. Ecol. Lett. 2010, 6, 509–517. [Google Scholar] [CrossRef] [Green Version]
- Hillebrand, H.; Bennett, D.M.; Cadotte, M.W. Consequences of dominance: A review of evenness effects on local and regional ecosystem processes. Ecology 2008, 89, 1510–1520. [Google Scholar] [CrossRef] [PubMed]
- Li, Y.Z.; Chen, P.M. Quantitative distribution of fish resources in main coral reef waters of Nansha Islands. J. Fish. China 2004, 28, 651–656. [Google Scholar]
- Zhang, K.; Guo, J.; Xu, Y.; Jiang, Y.; Chen, Z. Long-term variations in fish community structure under multiple stressors in a semi-closed marine ecosystem in the south china sea. Sci. Total Environ. 2020, 745, 140892. [Google Scholar] [CrossRef]
- Sun, D.R.; Lin, Z.J.; Qiu, Y.S.; Wang, X.H. Fish fauna of coral reef waters of the Xisha Islands. South China Fish. Sci. 2005, 1, 22–29. [Google Scholar]
- Magurran, A.E. Biodiversity Measurement; Science Press: Beijing, China, 2011. [Google Scholar]
- Cottingham, K.L.; Brown, B.L.; Lennon, J.T. Biodiversity may regulate the temporal variability of ecological systems. Ecol. Lett. 2001, 4, 72–85. [Google Scholar] [CrossRef]
- Li, Y.C.; Wu, Z.J.; Chen, S.Q.; Cai, Z.F.; Lan, J.X.; Tong, Y.H.; Yao, H.J. Discussion of the diversity of the coral reef fish in the shallow reefs along the Yongxing and Qilianyu island. Mar. Environ. Sci. 2017, 36, 509–516. [Google Scholar]
- Hughes, T.P.; Huang, H.; Young, M.A.L. The Wicked Problem of China’s Disappearing Coral Reefs. Conserv. Biol. 2013, 27, 261–269. [Google Scholar] [CrossRef]
- Coral Reef Branch Pacific Society of China (PSC). State of China′s Coral Reefs Report (2011–2019); Ocean Press: Beijing, China, 2020. [Google Scholar]
- Hughes, T.P. Catastrophes, phase shifts, and large-scale degradation of a Caribbean coral reef. Science 1994, 265, 1547–1551. [Google Scholar] [CrossRef] [Green Version]
- Tilman, D.; Wedin, D.; Knops, J. Productivity and sustainability influenced by biodiversity in grassland ecosystems. Nature 1996, 379, 718–720. [Google Scholar] [CrossRef]
- Leonard, D.R.P.; Clarke, K.R.; Somerfield, P.J.; Warwick, R.M. The application of an indicator based on taxonomic distinctness for UK marine biodiversity assessments. J. Environ. Manag. 2006, 78, 52–62. [Google Scholar] [CrossRef]
- Bevilacqua, S.; Fraschetti, S.; Musco, L.; Guarnieri, G.; Terlizzi, A. Low sensitiveness of taxonomic distinctness indices to human impacts: Evidences across marine benthic organisms and habitat types. Ecol. Indicat. 2011, 11, 448–455. [Google Scholar] [CrossRef]
- Clarke, K.R.; Warwick, R.M. Change in Marine Communities: An Approach to Statistical Analysis and Interpretation; Natural Environment Research Council: London, UK, 2001; p. 190. [Google Scholar]
- Cheng, J.S.; Guo, X.W. Distribution and dynamic variations of species and quantity of benthos in the Bohai Sea. Mar. Fish. Res. 1998, 1, 31–42. [Google Scholar]
- Planes, S.; Lecchini, D.; Mellin, C.; Charton, J.G.; Harmelin-Vivien, M.; Kulbicki, M.; Mou-Tham, G.; Galzin, R. Environmental determinants of coral reef fish diversity across several French Polynesian atolls. Comptes Rendus Biol. 2012, 335, 417–423. [Google Scholar] [CrossRef]
- Villéger, S.; Miranda, J.R.; Hernández, D.F.; Mouillot, D. Contrasting changes in taxonomic vs functional diversity of tropical fish communities after habitat degradation. Ecol. Appl. 2010, 20, 1512–1522. [Google Scholar] [CrossRef]
- Parker, J.; Cao, Y.; Sass, G.G.; Epifanio, J. Large river fish functional diversity responses to improved water quality over a 28 year period. Ecol. Indic. 2018, 88, 322–331. [Google Scholar] [CrossRef]
- Yan, H.Q.; Shi, Q.; Yu, K.F.; Tao, S.C.; Yang, H.Q.; Liu, Y.; Zhang, H.L.; Zhao, M.X. Regional coral growth responses to seawater warming in the South China Sea. Sci. Total Environ. 2019, 670, 595–605. [Google Scholar] [CrossRef]
- China, V.; Zvuloni, A.; Roll, U.; Belmaker, J. Reduced human activity in shallow reefs during the COVID-19 pandemic increases fish evenness. Biol. Conserv. 2021, 257, 109103. [Google Scholar] [CrossRef]
- Taiga, K.; Katsunori, T. Patterns in diversity and species composition in soft-sediment tidepool fishes across topographical types: Implications for conservation with spatial nuances. Mar. Environ. Res. 2021, 170, 105442. [Google Scholar]
- Jackson, D.A.; Walker, S.C.; Poos, M.S. Cluster analysis of fish community data: “New” tools for determining meaningful groupings of sites and species assemblages. Am. Fish. Soc. Symp. 2010, 73, 503–527. [Google Scholar]
- Shen, P.P.; Tan, Y.H.; Huang, L.M.; Zhang, J.L.; Yin, J.Q. Occurrence of brackish water phytoplankton species at a closed coral reef in Nansha Islands, South China Sea. Mar. Pollut. Bull. 2010, 60, 1718–1725. [Google Scholar] [CrossRef]
- Li, S.F.; Yan, L.P.; Li, C.S.; Hu, F. The analysis of fish composition pattern in the northern East China Sea. J. Fish. China 2004, 28, 384–392. [Google Scholar]
Publisher’s Note: MDPI stays neutral with regard to jurisdictional claims in published maps and institutional affiliations. |
© 2021 by the authors. Licensee MDPI, Basel, Switzerland. This article is an open access article distributed under the terms and conditions of the Creative Commons Attribution (CC BY) license (https://creativecommons.org/licenses/by/4.0/).