1. Introduction
Climate change will have a major impact on agricultural systems within the next decades [
1] and expose many ecosystems to atmospheric and soil water deficits [
2]. In many arid or semi-arid areas, due to a decreased water availability and increases in salinity related to inadequate irrigation practices [
3,
4], the use of crops with an enhanced tolerance to salt stress will be required [
5]. However, many conventional crops are largely intolerant to even small increases in soil salinity [
6]. It is anticipated that a reduction in the availability of land suitable for conventional agriculture will cause a direct competition between the land used for the production of energy crops and that used for food production, forestry and/or conservation measures [
7]. Given this scenario, any expansion in the cultivation of bioenergy crops is likely to place an increasing emphasis on the use of land that is unsuitable for conventional agriculture, including areas subjected to a high salinity. Consequently, the wider exploitation of bioenergy crops may require an enhanced salt tolerance.
Salinization is a product of natural interactions among geological, hydrological and vegetation processes, as well as being due to anthropogenic influences, including irrigation and grazing practices [
8]. Saline soils can be characterized as those soils that have an electrical conductivity above 4 dS m
−1 [
4], and they are often linked to increased concentrations of sodium chloride (NaCl). An increase in salinity is usually associated with decreases in the productivity of sensitive plants/crops (glycophytes), even at low concentrations, while in more resistant species (halophytes), the productivity may even be stimulated at low concentrations. However, considerable variations in salt tolerance exist both among glycophytes and halophytes, and even halophytes can show growth reductions at a higher salinity [
9]. Saline conditions can affect growth through reductions in leaf initiation, leaf expansion, reproduction and root growth [
10,
11,
12]. Part of the reason for a reduction in growth is associated with lower substrate water potentials [
13] that can limit water and nutrient uptake (physiological drought), with the toxic effects of high concentrations of sodium (Na
+) and chlorine (Cl
−) ions on plant metabolism, as well as with competition with nutrient ions, particularly potassium (K) [
12]. Saline conditions also have an indirect effect on photosynthetic activity due to reductions in stomatal conductance, as a consequence of lower soil water potentials, restricting the availability of CO
2 for photosynthesis [
14]. However, there is also evidence of salt-related non-stomatal inhibition of photosynthesis, through reductions in the chlorophyll content of leaves [
15], an increased resistance to CO
2 diffusion to the site of reduction in the chloroplast, a reduced RUBISCO (ribulose 1,5–bisphosphate) activity [
16], decreases in the stability of photosystem II (PSII) and inhibition of photosynthetic electron transport [
17].
In general, conventional crops show limited growth under saline conditions [
18]. In contrast, some bioenergy crops, such as
Arundo donax [
19,
20] and
Miscanthus x
giganteus [
21], have been reported to show an increased tolerance to moderately high levels of salinity at least in the short term. For switchgrass (
Panicum virgatum), reductions in aboveground and belowground biomass have been reported in response to salinity, but almost all the available information is based on germination and seedling studies [
22]. There are, however, some long-term exposure studies with switchgrass that have highlighted high emergence rates and biomass production in both lowland and upland switchgrass types exposed to moderate to high salinity [
23,
24]. This suggests that switchgrass may be a good candidate for bioenergy production in marginal lands affected by salinity.
Salinity tolerance in plants is related to different mechanisms, primarily associated with either salt exclusion and/or compartmentation [
9,
25]. Previous studies have indicated that switchgrass populations may show different responses to salt, such as a selective exclusion from the roots, as well as the accumulation of salts in aerial plant parts [
23]. Increases in organic solutes (i.e., proline and soluble sugars), often related to salt tolerance, have also been found in response to increasing salt concentrations in switchgrass [
26,
27]. Other mechanisms, for example the elimination of salt through salt glands [
22,
28], have also been suggested, but in general information on the mechanisms and/or variability of salt tolerance among switchgrass genotypes is limited.
To examine the response of switchgrass to salinity, three different genotypes were compared in order to investigate the effects on (1) biomass production, (2) leaf-level photosynthesis, (3) plant water balance, (4) proline and sugar concentrations in leaves, (5) cation concentrations in roots, culms and leaves and (5) stomatal density andsize and salt gland production. The results provide insights into the different mechanisms of salt tolerance found in switchgrass and how these contribute to final biomass yields.
2. Material and Methods
2.1. Plant Material, Growth Conditions Experimental Design
Switchgrass (Panicum virgatum L.) is an important, largely warm-season, perennial grass of the prairies of the United States, and is usually used as a forage crop and for preventing soil erosion. Three switchgrass genotypes, i.e., Alamo, Kanlow and Trailblazer, were used for this experiment. Alamo and Kanlow are lowland ecotypes, whereas Trailblazer is an upland ecotype. The seeds were obtained from Ceres College Station, College Station, TX, USA and CERES Inc., Thousand Oaks, CA, USA. The seeds were sterilized with a 2% solution of sodium hypochlorite for two minutes, rinsed with sterilized distilled water and germinated in Petri dishes with filter paper, and water was applied. After seven days, the seedlings were planted in 0.5 L pots with a mixture of John Innes No. 2, perlite and vermiculite (2:1:1; v:v:v) and grown in a greenhouse under natural light conditions (~500 μmol photon m−2 s−1) with a day/night temperature of ~27/20 °C. Manual watering was applied to the plants as needed (3–4 times per week). When the second/third leaf was fully developed, the plants were transplanted into 4.5 L pots with the same substrate (one plant per pot, 84 plants per genotype).
Two months after planting, the seedlings were divided into five groups and salt stress was induced adding NaCl in the irrigation water. Five different concentrations of NaCl, i.e., control, 50, 100, 200 and 300 mM, were used. In order to avoid an osmotic shock, the salt concentrations were gradually increased. For the highest concentrations (200 and 300 mM NaCl), the whole process took a total of three weeks, and the plants were subsequently exposed to these treatments for 6 months. A total of five harvests were performed over the duration of the experiment; at 60, 90, 135, 180 and 240 days after planting (DAP). The mean values of the electric conductivity of the growing media throughout the experiment, measured with a WET sensor (WET2, Delta-T Devices, Ltd., Cambridge, UK), are shown in
Table 1.
2.2. Plant Growth Parameters
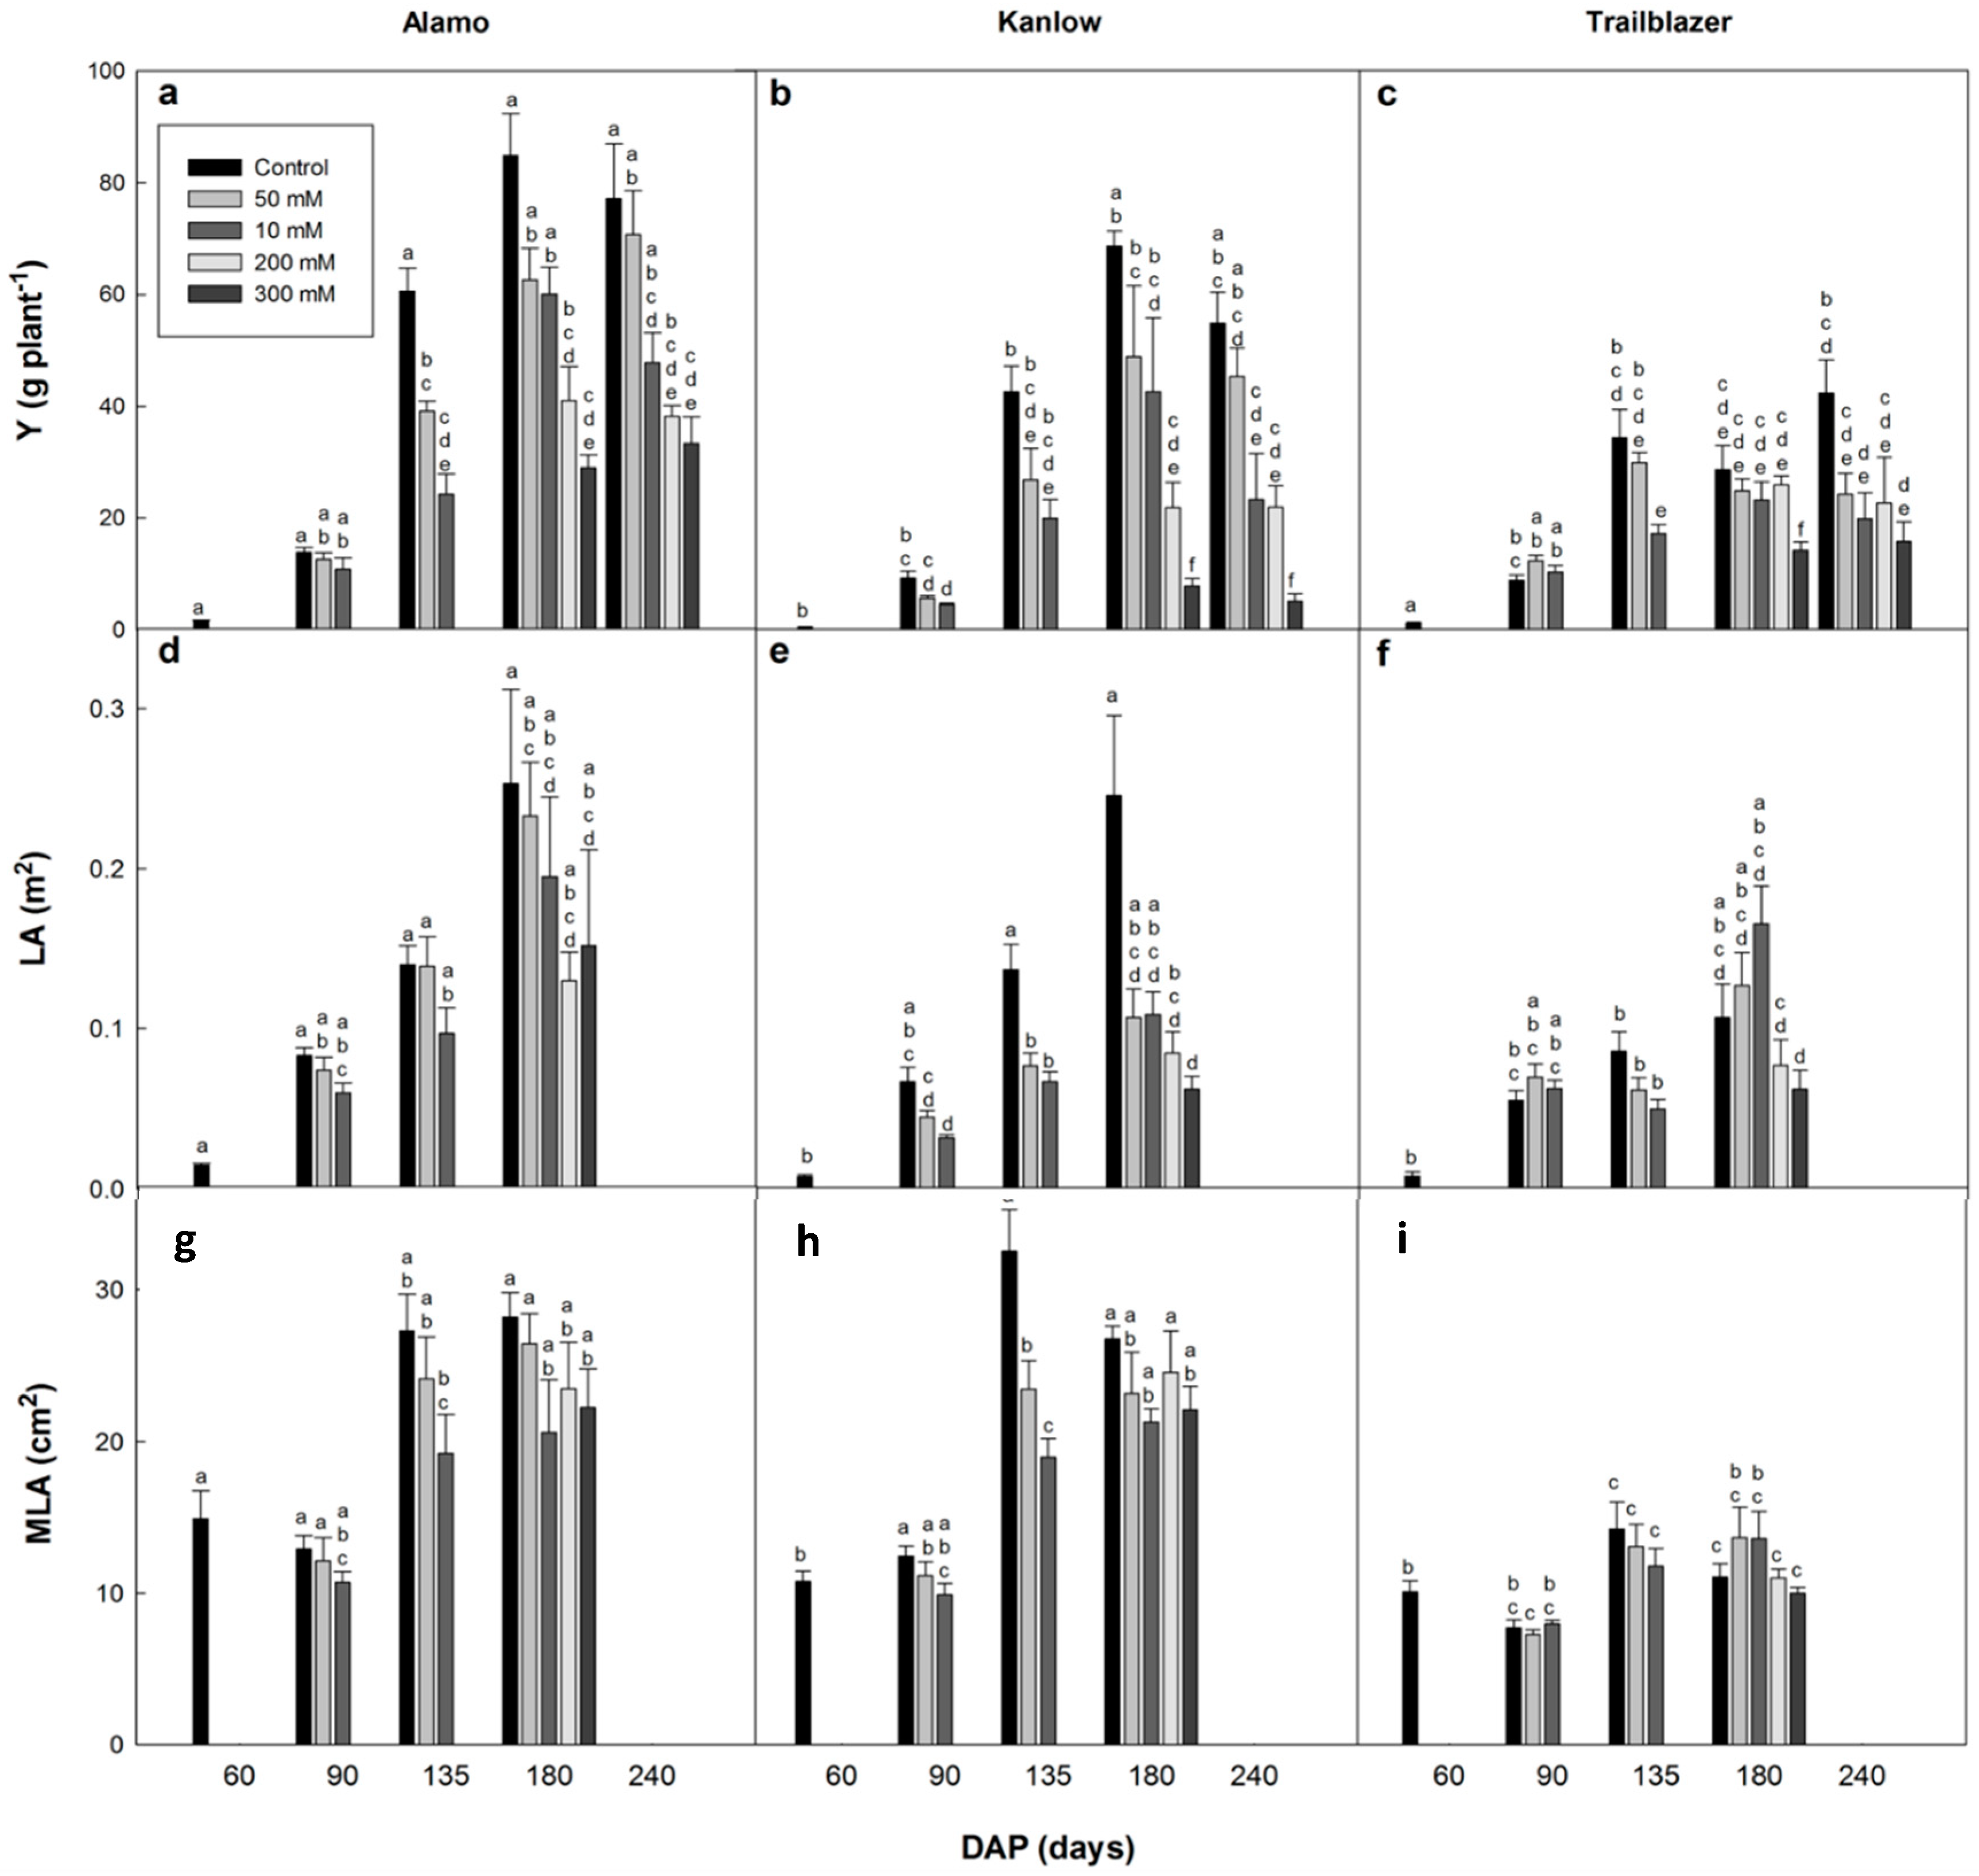
The shoot and root biomass (oven dried to a constant weight for a minimum 2 days at 80 °C), total leaf area (LA) and mean leaf area (MLA) were determined for each harvest interval. Plants exposed to 200 and 300 mM NaCl were only harvested at 135 and 180 DAP. The leaf areas were calculated on three representative leaves from the middle part of the canopy using a portable leaf area meter (ADC Bioscientific, Hoddesdon, UK) and then multiplied by the leaf number to estimate the total leaf area. The values of LA are absent for the last harvest (240 DAP) due to plant senescence.
2.3. Gas Exchange and Chlorophyll Fluorescence Measurements
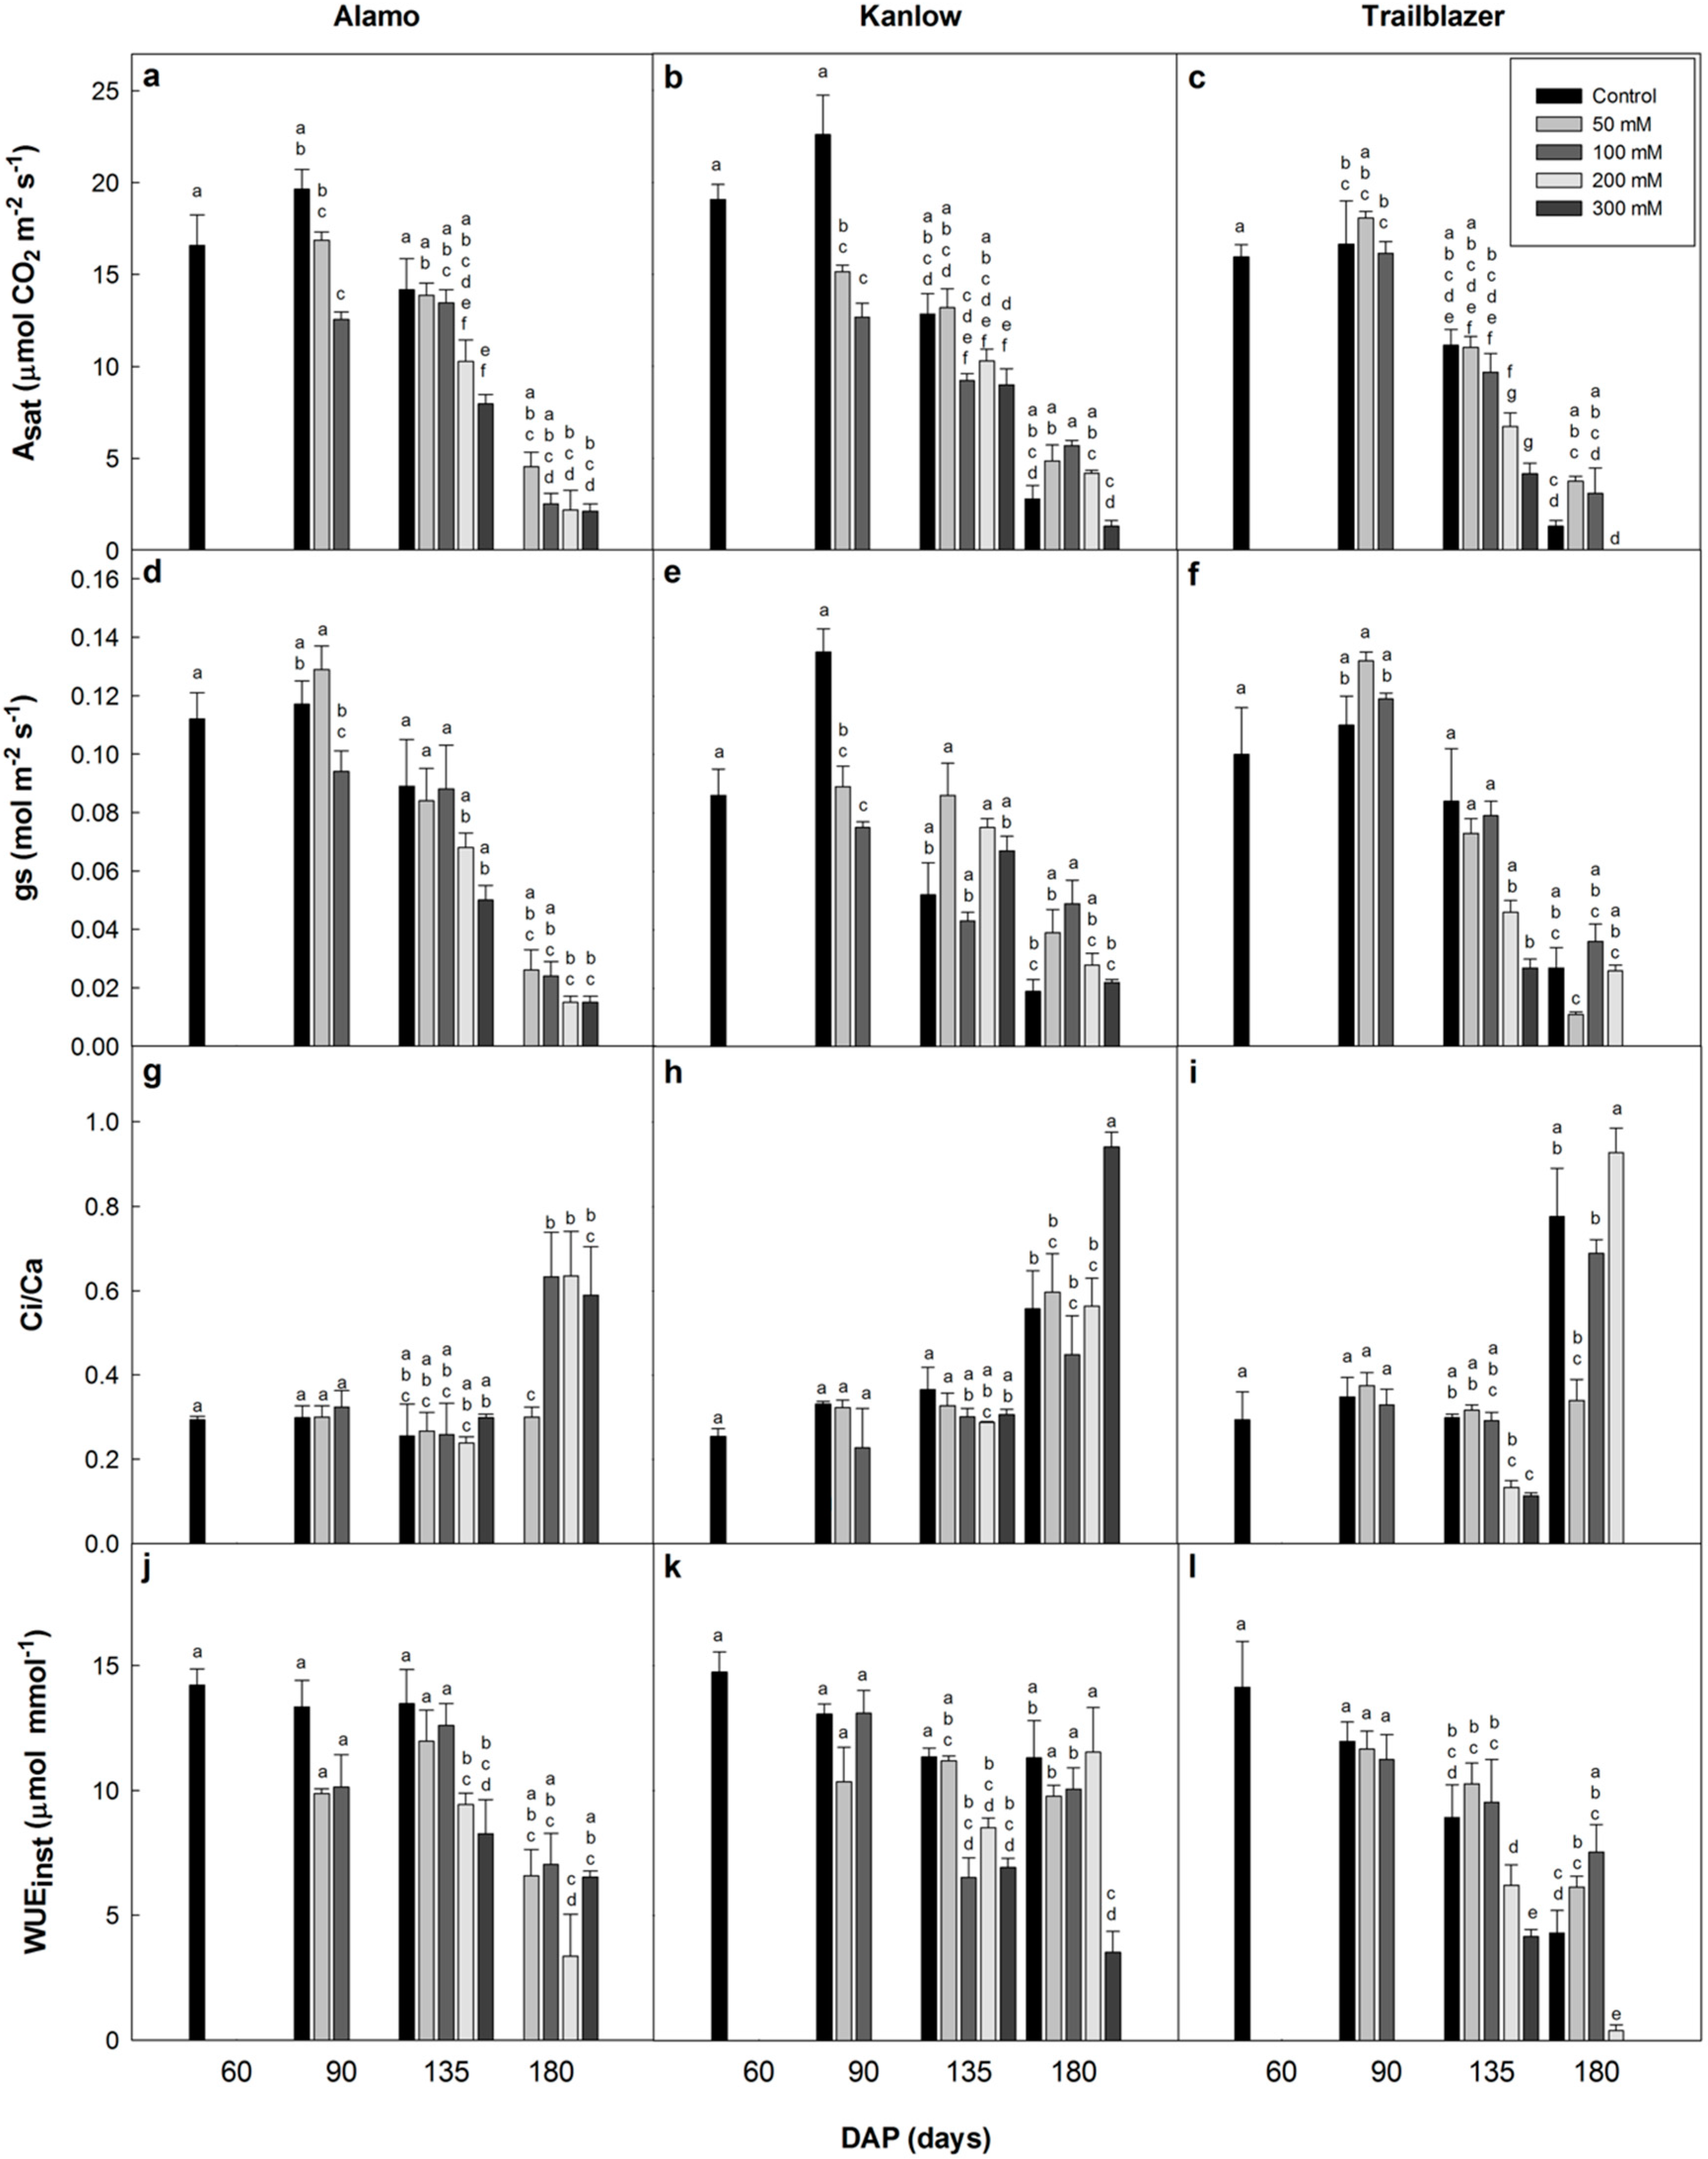
Leaf gas exchange measurements were conducted with a portable infrared gas analyser (LI-COR 6400, Lincoln, NE, USA) at 25 °C (leaf temperature) on the last fully expanded leaf from the bottom to the top. Light response (A/PPFD) curves and the response of CO
2 assimilation to intercellular CO
2 concentration (A/Ci curves) were conducted for each harvest following the method described in Cordero & Osborne [
29]. The light-saturated assimilation rate (A
sat), stomatal conductance (g
s), the ratio of the intercellular to ambient CO
2 concentration (Ci/Ca) and instantaneous water use efficiency (WUE
inst) were calculated. The average vapour pressure deficit (VPD) during the measurements varied from 1.05 to 1.27 kPa.
Chlorophyll fluorescence measurements on the adaxial surface of the leaves were made using a fluorometer (FMS 2, Hansatech, King’s Lynn, UK) and coincided with the gas exchange measurements. The maximum quantum efficiency of photosystem II (Fv/Fm) was calculated from the fluorescence parameters after dark adaptation of the leaves for 20 min. The values for leaf gas exchange and chlorophyll fluorescence parameters were calculated for all genotypes and treatments for the first four harvests. Because plants started senescing, some values for the photosynthetic and chlorophyll fluorescence parameters are absent at 180 DAP and at the end of the experiment (240 DAP).
2.4. Leaf Water Status and Epidermal Impressions
The pre-dawn leaf water potential (Ψ
pd) was determined using a Scholander-type pressure chamber (SKPM 1400 Series, SKYE Instrument, Dole, Powys, UK), and the relative water content (RWC) was estimated via a modification of Weatherley’s method [
30]. Both parameters were first measured on fully developed leaves from the top of the main culm.
Epidermal impressions were obtained by applying transparent nail polish over an approximately 0.5 × 1 cm area on both the adaxial and abaxial surfaces of one leaf per plant, avoiding the midrib. These impressions were placed on a microscope slide and observed under 40× using a Leica DM2500 microscope (Leica Microsystems, Wetzlar, Germany) with Syncroscopy Automontage (Syncroscopy, Cambridge, UK) digital imaging software. The number of stomata was counted, and the lengths of three different stomata were measured within a visual field of 0.09 mm2 in each sample. The stomatal density, stomatal size and the presence of salt glands were examined with ImageJ (Wayne Rasband, Washington, DC, USA).
2.5. Proline and Total Soluble Sugars in Leaves
Total soluble sugars (TSS) and proline were quantified in potassium phosphate buffer (KPB) (50 mM, pH = 7.5) extracts of fresh tissue (0.2 g) after being manually ground with liquid nitrogen. The extracts were filtered through four layers of cheesecloth and centrifuged at 28,710×
g for 15 min at 4 °C. The supernatant was collected and stored at 4 °C for further TSS and proline determinations. The total soluble sugars were analyzed spectrophotometrically with the anthrone reagent [
31]. Free proline was estimated via a spectrophotometric analysis at 515 nm with the ninhydrin reaction [
32]. An analysis of the data was performed on the youngest full-mature leaves harvested at midday, frozen in liquid nitrogen and stored at −20 °C for each harvest for later quantification.
2.6. Mineral Analysis
The samples from the youngest fully mature leaves (0.5 g dry weight) were dry-ashed and dissolved in hydrogen chloride (HCl), as described in Duque [
33]. The potassium, magnesium, calcium and sodium concentrations were determined using a Perkin Elmer Optima 4300 inductively coupled plasma optical emission spectroscopy (ICP-OES) (Perkin Elmer, Billerica, MA, USA). The operating parameters of the ICP-OES were: radio frequency power 1300 W, nebulizer flow 0.85 L min
−1, nebulizer pressure 30 psi, auxiliary gas flow 0.2 L min
−1, sample introduction 1 mL min
−1. The cation balance was calculated as the ratio of the potassium, calcium and magnesium concentrations divided by the sodium concentration in tissues with the following formula: ((K + Ca + Mg)/Na) [
23].
2.7. Statistical Analysis
One and two-factor analyses of variance (ANOVA) were performed in SPSS 20.0 (IBM Corp, Armonk, NY, USA). The variance was related to the main treatments (salinity and genotype) and the interaction between them. The Levene’s test was used to check for homoscedasticity. The means ± SE were calculated, and, when the F-ratio was significant, the least significant differences were evaluated via the Tukey-b posthoc test. The linear regression and Pearson product-moment correlation coefficients were calculated to study the relationships between the variables. The significance levels were always set at 5%.
4. Discussion
The objective of this study was to assess the performance and genetic variability in the response of switchgrass to elevated salinity levels due to its potential importance for the wider exploitation of this genus as a bioenergy crop. Most studies have focused on the short-term effects of salinity on the performance of switchgrass, and the effects of long-term exposure have not been assessed in depth. After 75 days of salt stress exposure (135 DAP), there was evidence of a direct effect of salinity (50 and 100 mM) on shoot biomass, which was more evident in the lowland genotypes Alamo and Kanlow. Previous studies have shown that 30 days of exposure to 250 mM NaCl [
26], 30 days of irrigation with 10.0 dS m
−1 saline solution [
34] or 60 days at ~180 mM NaCl [
35] can impact the biomass yields in switchgrass. To our knowledge, however, there are no studies on the effect of lower concentrations (50 and 100 mM NaCl), although similar responses have been observed in
Miscanthus, with significant yield-reductions after a 64-day salinity exposure to concentrations of 100 mM NaCl [
36]. This biomass reduction was found to be linked to a reduced stomatal conductance and photosynthetic rate as result of a water deficit caused by salt stress, similar to previous research from Sánchez et al. [
35]. The different salinity levels did not affect the MLA values in general, indicating that differences in LA were possibly related to an effect of salinity on the initiation/emergence of new leaves in switchgrass rather than on leaf expansion. Leaf growth has been reported to be directly affected by salinity [
25,
35], and the significantly positive correlations between LA and shoot yield at 135 DAP (r = 0.744,
p < 0.001) and 180 DAP (r = 0.570,
p < 0.001) indicated strong relationships between the two parameters in switchgrass that could be exploited for the selection of high yielding genotypes. On the other hand, switchgrass also exhibited changes in development related to salinity. The flowering times were affected in Kanlow with a one-week flowering delay in the 200 mM treatment, and anthesis was not reached in the 300 mM NaCl treatment. These developmental disorders should be further studied under field conditions to select high-yielding genotypes that also have a high establishment rate in subsequent growing seasons. In fact, Zannetti et al. [
37] have recently demonstrated that Alamo has a high germination rate under saline conditions, although it shows a lower salt tolerance at a more mature stage.
Both short [
15,
26,
35] and long-term studies [
23,
24,
37] found general salinity-related reductions in CO
2 assimilation rates that were similar to the findings of this study. These differences in CO
2 assimilation were more pronounced during early development, and became smaller toward the end of the experiment when the assimilation rates of non-stressed plants were lower as they approached the senescence phase. Overall, the absence of an impact on Fv/Fm, coupled with largely constant values for Ci/Ca in the first two harvests, suggests that the photosynthetic/photochemical performance was not affected. However, a lower stomatal conductance under salt stress may limit CO
2 uptake with a consequent reduction of photosynthesis. Presumably, this was associated with salt-related water deficits, which is consistent with reductions in leaf Ψ and RWC. Correlated reductions in A
sat and g
s in response to salinity have previously been reported [
6,
38,
39], even in halophytes [
40]. Similar results have also been found in other C
4 species, in which a stomatal constraint was the main reason for the reduction in CO
2 assimilation in the early stages of exposure to osmotic stress [
41]. The negative correlation between Ci/Ca and A
sat in all treatments, including the controls at later stages, were probably largely developmental, as the photosynthetic apparatus starts to be dismantled as plants senesce [
42], and not solely as a consequence of a direct impact of salinity.
Although RWC was reduced in this experiment, consistent with other studies where plants were exposed to water deficits and salinity [
43,
44], switchgrass was shown to experience smaller reductions in RWC than other bioenergy crops under saline conditions [
35], indicating a great capability to maintain water balance. The ability of switchgrass to maintain high values of WUE
inst and RWC even after more than 60 days of exposure to saline conditions also gives an indication of a relatively high tolerance to salinity.
Proline may have a positive effect on the performance of plants exposed to salinity [
45,
46] and, together with the accumulation of soluble sugars, is often an indication of metabolic resistance [
47]. Salinity-related increases in proline have been widely documented in both C
3 species [
48,
49] and in C
4 grasses [
36,
50]. In our experiment, there was no strong indication of a relation between proline accumulation and salt tolerance. High proline concentrations were found at 90 and 180 DAP, but they were not consistent. However, the genotype that did not show proline accumulation at later growth stages (180 DAP) was the one that did not accumulate salt at the higher salinity levels (Alamo). The low yields achieved by Kanlow and Trailblazer at the higher salt concentrations at 180 DAP could be the result of a lack of compartmentation of salt within the cells that could have contributed to the production of proline as a stabilizer of cellular homeostasis [
51]. However, other compatible solutes or ions that have not been analyzed in this study could also be involved.
There were two different patterns in the accumulation of Na in the shoots of the switchgrass genotypes. Kanlow and Trailblazer showed a significantly higher concentration of Na in the higher salinity treatments than Alamo did. This suggests the existence of different mechanisms of salt tolerance within switchgrass genotypes, as previously reported in the lowland EG1102 and the upland EG2101 genotype by Anderson et al. [
23], through the exclusion from roots (Alamo) and accumulation of Na in shoots and leaves (Trailblazer and Kanlow). In roots, Alamo showed a lower Na concentration in the 300 mM treatment that could be explained by a reduction in Na influx to the roots or an efflux increase via a salt overlay sensitive (SOS) pathway [
52]. Conversely, Sun et al. [
34] described a higher Na concentration in Alamo compared to five other switchgrass genotypes including Kanlow. In our study, both Kanlow and Trailblazer accumulated a high concentration of Na in shoots, although the concentration of Na was almost double in the stems of Trailblazer. Previous research has suggested that the accumulation of Na in stems is greater for less saline-tolerant genotypes such as rice [
53,
54] and that salinity tolerance is often linked to smaller reductions in K and Ca concentrations in plant tissues [
55].
In general, lower concentrations of Mg were linked to increases in salinity only in shoots. This was accompanied by lower K levels in the shoots and roots of all genotypes in the salinity treatments that were concomitant with the increase in Na. These changes in cation concentrations may reflect a differential sensitivity to saline conditions. All genotypes showed an ability to largely maintain K levels in the leaves, which has previously been documented as an indication of salinity tolerance in wheat and barley [
56]. However, the major reduction in the cation balance observed in Kanlow and Trailblazer could be a consequence of reductions in the absorption of the essential cations Ca, Mg and K [
23,
57] or a consequence of higher concentrations of Na. Our results indicate that the ability to exclude Na from the roots, as found in Alamo, was not related to a disruption in the cation balance; in fact, these plants showed similar Ca, Mg and K levels to the other two genotypes. These results could indicate that the ability to maintain nutritional homeostasis through the exclusion of Na from the roots, as found in Alamo, could have been of benefit, as it was not associated with a cation imbalance-related yield loss that could impact on the absorption of essential nutrients [
23,
58].
The production of salt glands has been previously reported as an additional mechanism of salinity tolerance in switchgrass [
22]. According to our results, the production of salt glands was only significant in the Kanlow genotype, although it did not contribute to a reduction of Na in the leaves. It may be possible that the excretion of salt could have reduced the total content of salt in the aboveground biomass (lower Na content in stems), as previously reported for plants that do not exclude salt from the roots [
59], but these reductions seemed to be of minor significance. Our findings are in line with the results observed by Kim et al. [
28], who found that the production of salt glands was unlikely to contribute significantly to salt tolerance in switchgrass.


