1. Introduction
The Rwandan economy relies heavily on agriculture, a sector that has persistently played a leading part in employment provision, poverty alleviation, food availability, and export earnings. Recent world development indicators [
1] show that agriculture contributes to 31.5 percent of the gross domestic product (GDP), and offers employment to nearly 75 percent of the Rwandan population. This sector also provides 91 percent of the food consumed in the country, and generates 70 percent of Rwanda’s total export revenues, with coffee, tea, and pyrethrum playing an important role [
2,
3]. Coffee production in Rwanda is the key source of household income and export earnings [
2]. It holds a unique position in its economy by making approximately 27 percent of total export revenue [
3]. Owing to its importance to rural livelihoods, coffee, of all cash crops, demands more concern in Rwanda.
Coffee production in Rwanda was introduced in 1904 by German missionaries. Since the early 1950s, it has gradually undergone substantial development resulting from proper farm management [
4]. Owing to Rwandan soil characteristics, which are suitable for coffee production, coffee plantations are found in all four provinces of the country. Arabica and Robusta are the major coffee species cultivated in Rwanda. Arabica coffee occupies approximately 95% of the country’s total coffee plantations and is mostly planted at higher altitudes in the Southern, Northern, and Western Provinces of Rwanda. Robusta coffee comprises the remaining 5% and is planted at lower altitudes below 1400 m in the Eastern Province [
4]. According to Mutandwa et al. [
5], the total area under plantations was last estimated at 33,000 hectares, with 500,000 producers.
Despite its significant contribution in the Rwandan economy, the coffee production sector is facing a number of challenges, mainly low productivity. According to the authors of [
6], coffee yields in most of the East African counties lag behind Latin-America and Asia. In Rwanda, the average annual coffee yields varied between 1.5 and 2 tons per ha from 2012 to 2016 [
7]. In contrast, in the same period, the average annual coffee yields were around 8 tons per ha in Colombia, Venezuela, and Indonesia [
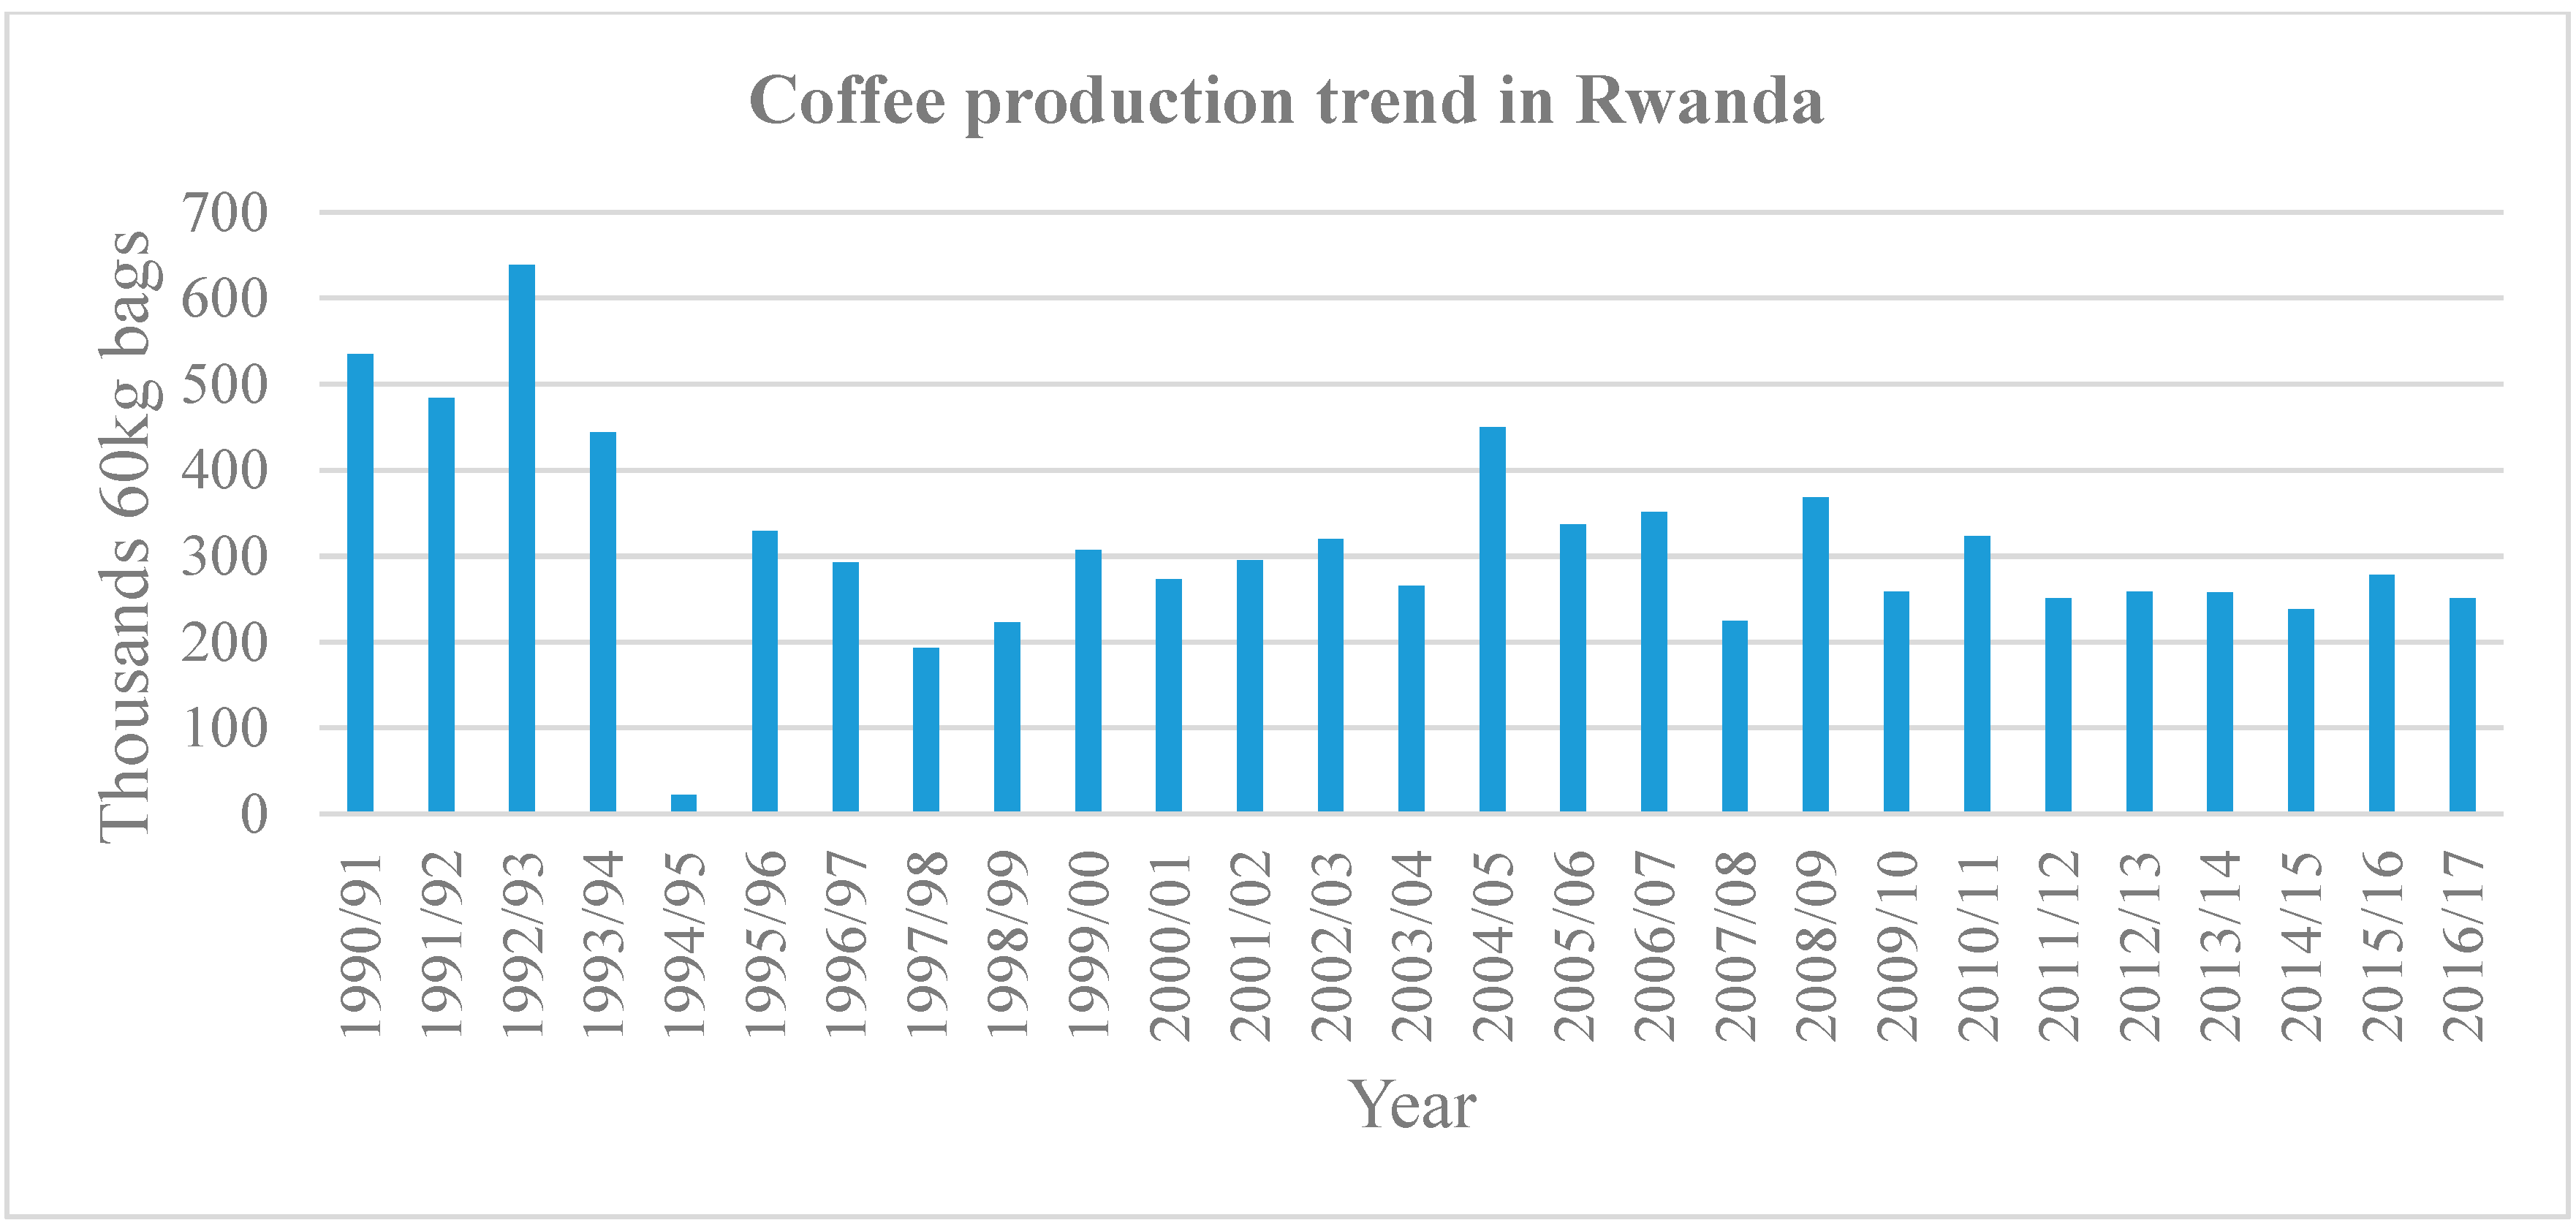
7]. As shown in
Figure 1, coffee production was devastated during the genocide and civil war, and then gradually revived, but was stopped in 2004/2005. The current level of productivity was never recovered fully after the tragic events in 1994 [
8]. The low level of coffee yield is the result of various environmental, institutional, and farm management challenges. Pests and diseases such as coffee berry disease and coffee leaf rust are the primary limitations for crop productivity [
9]. Moreover, the inability of farmers to adopt good agronomic practices such as weeding, mulching, pruning, use of improved varieties, fertilizers, and soil erosion control can also threaten coffee yields [
6,
10,
11].
Even though coffee productivity decreased and the total amount of coffee production in Rwanda decreased accordingly, the average price of coffee received by farmers was virtually stable (varying from U.S. cents 74.20 to U.S. cents 77 per lb of green coffee beans from 1990 to 2017, respectively [
8]) as a result of green coffee beans supply by other competitive production countries. Thus, currently, lower productivity than that in the early 1990s directly caused the low income in Rwandan coffee farms.
To address this challenge of low coffee productivity in Rwanda, government programs and development partners emphasized dissemination and adoption of agricultural technologies [
12]. However, the increase in agricultural productivity is not only determined by technological adoption, but also improvement in farmers’ technical efficiency (TE) [
13,
14,
15]. According to Coelli et al. [
16], TE denotes the producers’ capability to achieve the maximum output using the existing factors of production. Hence, in a resource-poor country like Rwanda, where the rate of technological adoption is relatively low, TE improvements in agriculture seem to be more advantageous.
However, there has been no empirical work conducted to analyze the TE in the production of coffee in Rwanda. Though empirical research in this area is lacking, information on producers’ TE helps quantify and compare farmer performance. This information could also contribute to efficient decision-making at the farmer level and assist policymakers in the formulation of pertinent strategies geared to improve productivity [
14]. Consequently, the present study attempts to analyze TE among coffee producers using the Northern Province of Rwanda as its case.
2. Materials and Methods
Extant studies on the estimation of TE have mainly used two approaches, namely, the parametric approach, such as the stochastic frontier analysis (SFA), and the non-parametric approach, such as data envelopment analysis (DEA). Both approaches provide results that are slightly different depending on the type of data [
13,
16,
17,
18]. However, Coelli et al. [
16] asserted that SFA is likely to be the most appropriate model for TE measurement in studies related to the agriculture sector, especially in developing countries. They base their evidence on the fact that it can handle the effect of statistical noise. Moreover, it also allows hypothesis testing and a single-stage approach for the simultaneous estimation of the production frontier and inefficiency model. Consequently, this study also uses the SFA model to estimate TE and evaluate the factors that affect it in coffee farming in the Northern Province of Rwanda.
The stochastic frontier production function was developed by Aigner et al. [
19] and Meeusen and van Den Broeck [
20]. The model was further extended by the authors of [
13,
21]; it is defined as
Here,
is the scalar of output for the
farmer, and
is a suitable production function, such as Cobb–Douglas, transcendental logarithmic, and so on.
is a vector of input variables used by producer
, and
is a vector of unknown parameters to be estimated.
is a symmetrically distributed random error component that represents the stochastic effects beyond the producer’s control (for example, weather, natural disaster, and others) and measurement errors. This random error component is assumed to be identically and independently distributed, with mean as 0 and constant variance as
. Lastly,
is the non-negative stochastic term
that represents technical inefficiency of the
farmer; it ranges between 0 and 1. The inefficiency term
follows the half-normal distribution; it is distributed as
[
16].
TE of an individual farm producer (Equation (2)) is defined as the ratio of the observed output
to the corresponding frontier output
[
16]. The model is expressed as follows [
21,
22,
23]:
As the value of the observed output is less than that of the frontier output, TE takes values between 0 and 1. A TE score closer to 1 implies that a coffee producer is producing nearer to the maximum output feasible level. Jondrow et al. [
24] suggested that the level of TE can be predicted using the conditional expectation of
, given the disturbance term
, which is defined in Equation (4) as follows [
25,
26]:
where
,
and
and
denote the normal density function and the cumulative distribution function, respectively. The maximum likelihood estimation (MLE) of the production function specified in Equation (1) yields estimators for the variance parameters
and
.
Battese and Coelli [
13] extended this technique by suggesting a model in which certain independent variables explain the variation of technical inefficiency (
). These authors propose that the normal distribution with mean as
and variance as
is truncated (at 0) to obtain the technical inefficiency (
).
where
represents a vector of independent variables, and
denotes a vector of unknown coefficients to be estimated.
is a random error term defined by a normal distribution with a mean of zero and unknown variance,
[
21,
26,
27].
The application of SFA requires a specification of the appropriate functional form, where Cobb–Douglas (CD) and transcendental logarithmic (TL) functional forms are commonly known in the literature. For this study, the likelihood ratio test indicates that CD production function is the most appropriate functional form that effectively fits our data than the TL. The model is then specified as follows [
21,
25,
27]:
where
denotes the coffee output of the
farmer, and
is the
factor of production. The five inputs (i.e.,
) considered in our model are land, labor, organic fertilizer, chemical fertilizer, and pesticides. As specified earlier, SFA also permits the estimation of the model for technical inefficiency effects. On the basis of the current state of Rwandan coffee farming and the relevant literature, eight variables (i.e.,
) are considered in our technical inefficiency model—education, household size, extension services, access to credit, land consolidation, soil erosion control, coffee tree variety, and cropping system.
3. Study Area and Data
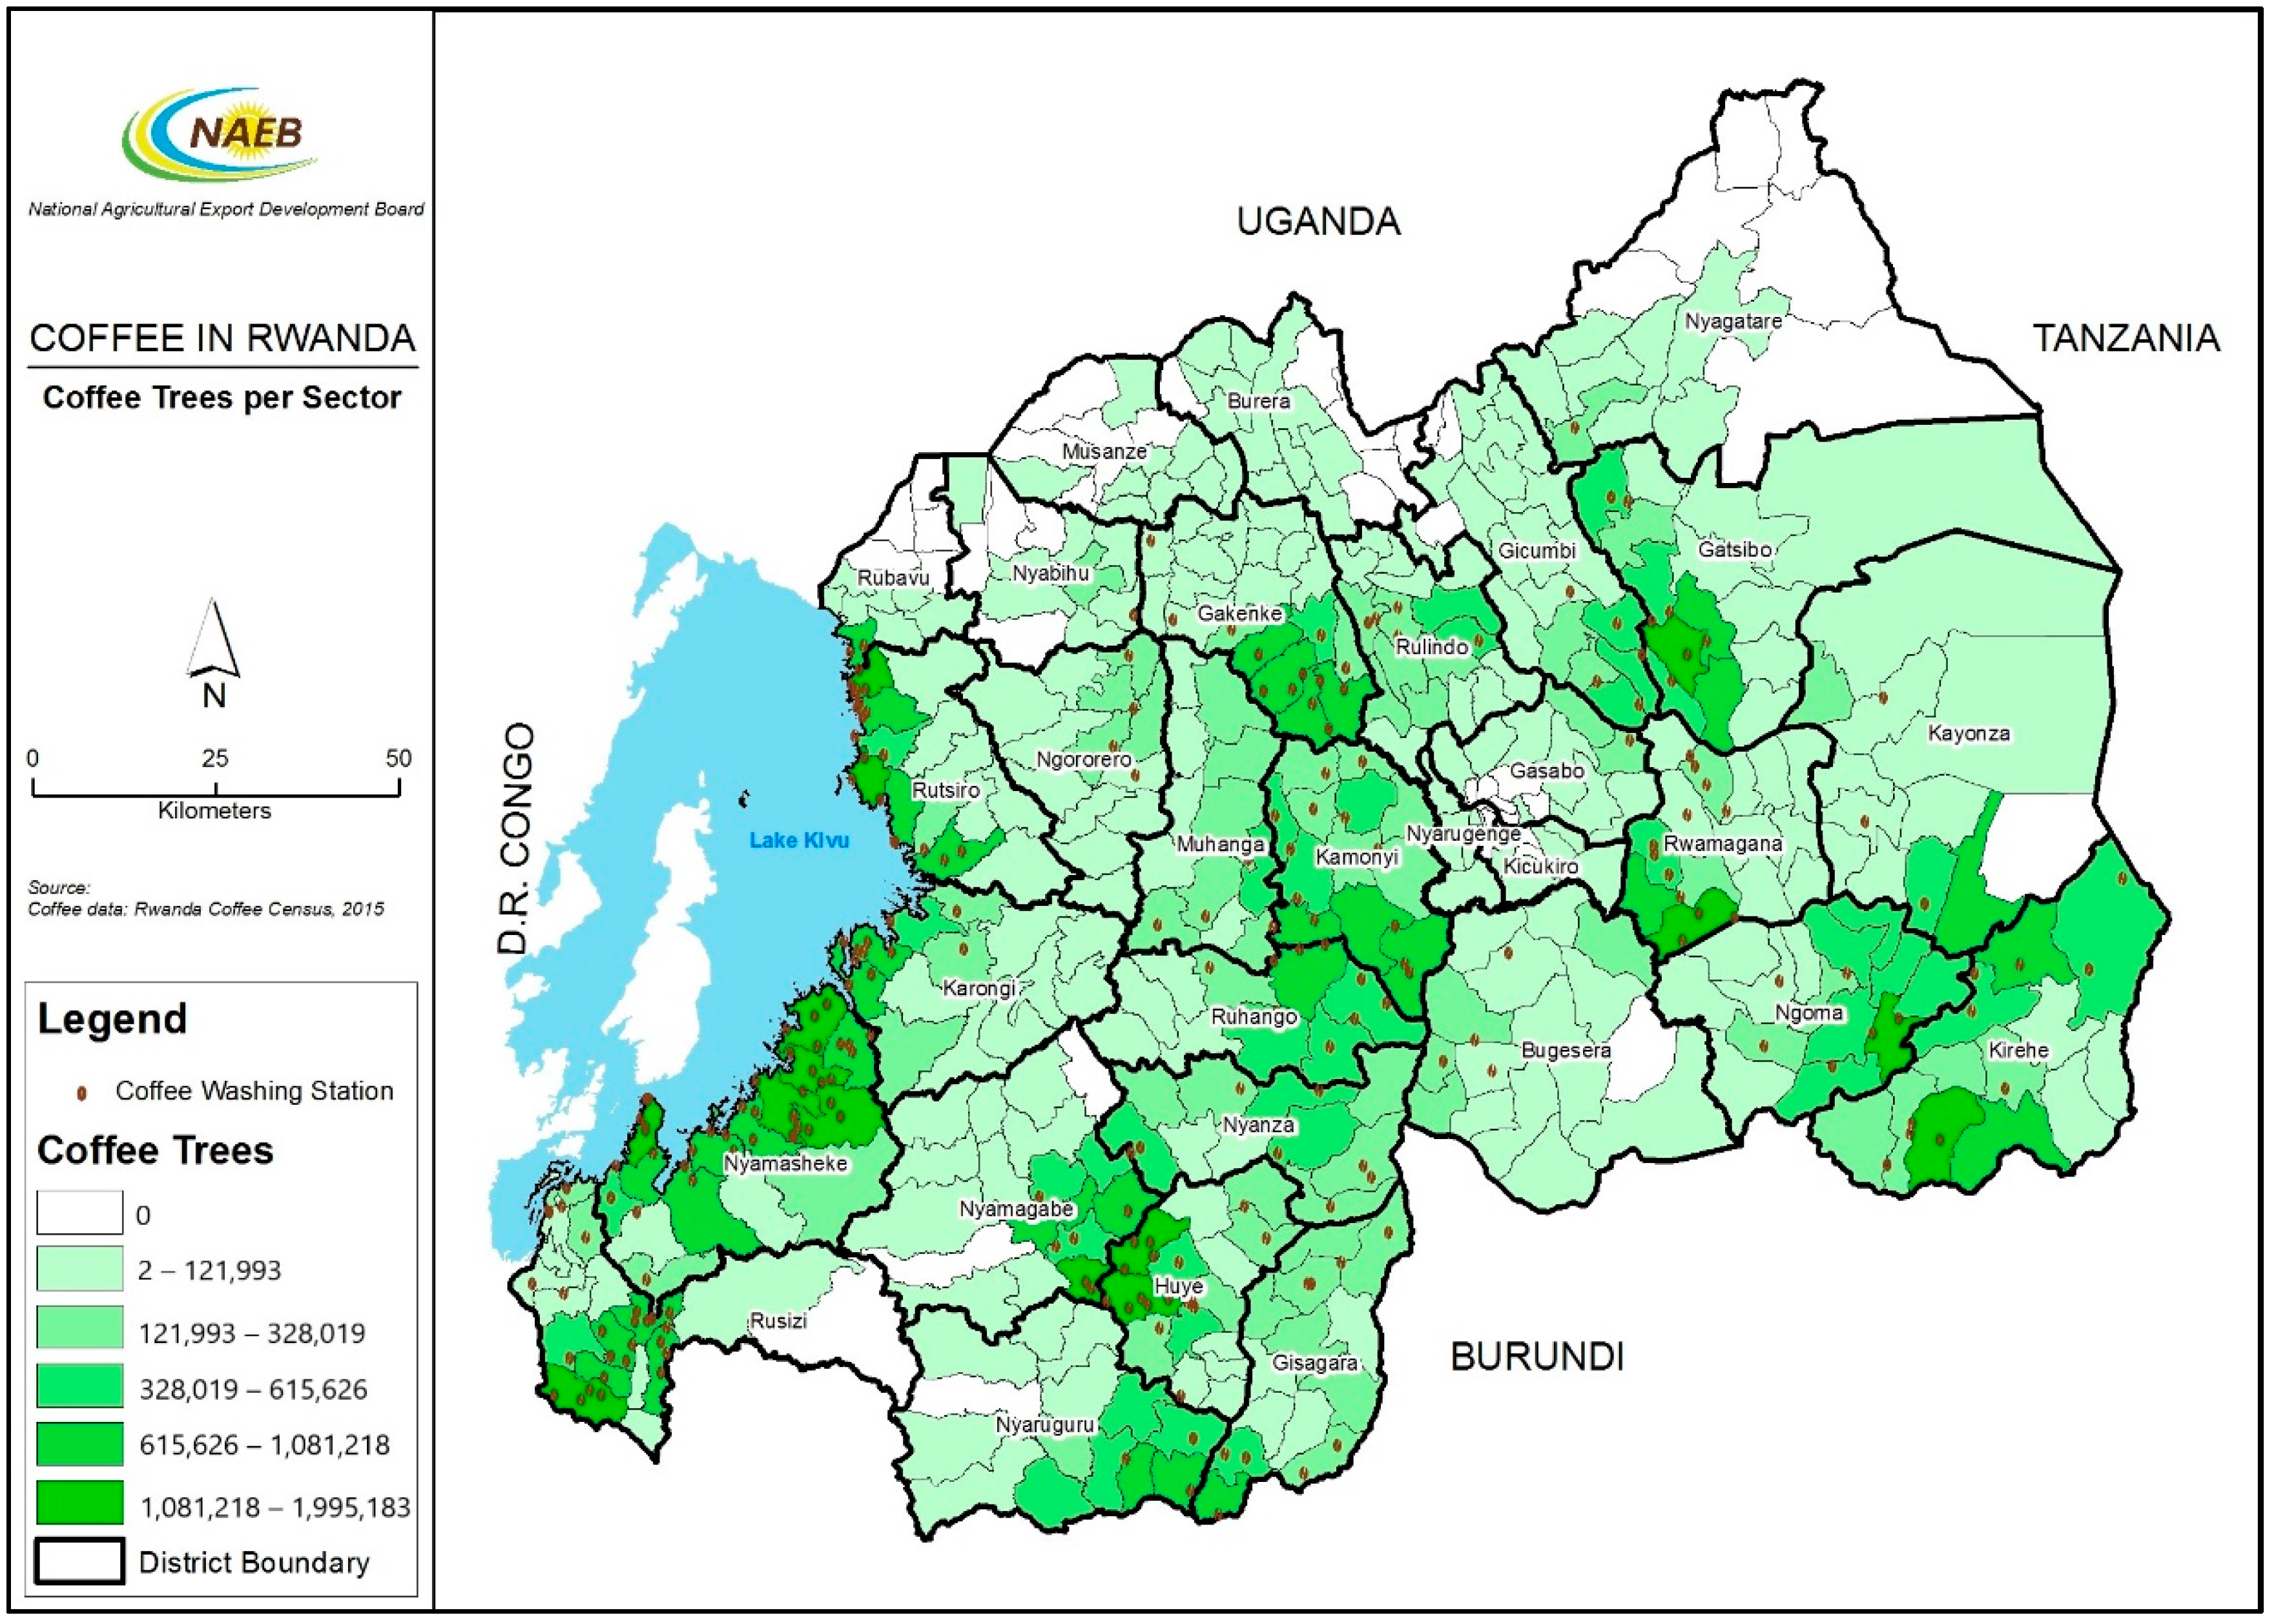
This study used cross-sectional data collected through a household survey conducted in Gakenke district of the Northern Province in Rwanda.
Figure 2 show the sites of the study. Our sample comprises 320 coffee farmers from areas covered by the survey during the 2016–2017 season of agriculture. Prior to the formal survey, research assistants were trained, and the questionnaire was pre-tested. After the pre-test, a few questions were amended in order to obtain accurate results. A multistage sampling method was applied to obtain a homogeneous sample of coffee farmers. In the first stage, purposive sampling was used to select the Northern Province for an in-depth study. This province was considered based on the concentration of coffee farms and its natural soil endowment. In the second stage, the district of Gakenke was purposively selected within other districts of the Northern Province owing to its comparatively large number of coffee trees and growers. The third stage involved a purposive selection of four administrative sectors that have a large number of coffee trees and producers. The sectors are Coko, Muhondo, Ruli, and Minazi. In the fourth stage, a simple random sampling technique was used to select farmers to be interviewed.
Generally, the coffee crop is grown in a tropical or subtropical climate. In the case of Rwanda, coffee is mainly grown by smallholder farmers, with farming systems characterized by land fragmentation and many small plots scattered on hillsides [
4]. Coffee plants in Rwanda are often intercropped with bananas and eucalyptus trees that provide shade to coffee [
4]. To improve soil fertility and crop yields, both organic and chemical fertilizers are used in Rwandan coffee farming. Organic fertilizers are usually prepared by mixing grasses, crop residues, and/or animal manure in compost. For chemical fertilizers, chemical fertilizer (NPK) (20-10-10) is applied at 400 g per tree per year, or NPK (17-17-17) at 120 g per tree per year, plus urea (46% of N) at 75 g per tree per year [
4]. Coffee is susceptible to pests and disease; specifically in study area, coffee berry disease transmitted by a tiny insect called
Colletotricum Coffeanum was reported by farmers to be the major disease damaging coffee trees. The commonly used pesticide to control the disease is copper oxychloride; for its use, 140 g of the product is diluted in 20 L of water, mixed, and applied to approximately 25 trees [
28]. The quantity of fertilizers and pesticides appears to be enormous compared with other input factors, as conventional coffee farming is known to produce the most heavily chemically treated foods in the world, which may be harmful to environments and human health, which demands organic coffee.
Table 1 presents the summary statistics of the variables used in the analysis of this study. On average, a household produced approximately 2669 kg of coffee per year. Farmers in the study area devoted 0.3 hectares, on average, to their coffee plantations, with 315 man-days, on average, of total labor employed in various farming activities. Organic fertilizer is also considered an input; it is highly recommended by environmental activists for sustainable improvement of soil fertility. Thus, the average amount of organic fertilizer (manure and compost) utilized by each coffee producer was 8425 kg, along with 118 kg of chemical fertilizer and 184 L of pesticide per household on average.
The survey also collected information on the determinants of technical inefficiency.
Table 1 shows that the average education level of selected households was found to be quite low, that is, limited to less than five years of formal education. The findings further revealed the average household size to be approximately six members. Besides, in terms of technical assistance, the frequency of contact of an extension officer with the farmer was 28 times per year on average in the 2017 agricultural season. The rate of access to credit in the sample study is still low, such that only 42 percent of farmers received credit to finance their agricultural activities from 2015 to 2017.
In 2007, the government of Rwanda launched the practice of land consolidation. However, in the Northern Province, only 39 percent of the sampled coffee farmers had embraced this practice. Furthermore, 92.5 percent of coffee farmers in the study area had undertaken structural measures for soil erosion control, such as creation of bench terraces and vegetative measures. Regarding the cropping system, 63 percent of coffee farmers in the Northern Province had adopted the mono-cropping system, while about 37 percent intercrop coffee plants with bananas and other fruit trees. Finally, in our sample, 82 percent of the farmers grew the BM139 variety of Arabica coffee, while the remaining 18 percent grew the Jackson 2/1257 variety of Arabica coffee.
4. Results and Discussion
The primary objective of this study is to estimate TE and analyze the factors that influence it among small-scale coffee farmers in the Northern Province of Rwanda. Before moving to the discussion of our econometric results, we carried out tests for our hypotheses (see
Table 2).
First, we tested for the existence of inefficiency where the null hypothesis asserts that the technical inefficiency effects are 0. However, this null hypothesis was rejected at the 1 percent level of significance, which corroborates the presence of technical inefficiency in coffee production. Being aware of the existence of technical inefficiency, the second test attempted to examine whether at least one variable that could explain the variation in technical inefficiency exists. For this purpose, we set the second null hypothesis, asserting that, among all variables included in the technical inefficiency model, none can significantly explain the variation in technical inefficiency. This null hypothesis was also rejected, which confirms that at least one variable has a significant effect on the variation of technical inefficiency among coffee farmers.
The maximum-likelihood estimates of the parameters for both the production frontier and technical inefficiency models, specified by Equations (5) and (6), are presented in
Table 3. The model diagnostics show that the estimates of
and
are significantly different from zero at a 1 percent level of significance. Improved Akaike information criterion (AIC) and Bayesian information criterion (BIC) values show that the SFA model has a better goodness of fit than the simple Ordinary Least Squares (OLS) regression. The estimated signs of input parameters are all positive as expected; they are all statistically significant at the 1 percent level. As our stochastic frontier production model uses the Cobb–Douglas functional form, the estimated coefficient values denote the production elasticities. The partial production elasticity measures the responsiveness of coffee output to the variation in a particular input, ceteris paribus [
16]. The sum of all partial production elasticities is called scale elasticity, and it indicates the returns to scale.
The results in
Table 3 show that all inputs used in the production function are inelastic, implying that a 1 percent increase in every input will lead to a less than 1 percent increase in coffee output. Of all five input variables considered in our model, chemical fertilizer (NPK) appeared to be the most important factor of production that has the highest effect on coffee output with production elasticity equal to 0.314. This implies that a 1 percent increase in the quantity of chemical fertilizer (NPK) increases the level of coffee output by about 0.314 percent, ceteris paribus. This finding is consistent with our expectations, and concurs with other extisting studies that found a significant positive effect of fertilizer on the crop output, such as Fatima and Azeem [
29] and Iráizoz et al. [
30]. The following highest elasticity was for organic fertilizer (manure and compost), with production elasticity equal to 0.275. This implies that organic fertilizer plays a significant positive impact on raising the coffee production level, as a 1 percent increase in the quantity of organic fertilizer leads to an estimated 0.275 percent increase in coffee output, ceteris paribus. This result is consistent with Chiona et al. [
22], Shively [
31], and Sorsie et al. [
32].
In addition, labor input is also sensitive toward coffee production, as a 1 percent increase in labor will boost the production of coffee by 0.182 percent, ceteris paribus. This result conforms to prior expectation of the positive effect of labor use on coffee output; it is also consistent with studies by Iráizoz et al. [
30], Theriault and Serra [
26], Binam et al. [
33], and Bäckman et al. [
34]. Likewise, land is an alternative input variable that can improve coffee production. We found that land size was associated with an elasticity coefficient of 0.162, implying that a 1 percent increase in the area under coffee plantation will lead to a 0.162 percent increase in coffee production. This finding conforms to prior expectations, and concurs with Khan et al. [
14], Fatima and Azeem [
29], Theriault and Serra [
26], and Balde et al. [
35]. Finally, the elasticity coefficient associated with pesticide input was found to be 0.120. This elasticity value indicates that pesticide application is sensitive toward better production of coffee, as a 1 percent increase in the quantity of pesticide results in a 0.120 percent increase in coffee production while holding other inputs constant. This result is consistent with the findings of Khan et al. [
14]. The sum of all partial production elasticities (i.e., scale elasticity) equaled 1.05, indicating the presence of an increasing returns to scale (IRS) in coffee production. IRS implies that a proportional increase in all factors of production results in a more than proportional increase in coffee output.
The results reported in
Table 4 indicate the summary of statistics for the TE scores of coffee farmers in the study area. We found that about 51 percent of coffee farmers in the sample have a TE ranging from 90 to 100 percent. This range of TE scores of coffee farmers is similar to the findings of Mukete et al. [
36] and Binam et al. [
37]. The average level of TE was found to be 82 percent, even though about half of the farms achieved more than 90 percent, implying that there is a possibility to boost coffee production by 18 percent, given the proportion of farm inputs and the current technology used. Alternatively, this result suggests that, on average, 18 percent of the expected coffee production is lost owing to technical inefficiency of farmers.
The lower section of
Table 3 presents the results of the estimates for the determinants of technical inefficiency. Owing to the inverse relationship between technical inefficiency and TE (see Equation (3)), parameter estimates are interpreted in terms of their impact on TE. This implies that a negative effect of a particular variable on technical inefficiency indicates a positive effect on TE. In addition, the negative sign of the coefficient of inefficiency variable implies that the variable has a positive effect on the producer’s TE, whereas a positive sign implies a negative effect on TE [
16].
The results show that education level, extension services, access to credit, land consolidation, improved variety of coffee trees, and the cropping system would significantly improve farmers’ TE. The farmer’s level of education has a negative and statistically significant coefficient, indicating that TE levels increase in proportion to the level of a farmer’s education. This finding is in conformity with the results reported by Khan et al. [
14], Fatima and Azeem [
29], Binam et al. [
37], and Hong et al. [
38], according to whom, the education level significantly and positively affects farmers’ TE in Bangladesh, Pakistan, Cote d’Ivoire, and China, respectively.
The negative and statistically significant coefficient of the frequency of extension services rendered to coffee farmers implies that farmers who receive more advisory services are likely to have higher levels of TE. This result is consistent with Fatima and Azeem [
29], Chiona et al. [
22], Binam et al. [
33], and Bäckman et al. [
34].
Another factor that influenced TE is access to credit. A coefficient of the access to credit variable was found to be negative and statistically significant at the 5 percent level of significance. Thus, access to credit facilities also significantly improves farmer’s level of TE, as it may enhance their ability to finance the purchase of seasonal farm inputs, and invest in the acquisition of more agricultural land and expansion of coffee plantations. Other studies that obtained similar findings include Chiona et al. [
22], Binam et al. [
33], Binam et al. [
37], and Bozoǧlu and Ceyhan [
39].
Regarding the land consolidation variable, the results in
Table 3 show that managing coffee plantations through land use consolidation significantly improves the level of TE in coffee production. This finding is in conformity with Chen et al. [
40], Wu et al. [
41], and Manjunatha et al. [
42], who acknowledged the significance of the land consolidation process as a key policy instrument to enhance farmers’ efficiency in China and India. One plausible explanation for this finding is that the consolidation of spatially dispersed plots into contiguous parcels assists the government in implementing policies with respect to fertilizer subsidies, credit facilities, marketing access, and rural infrastructure development. Thus, farmers can take advantage of such schemes to improve their efficiency and productivity.
The use of an improved variety of coffee trees was also found to significantly improve the level of farmers’ TE. Specifically, in the study area, farmers who planted the BM139 variety of Arabica coffee were more technically efficient than their counterparts, who still had low yielding varieties of coffee, such as Jackson 2/1257. This finding supports Fatima and Azeem [
29], Chiona et al. [
22], and Sorsie et al. [
32], who acknowledged the importance of modern and upgraded crop varieties in improving productivity and efficiency in Pakistan, Zambia, and Ethiopia, respectively.
Finally, the cropping system is a variable that explains variations in technical inefficiency. It was included in the technical inefficiency model as a dummy variable to determine whether the adoption of a mono-cropping system can improve TE of coffee farmers. Consequently, the cropping system was found to be statistically significant with a negative sign. This implies that farmers who produce coffee under the mono-crop system tended to have higher levels of TE than those with intercropped coffee. This finding is in line with Binam et al. [
37], who supported the benefits of the mono-crop system in enhancing coffee farmers’ efficiency in Cote d’Ivoire.
5. Conclusions
Researchers worldwide have been drawn to the analysis of farmers’ level of TE and its determinants, which is a critical necessity for both farmers and policymakers. Farmers find it useful because an improvement in their managerial skills leads to efficient allocation of inputs in order to produce desired levels of output. Also, it helps policymakers formulate pertinent policies geared toward improving crop productivity.
This study applied the SFA model on a sample of 320 coffee farmers operating in the Northern Province of Rwanda in order to derive their TE scores, and then investigated the factors that influence TE of coffee farmers in the study area. The mean level of TE among coffee farmers in the study area was estimated at 82 percent. From a technical standpoint, this implies that there is a potential to increase coffee production by about 18 percent with the current levels of inputs and farm technologies available in the country through the reduction of technical inefficiency. The analysis of partial production elasticities and returns to scale revealed that all inputs used in the production function are inelastic, that is, a 1 percent increase in each input will lead to a less than 1 percent increase in coffee output. In addition, we found that coffee production was more responsive to chemical fertilizers, followed by organic fertilizer, labor, land, and pesticide. The returns to scale (RTS) coefficient was found to be 1.05, which implies that farmers in the Northern Province of Rwanda experience IRS in coffee production. In other words, this suggests that a proportional increase in all factors of production results in a more than proportional increase in coffee output. Our results further revealed that education, extension services, access to credit, land consolidation, improved variety of coffee trees, and cropping system significantly improved coffee producers’ TE.
On the basis of the results of the study, the following policy implications are proposed. The main focus should be put on promoting education in the rural areas and encouraging farmers to participate in training programs. In addition, extension services should be strengthened and should target all farmers in all locations. This will improve the farmers’ managerial skills, thus resulting in higher technical efficiency. The government should support small-scale farmers to get access to credit. The findings further suggest that research and development is needed to develop and release improved coffee varieties. In this regard, the task of extension agents would be to advise and encourage farmers to adopt high-yielding and disease-resistant coffee varieties like BM139. Finally, our results suggest that the practice of mono-cropping system and managing coffee plantations through land consolidation could also reduce the level of technical inefficiency among coffee farmers in the Northern Province of Rwanda. Currently, mechanization has not been adopted in coffee farming in Rwanda because of different challenges such as the hilly topography of the terrain, the fact that some coffee plants are grown under shade tree canopy, high cost of machinery, and so on. Although the mechanization of coffee farm operations is difficult to achieve, its introduction can be a viable option for effective maintenance of coffee plantations, and improve the efficiency and productivity of labor.
However, when it comes to improving the level of TE among coffee farmers across Rwanda, our findings may not be generalizable. Hence, future research must consider a larger sample of farmers that covers all Rwandan provinces.


