Abstract
The alley-cropping systems (ACSs), which integrate parallel tree strips at varying distances on an agricultural field can result, complementarity of resource use, in an increased land-use efficiency. Practitioners’ concerns have been directed towards the productivity of such systems given a reduced area covered by agricultural crops. The land equivalent ratio (LER) serves as a valuable productivity indicator of yield performance and land-use efficiency in ACSs, as it compares the yields achieved in monocultures to those from ACSs. Consequently, the objective of this combined experimental and simulation study was to assess the tree- and crop-yields and to derive the LER and gross energy yield for two temperate ACSs in Germany under different design scenarios, i.e., tree arrangements (lee- or wind-ward) and ratios of tree area to crop area. Both LER and gross energy yields resulted in a convex curve where the maximum values were achieved when either the tree or crop component was dominant (>75% of the land area) and minimum when these components shared similar proportions of land area. The implications of several design scenarios have been discussed in order to improve the decision-making, optimization, and adaptation of the design of ACSs with respect to site-specific characteristics.
1. Introduction
As a consequence of the industrialisation and specialization of the agricultural production, field sizes across Europe have expanded with negative implications for the environment, particularly for landscape diversity and biodiversity [,,]. The increased biomass demand for a bio-based economy will only heighten the pressure on arable lands, which will eventually compete with other land-uses in terms of food and feed production []. In this context, a need to redesign the agricultural landscapes towards a multifunctional land-use has been identified in order to promote ecosystem services and to ensure a sustainable and resilient agricultural production in the 21st century [,].
Agroforestry systems, which integrate trees into agriculturally-managed fields, are often regarded as a flexible multi-crop land-use strategy to provide ecological and economic benefits [,]. Agroforestry systems have been shown to preserve high levels of agricultural yields while delivering ecosystem services, hence increasing land-use efficiency [,], and concurrently providing effective climate change mitigation, such as reducing the atmospheric carbon dioxide [], and adaptation measures [,].
A variation of agroforestry is represented by the so-called alley-cropping systems for the production of woody biomass (ACSs) for energy purposes, in which several hedgerows of fast-growing trees are established in parallel strips at varying distances on an agricultural field []. The tree strips can be managed as short-rotation coppices and repeatedly harvested every 2–6 years, while the alleys between them are managed as conventional agricultural areas with annual crops [].
Practitioners have expressed concern about the productivity of such systems due to the reduced area covered by agricultural crops []. Through negative attributes reported by practitioners, the existence of trees has been perceived to decline the crop yield [], to impede farm machinery, and to attract diseases []. In order to improve the design of ACS, research has focused on identifying optima for the tree arrangement (scattered or lined, leeward or windward), the distance between trees, and the proportion of land covered by the tree strips [].
In this context, the land equivalent ratio (LER) can serve as a valuable productivity indicator of yield performance and land-use efficiency in ACSs. LER is defined as the ratio of the area needed under monocultures compared to the area under intercropping, at the same management level and over the same period, that is required to provide an equivalent yield [].
However, calculating the LER is a retrospective assessment and experiments with different ACS designs aiming at finding an optimum proportion of land covered by either trees or crops, while considering the specific site conditions, would be time-consuming and would demand a notable large amount of funding. Moreover, empirical data on these systems are scarce and therefore, an alternative method is crucial for achieving yield predictions under different implementation scenarios. Such a method is given by simulations capable of predicting the yield of both trees and crops in ACSs under different climatic, soil, and management conditions.
Consequently, the objective of this combined experimental and simulation study was to determine the potential energy wood and grain (winter wheat and winter barley) or seed (winter rapeseed) production, as well as to derive the LER, for two temperate ACSs in northern and north-eastern Germany, under different design scenarios. The emphasis of the design was set on tree arrangement (lee- or wind-ward) and the ratio of tree area to crop area. By evaluating these empirical- and simulation-based responses, we have pursued optima in the design of ACSs comprising of the most advantageous ratios of tree area to crop area with respect to tree arrangement, potential energy, wood and grain or seed production, as well as LER values and gross energy yield.
2. Materials and Methods
2.1. Experimental Sites
Data used for this study was gathered in 2016 and 2017 at two short-rotation alley-cropping systems (ACSs) established near Wendhausen (Lower Saxony) and Neu Sacro (Brandenburg), Germany. The ACS at Wendhausen consists of nine tree strips having a width of 10 m (without the so-called buffer zone, a distance of about 1.5 m allocated between the tree strip and crop alleys for the agricultural machinery) and a length of 225 m, with agricultural alleys of 48 m and 96 m width between the tree strips []. The ACS at Neu Sacro consists of seven tree strips having a width of 10 m (without the buffer zone of 1.5 m) and a length of 660 m, with agricultural alleys of 24 m, 48 m, and 96 m width between the tree strips []. The information for both sites is summarised in Table 1.

Table 1.
Description of the experimental sites at Wendhausen and Neu Sacro.
Monthly values for mean air temperature and total rainfall during the two years of investigation were used for creating Walter–Lieth climate diagrams (Figure A1) in order to gain insight into the compound effects that influence the growth of trees and crops.
2.2. Plot Design and Yield Assessment
Four alley-cropping-plots (APs) and four monoculture-plots (MPs) representing an ACS and monoculture respectively, were established at Wendhausen and Neu Sacro in the winter season of 2015/2016. At both sites, the APs were 24 m wide, placed on half of the 48 m agricultural alleys, and included half of the 10 m tree strips, hence accounting for a size of 29 m × 30 m. Furthermore, as the tree strips were perpendicular to the main wind direction at both sites, and in order to account for the yield variability in the tree-crop competition zone, two APs were arranged leeward and two APs windward.
Annual measurements of breast height diameter (i.e., at a height of 1.3 m above the ground) were taken from the short rotation coppices in the winter season of 2016/2017 and 2017/2018. In addition, 25 shoots were chosen, cut manually 10 cm above the ground, chipped, and weighted. An allometric equation of the form M = a D b was used in order to derive the dry matter of all measured diameters, where M is the tree biomass (kg), D is the shoot basal diameter (cm), and a and b are the intercept and slope of a least-square linear regression of ln-transformed data. The above-ground tree woody biomass production per hectare was estimated using the average number of shoots per hectare and the average dry weight of the shoots according to the mean stool method [].
Regarding the crop grain yield, winter rapeseed (Brassica napus L.) was harvested in the summer of 2016 and winter wheat (Triticum aestivum L.) in summer 2017 at Wendhausen, whereas at Neu Sacro, winter wheat was harvested in summer 2016 and winter barley (Hordeum vulgare L.) was harvested in summer 2017. Crop yields in the APs of 29 m × 30 m were harvested with a plot combine harvester with a cutting width of 2 m × 10 m, centred at 1 m, 4 m, 7 m, and 24 m distance from the tree strips (Figure 1).
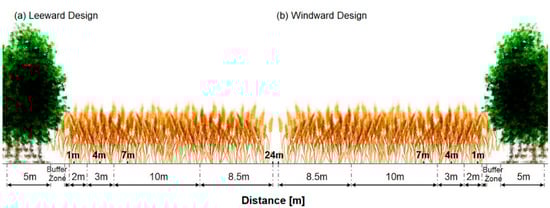
Figure 1.
To-scale design of the leeward (a) and windward (b) alley-cropping-plots, together with the harvest points set at 1 m, 4 m, 7 m, and 24 m away from the tree strips. The supplemented distances (i.e., 2 m, 3 m, 10 m, and 8.5 m) sum up half of the neighbouring distances of the harvest points and represent the weights used for calculating the overall crop yield. The buffer zone represents a distance of 1.5 m between the tree strip and crop alleys.
Additional information on the location, design, and harvest points of the APs is presented in Figure A2a for Wendhausen and in Figure A2b for Neu Sacro.
For the overall crop yield in the APs, weighted averages were used (Equation (1)), where the weights were determined assuming half of the distance between the harvest points. Thus, the weight for the harvest point located 7 m away from the tree strip, for example, considered half of the distance between the points set at 4 m and 7 m (i.e., 1.5 m), and half of the distance between points 7 m and 24 m (i.e., 8.5 m), leading to an overall distance of 10 m.
The crop yields in the MPs with a size of 10 m × 10 m were harvested with the same plot combine harvester with a cutting width of 2 m × 10 m centred in the middle of the plot. The measurements in the tree MPs underwent some changes due to lacking an identical planting scheme.
At Wendhausen, the available control field for trees contrasted with the APs by the age of the rotation cycle (i.e., 3-years instead of 6-years). Although this meant that the tree harvest at Wendhausen occurred in the winter season of 2013/2014 [] for the control field and in the winter season of 2017/2018 for the APs, we opted for this control field as the representative for a tree MP in order to analyse poplar trees belonging to the same rotation and planted at the same density as the trees in APs. Moreover, the weather data observed in the two growing periods (i.e., from 2011 to 2013 for the MPs and from 2014 to 2016 for the APs) displayed a relatively low interannual variation of +0.8 °C in mean annual air temperature and of −19 mm in average precipitation sum. At Neu Sacro, we assumed that the trees belonging to a double-row plot of the ACS would be comparable to those in an MP and therefore, measurements were collected from poplar trees grown at the same time as the trees from the APs, although the tree density varied somewhat, albeit insignificantly, due to a different mortality rate of the two areas.
In order to avoid the border edge effect [] reported at Wendhausen by Lamerre et al. [] and at Neu Sacro by Veste et al. [], we employed the dry matter woody biomass values obtained from the middle rows of the tree MPs to compare with the rows of their counterpart APs. Accordingly, the dry matter woody biomass value at Wendhausen was set at 9.4 Mg DM ha−1 a−1 [] and 9.0 Mg DM ha−1 a−1 at Neu Sacro (own measurements).
For gaining insight into the significance of our measurements, the coefficients of variation were calculated for the measured dry matter woody biomass values, either between APs and MPs, in order to confirm the differences in production stemming from the chosen two systems, as well as within plots belonging to the same system (i.e., separately for APs and MPs) in order to check whether meaningful differences exist between lee- and wind-ward arranged plots. Additionally, t-tests were performed, where p values were compared to a significance level of 0.05 in order to determine whether significant differences existed between the lee- and wind-ward APs, as well as between APs and MPs. For this, the Analysis ToolPak from Excel (Microsoft) was employed.
Furthermore, the dry matter woody biomass values recorded over the investigated period of two years were converted to energy units in order to better compare the overall production from ACSs with monocultures. This was done by using the gross heat of combustion for each component, as proposed by Kaltschmitt et al. [], and namely 18.5 GJ Mg−1 for the poplar woody biomass, 17.0 GJ Mg−1 for the grains of winter wheat, 17.5 GJ Mg−1 for the grains of winter barley, and 26.5 GJ Mg−1 for the seeds of winter rapeseed.
2.3. Empirically-Determined Land Equivalent Ratio
The LER was determined for each system and scenario with respect to the area covered by both trees and crops in a land area and under the assumption that the yields of both trees and crops are of equal economic importance, after Mead and Wiley (Equation (2)) []:
where, (Mg DM ha−1 a−1) and (Mg DM ha−1 a−1) are respective dry matter yields of wood and grains (winter wheat and winter barley) or seeds (winter rapeseed) per cropped area in Aps, and (Mg DM ha−1 a−1) and (Mg DM ha−1 a−1) are dry matter yields of wood and grains or seeds per cropped area in MPs.
In order to express these yields per alley-cropping system and not per cropped area, a weighted ratio was used for both tree and crop components depending on their land area proportion (%). While LER ≤ 1 would mean that there is no productivity advantage of an ACS over a monoculture, a LER > 1 would suggest that the production in the ACS is higher than the one in a monoculture system [].
2.4. Calibration and Validation of the Yield-SAFE Model (Yield Estimator for Long-Term Design of Silvoarable AgroForestry in Europe)
For the site-specific yield production of trees and crops in ACSs under competitive conditions, we employed the Yield-SAFE model (Yield Estimator for Long-term Design of Silvoarable AgroForestry in Europe), a parameter-sparse, eco-physiological, and process-based simulation model developed for predicting resource capture, growth, and production in forestry, arable, and agroforestry systems []. The reasoning behind choosing the Yield-SAFE model stays in its capacity to render credible yield estimates of trees and crops in relation to different weather, soil, and management conditions from available, but scarce data []. In this version of the model, the potential tree and crop growth is simulated in terms of primarily air temperature (for the developmental and phenological processes), global solar radiation (for the derivation of photosynthesis), and water availability. Under this growth assumption, the nutrient availability is not considered to be a yield-limiting factor []. Improvements proposed by Palma et al. [] were integrated into the model, notably being the effect of trees on microclimate (temperature, wind speed, and evapotranspiration).
The assumptions and equations embodied in the Yield-SAFE model are extensively detailed by van der Werf et al. [], Keesman et al. [], and Burgess et al. [] regarding the states, rates and static relationships, and management of the tree growth, crop growth, and soil water dynamics. Moreover, a comprehensive description of the Yield-SAFE model, along with default parameter values for a substantial range of tree and crop species is provided by Burgess et al. [].
Heretofore, the Yield-SAFE model was calibrated and validated for poplar, walnut, cherry, holm oak, and stone pine trees, planted at low densities, alongside wheat, forage maize, grain maize, sunflower, and oilseed, leading to appraisals of both tree and crop yields and LER values in Atlantic and Mediterranean regions of Europe [,,,,].
In this paper, two sets of data were reserved, one for calibration of the Yield-SAFE model and one for validation of the model output. Initially, distinctions were made between the four APs, two arranged leeward and two windward. However, since the woody biomass measurements showed no significant differences between the two lee- and two wind-ward plots, the woody biomass was analysed considering four replicates. For the model calibrations, we retrieved information about the trees (planting density, management, yield, DOYplant, DOYharvest), crops (management, yield, DOYsow, DOYharvest), and soil physical characteristics (texture, structure, porosity, bulk density, organic matter) reported by Lamerre et al. [] and Swieter et al. [] for the site at Wendhausen and by Kanzler and Böhm [] at Neu Sacro. This information, together with model ecophysiological parameters based on bibliography and expert knowledge, as instructed in Graves et al. [], Keesman et al. [], Burgess et al. [], and Wösten et al. [], created the data set used for the calibration of the model. For example, the reported soil characteristics helped achieve the Mualem-van Genuchten parameters as instructed by Wösten et al. [], used for the calibration of the Yield-SAFE model. Altogether, the tree parameters are presented in Table A1, the crop parameters in Table A2, and the soil parameters in Table A3. The daily climate input was obtained through the German Weather Service, stations Braunschweig and Cottbus, for the sites at Wendhausen and Neu Sacro, respectively. The validation data set encompasses the measured woody biomass values, as averaged between the APs. Therefore, the model output was validated against measured values in order to test the ability of the Yield-SAFE model to generate potential energy wood and grain or seed production, as well as to derive the LER, under different ratios of tree area to crop area.
The performance of the Yield-SAFE model was evaluated visually, by comparing the simulated tree and crop yields with measured ones, as well as by determining the normalized root-mean-square error (NRMSE), the coefficient of determination (R2), the concordance correlation coefficient (CCC) [], which measured the agreement between the simulated and measured yields, and the bias function of the simulated yields (SB). Statistical analysis was performed using the R software (version 3.4.2, R Core Team 2017; R Foundation for Statistical Computing, Vienna, Austria) independently for determining the NRMSE, R2, and SB, and using the package “epiR” [] for calculating the CCC.
2.5. Yield-SAFE Simulations of Tree and Crop Yields and Land Equivalent Ratio
The experimental, calibration, and validation sections of this study considered APs with a ratio of tree area to crop area of 17:83, i.e., the trees were planted on 17% and the arable crop on 83% of the land area. Once validated, the Yield-SAFE model was used to simulate the potential dry matter woody biomass and crop yield for the considered ACSs, as well as to derive the LER, under ratios of tree area to crop area of 20:80, 25:75, 40:60, 50:50, 60:40, 75:25, and 80:20 (Figure A2c). Throughout these simulations, the planting density remained constant.
By evaluating these empirical- and simulation-based responses, optimum ratios of tree area to crop area in the design of the investigated ACSs were identified with respect to the potential energy woody and grain production, as well as LER values and gross energy yield. Conversely, designs not belonging to these ratio optima were considered ineffective in ACSs compared to other design options. Furthermore, key factors influencing the considered design of ACSs were discussed.
3. Results
3.1. Yield Assessment
The dry matter yields of wood and grains (winter wheat and winter barley) or seeds (winter rapeseed) per cropped area are presented in Table 2, together with the inferred gross energy yield, coefficient of variation, as well as the results of t-tests where p-values were compared to a significance level of 0.05.
Table 2.
Dry matter yields of wood and grains (winter wheat and winter barley) or seeds (winter rapeseed) per cropped area obtained from alley-cropping- and monoculture-plots at Wendhausen and Neu Sacro for the investigated years and their inferred gross energy yield. APs 1 and 2 were arranged leeward and APs 3 and 4 windward. The coefficient of variation (CV) and level of significance are included.
At Wendhausen, the APs were generally less productive than their counterpart MPs, especially in 2016. This, however, was only true for the dry matter yield obtained for the crops and not for the trees. At Neu Sacro, the APs were more productive than the MPs in both years and for all investigated species.
In 2016, the dry matter woody biomass increment resulted from the APs at Wendhausen was significantly lower (−25%) than that at Neu Sacro, whereas in 2017, similar values were obtained between the two sites. However, the dry matter woody biomass resulting from the MPs at Wendhausen was slightly higher (+5%) than that at Neu Sacro.
Worth mentioning would also be fact that the dry matter yields of winter wheat grains at the two locations produced similar values from the APs, while the yields from MPs were considerably higher at Wendhausen than at Neu Sacro.
Regarding the energy production over the investigated two years at Wendhausen, 221 GJ ha−1 would be achieved from crop MPs or 348 GJ ha−1 would be achieved from tree MPs, but an overall gross energy yield of 619 GJ ha−1 from the APs. Likewise, the crop- and tree-MPs established at Neu Sacro would deliver a gross energy yield of 151 GJ ha−1 or 333 GJ ha−1 respectively, over the two years, whereas the APs would provide an overall gross energy yield of 689 GJ ha−1.
The coefficients of variation within the APs at both locations were rather low, except for the one at Neu Sacro in 2017 of 13%. The level of variation within the MPs was also minor at Wendhausen, contrasting to the one at Neu Sacro with 20% and 16% in 2016 and 2017, respectively. The yield variation between APs and MPs was relatively high for most of the investigated cases except for the dry matter woody biomass at Wendhausen in 2016.
Regarding the lee- and wind-ward arranged APs, none of our investigations showed positive statistical significance, implying no effect of tree arrangement in relation to wind on the dry matter yield. Significant differences were found between the yields from APs and MPs, except for the dry matter yield of winter wheat grains at Neu Sacro (Table 2).
The measurements at Wendhausen and Neu Sacro were converted to relative yields, referring to the yield of each AP against its counterpart MP (Figure 2).
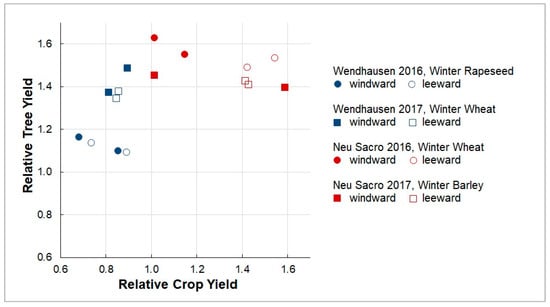
Figure 2.
Relative tree and crop yields obtained from lee- and wind-ward arranged poplar strips with cropped alleys at Wendhausen and Neu Sacro, over the investigated years.
The relative yield of the tree component was above 1.0 at both locations and in both years, suggesting that trees in APs were more productive than in MPs. Similar results were found for the relative yield of the crop component at Neu Sacro in both years, contrary to the one obtained at Wendhausen, which remained below 1.0, suggesting that both winter wheat and winter rapeseed were more productive in the MPs than in the APs.
In 2016, the relative crop yields from the leeward plots observed at Neu Sacro rendered values of 1.4 and 1.5, whereas the windward plots had values of 1.0 and 1.2. Otherwise, no concrete pattern was noticed for the lee- and wind-ward plots at the two locations in the investigated years.
3.2. Empirically-Determined Land Equivalent Ratio
The annual LER of each AP against its counterpart MP is presented in Figure 3, as determined for each experimental site and for both investigated years.
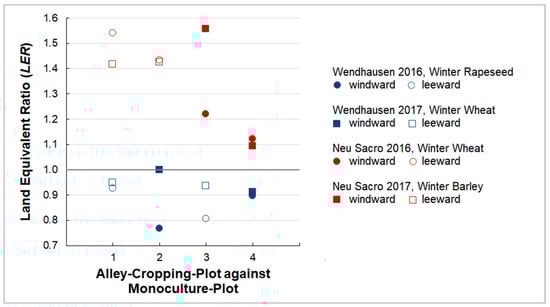
Figure 3.
Annual land equivalent ratio (LER) obtained in 2016 and 2017 at Wendhausen and Neu Sacro. The grey line serves as a threshold above which the alley-cropping-plots have a greater productivity than the monoculture-plots.
The APs at Wendhausen rendered LER values from 0.8 (plots 2 and 3, in 2016) to 1.0 (plot 2, in 2017), whereas at Neu Sacro, LER values from 1.1 (plot 4, in both years) to 1.6 (plot 3, in 2017) were obtained.
3.3. Validation of the Yield-SAFE Model
Throughout the investigated timeframe, the Yield-SAFE model was able to simulate the tree and crop dry matter yields from the ACSs at Wendhausen (Figure 4a) and Neu Sacro (Figure 4b) with satisfying accuracy.
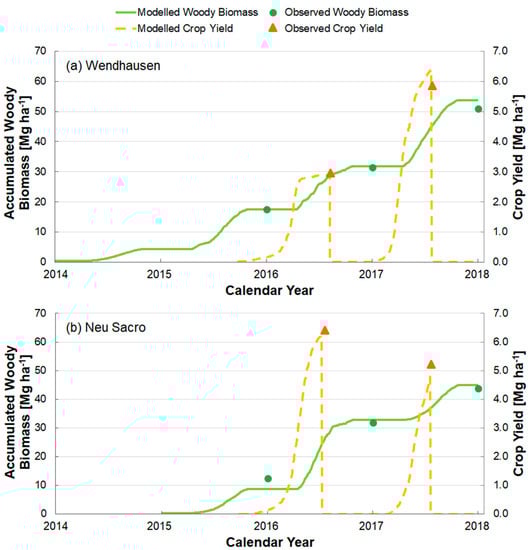
Figure 4.
Above-ground tree woody biomass and crop yields accumulated at Wendhausen (a) and Neu Sacro (b) over the investigated period, as simulated with the Yield-SAFE model (lines) and as observed for the trees (circles) and crops (triangles; winter rapeseed and winter wheat in 2016 and 2017 respectively at Wendhausen; winter wheat and winter barley in 2016 and 2017, respectively at Neu Sacro).
At Wendhausen, the deviations of the simulated tree woody biomass accounted for 0.00%, 0.01%, and 0.05% from the tree woody biomass observed at the beginning of 2016, 2017, and 2018, respectively. Between the simulated and the observed crop yields, deviations of −0.02 % and 0.08 % were rendered for 2016 and 2017, respectively.
At Neu Sacro, the deviations of the simulated tree woody biomass accounted for −46%, 1%, and 1% from the tree woody biomass observed at the beginning of 2016, 2017, and 2018, respectively. Between the simulated and the observed crop yields, deviations of −3% and −8% were rendered for 2016 and 2017, respectively.
The relative errors of the simulated fits were generally low, with normalized root-mean-square error (NRMSE) values of 5% and 8% for the Yield-SAFE tree and crop validations respectively, at Wendhausen, and NRMSE values of 8% and 6% for the Yield-SAFE tree and crop validations respectively, at Neu Sacro. For both locations, the fit was highly significant (i.e., the R2 values were more than 0.99 for both tree and crop validations). The concordance correlation coefficient (CCC) was 0.99 and 0.97 for the Yield-SAFE tree and crop validations respectively, at Wendhausen, and 0.99 and 0.89 for the Yield-SAFE tree and crop validations respectively, at Neu Sacro.
3.4. Yield-SAFE Simulations of Tree and Crop Yields and Land Equivalent Ratio
Once satisfyingly validated for APs with a ratio of tree area to crop area of 17:83, the Yield-SAFE model was used to simulate the dry matter yields of wood and grains or seeds per cropped area emerging from APs with ratios of tree area to crop area of 20:80, 25:75, 40:60, 50:50, 60:40, 75:25, and 80:20 at Wendhausen (Figure 5) and Neu Sacro (Figure 6).
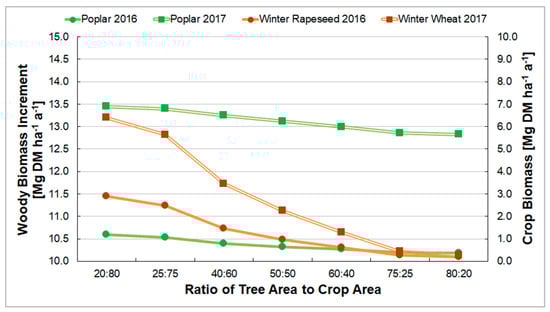
Figure 5.
Above-ground tree woody biomass and crop yields, as simulated by the Yield-SAFE model at Wendhausen, under different ratios of tree area to crop area.
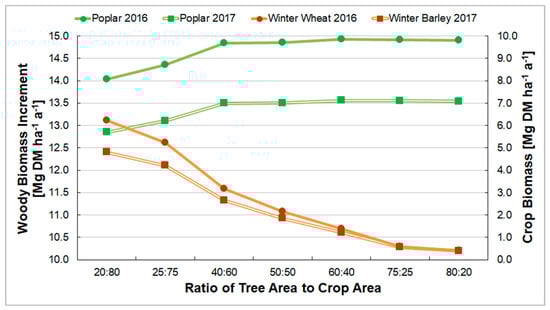
Figure 6.
Above-ground tree woody biomass and crop yields, as simulated by the Yield-SAFE model at Neu Sacro, under different ratios of tree area to crop area.
A clear downfall in the simulated grain (winter wheat) and seed (winter rapeseed) yield was noticed after the ratio of tree area to crop area of 25:75 at Wendhausen, whereas a rather small decline was noted for the woody biomass beyond the same point. Subjected to the ratio of tree area to crop area of 80:20, the Yield-SAFE simulations for both years rendered about 93% less crop yield and 4% less yearly tree woody biomass compared to the values obtained for a ratio of tree area to crop area of 20:80.
The simulated grain yield at Neu Sacro was subjected to a downfall after the ratio of tree area to crop area of 25:75, although an upward surge was observed in the yearly woody biomass beyond the same point, until the ratio of tree area to crop area of 40:60, where a rather protracted yearly woody biomass was noticed. Between the first and the last design scenarios, about 93% less crop yield and 6% more yearly woody biomass were rendered by the Yield-SAFE model for both years.
These values simulated for the dry matter yields of wood and grains or seeds per cropped area and per alley-cropping system are presented in Table A4, together with their respective relative yields, and hence, the LER and gross energy yield determinations. Furthermore, Figure 7 presents the LER values as simulated by the Yield-SAFE model under ratios of tree area to crop area of 20:80, 25:75, 40:60, 50:50, 60:40, 75:25, and 80:20 for both locations and investigated years.
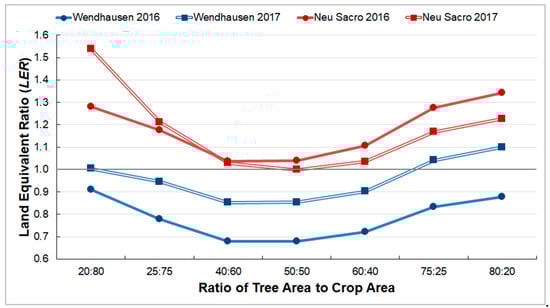
Figure 7.
The effect of different ratios of tree area to crop area on the land equivalent ratio (LER), as simulated by the Yield-SAFE model for the ACSs at Wendhausen and Neu Sacro, in 2016 and 2017. The grey line serves as a threshold above which the alley-cropping system has a greater productivity than the monoculture system.
The LER values simulated for different ratios of tree area to crop area follow a convex curve where the maximum values are achieved when either tree or crop component was dominant (i.e., when one of these components occupy at least 75% of the land area) and minimum when these components shared similar proportions of land area. At Wendhausen, aside from very few cases, the LER remained below 1.0 no matter the ratio of tree area to crop area, suggesting that the simulated alley-cropping system was less productive than the monoculture system. Conversely, at Neu Sacro, integrating trees and crops under all area proportions caused the simulated LER to be above 1.0, hence suggesting that the alley-cropping system was more productive than the monoculture system.
The gross energy yields over the two investigated years (Figure 8; Table A4) at Wendhausen would follow a softer curve by decreasing slightly, with 5 % from the ratio of tree area to crop area of 20:80, and increasing thereafter up to 40% more gross energy yield achieved in the ratio of tree area to crop area of 80:20, compared to that of 20:80. Similar results were observed for Neu Sacro, i.e., a slight decrease of 5% followed by an upward surge up to 60% more gross energy yield achieved in the ratio of tree area to crop area of 80:20, compared to that of 20:80.
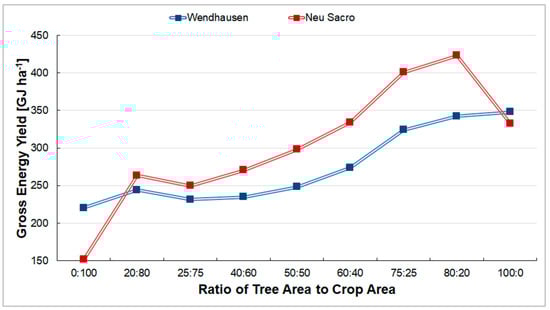
Figure 8.
The effect of different ratios of tree area to crop area on the gross energy yield, calculated with simulated yields for the ACSs at Wendhausen and Neu Sacro, in 2016 and 2017.
At the highest simulated proportion of land area covered by the crop (i.e., 20:80), the ACS at Wendhausen and Neu Sacro rendered 11% and 74% more gross energy yield respectively, compared to the crop monoculture (i.e., 0:100). Similarly, compared to the tree monoculture (i.e., 100:0), the highest simulated proportion of land area occupied by the trees (i.e., 80:20) rendered 27% more gross energy yield at Neu Sacro, albeit 2% less gross energy yield at Wendhausen.
3.5. Optimum Ratios of Tree Area to Crop Area
According to the simulated energy wood and grains (winter wheat and winter barley) or seeds (winter rapeseed) at our considered ACSs, the ratios of tree area to crop area from 20:80 to 25:75 would be the most advantageous to the design of such systems. The accretion accounting for the highest potential tree and crop yields emerged from these ratios regardless of the tree arrangement of the APs.
The simulated LER values inferred two main ratios of tree area to crop area, i.e., from 20:80 to 25:75, but also from 75:25 to 80:20. While the implication at Wendhausen was that the productivity of the ACS was below a monoculture’s regardless of the proportion of area covered by either trees or crops, these main ratios were preferable compared to other design options, and quite favourable in 2017.
The gross energy yield values suggested that all ratios of tree area to crop area above 75:25 would be advantageous at Wendhausen, but only from 75:25 to 80:20 at Neu Sacro, since the values decreased thereafter (Figure 8).
4. Discussion
4.1. Yield Assessment
Although the annual increment of tree woody biomass reported for poplar can vary with tree clone of choice, weather, and other growth-limiting factors such as mortality and seasonal variation of light, studies performed on second rotation poplar trees planted at around 10,000 cuttings ha−1 recorded biomass values in the range of 2.8–9.0 Mg DM ha−1 a−1 [], 2.0–9.6 Mg DM ha−1 a−1 [], and sometimes above 20 Mg DM ha−1 a−1 []. In a study made on 6-year, second rotation-cycle poplar trees planted at 11,000 cuttings ha−1, Bemmann et al. [] reported woody biomass values between 11.5 Mg DM ha−1 a−1 and 19.0 Mg DM ha−1 a−1 obtained at vigorous locations and between 4.5 Mg DM ha−1 a−1 and 9.0 Mg DM ha−1 a−1 achieved at less vigorous site types.
The poplar tree yields found in the present study were in line with findings from the literature, although significant differences arose between APs compared to their corresponding MPs. A tree yield advantage from the tree strips in APs would stem from additional space and higher light availability thanks to the crop alleys. The tree yield from MPs purposefully did not consider these border edges so that a fair resemblance to a monoculture forestry was ensured [], despite the reported lower yields.
According to the yield potential tables for energy crops in Germany proposed by Döhler [], the crop yields measured at our study sites would be classified as medium to low, which we would attribute to the weather conditions, but also to waterlogging during the winter months [], extreme heterogeneity in water content [,], and soil texture reported at Wendhausen by Lamerre et al. [,] and at Neu Sacro by Kanzler and Böhm [].
Regarding the weather conditions, the results presented in Table 2 indicate towards unfavourable growing conditions for trees and crops in 2016, compared to 2017, at Wendhausen, whereas at Neu Sacro, the tree and crop growth were similar, albeit more prosperous for trees in 2016 than in 2017. This implication was corroborated by the Walter–Lieth climate diagrams (Appendix A1), revealing 314 mm less annual average precipitation in 2016 than in 2017 at Wendhausen and only 28 mm less in 2016 than in 2017 at Neu Sacro. Moreover, the rainfall in 2016 in both locations was subjected to a drastic decline precisely in those months essential for tree and crop growth. The mean annual temperatures were around 10.3 °C in both years and for both locations. Since even minor changes in average precipitation sum, global solar radiation, and mean air temperature have been reported to significantly alter the growth of poplar trees [], oilseed rape [], winter wheat, and barley [], the auspicious weather conditions from 2017 might explain why tree and crop yields at Wendhausen were lower in 2016 than in 2017.
At Wendhausen, small variation was noticed within crop yields from APs and MPs, although the absolute values would indicate a slight yield advantage stemming from the windward arranged plots, caused mainly by the leaf litter deposition []. Significant differences at Wendhausen were observed between the APs and MPs, with crop yield advantages inclining toward the latter plots. The reduced crop yield in APs was correlated with tree height (i.e., more than 6 m), hence, higher tree shading causing crop developmental delays up to 7 m away from the tree strips [].
At Neu Sacro, the crop yields particularly varied within MPs, but also within APs, in 2017. This might have been the result of extreme temperatures throughout the day, heterogeneity in water content and soil texture, as well as remarkable differences in relative humidity and water evaporation rates between MPs and APs reported at the site []. Consequently, the crop yields from the MPs were significantly lower than the ones from APs, highlighting the contribution of tree strips to crop yield production in terms of increased soil moisture and relative humidity, temperature regulation, wind protection, and hence, a reduced evapotranspiration, as also reported by Kanzler and Böhm [] and Kanzler et al. [] at the Neu Sacro site.
According to some studies, the yield production of winter cereals benefits from the presence of tree strips in dry conditions but is hindered by them in well-watered conditions [,]. This could explain why the winter wheat yield from MPs at Wendhausen reached 7.2 Mg DM ha−1 a−1 in 2017 and only 5.1 Mg DM ha−1 a−1 in 2016 at Neu Sacro, whilst the APs at both locations rendered similar results, around 6.0 Mg DM ha−1 a−1. The amount of rainfall in 2017 was relatively high at Wendhausen, theoretically allowing for a considerable crop yield production in the MPs, but under the presence of trees in the APs, crops might have suffered from waterlogging, as well as from the height of the trees and a lack of litter coverage, which resulted in lower planting density and hence, lower crop yield []. At Neu Sacro, on the other hand, the crops in the APs might have benefitted from the drier conditions of 2016, along with the above-mentioned contribution of tree strips.
Regarding the lee- and wind-ward arranged APs, none of our investigations showed high variance or a positive statistical significance between the tree and crop DM yields. Therefore, the implication was either that no windbreaking effect of tree strips existed in relation to the crop DM yield or that, while the main wind direction pointed from South–West, it changed throughout the year at Wendhausen [] and Neu Sacro [], thus affecting all APs in a similar way.
Lastly, the appropriateness of using winter crops at high latitudes (i.e., more than 50° latitude North) in ACS should be further examined, since the sun irradiance reaching the crop can be hindered by the trees leafing precisely at key phenological stages for winter crops, i.e., in December (when crop germination and early growth occurs), March (for crop flowering), and June (when grain filling is concerned) []. By comparison, poplar trees open their buds in April and drop their leaves in November. Given our establishment (i.e., 24 m wide crop alleys with North–South tree strip orientation), trees can capture more than 50% of the sun irradiation that would have reached the crop, strongly affecting the crop yields [].
4.2. Empirically Determined Land Equivalent Ratio
Aside from one case in 2017, the LER values at Wendhausen were lower than 1.0, indicating that the ACS was consistently less productive than the monoculture system within the observed two years. Conversely, at Neu Sacro, all LER values were higher than 1.0, favouring the ACS by comparison to the monoculture system.
Nevertheless, since the border edge effects can influence the DM woody biomass in an MP to different extents, it can produce favouring of a certain system when determining the LER. For example, at Wendhausen the reported DM woody biomass from the middle rows was 9.4 Mg DM ha−1 a−1, but 13.7 Mg DM ha−1 a−1 in the leeward border of the tree monoculture system []. Similarly, at Neu Sacro, 9.0 Mg DM ha−1 a−1 were determined from the middle rows, by comparison to 11.0 Mg DM ha−1 a−1 from the leeward border of the tree monoculture system (own measurements). However, given the proportion of the total area that these values account for and for the purpose of this study, it was paramount to ensure a fair resemblance to a monoculture forestry, despite the reported lower yields. In a comprehensive study on different types of edge effects and their disadvantages to the overall yield estimations, Langton [] recommended eliminating edge effects, hence improving the accuracy of yield estimation.
Shortcomings of the LER approach include the lack of consideration for by-products and their revenue, the rectangularity of the planting scheme, the assumption that the production is constant, reliable, and happens in a static temporal context, and the idea that the interactions between trees and crops would automatically lead to either benefits or competition [].
4.3. Yield-SAFE Simulations of Tree and Crop Yields and Land Equivalent Ratio
The concordance correlation coefficient (CCC) and the simulation bias (SB) were also used to assess the model performance of APSIM (Agricultural Production Systems Simulator) to predict the dry matter (DM) yield of switchgrass (Panicum virgatum L.) and Miscanthus (Miscanthus x giganteus) and classifications were introduced pertaining to these two parameters []. Accordingly, the Yield-SAFE model rendered “very-good” (CCC > 0.90 and SB < 20%, []) correspondences with the observed above-ground DM yields of woody biomass and crop yield, which implied that the Yield-SAFE model was able to capture the crucial aspects of the crop-tree interactions in our ACSs over the investigated period.
The crop yield simulations showed a steady decline in crop yield as the ratio of tree area to crop area increased, which was expected since the area occupied by the crops decreased. Additionally, our results were corroborated by measurements performed from 2008 to the end of 2014 at Wendhausen on ACSs with ratios of tree area to crop area of 20:80 and 27:73 []. Comparing the compound yields of trees and crops stemming from these two ratios of tree area to crop area, Lamerre et al. [] reported less crop yield in the 27:73 ratio than in 20:80 one, albeit higher tree yield.
Our tree yield simulations showed slight differences between the first and the last design scenarios, i.e., 4% less tree yield at Wendhausen and 6% more tree yield at Neu Sacro. In the Yield-SAFE model, a higher tree area on the total land area did not presume a higher planting density of the trees, but rather wider tree strips with narrower crop alleys in between, as presented in Figure A2c. This increase in tree yield observed at Neu Sacro would be plausible since the poplar trees planted at a planting density of 8,700 tree ha−1 would be able to intercept the major proportion of the incoming light early in the tree rotation during well-watered conditions. At higher planting densities, however, the competition for incoming light could hamper the potential yield increase even during well-watered conditions, similar to an edge effect. In the Yield-SAFE model, these soil water conditions are given by the water balance equation, but also in terms of the ground water levels (i.e., 0.9 m at Wendhausen [] and 1.4 at Neu Sacro []).
Progressively higher tree yields in the APs than in the MPs, together with the gradually increasing percentage of total land area occupied by trees, caused an initial descent followed by an upraise in the simulated LER values. Similarly, the gross energy yields increased progressively with the percentage of total land area occupied by trees, as the energy derived from the dry matter yields of wood largely matched the energy lost from grains (winter wheat and winter barley) or seeds (winter rapeseed).
Compared to their corresponding tree and crop monocultures, the investigated ACSs rendered higher simulated energy yields. This is largely because, compared to the monoculture simulations of tree and crop yields, the ACS simulations accounted for the competition for water availability and incoming light, but also considered the algorithms for tree effects on microclimate, hence conserving soil moisture [,]. This was important since previous studies did not include such effects in Yield-SAFE, albeit the need was clearly stated [].
Nevertheless, simulating the energy wood and grain or seed production in ACSs with respect to the monoculture systems can be hampered by various uncertainties, many of those related to the underlying assumptions in the model, which do not account for plant mortality, nutrients, and pests, but also because of the difficulty in discriminating between intra- and inter-specific plant competition.
4.4. Optimum Ratios of Tree Area to Crop Area
Considering the highest potential tree and crop yields, LER values, and gross energy yields, optimum ratios in the design of our investigated ACSs would encompass the ratios of tree area to crop area from 20:80 to 25:75, but also from 75:25 to 80:20. While this later uprise in the simulated LER values would assume that certain ACSs might favour narrower crop alleys, difficulties would appear in reality in terms of machinery use and expenses required for establishing a narrow crop alley at the outcome of a virtually insignificant production.
The empirical and simulation-based approaches of this study have not taken into account the environmental benefits brought by the presence of trees on an agricultural land, such as the reduction in plant mortality, due to disease or wind-throw [], the reduction of atmospheric carbon dioxide [], and reduced nutrient leaching []. These factors should be calculated in the future and summed to the whole nexus of advantages and disadvantages of integrating trees on an agricultural land.
5. Conclusions
Based on the measurements and simulations of dry matter yields of energy wood and grains (winter wheat and winter barley) or seeds (winter rapeseed) in ACSs, we derived the land equivalent ratio (LER) and the gross energy yield for two years, locations, and several ratios of tree area to crop area.
Optima in the design of ACSs comprising of most advantageous tree arrangement and ratio of tree area to crop area were identified with respect to tree arrangement, potential energy, wood and grain or seed production, as well as LER values and gross energy yield. Furthermore, the implications of several ratios of tree area to crop area have been discussed in order to improve the decision-making, optimization, and adaptation of the design of ACSs with respect to site-specific characteristics.
The notion that the trade-off between wood and grain production does not solely implicate the production of ACSs was reinforced, as the presence of trees can also bring many environmental benefits to the agricultural land that should be calculated and summed to the whole nexus of advantages and disadvantages of ACSs before establishing such systems or choosing against it.
Nevertheless, this study emphasized the considerable potential of modelling approaches in ACSs, as they can simulate tree and crop yields for specific site-conditions in a non-intrusive, inexpensive, and prompt way while supporting an early site-setup planning.
Author Contributions
The SIGNAL project was initiated and planned in relation to the proposal call “Soil as a Sustainable Resource for the Bioeconomy—BonaRes” (http://www.signal.uni-goettingen.de). Diana-Maria Seserman analysed the data and wrote the manuscript. Anita Swieter, Maren Langhof, Maik Veste, and Dirk Freese contributed by revising the manuscript. Conceptualization, D.-M.S.; Methodology, D.-M.S.; Software, D.-M.S.; Validation D.-M.S.; Formal analysis, D.-M.S.; Investigation, D.-M.S.; Resources, D.-M.S., A.S., M.L. and D.F.; Data curation, D.-M.S., A.S. and M.L.; Writing—original draft preparation, D.-M.S.; Writing—review and editing, D.-M.S., A.S., M.L., D.F. and M.V.; Visualization, D.-M.S.; Supervision, D.F.; Project administration, D.F.; Funding acquisition, D.F.
Funding
This research was carried out under the BonaRes - SIGNAL project (FKZ 031A562E, 2015-2018) and funded by BMBF-German Federal Ministry of Education and Research (Bundesministerium für Bildung und Forschung).
Acknowledgments
We are grateful to our colleagues at the Julius Kühn-Institut in Braunschweig for their support and scientific collaboration. Additionally, we thank the Agrargenossenschaft Forst/L. e.G. for their promotion and management of the agroforestry system at Neu Sacro and the German Weather Service (Deutscher Wetterdienst, DWD) for the provision of weather data. We gratefully acknowledge the various students for their help with the field work. Nevertheless, we would also like to thank the editor and reviewers for their assistance and helpful comments on the manuscript.
Conflicts of Interest
The authors declare no conflict of interest. The founding sponsors had no role in the design of the study, in the collection, analyses, or interpretation of data, in the writing of the manuscript, and in the decision to publish the results.
Appendix A
Table A1.
Tree parameter values used for the parametrization of the Yield-SAFE model.
Table A1.
Tree parameter values used for the parametrization of the Yield-SAFE model.
| Symbol | Description | Unit | Location | Value | Source |
|---|---|---|---|---|---|
| Tree Parameters | |||||
| Initial Conditions | |||||
| nShoots0 | Initial number of shoots per tree | tree−1 | Wendhausen | 1.256 | Own data |
| Neu Sacro | 1.086 | ||||
| Bt0 | Initial tree biomass | g tree−1 | Wendhausen | 40 | [] |
| Neu Sacro | |||||
| LAt0 | Initial tree leaf area | m2 tree−1 | Wendhausen | 0 | [,,] |
| Neu Sacro | |||||
| Parameters | |||||
| εt | Radiation use efficiency | g MJ−1 | Wendhausen | 1.1100 | Own data |
| Neu Sacro | 0.9912 | ||||
| kt | Light extinction coefficient | Wendhausen | 0.8 | [,] | |
| Neu Sacro | |||||
| tt | The number of days after bud-burst at which the leaf area has reached 63.2% of its maximum leaf area LAssmax | d | Wendhausen | 10 | [,] |
| Neu Sacro | |||||
| LAssmax | Maximum leaf area for a single shoot | m2 | Wendhausen | 0.04 | [] |
| Neu Sacro | |||||
| nShootsmax | Maximum number of shoots per tree | tree−1 | Wendhausen | 10,000 | [,] |
| Neu Sacro | |||||
| Kmain | Relative attrition rate of tree biomass | d−1 | Wendhausen | 10−4 | [,] |
| Neu Sacro | |||||
| γt | Transpiration coefficient of the trees | m3 kg−1 | Wendhausen | 0.2 | [] |
| Neu Sacro | |||||
| (pFcrit)t | Critical pF value | log (cm) | Wendhausen | 4.0 | [] |
| Neu Sacro | |||||
| (pFpwp)t | pF value at permanent wilting point | log (cm) | Wendhausen | 4.2 | [] |
| Neu Sacro | |||||
| Tree Phenology | |||||
| DOYbudburst, DOYleaffall | Day of year for bud-burst and leaf fall | DOY | Wendhausen | 105, 300 | [] |
| Neu Sacro | |||||
| Management Parameters | |||||
| ρt | Planting density | trees ha−1 | Wendhausen | 10,000 | [] |
| Neu Sacro | 8700 | [] | |||
Table A2.
Crop parameter values used for the parametrization of the Yield-SAFE model.
Table A2.
Crop parameter values used for the parametrization of the Yield-SAFE model.
| Symbol | Description | Unit | Crop | Location | Value | Source |
|---|---|---|---|---|---|---|
| Crop Parameters | ||||||
| Initial Conditions | ||||||
| Bc0 | Initial crop biomass | g m−2 | All | All | 10 | [] |
| LAc0 | Initial crop leaf area | m2 m−2 | All | All | 0.1 | [] |
| Pleaves | Partitioning factor to leaves | All | All | 0.8 | [] | |
| Parameters | ||||||
| εc | Radiation use efficiency | g MJ−1 | ww | NS | 1.690 | Own data |
| wb | NS | 1.033 | ||||
| wr | WH | 1.017 | ||||
| ww | WH | 0.907 | ||||
| kc | Light extinction coefficient | All | All | 0.7 | [] | |
| (pFcrit)c | Critical pF value | log (cm) | wb | All | 2.9 | [,] |
| ww, wr | 3.2 | |||||
| (pFpwp)c | pF value at permanent wilting point | log (cm) | All | All | 4.2 | [] |
| SLA | Specific leaf area | m2 g−1 | ww, wb | NS | 0.005 | [] |
| wr | WH | 0.020 | ||||
| ww | WH | 0.005 | ||||
| T0 | Base temperature | °C | All | All | 5 | [] |
| Tsum emerge | Heat sum at emergence | °Cd | All | All | 57 | [] |
| 79 | ||||||
| Tsum RB | Heat sum when partitioning to leaves starts to decrease | °Cd | All | All | 456 | [] |
| 500 | ||||||
| Tsum RE | Heat sum when partitioning to leaves ceases | °Cd | All | All | 464 | [] |
| 1300 | ||||||
| Tsum harvest | Heat sum at harvest | °Cd | All | All | 1312 | [] |
| 2000 | ||||||
| Management Parameters | ||||||
| DOYsow | Day of sowing | DOY | ww | NS | −65 | [] |
| wb | NS | −60 | [] | |||
| wr | WH | −116 | [] | |||
| ww | WH | −95 | [] | |||
| DOYharvest | Day of harvest | DOY | ww, wb | NS | 245 | [] |
| wr | WH | 225 | [] | |||
| ww | WH | 300 | [] | |||
ww: winter wheat, wb: winter barley, wr: winter rapeseed, WH: Wendhausen, NS: Neu Sacro.
Table A3.
Soil parameter values used for the parametrization of the Yield-SAFE model.
Table A3.
Soil parameter values used for the parametrization of the Yield-SAFE model.
| Symbol | Description | Unit | Crop | Location | Value |
|---|---|---|---|---|---|
| Soil Parameters | |||||
| Initial Conditions | |||||
| θ0 | Initial volumetric water content | m3 m−3 | Wendhausen | 0.552 | [,] |
| Neu Sacro | |||||
| Parameters | |||||
| δeva | Potential evaporation per unit energy | mm MJ−1 | Wendhausen | 0.15 | [,] |
| Neu Sacro | |||||
| D | Depth of the soil compartment | mm | Wendhausen | 900 | [] |
| Neu Sacro | 1400 | [] | |||
| α | Van Genuchten parameter | Wendhausen | 0.0083 | [] | |
| Neu Sacro | 0.0383 | ||||
| nsoil | Van Genuchten parameter | Wendhausen | 1.2539 | [] | |
| Neu Sacro | 1.3774 | ||||
| δ | Parameter affecting the drainage rate below root zone | Wendhausen | 0.07 | [] | |
| Neu Sacro | |||||
| PWP | Permanent wilting point | log (cm) | Wendhausen | 4.2 | [,] |
| Neu Sacro | |||||
| (pFcrit)E | Critical pF value for evaporation | log (cm) | Wendhausen | 2.3 | [,] |
| Neu Sacro | |||||
| pFFC | Water tension at field capacity | log (cm) | Wendhausen | 2.3 | [,] |
| Neu Sacro | |||||
| Ks | Soil hydraulic conductivity at saturation | mm d−1 | Wendhausen | 24.8 | [] |
| Neu Sacro | 60.0 | ||||
| θs | Saturated volumetric water content | m3 m−3 | Wendhausen | 0.520 | [] |
| Neu Sacro | 0.403 | ||||
| θr | Residual volumetric water content | m3 m−3 | Wendhausen | 0.010 | [] |
| Neu Sacro | 0.025 | ||||
Table A4.
Tree and crop yields per cropped area and per alley-cropping system, their corresponding relative yields, the inferred LER and gross energy yield values, as projected by the Yield-SAFE model at Wendhausen and Neu Sacro in 2016 and 2017 and under different ratios of tree area to crop area.
Table A4.
Tree and crop yields per cropped area and per alley-cropping system, their corresponding relative yields, the inferred LER and gross energy yield values, as projected by the Yield-SAFE model at Wendhausen and Neu Sacro in 2016 and 2017 and under different ratios of tree area to crop area.
| Wendhausen | Neu Sacro | ||||||||||||||||||
|---|---|---|---|---|---|---|---|---|---|---|---|---|---|---|---|---|---|---|---|
| Yield Per Cropped Area | Yield Per ACS (Yi) | Relative Yields (Yi/Y100) | LER (Equation (2)) | Gross Energy Yield (GJ ha−1) | Yield Per Cropped Area | Yield Per ACS (Yi) | Relative Yields (Yi/Y100) | LER (Equation (2)) | Gross Energy Yield (GJ ha−1) | ||||||||||
| (Mg DM ha−1 yr−1) | (Mg DM ha−1 yr−1) | ||||||||||||||||||
| Plant | Area (%) | 2016 | 2017 | 2016 | 2017 | 2016 | 2017 | 2016 | 2017 | 2016 | 2017 | 2016 | 2017 | 2016 | 2017 | 2016 | 2017 | ||
| Tree | 0 | 1 | 1 | 220 | 1 | 1 | 151 | ||||||||||||
| Crop | 100 | 3.7 | 7.2 | 3.7 | 7.2 | 1.0 | 1.0 | 5.1 | 3.7 | 5.1 | 3.7 | 1.00 | 1.00 | ||||||
| Tree | 20 | 10.6 | 13.5 | 2.1 | 2.7 | 0.2 | 0.3 | 0.9 | 1.0 | 244 | 14.0 | 12.9 | 2.8 | 2.6 | 0.3 | 0.3 | 1.3 | 1.5 | 264 |
| Crop | 80 | 3.2 | 6.4 | 2.6 | 5.1 | 0.7 | 0.7 | 6.1 | 5.8 | 4.9 | 4.6 | 1.0 | 1.3 | ||||||
| Tree | 25 | 10.5 | 13.4 | 2.6 | 3.4 | 0.3 | 0.4 | 0.8 | 0.9 | 232 | 14.4 | 13.1 | 3.6 | 3.3 | 0.4 | 0.4 | 1.2 | 1.2 | 250 |
| Crop | 75 | 2.5 | 5.6 | 1.9 | 4.2 | 0.5 | 0.6 | 5.3 | 4.2 | 4.0 | 3.2 | 0.8 | 0.9 | ||||||
| Tree | 40 | 10.4 | 13.3 | 4.2 | 5.3 | 0.4 | 0.6 | 0.7 | 0.9 | 235 | 14.8 | 13.5 | 5.9 | 5.4 | 0.7 | 0.6 | 1.0 | 1.0 | 270 |
| Crop | 60 | 1.5 | 3.5 | 0.9 | 2.1 | 0.2 | 0.3 | 3.2 | 2.7 | 1.9 | 1.6 | 0.4 | 0.4 | ||||||
| Tree | 50 | 10.3 | 13.1 | 5.2 | 6.6 | 0.5 | 0.7 | 0.7 | 0.8 | 248 | 14.9 | 13.5 | 7.5 | 6.8 | 0.8 | 0.8 | 1.0 | 1.0 | 298 |
| Crop | 50 | 1.0 | 2.2 | 0.5 | 1.1 | 0.1 | 0.2 | 2.2 | 1.9 | 1.1 | 1.0 | 0.2 | 0.3 | ||||||
| Tree | 60 | 10.3 | 13.0 | 6.2 | 7.8 | 0.7 | 0.8 | 0.7 | 0.9 | 274 | 14.9 | 13.6 | 8.9 | 8.2 | 1.0 | 0.9 | 1.1 | 1.0 | 334 |
| Crop | 40 | 0.6 | 1.3 | 0.2 | 0.5 | 0.1 | 0.1 | 1.4 | 1.2 | 0.6 | 0.5 | 0.1 | 0.1 | ||||||
| Tree | 75 | 10.2 | 12.9 | 7.7 | 9.7 | 0.8 | 1.0 | 0.8 | 1.0 | 324 | 14.9 | 13.6 | 11.2 | 10.2 | 1.2 | 1.1 | 1.3 | 1.2 | 401 |
| Crop | 25 | 0.3 | 0.4 | 0.1 | 0.1 | 0.0 | 0.0 | 0.6 | 0.6 | 0.2 | 0.2 | 0.0 | 0.0 | ||||||
| Tree | 80 | 10.2 | 12.8 | 8.2 | 10.2 | 0.9 | 1.1 | 0.9 | 1.1 | 342 | 14.9 | 13.5 | 11.9 | 10.8 | 1.3 | 1.2 | 1.3 | 1.2 | 423 |
| Crop | 20 | 0.2 | 0.3 | 0.0 | 0.1 | 0.0 | 0.0 | 0.4 | 0.4 | 0.1 | 0.1 | 0.0 | 0.0 | ||||||
| Tree | 100 | 9.4 | 9.4 | 9.4 | 9.4 | 1.0 | 1.0 | 1 | 1 | 348 | 9.0 | 9.0 | 9.0 | 9.0 | 1.00 | 1.00 | 1 | 1 | 333 |
| Crop | 0 | ||||||||||||||||||
ACS: alley-cropping system, LER: land equivalent ratio.

Figure A1.
Walter-Lieth climate diagrams for the weather stations at Braunschweig (Wendhausen; a, c) and Cottbus (Neu Sacro; b, d). Monthly values from 2016 (a,b) and 2017 (c,d) were used to represent the mean air temperature (red) and average precipitation sum (blue). If the average monthly precipitation sum lies under the mean monthly air temperature, the period is considered arid (filled in dotted red vertical lines), otherwise it is considered wet (filled in blue lines). Minimum and maximum annual temperatures are located on the far-left side and annual mean temperatures are located atop, together with the annual precipitation sum. Frost months (when the absolute monthly temperature minimums are equal or lower than 0 °C) are shown in solid blue boxes along the x-axis.

Figure A2.
To-scale sketch of the 29 m × 30 m alley-cropping-plots (APs) design at Wendhausen (a) and Neu Sacro (b). At both sites, AP1 and AP2 are arranged leeward and AP3 and AP4 windward. The solid-coloured areas correspond to the tree strips and the shaded areas to the cropped surfaces. The orange bars represent the 2 m × 10 harvest transects located 1 m, 4 m, 7 m, and 24 m away from the tree strips. As the experimental part of this study focused on a ratio of tree area to crop area of 17:82, the simulations considered design scenarios with ratios of tree area to crop area of 20:80, 25:75, 40:60, 50:50, 60:40, 75:26, and 80:20 (c).
References
- Wesche, K.; Krause, B.; Culmsee, H.; Leuschner, C. Fifty years of change in Central European grassland vegetation: Large losses in species richness and animal-pollinated plants. Biol. Conser. 2012, 150, 76–85. [Google Scholar] [CrossRef]
- Meyer, S.; Wesche, K.; Krause, B.; Leuschner, C. Dramatic impoverishment of arable plant communities since the 1950s/60s—A large scale analysis across geological substrate groups. Divers. Distrib. 2013, 19, 1175–1187. [Google Scholar] [CrossRef]
- Tsiafouli, M.A.; Thébault, E.; Sgardelis, S.P.; Ruiter, P.C.; van der Putten, W.H.; Birkhofer, K.; Hemerik, L.; de Vries, F.T.; Bardgett, R.D.; Brady, M.V.; et al. Intensive agriculture reduces soil biodiversity across Europe. Glob. Chang. Biol. 2015, 21, 973–985. [Google Scholar] [CrossRef] [PubMed]
- Zscheischler, J.; Gaasch, N.; Butler Manning, D.; Weith, T. Land Use Competition Related to Woody Biomass Production on Arable Land in Germany. In Land Use Competition. Human-Environment Interactions; Niewohner, J., Bruns, A., Hostert, P., Krueger, T., Nielsen, J.Ø., Haberl, H., Lauk, C., Lutz, J., Müller, D., Eds.; Springer: Heidelberg, Germany, 2016; pp. 193–213. [Google Scholar] [CrossRef]
- Landis, D.A. Designing agricultural landscapes for biodiversity-based ecosystem services. Basic Appl. Ecol. 2017, 18, 1–12. [Google Scholar] [CrossRef]
- Birkhofer, K.; Andersson, G.K.S.; Bengtsson, J.; Bommarco, R.; Dänhardt, J.; Ekbom, B.; Ekroos, J.; Hahn, T.; Hedlund, K.; Jönsson, A.M.; et al. Relationships between multiple biodiversity components and ecosystem services along a landscape complexity gradient. Biol. Conserv. 2018, 218, 247–253. [Google Scholar] [CrossRef]
- Morhart, C.D.; Douglas, G.C.; Dupraz, C.; Graves, A.R.; Nahm, M.; Paris, P.; Sauter, U.H.; Sheppard, J.; Spiecker, H. Alley coppice—A new system with ancient roots. Ann. For. Sci. 2014, 71, 527–542. [Google Scholar] [CrossRef]
- Veste, M.; Böhm, C. Agrarholz—Schnellwachsende Bäume in der Landwirtschaft; Springer: Heidelberg, Germany, 2018. [Google Scholar]
- Fagerholm, N.; Torralba, M.; Burgess, P.J.; Plieninger, T. A systematic map of ecosystem services assessments around European agroforestry. Ecol. Indic. 2016, 62, 47–65. [Google Scholar] [CrossRef]
- Paul, C.; Weber, M.; Knoke, T. Agroforestry versus farm mosaic systems—Comparing land-use efficiency, economic returns and risks under climate change effects. Sci. Total Environ. 2017, 587–588, 22–35. [Google Scholar] [CrossRef] [PubMed]
- De Stefano, A.; Jacobson, M.G. Soil carbon sequestration in agroforestry systems: A meta-analysis. Agrofor. Syst. 2018, 92, 285–299. [Google Scholar] [CrossRef]
- Verchot, L.V.; Van Noordwijk, M.; Kandji, S.; Tomich, T.; Ong, C.; Albrecht, A.; Mackensen, J.; Bantilan, C.; Anupama, K.V.; Palm, C. Climate change: Linking adaptation and mitigation through agroforestry. Mitig. Adapt. Strateg. Glob. 2007, 12, 901–918. [Google Scholar] [CrossRef]
- Schoeneberger, M.; Bentrup, G.; de Gooijer, H.; Soolanayakanahally, R.; Sauer, T.; Brandle, J.; Zhou, X.; Current, D. Branching out: Agroforestry as a climate change mitigation and adaptation tool for agriculture. J. Soil Water Conserv. 2012, 67, 128A–136A. [Google Scholar] [CrossRef]
- Tsonkova, P.; Böhm, C.; Quinkenstein, A.; Freese, D. Ecological benefits provided by alley cropping systems for production of woody biomass in the temperate region: A review. Agrofor. Syst. 2012, 85, 133–152. [Google Scholar] [CrossRef]
- Tsonkova, P.; Mirck, J.; Böhm, C.; Fütz, B. Addressing farmer-perceptions and legal constraints to promote agroforestry in Germany. Agrofor. Syst. 2018, 92, 1091–1103. [Google Scholar] [CrossRef]
- Graves, A.R.; Burgess, P.J.; Liagre, F.; Pisanelli, A.; Paris, P.; Moreno, G.; Bellido, M.; Mayus, M.; Postma, M.; Schindler, B.; et al. Farmer Perceptions of Silvoarable Systems in Seven European Countries. In Agroforestry in Europe; Rigueiro-Rodróguez, A., McAdam, J., Mosquera-Losada, M.R., Eds.; Springer Science + Business Media B.V.: Berlin, Germany, 2009; Volume 6. [Google Scholar] [CrossRef]
- Rois-Díaz, M.; Lovric, N.; Ferreiro-Domínguez, M.N.; Mosquera-Losada, M.R.; den Herder, M.; Graves, A.; Palma, J.H.N.; Paulo, J.A.; Pisanelli, A.; Smith, J.; et al. Farmers’ reasoning behind the uptake of agroforestry practices: Evidence from multiple case-studies across Europe. Agrofor. Syst. 2018, 92, 811–828. [Google Scholar] [CrossRef]
- Böhm, C. Erarbeitung Einer Kontrollfähigen Definition für Agroforstschläge. Eine Initiative der Innovationsgruppe AUFWERTEN in Zusammenarbeit Mit der Arbeitsgemeinschaft Agroforst Deutschland. 2017. Available online: http://agroforst-info.de/rechtliche-und-politische-rahmenbedingungen (accessed on 3 August 2018).
- Mead, R.; Willey, R.W. The concept of a ‘Land Equivalent Ratio’ and advantages in yields from intercropping. Exp. Agric. 1980, 16, 217–228. [Google Scholar] [CrossRef]
- Swieter, A.; Langhof, M.; Lamerre, J.; Greef, J.M. Long-term yields of oilseed rape and winter wheat in a short rotation alley cropping agroforestry system. Agrofor. Syst. 2018, 1–12. [Google Scholar] [CrossRef]
- Kanzler, M.; Böhm, C. Nachhaltige Erzeugung von Energieholz in Agroforstsystemen (AgroForstEnergie II): Teilvorhaben 2: Bodenschutz, Bodenfruchtbarkeit, Wasserhaushalt und Mikroklima Schlußbericht. In Fachgebiet für Bodenschutz und Rekultivierung; Brandenburgische Technische Universität Cottbus-Senftenberg: Cottbus, Germany, 2016. [Google Scholar]
- Lamerre, J.; Schwarz, K.U.; Langhof, M.; von Wühlisch, G.; Greef, J.M. Productivity of poplar short rotation coppice in an alley-cropping agroforestry system. Agrofor. Syst. 2015, 89, 933–942. [Google Scholar] [CrossRef]
- Lamerre, J.; Langhof, M.; Sevke-Masur, K.; Schwarz, K.U.; von Wühlisch, G.; Swieter, A.; Greef, J.M.; Dauber, J.; Hirschberg, F.; Joormann, I.; et al. Nachhaltige Erzeugung von Energieholz in Agroforstsystemen: Teilprojekt 3: Standort Niedersachsen, Strukturvielfalt und Biodiversität. Schlußbericht. In Institut für Pflanzenbau und Bodenkunde; Julius Kühn-Institut Bundesforschungsinstitut für Kulturpflanzen (JKI): Braunschweig, Germany, 2016. [Google Scholar]
- Hytönen, J.; Lumme, I.; Törmälä, T. Comparison of Methods for Estimating Willow Biomass. Biomass 1987, 14, 39–49. [Google Scholar] [CrossRef]
- Langton, S. Avoiding edge effects in agroforestry experiments; the use of neighbourbalanced designs and guard areas. Agrofor. Syst. 1990, 12, 173–185. [Google Scholar] [CrossRef]
- Veste, M.; Malaga Linares, R.A.; Seserman, D.M.; Schmitt, D.; Wachendorf, M.; Küppers, M. Annual Leaf Carbon Fluxes, Light Interception, and Stand Structure of Poplars and Black Locusts in an Alley-Cropping System, Lower Lusatia, Germany. In Proceedings of the 4th European Agroforestry Conference: Agroforestry as Sustainable Land Use, Nijmegen, The Netherlands, 28–30 May 2018; pp. 488–492. [Google Scholar]
- Kaltschmitt, M.; Hartmann, H.; Hofbauer, H. Energie aus Biomasse: Grundlagen, Techniken und Verfahren; Springer: Berlin, Germany, 2016. [Google Scholar]
- Van der Werf, W.; Keesman, K.; Burgess, P.J.; Graves, A.R.; Pilbeam, D.; Incoll, L.D.; Metselaar, K.; Mayus, M.; Stappers, R.; van Keulen, H.; et al. Yield-SAFE: A parameter-sparse, process-based dynamic model for predicting resource capture, growth, and production in agroforestry systems. Ecol. Eng. 2007, 29, 419–433. [Google Scholar] [CrossRef]
- Graves, A.R.; Burgess, P.J.; Palma, J.; Keesman, K.J.; van der Werf, W.; Dupraz, C.; van Keulen, H.; Herzog, F.; Mayus, M. Implementation and calibration of the parameter-sparse Yield-SAFE model to predict production and land equivalent ratio in mixed tree and crop systems under two contrasting production situations in Europe. Ecol. Model. 2010, 221, 1744–1756. [Google Scholar] [CrossRef]
- Palma, J.H.N.; Graves, A.R.; Crous-Duran, J.; Upson, M.; Paulo, J.A.; Oliveira, T.S.; Silvestre Garcia de Jalón, S.; Burgess, P.J. Yield-SAFE Model Improvements; Milestone Report 29 (6.4) for EU FP7 Research Project: AGFORWARD 613520; Sine Nomine: Lisboa, Portugal, 2016; p. 30. Available online: http://hdl.handle.net/10400.5/12337 (accessed on 20 March 2019).
- Keesman, K.J.; Graves, A.; van der Werf, W.; Burgess, P.; Palma, J.; Dupraz, C.; van Keulen, H. A system identification approach for developing and parameterising an agroforestry system model under constrained availability of data. Environ. Modell. Softw. 2011, 26, 1540–1553. [Google Scholar] [CrossRef]
- Burgess, P.J.; Graves, A.; Metselaar, K.; Stappers, R.; Keesman, K.; Palma, J.; Mayus, M.; van der Werf, W. Description of Plot-SAFE Version 0.3, Unpublished Document; Cranfield University: Bedfordshire, UK, 2004; p. 52. [Google Scholar]
- Burgess, P.; Graves, A.; Palma, J.; Herzog, F.; Keesman, K.; van der Werf, W. EU SAFE Project Deliverable 6.4: Parametrization of the Yield-SAFE Model and Its Use to Determine Yields at the Landscape Test. Sites; Cranfield University-Institute of Water and Environment: Bedfordshire, UK, 2005. [Google Scholar]
- Palma, J.H.N.; Graves, A.R.; Bunce, R.G.H.; Burgess, P.J.; de Filippi, R.; Keesman, K.J.; van Keulen, H.; Liagre, F.; Mayus, M.; Reisner, Y.; et al. Modeling environmental benefits of silvoarable agroforestry in Europe. Agric. Ecosyst. Environ. 2007, 119, 320–334. [Google Scholar] [CrossRef]
- Palma, J.H.N.; Paulo, J.A.; Tome, M. Carbon sequestration of modern Quercus suber L. silvoarable agroforestry systems in Portugal: A YieldSAFE-based estimation. Agrofor. Syst. 2014, 88, 791–801. [Google Scholar] [CrossRef]
- Wösten, J.H.M.; Lilly, A.; Nemes, A.; Le Bas, C. Development and use of a database of hydraulic properties of European soils. Geoderma 1999, 90, 169–185. [Google Scholar] [CrossRef]
- Ojeda, J.J.; Volenec, J.J.; Brouder, S.M.; Caviglia, O.P.; Agnusdei, M.G. Evaluation of Agricultural Production Systems Simulator (APSIM) as yield predictor of Panicum virgatum and Miscanthus x giganteus in several US environments. GCB Bioenergy 2017, 9, 796–816. [Google Scholar] [CrossRef]
- Stevenson, M.; Nunes, T.; Heuer, C.; Marshall, J.; Sanchez, J.; Thornton, R.; Reiczigel, J.; Robison-Cox, J.; Sebastiani, P.; Solymos, P.; et al. epiR: Tools for the Analysis of Epidemiological Data, R Package Version 1.0-2. Available online: https://CRAN.R-project.org/package=epiR (accessed on 20 June 2019).
- Mitchell, C.P.; Stevens, E.A.; Watters, M.P. Short rotation forestry—Operations, productivity and costs based on experience gained in the UK. For. Ecol. Manag. 1999, 121, 123–136. [Google Scholar] [CrossRef]
- Aylott, M.J.; Casella, E.; Tubby, I.; Street, N.R.; Smith, P.; Taylor, G. Yield and spatial supply of bioenergy poplar and willow short-rotation coppice in the UK. New Phytol. 2008, 178, 358–370. [Google Scholar] [CrossRef]
- Calfapietra, C.; Gielen, B.; Karnosky, D.; Ceulemans, R.; Mugnozza, G.S. Response and potential of agroforestry crops under global change. Environ. Pollut. 2010, 158, 1095–1104. [Google Scholar] [CrossRef]
- Bemmann, A.; Feger, K.H.; Gerold, D.; Große, W.; Hartmann, K.U.; Petzold, R.; Röhle, H.; Schweinle, J.; Steinke, C. Kurzumtriebsplantagen auf landwirtschaftlichen Flächen in der Region Großenhain im Freistaat Sachsen. Forstarchiv 2007, 78, 95–101. [Google Scholar]
- Döhler, H. Faustzahlen für die Landwirtschaft, 13th ed.; Kuratorium für Technik und Bauwesen in der Landwirtschaft e.V. KTBL: Darmstadt, Germany, 2005. [Google Scholar]
- Seserman, D.M.; Pohle, I.; Veste, M.; Freese, D. Simulating Climate Change Impacts on Hybrid-Poplar and Black Locust Short Rotation Coppices. Forests 2018, 9, 419. [Google Scholar] [CrossRef]
- Pohle, I.; Koch, H.; Conradt, T.; Gädeke, A.; Grünewald, U. Potential impacts of climate change and regional anthropogenic activities in Central European mesoscale catchments. Hydrol. Sci. J. 2015, 60, 912–928. [Google Scholar] [CrossRef]
- Gerstengarbe, F.W.; Badeck, F.; Hattermann, F.; Krysanova, V.; Lahmer, W.; Lasch, P.; Stock, M.; Suckow, F.; Wechsung, F.; Werner, P.C. Studie zur klimatischen Entwicklung im Land Brandenburg bis 2055 und deren Auswirkungen auf den Wasserhaushalt, die Forst- und Landwirtschaft sowie die Ableitung erster Perspektiven. Potsdam. Inst. Clim. Impact Res. 2003, 83, 96. [Google Scholar]
- Kanzler, M.; Böhm, C.; Mirck, J.; Schmitt, D.; Veste, M. Microclimate effects on evaporation and winter wheat (Triticum aestivum L.) yield within a temperate agroforestry system. Agrofor. Syst. 2018, 1–21. [Google Scholar] [CrossRef]
- Bruckhaus, A.; Buchner, W. Hecken in der Agrarlandschaft: Auswirkungen auf Feldfruchtertrag und ökologische Kenngrößen. Ber. Über Landwirtsch. 1995, 73, 435–465. [Google Scholar]
- Dupraz, C.; Blitz-Frayret, C.; Lecomte, I.; Molto, Q.; Reyes, F.; Gosme, M. Influence of latitude on the light availability for intercrops in an agroforestry alley-cropping system. Agrofor. Syst. 2018, 92, 1019–1033. [Google Scholar] [CrossRef]
- Terreaux, J.P.; Chavet, M. An intertemporal approach of Land Equivalent Ratio for agroforestry plots. Lameta DT 2004, 15, 18. [Google Scholar]
- Palma, J.H.N.; Oliveira, T.; Crous-Duran, J.; Graves, A.R.; Garcia de Jalon, S.; Upson, M.; Giannitsopoulos, M.; Burgess, P.J.; Paulo, J.A.; Tomé, M.; et al. Modelled Agroforestry Outputs at Field and Farm Scale to Support Biophysical and Environmental Assessments; Deliverable 6.17 (6.2) for EU FP7 Research Project: AGFORWARD project 613520; Sine Nomine: Lisboa, Portugal, 2017; p. 162. Available online: http://hdl.handle.net/10400.5/14799 (accessed on 20 March 2019).
- Crous-Duran, J.; Graves, A.R.; Paulo, J.A.; Mirck, J.; Oliveira, T.S.; Kay, S.; García de Jalón, S.; Palma, J.H.N. Modelling tree density effects on provisioning ecosystem services in Europe. Agrofor. Syst. 2018, 1–23. [Google Scholar] [CrossRef]
© 2019 by the authors. Licensee MDPI, Basel, Switzerland. This article is an open access article distributed under the terms and conditions of the Creative Commons Attribution (CC BY) license (http://creativecommons.org/licenses/by/4.0/).