Article

Actual Evapotranspiration and Tree Performance of Mature Micro-Irrigated Pistachio Orchards Grown on Saline-Sodic Soils in the San Joaquin Valley of California

1
Department of Land, Air and Water Resources, University of California, Davis, CA 95616, USA
2
Department of Water Resources, University of Concepción, Chillan 3801061, Chile
3
Department of Plant Sciences, University of California, Davis, CA 95616, USA
4
California Department of Water Resources, Sacramento, CA 94236, USA
5
USDA-ARS, U.S. Salinity Laboratory Riverside, CA 92507, USA
6
University of California Cooperative Extension Kern County, Bakersfield, CA 93307, USA
*
Author to whom correspondence should be addressed.
Agriculture 2019, 9(4), 76; https://doi.org/10.3390/agriculture9040076
Submission received: 9 February 2019 / Revised: 21 March 2019 / Accepted: 27 March 2019 / Published: 12 April 2019
(This article belongs to the Special Issue Response and Tolerance of Agricultural Crops to Salinity Stress)

Abstract

:
In California, a significant percentage of the pistachio acreage is in the San Joaquin Valley on saline and saline-sodic soils. However, irrigation management practices in commercial pistachio production are based on water-use information developed nearly two decades ago from experiments conducted in non-saline orchards sprinkler-irrigated with good quality water. No information is currently available that quantify the effect of salinity or combined salinity and sodicity on water use of micro-irrigated pistachio orchards, even though such information would help growers schedule irrigations and control soil salinity through leaching. To fill this gap, a field research study was conducted in 2016 and 2017 to measure the actual evapotranspiration (ETa) from commercial pistachio orchards grown on non-saline and saline-sodic soils in the southern portion of the San Joaquin Valley of California. The study aimed at investigating the functional relations between soil salinity/sodicity and tree performance, and understanding the mechanisms regulating water-use reduction under saline and saline-sodic conditions. Pistachio ETa was measured with the residual of energy balance method using a combination of surface renewal and eddy covariance equipment. Saline and saline-sodic conditions in the soil adversely affected tree performance with different intensity. The analysis of field data showed that ETa, light interception by the tree canopy, and nut yield were highly and linearly related (r2 > 0.9). Moving from non-saline to saline and saline-sodic conditions, the canopy light interception decreased from 75% (non-saline) to around 50% (saline) and 30% (saline-sodic), and ETa decreased by 32% to 46% relative to the non-saline orchard. In saline-sodic soils, the nut yield resulted around 50% lower than that of non-saline orchard. A statistical analysis performed on the correlations between soil physical-chemical parameters and selected tree performance indicators (ETa, light interception, and nut yield) revealed that the sodium adsorption ratio (SAR) adversely affected tree performance more than the soil electrical conductivity (ECe). Results suggest that secondary effects of sodicity (i.e., degradation of soil structure, possibly leading to poor soil aeration and root hypoxia) might have had a stronger impact on pistachio performance than did salinity in the long term. The information presented in this paper can help pistachio growers and farm managers better tailor irrigation water allocation and management to site-specific orchard conditions (e.g., canopy features and soil-water salinity/sodicity), and potentially lead to water and energy savings through improved irrigation management practices.

1. Introduction

A substantial reduction in surface water supplies for irrigated agriculture has occurred in the San Joaquin Valley (SJV) of California in recent years due to periodic droughts and various environmental regulations. Alongside the adoption of good water management practices, growing crops with greater drought and salinity tolerance have become necessary adaptation strategies to maintain profitable farming systems in the valley under a changing environment with limited and increasingly variable supplies of non-saline water.
In the last 15 years, pistachio acreage in the SJV has rapidly expanded and now includes land affected by salinity and sodicity that was previously used to grow cotton [1]. Besides being more profitable than cotton, pistachios express both drought resilience [2,3] and higher salt tolerance [4,5] than do most other tree crops grown in the valley.
Soil salinity is a known constraint on agricultural production, particularly in the western San Joaquin Valley [6], where alluvial soils are naturally high in salts due to their marine origin from the Coastal Range parent material [7].
In the recent past, some researchers investigated the tolerance of different pistachio rootstocks to various salinity levels [8,9,10] and assessed their behavior and performance under field conditions [11]. However, no information is currently available on how salinity affects the actual water use of micro-irrigated pistachio orchards. This information is becoming increasingly important to help growers better manage irrigation and leaching practices in salt-affected areas, especially in the future as fresh water will continue to be limiting due to recurring droughts and environmental regulations.
Pistachio trees can transpire large water amounts under non-stress conditions [12], where mid-summer evapotranspiration ( ET ) rates are significantly higher than many other deciduous species [13]. The scientific literature reports maximum crop coefficient ( K c ) values for mature, non-stressed pistachio orchards ranging from 0.8 [14], to 1.19 [15], and up to 1.36 [16] during peak water use months (July and August). These values come from research studies conducted in surface and sprinkler-irrigated pistachio orchards in Turkey, California, and Spain, respectively. The large variability in K c values almost certainly reflects different growing conditions and stresses, differences in tree vigor and health, and irrigation practices, but also reveals uncertainty about the actual pistachio’s water needs. The uncertainty becomes even greater when orchards are grown on marginal soils with micro-irrigation and low-quality water, given that low soil osmotic potential can reduce water and nutrient uptake, stomatal conductance, [17] and transpiration [18,19,20,21]. To compensate for the lower osmotic potential in the soil solution, plants synthesize and accumulate solutes inside cells. This osmotic adjustment requires metabolic energy, as ions are actively transported across membranes and then compartmentalized, penalizing plant growth [22,23]. Ultimately, salinity will result in reduced plant growth, lower yields, and crop failure in severe cases [24]. Salinity may also cause specific-ion toxicity (e.g., Na+, Cl and boron), and in some cases upset the nutritional balance of plants.
The salt composition of the soil water also influences the composition of cations on the exchange complex, potentially affecting soil permeability and tilth. Sodic soils, those where Na+ represents a high fraction of the adsorbed cations, can cause the degradation of soil structure leading to reduction of water infiltration. The impact of sodicity on soil physical conditions depends on the salinity and sodicity of the irrigation water. As sodicity increases and salinity decreases, soil aggregates become less stable causing them to disperse, thereby reducing infiltration rates [25]. Sodicity, therefore, can indirectly affect tree performance due to effects on soil structure. Sodic soils have a smaller pore size distribution, which reduces the hydraulic conductivity, increases soil strength, and reduces oxygen concentration and diffusion in the soil. This can create stress to roots, as anoxia or hypoxia conditions can impair root functions, i.e., both water and nutrient uptake.
Understanding the combined impacts of salinity and sodicity on tree water use is complex due to various effects on plant performance and soil. Reductions in canopy growth and ET are tightly interrelated and can reciprocally affect each other, magnifying the decrease of water use by plants exposed for long time to saline conditions [26]. Reductions in canopy size under salinity can directly reduce ET, as documented in Reference [27].
The majority of studies on the effect of salinity on ET were conducted on field crops [27,28,29] or on potted young trees [30,31,32]. However, the review of literature shows that no substantial research has been done so far to study the actual water use of pistachio orchards affected by long-term saline/sodic conditions. To fill this knowledge gap, a field study was initiated in spring 2016 and conducted over the course of 2016 and 2017 to measure the actual evapotranspiration (ETa), the fraction of photosynthetic active radiation ( fPAR ) intercepted by the tree canopy, and the nut yield in two mature, drip-irrigated commercial pistachio orchards grown on non-saline and saline-sodic soils, respectively. The saline-sodic orchard features large spatial variability of canopy size and fractional canopy cover, which likely results from highly variable soil water and salinity/sodicity. Field measurements collected at these two study orchards were analyzed and compared with the aim to quantify the reductions in tree growth, canopy size, light interception, actual evapotranspiration, and nut yield due to long-term exposure of pistachio trees to saline and saline-sodic conditions.

2. Materials and Methods

Two mature commercial pistachio orchards, both located in Kings County (in the southern portion of the SJV), were selected and instrumented in May 2016 with field sensors to collect data on various parameters of the surface energy balance over the course of the crop seasons 2016 and 2017, from late May to early October. The data collection also included multiple field surveys with ground equipment to characterize salinity (ECe) and other relevant soil parameters, and determine the fPAR intercepted by the tree canopy, and the fresh nut yield.
The sections below provide a description of the main characteristics of the study orchards, as well as of the methods and tools used for the collection and analysis of field datasets.

2.1. Characteristics of the Southern San Joaquin Valley and of Study Orchards

The southern region of the SJV comprises the counties of Madera, Fresno, Tulare, Kings, and Kern. It has a Mediterranean climate, with rainfall occurring mostly during winter months (November through February).
The two study orchards are of Kerman cultivar grafted onto Pioneer Gold 1 (PG1) rootstock, and are drip-irrigated with dual driplines. One orchard has non-saline (NS) soil and the other has saline/sodic-affected (S) soil.
The non-saline orchard is a 30-ha block located in the area of Hanford, CA (36°15′ N, 119°30′ W, elevation of 77 m above sea level), with mature trees planted in 1985 with a 6 m × 5 m spacing on a sandy-clay loam soil (53% sand, 26% silt, and 21% clay). The soil in this orchard has a saturation percentage (SP) of 32%, average electrical conductivity of the saturated soil extract (ECe) of 2.7 dS m−1, sodium adsorption ratio ( SAR ) of 4.3, and average pH of 7.6. The irrigation system has dual driplines with 10 Netafim Uniram pressure-compensating drippers per tree with nominal flowrate of 3.8 l h−1. The actual application rate is 1.33 mm h−1, with average emitters’ flowrate of 4.0 l h−1 and distribution uniformity (DU) of 0.95, where all characteristics were measured in summer 2016 by a professional irrigation system evaluation team that used the micro-irrigation evaluation procedure developed by the Irrigation Training and Research Center (ITRC) of CalPoly [33].
The saline/sodic-affected orchard is a 57-ha block located in the area of Lemoore, CA (36°14′ N and 119°56′ W, elevation of 72 m above sea level), and has mature trees planted during the late 1980s with 5 m × 5 m spacing on a clay soil (27% sand, 29% silt, and 43% clay). The soil has SP ranging from 27% to 117%, ECe ranging from 1.7 to 14 dS   m 1 , SAR ranging from 7 to 45, and average pH of 7.6. The micro-irrigation system consists of dual driplines with eight Netafim Triton X pressure-compensating drippers per tree with nominal flowrate of 1.9 l h−1. The actual system application rate is 0.43 mm h−1 with average emitters’ flowrate of 1.4   l   h 1 and DU of 0.87, also measured in summer 2016 by the professional irrigation system evaluation team using the Cal Poly ITRC procedure [33].
In both the orchards, the irrigation water applied by growers was measured and recorded using magnetic flowmeters (Sensus iPEARL, Raleigh, NC, USA) installed along both the driplines serving the central tree row within the footprint area of each ET station. The analysis of recorded flowmeter data (Table 1) showed that irrigation water was applied every 2 to 3 days on average, and that about 250–400 mm was applied before starting the ET data collection. Part of this water was applied before leaf-out to refill the soil profile and part was applied from leaf-out to the 25th of May to meet the ET requirements during that period. Soil moisture was monitored by means of granular matrix moisture tension sensors (Watermark, Irrometer Company, Inc., Riverside, CA, USA) installed at the depths of 0.40 m, 0.90 m, and 1.20 m. Growers scheduled irrigation based on a combination of ET and soil moisture, and maintained the moisture tension in the root zone consistently above −50 centibars [34]. This value is well above the recommended maximum soil moisture tension to prevent water deficit for deciduous tree crops [35] and above the moisture tension corresponding to 50% of the available water for both sandy-clay loam soil (−140:−160 kPa) of the non-saline orchard, and clay soil (−220:−240 centibars) of the saline/sodic-affected orchard [36].
Depending on the orchard and on the season, between 719 and 965 mm were applied in the period of ET data collection (25 May–10 October). The total seasonal applied irrigation water ranged from 1125 to 1222 mm and was consistently higher than the reference ET (ETo) obtained from the Spatial CIMIS website for each experimental orchard [37].
Despite the two sites being about 40 km apart, their ETo is very similar due to the homogeneous orographic condition of the SJV.

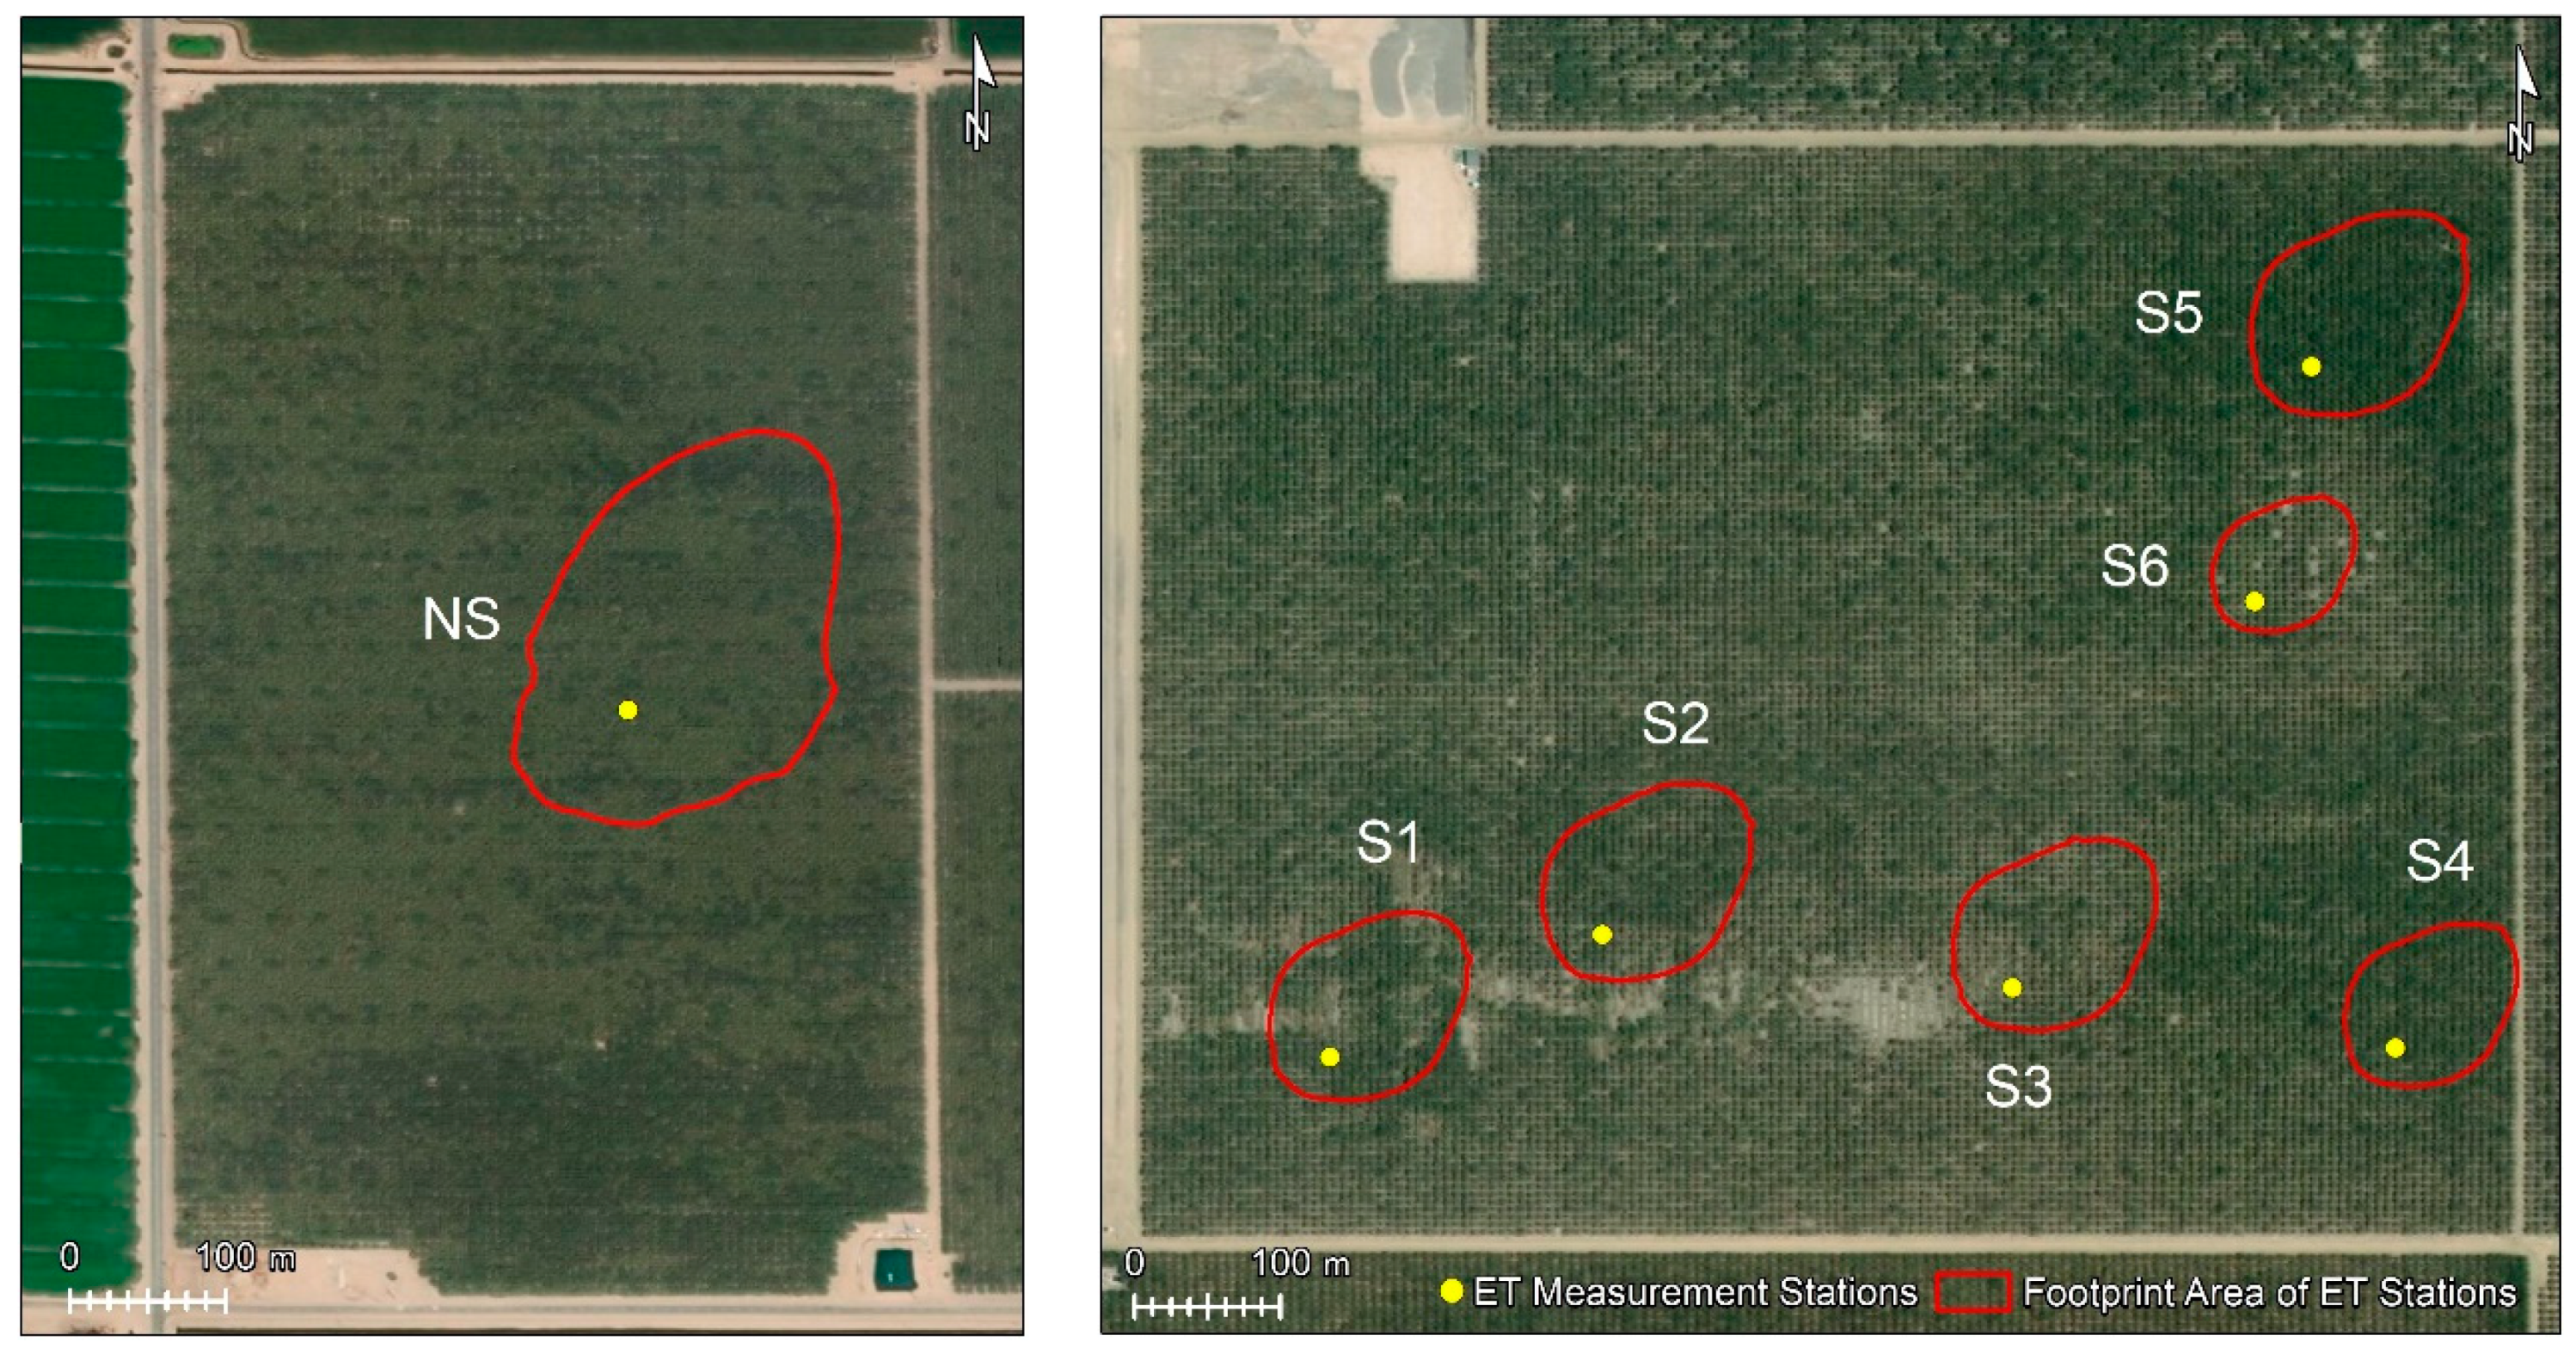
2.2. ET Measurements

The actual crop evapotranspiration ( ET a ) was determined using the residual of energy balance (REB) method that calculates the latent heat flux ( LE ) as the residual from data collected with research-scale micro-meteorological sensors. Equation (1) states that
LE = R n G H ,
where LE is the latent heat flux ( MJ   d 1 m 2 ), R n is net radiation ( MJ   d 1 m 2 ), G is soil heat flux density ( MJ   d 1 m 2 ), H is sensible heat flux ( MJ   d 1 m 2 ), and λ is the latent heat of vaporization ( MJ   kg 1 ). ET a is calculated via Equation (2) by dividing the LE by the coefficient λ = 2.45   MJ   kg 1 (the energy required to vaporize 1 kg of water from the liquid state) to obtain the actual crop evapotranspiration rates in kg d−1 m−2, which is numerically equivalent to mm d−1.
ET a = LE λ
Two different types of ET stations were used in this field study. The first type is a full-flux station (Full), consisting of a sonic anemometer used to compute the sensible heat flux (H) using eddy covariance (EC) methodology and fine-wire thermocouples to determine uncalibrated H (H′) using the surface renewal technique. The sonic anemometer data were corrected by increasing the magnitude of the H estimate from the RM Young sonic anemometer by 12%, based on the article by Kochendorfer et al. [38]. The H′ is highly correlated with H, and a calibration factor is determined by computing the slope of the least-squares regression (α) of H versus H′ separately for positive and negative H′. Then, the product of α and H′ provides a good estimate of the half-hourly sonic H values. The second type of station is a lite-flux station (Lite) that uses only thermocouples and SR methodology to calculate half-hourly H′ values, which are multiplied by the α calibration factor determined from the full station. The thermocouples are mounted at the same height above similar canopies for both the full and lite stations. Details on the surface renewal and sonic anemometer analysis used in this research, and their advantages, are fully discussed in Shapland et al. [39].
For the full stations, half-hourly LE is computed as: LE = R n G H using measured net radiation, ground heat flux, and sonic H. The daily LE is determined by summing the 48 half-hourly values of LE   ( MJ   m 2 ) . For the lite stations, the daily LE is determined by summing the 48 half-hourly values of LE = R n α H ( MJ   m 2 ) ; assuming that the daily total ground heat flux G = 0 . Even though the half-hourly LE for the lite stations is not strictly correct, the daily LE provides a good approximation for daily latent heat flux. The energy needed to vaporize 1.0 mm depth of water from a 1.0 m2 surface area is approximately 2.45   MJ   m 2 , so the daily actual crop ET   ( mm   d 1 ) is computed as: LE / 2.45 for LE in MJ   m 2 d 1 .
The full stations include: (a) A net radiometer (NRLite2, Kipp & Zonen Inc., Delft, The Netherlands) to measure net radiation (Rn) approximately 1 m above the tree canopy; (b) a three-dimensional sonic anemometer (RE, RM Young Inc., Traverse City, MI, USA) to measure sensible heat flux density (H) with the eddy covariance methodology, and two 76.2-μm diameter Chromel-Constantan thermocouples (model FW3 from Campbell Scientific, Logan, UT, USA), both mounted approximately 1 m above the canopy, to measure H at 10 Hz frequency with the surface renewal methodology; (c) three soil sensor packages to calculate the ground heat flux density (G), consisting of a soil heat flux plate (HFT3, REBS, Bellevue, WA, USA), three averaging soil temperature thermocouple probes (Tcav, Campbell Scientific Inc., Logan, UT, USA), and three soil moisture sensors (EC5, Decagon Devices, Pullman, WA, USA). For each package, the ground heat flux plate and soil moisture sensors were installed horizontally at 0.05 m below the soil surface, whereas the probes of the Tcav sensor were installed at an angle from 0.04 to 0.01 m depth and were distributed on both sides of the HFT2 and EC5 sensors in a line perpendicular to the tree rows.
One of the G packages was located in a tree row where the surrounding soil was wetted when the drip system operated. The second G package was located at 1/3 of the distance between the row and the first G package, while the third G package was located at 2/3 of the distance to the next row. The ground heat flux at the soil surface was estimated using a continuity equation as described in Reference [40] using the mean HFT3 measurements, the change in temperature of the 0.04 to 0.01 m temperature measurements, and the volumetric water content.
For the full stations, some additional meteorological sensors were used including a rain gauge (TR-525M, Texas Electronics, Dallas, TX, USA), a pyranometer (SP Lite 2, Kipp & Zonen Inc., Delft, The Netherlands), and an air temperature and relative humidity probe (HC2S3, Rotronic Hauppauge, New York, NY, USA). All the above-ground individual sensors were mounted on painter scaffolding (1.5 × 2.1 m frames) over posts driven approximately 1 m into the ground. The height of the scaffold tower was approximately 5.5 m, and power for all the sensors was provided by a 40-w solar collector panel connected with a 100 A battery for storage. The micro-meteorological data were collected, stored, and processed with a CR3000 data logger (Campbell Scientific, Logan, UT, USA).
The lite ET stations consisted of a net radiometer (NRLite2, Kipp & Zonen Inc., Delft, The Netherlands), two 76.2-μm diameter Chromel-Constantan thermocouples (model FW3 from Campbell Scientific, Logan, UT, USA) to calculate H with the surface renewal theory [41,42,43], and no G packages. These individual sensors of the lite stations were installed approximately 1 m above the orchard canopy on a steel-tripod mounting with power provided by a 20-w solar collector panel connected with a 26 A battery for storage.
In both types of ET stations, direct two-way communication with the station was possible using a cellular phone modem (RavenXT, Sierra Wireless, Richmond, BC, Canada).
One full ET station was installed at the non-saline orchard (NS), given the spatially uniform tree canopy conditions. At the saline-sodic orchard, one full station (S2) and five lite stations (S1 and S3–S6) were installed (Table 2), which provided sufficient coverage to capture the spatial variability of soil and tree canopy conditions.
The ET flux footprints for all stations were determined using the method proposed by Kljun et al. [44]. The field datasets collected during the 2016 and 2017 growing seasons showed, as expected, that the main contribution to flux measurements came from the areas north to north-east of all the ET stations. The footprint areas contributing 90% of the measured fluxes were between 80–160 m wide in the east-west direction and 90–180 m long in the north-south direction. Figure 1 shows the footprint areas (in red circles) for each ET station calculated for the entire growing season 2017 in both the study orchards. The footprint evaluation was conducted to ensure that all fluxes measured by the full and lite ET stations were generated from specific areas of interest within the study orchards.
Figure 2 shows an example of the scatter of the H versus H′ data obtained during the entire 2016 season in the non-saline orchard. Alpha calibrations were calculated separately for unstable conditions (upward fluxes), represented by positive H, and for stable conditions (downward fluxes), represented by negative H. It is well known that unstable conditions enhance turbulence with respect to stable ones, so separate calibration is common in literature [41,45,46].
The standard errors were 26 W m−2 for negative and 48 W m−2 for positive H′, which are quite small. The 30-min H values of the non-saline orchards from surface renewal were adjusted using the observed correction factor α of 0.95 for the positive values and 0.26 for the negative values. In the non-saline orchard, the coefficient 1.03 was used to correct the positive H values from SR, and 0.53 to correct the negative ones [47].

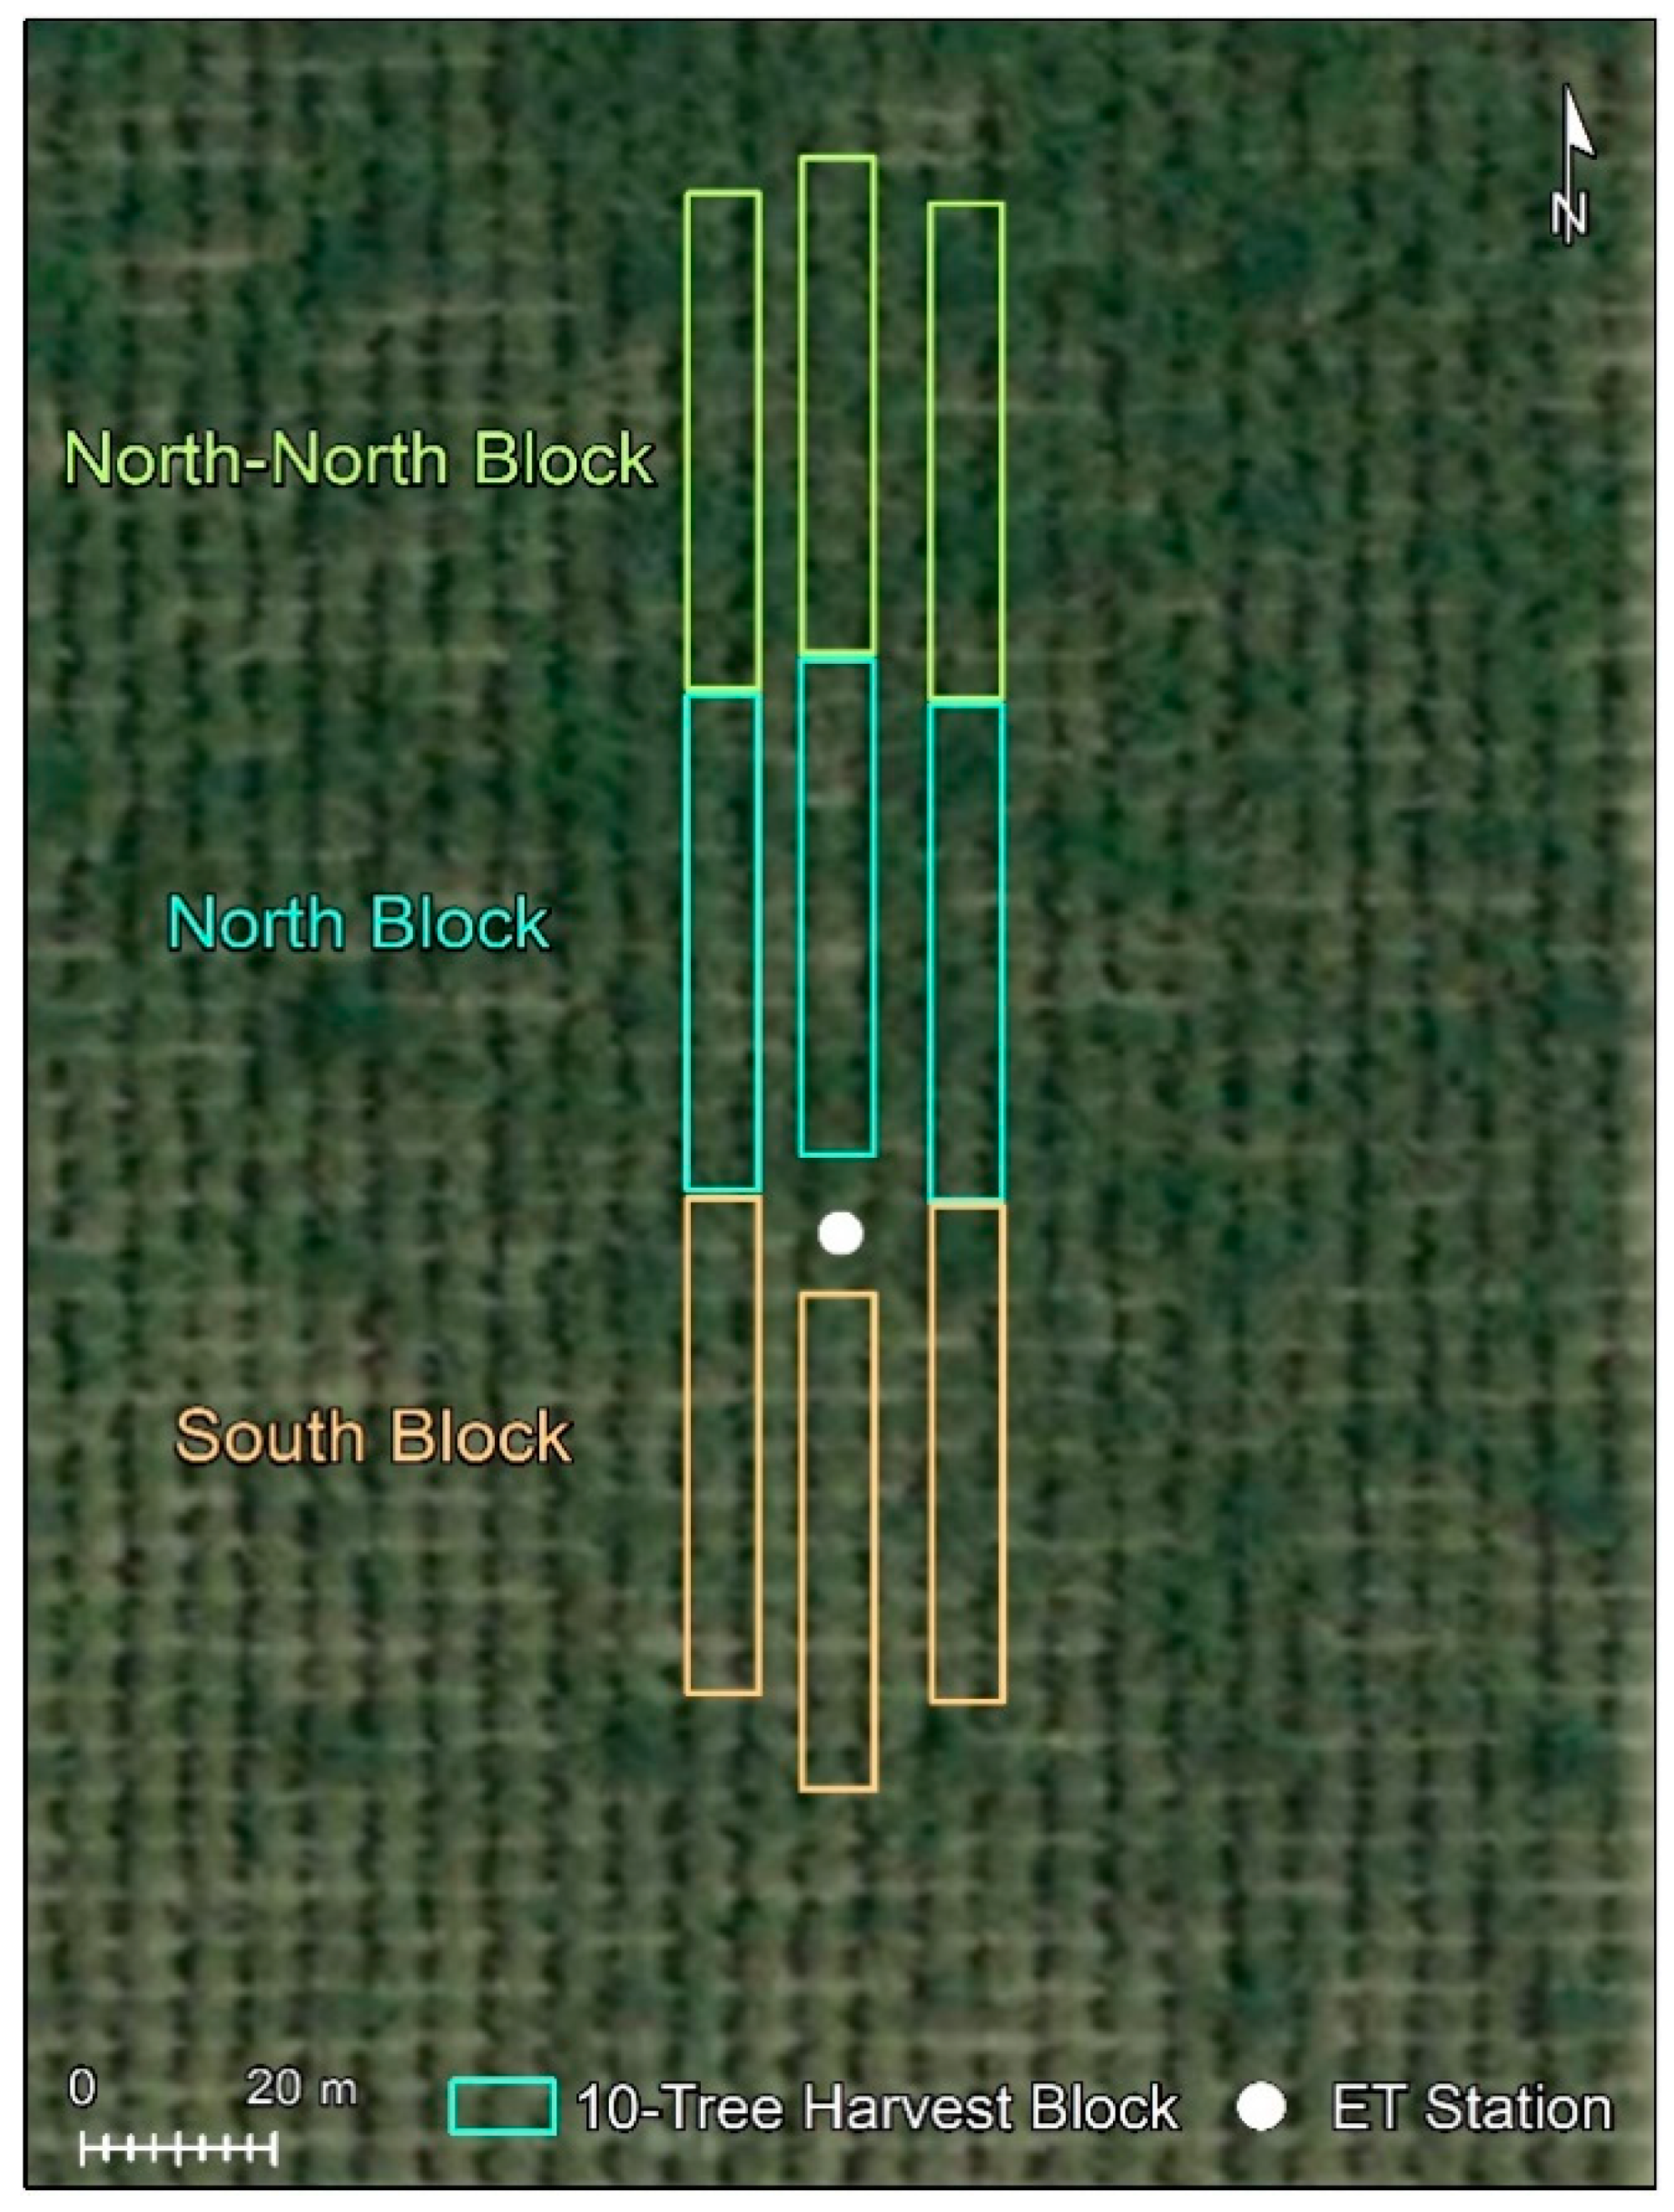
2.3. PAR Light Interception by the Tree Canopy

During the course of the 2016 and 2017 crop seasons, multiple field surveys were conducted at the two study orchards to measure the light interception by the tree canopies in the footprint areas of the ET stations. Specifically, the natural light in the PAR region (400–700 nm) below the canopy (PARb) was measured during the surveys using a series of AccuPAR LP-80 ceptometers (Decagon Devices, Inc., Pullman, WA, USA) connected to a datalogger (CR3000, Campbell Scientific, Logan, UT, USA) and mounted at a height of 0.4 m from the ground level on two side-arm bars of a Kawasaki Mule utility vehicle or Mobile LightBar (MLB) [48]. Measurements of light interception were taken during clear skies at solar noon ± 1 h. The MLB is normally operated at a speed of about 2.8 m s−1, scanning the light transmitted by the canopy every 0.3 m down the orchards rows and integrating segments of 0.4 m across the rows [49].
A differential GPS kept track of the MLB scan position within the orchard, and full sun PAR measurements ( PAR a ) were simultaneously recorded at the ends of each rows. In addition, a data logger (Hobo U30; Onset Computer, Pocasset, MA, USA) connected to a PAR sensor (S-LIA-M003, Onset Computer, Pocasset, MA, USA) was set up to log at 1-min intervals outside of the orchard in an unobstructed location nearby. The fPAR was then calculated using Equation (3) reported below:
fPAR = 1 PAR b PAR a .
Measurements were performed on both sides of each ET station including six rows to the east and six rows to the west. Data were recorded with a datalogger and then analyzed using a custom program developed in R programming language [50].

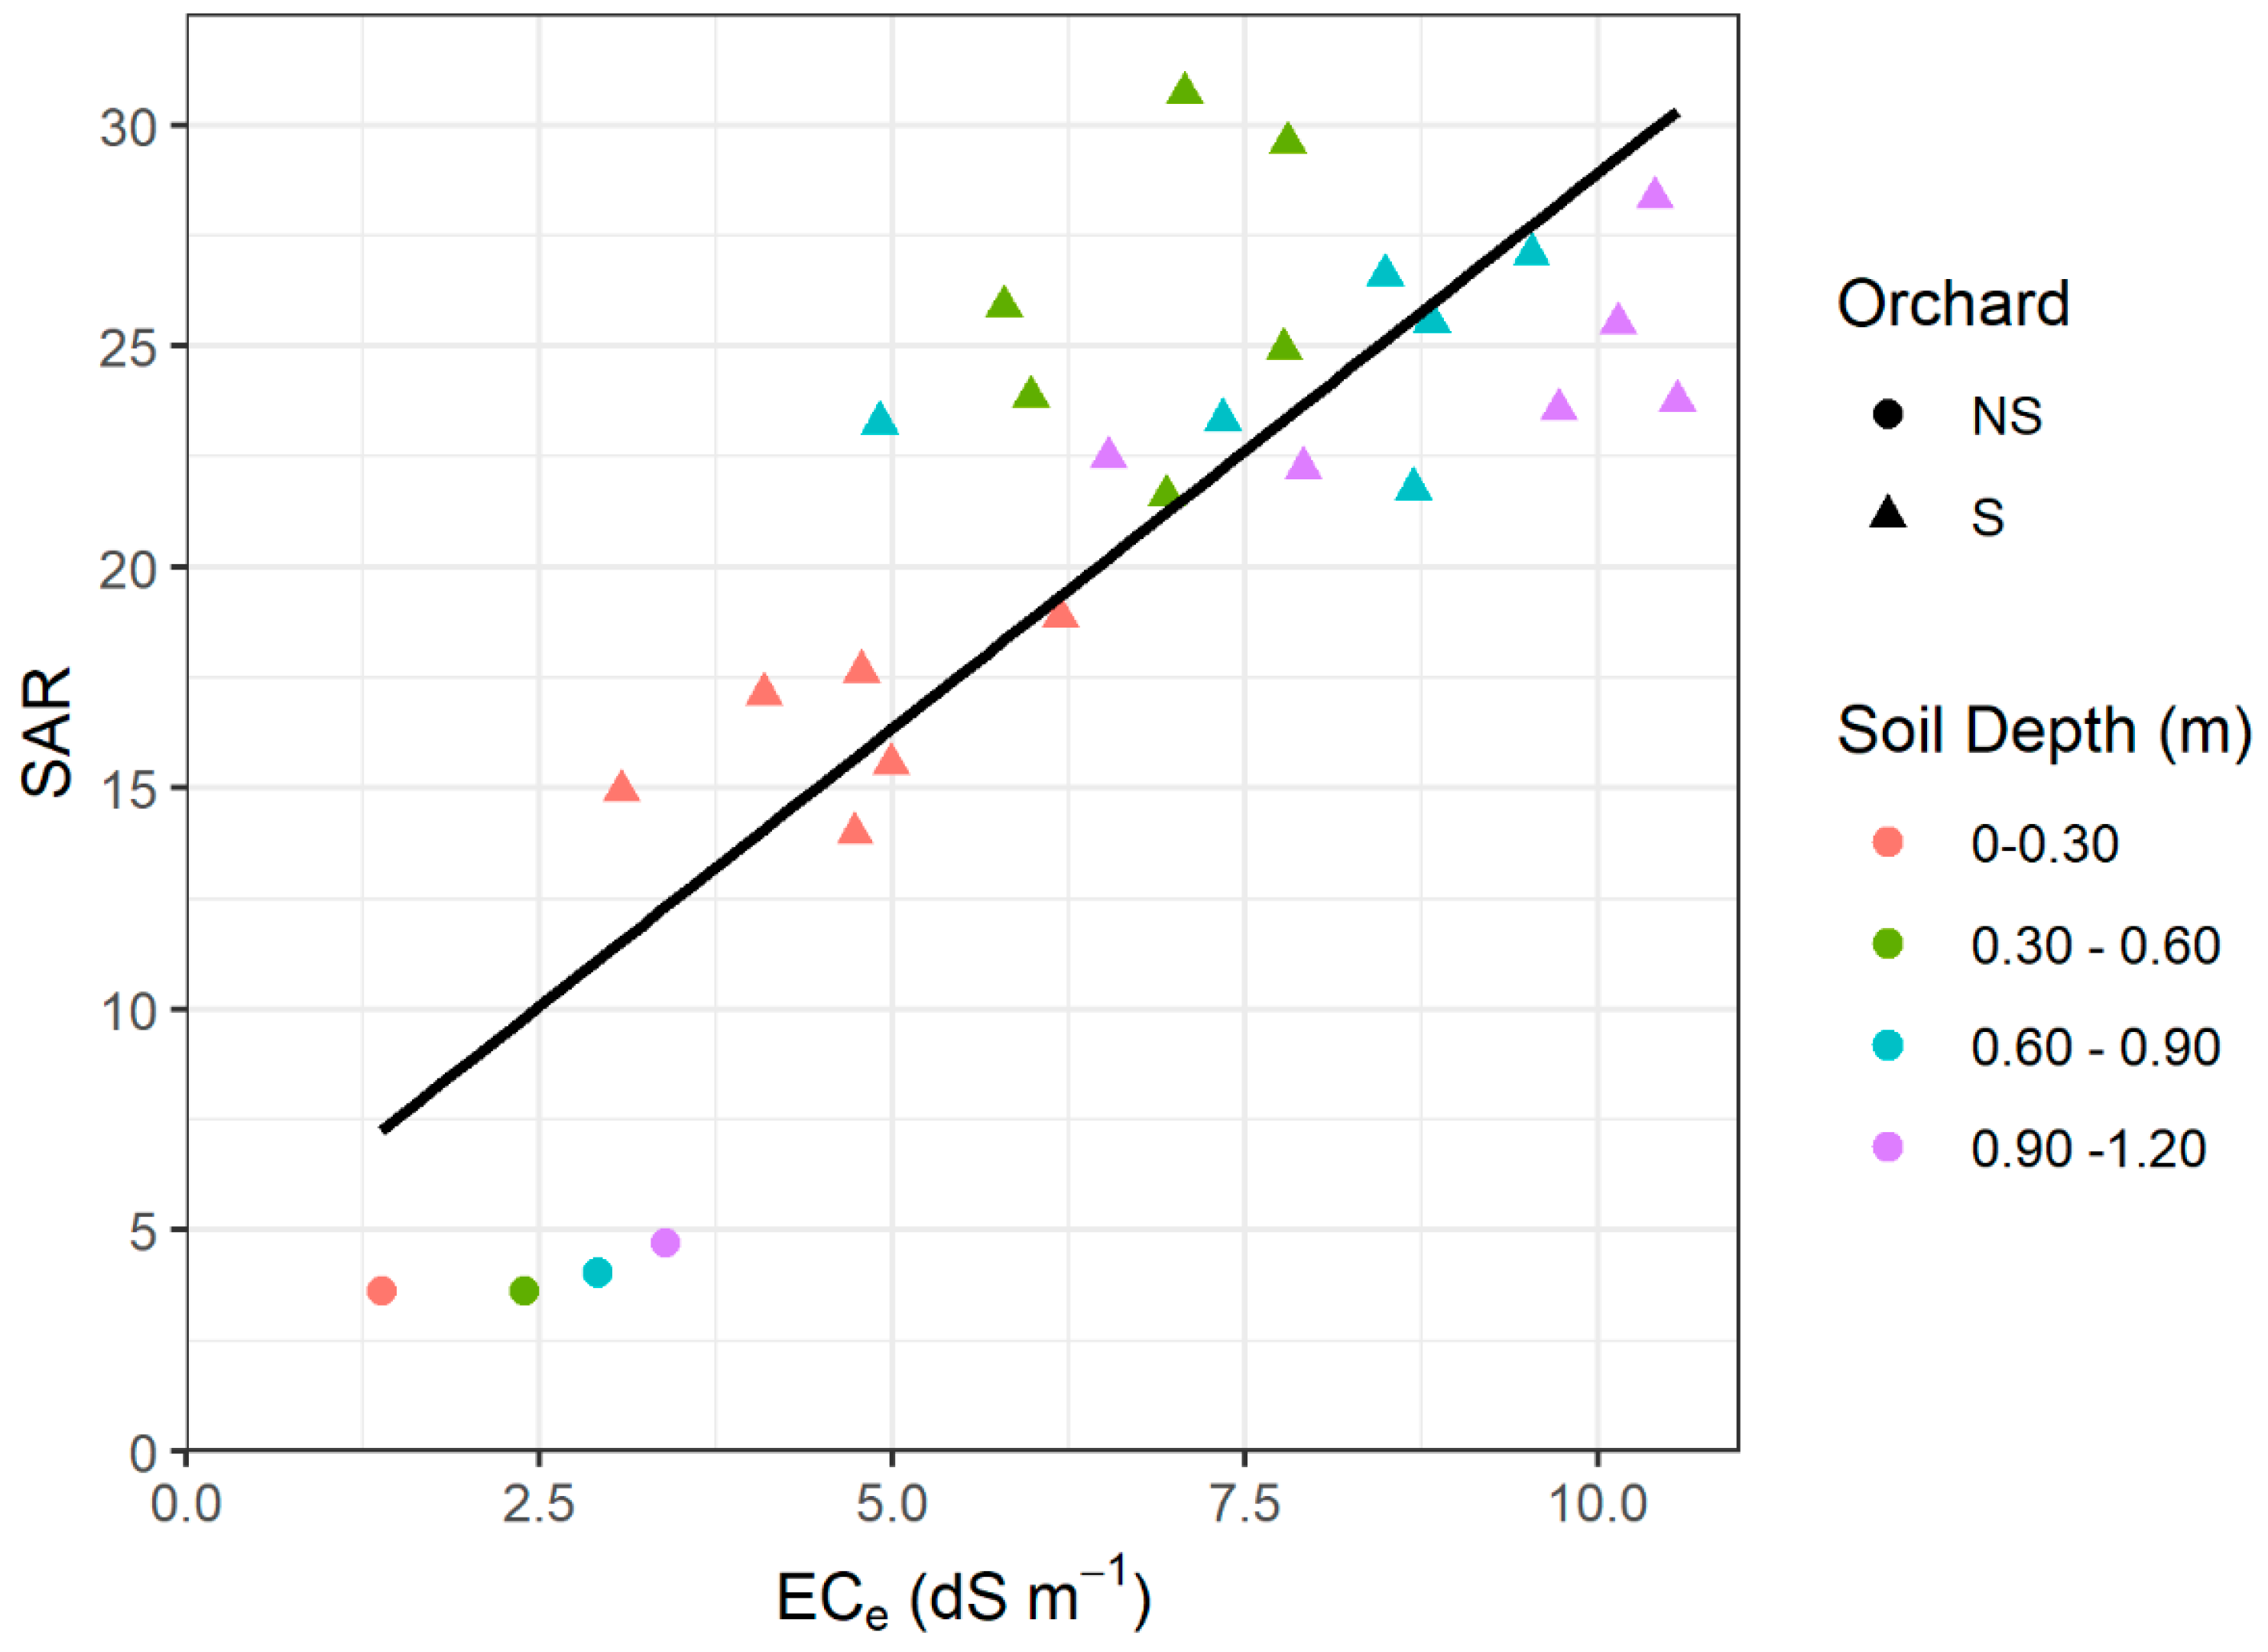
2.4. Assessment of Soil Salinity

At both the study orchards, the soil features were surveyed and characterized within the footprint areas around each ET station, i.e., one footprint area at the non-saline orchard and six footprint areas in the orchard affected by salinity/sodicity. The footprints measured approximately 200 × 200 m in size and were centered at each ET station. Surveys of soil-apparent electrical conductivity (ECa) were conducted in September 2016 using mobile electromagnetic induction (EMI) equipment following protocols and guidelines developed by the U.S. Salinity Laboratory of the United States Department of Agriculture (USDA) for field-scale salinity assessment [51,52,53,54]. Measurements of ECa were taken along the irrigation driplines with an EM38 Dual Dipole Electrical Conductivity Meter (Geonics Ltd., Mississauga, Ontario, Canada), in the horizontal ( EM h ) and vertical ( EM v ) dipole modes to provide shallow (0 to ~0.75 m) and deep (0 to ~1.5 m) measurements of ECa, respectively.
The ECa measurements were georeferenced with sub-meter accuracy using a Trimble Pro-XRS GPS system (Trimble, Sunnyvale, CA, USA). At the non-saline orchard, ECa was measured at 686 locations across 10 parallel transects. At the saline orchard, ECa was measured at 588 locations (18 transects) at station S1; 629 locations (20 transects) at S2; 833 locations (14 transects) at S3; 839 locations (14 transects) at S4; 746 locations (20 transects) at S5; and 680 locations (19 transects) at S6. Immediately after each EMI survey was completed, the spatial variability of ECa data around each ET station was used to identify 12 sampling locations per footprint area using the response surface sampling design (RSSD) algorithm [55] in ESAP-95 version 2.01 [56]. This is often referred to as “ECa-directed soil sampling” in the literature [54], and it is based on the repeatedly validated hypothesis that the spatial variability of the ECa measurements is a proxy for the variability of soil properties influencing the ECa value, such as water content, texture, and salinity [53]. The RSSD algorithm identifies soil sampling locations for ECe analysis so that the frequency statistics of ECa are fully represented. Concurrently, the algorithm maximizes the distance between selected soil sampling locations to avoid (short-scale) spatial autocorrelation.
Soil cores were collected at 0.3 m depth increments down to 1.2 m at each sampling location and soil samples were sealed in plastic bags. Gravimetric water content (%) was determined on subsamples from each soil sample. The remaining soil was air-dried and ground to pass through a 2-mm sieve. Soil was wetted to saturation and saturation percentage (SP, %) was recorded. The water extracted from the saturated soil paste was analyzed for electrical conductivity (ECe, dS   m 1 ), pH, and sodium adsorption ratio (SAR).
The methods used for the soil analyses can be found in methods of soil analysis [57,58,59]. Adjusted SAR (SARadj) and cation ratio of structural Stability (CROSS) were also determined, following methodologies indicated by Lesch and Suarez, and Sposito et al., respectively [27,60]. SAR has been the standard for predicting soil permeability hazard, and is defined as the concentration of Na+ divided by the square root of the averaged Ca2+ and Mg2+ concentrations, all expressed as mmolc L−1 [25]. More recently, the cation ratio of soil structural stability (CROSS) has been suggested as a better indicator of stability, as it adds the dispersing power of K+ and discounts the flocculating power of Mg2+ [61]. Several papers have addressed the CROSS index and a CROSS optimization expression was suggested as the most reliable [62], which is presented in the Equation (4) below:
CROSSopt = Na + 0.335 K ( Ca + 0.0758 Mg )
In this expression, K+ is added to the numerator where it has about an additional 1/3 of the dispersive effects as Na+. Similarly, the flocculating power of Mg2+ in the denominator is diminished by over an order of magnitude relative to Ca2+. As such, CROSS > SAR for most irrigation waters [63]. This more conservative CROSS expression can be a better predictor of the effect of irrigation water chemistry on soil structure, which adversely affect water infiltration.

2.5. Measurement of Nut Yield and Assessment of Tree Performance

The nut yield was measured at the non-saline and saline/sodic sites during the harvesting operations, from blocks of trees (south, central, and north) located within the footprint areas of each ET station (Figure 3), each consisting of 10 female trees. The trees immediately north and south of the ET station were not harvested to avoid the risks of shake-harvest damaging field instrumentation. The trees were mechanically harvested, and the resulting nuts were collected in bins and weighed.
A composite index named relative performance reduction (RPR) was developed and used to quantify the decline of tree performance resulting from relative decreases in ET, nut yield, and fPAR at each saline/sodic affected site with respect to those of the non-saline orchard. The RPR index was calculated based on Equation (5) below:
RPR = ET rel + Y rel + fPAR rel 3 ,
where ET rel is the relative actual pistachio ET, Y rel is the relative nut yield, and fPAR rel is the relative fraction of the photosynthetic active radiation intercepted by the tree canopy in the saline/sodic sites with respect to the non-saline orchard.
ET rel is calculated as [ 1 ( CET a / CET m ) ], with CET a being the actual seasonal cumulated pistachio evapotranspiration measured at the various saline/sodic sites, and CET m the actual seasonal cumulated ET measured at the non-saline orchard (i.e., maximum actual cumulated pistachio ET among all sites). Since ETo was the same in the two experimental orchards (Table 1), differences in ETa were not associated to dissimilar environmental request. Similarly, Y rel is calculated as [ 1 ( Y a / Y m ) ] with Y a being the actual nut yield measured within the various saline/sodic sites and Y m the actual nut yield measured at the non-saline site (i.e., maximum nut yield among all sites). fPAR rel is calculated as [ 1 ( fPAR a / fPAR m ) ], with fPAR a being the actual fPAR measured at full tree canopy development at the various saline/sodic sites and fPAR m the actual fPAR measured at the non-saline site (i.e., maximum fPAR among all the sites).
The calculation of the RPR enabled to conduct a single statistical analysis for evaluating the effect of various soil parameters on tree performance, rather than considering three separate analyses, one for each individual tree performance parameter (i.e., fPAR, ETa, Nut Yield). Since these parameters are inter-related and can reciprocally affect each other, the RPR provide a more comprehensive index on the effect of salinity-sodicity on pistachio tree growth, water use, and nut production. However, the calculated RPR values must be referred to the orchard-specific conditions of the study sites, given the strong influence of site-specific growing conditions and the adaptation of pistachio tree to those long-term conditions.
The statistical analysis of the field datasets was conducted with ANOVA test using R program [50]. Differences among the study sites were determined with the Tukey test, with statistical significance set at p ≤ 0.05. The significance of correlations was evaluated at the 0.05 confidence level among the RPR values and various soil parameters measured at different depths using the values of r and p-value calculated following the Students t-test.

3. Results

3.1. Soil Parameters

The values of the apparent electrical conductivity obtained with measurements taken in the horizontal and vertical dipole modes, i.e., ECa EMh and ECa EMv, across the two surveyed study orchards had a significant (p < 0.05) positive Pearson correlation coefficient with the gravimetric water content (WC), SP, and SAR for all four sampled depths. As expected, the ECe had significant positive relationships with ECa EMh and ECa EMv (Table 3), which indicate that the laboratory data from the 12 soil sampling locations are representative of the different footprint areas [64].
Table 4 reports the values of different parameters determined from the saturation extract of soil samples collected in the saline/sodic orchard versus those of the non-saline orchard.
Soil parameters varied significantly between the two orchards. In the saline-sodic orchard, SAR was 5.2 times higher (mean value of 22 for all sampling locations and depths) than the non-saline orchard (mean of 4.3). The ECe was nearly three times higher in the saline-sodic (mean ECe of 7.1   dS   m 1 ) than the non-saline orchard (mean ECe of 2.7 dS   m 1 ). In the saline-sodic orchard, ECe ranged from 1.6 to 14   dS   m 1 , depending on the sampling location and depth, whereas in the non-saline orchard ECe ranged from 0.6 to 6.4   dS   m 1 . Saturation percentage (SP) and water content (WC) were higher in the saline-sodic orchard, while no differences were observed in the pH value. The CROSS and SAR adj also had significantly higher values in the saline-sodic orchard (25 and 17 versus 5 and 3, respectively).
In the saline-sodic orchard, there is highly variable ECe–SAR combination (Figure 4): As the soil sampling depth increased (from 0 to 1.20 m), ECe increased from 3 up to 11 dS   m 1 , and the corresponding values of SAR increased from 15 up to 30.
In the non-saline orchard, as the sampling depth increased, the ECe increased from 1.2 up to 3.7 dS   m 1 but the SAR values remained around 4.0.

3.2. PAR Light Interception, Nut Yield, and Tree Performance

For both the 2016 and 2017 seasons, the highest fPAR value of about 75% was measured in the non-saline orchard around the end of July (Table 5). In the saline/sodic orchard, the highest fPAR values were observed at the S4 and S5 sites, with average values of 53% in 2016 and 61% in 2017. In contrast, the lowest fPAR values of 26% in 2016 and 32% in 2017 were recorded at S3. The sites S1, S2, and S6 had mean fPAR values of about 45%, 35%, and 33% in 2016 and of 40%, 44%, and 36% in 2017, respectively.
The fresh nut yield measured at the non-saline orchard was 10 kg tree−1 in 2016 and 40 kg tree−1 in 2017, thus showing large year-to-year variations, mainly due to the typical alternate bearing behavior of pistachio (Table 5).
In the saline-sodic orchard, the nut yield ranged from 12 to 23 kg tree−1 in 2016 and from 10 to 24 kg tree−1 in 2017. The site S4 had the highest nut production consistently in 2016 and 2017, whereas the S1 and S3 sites had the lowest nut production in 2016 and 2017, respectively.
The edible percentage of the fresh nut yield was around 34% in 2016 and around 32% in 2017 for both the non-saline and saline-sodic orchards, and differences among sites were not statistically significant [34].
Table 5 reports the values of fPAR , seasonal-cumulated ETa, and nut yield measured within the footprint areas of the different ET sites for the two study orchards. These parameters were used to calculate the values of RPR, which revealed significant differences of tree performance among the various sites. Within the saline-sodic orchard, S4 and S5 were the least-impacted sites with tree performance decreases of 16% (RPR value of 0.16) and 17% (RPR value of 0.17) relative to the non-saline orchard, respectively. The S3 resulted as the most impacted site, with tree performance decrease of 52% (RPR value of 0.52) relative to the non-saline orchard. The sites S1, S2, and S6 were moderately affected, as RPR values ranged from 0.34 (S2) to 0.37 (S6) and 0.40 (S1).

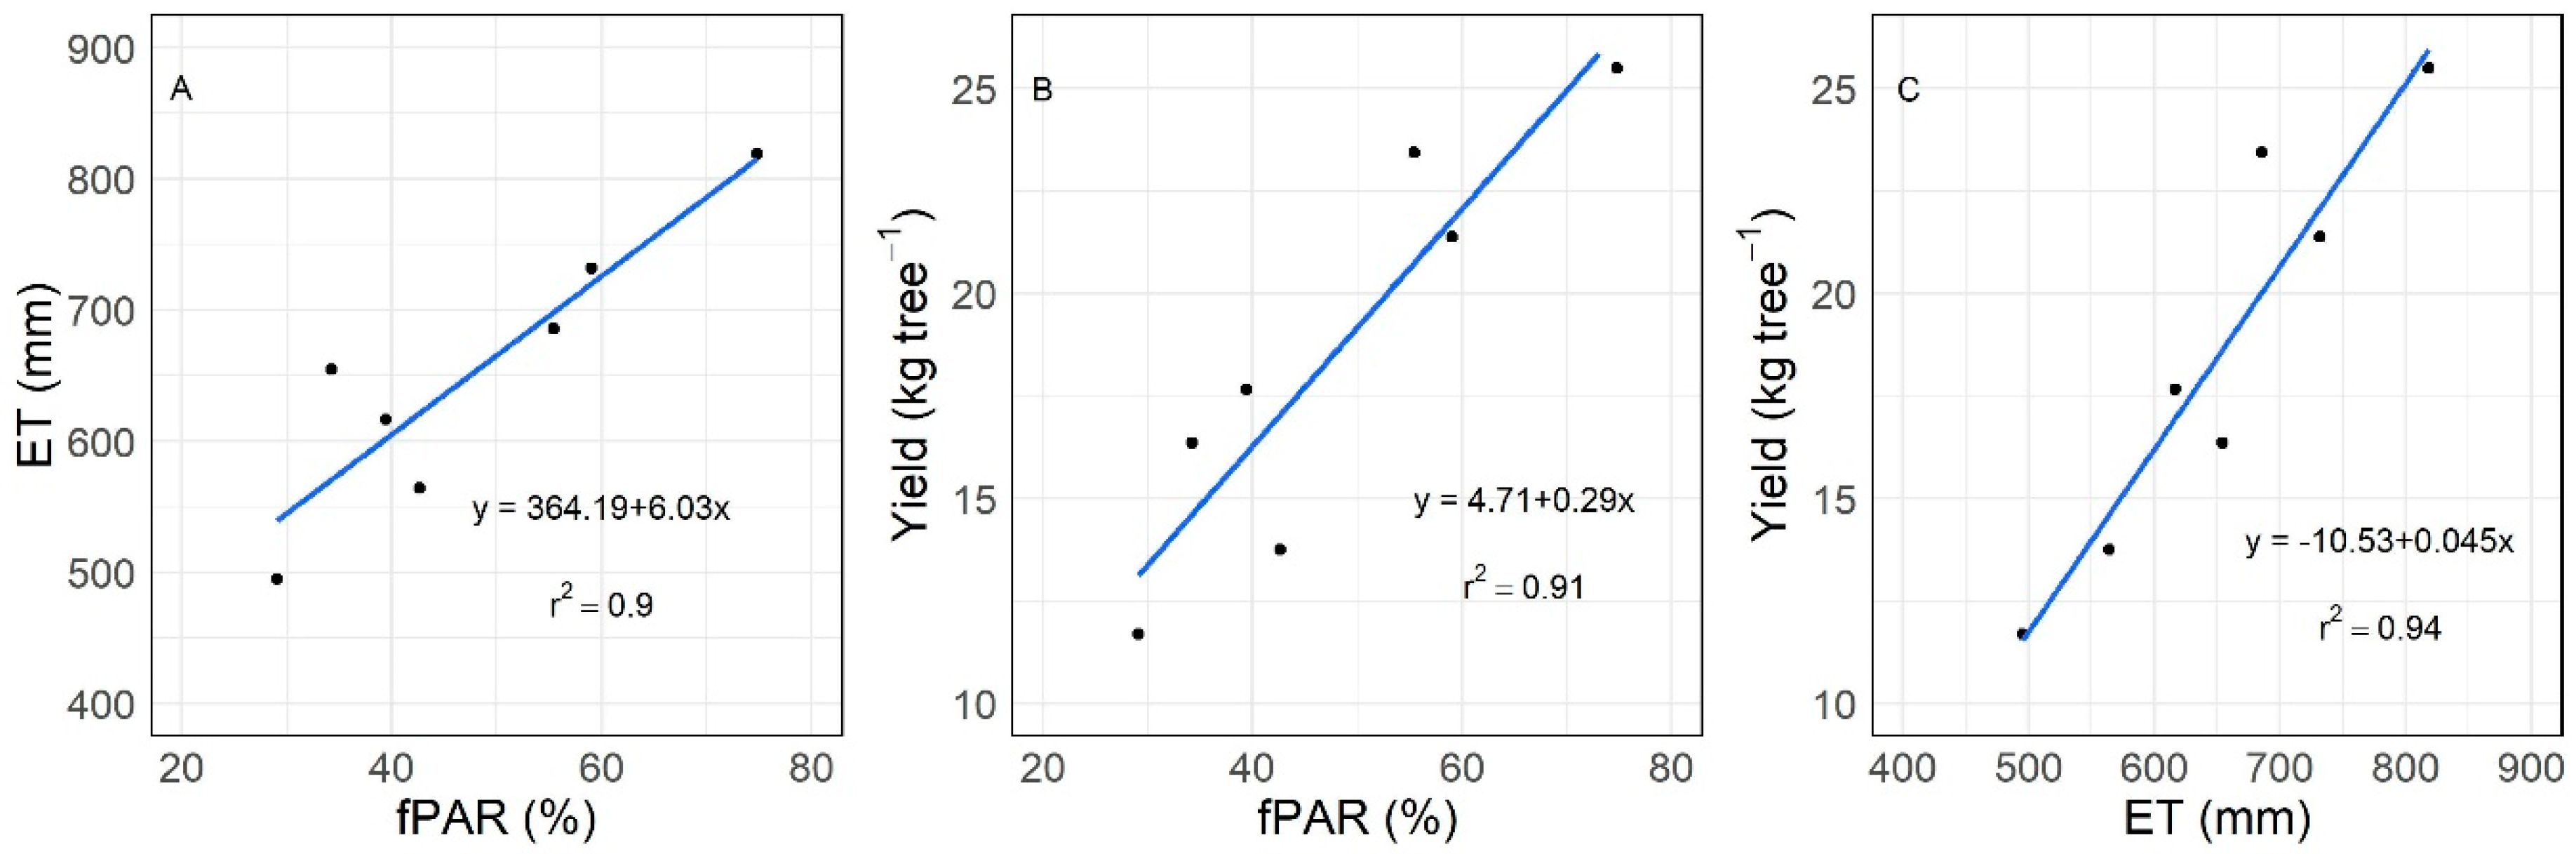
3.3. Relations between fPAR, ET, and Yield

When considering multiple crop-related aspects, significant relations were found among fPAR , seasonal cumulated ETa, and nut yield (values of fresh nut production per tree were averaged over the 2016 and 2017 seasons), with r2 > 0.9 and p-value < 0.001, as shown in Figure 5 below. Specifically, as fPAR decreased from 75% to 30% moving from the non-saline orchard to saline and to saline-sodic sites, the seasonal cumulative ETa lowered from 800 to 500 mm, and the averaged nut yield declined from 25 to 12 kg tree−1.

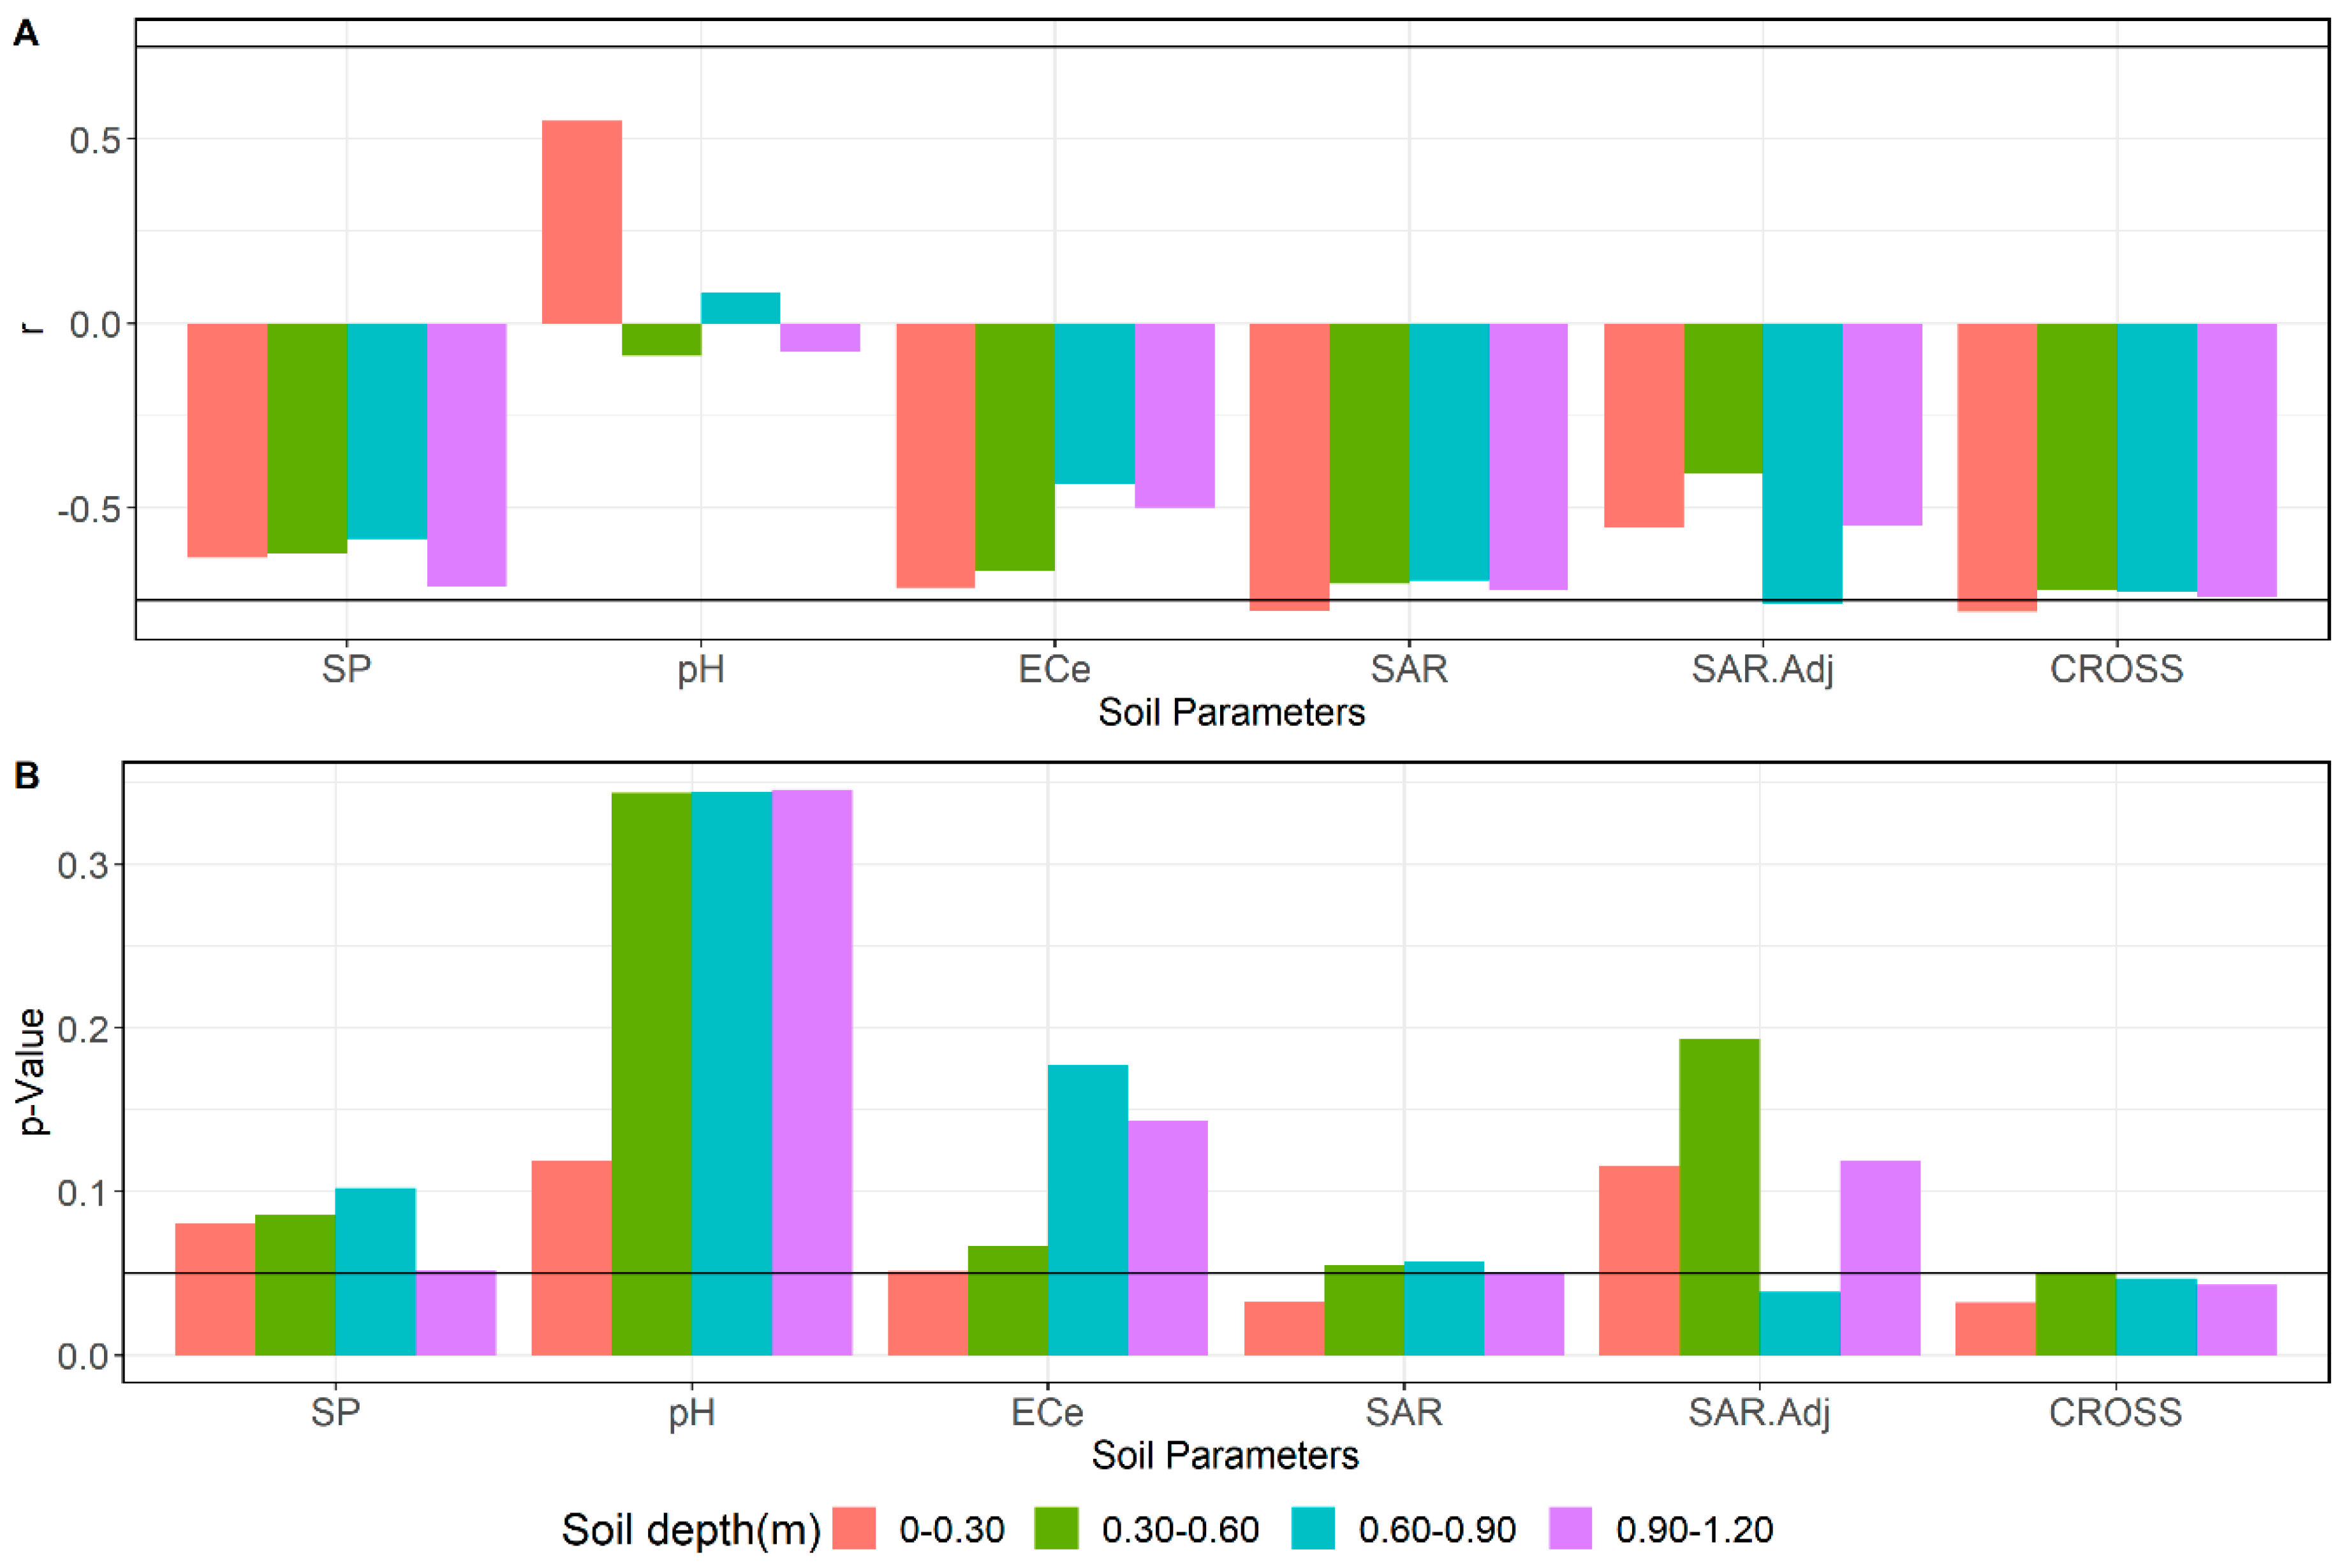
3.4. Relations between Soil Parameters and Tree Performance

The values of RPR at the different study sites were correlated with soil parameters (measured at soil depths ranging from 0 to 1.20 m) as illustrated in Figure 6, which also shows the r and p-values obtained from the Student t-test.
The data analysis revealed that most of the considered soil parameters are negatively correlated with RPR, except pH at the soil depths of 0–0.30 and 0.60–0.90 m. The ECe, pH, SP, and WC were found to be not significantly correlated with RPR, while SAR , SAR adj , and CROSS were found to be significantly correlated with RPR. Values of SAR and CROSS showed significant correlations with RPR only for the soil depth 0–0.30 m, whereas SAR adj showed significant correlation with RPR at soil depth 0.60–0.90 m.
The analysis performed on field data considered the relations among the soil parameters and tree performance significant when r > 0.75, based on the specific sample size (n = 7) at each considered soil depth [65].

4. Discussion

The results obtained in this study indicate that tree performances were impacted by the combined effects of salinity and sodicity. The size of trees grown under medium to high salinity-sodicity was 10% to 40% smaller than that of trees grown in non-saline conditions, as indicated by the lower fPAR values. Zarate-Valdez et al. [66] documented that fPAR is highly correlated with leaf area index (LAI) in almond trees, whose canopy architecture is similar to that of pistachio trees. The practical implication of fPAR reductions under saline and saline-sodic growing conditions is that trees intercept less incoming solar radiation, which is the main driver of water transpiration and carbon assimilation for vegetative growth and nut production. This energy-related aspect magnifies the adverse effects of soil-water salinity and sodicity on tree water use and performance.
The amounts of irrigation water applied by the growers (Table 1) at the study orchards over the course of the crop seasons (~1100–1200 mm) were between 30% to 60% higher than the measured seasonal pistachio ET (between 465 to 867 mm depending on the season and site). This suggests that no water deficit occurred at the study orchards during the 2016 and 2017 seasons that could have affected the tree performance.
We found that fPAR , ETa, and nut production were highly and linearly inter-correlated, with lower values of these crop parameters resulting from the prolonged and cumulative stress imposed by soil salinity and sodicity on tree performance. Moving from non-saline to increasing saline and saline-sodic conditions, ETa decreased linearly with fPAR , which in turn depends on canopy size and leaf density. However, curvilinear relationships between fractional canopy cover and crop ET for well-watered and non-stressed fruit and nut crops are found in the literature, i.e., from young immature stands to mature trees grown on non-saline soils, with maximum water use occurring when the fractional canopy cover at midday reaches about ~65% [66,67]. In the present study, smaller tree canopy sizes are not an indicator of tree age, but rather the combined abiotic stress imposed by salinity and sodicity, reducing tree growth.
The reduction of tree growth associated with salinity stress in pistachio was documented by several authors in previous studies [7,68,69]. Under lower soil osmotic potential, trees spend more metabolic energy (photosynthate) synthesizing and concentrating carbohydrates to adjust osmotically [70], which in turn adversely affects the vegetative growth and yield [22,23,71,72]. Therefore, the reduced vegetative growth can be considered as a physiologic adjustment of trees to the long exposure to saline growing conditions, but at the same time may have a magnifying impact on the consumptive water use and yield. Tripler et al. [26] found a similar cumulated effect of salinity on ET and tree growth at the end of a 6-year experiment conducted on potted date palm seedling, suggesting that the long-term impact of salinity on ET was magnified.
The low correlation observed in the present study between ECe and plant performance suggests that a low osmotic potential of the soil solution was probably not the main stressor for pistachio trees exposed to long-term salinity and sodicity conditions. This aspect contrasts with the scientific literature, which reports the existence of strong relations between ECe and tree growth, ECe and ET, and ECe and yield for pistachio [11,73] and other species [26,32,74].
The ability of pistachio to tolerate salinity and maintain good water status has been related to its capacity of osmotic adjustment, as documented by various authors [69,75,76]. Trees accumulate metabolites that act as compatible solutes in response to changes of external osmotic potential [77,78]. Some authors [79] found that growth reduction in pistachio is associated more with Na+ toxicity rather than with the osmotic effect. Reduced photosynthetically active leaf surface, associated with direct Na+ toxicity, may strongly affect carbohydrate budget in pistachio [80]. While salinity may be contributing to osmotic stress and perhaps specific ion stress, sodic conditions are likely imposing a secondary, yet relevant abiotic stress on the trees.
The high correlations found in this study between tree performance and SAR, and SARadj and CROSS supports this hypothesis. High values of SAR correspond to higher concentration of Na+ on the soil exchange complex relative to Ca2+ and Mg2+, which may adversely affect soil physical properties and water infiltration. Tree growth and performance under saline-sodic conditions may be affected by deteriorated soil structure resulting in hypoxia and poor oxygen diffusion from the bulk soil to the root surface. This hypothesis is supported by field observations of extended periods of water ponding in the saline-sodic sites. Results suggest that, in the long term, these secondary effects due to water composition (i.e., sodicity) may have significantly and predominantly impacted tree growth and performance.

5. Conclusive Remarks, Practical Implications, and Future Work

Findings from the present field research study indicate that soil-water salinity and sodicity significantly reduced the water use of micro-irrigated pistachio orchards. However, the mechanisms reducing the actual ET in saline and saline-sodic soils appear to be complex, due to multiple and combined effects of soil parameters on canopy growth of pistachio trees. These effects are related to water logging, reduced infiltration and oxygen diffusion, as well as to reduced soil osmotic potential. Such effects must be considered alongside the ability of pistachio trees to adapt to adverse soil-water conditions to some extent in the long term. In turn, all these aspects affect the amount of solar radiation intercepted by trees, the actual ET and carbon assimilation for vegetative growth and nut production. In other words, the results obtained from this study reveal that salinity and sodicity reduced the growth of trees, which intercept less solar radiation and result in lower ET and less carbon assimilation for growth and yield.
The analysis of field datasets collected in this study showed the existence of strong inter-relations among fPAR, ET, and Nut Yield, which magnified the impact of salinity and salinity-sodicity on pistachio-tree water use and performance in the long term.
As far as tree performance is concerned, the RPR index introduced here integrates the combined adverse effects of soil-water salinity and sodicity on tree growth, water use, and nut production. The RPR index averages out the individual impacts related to fPAR, ETa, and Nut Yield, and thus their relative contributions to tree performance reductions. Future research should investigate the contribution of other parameters and processes that affect the expression of tree performance. As an example, comparative analyses of plant tissue samples could identify differential nutrient and ion uptake by trees grown in non-saline, saline, and saline-sodic conditions, and evaluate nutrient deficiencies or specific ion toxicity occurring in saline and saline-sodic conditions relative to those of trees grown on non-saline soils.
The statistical analysis conducted on field measurements collected in this study indicate a low correlation between ECe and plant performance, suggesting that lower soil osmotic potential was probably not the main stressor for pistachio trees grown on salt-affected conditions. This aspect somehow contrasts with the scientific literature, which reports strong relations between ECe and plant growth, ECe and ET, and ECe and yield for many plant species. However, previous studies suggest that pistachios tolerate soil-water salinity relatively more than other nut trees, and that tree growth reduction is more related to ion toxicity than to osmotic reduction effects. In this regard, the present study found strong correlations of plant performance with SAR, SARadj, and CROSS, indicating that Na+ may also generate some secondary stress on trees as a result of soil structure degradation, leading to reduced water infiltration, poor soil aeration, and eventually root hypoxia and asphyxia. Future research should investigate in deeper details these soil-plant-water aspects and dynamics, by monitoring the concentration and diffusion rate of soil oxygen, and understanding how these parameters relate with canopy transpiration, carbon assimilation, and translocation of nutrients and ions to leaves in saline and saline-sodic conditions.
In the near future, agricultural water supply will be increasingly limited in the southern portion of the San Joaquin Valley because of stringent water policies and environmental regulations. In this context, the information developed in the present study could help pistachio growers and ranch managers tailor water allocations to meet the actual water demand of pistachio orchards grown on non-saline and saline-sodic soils, while pursuing some water and energy savings at farm level. The results from this study could also help pistachio growers predict water and energy needs of pistachio orchards with higher accuracy, provide resource-efficient irrigation scheduling, estimate yield reductions based on soil-water salinity and sodicity, as well as design and implement deficit irrigation strategies relative to baseline pistachio water use, both for non-saline and saline/sodic conditions. The same results could also inform the economic evaluation of alternative strategies for pistachio growers to cope with water limitations and curtailments (i.e., retirement of planted acreage, deficit irrigation practices, combinations of land fallowing and deficit irrigation, etc.).
Future research efforts could focus on separating the energy-related aspect (i.e., less light interception by smaller trees) from the osmotic and physiologic effects (adjustment to lower soil osmotic potential, reduced water and nutrient uptake, Na+ toxicity, Na+ impact on soil structure, hypoxia, etc.), and on the timing of occurrence of these effects during the course of the crop season. Another aspect deserving further investigation is the development of separate relations between fPAR and ETa for pistachio orchards grown on non-saline versus saline and saline-sodic soils, in order to provide growers with valuable information on actual tree water use as function of site-specific growing conditions (i.e., tree canopy size and density, tree spacing, soil-water salinity and sodicity). These functional relationships could inform planning decisions related to pistachio acreage expansion, tree planting density, and optimal water allocations with the aim to maximize farm net profit for pistachio growers. Moreover, research could aim at estimating light interception and actual consumptive use with remote-sensing or proximal sensing of canopy features, by gaining a detailed understanding of the correlations between fPAR and various vegetation indices in the different stages of the crop season for non-saline, increasingly saline, and saline-sodic orchards. Finally, assessing the magnitude of spatial variability of ET-related processes in commercial pistachio orchards grown on saline and saline-sodic soils could enable the quantification of potential water and energy savings, as well as the economic benefits of site-specific irrigation application (i.e., variable rate irrigation technology).

Author Contributions

D.Z., R.L.S., B.L.S., and G.M. designed the study and experimental setup. D.L.C. and E.S. collected, analyzed and interpreted the data for the assessment of soil salinity. L.F., G.M. and K.S. collected, analyzed and interpreted the yield data. C.L. helped instrumenting the study orchards with field sensors for ET data collection. R.L.S., O.L., G.M. and D.Z. collected, analyzed and interpreted the ET meausurements. B.D.L. collected, analyzed and interpreted the fPAR data. M.L.M. and G.M. performed the statistical elaborations. G.M., D.Z., R.L.S., S.R.G. and B.L.S. conducted the interpretation of results. G.M., D.Z., and O.L. defined the contents of this manuscript. G.M. and D.Z. wrote the first draft of the manuscript with contribution from all co-authors.

Funding

This research study was supported by the California Pistachio Research Board through the Grants #201503529, #201602119, and #201703291, and by the U.S. Department of Agriculture’s (USDA) Agricultural Marketing Service through Grant 15-SCBGP-CA-0046. The contents presented in this manuscript are solely the responsibility of the authors and do not necessarily represent the official views of the California Pistachio Research Board and of the USDA. The involvement of Octavio Lagos in this research study was partially founded by the Centro de Recursos Hidricos para la Agricultura y la Mineria CRHIAM (CONICYT-FONDAP-15130015)”.

Acknowledgments

Special gratitude goes to James Nichols of Nichols Farms and Bart Flores of Flores Farm for their continuous support and in-kind contributions to the research team during the field data collection at the two study orchards in 2016-2018.

Conflicts of Interest

The authors declare no conflict of interest.

Notations

Y r Relative crop yield
a Salinity threshold ( dSm 1 )
b Slope of yield reduction per dSm 1 in %
CROSSCation Ratio of Structural Stability
ECElectro Conductivity
ETEvapotranspiration
ET a Actual Evapotranspiration, mm
fPAR Fraction of Photosynthetically Active Radiation
H′Uncalibrated Surface Renewal Sensible Heat Flux, Wm 2
H′Eddy Covariance Surface Renewal Sensible Heat Flux, Wm 2 Kc: Crop coefficient
NSNon-saline
PARPhotosynthetically Active Radiation
RPRRelative Performance Reduction
SSaline
SARSodium Adsorption Ratio
SAR adj adjusted SAR
SJVSan Joaquim Valley
SPSaturation percentage
WCWater content

References

  1. Goldhamer, D.A. Tree water requirements and regulated deficit irrigation. In Pistachio Production Manual; Ferguson, L., Ed.; Fruit and Nut Research and Information Center, University of California: Davis, CA, USA, 2005; pp. 103–116. [Google Scholar]
  2. Behboudian, M.H.; Walker, R.R.; Törökfalvy, E. Effects of water stress and salinity on photosynthesis of pistachio. Sci. Hortic. 1986, 29, 251–261. [Google Scholar] [CrossRef]
  3. Spiegel-Roy, P.; Nazigh, D.; Evenari, M. Response of pistachio to low soil moisture conditions. J. Am. Soc. Hortic. Sci. 1977, 102, 470–473. [Google Scholar]
  4. Maas, E.V.; Grattan, S.R. Crop yields as affected by salinity. In Agricultural Drainage; American Society of Agronomy: Madison, WI, USA, 1999; pp. 55–108. [Google Scholar]
  5. Walker, R.R.; Törökfalvy, E.; Behboudian, M.H. Uptake and distribution of chloride, sodium, and potassium ions and growth of salt-treated pistachio plants. Aust. J. Agric. Res. 1987, 38, 383–394. [Google Scholar] [CrossRef]
  6. Scudiero, E.; Corwin, D.L.; Anderson, R.G.; Yemoto, K.; Clary, W.; Wang, Z.L.; Skaggs, T.H. Remote sensing is a viable tool for mapping soil salinity in agricultural lands. Calif. Agric. 2017, 71, 231–238. [Google Scholar] [CrossRef] [Green Version]
  7. Letey, J. Soil salinity poses challenges for sustainable agriculture and wildlife. Calif. Agric. 2000, 54, 43–48. [Google Scholar] [CrossRef] [Green Version]
  8. Ferguson, L.; Sanden, B.; Grattan, S.; Reyes, H.C.; Wilson, C.; Cross, E. Potential for utilizing blended drainage water for irrigating west side, San Joaquin valley pistachios. Cah. Opt. Méditerr. 2001, 56, 155–167. [Google Scholar]
  9. Ferguson, L.; Poss, P.A.; Grattan, S.R.; Grieve, C.M.; Want, D.; Wilson, C.; Donovan, T.J.; Chao, C.T. Pistachio rootstocks influence scion growth and ion relations under salinity and boron stress. J. Am. Soc. Hortic. Sci. 2002, 127, 194–199. [Google Scholar] [CrossRef]
  10. Mehdi-Tounsi, H.; Chelli-Chaabouni, A.; Mahjoub-Boujnah, D.; Boukhris, M. Long-term field response of pistachio to irrigation water salinity. Agric. Water Manag. 2017, 185, 1–12. [Google Scholar] [CrossRef]
  11. Sanden, B.L.; Ferguson, L.; Reyes, H.C.; Grattan, S.C. Effect of salinity on evapotranspiration and yield of San Joaquin Valley pistachios. In Acta Horticulturae, Proceedings of the Fourth International Symposium on Irrigation of Horticultural Crops; ISHS: Korbeek-Lo, Belgium, 2004; Volume 664, pp. 583–589. [Google Scholar]
  12. Goldhamer, D.A.; Kjelgren, R.; Beede, R.; Williams, L.; Moore, M.J.; Lan, J.; Weinberger, G.; Menezes, J. Water Use Requirements of Pistachio Trees and Response to Water Stress; Annual Report of the California Pistachio Commission; California Pistachio Commission: Fresno, CA, USA, 1985. [Google Scholar]
  13. Goldhamer, D.A.; Beede, R.; Moore, J.M.; Weinberger, G.; Menezes, J., Jr. Water Use Requirements and Physiological Response to Water Stress in Pistachio; Annual Report of the California Pistachio Commission, Crop Year; California Pistachio Commission: Fresno, CA, USA, 1983; pp. 53–57. [Google Scholar]
  14. Kanber, R.; Yazar, A.; Önder, S.; Köksal, H. Irrigation response of pistachio (Pistaciavera L.). Irrig. Sci. 1993, 14, 7–14. [Google Scholar] [CrossRef]
  15. Goldhamer, D.A. Irrigation Management. In Pistachio Production Manual; Ferguson, L., Ed.; Fruit and Nut Research and Information Center, University of California: Davis, CA, USA, 1995; pp. 71–81. [Google Scholar]
  16. Iniesta, F.; Testi, L.; Goldhamer, D.A.; Fereres, E. Quantifying reductions in consumptive water use under regulated deficit irrigation in pistachio (Pistacia vera L.). Agric. Water Manag. 2008, 95, 877–886. [Google Scholar] [CrossRef]
  17. Marino, G.; Di Martino, S.; Roxas, A.A.; Caruso, T.; Ferguson, L.; Barone, E.; Marra, F.P. Sustainability of pistachio production (Pistacia vera L.) under supplemental irrigation in a Mediterranean climate. Sci. Hortic. 2018, 241, 260–266. [Google Scholar] [CrossRef]
  18. Meiri, A.; Kamburov, J.; Shalhevet, J. Transpiration effects on leaching fractions. Agron. J. 1977, 69, 779–782. [Google Scholar] [CrossRef]
  19. Letey, J.; Dinar, A. Simulated crop-water production functions for several crops when irrigated with saline waters. Hilgardia 1986, 54, 1–32. [Google Scholar] [CrossRef] [Green Version]
  20. Dudley, L.M.; Ben-Gal, A.; Lazarovitch, N. Drainage water reuse: Biological, physical, and technological considerations for system management. J. Environ. Qual. 2008, 37 (Suppl. 5), S25–S35. [Google Scholar] [CrossRef]
  21. Greenway, H.; Munns, R. Mechanisms of salt tolerance in nonhalophytes. Ann. Rev. Plant Physiol. 1980, 31, 149–190. [Google Scholar] [CrossRef]
  22. Stavarek, S.J.; Rains, D.W. Effect of salinity on growth and maintenance costs of plant cells. In Cellular and Molecular Biology of Plant Stress; Key, J.L., Kosuge, T., Alan, R., Eds.; Liss, Inc.: New York, NY, USA, 1985; pp. 129–143. [Google Scholar]
  23. Yeo, A.R. Salinity resistance: Physiology and prices. Physiol. Plant. 1983, 58, 214–222. [Google Scholar] [CrossRef]
  24. Grieve, C.M.; Grattan, S.R.; Maas, E.V. Plant salt tolerance. In ASCE Manual and Reportson Engineering Practice No. 71 Agricultural Salinity Assessment and Management, 2nd ed.; Wallender, W.W., Tanji, K.K., Eds.; ASCE: Reston, VA, USA, 2012; Chapter 13; pp. 405–459. [Google Scholar]
  25. Suarez, D.L. Irrigation water quality assessments. In Agricultural Salinity Assessment and Management, 2nd ed.; Wallender, W.W., Tanji, K.K., Eds.; ASCE: Reston, VA, USA, 2012; pp. 343–370. [Google Scholar]
  26. Tripler, E.; Shani, U.; Mualem, Y.; Ben-Gal, A. Long-term growth, water consumption and yield of date palm as a function of salinity. Agric. Water Manag. 2011, 99, 128–134. [Google Scholar] [CrossRef]
  27. Skaggs, T.H.; Poss, J.A.; Shouse, P.J.; Grieve, C.M. Irrigating forage crops with saline waters: 1. Volumetric lysimeter studies. Vadose Zone J. 2006, 5, 815–823. [Google Scholar] [CrossRef]
  28. Shani, U.; Dudley, L.M. Field studies of crop response to water and salt stress. Soil Sci. Soc. Am. J. 2001, 65, 1522–1528. [Google Scholar] [CrossRef]
  29. Ben-Gal, A.; Karlberg, L.; Janson, P.K.; Shani, U. Temporal robustness of linear relationships between production and transpiration. Plant Soil 2003, 251, 211–218. [Google Scholar] [CrossRef]
  30. Shani, U.; Ben-Gal, A.; Tripler, E.; Dudley, L.M. Plant response to the soil environment: An analytical model integrating yield, water, soil type, and salinity. Water Resour. Res. 2007, 43, 1–12. [Google Scholar] [CrossRef]
  31. Tripler, E.; Ben-Gal, A.; Shani, U. Consequence of salinity and excess boron on growth, evapotranspiration and ion uptake in date palm (Phoenix dactylifera L., cv. Medjool). Plant Soil 2007, 297, 147–155. [Google Scholar] [CrossRef]
  32. Bhantana, P.; Lazarovitch, N. Evapotranspiration, crop coefficient and growth of two young pomegranate (Punica granatum L.) varieties under salt stress. Agric. Water Manag. 2010, 97, 715–722. [Google Scholar] [CrossRef]
  33. Burt, C.M. Rapid field evaluation of drip and microspray distribution uniformity. Irrig. Drain. Syst. 2004, 18, 275–297. [Google Scholar] [CrossRef] [Green Version]
  34. Marino, G.; Zaccaria, D.; University of California, Davis, CA, USA. Unpublished work. 2019.
  35. Hanson, B.; Orloff, S.; Sanden, B. Monitoring Soil Moisture for Irrigation Water Management; Publication Number 21635; Agriculture and Natural Resources, University of California: Davis, CA, USA, 2007. [Google Scholar]
  36. Hanson, B.R.; Schwankl, L.J.; Fulton, A.E. Scheduling Irrigations: When and How Much Water to Apply; Publication Number 3396; Agriculture and Natural Resources, University of California: Davis, CA, USA, 1999. [Google Scholar]
  37. Hart, Q.J.; Brugnach, M.; Temesgen, B.; Rueda, C.; Ustin, S.L.; Frame, K. Daily reference evapotranspiration for California using satellite imagery and weather station measurement interpolation. Civ. Eng. Environ. Syst. 2009, 26, 19–33. [Google Scholar] [CrossRef]
  38. Kochendorfer, J.; Meyers, T.P.; Frank, J.; Massman, W.J.; Heuer, M.W. How well can we measure the vertical wind speed? Implications for fluxes of energy and mass. Bound. Layer Meteorol. 2012, 145, 383–398. [Google Scholar] [CrossRef]
  39. Shapland, T.M.; McElrone, A.J.; Khaw, T.P.U.; Snyder, R.L. A turnkey data logger program for field-scale energy flux density measurements using eddy covariance and surface renewal. Ital. J. Agrometeorol. 2013, 18, 5–16. [Google Scholar]
  40. De Vries, D.A. Thermal properties of soil. In Physics of Plant Environment; van Wijk, W.R., Ed.; North-Holland Publishing Company: Amsterdam, The Netherlands, 1963; pp. 210–234. [Google Scholar]
  41. Khaw, T.P.U.; Qiu, J.; Su, H.B.; Watanabe, T.; Brunet, Y. Surface renewal analysis: A new method to obtain scalar fluxes without velocity data. Agric. For. Meteorol. 1995, 74, 119–137. [Google Scholar]
  42. Snyder, R.L.; Spano, D.; Khaw, T.P.U. Surface renewal analysis for sensible and latent heat flux density. Bound. Layer Meteorol. 1996, 77, 249–266. [Google Scholar] [CrossRef]
  43. Shapland, T.M.; Snyder, R.L.; Smart, D.R.; Williams, L.E. Estimation of actual evapotranspiration in winegrape vineyards located on hillside terrain using surface renewal analysis. Irrig. Sci. 2012, 30, 471–484. [Google Scholar] [CrossRef]
  44. Kljun, N.; Calanca, P.; Rotach, M.W.; Schmid, H.P. A simple two-dimensional parameterisation for Flux Footprint Prediction (FFP). Geosci. Model Dev. 2015, 8, 3695–3713. [Google Scholar] [CrossRef] [Green Version]
  45. Montazar, A.; Rejmanek, H.; Tindula, G.; Little, C.; Shapland, T.; Anderson, F.; Inglese, G.; Mutters, R.; Linquist, B.; Greer, C.A.; et al. Crop coefficient curve for paddy rice from residual energy balance calculations. J. Irrig. Drain. Eng. 2017, 143, 04016076. [Google Scholar] [CrossRef]
  46. Simmons, L.J.; Wang, J.; Sammis, T.W.; Miller, D.R. An evaluation of two inexpensive energy-balance techniques for measuring water use in flood-irrigated pecans (Carya illinoinensis). Agric. Water Manag. 2007, 88, 181–191. [Google Scholar] [CrossRef]
  47. Zaccaria, D.; Marino, G.; Shapiro, K.; Snyder, R.L.; University of California, Davis, CA, USA. Unpublished work. 2019.
  48. Zarate, J.; Metcalf, S.; Stewart, W.; Ustin, S.L.; Lampinen, B. Estimating light interception in tree crops with digital images of canopy shadow. Precis. Agric. 2015, 16, 425–440. [Google Scholar] [CrossRef]
  49. Lampinen, B.D.; Udompetaikul, V.; Browne, G.T.; Metcalf1, S.G.; Stewart, W.L.; Contador, L.; Negron, C.; Upadhyaya, S.K. A Mobile Platform for Measuring Canopy Photosynthetically Active Radiation Interception in Orchard Systems. Hortechnology 2012, 22, 237–244. [Google Scholar] [CrossRef]
  50. R Core Team. R: A Language and Environment for Statistical Computing; R Foundation for Statistical Computing: Vienna, Austria, 2013; Available online: http://www.R-project.org/ (accessed on 29 November 2017).
  51. Corwin, D.L.; Lesch, S.M. Application of soil electrical conductivity to precision agriculture: Theory, principles, and guidelines. Agron. J. 2003, 95, 455–471. [Google Scholar] [CrossRef]
  52. Corwin, D.L.; Lesch, S.M. Characterizing soil spatial variability with apparent soil electrical conductivity: I. Survey protocols. Comput. Electron. Agric. 2005, 46, 103–133. [Google Scholar] [CrossRef]
  53. Corwin, D.L.; Lesch, S.M. Apparent soil electrical conductivity measurements in agriculture. Comput. Electron. Agric. 2005, 46, 11–43. [Google Scholar] [CrossRef]
  54. Corwin, D.L.; Scudiero, E. Field-scale apparent soil electrical conductivity. In Methods of Soil Analysis; Logsdon, S., Ed.; Soil Science Society of America: Madison, WI, USA, 2016; Volume 1. [Google Scholar]
  55. Lesch, S.M. Sensor-directed response surface sampling designs for characterizing spatial variation in soil properties. Comput. Electron. Agric. 2005, 46, 153–179. [Google Scholar] [CrossRef]
  56. Lesch, S.M.; Rhoades, J.D.; Corwin, D.L. ESAP-95 Version 2.01 R. User Manual and Tutorial Guide; Research Report No. 146; U.S. Salinity Laboratory: Riverside, CA, USA, 2000; p. 161.
  57. Corwin, D.L.; Yemoto, K. Salinity: Electrical conductivity and total dissolved solids. In Methods of Soil Analysis; Logsdon, S., Ed.; Soil Science Society of America: Madison, WI, USA, 2017; Volume 2. [Google Scholar]
  58. Sparks, D.L. Methods of Soil Analysis. Part 3-Chemical Methods; SSSA Book Series 5; Soil Science Society of America: Madison, WI, USA, 1996. [Google Scholar]
  59. Dane, J.H.; Topp, G.C. Methods of Soil Analysis: Part 4-Physical Methods; SSSA Book Series 5; Soil Science Society of America: Madison, WI, USA, 2002. [Google Scholar]
  60. Lesch, S.M.; Suarez, D.L. A short note on calculating the adjusted SAR index. Trans. ASABE 2009, 52, 493–496. [Google Scholar] [CrossRef]
  61. Rengasamy, P.; Marchuk, A. Cation ratio of soils structural stability (CROSS). Soil Res. 2011, 49, 280–285. [Google Scholar] [CrossRef]
  62. Smith, C.J.; Oster, J.D.; Sposito, G. Potassium and magnesium in irrigation water quality assessment. Agric. Water Manag. 2015, 152, 59–64. [Google Scholar] [CrossRef]
  63. Sposito, G.; Oster, J.D.; Smith, C.J.; Assouline, S. Assessing soil permeability impacts from irrigation with marginal-quality waters. CAB Rev. 2016, 11, 1–7. [Google Scholar] [CrossRef]
  64. Scudiero, E.; Lesch, S.M.; Corwin, D.L. Validation of sensor-directed spatial simulated annealing soil sampling strategy. J. Environ. Qual. 2016, 45, 1226–1233. [Google Scholar] [CrossRef]
  65. Rummel, R.J. Understanding Correlation; Department of Political Science, University of Hawaii: Honolulu, HI, USA, 1976. [Google Scholar]
  66. Zarate-Valdez, J.L.; Whiting, M.L.; Lampinen, B.D.; Metcalf, S.; Ustin, S.L.; Brown, P.H. Prediction of leaf area index in almonds by vegetation indexes. Comput. Electron. Agric. 2012, 85, 24–32. [Google Scholar] [CrossRef]
  67. Fereres, E.; Martinich, D.A.; Aldrich, T.M.; Castel, J.R.; Holzapfel, E.; Schulbach, H. Drip irrigation saves money in young almond orchards. Calif. Agric. 1982, 36, 12–13. [Google Scholar]
  68. Abbaspour, H.; Afshari, H.; Abdel-Wahhab, M.A. Influence of salt stress on growth, pigments, soluble sugars and ion accumulation in three pistachio cultivars. J. Med. Plants Res. 2012, 6, 2468–2473. [Google Scholar] [CrossRef]
  69. Chelli Chaabouni, M.; Hammami, M.; Gouia, K.; Gargouri, R.; Gargouri, K.; Drira, N. Effect of salt stress on Pistacia atlantica seedlings at nursery conditions. Options Méditerranéennes. Série A Séminaires Méditerranéens 2010, 94, 135–140. [Google Scholar]
  70. Epstein, E. Responses of plants to saline environments. In Genetic Engineering of Osmoregulation: Impact on Plant Productivity for Food, Chemicals, and Energy; Rains, D.W., Valentine, R.C., Hollaender, A., Eds.; Plenum Press: New York, NY, USA, 1985; pp. 7–21. [Google Scholar]
  71. Läuchli, A.; Grattan, S.R. Soil pH extremes. In Plant Stress Physiology; CAB International: Wallingford, UK, 2012; p. 194. [Google Scholar]
  72. Raven, J.A. Regulation of pH and generation of osmolarity in vascular plants: A cost-benefit analysis in relation to efficiency of use of energy, nitrogen and water. New Phytol. 1985, 101, 25–77. [Google Scholar] [CrossRef]
  73. Picchioni, G.A.; Miyamoto, S.; Storey, J.B. Salt effects on growth and ion uptake of pistachio rootstock seedlings. J. Am. Soc. Hortic. Sci. 1990, 115, 647–653. [Google Scholar] [CrossRef]
  74. Grattan, S.R.; Zeng, L.; Shannon, M.C.; Roberts, S.R. Rice is more sensitive to salinity than previously thought. Calif. Agric. 2002, 56, 189–195. [Google Scholar] [CrossRef]
  75. Chelli-Chaabouni, A.; Ben Mosbah, A.; Maalej, M.; Gargouri, K.; Gargouri-Bouzid, R.; Drira, N. In vitro salinity tolerance of two pistachio rootstocks: Pistacia vera L. and Pistacia atlantica Desf. Environ. Exp. Bot. 2010, 69, 302–312. [Google Scholar] [CrossRef]
  76. Hajiboland, R.; Noroozi, F.; Poschenrieder, C. Growth physiological, biochemical and ionic responses of pistachio seedlings to mild and high salinity. Trees 2014, 28, 1065–1078. [Google Scholar] [CrossRef]
  77. Hasegawa, P.M.; Bressan, R.A.; Zhu, J.-K.; Bohnert, H.J. Plant cellular and molecular responses to high salinity. Ann. Rev. Plant Physiol. 2000, 51, 463–499. [Google Scholar] [CrossRef]
  78. Munns, R.; Tester, M. Mechanisms of salinity tolerance. Ann. Rev. Plant Biol. 2008, 59, 651–685. [Google Scholar] [CrossRef]
  79. Karimi, H.R.; Zamani, Z.; Ebadi, A.; Fatahi, R. Effects of Water Salinity on Growth Indices and Physiological Parameters in Some Wild Pistachio. Int. J. Nuts Relat. Sci. 2012, 3, 41–48. [Google Scholar]
  80. Marino, G.; La Mantia, M.; Caruso, T.; Marra, F.P. Seasonal dynamics of photosynthesis and total carbon gain in bearing and nonbearing pistachio (Pistacia vera L.) shoots. Photosynthetica 2018, 56, 932–941. [Google Scholar] [CrossRef]
Figure 1. Location of the ET measuring stations and footprint areas in the non-saline (NS) orchard (left) and saline-sodic affected (S) orchard (right).
Agriculture 09 00076 g001
Figure 2. The α calibration: the least-squares regression through the origin of 30-min sensible heat flux density obtained from surface renewal (H′) versus 30-min sensible heat flux density obtained from eddy covariance (H) for the non-saline orchard during the 2016 season.
Agriculture 09 00076 g002
Figure 3. Schematic representation of the selected blocks of 10 female trees where nut yield was measured within the footprint areas of ET stations.
Agriculture 09 00076 g003
Figure 4. Relation between ECe and SAR at different soil sampling depths (between 0 and 1.20 m) for the study orchards. Each point in the graph represents the average of 12 soil samples at each soil depth for the non-saline (NS) and the saline-sodic (S) orchards. The black solid line indicates the linear regression for the entire dataset. The parameters of the linear equation are: a = 1.5, b = 3.8; r 2 = 0.68 ; p value < 0.001.
Agriculture 09 00076 g004
Figure 5. Relations found across all study sites between: (A) mean fPAR (averaged over the 2016 and 2017 seasons) and cumulative ETa (averaged over the 2016 and 2017 seasons from May 25 to October 10); (B) fPAR and averaged fresh nut yield; (C) cumulative ETa and averaged fresh nut yield.
Agriculture 09 00076 g005
Figure 6. Results from statistical analysis involving correlation tests. The top graph (A) illustrates the correlations between RPR and different soil parameters for soil depths of 0–1.20 m with significance factors of r; the bottom graph (B) indicates the p-value obtained by the Student T-test. The black solid line represents the significance thresholds for r = 0.75 and p-value = 0.05. SP = saturation percentage (%); ECe = electrical conductivity ( dS   m 1 ; SAR = sodium adsorption ratio; SAR adj = adjusted SAR ; CROSS = cation ratio of soil structural stability.
Agriculture 09 00076 g006
Table 1. Applied irrigation water at the study orchards and reference evapotranspiration (ETo) obtained from the Spatial CIMIS for the two experimental orchards.
YearOrchardPre-Season Irrigation
(mm)
In-Season Irrigation
(mm)
Total Irrigation
(mm)
ETo
(mm)
2016Non-saline2549651219946
Saline2629601222941
2017Non-saline3298231152930
Saline4067191125939
Table 2. Types of ET stations (full and lite) installed at the two pistachio study orchards, with indication of the method (EC: eddy covariance; SR: surface renewal) used for estimating the sensible heat flux (H).
OrchardStation IDType of ET StationsMethod for Estimating H
Non-SalineNSFullEC and SR
SalineS1LiteSR
S2FullEC and SR
S2LiteSR
S4LiteSR
S5LiteSR
S6LiteSR
Table 3. Pearson correlation coefficients between soil apparent electrical conductivity (ECa) for the 0~0.75-m ( EM h ) and 0~1.5-m ( EM v ) soil profiles and laboratory measurements of gravimetric water content (WC), saturation percentage (SP), pH, salinity (ECe), and sodium adsorption ratio ( SAR ). Significant correlations (p < 0.05) are reported in bold red font.
Depth0–0.30 m0.30–0.60 m0.60–0.90 m0.90–1.20 m
WC
ECa EMh0.660.630.520.63
ECa EMv0.630.620.510.64
SP
ECa EMh0.600.710.650.56
ECa EMv0.580.700.670.62
PH
ECa EMh−0.180.13−0.07−0.06
ECa EMv−0.140.18−0.010.01
ECe
ECa EMh0.450.210.450.58
ECa EMv0.400.220.440.60
SAR
ECa EMh0.470.680.710.74
ECa EMv0.450.670.730.76
Table 4. Values of soil chemical parameters (average, minimum, and maximum) determined from the saturated extracts of soils samples collected at the non-saline (NS) and saline-sodic (S) orchards. The analytical determinations were conducted by the USDA Salinity Laboratory, Riverside (CA).
OrchardValueSAR ECe   ( d S   m 1 ) WC   ( g   g 1 ) SP (%)pHCROSS S A R a d j
NSAve4.32.70.10.37.64.92.9
Min1.10.580.040.26.52.11.8
Max11.96.40.160.428.411.24.3
SAve22.67.10.190.617.625.217.1
Min7.41.650.090.276.522.415.3
Max44.814.040.311.178.827.115.3
Table 5. Fraction of PAR interception by tree canopy ( fPAR , %), seasonal cumulative actual ET ( CET a , mm), fresh nut yield (kg tree−1), measured in the 2016 and 2017 seasons, and relative performance reduction (RPR) calculated for the non-saline and saline-sodic orchards.
OrchardSite f P A R   ( % ) CETa (mm)Nut Yield (kg tree−1)RPR
201620172016201720162017
Non salineNS75 a75 a77186710 c41 a0.00
SalineS145 c40 c,d57155712 c16 b,c0.40
S235 d44 c61162220 a,b15 b,c0.34
S327 e32 e52546514 b,c10 c,d0.52
S451 b,c60 b72165023 a24 b0.17
S556 b6273972420 a,b22 b0.16
S633 b,e36 d,e67163814 b,c19 b0.37
The superscript letters close to values represent significant differences among sites (Tukey, p < 0.05) and cells with the same letter have a 5% or less probability of occurrence due to random chance.

