Article

Protected Designation of Origin and Sustainability Characterization: The Case of PDO Cocoa Arriba

1
Agricultural Economics and Rural Policy Group, Wageningen School of Social Sciences, Wageningen University & Research, 6701 Wageningen, The Netherlands
2
Faculty of Science and Engineering in Food and Biotechnology, Technical University of Ambato, Ambato 180101, Ecuador
3
Faculty of Food Sciences, Universitat de Barcelona, 08019 Barcelona, Spain
4
School of Management, Swansea University, Swansea SA1-1EJ, UK
*
Author to whom correspondence should be addressed.
Agriculture 2019, 9(10), 229; https://doi.org/10.3390/agriculture9100229
Submission received: 19 September 2019 / Revised: 14 October 2019 / Accepted: 17 October 2019 / Published: 22 October 2019

Abstract

:
The employment of Protected Designations of Origin (PDO) in agri-food products through recognized chains has a fundamental economic role in Ecuador. A substantial amount of research has focused on examining the crop performance of PDO products. However, there is a shift in the agri-food chain perspective towards more sustainable models. In this respect, social, economic, and institutional aspects are consequential and contribute to the agri-food sector development. The current rise in market opportunities at the local and international level drives support for them. This study aims to analyze socio-economic and governance components, in order to understand the PDO Cocoa Arriba (Theobroma cacao) chain sustainability performance and propose potential future strategies. Principal Components Analysis was used to contribute relevant insight. This framework applies accounts with a revision of primary and supporting activities. The investigation clustered pre-production, production, and post-production tiers. It also executed food chain mapping and identified chain actors. Results suggested several viable long-term strategies. Examples of these strategies include the enhancement of national regulation to assist chain actors, and the stimulus of young producers and empowerment of associations. The main contribution to the research was the application of governance mechanisms to comprehensively assess chain performance. Based on the results, we recommend incorporating new indicators to analyze the environmental and institutional components in detail.

1. Introduction

Cocoa (Theobroma cacao L.) is cultivated mainly in Latin American countries and represents an important crop worldwide, for both processed and raw material markets [1,2]. African countries have led world production in recent years [3,4]. According to the United Nations Food and Agriculture Organization’s latest estimates, world production of cocoa is more than 4,600,000 tons per year, resulting from around 1,200,000 ha of cultivated land [5]. Cameroon, Nigeria, Indonesia, Ghana, and Cote D’Ivoire are the primary producers of cocoa, making up 67% of total world production [6]. Ecuador, with an output of 270,000 tons, placed ninth in the world ranking of cocoa-producing countries [7]. In 2016, Ecuador was Latin America’s largest producer, making up 35% of cocoa production [8]. However, in recent years, the Ecuadorian cocoa market faced troubles, and small producers fell victim to price volatility and poor contingency strategies to manage risk. This resulted in a deceleration of 5%, as compared to the 3.8% growth it had experienced during the 2015 fiscal year [9].
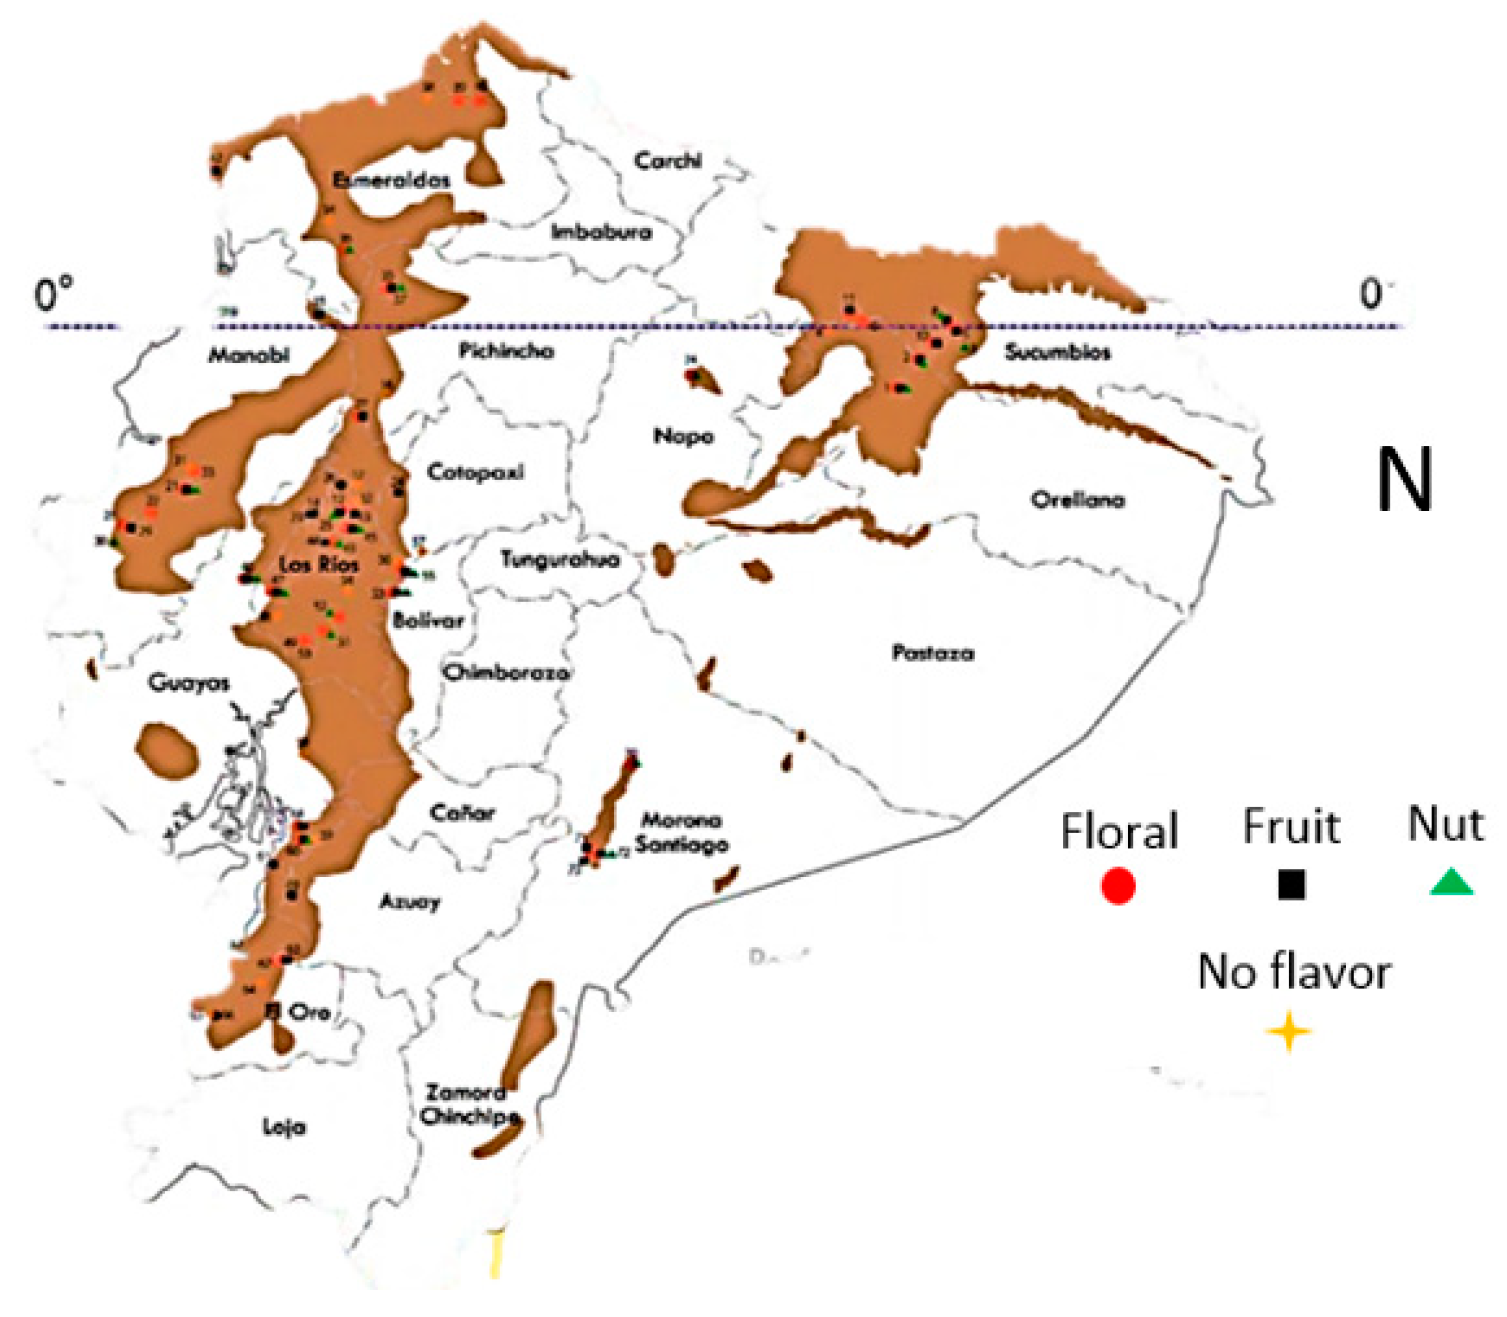
According to the Ministry of Agriculture–MAG census [10], the Ecuadorian coastal region is the central location of cocoa production, contributing more than 70% of the Ecuadorian output. Los Ríos and Guayas provinces account for the most extended surface area, covering around 35% of the total cocoa crop area. Ecuador grows two varieties of cocoa, Arriba that owns a deep floral-fruity aroma, and it is widely cultivated in Los Ríos province; and CCN-51 a cloned variety for high productivity, represent 30 and 70 percent of production, respectively [11]. Nevertheless, the reality of Cocoa Arriba production reveals a weak business model that brings short-term instability. For example, research revealed a lack of appropriate remuneration to producers, and insufficient producer prices to compensate production costs [12]. The United Nations Development Programme UNDP–Ecuador [13] reported the consequences of this, including rural migration, which is between 1.5% and 2.5% per year, as well as an increase in the agricultural frontier, which causes a deforestation rate between 3.5% and 5% per year [14]. Therefore, specific instruments promoting sustainable chains are vital. The Protected-Designation-of-Origin (PDO) tool, a name of a specific area that recognizes official rules to produce certain foods with unique characteristics, aligns with the spirit of the regulation, which aims to increase small producers’ welfare, and is coherent with sustainable governance mechanisms.
The Ecuadorian PDO cocoa is known as “Cacao Arriba”, and it is the symbolic product of Ecuador. During 2002, the Ministry of Agriculture led a process of Cocoa Arriba revaluation, through the project “Recovery of Production and Improvement of the Quality of National Cocoa” [15]. In 2007, Ecuador submitted the designation of origin (DO) application for Cocoa Arriba and it was approved in 2013 [16]. Today, Ecuador has the most significant world market share of Cocoa Arriba (63%). Its recognition by the international industry is due to its sensory characteristics (fruity and floral flavors); however, estimates indicate that less than 28% of cocoa exports correspond to Arriba cocoa [17]. Thus, Cocoa Arriba PDO production is an essential alternative crop, able to underpin sustainability and rural development in agricultural sectors. Various authors argue that studies have only addressed agronomic aspects, such as post-harvest practices and pest management, but lack an integrated perspective. This perspective would include PDO standards application, economic evaluation, and social implications, which underline existing shortcomings [18,19]. Understanding gaps between standards and chain-level practices is paramount, in order to assess the potential for sustainable governance and to drive the transformation in agri-food chains.
In such a context, the present article aims to contribute by addressing two research questions. The first RQ is how is the Cocoa Arriba PDO chain different from the CCN-51 cocoa chain in terms of socio-economic performance? The last RQ is what kind of governance mechanism does the Cocoa Arriba PDO chain describe, and what sets it apart from the CCN-51 cocoa chain? As such, the study hopes to further our understanding of the socio-economic sustainability assessment and the relevant insight it might provide regarding the cocoa PDO chain. It focused on Los Ríos province, since it covers most of the Cocoa Arriba production in Ecuador.

2. Theoretical Framework and Methods

2.1. Value Chain Approach and the Governabilty

A value-chain divides itself into two central elements. Chain refers to the linkage between stages, considering the process from pre-production to consumption [20]. Value refers to the process by which chain actors such as farmers, firms, entrepreneurs and retailers, among others, add utility to goods and services for final consumers [21]. The scientific community uses the “chain approach” for a better understanding of sector dynamics. However, how chain actors add value depends on competencies. Those competencies can be retained if chain performance is based on proper governance mechanisms. A governance mechanism describes how the practices and processes of chain actors are coordinated [22]. Types of governability are market, modular, relational, captive, and hierarchy [22]. The operability of these mechanisms depends on the coordination devices they own, and the degree of power asymmetry. For example, market governance depends on prices, and shows low power asymmetry, whereas, hierarchy uses flows of information to coordinate activities. From a sustainability perspective, “value chain” has more appeal, since it encourages a full-lifecycle view. The geographical scope of this outlook allows the establishment of boundaries for a better examination [23]. Political, economic, and environmental aspects of a chain engage scholars and practitioners because of the existing complexity [24].

2.2. Sustainability and Agri-Food System Perspective

Sustainability aims to “meet the needs of the present without compromising the ability of future generations to meet their own needs” [25]. When sustainability is applied to agri-food scenarios, it mainly focuses on biophysical approaches [26,27]. Common findings from these studies suggest that environmental challenges are the central barrier preventing a sustainable development of agriculture [28,29]. However, sustainability in the context of an agri-food chain depends on trade-offs between social welfare and economic growth [30]. The former concerns the life quality of actors [31] and includes local purchases, local hiring, supporting local community events, the impact of products on society, and business dealings with ethical policies. The economic aspect explains the distribution of wealth across the stages [32]. Thus, a food system perspective is vital, since it groups the elements as a whole and examines their dynamic in an open or closed scenario [33]. A closed setting does not interface with the environment, and knowledge flows within a closed circuit [34]. An open scenario interacts with its environment by giving and receiving information [35]. As such, we would expect a socio-economic performance to improve sustainability practices. Figure 1 shows the scientific basis of the framework used to assess the sustainability of Arriba and CCN-51 cocoa chains.

2.3. Protected Designation of Origin “Cocoa Arriba”

The Cocoa Arriba is produced widely in Ecuador and has unique genetic characteristics [36]. Researchers have tried to propagate it, but the plant has neither developed nor provided a product with the same characteristic floral flavor [37]. Research attributes its unique features to the Ecuadorian weather and soil conditions [38]. Production takes place in the equatorial zone at an altitude between zero and 1200 m above sea level [39]. This zone is located between latitudes 01° 27′ 06” N to 05° 00′ 56” S and longitudes 75° 11′ 49” W to 81° 00′ 40” W. It has a humid climate, with rainfall of 2000 to 4000 mm, with slight variations, due to the small mountain ranges that modify the weather. The word Arriba emerged in the colonial period, where Ecuador divided itself into four ecological zones [40]. The Arriba zone comprises Guayas and Los Ríos provinces, which are the current leaders in Cocoa Arriba production [41]. The following is a detailed map of the geographical area where Cocoa Arriba is currently grown and produced (see Figure 2).
In the country, there are shortcomings in regulations of protected designations of origin (PDO) [42]. In the precise control absence on the use of Ecuadorian PDO, the cocoa sector suffers permanent threats on economic, market, and sustainability terms [43,44,45]. The International Regulations Agreement on Trade-Related Aspects of Intellectual Property Rights-TRIPS. R.O. No. 977, 28 June 1996 and the Paris Convention for the Protection of Industrial Property. R.O. No. 244, 29 July 1999, supported the process of Cacao Arriba PDO legalization [43]. The Andean regulations Normative Decision 486 of the Cartagena Agreement of the Common Regime on Industrial Property R.O. No. 258, 2 February 2001, also contributed to the process. The Ecuadorian Institute of Intellectual Property (IEPI) established the Cacao Arriba PDO standard (Table 1). “The standard technique allows an activity to take place without any ex-ante control, but the supplier who fails to meet the standards perpetrates an infringement” [46]. The existing standards of Cocoa Arriba are INEN 176 and 177. However, the Inter-American Institute for Cooperation on Agriculture argued that this Cocoa Arriba PDO standard requires a specific rule, to guarantee the quality of the four types of the Ecuadorian Cacao Arriba [47]. These types are (a) ASSPS (Arriba superior summer plantation selecto), (b) ASSS (Arriba superior summer selecto), (c) ASS (Arriba superior selecto), (d) ASN (Arriba superior navidad) and (e) Arriba superior época.

2.4. Methodology

2.4.1. Research Region

To answer the research questions, we collected both qualitative interview feedback, and quantitative primary and secondary data, from the production and post-production stages. Buena Fe district, located in the coastal region, was selected for several reasons. First, this zone is the leader in cocoa production, accounting for 15% of the national share and with up to 8000 farmers. Second, it has proper agricultural conditions, such as a location 520 m above sea level, a temperature that is usually of around 12 to 25 °C and climates from tropical humid to semi-humid. Third, these farmers are generally ahead of other Ecuadorian zones in adopting sustainability practices to protect the Arriba cocoa. Fourth, Arriba and CCN-51 chains from Buena Fe have exciting market opportunities and a rural development component. As such, this study arguably presents a more enriched view of sustainable performance. The methodology applied includes phases and tools detailed below.

2.4.2. Survey Layout

The study first performed interviewed technicians from the Ministry of Agriculture–MAG, and through the information from the last census (2015), it sectioned producers for the area under study. Experts from the Ministry of Industries were interviewed and the study also sectioned the post-production actors, by examining the record of SMEs and large companies. Then, we executed a workshop with stakeholders, to select performance variables from a predetermined list. The list considered demographical, social, productive, and economic variables. Demographic variables helped describe the nature of the sample [49]. Social variables stated the social sustainability status of people, within the chain context [50]. Productive variables showed structural features of production [51]. Economic variables described sustainability in financial terms [52]. The experiment was formed of a one version survey, Cronbach’s alpha index validated the questionnaire, and wording was changed to reflect the use of cocoa over other types of products. Each survey was pilot-tested with at least three interviewees, who assisted with confusing and ambiguous items, as well as survey layout and flow. The final questionnaire consisted of three major sections. The first section focused on respondents and socio-demographic aspects. The second section covered the socio-economic dimension. The last part collected information on respondents’ perception of how economic and agronomic aspects impact their productive performance.

2.4.3. Sampling and Responses

The information obtained from the Ministry of Agriculture—MAG and Ministry of Production—MIPRO resulted in a list of 320 chain actors. Then, the study applied the Sukhatme formula [53], at a 95% confidence level, and employed the variable “number of producers registered by MAG” to target 250 cocoa producers (farmers and cooperative representatives). Sukhatme formula has been applied widely by MAG experts in statistical reports. We contacted post-production actors to participate in the study through interviews and capture information related to the local cocoa market. Beforehand, the respondent data set of post-production was further refined, to eliminate any participant that did not commercialize cocoa. Primarily, the study removed fruit and vegetable, and cereal producers, since they tend to focus on different issues. The final group of participants consisted of 50 post-production participants (cocoa traders and entrepreneurs). Overall, information gathered confirmed a reasonable basis for developing the governance analysis, using the Gereffi Framework [22]. Governance typologies in value chains showed the mechanism for coordinate actors, activities, and stages.

2.4.4. Data Analysis

The study examined socio-demographic data obtained from surveys by applying statistical descriptions, which include averages for Arriba and CCN-51 respondents, as well as the results of two-population t-tests, to search for differences between these means. This procedure allowed us to generate the characterization of Arriba and CCN-51 chains. Also, the analysis showed a chain mapping, by employing the Hawke scheme [54] and the Dotoli approach [55], which enabled a gradual graphical description of stages, linkages, and connections, through which food experiment value-trajectories, and information and financial resources, form a chain. Analysis of producer perception used a scale similar to the one used by Melnyk [56]. Here, respondents were first asked to indicate the relevance of economic and agronomic factors on the performance of their crops. The variables were measured on the relative frequency of a five-point scale: 1, extremely irrelevant; 2, irrelevant; 3, neutral; 4, very relevant; and 5, extremely relevant. Then, we employed Principal Component Analysis (PCA), [57] to assess crop constructs (e.g., land tenure, cultivation technique), economic constructs (e.g., costs and yields), and associative measures. The method also included a correlation analysis and the standardization of variables. It built orthogonal variables (Z-scores) from the original ones, to eliminate the effect of scales. The unification used the following expression:
Z i j = x i j μ j σ j
With the orthogonal variables obtained from the PCA, we performed a multidimensional analysis to explain the performance of the chain under study.

3. Results and Discussion

3.1. Sectioning of Value Chain Actors

Table 2 shows the information provided by the Ministry of Agriculture about the production stage. The data accounted for 4.2% of cocoa-producing families. According to surveyed producers, the area stands out because its rivers and mountains promote a variety of climatic floors favoring the crops’ development.

3.2. Value Chain Characterization

Socio-Demographic Characteristic of Producing Families

Table 3 states the socio-demographic characteristics of the respondents. Most of the participants at the CCN-51 chain were between 26 and 40 years old (54.6%). In the case of the Arriba chain, producers who were 41 to 55 years old represented 64.2% of the respondents. Also, there was a difference in education level, since a high proportion of participants (39.5%), belonging to the CCN-51 chain reported a college education. However, more than 50% of Arriba producers only reported a high-school level education. It is noteworthy that interviewees responded to crop management questions with a high level of knowledge. This is because a large proportion (more than 50%) of producers of both chains followed agricultural science programs [58]. Regarding monthly income, most Arriba producers reported a range between 701–1000 USD (34.5%) and CCN-51 producers presented a range between 1301–1700 USD (38.3%).
The average number of household members was 3.7 in both chains, and 63% of respondents reside in the Buena Fé district. According to the National Institute of Statistics and Census (INEC) [59], the average number of members per household in Ecuador is 2.7, and the average monthly income was 450 USD in 2018 [60]. Therefore, the sample demonstrated better representativeness in terms of the average salary of a household member.

3.3. Chain Actors: Influencers/Enablers

Outcomes showed the intervention of chain influencers, such as public entities, advisors, and private agro-centers. These actors aimed to provide technical advice to producers during crop management. Peasant families were the first enabler cluster identified, and were responsible for channeling the harvest to collection centers and distributors. The main difference identified was the crop volume of Arriba cocoa, which is 20% of the crop volume of CCN-51 cocoa. Also, exports of dried Cocoa CCN-51 are above 35% of Arriba cocoa exports. However, exports of liquor are the opposite; Arriba liquor exports are 21% greater than CCN-51 liquor. Processors, the second enabler cluster, transform the raw material (dried cocoa) into liquor or paste. Outcomes also identified dealers (third enabler cluster) strategically located in areas close to the plantations, which aimed to link processors and producers, thus dynamizing the trade. The primary goods sold by the CCN-51 chain are dried cocoa and nibs, while the Arriba chain sold mainly cocoa paste. The Central Bank (external influencer) established the reference prices for the commercialization of liquor and dried cocoa, based on the New York Stock Exchange and the International Cocoa Organization (ICCO) (see Figure 3).

3.4. Chain Functions

In the pre-production stage, outcomes showed the presence of private greenhouses, responsible for the supply of seedlings. In the production stage, actors paid great attention to climatic conditions for crop planning. Also, respondents pointed to the period between December and May as the best cultivation time, due to an increase in rainfall and of temperature. It is noteworthy that crops require shade to achieve an optimum level of production. Another essential requirement is surface cleaning—the elimination of pests and weeds. Bush pruning is necessary after the first year of crop life. It is common to see producers plan the harvest stage in two phases, the first to collect Arriba cocoa in winter, and the second to harvest CCN-51 cocoa in summer. Producers performed the harvest at intervals of 10 to 15 days. Subsequent stages are fermentation, drying, and grain bagging. The sector’s humidity and temperature helped the fermentation process, while the drying process took place at collection points. Producers dried the cocoa using solar energy, while collection points used gas dryers. The international market appreciates solar drying, due to its sustainable orientation.
Roasting and shelling are the main steps in the transformation of cocoa beans. Roasting potentiates aroma and flavor, and husking separates the crust from the almond. The final product husking is the nib. Nibs are ground to obtain a thick paste, which is refined and later distributed as a semi-processed product. The cocoa paste is in high demad in the confectionery sector, and its monetary value ranges between 10.00 and 15.00 USD/kg in the case of CCN-51 cocoa, and between 13.00 and 20.00 USD/kg in the case of Arriba cocoa. The pastry, baking, and catering sectors are the principal applicants for the refined paste. Cost ranges between 8.00 and 10.00 USD/kg in the case of CCN-51 cocoa, and between 15.00 and 25.00 USD/kg in the case of Arriba cocoa (see Figure 2). At the marketing stage, small intermediaries promote cocoa, and supply the grain to small businesses and artisans.

3.5. Chain Flows of Resources

Outcomes identified two types of streams, classified as high and low importance. The cocoa trajectories used the high-relevance streams (HRSs) and took place at production, fermentation, and drying activities. In this sense, the quality standards of cocoa set up by the Ecuadorian Standardization Service (INEN) (see Table 4), play an essential role, due to local market requirements. The HRSs held during commercialization and transformation. The social, environmental, and political interests of cocoa derivatives are increasing; however, their quality standards, established by INEN through standards 175, 176, and 177, need revision, to boost their market growth (2.2 to 3.5 percent per year).
The low-relevance streams (LRSs) took place during supporting activities [63]. The first flow was the financial one, and its supporters were public and private banking entities, and credit unions. Outcomes showed financing programs, with facilities with access to microcredits. Flow of information was also essential. Technical and marketing information were in high demand from actors. Ministry of Agriculture and the Institute of Agricultural Research (INIAP) were the leading providers. However, there were also private organizations, focused on disseminating aspects of prices and marketing opportunities. Figure 4 shows the mapping of all the components analyzed.

3.6. Chain Governability

The observations examined governability, information-coding mechanisms, the complexity of the inter-firm information transfer, and the level of competence of actors. The study identified the following:
1. Market governability. The CCN-51 chain reported this scenario and characterized it, because governing bodies, such as farmers (suppliers) and dealers (intermediaries), performed repetitive transactions easily codified within exchange environments, such as district markets. The most common district markets close to Buena Fe are Quevedo, Ambato, and Guayaquil. Cash payments or contracts with short credit periods, no more than eight days, were the primary business coordination mechanisms. Also, transactional costs existed, which evidenced failures during logistics and commercialization (See Figure 5);
2. Modular governability. The Arriba chain demonstrated a setting whose transactions were codified by following a significant level of complexity. In this scenario, it is easy to observe a sort of power market imposed by governing bodies, such as processors and dealers. These actors set product specifications, credit periods, and buying prices for producers through contracts. Besides, liquor and nibs processors acquired generic machinery, to reduce the risk of investment. The most common acquisitions are refiners, molders, and peelers. The relationships between actors are relevant, due to the high volume of local and global market information transferred, as well as technical procedures (See Figure 6).

3.7. Producer Perception and Socio-Economic Variables

The experiment examined the cocoa producers’ performance in both chains, to elucidate socio-economic and production aspects. We applied a Principal Components Analysis on the 12 primary variables. The details of the variables studied are in Table 5. The components (KMO = 0.818, Bartlett’s test χ2 sig. 0.000) arose with values greater than 1, satisfactorily explaining 70.22% of the total variance.
Results in Table 5 reveal that the inherent aspects of crops were relevant for producers when performance analysis took place. Outcomes classified this component as agronomic. Variables in the element were cocoa variety, land tenure, cultivation technique, number of crops, and post-harvest practices. Cocoa variety is a factor that impacts producer performance, thus, we performed a PCA by producer group, i.e., Arriba and CCN-51, to investigate differences between both chains.
In the case of Cocoa Arriba producers, the first component is noteworthy on account of its impact. The variables included land tenure, cultivation technique, associativity, and post-harvest practices, i.e., factors inherent to crop development (see Table 6). Most of the variables represented strategic information for excellent production performance. However, it is essential to emphasize that the results presented the associative variable as a crucial aspect for this group of producers. Besides, the price variable captured little interest, possibly because the cocoa market is expanding its quotas and business opportunities [64].
In the case of Cocoa CCN-51 producers, the second component had the highest score. The variables included production cost, financing, yields, cocoa acreage, and acreage, i.e., factors inherent to economic and management planning (see Table 7). Most of the variables represented strategic information for excellent financial performance. However, the results showed the associative variable as having little impact on producers’ perception. The price variable also had little impact, possibly because international markets have already established the price of CCN-51.
Finally, Figure 7A distinguished two distinct segments—non-association members and associated members—by considering agronomic and financial components. We observed that most Cocoa Arriba producers opted to be part of associations. Respondents pointed out benefits, such as the reduction of economic risk, because representatives addressed production by following strategies formulated by consensus. In Figure 7B, the interpretation is different, because CCN-51 producers did not tend to be part of associations; they opted to make decisions independently.

4. Conclusions

Improving the social and economic sustainability performance of the agri-food networks would involve significant structural changes. As a sub-cluster of the agri-food sector, cocoa producers, traders, processors, and distributors have responded to rural development problems, associativity, and cost-efficiency. Market opportunities, together with regulations through certification tools, such as Protected Designations of Origin, look for supporting viable and fair agricultural activities. Sustainable status for cocoa chains has received attention in the existing literature. Environmental aspects related to soil conditions of crops, pest-management plans, and deforestation practices were examined extensively. Nevertheless, social conditions and economic performance have received little attention. This paper aimed to provide an initial comparison between two different chains, CCN-51, and Arriba PDO, by emphasizing PDO chain demographic, socio-economic situation, and the impact of these factors on economic performance outcomes. The paper’s aim was to highlight their effect on the sustainability of a PDO widely recognized at the world market level. While two research questions tackled this aim, the results showed marked differences between both cocoa chains. We also faced a scarcity of indicators of a holistic sustainability assessment. Such findings highlight the complexity of evaluating of sustainability conditions, encourage future discussion, and motivate frameworks to evaluate the cocoa chain comprehensively at all levels.
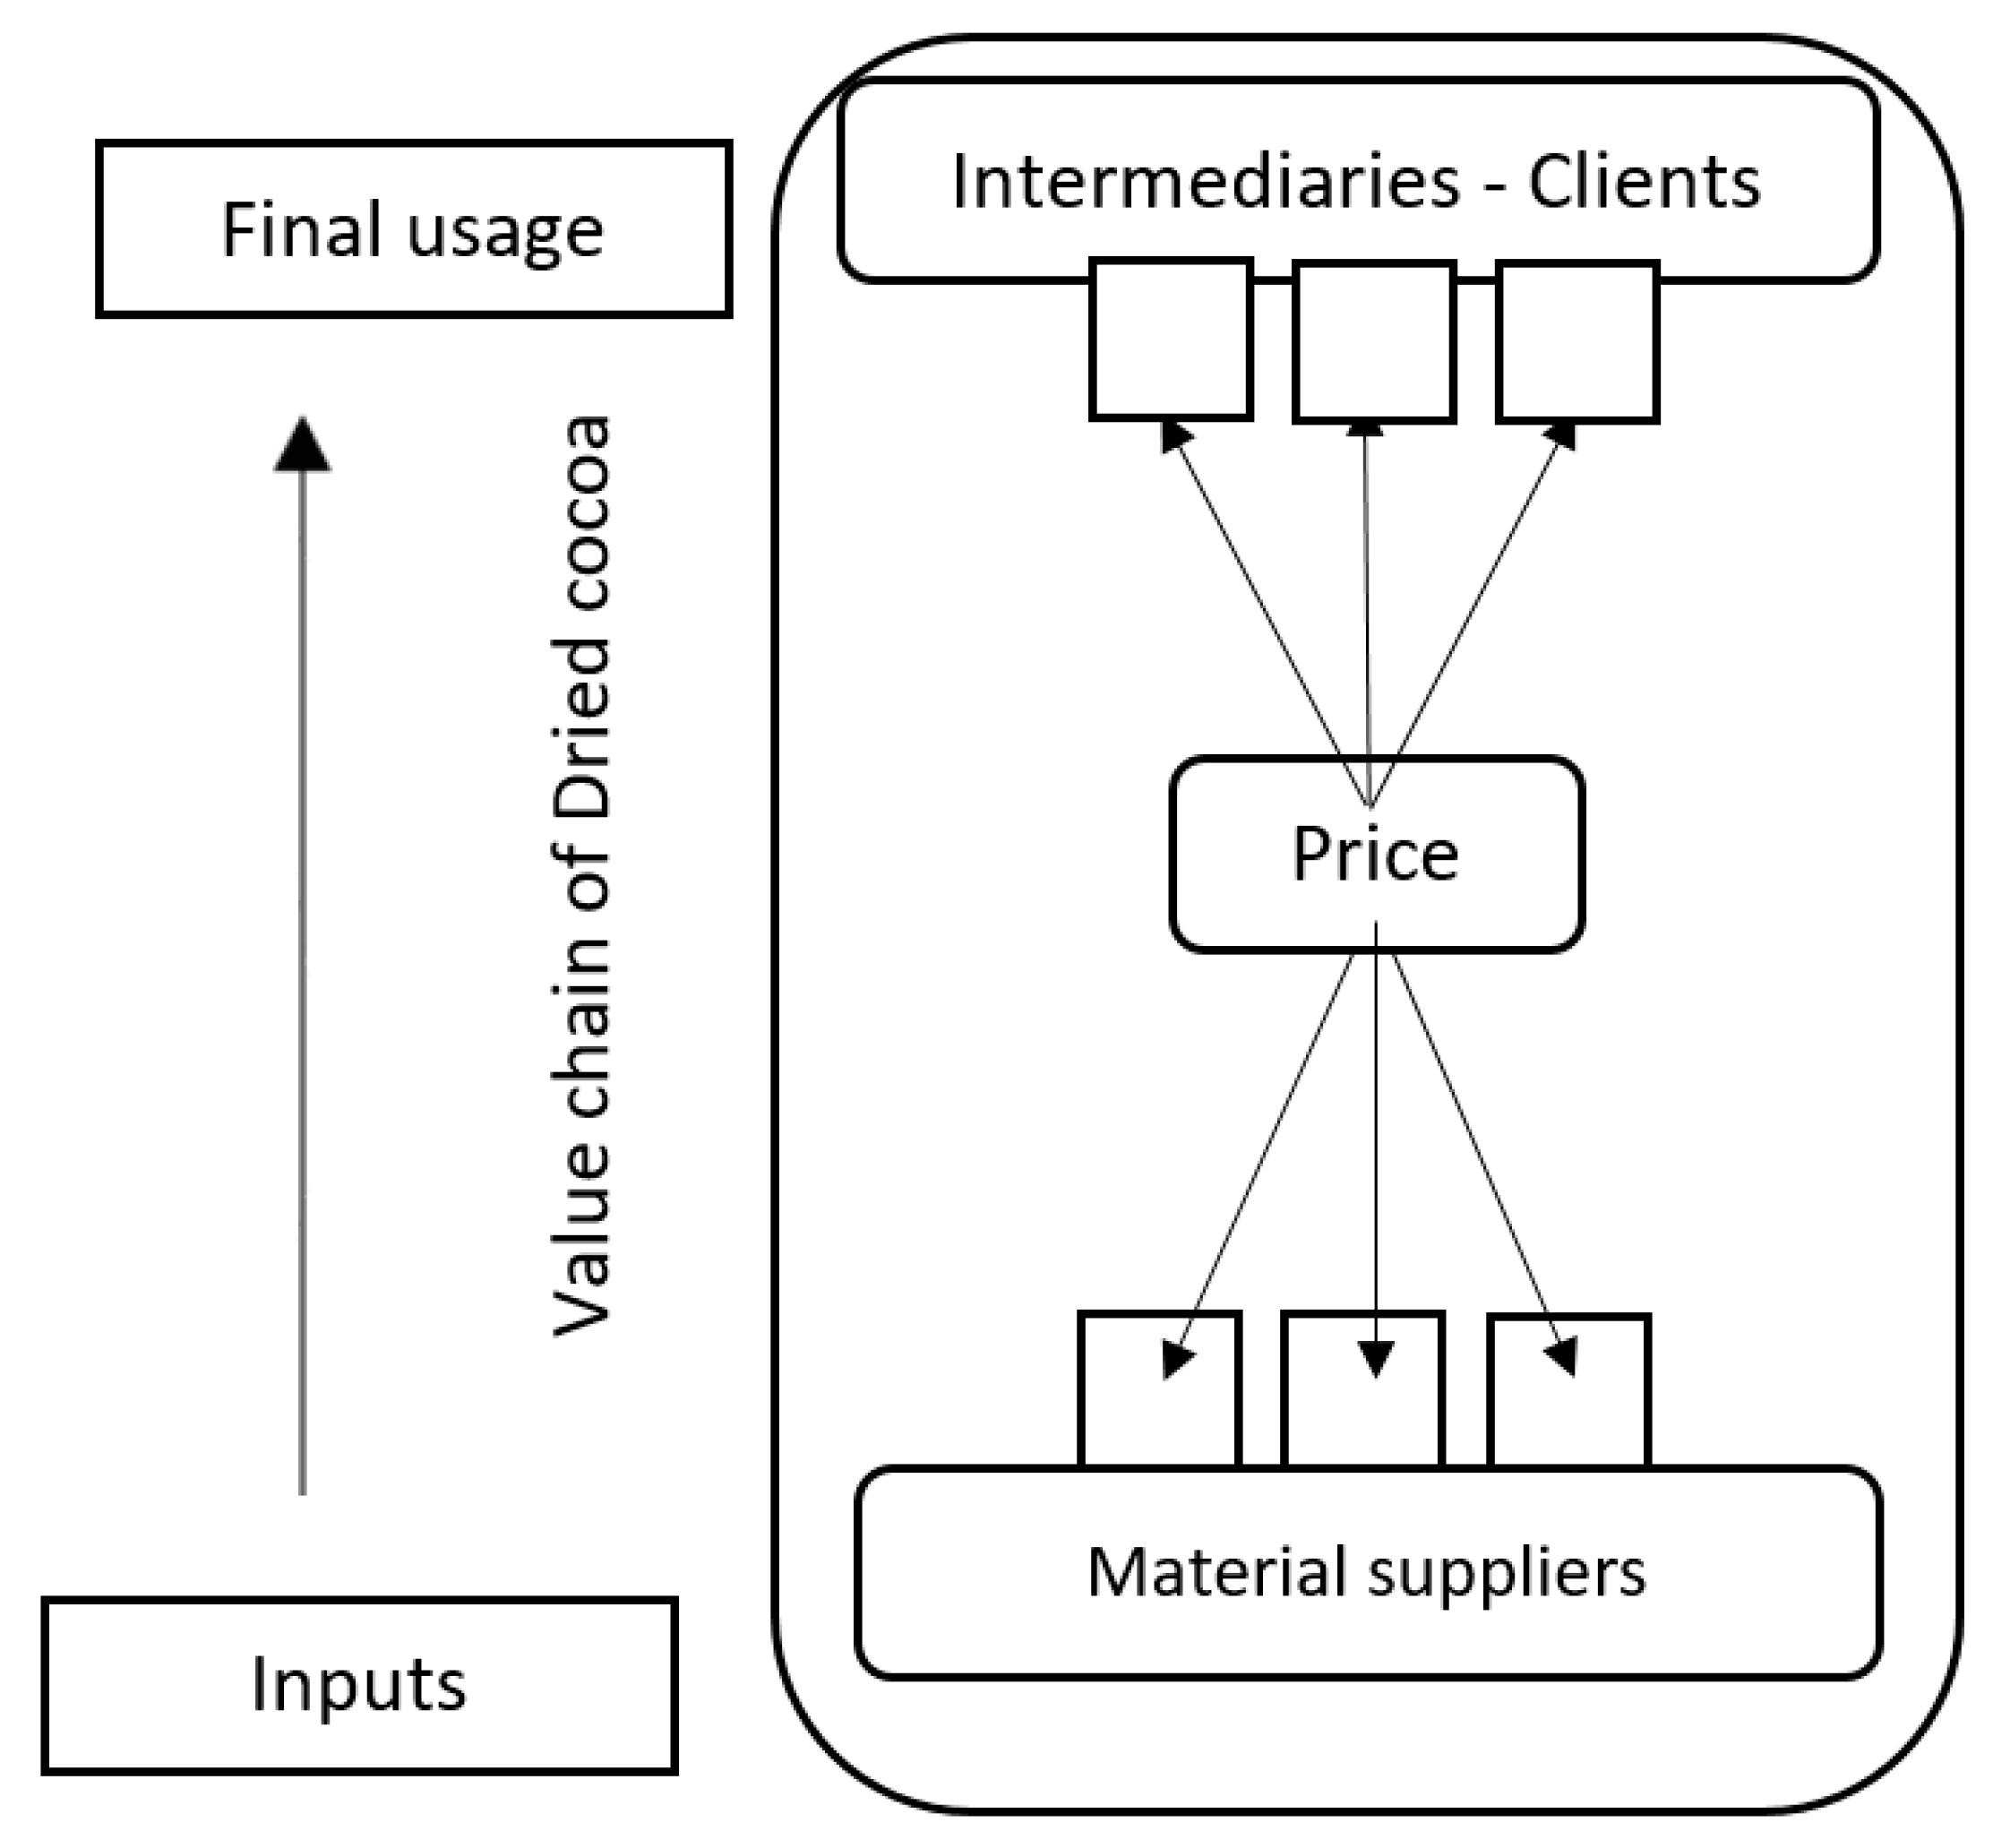
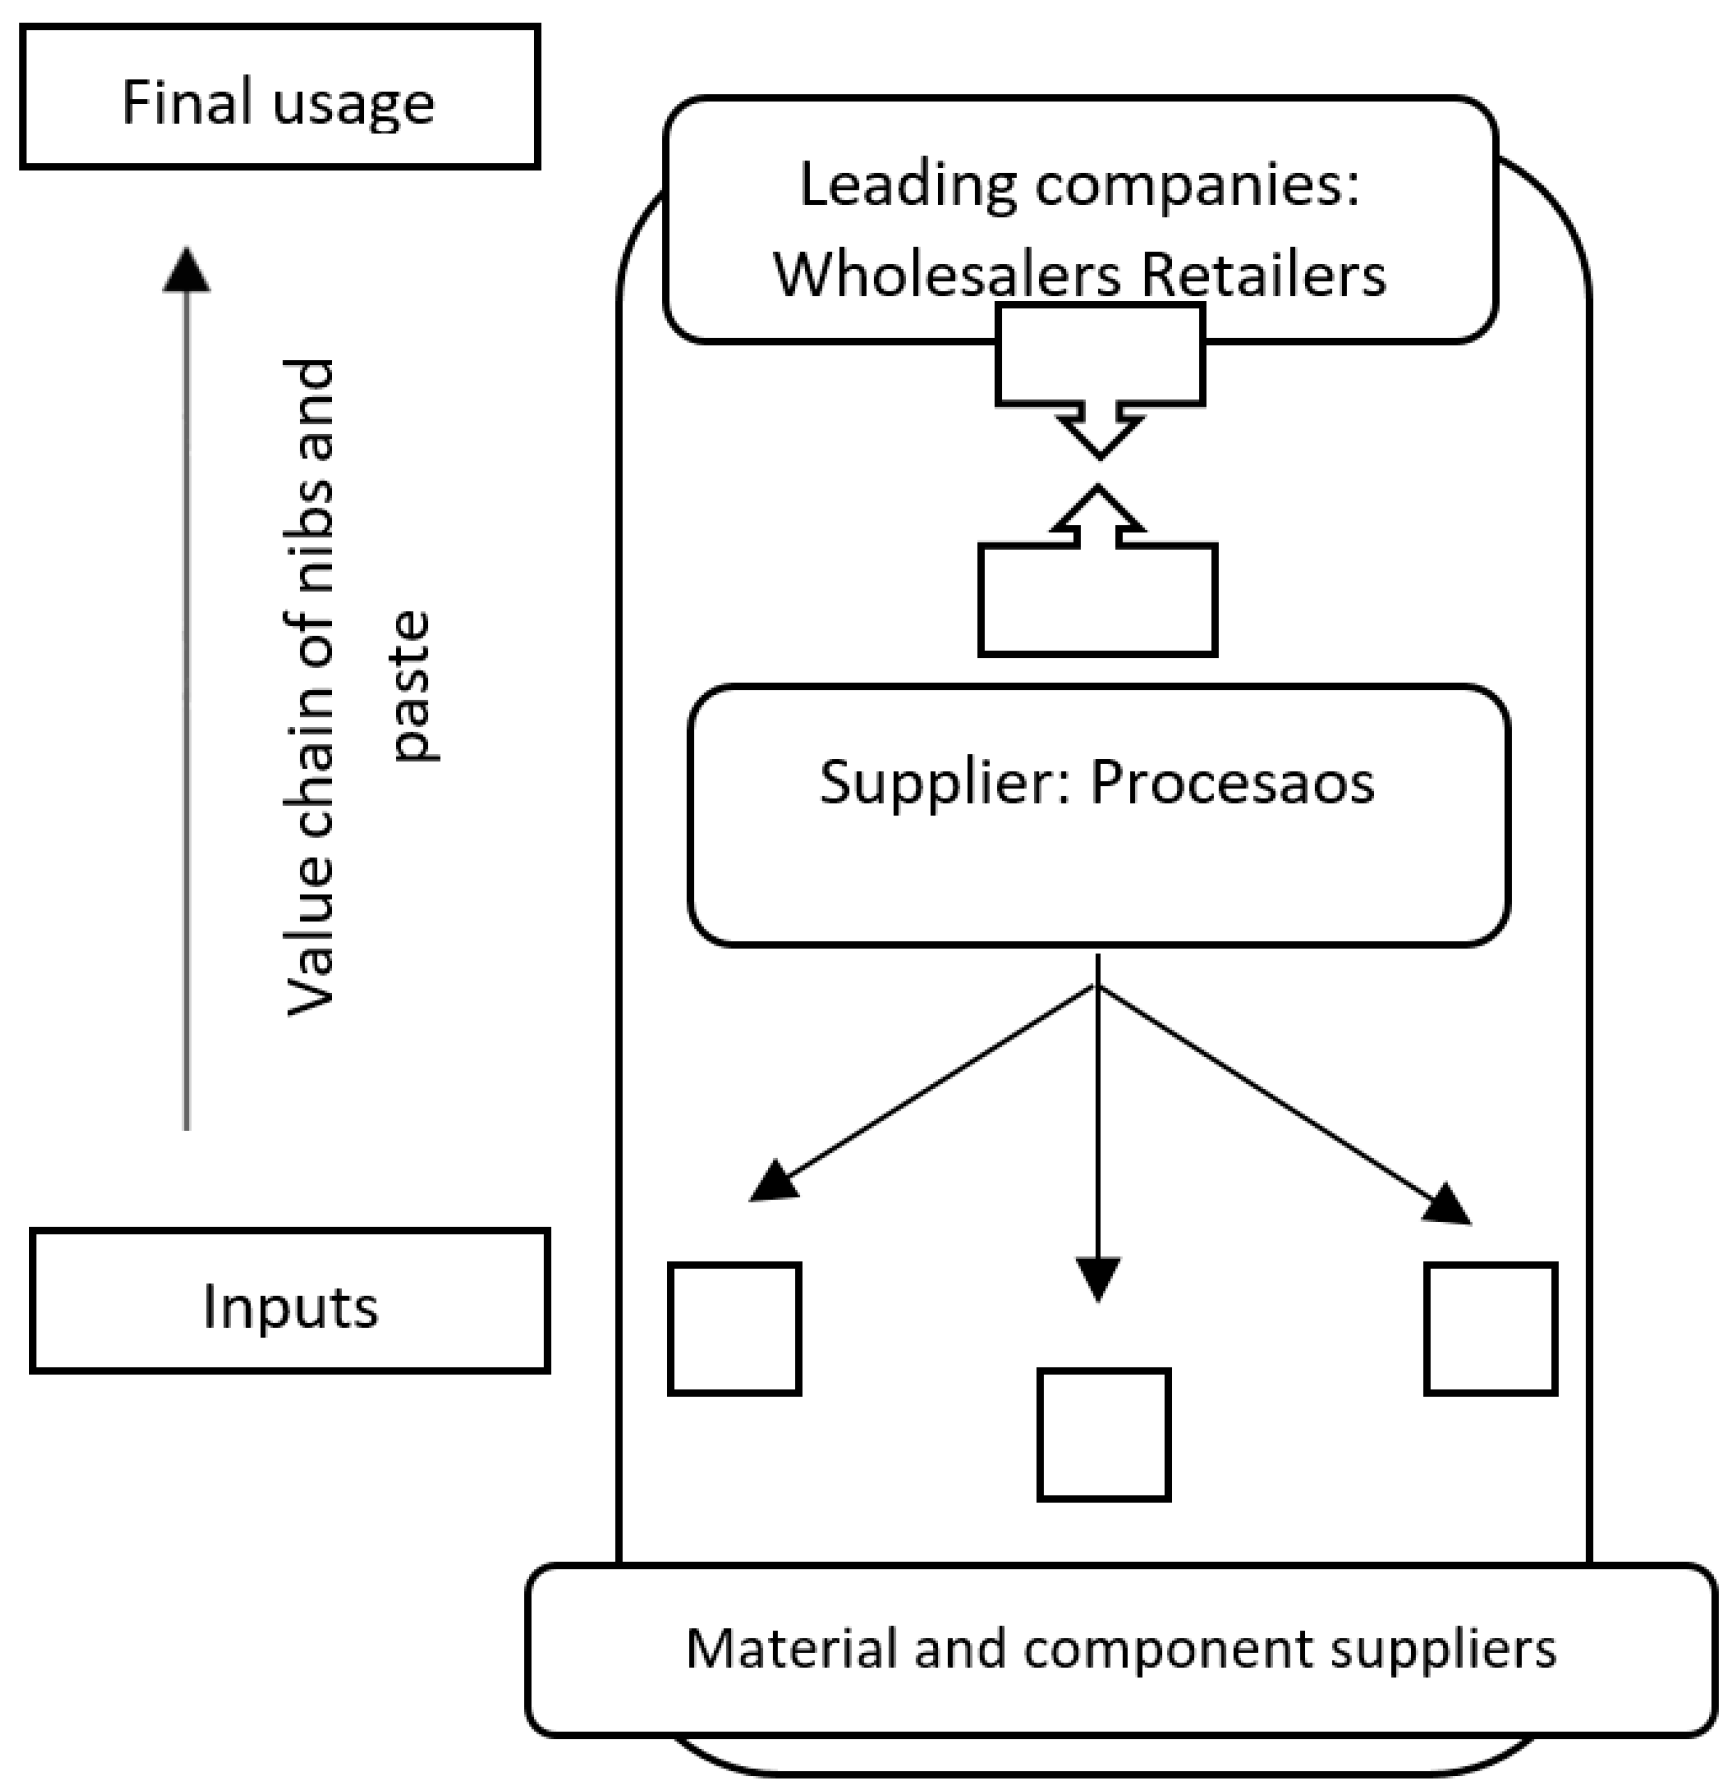
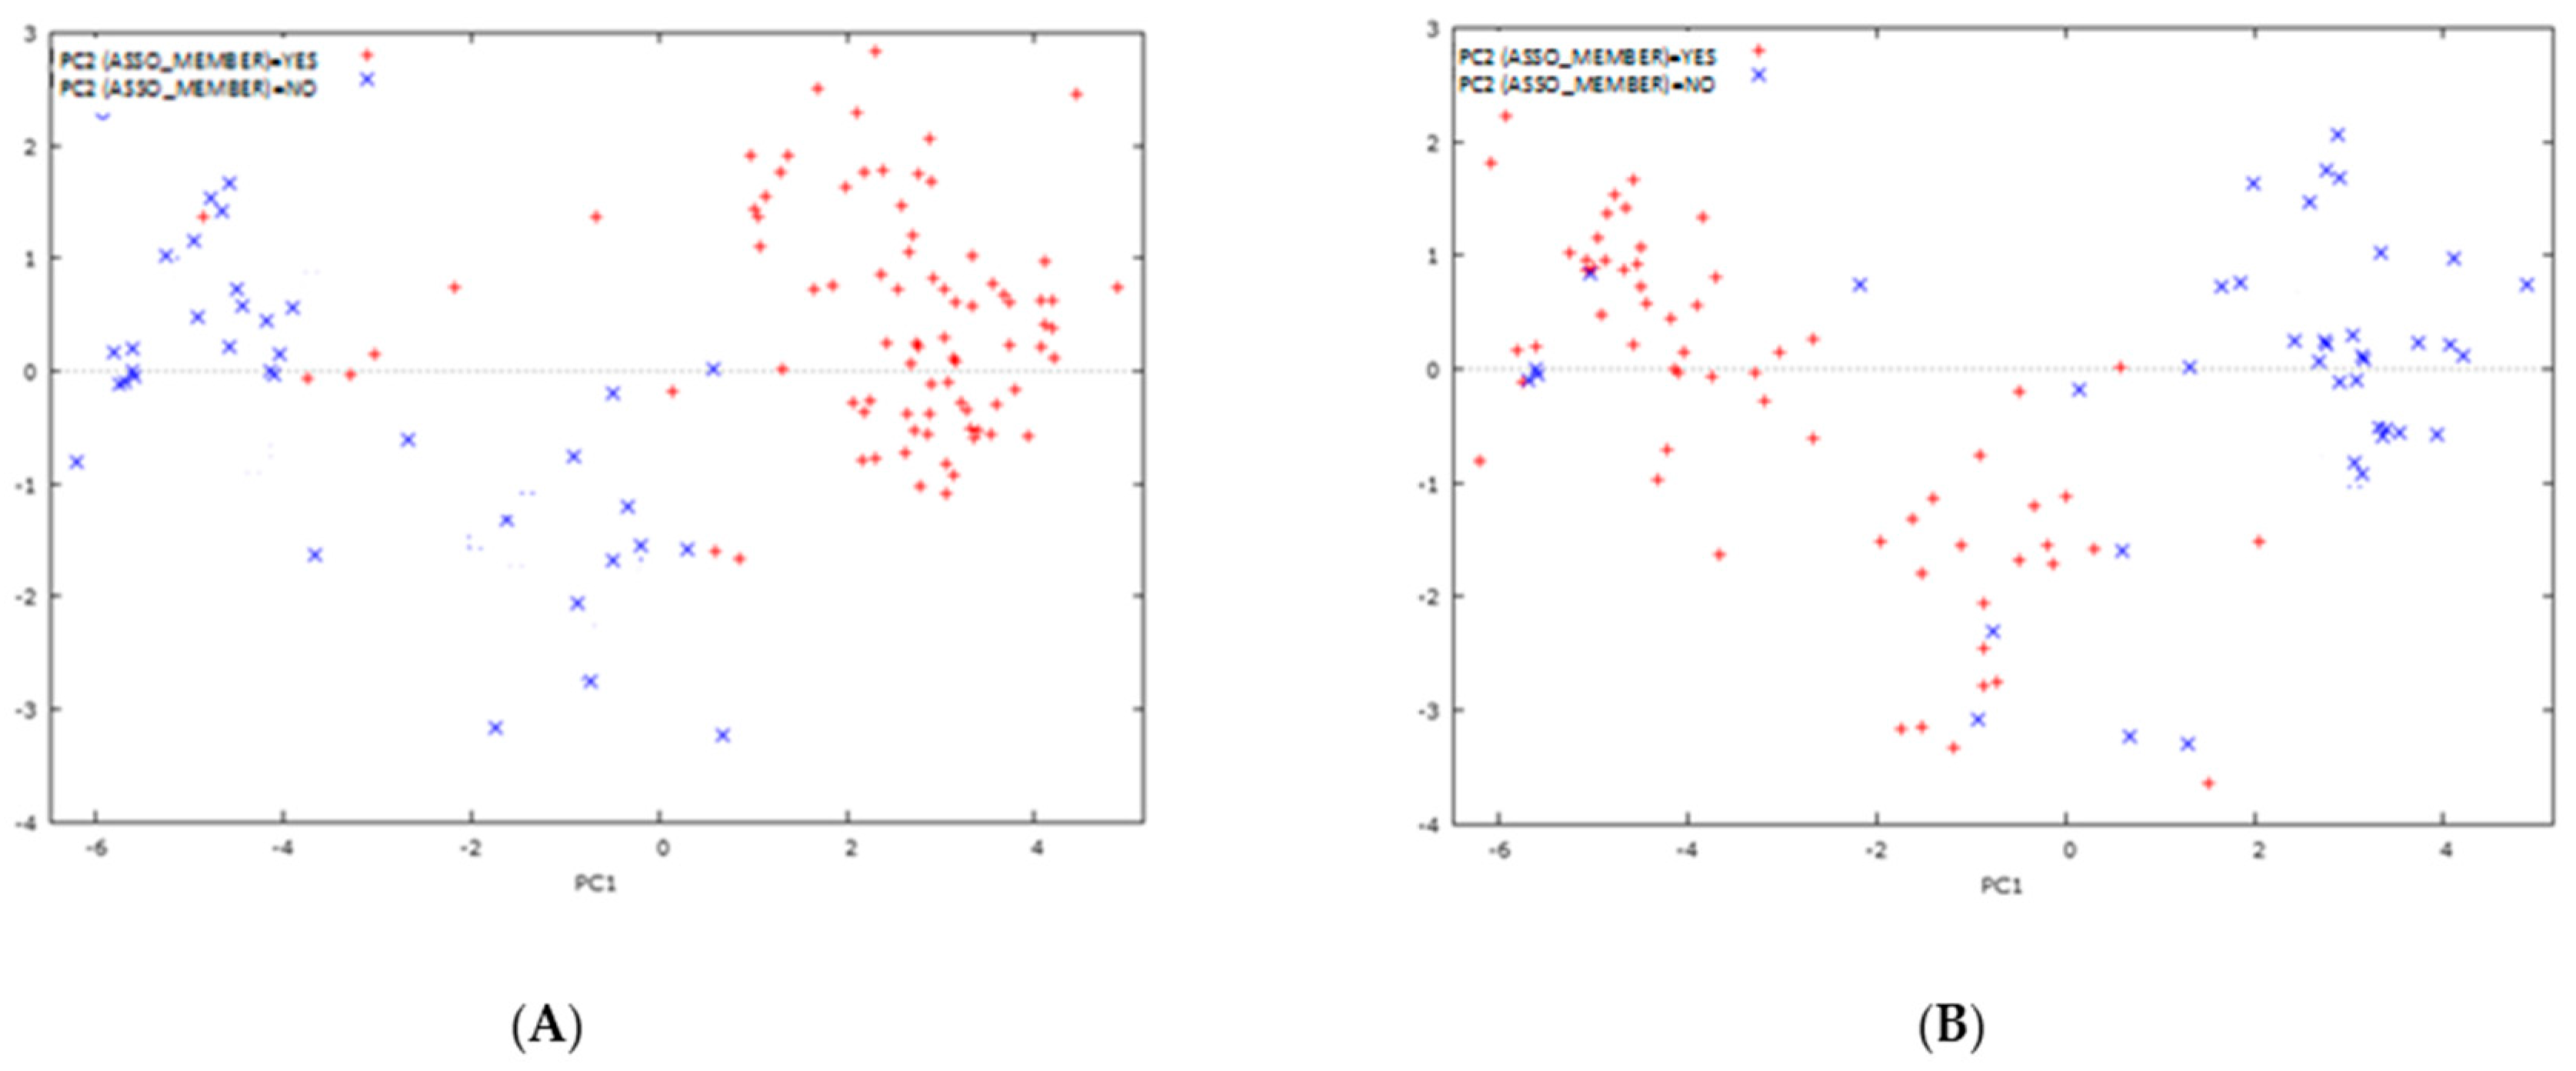
The results of our study suggest that the Arriba PDO chain shows a disadvantage in the age profile of its population, which constitutes a possible threat. The education level of Arriba workers, as well as their associativity, are lower. Regarding academic formation, actors required an integrated perspective to make decisions effectively. Likewise, differences in monthly income pointed out a drawback for Arriba cocoa PDO producers. Together, this information allowed us to conclude that market differentiation principals are essential to recognize the implications of a good PDO, and help producers receive fair benefits. The public entities in charge of monitoring the production of Cacao Arriba, and those that manage local and international market intelligence systems, have not been able to establish such a differentiation. This issue is the main fault presented by the PDO chain. Moreover, the strategies for the two circuits, CCN-51 and Arriba, are different. CCN-51 cocoa was designed for mass markets and the industrialization of comparable products [65], such as nibs, cocoa powder, and degreased chocolate for toppings, among others. Cocoa Arriba is a good whose sensory potential must be exploited in consumer goods with a high degree of quality and differentiation, that is, in exclusive market segments.
Moreover, the study realized an urgent need for differentiated value-added procedures to address cost efficiency and improve margins for producers, SMEs, and entrepreneurs. In addition, governance played a crucial role in the performance of the PDO chain. Consequently, we confirm the inconsistency of equal establishment strategies for both chains, executed by public bodies. The modular governability of the PDO chain shows the need to design and strengthen precise information flows, that are aimed at achieving high value-added consumer goods. We believe that the market for processed Cocoa Arriba-based goods has full reception at the local level, and even more so in global markets [66]. Europe, Asia, and North America are markets which demand this type of good. Regarding perception, actors of both chains mentioned agronomic factors, such as cocoa variety, land tenure, cultivation technique, number of crops, and post-harvest practices, as the main drivers of economic sustainability. The PDO chain showed little interest in the price mechanism, since the world market is expanding, and actors are looking for a significant transition towards a sustainable chain. Apart from that, findings concluded that future research on integrated ecological and institutional practices within the multi-level approach are necessary [67]. Future studies must focus on different labor and agricultural practice regulations and policies, to monitor their significant role in the adoption of sustainable models.

Author Contributions

Conceptualization, C.M.-M. and R.M.; methodology, C.M.-M. and J.J.; software, P.M.; validation, J.S.; formal analysis C.M.-M. and R.M.; investigation, J.J. and P.M.; writing-original draft preparation, C.M.-M. and J.S.; writing-review and editing, C.M.-M. and R.M.

Funding

This research was financially supported by the Faculty of Science and Engineering of Food and Biotechnology, Technical University of Ambato, UTAFCIAB0221-Sustainability of agri-food chains.

Acknowledgments

The authors acknowledge support from researchers of Agricultural Economics and Rural Policy Group, Wageningen University & Research.

Conflicts of Interest

Authors declare no conflict of interest.

References

  1. Rusconi, M.; Conti, A. Theobroma cacao L., the Food of the Gods: A scientific approach beyond myths and claims. Pharmacol. Res. 2010, 61, 5–13. [Google Scholar] [CrossRef] [PubMed]
  2. Soria, V. Principal varieties of cocoa cultivated in tropical America. In Cocoa Growers’ Bulletin; United States Department of Housing and Urban Development: Wallingford, UK, 1970. [Google Scholar]
  3. Abbey, P.; Tomlinson, P.; Branston, J. Perceptions of governance and social capital in Ghana’s cocoa industry. J. Rural Stud. 2016, 44, 153–163. [Google Scholar] [CrossRef]
  4. Ton, G.; Hagelaars, G.; Laven, A.; Vellema, S. Chain Governance, Sector Policies and Economic Sustainability in Cocoa: A Comparative Analysis of Ghana, Côte D’Ivoire, and Ecuador. SSRN Electron. J. 2008. [Google Scholar] [CrossRef]
  5. The state of Agricultural Commodity Markets: Cocoa. Available online: http://www.fao.org/3/I9542EN/i9542en.pdf (accessed on 19 October 2019).
  6. Alemagi, D.; Duguma, L.; Minang, P.A.; Nkeumoe, F.; Feudjio, M.; Tchoundjeu, Z. Intensification of cocoa agroforestry systems as a REDD+ strategy in Cameroon: Hurdles, motivations, and challenges. Int. J. Agric. Sustain. 2015, 13, 187–203. [Google Scholar] [CrossRef]
  7. Petithuguenin, P.; Roche, G. Ecuador: The cocoa sector, results and prospects. Plant. Rech. Dev. 1995, 2, 15–26. [Google Scholar]
  8. Ministry of Agriculture—MAG. Ecuador es el Primer Exportador de Cacao en Grano de América; Ministerio de Agricultura y Ganadería: Quito, Ecuador, 2018. [Google Scholar]
  9. Kozicka, M.; Tacconi, F.; Horna, D. Forecasting Cocoa Yields for 2050; Bioversity International: Rome, Italy, 2018. [Google Scholar]
  10. Coffee and Cocoa. Available online: https://www.agricultura.gob.ec/cafe-cacao/ (accessed on 18 October 2019).
  11. National Association of Cocoa Exporters—ANECACAO. Production of Cocoa Bean Varieties in Ecuador; ANECACAO: Guayaquil, Ecuador, 2019. [Google Scholar]
  12. Sepúlveda, W.S.; Ureta, I.; Mendoza, C.; Chekmam, L. Ecuadorian Farmers Facing Coffee and Cocoa Production Quality Labels. J. Int. Food Agribus. Mark. 2018, 30, 276–290. [Google Scholar] [CrossRef]
  13. A Traceability System for Amazonian Cocoa UNDP. Available online: https://www.elcomercio.com/tendencias/sistema-trazabilidad-cacao-amazonico-educacion.html (accessed on 19 October 2019).
  14. Portalanza, D.; Barral, M.P.; Villa-Cox, G.; Ferreira-Estafanous, S.; Herrera, P.; Durigon, A.; Ferraz, S. Mapping ecosystem services in a rural landscape dominated by cacao crop: A case study for Los Rios province, Ecuador. Ecol. Indic. 2019, 107, 105593. [Google Scholar] [CrossRef]
  15. Recovery of Production and Improvement of the Quality of National Cocoa. Available online: https://www.vicepresidencia.gob.ec/wp-content/uploads/2015/07/Resumen-Cadena-de-Cacao-rev.pdf (accessed on 20 October 2019).
  16. Protected Designation of Origin Cocoa Arriba. Available online: https://www.derechosintelectuales.gob.ec/ (accessed on 20 October 2019).
  17. Macías Barberán, J.R.; Cuenca Nevárez, G.J.; Intriago Flor, F.G.; Caetano, C.M.; Menjivar Flores, J.C.; Pacheco Gil, H.A. Vulnerability to climate change of smallholder cocoa producers in the province of Manabí, Ecuador. Revista Facultad Nacional de Agronomía Medellín. 2019, 72, 8707–8716. [Google Scholar] [CrossRef]
  18. Collinson, C.; Leon, M. Economic Viability of Ethical Cocoa Trading in Ecuador; Greenwich Academic Literature Archive: Greenwich, UK, 2000. [Google Scholar]
  19. Argüello, D.; Chavez, E.; Lauryssen, F.; Vanderschueren, R.; Smolders, E.; Montalvo, D. Soil properties and agronomic factors affecting cadmium concentrations in cacao beans: A nationwide survey in Ecuador. Sci. Total Environ. 2019, 649, 120–127. [Google Scholar] [CrossRef]
  20. Council of Supply Chain Management Professionals—CSCMP. Supply Chain Management Terms and Glossary; CSCMP: Lombard, IL, USA, 2010. [Google Scholar]
  21. Ballou, R.H.; Gilbert, S.M.; Mukherjee, A. New Managerial Challenges from Supply Chain Opportunities. Ind. Mark. Manag. 2000, 29, 7–18. [Google Scholar] [CrossRef]
  22. Gereffi, G.; Humphrey, J.; Sturgeon, T. The governance of global value chains. Int. Political Econ. 2005, 12, 78–104. [Google Scholar] [CrossRef]
  23. Lamine, C.; Renting, H.; Rossi, A.; Wiskerke, J.S.; Brunori, G. Agri-Food systems and territorial development: Innovations, new dynamics and changing governance mechanisms. In Farming Systems Research into the 21st Century: The New Dynamic; Springer: Dordrecht, The Netherlands, 2012; pp. 229–256. [Google Scholar]
  24. Shleifer, A. Understanding Regulation. In European Financial Management; John Wiley & Sons Ltd.: Hoboken, NJ, USA, 2005; Volume 11, pp. 439–451. [Google Scholar]
  25. World Commission on Environment and Development—WCED. Our Common Future; Report of the World Commision on Environment and Development; WCED: New York, NY, USA, 1987. [Google Scholar]
  26. Stoorvogel, J.J.; Antle, J.M.; Crissman, C.C.; Bowen, W. The tradeoff analysis model: Integrated bio-physical and economic modeling of agricultural production systems. Agric. Syst. 2004, 80, 43–66. [Google Scholar] [CrossRef]
  27. Yakovleva, N. Measuring the Sustainability of the Food Supply Chain: A Case Study of the UK. J. Environ. Policy Plan. 2007, 9, 75–100. [Google Scholar] [CrossRef]
  28. Salmoral, G.; Willaarts, B.A.; Garrido, A.; Guse, B. Fostering integrated land and water management approaches: Evaluating the water footprint of a Mediterranean basin under different agricultural land use scenarios. Land Use Policy 2017, 61, 24–39. [Google Scholar] [CrossRef]
  29. Carter, C.R.; Easton, P.L. Sustainable supply chain management: Evolution and future directions. Int. J. Phys. Distrib. Logist. Manag. 2011, 41, 46–62. [Google Scholar] [CrossRef]
  30. Ruiz, K.; Biondi, S.; Oses, R.; Acuña-Rodríguez, I.; Antognoni, F.; Martinez, E.; Jacobsen, S. Quinoa biodiversity and sustainability for food security under climate change. Sustain. Dev. 2014, 34, 349–359. [Google Scholar] [CrossRef]
  31. Smetana, S.; Mathys, A.; Palanisamy, M.; Heinz, V. Sustainability of insect use for feed and food: Life Cycle Assessment perspective. J. Clean. Prod. 2016, 137, 741–751. [Google Scholar] [CrossRef]
  32. Tuesta, O.; Santistevan, M.; Borjas, R.; Castro, V.; Julca, A. Sustainability of cacao farms in the district of Huicungo (San Martín, Perú) with the “rapid agroecological method”. Peruv. J. Agron. 2017, 1, 8–13. [Google Scholar] [CrossRef]
  33. Edwards, C.; Lal, R.; Madden, P.; Miller, R.; House, G. Sustainable Agricultural Systems; St. Lucie: Delray Beach, FL, USA, 1990. [Google Scholar]
  34. Von Bertalanffy, L. An outline of general system theory. Br. J. Philos. Sci. 1950, 12, 30–49. [Google Scholar] [CrossRef]
  35. Thies, C.; Kieckhäfer, K.; Spengler, T.S.; Sodhi, M.S. Operations research for sustainability assessment of products. Eur. J. Oper. Res. 2019, 274, 1–21. [Google Scholar] [CrossRef]
  36. Ecuadorian Association of Cocoa Exporters—ANECACAO. Agricultor ecuatoriano logró Denominación de Origen Cacao-Arriba; ANECACAO: Guayaquil, Ecuador, 2017. [Google Scholar]
  37. Pustjens, A.M.; Muilwijk, M.; Weesepoel, Y.; Ruth, S.M. Advances in Authenticity Testing of Geographical Origin of Food Products. Adv. Food Authent. Test. 2016, 339–367. [Google Scholar] [CrossRef]
  38. Gateau-Rey, L.; Tanner, E.V.J.; Rapidel, B.; Marelli, J.-P.; Royaert, S. Climate change could threaten cocoa production: Effects of 2015-16 El Niño-related drought on cocoa agroforests in Bahia, Brazil. PLoS ONE 2018, 13, e0200454. [Google Scholar] [CrossRef] [PubMed]
  39. Estupiñán, M. Análisis de la situación actual de las asociaciones productoras del sector cacaotero en el cantón Rioverde con perspectivas de exportación; PUCESA—Escuela de Comercio Exterior: Ambato, Ecuador, 2018. [Google Scholar]
  40. Arevalo, M.; González, D.; Delgado, T.; Maroto, S.; Montoya, P. Estado actual sobre el comercio de cacao en América; IICA: San José, Costa Rica, 2016. [Google Scholar]
  41. Pino, S.; Aguilar, H.; Sisalema, L. The Denomination of origin for cocoa arriba. Holy Grail 2018, 39, 1–15. [Google Scholar]
  42. National Institute of Intellectual Property—IEPI. Denominación de Origen; IEPI: Quito, Ecuador, 2019. [Google Scholar]
  43. Inter-American Institute for Cooperation on Agriculture—IICA. Estrategia IICA–Ecuador 2014–2018; IICA: Quito, Ecuador, 2014. [Google Scholar]
  44. Ogus, A. Regulatory law: Some lessons from the past. Legal Stud. 1992, 12, 1–19. [Google Scholar] [CrossRef]
  45. Ogus, A. Regulation: Legal Form and Economic Theory; Hart Publishing: Oxford, UK, 1994. [Google Scholar]
  46. Ogus, A. Evaluating alternative regulatory regimes: The contribution of Law and economics. Geoforum 1999, 30, 223–229. [Google Scholar] [CrossRef]
  47. Aidoo, R.; Fromm, I. Willingness to Adopt Certifications and Sustainable Production Methods among Small-Scale Cocoa Farmers in the Ashanti Region of Ghana. J. Sustain. Dev. 2015, 8, 33. [Google Scholar] [CrossRef]
  48. Ecuadorian Institute of Intellectual Property—IEPI. Análisis de la primera propuesta normativa de un Consejo Regulador para la Denominación de Origen Cacao Arriba; IEPI: Quito, Ecuador, 2010. [Google Scholar]
  49. Pollak, R.; Terence, W. Demographic variables in demand analysis. Econom. J. Econom. Soc. 1981, 49, 1533–1551. [Google Scholar] [CrossRef]
  50. Saunders, R.; Motl, R.; Dowda, M.; Dishman, R.; Pate, R. Comparison of Social Variables for Understanding Physical Activity in Adolescents. Am. J. Health Behav. 2004, 28, 426–436. [Google Scholar] [CrossRef]
  51. Aigner, D.; Chu, S. On estimating the industry production function. Am. Econ. Rev. 1968, 58, 826–839. [Google Scholar]
  52. Granger, C. Developments in the study of cointegrated economic variables. Oxf. Econ. Stat. 1986, 48, 213–228. [Google Scholar] [CrossRef]
  53. Sukhatme, P. Sampling Theory of Surveys, with Applications; Indian Society of Agricultural Statistics: New Delhi, India, 1954. [Google Scholar]
  54. Hawkes, C.; Ruel, M. Value Chains for Nutrition; International Food Policy Research Institute: Washington, DC, USA, 2011. [Google Scholar]
  55. Dotoli, M.; Fanti, M.; Meloni, C.; Zhou, M. A multi-level approach for network design of integrated supply chains. Int. J. Prod. Res. 2005, 43, 4267–4287. [Google Scholar] [CrossRef]
  56. Melnyk, S.; Sroufe, R.; Calantone, R. Assessing the impact of environmental management systems on corporate and environmental performance. J. Oper. Manag. 2003, 21, 329–351. [Google Scholar] [CrossRef]
  57. Jolliffe, I.T. Principal Component Analysis, 2nd ed.; Springer: Berlín, Germany, 2002. [Google Scholar]
  58. Díaz-Montenegro, J.; Varela, E.; Gil, J.M. Livelihood strategies of cacao producers in Ecuador: Effects of national policies to support cacao farmers and specialty cacao landraces. J. Rural Stud. 2018, 63, 141–156. [Google Scholar] [CrossRef]
  59. National Institute of Statistics—INEC. Population and Housing Census; INEC: Quito, Ecuador, 2010. [Google Scholar]
  60. Viteri Salazar, O.; Ramos-Martín, J.; Lomas, P.L. Livelihood sustainability assessment of coffee and cocoa producers in the Amazon region of Ecuador using household types. J. Rural Stud. 2018, 62, 1–9. [Google Scholar] [CrossRef]
  61. International Cocoa Organization—IICO. Cocoa Market Review; IICO: London, UK, 2019. [Google Scholar]
  62. Ecuadorian Standardization Service-INEN. NTE INEN 0176: Cacao en grano. Requisitos; INEN: Quito, Ecuador, 2006. [Google Scholar]
  63. Ding, D.; Chen, J. Coordinating a three level supply chain with flexible return policies. Omega 2018, 36, 865–876. [Google Scholar] [CrossRef]
  64. Scherer, F.; Ross, D. Industrial Market Structure and Economic Performance; University of Illinois at Urbana-Champaign’s: Champaign, IL, USA, 1990. [Google Scholar]
  65. Porter, M.; Sachs, J.; McArthur, J. Competitiveness and Stages of Economic Development; Macmillan Press: London, UK, 2002. [Google Scholar]
  66. Banchuen, P.; Sadler, I.; Shee, H. Supply chain collaboration aligns order-winning strategy with business outcomes. IIMB Manag. Rev. 2017, 29, 109–121. [Google Scholar] [CrossRef] [Green Version]
  67. Martín-Gómez, A.; Aguayo-González, F.; Luque, A. A holonic framework for managing the sustainable supply chain in emerging economies with smart connected metabolism. Resour. Conserv. Recycl. 2019, 141, 219–232. [Google Scholar] [CrossRef]
Figure 1. Sustainability assessment framework for an agri-food value chain.
Agriculture 09 00229 g001
Figure 2. Map of geographical area of Arriva cocoa cultivars in Ecuador.
Agriculture 09 00229 g002
Figure 3. Monthly averages of daily prices. Source: [61].
Agriculture 09 00229 g003
Figure 4. Mapping of the Cocoa Chain at Los Ríos District.
Agriculture 09 00229 g004
Figure 5. Governance mechanism at CCN-51 cacao chain.
Agriculture 09 00229 g005
Figure 6. Governance mechanism at Arriba chain.
Agriculture 09 00229 g006
Figure 7. (A) Scatter plot of Arriba producers and associativity; (B) Scatter plot of CCN-51 producers and associativity.
Agriculture 09 00229 g007
Table 1. Standards of Cacao Arriba Protected Designations of Origin (PDO) and CCN-51.
Cocoa ArribaCCN-51
RequirementUnitASSPSASSSASSASNASE
One Hundred Grainsg135–140130–135120–125110–115105–110135–140
FermentationGood%756560442665 ***
Slight *%10105102711
Total%857565545376
BiophysicalViolet%101521252518
Slaty%491218185
Mold%112341
Total number of defects (over 500 g)%00134 **1
Note: ASSPS, Arriba superior summer plantation selecto); ASSS, Arriba superior summer selecto; ASS, Arriba superior selecto; ASN, Arriba superior navidad; ASE, Arriba superior época; * brown colour, with pale violet zones, ** presence of rough rice only for the ASE type; *** colour varying from brown to violet. Source: [48].
Table 2. Number of producers and cocoa production area.
ProvinceDistrictNumber of Producer FamiliesArea of Production (ha)
Los RiosBuena Fe12201884.5
Ventanas6301025.2
Vinces470821.4
Source: [10].
Table 3. Socio-economic characteristics of cocoa-producing families.
Proportion
VariableMeanCCN-51ArribaDifference (p)
Gender (n = 250)
Female 52.064.0
Male 48.036.0
Age (head of family) (n = 250)
<18 años172.51.90.057 *
19–25 años2314.64.70.048 **
26–40 años3454.68.20.028 **
41–55 años4617.664.20.039 **
56–65 años598.213.70.025 **
>66 años682.57.30.435
Education (head of family) (n = 250)
Primary 12.422.5
Secundary 48.151.3
College 39.526.2
Associativity (households) (n = 250)
Members 44.957.4
Non-members 55.142.6
Montly household income (n = 250)
<700 USD62511.414.60.001 ***
701–1000 USD83019.634.50.021 **
1001–1300 USD122025.229.70.027 **
1301–1700 USD158038.317.80.032 **
>1700 USD19505.53.40.001 ***
Note: Difference (p) represents the p-value significance of two population t-test with unequal sample sizes and unequal variances: ∗∗∗∗ for < 0.001, ∗∗∗ for < 0.01, ∗∗ for < 0.05, and ∗ for < 0.1.
Table 4. Biophysical standards of cocoa.
Standard
Type of GrainDegree IDegree II
MoldyMax. 3%Max. 4%
SlatyMax. 3%Max. 8%
Flattened, blossomed or insects affectionMáx. in total 3%Máx. in total 6%
Source: [62].
Table 5. Producers’ perception of the relative importance of productive performance aspects.
Relative FrecuencyAggregate Score
VariableExtremely IrrelevantIrrelevantNeutralVery RelevantExtremely RelevantMeanSD
Acreage2.21.514.338.143.94.310.85
Cocoa acreage2.13.719.240.334.64.270.77
Production cost 2.54.528.238.925.93.690.89
Yields3.14.933.736.222.13.550.92
Financing2.55.938.132.521.03.690.91
Land tenure2.95.740.234.916.33.670.88
Price1.53.238.736.520.13.660.91
Cocoa variety1.39.832.638.218.13.630.95
Cultivation technique9.412.526.330.721.13.582.47
Additional crops4.510.231.834.319.23.580.77
Post harvest practices2.519.738.125.913.82.980.84
Associativity18.222.230.218.111.32.741.35
Table 6. Matrix of extracted components from PCA analysis of Arriba cocoa producers.
Component
123
VariableLand tenure0.961
Cultivation technique0.855
Associativity0.827
Postharvest practices0.818
Acreage 0.875
Production cost 0.862
Cocoa acreage 0.795
Yields 0.761
Financing 0.733
Additional crops 0.725
Price 0.772
Eigenvalue4.4221.5241.102
Statistical factorsVariance %38.47115.21816.531
Cumulative variance %38.47153.68970.220
Cronbach alpha0.8910.8950.758
Mean3.112.532.89
Table 7. Matrix of extracted components from PCA analysis of CCN-51 cocoa producers.
Component Matrix
123
VariableAdditional crops 0.824
Cultivation technique0.811
Land tenure0.752
Postharvest practices0.623
Production cost 0.951
Financing 0.983
Yields 0.845
Cocoa acreage 0.839
Acreage 0.712
Price 0.753
Associativity 0.694
Eigenvalue4.2771.6711.215
Statistical factorsVariance %35.52218.19614.112
Cumulative variance %35.52253.71867.830
Cronbach alpha0.8660.8990.761
Mean3.052.732.71

