Article

On the Evolution of Trade and Sanitary and Phytosanitary Standards: The Role of Trade Agreements

by
Fabio Gaetano Santeramo
*,
Valentina Guerrieri
and
Emilia Lamonaca
Department of Science of Agriculture, Food and Environment, University of Foggia, via Napoli 25, 71121 Foggia, Italy
*
Author to whom correspondence should be addressed.
Agriculture 2019, 9(1), 2; https://doi.org/10.3390/agriculture9010002
Submission received: 25 November 2018 / Revised: 13 December 2018 / Accepted: 19 December 2018 / Published: 21 December 2018
(This article belongs to the Special Issue Agriculture Policies: Experiences and Challenges)

Abstract

:
Trade agreements and trade measures are policy instruments thought to favour trade by providing a degree of harmonisation among members. We analyse how the agri-food trade and the incidence of Sanitary and Phytosanitary Standards (SPSs) have evolved within countries sharing agreements. We examine, through a regression discontinuity design, whether the approval of agreements affects the evolution of trade and SPSs over time, and quantify the trade effects of SPSs. We also provide differences before and after the introduction of agreements, and among the most regulated agri-food products. Findings show that trade agreements tend to favour the increase of trade and the reduction of policy measures between members. However, regulation inequalities exist across trade agreements covering different geo-economic areas: after the approval of agreements, the existence and the importance of SPSs become relevant among developing countries, whereas the pervasiveness of SPSs becomes less stringent between developed and developing countries. Our analyses also prove that trade agreements and trade measures are trade-enhancing only at aggregate level: product-specific analyses show that cereal is the only sector that benefits from the joint influence of trade agreements and SPSs. The harmonisation of SPSs within agreements may be determinant in avoiding distortions in favour of members.

1. Introduction

Deep changes have characterised the global agri-food sector over the last decades: an outcome of the economic globalisation that has stimulated the development of global commodity chains and has created a deep economic integration [1,2].
By facing such continuous changes, policymakers have attempted to progressively liberalise the agri-food trade: multilateral and country-specific negotiations have been longstanding at the forefront of the trade policy agenda [3]. In particular, the multilateral negotiations of the World Trade Organisation (WTO) in the mid-1990s have provided a substantial reduction of tariffs, balanced out by the wide diffusion of non-tariff measures (NTMs) [4]. In parallel with the multilateral negotiations, several agreements have evolved at regional level to further liberalise trade: the higher the initial level of trade regulations between members, the larger the trade liberalisation. In particular, the latter may occur through a process of convergence from above (e.g., by lowering regulations) or from below (e.g., by raising harmonised regulations) [5].
Trade regulations and their harmonisation between members are thus relevant issues in the negotiation agenda of trade agreements, due to their controversial impacts on trade [6]. In fact, while a number of studies conclude that NTMs are trade-impeding [7,8], others demonstrate that they are trade-enhancing [9]. In addition, several studies support both the barrier and the catalyst roles of NTMs in trade [10,11,12]. The heterogeneous effects of policy measures on trade are frequently related to the different types of NTMs and their rationales, but might also be a consequence of the specific products and countries under investigation [13].
Most of the existing literature focuses on the trade effects of NTMs, distinguishing between country-specific and internationally harmonised measures [14,15], or on the effects of trade agreements, in particular on trade creation and diversion [3,16,17]. By contrast, in the academic debate, little attention has been given to the role of NTMs as trade barriers or catalysts in the context of trade agreements. An exception is the study by Disdier et al. [6] that examines whether, in the framework of economic integration agreements among developed and developing countries, the harmonisation of technical measures affects international trade. Their analysis suggests that trade agreements create trade between developed and developing members, but also divert trade between developing members and developing non-members. They also argue that the harmonisation of trade measures on the basis of regional standards negatively impacts trade from developing to developed countries.
However, this evidence calls for further research: are differences, in terms of trade impact, observable in a context wider than the developed-developing agreements, or at the sector level? We aim at filling this gap by investigating if and how the approval of trade agreements affects the evolution of trade and NTMs over time. We also examine the trade effects of policy measures before and after the introduction of the agreements.
Our focus is on the most adopted NTMs in the agri-food sector: Sanitary and Phytosanitary Standards (SPSs). We use a large dataset on country-specific trade flows and SPSs which includes data, from 1990 to 2015, on the major developed and developing countries sharing trade agreements. The empirical analysis is built on a regression discontinuity design [18,19], that allows us to conclude on specific trade impacts of SPSs before and after the entry into force of trade agreements. Moreover, sector-specific analyses highlight differences among the most regulated agri-food products.

On Trade Agreements and Technical Non-Tariff Measures in the Agri-Food Sector

The general increase and the changing patterns of trade intensity have characterised the agri-food sector over the last decades [13]. Such phenomena may be the consequence of the progressive process of trade liberalisation and of the impact of specific provisions to fulfil trade agreements. In fact, the agenda of trade negotiations has shifted from tariffs (reduced to an average lower than 5%) to a wide range of behind-the-border trade measures [6].
The vast majority of countries have sought to improve their market access though preferential, bilateral, and regional trade agreements: while multilateral negotiations have stalled, a number of collective agreements has entered into force (Figure 1). Since 2000, the number of new agreements notified to the World Trade Organisation (WTO) experienced a considerable growth: in 2017, the trade agreements equalled 314 (compared to 96 in 2000), of which 90% were regional (RTAs) and 10% preferential (PTAs) [20,21].
Trade agreements may facilitate market access by lowering tariffs cuts and providing other market access concessions [22]. In particular, trade agreements have a dual effect on trade response: they push toward the creation of intra-bloc trade, and lead to trade diversion toward developing countries [6,23,24]. Mutually beneficial trade liberalisation is more likely to be achieved within country-specific agreements rather than in a heterogeneous multilateral framework. In fact, country-specific agreements are more versatile and allow us to easily address trade negotiations that cover the increasing range of non-tariff measures (NTMs) [6].
The NTMs, defined as “policy measures other than ordinary customs tariffs that can potentially have an economic effect on international trade in goods, changing quantities traded, or prices or both” [25] (p. 1), may be technical or nontechnical. In particular, technical NTMs may be raised to protect human, animal, and plant health from risks arising from contaminants or disease-causing organisms (Sanitary and Phytosanitary Standards, SPSs), or to lay down characteristics that products, related processes, and production methods should ensure (Technical Barriers to Trade, TBTs).
The intensity of technical regulations implemented per year in the agri-food sector has substantially grown in a century (from 325 in 1910 to 664,738 in 2016, [26]), showing heterogeneous patterns across periods, countries, product categories, and types of measures. In particular, the number of technical NTMs, negligible until the mid-1990s, experienced an exponential increase after 1994 (+360%, from 120,272 implemented until 1994 to 554,446 until 2016, [26]). In fact, the negotiations of the WTO determined the proliferation of the NTMs in response to a large reduction in tariffs [4,13].
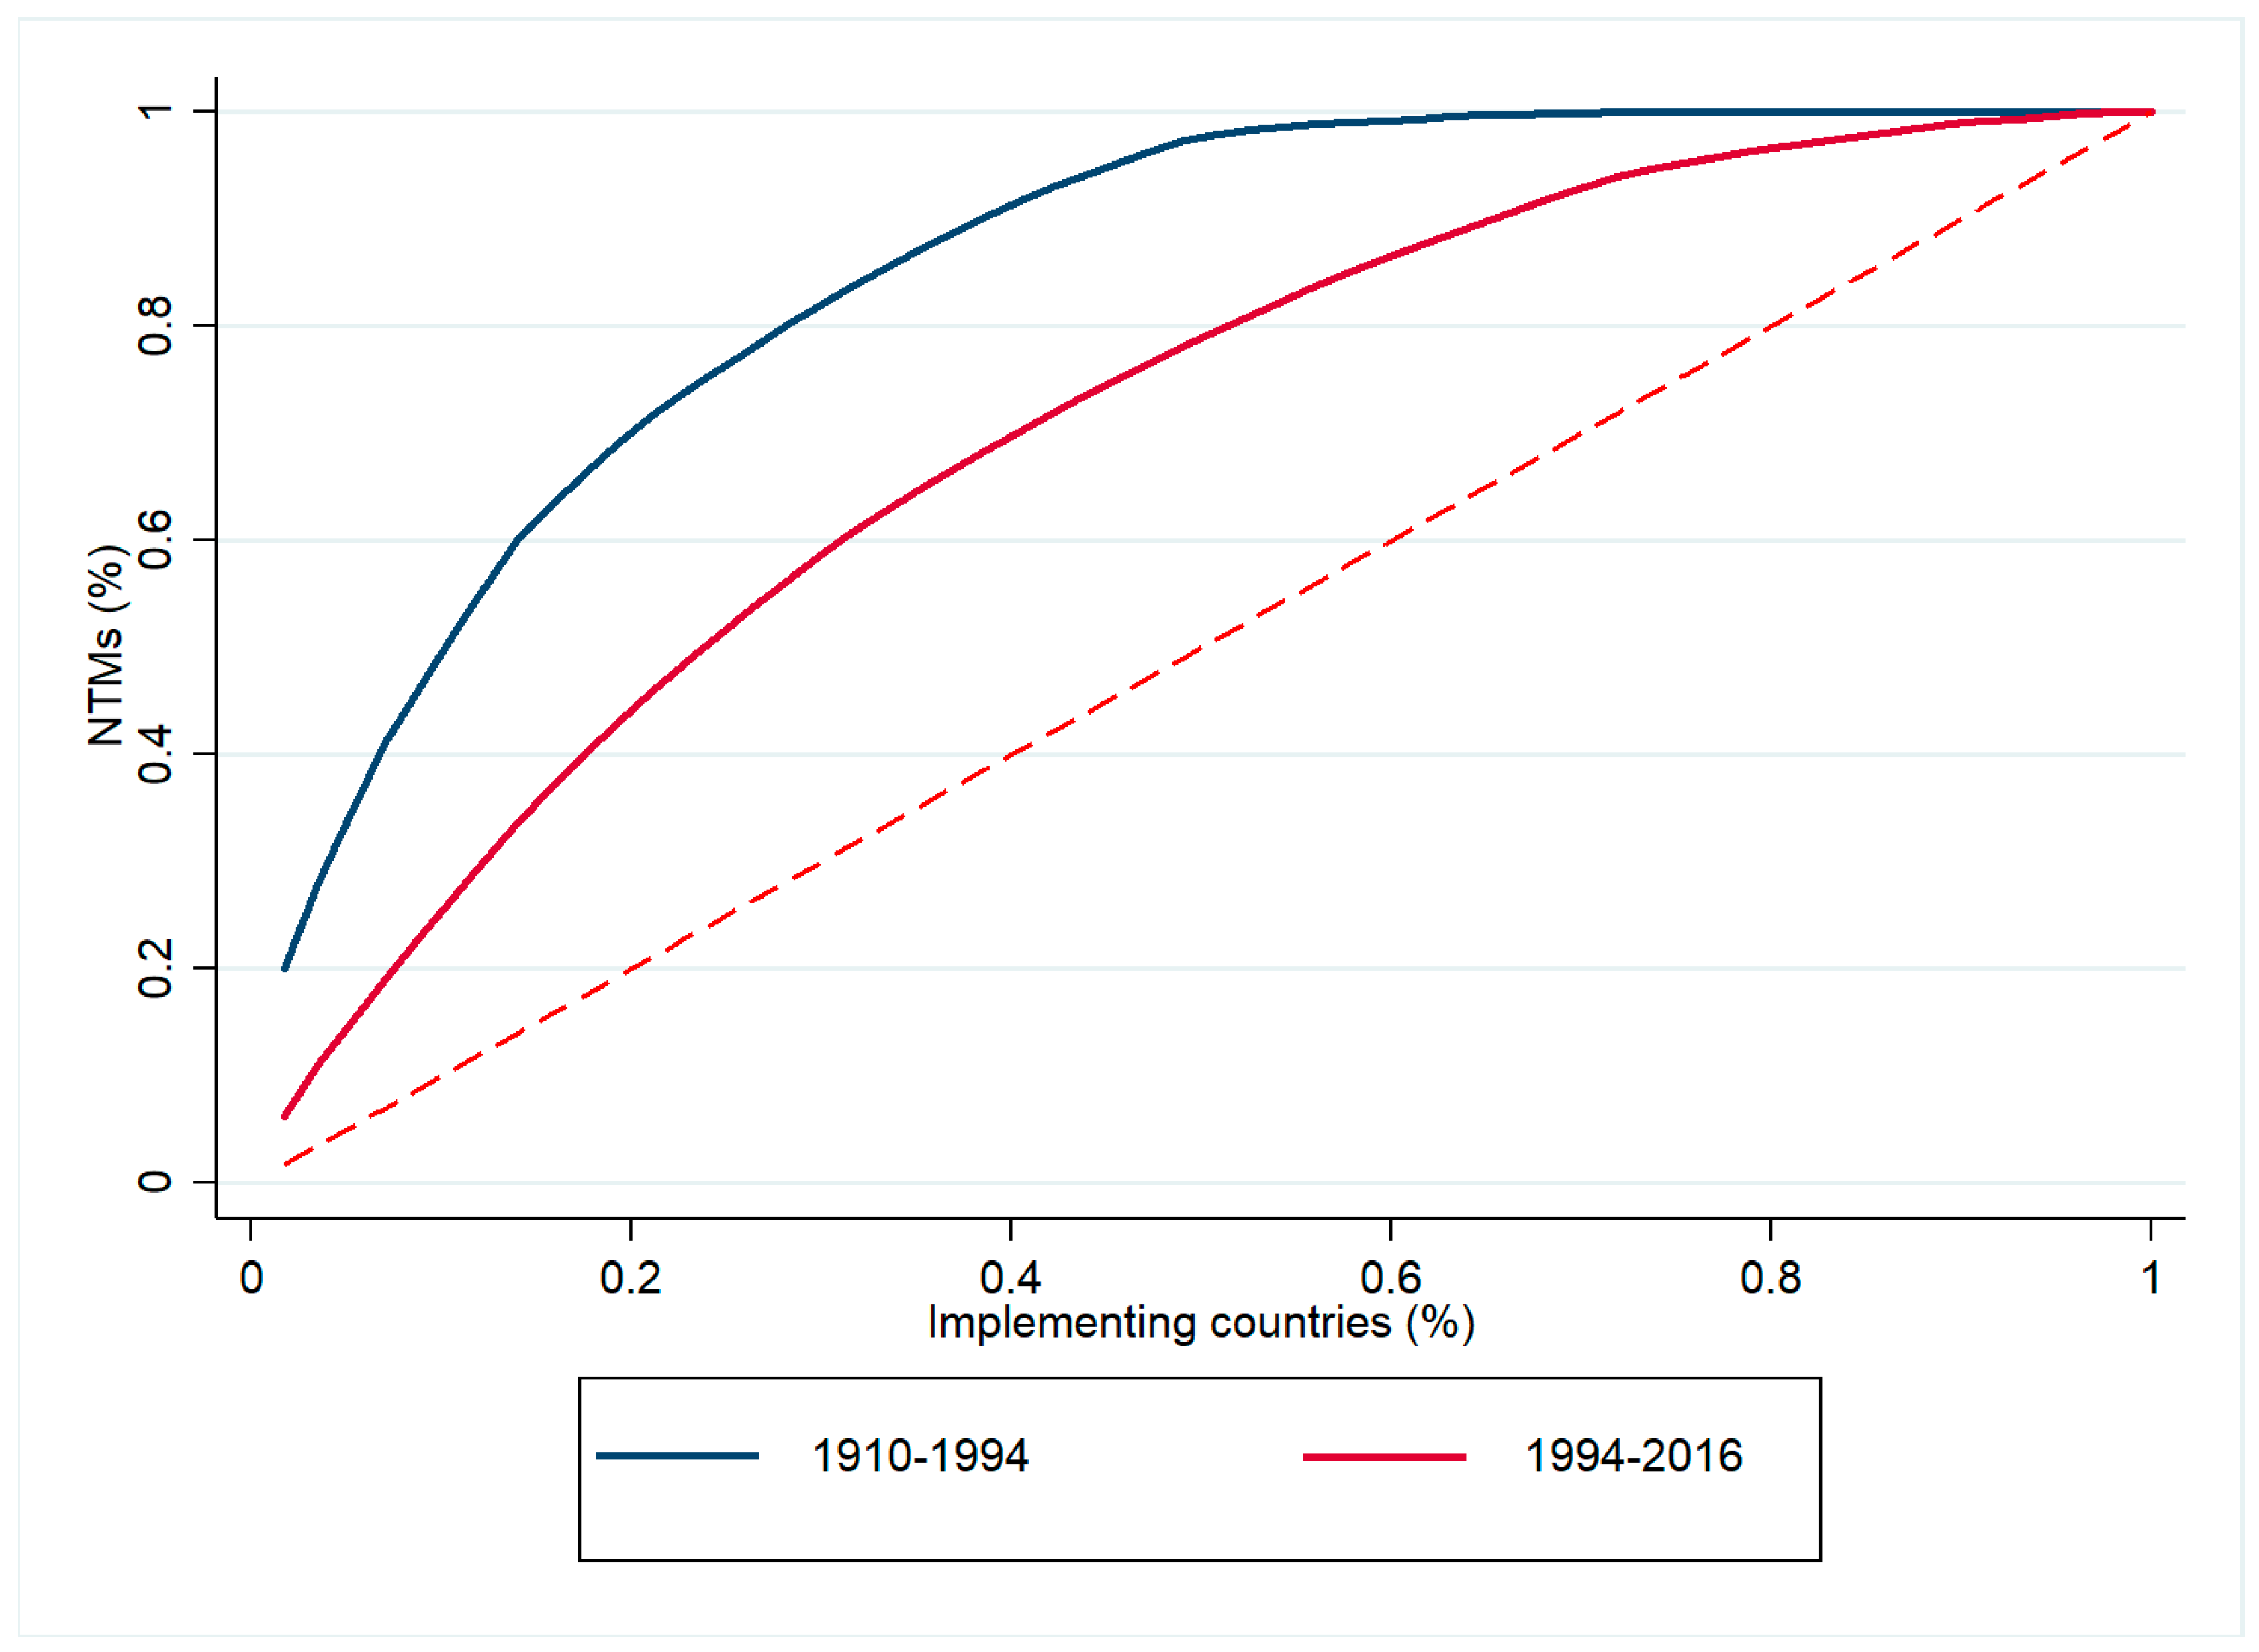
Despite only few countries being responsible for the wide diffusion of technical NTMs, the number of implementing countries has increased by 30% from pre- (1910–1994) to post-Uruguay Round era (1995–2016). Approximately 70% of technical NTMs were implemented by 20% of countries before 1994 and by 40% of countries after 1994 (lower concavity of the cumulative density function 1995–2016, Figure 2) [26]. In particular, in recent times there has been an increase of regulations in developing countries, which tend to affirm their role in the WTO consultations [27,28].
While countries implementing technical NTMs and types of measures have changed over time, there have been no substantial variations in the incidence of technical NTMs in specific agri-food sectors. In fact, seafood and meat-based products, fruit and vegetables, dairy produce, preparations of meat and fish, oilseeds and cereals are the longstanding most affected sectors [26].
In addition, of technical NTMs the most widespread are the SPSs, whose number has largely exceeded the TBTs one over years. As for types of SPSs, the most implemented have been (in descending order) certification and inspection requirements (SPSs A830 and A840), special authorisation requirement for SPS reasons (SPS A140), restricted use of certain substances in foods and feeds and their contact materials (SPS A220) and labelling requirements (SPS A310); while the incidence of SPSs A830, A840, A140, A220 reduces by 50% after the Uruguay Round, the opposite is true for SPS A310 [26].
The WTO members may arbitrarily raise or lower SPSs, provided that the SPSs comply with basic principles of the WTO’s SPS Agreement that establish conditions under which national regulatory authorities may set safety standards directly or indirectly influencing international trade [29]. Accordingly, the SPSs have to be based on objective scientific data (justification of measures); need to be consistent with international standards defined by the Office International des Épizooties (OIE) for animal health, the International Plant Protection Convention (IPPC) for plant health, and the Codex Alimentarius Commission for food safety (harmonisation of standards); may be country- or region-specific due to differences in sources and levels of risk (regionalisation); have to be accepted as alternative measures by trading partners to ensure the same level of accepted risk (equivalency); should be based on appropriate risk assessment procedures if standards exceed the international ones (risk assessment); have to be notified and/or explained to trading partners if modified or of new introduction (transparency); may be provisional (temporary measures) and/or subject to dispute settlement.
The compliance with principles of the SPS Agreement allow us to progressively standardise the trade effects of SPSs that, as suggested in [30], reflect divergences among countries’ food safety regulations, differences in consumers’ preferences across countries, ability (or limited capacity) to produce safe food, and willingness to pay for risk-reducing technology.

2. Materials and Methods

2.1. Description of Data

Our analysis relies on bilateral, annual data for 19 countries from 1990 to 2015. According to the United Nations’ country classification [31], we select developed economies (Australia, Canada, the European Union, New Zealand, and the United States) and developing economies (Congo, Egypt, Libya, Morocco, and Tunisia for Africa; Argentina, Bolivia, and Peru for Latin America; Brazil, Russian Federation, Indonesia, India, China, and South Africa (i.e., BRIICS countries), with the Russian Federation listed as an economy in transition [31], but considered a developing country for argument’s sake) to account for 77% of the global gross domestic product (GDP). In 2015, developed economies, BRIICS countries, Egypt, and Peru were listed as the top 25% economies for the level of GDP. All these economies have benefited from a general growth in global welfare from 1990 to 2015: in particular, Bolivia and Congo have more than quadrupled their GDPs, while Libya, Morocco, and Tunisia have tripled their GDPs [32]. Since 2000, the importance of developing economies and of BRIICS countries has driven the development of global agri-food markets. In particular, most of the increased share of BRIICS’ agri-food trade represents increased trade with other BRIICS countries.
Bilateral trade data are collected from the UN Comtrade database; data on country-specific Sanitary and Phytosanitary Standards (SPSs) are provided by the Global Database on Non-Tariff Measures of the United Nation Conference on Trade and Development (UNCTAD); the Regional Trade Agreements Information System (RTA-IS) and the WTO Database on Preferential Trade Arrangements (PTAs) provide available information doe RTAs and PTAs (e.g., year of entry into force, signatory countries, involved regions).
We focus on the 8 most regulated categories in the agri-food sector, coded according to the Harmonised System (HS) 2-Digit Chapter Headings: in descending order, fish (03, 27%), meat (02, 14%), vegetables (07, 9%), dairy produce (04, 8%), preparation of meat and fish (16, 8%), fruits (08, 7%), oil seeds (12, 5%), cereals (10, 3%) [26]. We work at the two-digit level in order to avoid potential endogeneity bias implied by measures implemented for protectionist purposes or to control imports in the absence of sizeable tariffs [33].

2.2. Inventory Approach

We analyse the incidence of Sanitary and Phytosanitary Standards (SPSs) within Regional Trade Agreements (RTAs) through an inventory approach [34]. We compute the frequency index, the coverage ratio, and the prevalence score at the country-pair level (ij), two years before and two years after entry into force of the agreement (t ± 2) to better capture the effect of the agreements.
The frequency index is an indicator of the presence/absence of trade measures; it captures the percentage of products subject to one or more SPSs:
F i j , t   ±   2   =   [ i j D i j , t   ±   2 S P S D i j , t   ±   2 X i j D i j , t   ±   2 X ] · 100
where D i j , t   ±   2 S P S and D i j , t   ±   2 X are dummy variables that equal 1 if at least one SPS and trade flows (X) exist between i and j at time t − 2 and t + 2 (0 otherwise).
The coverage ratio reflects the importance of SPSs in overall trade; it captures the percentage of trade subject to one or more measures:
C i j , t   ±   2   =   [ i j D i j , t   ±   2 S P S X i j , t   ±   2 i j X i j , t   ±   2 ] · 100
where X i j , t   ±   2 is the value of trade between i and j at time t − 2 and t + 2.
The prevalence score accounts for the pervasiveness of trade measures; it captures the average number of SPSs implemented for a product.
P i j , t   ±   2   =   i j S P S i j , t   ±   2 ¯ D i j , t   ±   2 X i j D i j , t   ±   2 X
where S P S i j , t   ±   2 ¯ is the average number of SPSs applied between i and j at time t − 2 and t + 2: the larger the number of trade measures applied for each country-pair, the more stringent the regulation in that agreement.
We analytically examine the three indicators through descriptive statistics and graphical analyses. In particular, we compare the distributions of the frequency index, the coverage ratio, and the prevalence score before (at t − 2) and after (at t + 2) the year of entry into force of RTAs, highlighting differences and similarities among several agreements.

2.3. Empirical Approach

We investigate if and how the approval of a Regional Trade Agreement (RTA) affects the evolution of trade and of Sanitary and Phytosanitary Standards (SPSs) over time by adopting a regression discontinuity design [18,19]. We assume that the logarithm of trade flows ( ln ( X i j k ) ) and the number of implemented SPSs ( S P S i j k ) are a function of the overall time trend (t) and of the time trend after the introduction of a RTA (tpost-RTA):
ln ( X i j k )   =   δ   +   θ 0 t   +   k   =   1 K θ 1 k t p o s t     R T A D i j k   +   u i j k
and
S P S i j k   =   δ   +   θ 0 t   +   k   =   1 K θ 1 k t p o s t     R T A D i j k   +   u i j k
where the superscript k indexesagri-food products and the subscripts ij index country-pairs; δ is a constant, θ 0 and θ 1 k are the parameters of interest, u i j k is the error term. In the sensitivity analyses, the product-specific dummy variable ( D i j k ) allows us to capture the evolution of trade and SPSs in each agri-food sector.
As a further step, we examine the trade effects of the SPSs before and after the introduction of RTAs:
ln ( X i j k )   =   α   +   t   =   1 T β t   +   γ 0 S P S i j k   +   k   =   1 K γ 1 k S P S i j ,   p o s t R T A k D i j k   +   ε i j k
where β t representstime fixed effects; α is a constant, γ 0 and γ 1 k are the parameters of interest, ε i j k is the error term; ij, k, ln ( X i j k ) , S P S i j k , D i j k are defined as above.
We estimate Equations (4)–(6) through least squares and disentangle, from the overall effect (model A), the effect produced by the approval of RTAs (model B), and the product-specific effect (model C).

3. Results

3.1. Results of the Inventory Analyses

A vast majority of countries have at least one Regional Trade Agreement (RTA): in particular, we found that 13 out of 19 countries are involved in RTAs (Table 1). RTAs tend to be in place among countries with similar levels of economic development. In particular, the United States (US) and Canada, and Australia and New Zealand have stipulated an RTA (since the mid-1980s). RTAs are also established among Latin American countries, while China has trade agreements with Indonesia (since 2009) and Peru (since 2010). The Russian Federation and African countries have no RTAs in force: the only exception is Morocco that implemented one RTA with the US in2006. In addition, there are several RTAs stipulated among countries with different levels of economic development: among Peru and the US (since 2009); Peru and Canada (since 2010); Peru and the European Union (EU) (since 2013); Indonesia and Australia; Indonesia and New Zealand (since 2010).
From 1990 to 2015, the average value of trade was greater among countries belonging to RTAs than among countries that have no RTAs in place (266 million US$ compared to 79 million US$) [35]. Conversely, the average number of Sanitary and Phytosanitary Standards (SPSs) was lower among countries within RTAs (1.52 compared to 1.77) [26]. In line with Scoppola et al. [17], we find asymmetries between countries within and out of trade agreements.
As for countries sharing an RTA, Table 2 shows the evolution of trade and level of regulations, as well as of the frequency index, the coverage ratio, and the prevalence score two years before and two years after the introduction of RTAs (according to the date of entry into force of the agreements).
Trade values tend to be greater after the entry into force of RTAs in 13 out of 15 agreements. Few exceptions are the US and Australia, and Peru and the US, whose trade flows decrease by 87% and 23% respectively. By contrast, trade relationships are particularly favoured by RTAs for China and New Zealand or Indonesia (trade exponentially increased when RTAs are in place), and for Indonesia and Australia or India (trade nonexistent before the RTAs). In fact, as suggested by Grant and Lambert [36] (p. 766), a “successful liberalisation of agricultural trade within RTAs could generate a relatively larger trade response”.
Country-specific differences emerge in the level of SPSs. Nonexistent in the period pre-RTA, the SPSs started to regulate trade between developing countries after the approval of an RTA (i.e., between Latin American countries, and between Indonesia and China or India); in particular, the SPSs were implemented some year after the entry into force of the RTA between Bolivia and Brazil (since 2000), and between Argentina and Bolivia, and Bolivia and Peru (since 2003). The phase-in period of RTAs may have different lengths: in some cases, the harmonisation of trade policies between members may take several years [36]. The SPSs tend to be lower for countries with different levels of economic development sharing RTAs (exception made for Canada and Peru).
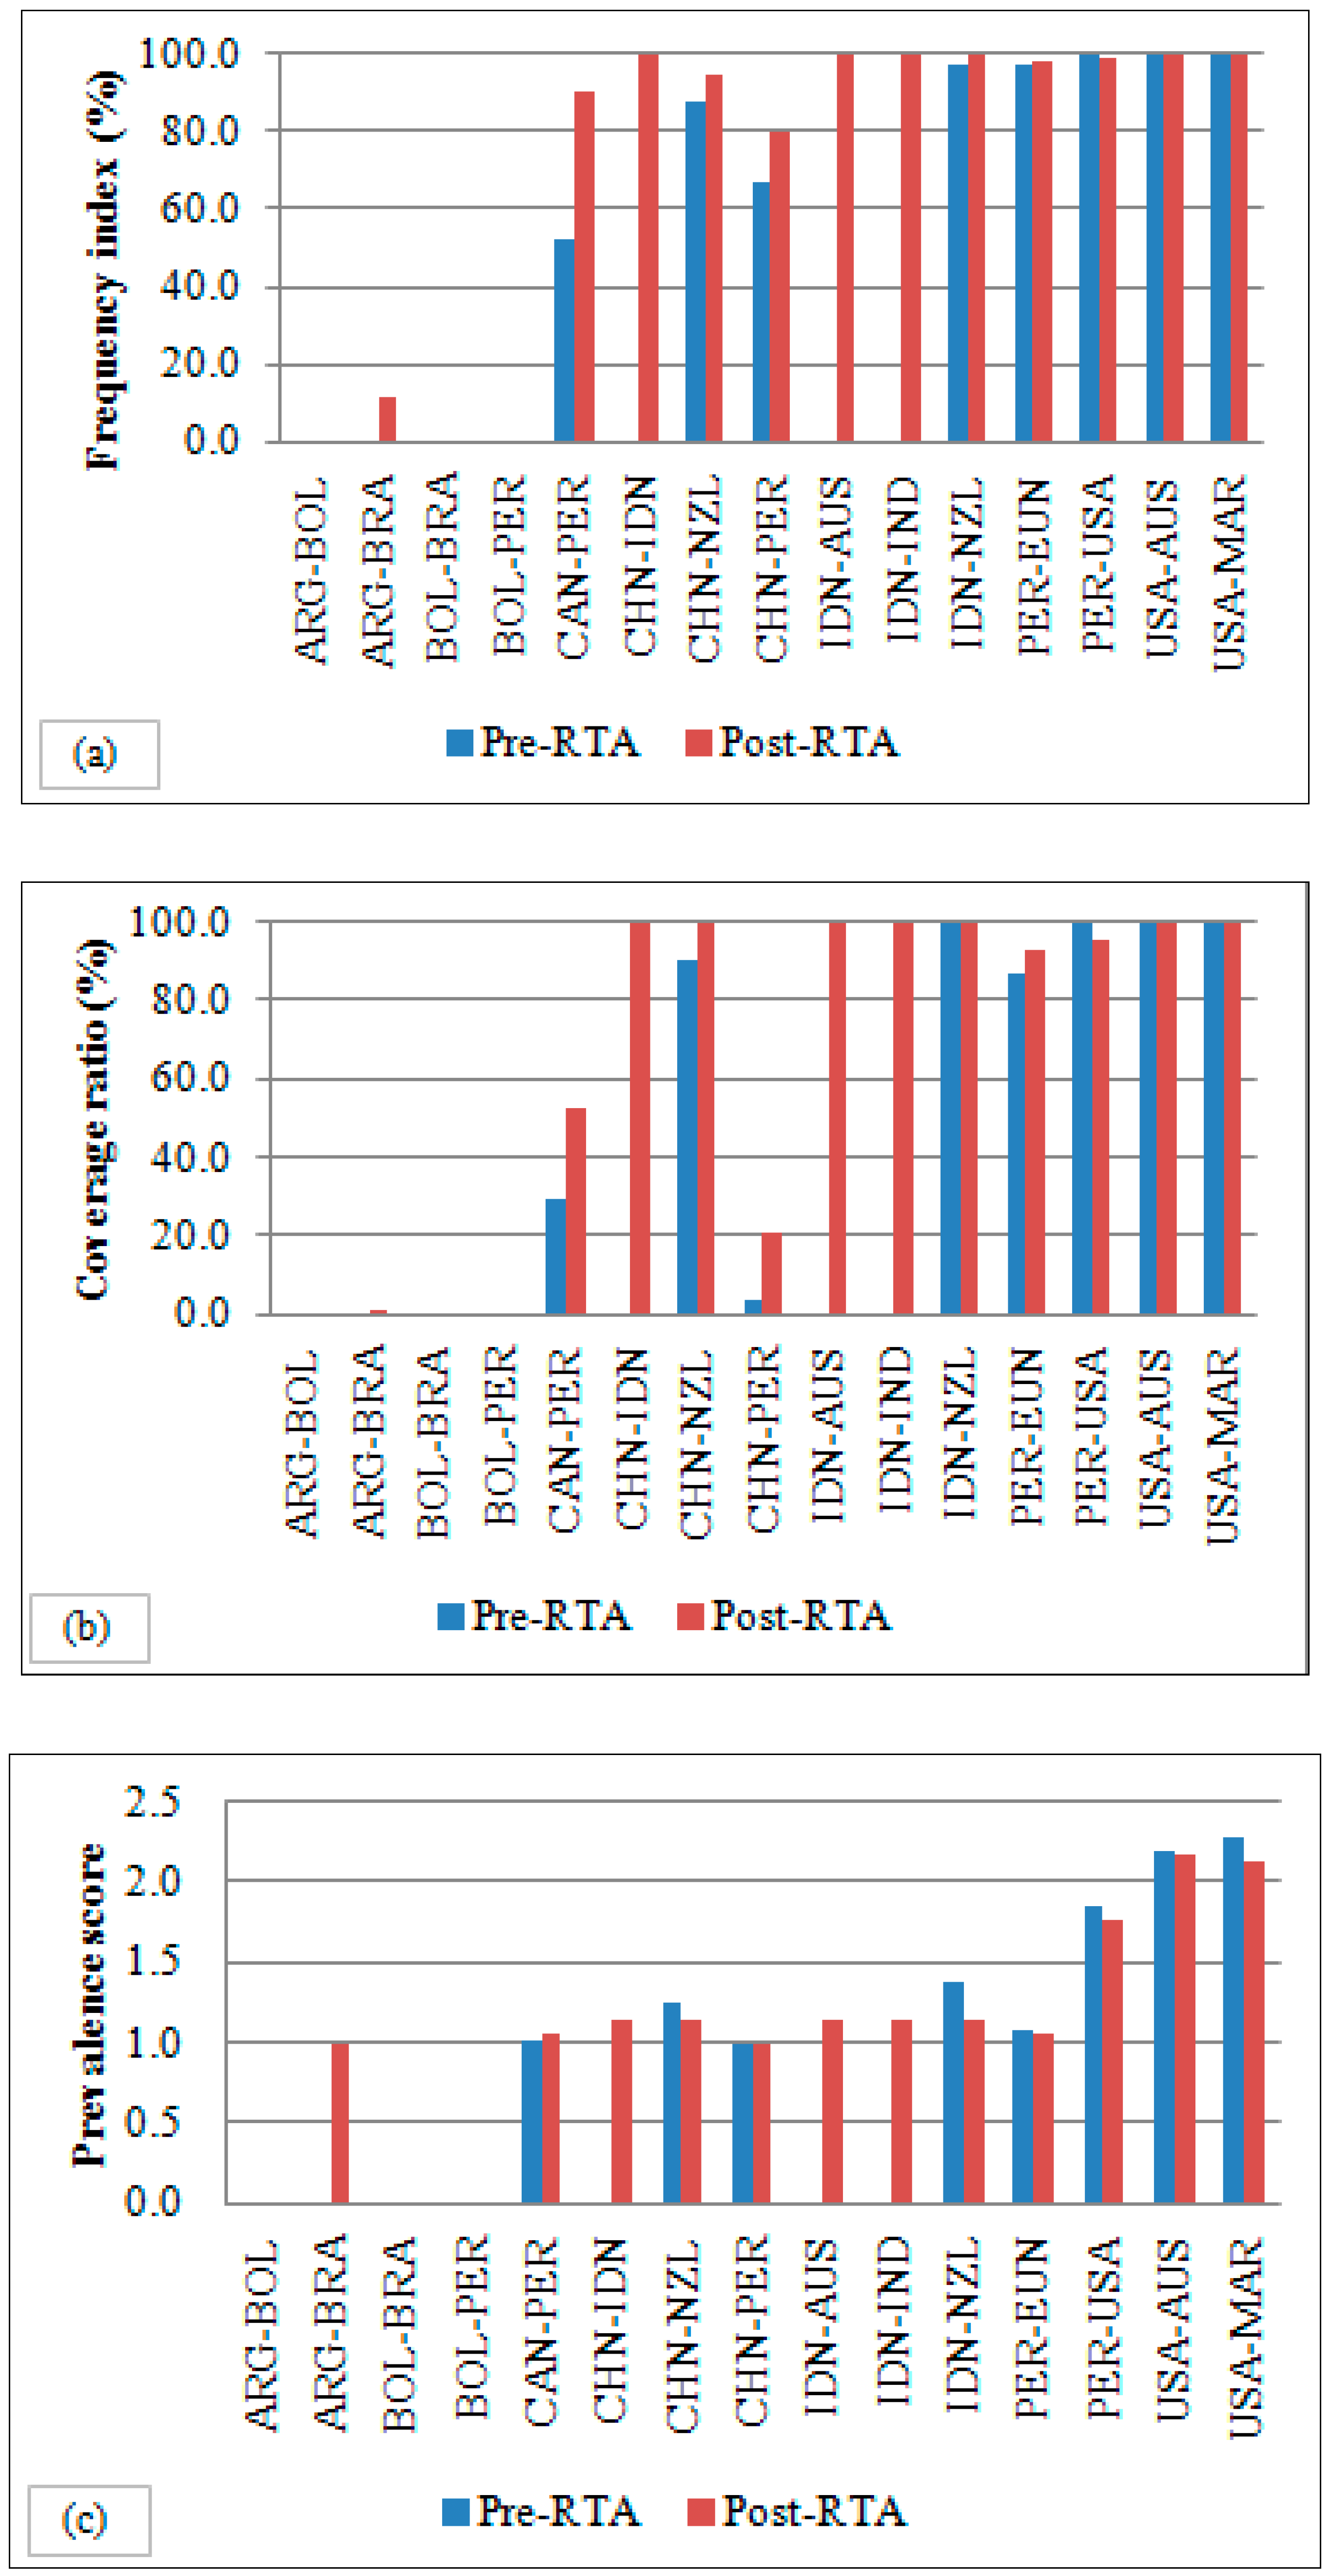
The frequency indices, the coverage ratios, and the prevalence scores reflect the evolution of trade and SPSs. We observe that countries sharing an RTA apply some form of SPSs for 94% of products (average frequency index), accounting for 98% of traded values (average coverage ratio), both before and after the entry into force of the agreements. A relatively higher coverage ratio may be due to larger traded volumes of products under regulation (especially from developing countries) and to a wider implementation of trade measures on the most traded products (in particular from developed countries) [34].
However, the incidence of the SPSs is heterogeneous across agreements and time periods (Figure 3). In periods prior to the approval of RTAs, only trade between developed and developing countries is regulated by SPSs (exception made for China and Peru). After the entry into force of RTAs, the pervasiveness of SPSs per product is a new and relevant phenomenon between developing countries (prevalence scores from 0 before the RTA to at least 1 after the RTA), but becomes less stringent between countries with different levels of economic development (i.e., lower values of prevalence scores in most of developed-developing country-pairs). As suggested in Scoppola et al. [17], the reduction of non-tariff measures offsets potential negative impacts due to increased variable and fixed costs that countries face to access trade agreements.
Overall, the inventory analyses shed light on regulation inequalities across different geo-economic areas and time periods. A plausible explanation is that “the high quality and safety food standards of developed countries and the related process of harmonisation on a regional, and not multilateral, basis, represents a complex behind-the-border barrier for developing countries” [17] (p. 261). The important use of the SPSs among countries with different levels of economic development may result from an effort of developing countries to harmonise regulations with their main developed trading partners.

3.2. Empirical Results

The results of the regression discontinuity design show the evolution of trade values and Sanitary and Phytosanitary Standards (SPSs) (Table 3), and the trade effects of the SPSs (Table 4), comparing the general trend (model A) with the effect after the stipulation of RTAs (model B). The results of the sensitivity analyses highlight differences across the agri-food sectors (model C).
The coefficients estimated for the variables ‘Time’ and ‘Timepost-RTA’ are positive if ‘Trade’ is the dependent variable and negative if ‘SPS’ is the dependent variable, and are consistent across models A, B, and C (Table 3). The results are in line with findings from the inventory analyses and highlight that trade values increase whereas the SPSs decrease with time. In particular, these effects are more evident after the entry into force of RTAs: trade increases by 15.2% and the SPSs decrease by 0.1% as fast after the approval of the agreements (We derived the ‘speed’ of increase or decrease of trade or SPSs as the ratio between the coefficient of interest post-RTA (e.g., ‘Timepost-RTA’) and the coefficient for the entire period (i.e., ‘Time’) (Table 3, B). As demonstrated by Sun and Reed [3], trade agreements are able to generate trade increase and lead to multilateral lowering of trade barriers (e.g., non-tariff measures) for the agri-food products among members of the agreements.
In the sensitivity analyses, the coefficients estimated for product-specific ‘Timepost-RTA’ are negative and statistically significant in 5 out of 8 cases with ‘Trade’ as dependent variable (i.e., meat, fish, dairy, vegetables, preparations of meat and fish), and positive and statistically significant in 7 out of 8 cases with ‘SPS’ as dependent variable (i.e., meat, fish, dairy, vegetables, fruit, oilseed, preparations of meat and fish). In both models (‘Trade’ and ‘SPS’), the coefficients estimated for the baseline (‘Timepost-RTA’) indicate the effect on cereals after the entry into force of RTAs.
The results highlight that the higher trade increase after the approval of RTAs depends on the more rapid increase in trade of cereals (+29.7%) and fruit (+13.1%). By contrast, trade of seafood and meat-based products (both raw and processed), vegetables, and dairy produce suffers a setback during the period post-RTAs. As for trade measures, only the SPSs that regulate trade of cereals decrease after the approval of RTAs (Table 3, C). The product-specific effects of the RTAs may be due to the fact that the agreements frequently cover a limited set of products (i.e., partial scope agreements): in the agri-food sector this issue is the rule rather than the exception [16].
Considering the trade effects of policy measures within trade agreements, Table 4 shows that the SPSs are trade catalysts, in particular after the stipulation of RTAs (model B). However, the trade effects are product-specific: while the SPSs are trade promoting for cereals (Again, the coefficient estimated for the baseline (‘Timepost-RTA’) indicates the trade effect of SPSs on cereals after the approval of RTAs.), they tend to reduce trade of other agri-food products (model C). As suggested in Santeramo and Lamonaca [13], it is plausible that the trade effects of policy measures depend on the dynamics of specific agri-food sectors. In addition, previous literature highlights that trade of cereals is likely to increase between members of the agreements, but not to be diverted towards counties out of the agreements [2]. A number of studies also demonstrate that the SPSs (and NTMs in general) are trade impeding for oilseeds and dairy produce [37], fruits and vegetables [7,38,39], meat-based products [12], and seafood products [40]. Not surprisingly, a common feature of the above mentioned products is the elevate perishability, which influences price and trade dynamics [41,42,43].
Overall, the empirical results demonstrate that trade and the SPSs evolve in opposite directions over time: trade agreements tend to favour the increase in trade and the reduction of policy measures between members. In addition, both the SPSs and RTAs are pro-trade, but only at the aggregate level: in fact, divergences emerge at the product level, with the trade of the vast majority of the agri-food sectors limited by the SPSs after the entry into force of RTAs.

4. Conclusions

Trade agreements and trade measures are policy instruments thought to liberalise and favour trade by providing a degree of harmonisation among members [6].
Our analyses provided differences before and after the introduction of the agreements, and among the most regulated agri-food products. In particular, our findings showed the evolution in opposite directions of trade and Sanitary and Phytosanitary Standards (SPSs) over time: in line with Grant and Lambert [36], we demonstrated that trade agreements tend to favour the increase of trade and the reduction of policy measures between members. However, we found the existence of regulation inequalities across trade agreements covering different geo-economic areas. After the approval of trade agreements, the existence and the importance of SPSs become relevant among developing countries, whereas the pervasiveness of SPSs becomes less stringent between countries with different levels of economic development (developed-developing countries). Such trends shed light on two phenomena: first, the proliferation of trade measures may induce distortions in trade flows of developing countries that respond to external pressures by implementing other trade measures [26,27]; second, the lower stringency of trade measure between developed and developing countries within trade agreements highlights that a process of convergence is more likely to be achieved in a regional rather than on a multilateral framework [17].
Our analyses also proved the hypothesis that trade agreements and trade measures are instruments that policymakers adopt to facilitate trade. However, this hypothesis is true only at the aggregate level. In fact, product-specific analyses showed that cereal is the only agri-food sector that benefits from the joint influence of trade agreements and SPSs. Accordingly, policy instruments have to be calibrated case-by-case to achieve their full potential [13].
The adoption of SPSs may benefit trade liberalisation, or imply trade reduction. In such a framework, trade agreements may be determinant in avoiding trade distortions in favour of members. Understanding how SPSs work in the agreements, and how they joint influence trade would help planning (and managing) trade policies. In fact, at the regional level, there are programmes to facilitate the harmonisation of standards: an example is the Asia and Pacific Plant Protection Commission, which develop regional standards for SPSs as part of the plant protection programme of the Commission’s contracting parties. Programmes of harmonisation of standards make available regional standards for SPSs to contracting and other interested parties, in order to facilitate trade and to avoid the use of unjustifiable SPSs as barriers to trade [44].

Author Contributions

Conceptualization, Supervision, F.G.S.; Methodology, F.G.S. and E.L.; Software, Data Curation, E.L. and V.G.; Writing—Original Draft Preparation, E.L.

Funding

This research received no external funding.

Acknowledgments

The authors would like to thank the anonymous referees and the editor for their suggestions that contributed to a substantial improvement of this article.

Conflicts of Interest

The authors declare no conflict of interest.

References

  1. Henson, S.; Loader, R. Barriers to agricultural exports from developing countries: The role of sanitary and phytosanitary requirements. World Dev. 2001, 29, 85–102. [Google Scholar] [CrossRef]
  2. Santeramo, F.G. On Non-Tariff Measures and Changes in Trade Routes: From North-North to South-South Trade? International Agricultural Trade Research Consortium: Washington, DC, USA, 2018. [Google Scholar]
  3. Sun, L.; Reed, M.R. Impacts of free trade agreements on agricultural trade creation and trade diversion. Am. J. Agric. Econ. 2010, 92, 1351–1363. [Google Scholar] [CrossRef]
  4. Arita, S.; Beckman, J.; Mitchell, L. Reducing transatlantic barriers on US-EU agri-food trade: What are the possible gains? Food Policy 2017, 68, 233–247. [Google Scholar] [CrossRef]
  5. Díaz-Bonilla, E.; Robinson, S.; Swinnen, J.F. Regional agreements and the World Trade Organization negotiations. Am. J. Agric. Econ. 2003, 85, 679–683. [Google Scholar] [CrossRef]
  6. Disdier, A.C.; Fontagné, L.; Cadot, O. North-South standards harmonization and international trade. World Bank Econ. Rev. 2015, 29, 327–352. [Google Scholar] [CrossRef]
  7. Peterson, E.; Grant, J.H.; Roberts, D.; Karov, V. Evaluating the trade restrictiveness of phytosanitary measures on US fresh fruit and vegetable imports. Am. J. Agric. Econ. 2013, 95, 842–858. [Google Scholar] [CrossRef]
  8. Dal Bianco, A.; Boatto, V.L.; Caracciolo, F.; Santeramo, F.G. Tariffs and non-tariff frictions in the world wine trade. Eur. Rev. Agric. Econ. 2016, 43, 31–57. [Google Scholar] [CrossRef]
  9. Cardamone, P. The effect of preferential trade agreements on monthly fruit exports to the European Union. Eur. Rev. Agric. Econ. 2011, 38, 553–586. [Google Scholar] [CrossRef]
  10. Schlueter, S.W.; Wieck, C.; Heckelei, T. Regulatory policies in meat trade: Is there evidence for least trade-distorting sanitary regulations? Am. J. Agric. Econ. 2009, 91, 1484–1490. [Google Scholar] [CrossRef]
  11. Xiong, B.; Beghin, J. Does European aflatoxin regulation hurt groundnut exporters from Africa? Eur. Rev. Agric. Econ. 2011, 39, 589–609. [Google Scholar] [CrossRef] [Green Version]
  12. Beckman, J.; Arita, S. Modeling the Interplay between Sanitary and phytosanitary measures and tariff-rate quotas under partial trade liberalization. Am. J. Agric. Econ. 2016, 99, 1078–1095. [Google Scholar] [CrossRef]
  13. Santeramo, F.G.; Lamonaca, E. The Effects of Non-Tariff Measures on Agri-Food Trade: A Review and Meta-Analysis of Empirical Evidence. Available online: https://arxiv.org/ftp/arxiv/papers/1811/1811.06323.pdf (accessed on 15 November 2018).
  14. De Frahan, B.H.; Vancauteren, M. Harmonisation of food regulations and trade in the Single Market: Evidence from disaggregated data. Eur. Rev. Agric. Econ. 2006, 33, 337–360. [Google Scholar] [CrossRef]
  15. Drogué, S.; DeMaria, F. Pesticide residues and trade, the apple of discord? Food Policy 2012, 37, 641–649. [Google Scholar] [CrossRef]
  16. Grant, J.H. Is the growth of regionalism as significant as the headlines suggest? Lessons from agricultural trade. Agric. Econ. 2013, 44, 93–109. [Google Scholar] [CrossRef]
  17. Scoppola, M.; Raimondi, V.; Olper, A. The impact of EU trade preferences on the extensive and intensive margins of agricultural and food products. Agric. Econ. 2018, 49, 251–263. [Google Scholar] [CrossRef]
  18. Imbens, G.W.; Lemieux, T. Regression discontinuity designs: A guide to practice. J. Econ. 2008, 142, 615–635. [Google Scholar] [CrossRef] [Green Version]
  19. Lee, D.S.; Lemieux, T. Regression discontinuity designs in economics. J. Econ. Lit. 2010, 48, 281–355. [Google Scholar] [CrossRef]
  20. RTA-IS. The Regional Trade Agreements Information System. Available online: rtais.wto.org/UI/Charts.aspx# (accessed on 15 October 2018).
  21. WTO. The WTO Database on Preferential Trade Arrangements. Available online: ptadb.wto.org/ptaList.aspx (accessed on 15 October2018).
  22. OECD. Regional Trade Agreements and Agriculture; OECD Food, Agriculture and Fisheries Papers, No. 79; OECD Publishing: Paris, France, 2015. [Google Scholar]
  23. Koo, W.W.; Kennedy, P.L.; Skripnitchenko, A. Regional preferential trade agreements: Trade creation and diversion effects. Appl. Econ. Perspect. Policy 2006, 28, 408–415. [Google Scholar] [CrossRef]
  24. Lambert, D.; McKoy, S. Trade creation and diversion effects of preferential trade associations on agricultural and food trade. J. Agric. Econ. 2009, 60, 17–39. [Google Scholar] [CrossRef]
  25. United Nations. UNCTAD International Classification of Non-Tariff Measures, February 2012 version (UNCTAD/DITC/TAB/2012/2); United Nations: New York, NY, USA; Geneva, Switzerland, 2012. [Google Scholar]
  26. UNCTAD. The Global Database on Non-Tariff Measures. Available online: trains.unctad.org/ (accessed on 15 September 2017).
  27. Bown, C.P.; Crowley, M.A. Emerging economies, trade policy, and macroeconomic shocks. J. Dev. Econ. 2014, 111, 261–273. [Google Scholar] [CrossRef] [Green Version]
  28. Martin, W. A Research agenda for international agricultural trade. Appl. Econ. Perspect. Policy 2018, 40, 155–173. [Google Scholar] [CrossRef]
  29. Grant, J.H.; Arita, S. Sanitary and Phyto-Sanitary Measures: Assessment, Measurement, and Impact; IATRC: Washington, DC, USA, 2017; Volume 21, pp. 1–53. [Google Scholar]
  30. Jongwanich, J. The impact of food safety standards on processed food exports from developing countries. Food Policy 2009, 34, 447–457. [Google Scholar] [CrossRef] [Green Version]
  31. United Nations. World Economic Situation and Prospects; United Nations: New York, NY, USA, 2017. [Google Scholar]
  32. CEPII. Gravity Database of Centre d’Études Prospectives et d’Informations Internationales. Available online: www.cepii.fr/CEPII/en/bdd_modele/bdd.asp (accessed on 29 October 2017).
  33. Disdier, A.C.; Fontagné, L.; Mimouni, M. The impact of regulations on agricultural trade: Evidence from the SPS and TBT agreements. Am. J. Agric. Econ. 2008, 90, 336–350. [Google Scholar] [CrossRef]
  34. Gourdon, J. CEPII NTM-MAP: A Tool for Assessing the Economic Impact of Non-Tariff Measures; No. 24; CEPII: Paris, France, 2014. [Google Scholar]
  35. UN Cometrade. Trade Database. Available online: comtrade.un.org/data/ (accessed on 29 March 2018).
  36. Grant, J.H.; Lambert, D.M. Do regional trade agreements increase members’ agricultural trade? Am. J. Agric. Econ. 2008, 90, 765–782. [Google Scholar] [CrossRef]
  37. Winchester, N.; Rau, M.L.; Goetz, C.; Larue, B.; Otsuki, T.; Shutes, K.; Wieck, C.; Burnquist, H.L.; de Souza, M.J.P.; de Faria, R.N. The impact of regulatory heterogeneity on agri-food trade. World Econ. 2012, 35, 973–993. [Google Scholar] [CrossRef]
  38. Cioffi, A.; Santeramo, F.G.; Vitale, C.D. The price stabilization effects of the EU entry price scheme for fruit and vegetables. Agric. Econ. 2011, 42, 405–418. [Google Scholar] [CrossRef] [Green Version]
  39. Santeramo, F.G.; Cioffi, A. The entry price threshold in EU agriculture: Deterrent or barrier? J. Pol. Mod. 2012, 34, 691–704. [Google Scholar] [CrossRef] [Green Version]
  40. Shepotylo, O. Effect of non-tariff measures on extensive and intensive margins of exports in seafood trade. Mar. Policy 2016, 68, 47–54. [Google Scholar] [CrossRef] [Green Version]
  41. Santeramo, F.G. Price transmission in the European tomatoes and cauliflowers sectors. Agribusiness 2015, 31, 399–413. [Google Scholar] [CrossRef]
  42. Santeramo, F.G.; von Cramon-Taubadel, S. On perishability and Vertical Price Transmission: empirical evidences from Italy. Bio-based Appl. Econ. 2016, 5, 199–214. [Google Scholar]
  43. Santeramo, F.G.; Lamonaca, E.; Nardone, G.; Seccia, A. The benefits of country-specific non-tariff measures in world wine trade. Wine Econ. Pol. 2018, in press. [Google Scholar]
  44. FAO. Regional Standards for Phytosanitary Measures; APPPC RSPM No. 2; FAO Regional Office for Asia and the Pacific: Bangkok, Thailand, 2004. [Google Scholar]
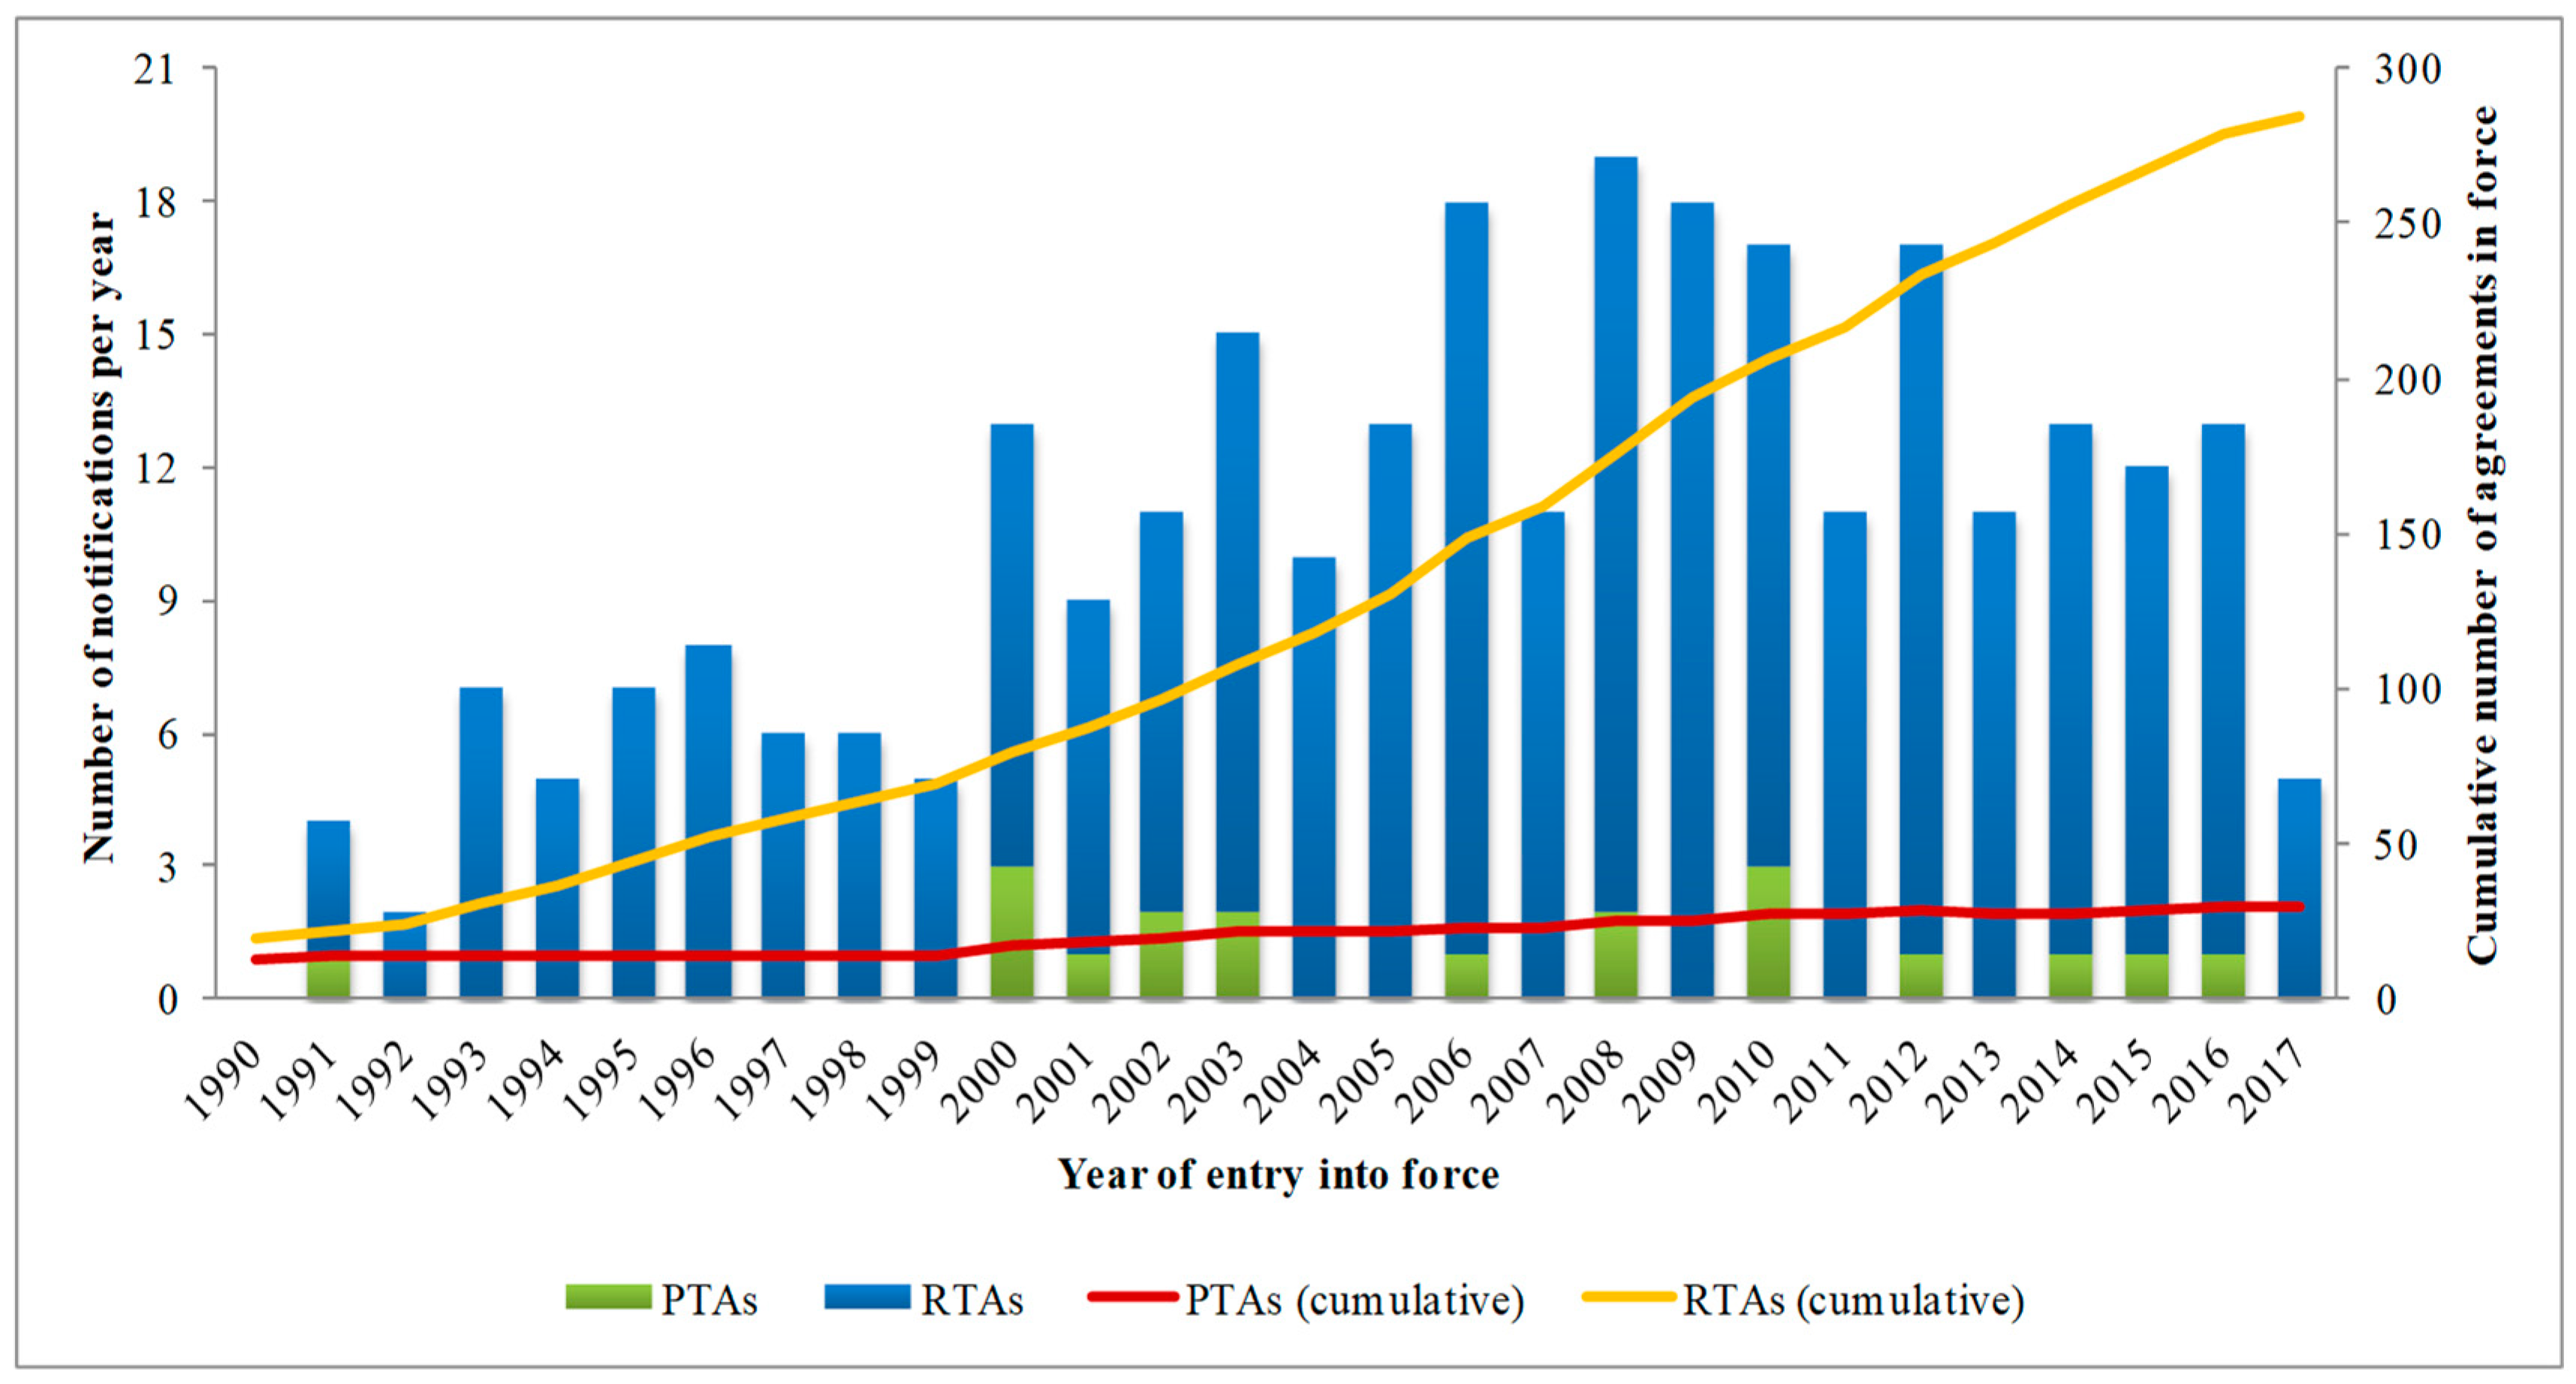
Figure 1. Global trade agreements by year of entry into force, 1990–2017. Source: elaboration on [20,21]. Notes: Acronyms are Preferential Trade Agreements (PTAs) and Regional Trade Agreements (RTAs).
Agriculture 09 00002 g001
Figure 2. Cumulative Density Functions (CDFs) of technical Non-Tariff Measures (NTMs) by implementing countries: detail by different time periods. Source: elaboration on [26]. Note: The theoretical CDF is expressed as a dashed line.
Agriculture 09 00002 g002
Figure 3. Frequency index (a), coverage ratio (b), and prevalence score (c) by country-pairs two years before and two years after the entry into force of Regional Trade Agreements (RTAs). Source: elaboration on [26,35].
Agriculture 09 00002 g003
Table 1. Regional Trade Agreements (RTAs) in force between pairs of countries, 1990–2015.
Reporter
PartnerArgentinaBoliviaBrazilCanadaChinaIndonesiaNew ZealandPeruUnited States
Argentina since 1996since 1992nononononono
Australianononononosince 2010since 1983nosince 2005
Boliviasince 1996 since 1996nonononosince 1995no
Brazilsince 1992since 1996 nononononono
Canadanonono nononosince 2010since 1989
Chinanononono since 2010since 2009since 2010no
Congononononononononono
Egyptnonononononononono
European Unionnononononononosince 2013no
Indonesianonononosince 2010 since 2010nono
Indianononononosince 2010nonono
Libyanonononononononono
Moroccononononononononosince 2006
New Zealandnonononosince 2009since 2010 nono
Perunosince 1995nosince 2010since 2010nono since 2009
Russian Federationnonononononononono
Tunisianonononononononono
United Statesnononosince 1989nononosince 2009
South Africanonononononononono
Source: Elaboration on [20].
Table 2. The evolution of trade values, number of Sanitary and Phytosanitary Standards (SPSs), frequency indices, coverage ratios, and prevalence scores before and after the entry into force of Regional Trade Agreements (RTAs).
Pairs of Countries Sharing RTAsYear of Entry into Force (t)Trade (Million US$)Number of SPSsFrequency Index (%)Coverage Ratio (%)Prevalence Score
Pre-RTA (t2)Post-RTA (t + 2)ΔPre-RTA (t2)Post-RTA (t + 2)ΔPre-RTA (t2)Post-RTA (t + 2)ΔPre-RTA (t2)Post-RTA (t + 2)ΔPre-RTA (t2)Post-RTA (t + 2)Δ
Argentina-Bolivia1996337500-0.00.0-0.00.0-0.00.0-
Argentina-Brazil19924962190040.011.80.00.90.01.0
Bolivia-Brazil1996174000-0.00.0-0.00.0-0.00.0-
Bolivia-Peru199544900-0.00.0-0.00.0-0.00.0-
Canada-Peru20105247556913652.190.129.352.91.01.1-
China-Indonesia2010587117,000018510.099.50.099.60.01.1
China-New Zealand20091570202,00012824987.994.790.399.81.31.1
China-Peru2010246518399667.279.63.620.51.01.0-
Indonesia-Australia20100136,000018510.099.90.0100.00.01.1
Indonesia-India2010043,700018500.099.90.099.50.01.1
Indonesia-New Zealand2009171045,90096206797.2100.0100.0100.0-1.41.1
Peru-European Union201326904950847138096.997.687.092.51.11.1-
Peru-United States200917,30013,4001433180899.799.399.595.31.91.8
United States-Australia2005390,00048,8001731174199.799.8100.099.82.22.2-
United States-Morocco2006386014,8001222129399.599.7100.0100.0-2.32.1
Source: elaboration on [20,26,35]. Notes: There are no trade flows between Indonesia and Australia, and Indonesia and India since 2002 until 2007, and no SPSs since 1990 until 2007. The SPSs are implemented since 2000 between Bolivia and Brazil, and since 2003 between Argentina and Bolivia, and Bolivia and Peru. Δ indicates the variation between pre- and post-RTA; ↑, ↗, ↘, and - indicate respectively a remarkable increase, a moderate increase, a moderate decrease, a lack of variation between pre- and post-RTA.
Table 3. The evolution of trade values and Sanitary and Phytosanitary Standards (SPSs): (A) overall effects, (B) effects post-Regional Trade Agreements (RTAs), and (C) product-specific effects.
VariablesABC
TradeSPSTradeSPSTradeSPS
Time7.300 ***−54.446 ***1.460 **−52.700 ***1.834 ***−52.700 ***
(0.591)(0.518)(0.614)(0.537)(0.613)(0.537)
Timepost-RTA 0.222 ***−0.071 ***0.545 ***−0.226 ***
(0.006)(0.006)(0.027)(0.024)
Timepost-RTA (meat) −0.207 ***0.173 ***
(0.030)(0.027)
Timepost-RTA (fish) −0.415 ***0.077 ***
(0.028)(0.026)
Timepost-RTA (dairy) −0.310 ***0.083 ***
(0.031)(0.028)
Timepost-RTA (vegetables) −0.580 ***0.360 ***
(0.032)(0.029)
Timepost-RTA (fruit) 0.240 ***0.199 ***
(0.031)(0.028)
Timepost-RTA (oilseeds) −0.0310.262 ***
(0.036)(0.033)
Timepost-RTA (preparations of meat and fish) −1.184 ***0.217 ***
(0.033)(0.030)
Constant0.701111.037 ***12.360 ***107.600 ***11.618 ***107.500 ***
(1.187)(1.040)(1.233)(1.078)(1.229)(1.078)
Observations528,834549,810528,834549,810528,834549,810
R-squared0.0000.0200.0030.0200.0090.021
Standard errors are in parentheses. *** and ** indicate statistical significance at 1% and 5%, respectively. Notes: The estimated coefficients (exclusion made for the constant) are of the order of 10−3. In model C, the coefficient estimated for ‘Timepost-RTA’ indicates the effect after the introduction of RTAs on cereals.
Table 4. The trade effects of Sanitary and Phytosanitary Standards (SPSs): (A) overall effects, (B) effects post-Regional Trade Agreements (RTAs), and (C) product-specific effects.
VariablesABC
Time fixed effectsYesYesYes
SPSs0.040 ***0.034 ***0.038 ***
(0.001)(0.002)(0.002)
SPSspost-RTA 0.110 ***1.103 ***
(0.005)(0.050)
SPSspost-RTA (meat) −0.656 ***
(0.052)
SPSspost-RTA (fish) −0.831 ***
(0.052)
SPSspost-RTA (dairy) −0.694 ***
(0.054)
SPSspost-RTA (vegetables) −1.133 ***
(0.050)
SPSspost-RTA (fruit) −0.870 ***
(0.051)
SPSspost-RTA (oilseeds) −0.833 ***
(0.053)
SPSspost-RTA (preparations of meat and fish) −1.537 ***
(0.054)
Constant14.850 ***14.870 ***14.860 ***
(0.032)(0.032)(0.032)
Observations499,153499,153499,153
R-squared0.0130.0140.019
Standard errors are in parentheses. *** indicates statistical significance at 1%. Notes: In model C, the coefficient estimated for ‘Timepost-RTA’ indicates the effect after the introduction of RTAs on cereals.