Article

Planting Fruits and Vegetables in Homegarden as a Way to Improve Livelihoods and Conserve Plant Biodiversity

by
Melaku Mathewos
1,*,
Kitessa Hundera
2 and
Lisa Biber-Freudenberger
3
1
Natural Resource Management, Jinka University, Jinka 165, Ethiopia
2
Biology, Jimma University, Jimma 378, Ethiopia
3
Center for Development Research, Bonn University, 53113 Bonn, Germany
*
Author to whom correspondence should be addressed.
Agriculture 2018, 8(12), 190; https://doi.org/10.3390/agriculture8120190
Submission received: 24 September 2018 / Revised: 12 November 2018 / Accepted: 12 November 2018 / Published: 3 December 2018

Abstract

:
Multi-story cropping systems are used to grow fruits and vegetables in rural homegardens, and it has been argued that they are crucial for the food and nutrition safety of rural populations. They also are considered as refuges for a number of plant species, and as one way to reduce pressure on the surrounding ecosystem by providing resources such as food, fiber, and firewood to farmers on their own farmland. This study was conducted to assess the contribution of fruits and vegetables in homegardens to household livelihoods and biodiversity conservation in the Yayo biosphere reserve in southwestern Ethiopia. The role of fruits and vegetables was evaluated for 96 households that were selected randomly from both fruit and vegetable users and only vegetable-user strata. To collect socioeconomic data, semi-structured interviews, direct observation, and focus group discussions were employed. A complete enumeration of plant species was done for diversity assessment in 48 homegardens from four kebeles (the smallest administrative unit in Ethiopia) in the Yayo and Hurumu districts and analyzed using descriptive statistics, Chi-square, independent t-test, and one-way ANOVA. The results indicated the highest plant diversity, with a total of 76 species identified from 38 families. Fruit and vegetable users were found to harbor more diversity in their homegardens compared to only vegetable-user homegardens. Homegarden size correlated significantly with species richness. Fruits and vegetables in homegardens were found to considerably contribute to household food consumption and total annual income independent of wealth categories. We also found a significant negative relationship between fruit and vegetable use and forest product harvesting, indicating the reduction of pressures on nearby forest ecosystems. This study supports the idea that fruits and vegetables contribute to biodiversity conservation directly as the entity of homegarden agrobiodiversity and indirectly through minimizing households’ demand for forest harvesting by providing food and generating income. Nevertheless, fruits and vegetables were not contributing at their full potential, which was mainly due to disease problems, pests, and a lack of better market access. Therefore, further research and interventions are needed to help farmers confront these challenges affecting fruit and vegetable production and productivity.

1. Introduction

The continued deterioration of natural resources and ecosystems has become a serious threat to both ecological systems and agricultural production [1]. Additional negative impacts on the local population are expected due to a loss of biodiversity and ecosystem services [2]. Biodiversity is important for ecosystems to recover from environmental shocks [3], as well as their regeneration and maintenance [4], and ultimate agricultural productivity [5]. Even though the causes of biodiversity loss are numerous, high population density [6] and unsustainable agriculture [7] take the lion’s share. One way to improve biodiversity conservation is to adopt agricultural practices that integrate agricultural production and biodiversity conservation [8] such as agroforestry. Agroforestry can play a major role in conserving and enhancing biodiversity levels on farms as well as the landscape level in both tropical and temperate regions of the world [9,10].
Conventional, especially, industrial agriculture depends strongly on expensive inputs (e.g., pesticides and fertilizer), which are often not affordable for poor farmers and harm the environment [11,12]. Therefore, economically productive and biodiversity-friendly agricultural approaches such as agroforestry are considered promising strategies to provide sufficient agricultural returns for the local population while maintaining a high level of biodiversity at the local farms. Thus, increasing livelihood options through agroforestry practice also enhances biodiversity conservation [13]. Multi-story cropping (hereafter used interchangeably with homegarden agroforestry) is a type of agroforestry that is characterized by a combination of crops, fruit trees, vegetables, and livestock [14]. Homegarden agroforestry is a more diverse and low-input sustainable system than industrial agriculture [15], and has the potential to alleviate resource-use pressure on conservation areas [16].
The UNESCO registered Yayo biosphere reserve combines wild coffee forests and agricultural areas [17], but biodiversity has been declining as a result of population growth and increasing land-use pressure [2]. Traditional hunting that uses forest fire as a mechanism to chase hiding animals, forest product harvesting such as forest honey harvesting, the extension of coffee plantations to the buffer and core zone, and agricultural expansion are among the main threats to the biosphere reserve.
In this study, we investigate the potential contribution of growing fruits and vegetables in homegardens to biodiversity conservation in order to provide livelihoods, food, and material for the local population, and as a consequence reduce pressures on the surrounding protected areas. Even though many studies have been conducted in the field of homegarden agroforestry [18,19,20], to the best of our knowledge, this is the only study that specifically addresses fruits and vegetables’ contributions to biodiversity conservation. The results may contribute to the design of efficient biodiversity conservation strategies that consider the livelihood status of the local community.

2. Materials and Methods

2.1. The Study Area

The study was conducted in the Yayo biosphere reserve located in the Ilu Abba Bora Zone of the Oromia National Regional State in Southwestern Ethiopia. It is located about 560 km from Addis Ababa toward the west, and 38 km from Mettu town toward the east. The biosphere reserve lies between 8°21′–8°26′ N latitude and 35°45′–36°3′ E longitude (Figure 1) within an altitudinal range between 1200–2000 m.a.s.l [21]. Hurumu and Yayo Woreda have an average annual rainfall of about 1600 mm, an average temperature of 23 °C, and an elevation range between 1160–2580 m.a.s.l [22].
The study was conducted in four kebeles: two from the Yayo district, namely Wabo and Bondo Megala, and two from the Hurumu district, namely Wangegne and Gaba. These kebeles were selected due to the widespread practice of fruit and vegetable production, and their vicinity to the biodiversity reservoir.
A total of 154,300 residents currently live in the Yayo biosphere reserve, and mainly rely on agriculture [23], with 65,000 people living in the Yayo Woreda and about 53,000 in the Hurumu Woreda according to estimations of the central statistical agency of Ethiopia [24].

2.1.1. Household Selection

A stratified random sampling technique was employed to select households (HHs) from the area based on their habit of using fruits and vegetables in their homegarden agroforests (HGAF). Kebele administrators and development agents (DAs) were used as key informants (KI) and helped identify HHs growing fruits and vegetables, and those HHs growing vegetables only. Preliminary surveys of HHs were used to confirm gardening practices as identified by the KI.
24 HHs were randomly selected from fruit and vegetable users (FVU) and from vegetable-only users (VOU) for each kebele. In total, 96 HHs from the four kebeles of the two woredas were sampled.

2.1.2. Household Survey Methods

Data about the contribution of fruits and vegetable use to the livelihoods of the farmers were collected using semi-structured questionnaires, focus group discussions (FGD), and personal observation (Appendix A). The questionnaire was originally prepared in English and translated to Afaan Oromo, which is the native language in the study area. However, the interviews were conducted in Amharic if a respondent was more familiar with it. Respondents were required to rank the contribution of fruits and vegetables to their household food consumption. The role of fruits and vegetables in income generation was assessed for three different wealth classes (poor, medium, and rich), which were grouped based on criteria such as land holding size, number of livestock, and the level of coffee production. Sample household heads were required to estimate the annual income from the different income sources for the year 2015.
In order to assess the role of fruits and vegetables in reducing forest harvesting pressure, sample respondents were asked whether they harvest forest, and if they said no, why they chose not to harvest products from the forest.
Two FGDs containing six to 10 people were conducted in each kebele to support and cross-check the information given by an individual respondent and obtain important information that was not covered by the individual questionnaires.

2.1.3. Biodiversity Inventory Methods

For species inventory data, complete enumeration was carried out in sample homegardens to assess plant diversity, frequency, and density (Figure 2). A total of 48 plots were sampled, of which 24 and 24 were FVU and VOU, respectively.
Identification and nomenclature of the species follow the flora of Ethiopia and Eritrea, and other common references [25,26,27,28,29,30]. In addition to this, the Natural Database for Africa (NDA) was used in plant species identification.
The Shannon Wiener diversity index and Sorenson similarity and dissimilarity indices were calculated to assess plant diversity. The Shannon index (H′) was used to quantify the relative abundance of the different species (Equation (1)). This index has a high sensitivity to sample size, and gives more weight to rare species [31]:
H = ( n = 1 ) p i ( l n p i )
where p is the proportion of individuals of a particular species (n) divided by the total number of individuals (N).
Species evenness (E) expresses how evenly the individual species of the community are distributed (Equation (2)):
E = H H m a x
here H m a x = l n   S , lnS is the natural logarithm of species richness. Species evenness ranges from zero to one, with zero indicating no evenness, and one indicating a complete evenness. In order to measure the similarity or dissimilarity of the different sampled communities, Sørensen similarity coefficients (SC) were calculated (Equation (3)):
S s = 2 C 2 C + S 1 + S 2
where C is the number of species that the two communities have in common, S1 is the total number of species found only in community 1, and S2 is the total number of species found only in community 2.
Additionally, the relative frequency and density were calculated for each species except those that were in their dormant state during data collection, making it difficult to count individuals.

2.2. Data Analysis

Microsoft Excel 2016 and the Statistical Package for Social Science (SPSS), Version 20 were used for statistical data analysis, including the descriptive statistics and Pearson correlation coefficients of household demographic variables and socioeconomic characteristics.
The average household incomes of different sampling groups were compared using an independent t-test analysis and one-way ANOVA with the related Tukey post hoc test.
In addition, the Chi-square test was used to estimate the dependency between interview responses, wealth classes, and the ranking of fruits and vegetables’ contribution to household food consumption, as well as between forest harvesting and the use of fruits and vegetables.

3. Results and Discussions

3.1. Plant Diversity Assessment of Homegardens

All of the surveyed homegardens were between 8–69 years old, and had a size ranging between 200–1250 m2. A total of 76 species were recorded and identified in the sample homegardens with a maximum number of 31 and a minimum of eight species recorded in fruit and vegetable user households’ homegardens (Table 1). This result is smaller than the maximum number of species (51) reported for homegardens from Benin, a West African country [32]. Out of the 38 families identified, the five most frequent families were Euphorbiaceae, Fabaceae, Lamiaceae, Rutaceae, and Myrtaceae. In total, 13 fruit species, which accounted for 17.1% of the total species and eight (10.52%) vegetable species were found in the homegardens of the study area. Similarly, the same numbers of fruit species (13) were reported by another study on homegardens of Bangladesh [18], while 31 fruit species were found in the homegardens of northern Thailand [33].
The result of the overall Shannon Wiener diversity index value that was calculated was 3.15. This result indicated that the homegarden system of the study area was characterized by high species evenness and richness.
The species evenness that was calculated was higher for FVU (E = 0.81) than for VOU (E = 0.68) (Table 1), indicating a more even distribution in FVU homegardens.
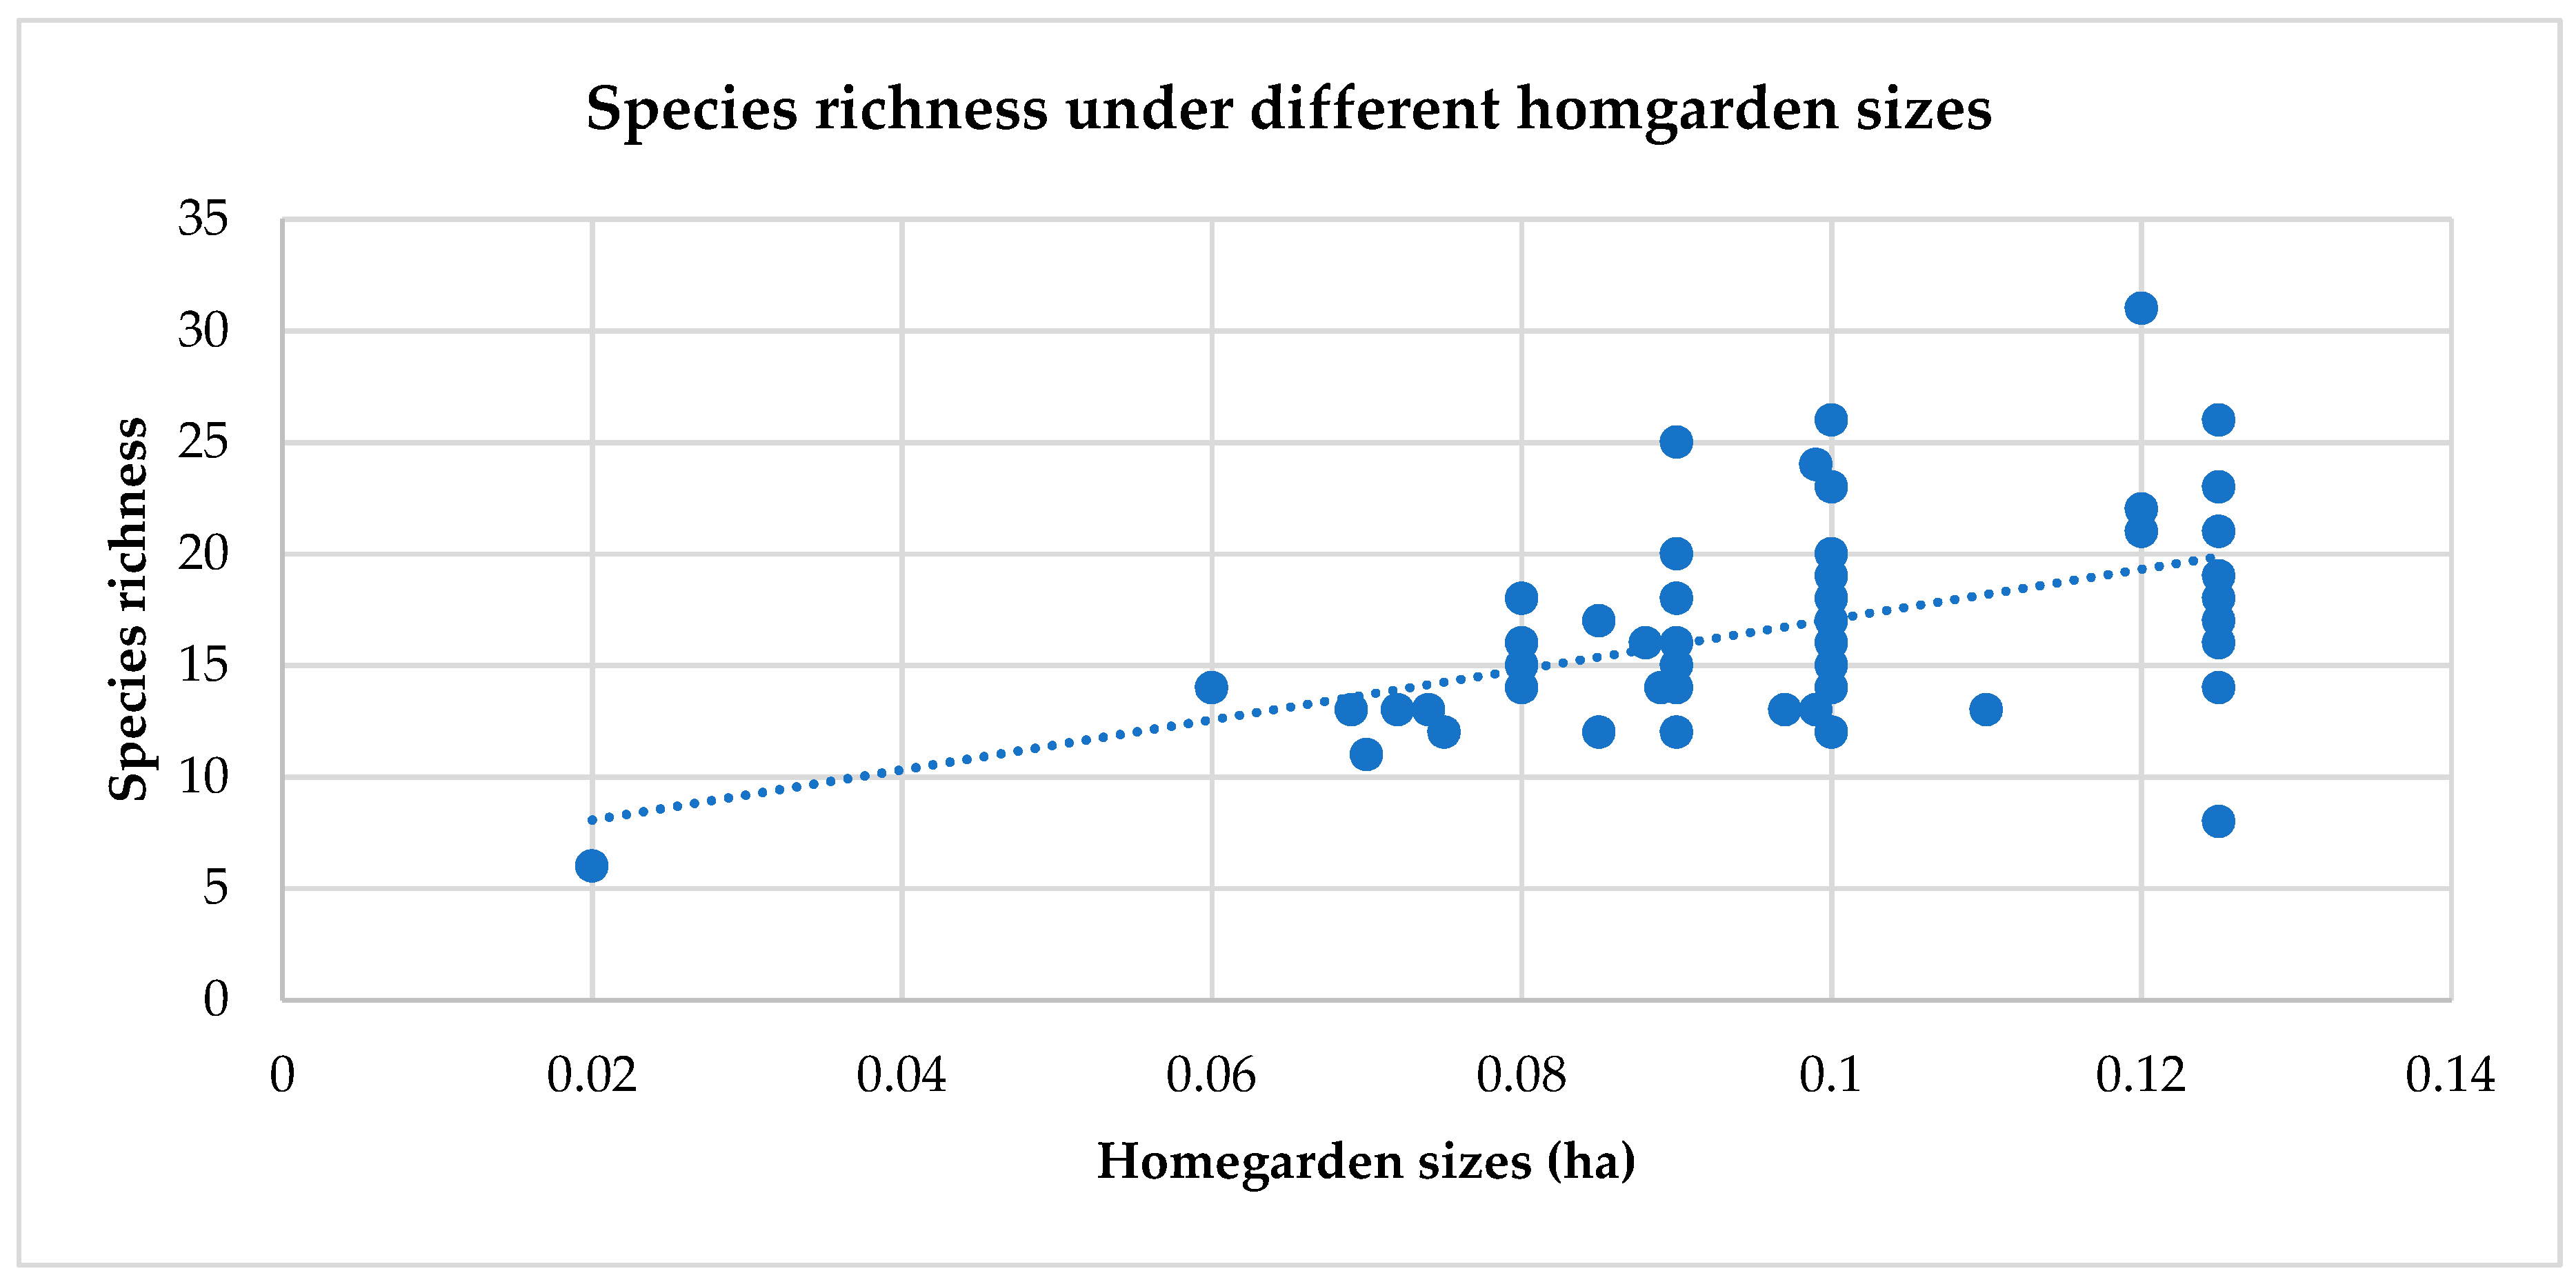
While we found no correlation between species richness and the age of the HG owner or the age of the HG, the HG size was significantly correlated to plant species richness, with a higher species richness in larger than in smaller-sized homegardens (p < 0.01) (Figure 3). This might be because smallholder farmers tend to focus on fewer species of larger value and allocate more of their land to food crops, while large holders can afford to include different types of plant species, including fruits.
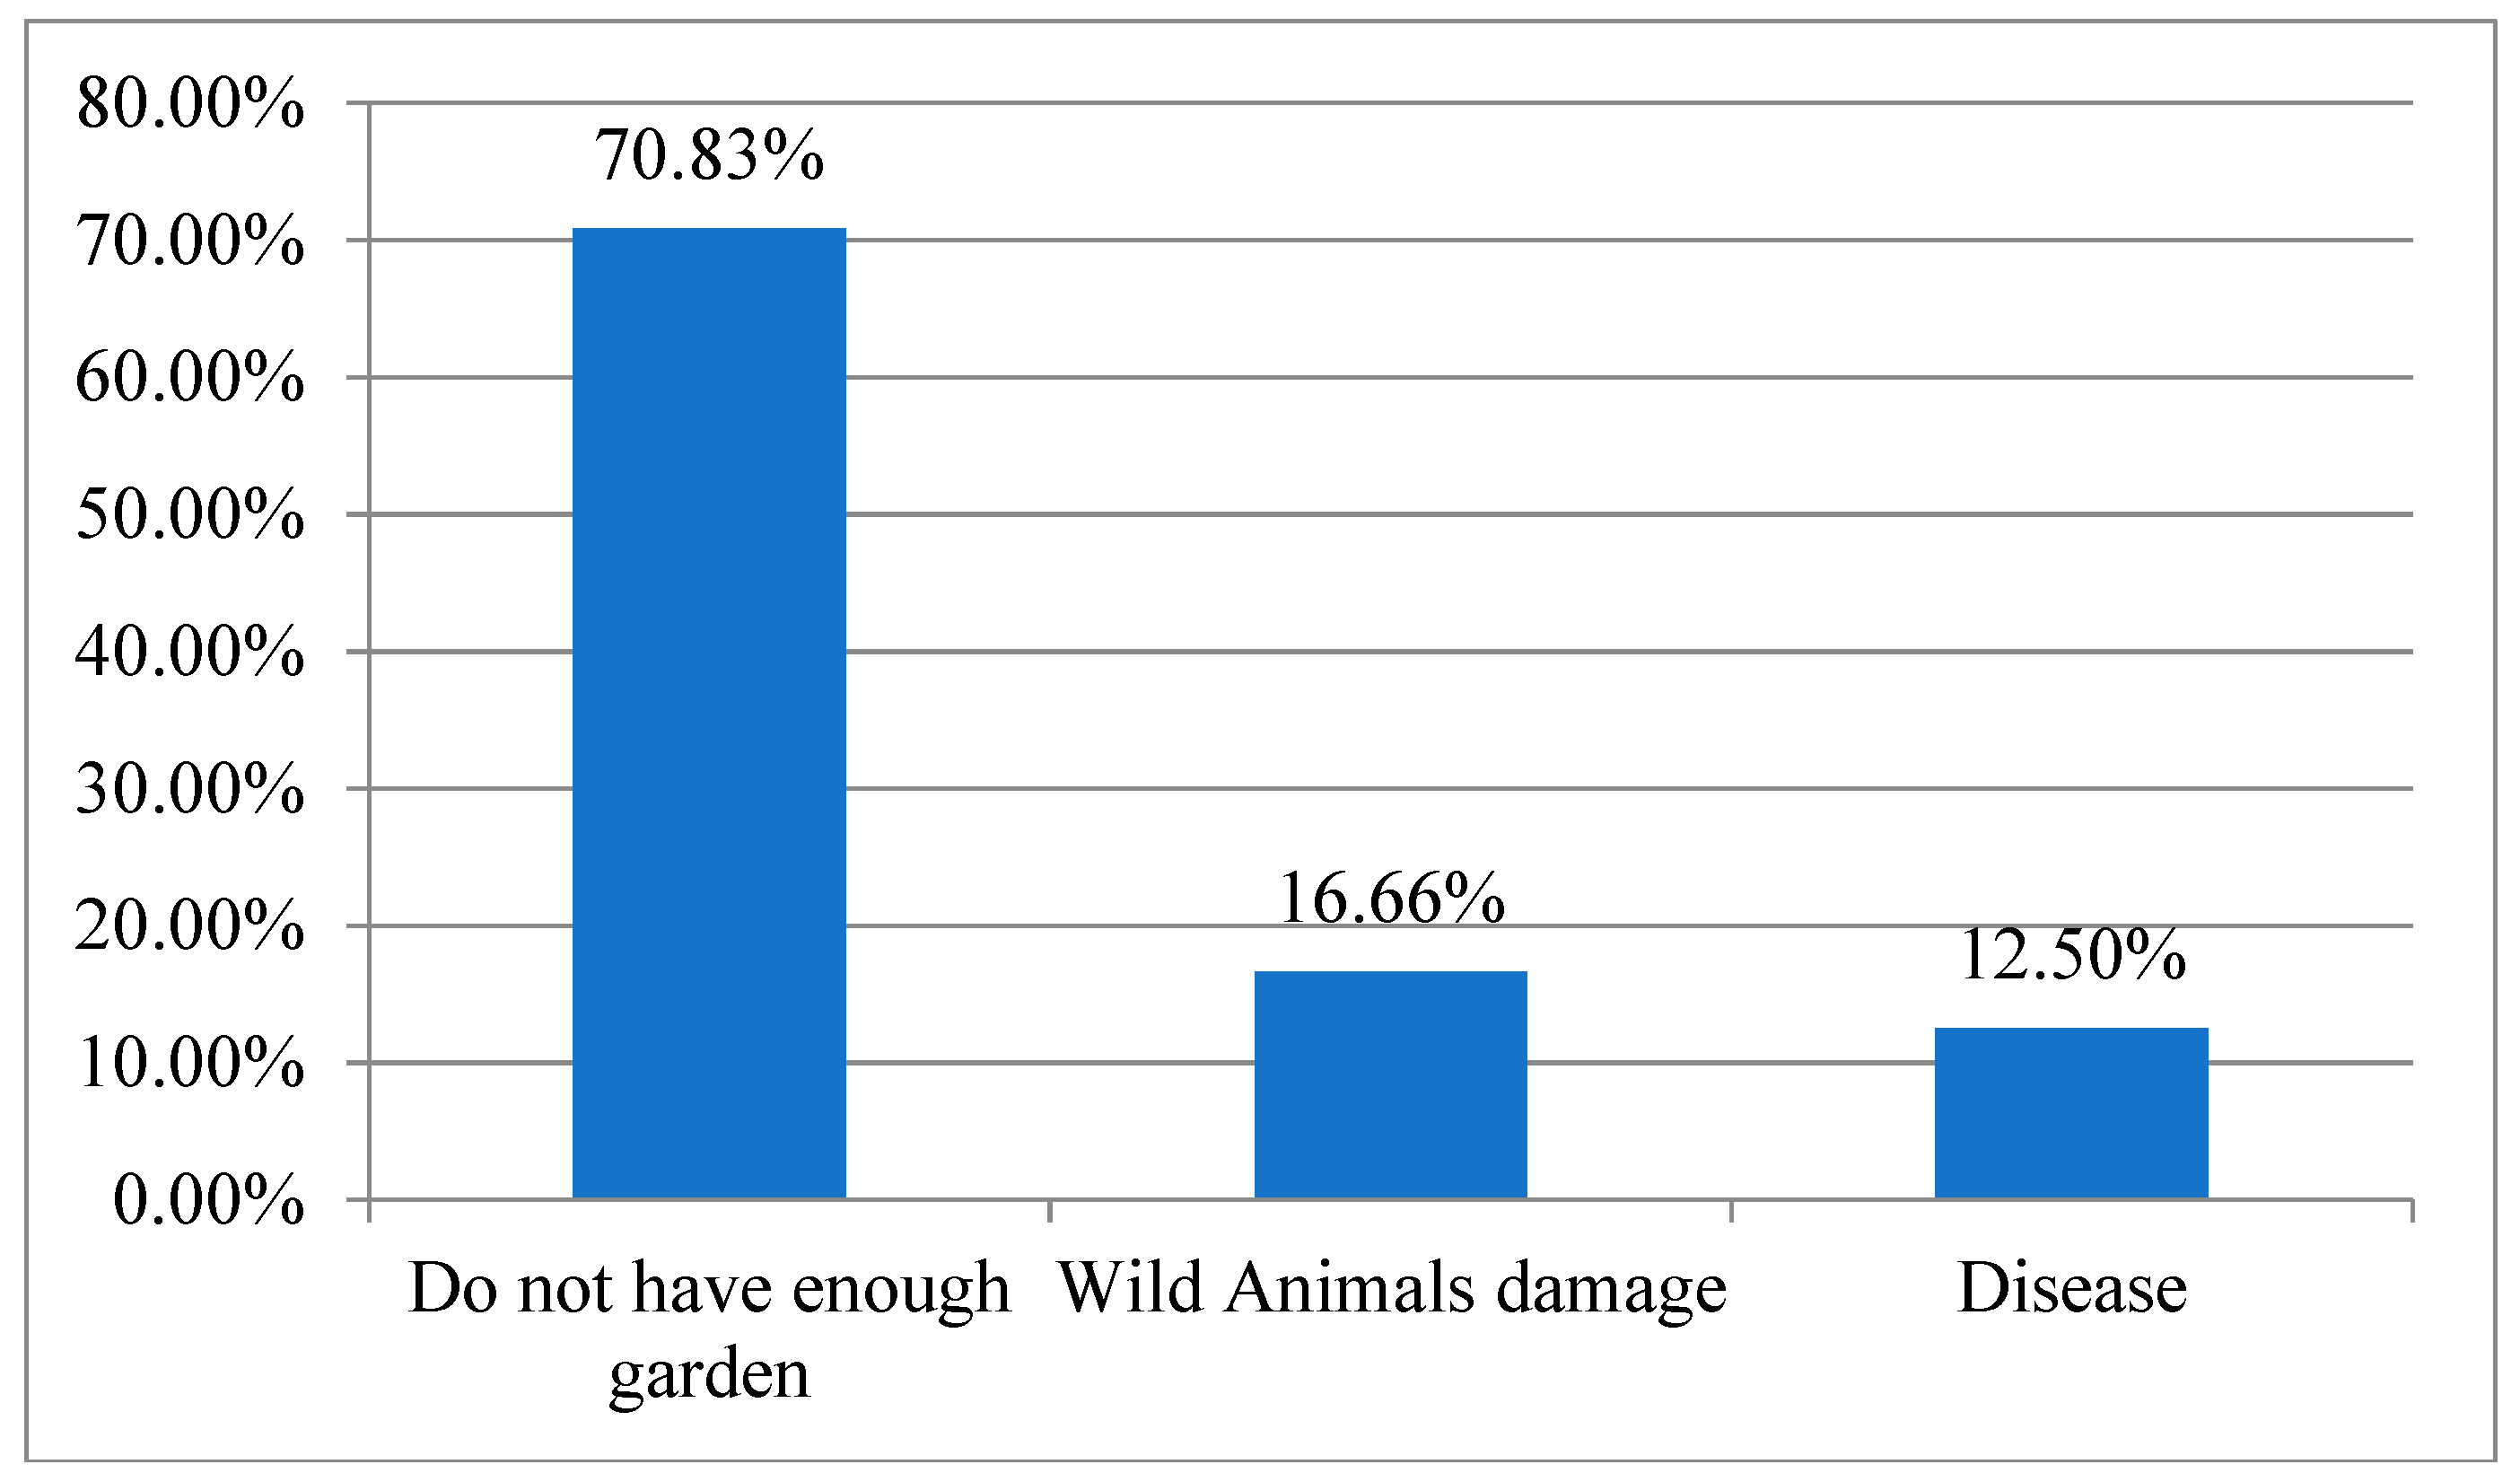
We attribute this to the tendency of large HG owners to grow fruit trees, while households with smaller HGs prefer to cultivate annual vegetables, which take a much shorter period of time to reach the harvesting period than fruit trees. About 71% of the VOU respondents considered the small size of their homegarden a reason for not growing any fruit (Figure 4). This result is in line with the conclusion from Degnet [22], stating that poorer families with less land holdings tend to have smaller homegardens, and as a consequence lower levels of diversity. The increase in species richness with increasing homegarden size was also reported by other studies on homegardens [19].

3.2. The Contribution of Fruits and Vegetables to Livelihoods

Most questionnaire respondents indicated that fruits and vegetables are contributing to their food safety, with 55.56% of respondents ranking the importance of fruits and vegetables in the households’ food intake as high, 32% ranking their importance as medium, and 12.34% ranking their importance as low.
Regardless of their wealth status, the respondents named fruits and vegetables as an important contributor to overall household food consumption and as particularly important for the food security of children in times of other crop shortages (two-tailed Chi-square test p = 0.66, X2 = 2.38, df = 4). This result is in line with a study conducted in northwestern Ethiopia [14], which stated that fruits play an important role in improving household nutritional security for at-risk populations, particularly women and children, especially during times of famine. Based on the existing literature, [34] Deribe drew the conclusion that vegetables and fruits contribute considerably to nutrition and food security.
Apart from work as an employee, we identified coffee, maize, Khat (Catha edulis (Vahl) Forssk. ex Endl.), livestock, fruits, and vegetables as major income sources in the study area.
The results indicated that coffee is the major source of income for all wealth categories, accounting for 52.43%, 68.27%, and 65.01% of the mean annual income for rich, medium, and poor households, respectively. This result confirms previous studies [17,19] highlighting coffee as the major cash crop in the area, followed by khat.
Wage was the second most important, while livestock was the least important income source for poor households. Income from maize, khat, and livestock was lower for poor households than for medium and rich households, but wage income was higher for poor households than medium-wealth households. This might be due to the tendency of poor households to engage more often in wage labor or off-farm activities to overcome their income shortage.
The sale of fruits and vegetables contributed on average 7% to the total income, contributing to a significant difference between the income of households with and without the marketing of fruits and vegetables (p < 0.01). However, the importance of the income from fruits and vegetables varied across the different wealth classes, with only 4.09% of rich, 7.12% of the medium wealthy, and 12.7% of poor farmers considering them important. Overall, we found fruits contributing more income than vegetables across all of the wealth classes, making up 7.58% of the mean total annual income of poor households and 2.41% of rich households (Table 2). Income from vegetables remained rather low, at 2.88% for rich households and 1.68% for poor households.
While income from fruits did not differ significantly between the kebeles (F = 0.46, df = 3, p = 0.708), income from vegetables was significantly lower in the Wabo and Bondo kebeles (406.25 ± 125.6) than the Gaba and Wangegne kebeles (p < 0.05). Accordingly, there was no significant difference within the same district in terms of fruit and vegetable income, but there was a significant difference between the two districts (Yayo and Hurumu). In other words, the Hurumu district received more annual income from fruits and vegetables than the Yayo district. This might be a direct result of the observed higher prevalence of vegetables and the availability of small-scale irrigation systems in the Hurumu district. In addition to this, there is a relatively better market access in the two kebeles of Hurumu, which is mainly due to the short distance to the markets of Hurumu and Metu.
Our results indicated that fruits and vegetables have the potential to contribute substantially to household livelihood. However, different challenges might limit the full productive potential of the homegardens.
Plant diseases, pests, and associated fruit abortions were the most important problems reported by 39.6% of the respondents during individual interviews and FGDs (Table 3). Citrus leaf and fruit spot, fruit rot, anthracnose, and bacterial soft rot were the most commonly reported fruit and vegetable diseases affecting fruits such as mango, papaya, lemon, kashmir, and vegetables such as cabbage, pepper, tomato, and potato. Similar diseases and pest problems have been reported, e.g., in the Kafa zone of southwestern Ethiopia [35]. Farmers often employ traditional farming practices such as the application of ashes and the removal of infected fruits and branches to manage diseases and pests. However, chemical treatments, including the application of insecticides, pesticides, or other more sophisticated and ecological integrated pest management strategies are lacking.
Wildlife damage was another important challenge for growing fruits and vegetables; it was highlighted by 19.8% of the respondents (Table 4). Monkeys and birds feed on fruits and cause physical damage to fruit trees, which in turn causes a yield reduction for the following years. The study Zewudie [36] also reported crop destruction by wild animals in Yayo and Hurumu, and emphasized that a substantial portion of the crops of the area is usually damaged by wild animals such as bush pigs, Columbus baboons, and other monkeys. Personal observation also confirmed this situation in the area.
Market access was considered to be a major challenge by about 16.7% of the respondents (Table 3), including markets for buying supplies and selling their products. Due to these challenges, farmers are often discouraged from cultivating fruits and vegetables. Similar findings were also reported by Katja [37], who argued that poor market access encouraged subsistence-orientated production. In addition, as it was also discussed in Tefera [38], low market return and access may also cause farmers to grow only a few cash crops; we can see this in the study area in terms of coffee and khat expansion, which in turn has a negative impact on the biodiversity of homegardens. However, for poor farmers, fruits and vegetables may provide an important source of food and nutrition security, even under difficult conditions for marketing this product. Other studies have confirmed our results and reported that agricultural products other than coffee and honey are less marketed and mostly consumed at the household level [39].

3.3. Effects of Homegardens on Household Forest Dependence and Nature Conservation

About 37.5% of respondents confirmed that they regularly harvest different forest products to meet their household needs such as fuel wood, forest coffee, fibers, and spices. Forest coffee and firewood were the two most important forest products harvested (63.9%) for local households, followed by spices and lianas (16.7%).
However, the majority of forest resource-dependent households (88.2%) were VOU households. This might be a consequence of the higher income and food security of fruit-growing households compared to other households. FVU relied significantly less on forest products than VOU, and showed significantly lower levels of nearby forest harvesting (r = −0.566, p < 0.01).
The majority (76.04%) of the respondents indicated that the planting of trees in their homegarden was a direct consequence of the declaration of the biosphere reserve and the resulting shortage of fuel wood, construction, and fencing materials. They also reported using fruit and other trees in their homegardens as a source for food, timber, and firewood, which replaced the most important products harvested from the forest. Our results indicate the importance of homegardens, specifically of fruit trees, to alleviate pressures from nearby forests as a source for wood, fiber, and other forest products.
The study Utpal [40] from Canada reported that the distance of a village from the next forest site highly affected the utilization of timber or non-timber products as a result of increasing time requirements and work force to collect the products with increasing distance. In this study, only 18.33% of respondents indicated that the long distance was their reason for not harvesting products from the forest, while the majority (61.66%) agreed that they substitute forest products with resources from their own farms. Only a minority of respondents reasoned that the forest is legally protected (10%) or that the resources can be accessed through local markets or sharing with their neighborhood (10%). This result indicates the important role of agroforestry systems in minimizing pressure on protected areas and natural forests. The main objective of the protection of the biosphere reserve is to maintain biodiversity and decrease the pressures exerted by the local community in the natural areas. It also encourages the sustainable use of natural resources without adversely affecting the biosphere reserve. However, food and income shortages have forced local communities to harvest natural forests and violate protected areas.
The results in this study highlight the important role of fruits and vegetables in plant biodiversity conservation and household livelihoods in terms of food and income generation. Fruits and vegetables have the potential to provide both food and income, thereby substituting resources that were previously harvested from natural forests. Therefore, an extension of the fruit and vegetable production in homegardens may have the potential to lower the pressures on natural forests, thereby improving the sustainable use of biodiversity in the biosphere reserves.

4. Conclusions and Recommendation

In this study, the contributions of fruits and vegetables in homegardens to biodiversity conservation and household livelihood were assessed. Plant diversity was identified and calculated in sampled homegardens growing fruits and vegetables, and homegardens growing only vegetables. It was found that the plant diversity was more diverse in fruit and vegetable homegardens than solely vegetable homegardens. Plant species’ richness was not determined by the age of the HG owner and the age of the HG, but rather by the size of the homegarden. The study also shows a positive correlation between fruits and vegetables growing homegarden, and plant diversity.
The contribution of fruits and vegetables to household livelihood was also assessed, and it was found that fruits and vegetables in the homegarden highly contribute to the household’s food requirement and income generation. However, most fruit and vegetable products are consumed at home and are less marketable. A comparison was done on both the contributions of fruits and vegetables to the household total annual income among the three different wealth categories. The results indicated that low-income households benefit more from growing fruits and vegetables in their homegardens than rich households.
The result revealed the direct and indirect contribution of fruits and vegetables in home gardens to biodiversity conservation. The direct contribution is that fruit and vegetable species that are cultivated in the homegardens themselves are the objects of plant diversity. The indirect role arises from the result: fruits and vegetables substantially contribute to household livelihood. Consequently, forest-dependent low-income households may reduce their use of forest products, thereby reducing pressure on forest biodiversity. In line with this, we found a negative correlation between fruit and vegetable use and forest product harvesting.
The results of this study indicated that growing fruits and vegetables in homegardens can play an important role in household livelihoods and biodiversity conservation. Nevertheless, fruits and vegetables are not contributing to the livelihood at their full potential due to limiting factors existing in the area such as the lack of an appropriate market, diseases, and insect and animal pests. The implementation of appropriate policy measures and interventions are of crucial importance to realize the benefits of fruit and vegetable growing in homegardens to supply fruit and vegetable varieties that are less prone to insect pests and diseases. Knowledge transfer about appropriate and integrated pest management measures can also bring a substantial change to farmers’ livelihood. Additionally, the market access of fruit and vegetable growers needs to be improved. Market chain analysis may also help enhance farmers’ profits from their fruit and vegetable supplies, thereby increasing the positive effects for their livelihoods.

Author Contributions

M.M.: Data curation, formal analysis, methodology, writing original draft, writing reviews and editing. K.H.: Methodology, resources, supervision. L.B.-F.: Funding acquisition, project administration, supervision.

Funding

This research was funded by NutriHAF-Africa project.

Acknowledgments

Our special thanks go to NutriHAF-Africa project “Diversifying Agriculture for Balanced Nutrition through Fruits and Vegetables in Multi-story Cropping System” for financial and technical support.

Conflicts of Interest

The authors declare no conflicts of interest.

Appendix A

Table A1. Plant species identified in Yayo and Hurumu districts.
No.Local NameScientific NameFamily NameGrowth HabitUse
1Abrango (O)Brassica carinata A. Br.BrassicaceaeHerb Vegetable
2Abukado (A)Persea americana Mill.LauraceaeTree Edible fruit
3Adami (O)Euphorbia abyssinica Gmel.EuphorbiaceaeTree Live fence
4Akurater (A)Glycine max L.FabaceaeBush Edible grain
5Ambebesa (O)Albizia gummifera Gmel.FabaceaeTree Timber
6AnanasAnanas comosus L.BromeliaceaeHerb Edible fruit
7Anfare (O)Nuxia congeta R.Br.LoganiaceaeTree/shrub Live fence
8Apple Malus domestica BorkhRosaceaeTree Edible fruit
9Bakkanisa (O)Croton macrostachyus Del.EuphorbiaceaeTree Medicinal, timber
10Bay bay (O)Nerium oleander L.ApocynaceaeShrub Live fence
11Bekeri (O)Cordia monoica Roxb.BoraginaceaeShrub Household tool, shade
12Besobila (O)Ocimum basilicum L.LamiaceaeHerb Spice
13Birbisa (O)Podocarpus falcatus Mirb.PodocarpaceaeTree Timber
14Buna (O)Coffea Arabica L.RubiaceaeShrubStimulant
15Buri/(A, O)Manihot esculenta Crantz.EuphorbiaceaeShrub Vegetable
16Burtukana (O)Citrus sinensis L.RutaceaeShrub/tree Edible fruit
17Chada (O)Euphorbia tirucalli L.EuphorbiaceaeShrub/treeLive fence
18KhatCatha edulis (Vahl) Forssk. ex Endl.QulqalCelastraceaeShrub Stimulant
19Dafe (O)Phaseolus lunatus L.FabaceaLianaEdible grain
20DamakaseOcimum lamiifolium Hochst. ex. Benth.LamiaceaeShrub Medicinal
21Dhumuga (O)Justicia schimperiana (Hochst. ex Nees) T. Anders.AcanthaceaeShrub Medicinal
22Dinblala (O)Nepeta azurea R.LamiaceaeHerb Spice, medicinal
23Ebicha (O)Vernonia amygdalina Del.Asteraceae Shrub Forage, timber
24Endodi (A)Phytolacca dodecandra L’Her.PhytolaccaceaeShrub Medicinal
25Enset (A)Ensete ventricosum Welw.Musaceae(E.edule)Herb Edible, forage
26Erd (A)Curcuma domestica ValetonZingiberaceaeHerb Spice
27Geesho (A)Rhamnus prinoides L’ Herit.RhamnaceaeShrub/tree Beverage input, household tool
28Gishta (A)Annona senegalensis Pers.AnnonaceaeShrubEdible fruit
29Godere (O, A)Colocasia esculenta (L.) Schott AraceaeHerb Vegetable
30Gora (O)Rubus genus (Rubus spp.)RosaceaeShrubEdible and live fence
31Grar (A)Acacia abyssinica Hochst.FabaceaeTree Timber, medicinal
32GravilaGrevillea robusta R.ProteaceaeTree Timber
33GuatmalaTripsacumandersonii J.PoaceaeGrassForage
34Harangema (O)Caesalpiniadecapetala (Roth) AlstonFabaceaeShrub Live fence
35Jijimbila (O)Zingiber officinale RoscoeZingiberaceaeHerb Spice
36Kazmir (A)Casimiroa edulis La LlaveRutaceaeTree Edible fruit
37Key abeba (A)Euphorbia cotinifolia L.EuphorbiaceaeShrub Live fence
38Key bahrzaf (A)Eucalyptus camaldulensis Dehnh.MyrtaceaeTree Timber
39Kororima (A)Aframomumcorrorima (Braun) JansenZingiberaceaeHerbSpice
40Kulkual (A)Opuntia ficus-indica L.CactaceaeShrub Live fence
41Lokko (O)Diospyros abyssinica (Hiern) F. WhiteEbenaceaeTree Timber
42Lolchisa (O)Diospyrosscabra (Chiov.) Cufod.EbenaceaeTree Timber, shade
43Lomii (A) Citrus aurantiifolia (Christm.) SwingleRutaceaeShrub/tree Edible fruit
44MangoMangiferaindica L.AnacardiaceaeTree Edible fruit
45Merge Urga (O)Cymbopogon citratus (DC.) Stapf.Poaceaeherb Ornamental
46Muziferenji (O)Musa acuminate CollaMusaceae Herb Edible fruit
47Muzii (O)Musa x-paradisiaca L.MusaceaeHerb Edible fruit
48NechBahrzafEucalyptus globulus Labill.MyrtaceaeTreeTimber
49Papaya Carica papaya L.CaricaceaeTree Edible fruit
50Qariya (A)Capsicum annuum L.SolanaceaeHerb Vegetable
51Qiltu (OFicusthonningii BlumeMoraceaeShrub/tree Shade
52Qobo (O)Ricinus communis L.EuphorbiaceaeShrub/tree Household tool
53Qodo (O)Myrtuscommunis L.MyrtaceaeShrub Medicinal
54Reji (O)Vernonia auriculifera Hiern.AsteraceaeShrub/tree Household tool
55Rigaraba (O)Brideliamicrantha (Hochst.) Baill.EuphorbiaceaeTreeFodder (leave)
56Sarte (O)Dracaena steudneri Engil.DracaenaceaeShrub Forage
57SespaniyaSesbaniasesban L.FabaceaeShrub/tree Crops shade
58Shenkora (A)Saccharum officinarum L.PoaceaeHerb Vegetable
59Shiferaw (A)Moringa stenopetala (Bak. f.) Cuf.MoringaceaeTree Medicinal
60Sigametbesha (A)Rosmarinus officinalis L.LamiaceaeShrub Spice
61Skuardinich (A)Ipomoea batatas L.ConvolvulaceaeHerb Vegetable
62Sufii (O)Helianthus annuus L.AsteraceaeForbEdible grain
63Tambo (O)Nicotiana tabacum L.SolanaceaeHerb Medicinal, Stimulant
64Tenadam (A)Rutachalepensis L.RutaceaeHerb Medicinal
65Tid (A)Cupressus lusitanica Mill.CupressaceaeTree Timber
66Tikurinchet (A)Prunus Africana (Hook.f.) Kalkm.RosaceaeTree Timber
67Timatim (A)Lycopersiconesculentum Mill.SolanaceaeHerb Vegetable
68Turungo (O)Citrus medica L.RutaceaeShrub/tree Edible fruit
69Urgessa (O)Premnaschimperi Engl.LamiaceaeShrub -
70VetiverChrysopogonzizanioides L.PoaceaeGrassForage, erosion control
71Wodessa (O)Cordia africana Lam.BoraginaceaeTree Timber
72Wolensu (O)Erythrina abyssinica Lam. ex DC.Fabaceae Tree Live fence
73Yam Dioscoreacayenensis Lam.DioscoreaceaegeophyteVegetable
74Zenbamba (A)Phoenix reclinata Jacq.ArecaceaeTree Household tool
75Zeytuna (A)Psidium guajava L.MyrtaceaeTree Edible fruit
76Zihonsar (A)Pennisetum purpureum Schumach.PoaceaeGrass Forage
Key: A = Amharic language; O = Afaan Oromo.

Appendix B

Table A2. Species frequency, relative frequency, density, and relative density.
No. Species Name FrequencyRelative Frequency (%)Density (ha−1)Relative Density (%)
62Acacia abyssinica Hochst.80.521.150.09
66Aframomumcorrorima50.323.570.29
28Albizia gummifera221.427.370.6
57Ananas comosus100.645.070.41
52Annona senegalensis110.711.50.12
32Brassica carinata201.2935.372.88
74Bridelia micrantha10.060.460.04
38Caesalpinia decapetala191.23--
46Capsicum annuum140.9166.7113.59
19Caricapapaya271.748.640.7
23Casimiroa edulis231.484.380.36
2Catha edulis593.8194.5915.86
9Chrysopogon zizanioides402.58--
41Citrus aurantiifolia171.13.340.27
60Citrus medica90.581.270.1
29Citrus sinensis211.354.720.38
1Coffea arabica835.35238.4819.44
21Colocasia esculenta271.74--
22Cordia Africana251.615.650.46
68Cordia monoica50.323.570.29
30Croton macrostachyus211.354.490.37
75Cupressus lusitanica10.060.230.02
50Curcuma domestica130.8511.520.94
69Cymbopogon citratus50.321.380.11
73Dioscorea cayenensis10.06--
64Diospyros abyssinica60.390.810.07
67Diospyros abyssinica50.321.150.09
27Dracaena steudneri221.425.180.42
8Ensete ventricosum402.5828.922.36
24Erythrina abyssinica231.4815.781.29
16Eucalyptus camaldulensis31223.271.9
76Eucalyptus globulus10.060.350.03
71Euphorbia abyssinica40.260.580.05
25Euphorbia cotinifolia231.4823.271.9
7Euphorbia tirucalli412.64--
54Ficus thonningii110.711.270.1
61Glycine max90.585.070.41
40Grevillea robusta181.164.950.4
59Helianthus annuus100.6430.24
43Ipomoea batatas161.03--
14Justicia schimperiana362.324.150.34
53Lycopersicon esculentum110.7113.821.13
56Malus domestica100.651.270.1
5Mangifera indica422.7216.471.34
58Manihot esculenta100.645.30.43
36Moringa oleifera191.233.570.29
10Musa acuminate392.5143.663.56
4Musa x-paradisiaca442.8447.243.85
49Myrtus communis130.858.990.73
65Nepeta azurea50.322.30.19
31Nerium oleander211.353.340.27
37Nicotiana tabacum191.238.990.73
72Nuxia congeta20.130.460.04
33Ocimum basilicum201.298.760.71
18Ocimum lamiifolium291.875.880.48
26Opuntia ficus-indica231.48--
48Pennisetum purpureum140.917.861.46
6Persea Americana412.6414.41.17
35Phaseolus lunatus191.234.260.35
51Phoenix reclinata130.843.340.27
47Phytolacca dodecandra L’Her.140.96.80.55
63Podocarpus falcatus70.450.920.08
70Premna schimperi40.260.580.05
45Prunus Africana150.973.80.31
44Psidium guajava150.9730.24
12Rhamnus prinoides382.4518.891.54
11Ricinus communis382.4513.251.08
34Rosmarinus officinalis201.296.220.51
55Rubus genus110.71--
3Ruta chalepensis462.9721.21.73
20Saccharum officinarum271.7481.686.66
17Sesbania sesban301.9310.710.87
39Tripsacum andersonii181.16--
13Vernonia amygdalina382.4510.940.89
15Vernonia auriculifera322.0616.131.31
42Zingiber officinale171.1--
Total1551100 100

Appendix C

Table A3. Correlations Table A1.
Age of RespondentsNumber of Household MembersLand Size of the Sample HouseholdAge of HomegardenUse of Fruits and VegetablesDistance from ForestHarvest of Products from ForestTotal Income
Age of respondentsPearson Correlation10.248 *0.221 *0.488 *−0.1960.1430.1540.071
Sig. (2-tailed) 0.0150.0300.0000.0560.1650.1330.493
N9696969696969696
Number of household membersPearson Correlation0.248 *10.1150.229 *−0.119−0.0860.0500.172
Sig. (2-tailed)0.015 0.2640.0250.2480.4030.6270.093
N9696969696969696
Land size of the sample householdPearson Correlation0.221 *0.11510.135−0.247 *0.0790.213 *0.572 **
Sig. (2-tailed)0.0300.264 0.1900.0150.4460.0370.000
N9696969696969696
Age of homegardenPearson Correlation0.488 **0.229 *0.1351−0.0710.0920.085−0.066
Sig. (2-tailed)0.0000.0250.190 0.4910.3740.4080.523
N9696969696969696
Use of fruits and vegetablesPearson Correlation−0.196−0.119−0.247 *−0.0711−0.008−0.405 **−0.107
Sig. (2-tailed)0.0560.2480.0150.491 0.9400.0000.299
N9696969696969696
Distance from forestPearson Correlation0.143−0.0860.0790.092−0.00810.087−0.021
Sig. (2-tailed)0.1650.4030.4460.3740.940 0.3980.837
N9696969696969696
Harvest of products from forestPearson Correlation0.1540.0500.213 *0.085−0.405 **0.08710.100
Sig. (2-tailed)0.1330.6270.0370.4080.0000.398 0.332
N9696969696969696
Total incomePearson Correlation0.0710.1720.572 **−0.066−0.107−0.0210.1001
Sig. (2-tailed)0.4930.0930.0000.5230.2990.8370.332
N9696969696969696
* Correlation is significant at the 0.05 level (two-tailed). ** Correlation is significant at the 0.01 level (two-tailed).
Table A4. Correlation Table A2.
Homegarden SizeAge of HomegardenAge of RespondentsNumber of Species Found in the HomegardenUser or Non-User
Homegarden sizePearson Correlation1−0.072−0.0850.368 **−0.106
Sig. (two-tailed) 0.4860.4120.0000.302
N9696969696
Age of homegardenPearson Correlation−0.07210.488 **0.0570.121
Sig. (two-tailed)0.486 0.0000.5790.239
N9696969696
Age of respondentsPearson Correlation−0.0850.488 **1−0.0430.110
Sig. (two-tailed)0.4120.000 0.6810.285
N9696969696
Number of species found in the homegardenPearson Correlation0.368 **0.057−0.0431−0.264 **
Sig. (two-tailed)0.0000.5790.681 0.009
N9696969696
User or non-userPearson Correlation−0.1060.1210.110−0.264 **1
Sig. (two-tailed)0.3020.2390.2850.009
N9696969696
* Correlation is significant at the 0.05 level (two-tailed). ** Correlation is significant at the 0.01 level (two-tailed).

References

  1. Balana, B.B.; Mathijs, E.; Muys, B. Assessing the Sustainability of Forest Management: An Application of Multi-Criteria Decision Analysis to Community Forests in Northern Ethiopia. J. Environ. Manag. 2010, 91, 1294–1304. [Google Scholar] [CrossRef] [PubMed]
  2. NCCB (Network Creation and Capacity Building in Yayu Biosphere). Yayu Biosphere in Brief; NCCB (Network Creation and Capacity Building in Yayu Biosphere): Addis Ababa, Ethiopia, 2014; pp. 1–6. [Google Scholar]
  3. Sunderland, T. Food Security: Why Is Biodiversity Important? Sécurité Des Aliments: Pourquoi La Biodiverstiré Est-Elle Importante? Seguridad Alimentaria: ¿por Qué Es Importante La Biodiversidad? Int. For. Rev. 2011, 13, 266–274. [Google Scholar]
  4. Khasa, P.D.; Dancik, B.P. Sustaining Tropical Forest Biodiversity. J. Sustain. For. 1997, 4, 1–31. [Google Scholar] [CrossRef]
  5. Humphries, C.J.; Williams, P.H.; Wright, R.V. Measuring Biodiversity Value for Conservation. Annu. Rev. Ecol. Syst. 1995, 26, 93–111. [Google Scholar] [CrossRef]
  6. Musotsi, A.A.; Sigot, A.J.; Onyango, M.O.A. The Role of Home Gardening in Household Food Security in Butere Division of Western Kenya. Afr. J. Food Agric. Nutr. Dev. 2008, 8, 378–388. [Google Scholar] [CrossRef]
  7. FAO (Food Agricultural Organization). Ethiopia’s Forest Resource Level Submission to the UNFFCC Ethiopia; FAO (Food Agricultural Organization): Addis Ababa, Ethiopia, 2016. [Google Scholar]
  8. Mohan, S.; Nair, P.R.; Long, A.J. An Assessment of Ecological Diversity in Homegardens: A Case Study from Kerala State, India. J. Sustain. Agric. 2007, 29, 135–151. Available online: http://jsa.haworthpress.com (accessed on 9 June 2018). [CrossRef]
  9. Coomes, O.T.; Ban, N. Cultivated Plant Species Diversity in Home Gardens of an Amazonian Peasant Village in Northeastern Peru. Econ. Bot. 2004, 58, 420–434. [Google Scholar] [CrossRef]
  10. Jose, S. Agroforestry for Conserving and Enhancing Biodiversity. Agrofor. Syst. 2012, 85, 1–8. [Google Scholar] [CrossRef]
  11. Horrigan, L.; Lawrence, R.S.; Walker, P. Review How Sustainable Agriculture Can Address the Environmental and Human Health Harms of Industrial Agriculture. Environ. Health Perspect. 2002, 110, 445–456. [Google Scholar] [CrossRef] [PubMed]
  12. Shiva, V. The Violence of Green Revolution: Third World Agriculture, Ecology and Politics; Zed Books LTD: Penang, Malaysiam, 1993. [Google Scholar]
  13. Dahlquist, R.M.; Whelan, M.P.; Winowiecki, L.; Polidoro, B.; Candela, S.; Harvey, C.A.; Wulfhorst, J.D.; McDaniel, P.A.; Bosque-Pérez, N.A. Incorporating Livelihoods in Biodiversity Conservation: A Case Study of Cacao Agroforestry Systems in Talamanca, Costa Rica. Biodivers. Conserv. 2007, 16, 2311–2333. [Google Scholar] [CrossRef]
  14. Linger, E. Agro-Ecosystem and Socio-Economic Role of Homegarden Agroforestry in Jabithenan District, North-Western Ethiopia: Implication for Climate Change Adaptation. SpringerPlus 2014, 3, 1–9. Available online: http://www.springerplus.com/content/3/1/154 (accessed on 23 May 2018). [CrossRef] [PubMed]
  15. Kumar, B.M.; Nair, P.R. The Enigma of Tropical Homegardens. Agrofor. Syst. 2004, 61, 135–152. [Google Scholar] [CrossRef]
  16. Muhammed, N.; Masum, M.F.H.; Hossain, M.M.; Chakma, S.; Oesten, G. Economic Dependence of Rural People on Homestead Forestry in Mymensingh, Bangladesh. J. For. Res. 2013, 24, 591–597. [Google Scholar] [CrossRef]
  17. Gole, T.W. Vegetation of the Yayu Forest in SW Ethiopia: Impacts of Human Use and Implications for in Situ Conservation of Wild Coffea Arabica L. Populations; Ecology and Development Series; Cuvillier: Göttingen, Germany, 2003; Volume 10, p. 171. [Google Scholar]
  18. Ali, A.M.S. Homegardens in Smallholder Farming Systems: Examples from Bangladesh. Hum. Ecol. 2005, 33, 245–270. [Google Scholar] [CrossRef]
  19. Abebe, T.; Sterck, F.J.; Wiersum, K.F.; Bongers, F. Composition and Density of Trees and Shrubs in Agroforestry Homegardens in Southern Ethiopia. Agrofor. Syst. 2013, 87, 1283–1293. [Google Scholar] [CrossRef]
  20. Kebebew, Z.; Urgessa, K. Agroforestry Perspective in Land Use Pattern and Farmers Coping Strategy: Experience from Southwestern Ethiopia. World J. Agric. Sci. 2011, 7, 73–77. [Google Scholar]
  21. Woldegeorgis, G.; Wube, T. A Survey on Mammals of the Yayu Forest in Southwest Ethiopia. J. Sci. 2012, 35, 135–138. [Google Scholar]
  22. Abebaw, D.; Virchow, D. The Microeconomics of Household Collection of Wild Coffee in Ethiopia: Some Policy Implications for In-Situ Conservation of Coffea arabica genetic diversity. Communal Areas Manag. Program. Indig. Resour. 2003, 27, 1–21. [Google Scholar]
  23. UNESCO (United Nations Educational, Scientific and Cultural Organization). World Network of Biosphere Reserves 2010: Sites for Sustainable Development; UNESCO (United Nations Educational, Scientific and Cultural Organization): Paris, France, 2010. [Google Scholar]
  24. CSA (Central Statistical Agency Ethiopia). Central Statistical Agency Ethiopia; Population Projection of Ethiopia for All Regions at Wereda Level from 2014–2017; CSA (Central Statistical Agency Ethiopia): Addis Ababa, Ethiopia, 2013.
  25. Hedberg, I. Flora of Ethiopia and Eritrea. In The Biodiversity of African Plants; The National Herbarium, Addis Ababa University: Addis Ababa, Ethiopia, 1989; Volume 3, pp. 1–659. [Google Scholar]
  26. Hedberg, I. Flora of Ethiopia and Eritrea. In The Biodiversity of African Plants; The National Herbarium, Addis Ababa University: Addis Ababa, Ethiopia, 1997; Volume 6, pp. 1–586. [Google Scholar]
  27. Hedberg, I. Flora of Ethiopia and Eritrea. In The Biodiversity of African Plants; The National Herbarium, Addis Ababa University: Addis Ababa, Ethiopia, 2000; Volume 2, pp. 1–532. [Google Scholar]
  28. Hedberg, I. Flora of Ethiopia and Eritrea. In The Biodiversity of African Plants; The National Herbarium, Addis Ababa University: Addis Ababa, Ethiopia, 1995; Volume 2, pp. 1–456. [Google Scholar]
  29. Hedberg, I. Flora of Ethiopia and Eritrea. In The Biodiversity of African Plants; The National Herbarium, Addis Ababa University: Addis Ababa, Ethiopia, 2003; Volume 4, pp. 1–352. [Google Scholar]
  30. Tesemma, A.B. Useful Trees and Shrubs of Ethiopia: Identification, Propagation and Management for 17 Agroclimatic Zones; World Agroforestry Centre, East Africa Region: Nairobi, Kenya, 2007. [Google Scholar]
  31. Negash, M.; Yirdaw, E.; Luukkanen, O. Potential of Indigenous Multistrata Agroforests for Maintaining Native Floristic Diversity in the South-Eastern Rift Valley Escarpment, Ethiopia. Agrofor. Syst. 2012, 85, 9–28. [Google Scholar] [CrossRef]
  32. Gbedomon, R.C.; Fandohan, A.B.; Salako, V.K.; Idohou, A.F.R.; Kakaї, R.G.; Assogbadjo, A.E. Factors Affecting Home Gardens Ownership, Diversity and Structure: A Case Study from Benin. J. Ethnobiol. Ethnomed. 2015, 11, 56. [Google Scholar] [CrossRef]
  33. Withrow-Robinson, B.; Hibbs, D.E. Testing an Ecologically Based Classification Tool on Fruit-Based Agroforestry in Northern Thailand. Agrofor. Syst. 2005, 65, 123–135. [Google Scholar] [CrossRef]
  34. Deribe, H.; Adugnaw, M. Review on Contribution of Fruits and Vegetables on Food Security in Ethiopia. J. Biol. Agric. Healthc. 2016, 6, 49–58. [Google Scholar]
  35. Kebede, M. Survey of Insects and Diseases of Fruit Crops in SNNPR: In the Case of Kafa Zone. J. Biol. 2015, 5, 73–82. [Google Scholar]
  36. Tulu, Z.J. Institutions, Incentives and Conflict in Coffee Forest Use and Conservation: The Case of Yayo Forest in Iluu Abba Bora Zone, Southwest Ethiopia; Bonn University: Bonni, Germany, 2009. [Google Scholar]
  37. Kehlenbeck, K.; Maass, B.L. Crop Diversity and Classification of Homegardens in Central Sulawesi, Indonesia. Agrofor. Syst. 2004, 63, 53–62. [Google Scholar] [CrossRef]
  38. Mekonen, T.; Giday, M.; Kelbessa, E. Ethnobotanical Study of Homegarden Plants in Sebeta-Awas District of the Oromia Region of Ethiopia to Assess Use, Species Diversity and Management Practices. J. Ethnobiol. Ethnomed. 2011, 11, 64. [Google Scholar] [CrossRef] [PubMed]
  39. Senbeta, F.; Gole, T.W.; Denich, M.; Kellbessa, E. Diversity of Useful Plants in the Coffee Forests of Ethiopia. Ethnobot. Res. Appl. 2013, 11, 49–69. [Google Scholar]
  40. Kumar, U. Impacts on Livelihood. Can. Cent. Sci. Educ. 2012, 2, 96–114. [Google Scholar]
Figure 1. Map of study area; Yayo and Hurumu Woreda.
Agriculture 08 00190 g001
Figure 2. Sample Pictures illustrating Homegarden Agroforestry System in Yayo and Hurumu Districts.
Agriculture 08 00190 g002
Figure 3. Relationships between homegarden size and species richness.
Agriculture 08 00190 g003
Figure 4. Given reasons for not growing any fruit in the home garden.
Agriculture 08 00190 g004
Table 1. Maximum, minimum, and average number of species found in the homegardens (HG) of fruit and vegetable users (FVU) and vegetable-only users (VOU).
User GroupsMax. No. of Species in Sample HGMin. No. of Species in Sample HGAverage No. of Species in Sample HGShannon Diversity Index (H′)Species Evenness
FVU311115.853.300.81
VOU21815.002.880.68
Plant diversity of the FVU (H′ = 3.30) was significantly higher than VOU homegardens (H′ = 2.88, p < 0.05, Table 1). This result is in line with another study [14] conducted in the Jabithenan district, Northwestern Ethiopia, who found that homegarden agroforestry is more diverse than non-tree based homegardens. Sorenson’s similarity indicated that 84% of plant species were similar for both FVU and VOU homegardens.
Table 2. Percentage share of income from different income sources for wealth categories.
Wealth CategoryFruit (%)Vegetables (%)Fruits and Vegetables (%)Wage (%)Livestock (%)Coffee (%)Maize (%)Khat (%)
Rich2.411.684.089.894.3752.4311.9617.27
Medium4.242.887.124.943.5468.278.227.91
Poor7.585.1212.78.092.7865.017.074.35
Table 3. Reported problems for low fruit and vegetable income with user groups.
No. Reported ProblemFrequencyPercentRank
1Wild animal damage1919.8%3
2Disease problem3839.6%1
3Market access problem1616.7%4
4Wild animals and disease problem2324.0%2
Total96100%
Table 4. The relationship between growing fruits and vegetables in a homegarden and forest harvesting.
Do You Harvest Products from the Forest?
Yes (%)No (%)
FVU11.771
VOU88.329
Total100100

