Article

The Common Bean (Phaseolus vulgaris) Basic Leucine Zipper (bZIP) Transcription Factor Family: Response to Salinity Stress in Fertilized and Symbiotic N2-Fixing Plants

1
Centro de Ciencias Genómicas, Universidad Nacional Autónoma de México, Cuernavaca 62209, Morelos, Mexico
2
Laboratorio de Fisiología Vegetal, Facultad de Biología, Universidad de La Habana, La Habana 10400, Cuba
*
Author to whom correspondence should be addressed.
These authors contributed equally to this work.
Agriculture 2018, 8(10), 160; https://doi.org/10.3390/agriculture8100160
Submission received: 10 August 2018 / Revised: 19 September 2018 / Accepted: 3 October 2018 / Published: 11 October 2018
(This article belongs to the Special Issue Legume-rhizobia Symbiosis: Current Knowledge and Future Prospects)

Abstract

:
The basic leucine zipper (bZIP) transcription factor family regulates plant developmental processes and response to stresses. The common bean (Phaseolus vulgaris), an important crop legume, possesses a whole set of 78 bZIP (PvbZIP) genes, the majority of these (59%) are most highly expressed in roots and nodules, root-derived new organs formed in the rhizobia N2-fixing symbiosis. Crop production is highly affected by salinity in Cuba and other countries. In this work we characterized the adverse effect of salinity to common bean plants of the Cuban CC-25-9-N cultivar grown in fertilized (full N-content) or symbiotic N-fixation (rhizobia inoculated) conditions. We assessed if PvbZIP TF participate in CC-25-9-N common bean response to salinity. Quantitative reverse-transcriptase-PCR (qRT-PCR) expression analysis showed that 26 out of 46 root/nodule-enhanced PvbZIP, that responded to salt stress in roots and/or nodules from fertilized and N2-fixing CC-25-9-N plants. From public common bean transcriptomic data, we identified 554 genes with an expression pattern similar to that of salt-responsive PvbZIP genes, and propose that the co-expressed genes are likely to be involved in the stress response. Our data provide a foundation for evaluating the individual roles of salt-responsive genes and to explore the PvbZIP-mediated improvement of salt tolerance in common bean.

1. Introduction

Legumes, which comprise one third of the world’s primary crop production for food and feed, are able to establish symbiosis with soil-nutrient scavenging mycorrhizal fungi and nitrogen-fixing soil bacteria (rhizobia), thus being important for sustainable agriculture. The effective interaction between legumes and rhizobia results in a novel plant organ, the root nodule. The differentiated bacteroids, established in the nodules, reduce atmospheric nitrogen to ammonia, which is in turn assimilated into organic nitrogen by the plant [1].
Salinity is a serious constraint to crop production since it affects around 30% of the arable land worldwide [2]. Legume crop production is adversely affected by salinity, especially under symbiotic N2-fixation (SNF) conditions where both rhizobial nodulation and nitrogen fixation are drastically diminished [3,4,5,6]. Salt-stress is complex since it includes both ion toxicity—excess toxic Na+ in the cytoplasm and a deficiency of essential ions such as K+—as well as an osmotic component that results in water deficit and causes physiological drought [7]. The role of transcription factors (TF) as global regulators of salt stress response and tolerance to salt stress has been documented in Arabidopsis and other plants. TF bind in the vicinity of their target genes and interact with other transcriptional regulators to recruit or block access of RNA polymerase to the DNA template, thus activating or repressing transcription.
According to their DNA-binding domains, plants TF are classified in different gene families that are conserved among different phyla. The basic leucine zipper (bZIP) TF family, among others, has been correlated with salt stress in different plants [8]. This large and diverse TF family has the characteristic or diagnostic bZIP domain (InterPro IPR004827; http://www.ebi.ac.uk/interpro/). The bZIP domain is 60–80 amino acids in length and includes two structural features: a basic region of approximately 16 amino acids with an invariant N-x7-R/K-x9 motif that is responsible for nuclear localization and DNA-binding to the G-box element 5′-CACGTG-3′, and a leucine zipper required for dimerization [9].
In Arabidopsis, the level of the plant hormone abscisic acid (ABA) increases with saline, drought and cold stresses leading to induction of gene expression through cis elements that include the ABRE (ABA-responsive element). The expression of Arabidopsis bZIP TF from group A is induced by ABA or stress; these bZIP are designated as ABF (ABRE binding factor) and AREB (ABA-responsive element binding protein) and are activated post-transcriptionally by phosphorylation. Active AREB or ABF induce the expression of ABRE-driven promoters of salt-responsive genes that allow the plant to cope with this stress [9,10]. The Arabidopsis AtbZIP1 TF is a positive regulator of plant tolerance to salt, osmotic and drought stresses. The AtbZIP1 knockout mutants showed reduced tolerance to these stresses, coinciding with the suppression of stress-responsive genes, whereas AtbZIP1 overexpression resulted in enhanced stress tolerance to salinity and drought [8].
Regarding legumes, Libault et al. [11] calculated that 5.7% of their genomes encode TF genes; these are distributed among ca. 60 gene families, including the bZIP family. Recently, Wang et al. [12] reported a genome-wide identification of the bZIP TF genes from six legumes whose genomes have been sequenced: soybean (Glycine max), common bean (Phaseolus vulgaris), chickpea (Cicer arientinum), pigeonpea (Cajanus cajan), Medicago truncatula, and Lotus japonicus. Their analysis identified 428 bZIP legume genes, with 33 to 138 bZIP genes in the different species. Several salt-responsive bZIP TF genes from soybean, common bean, and Medicago truncatula have been identified through transcriptomic analyses [12,13,14].
Common bean (Phaseolus vulgaris L.) is the most important crop legume for human consumption, accounting for 50% of the grain legumes consumed worldwide. In several African and Central/South American countries beans are staple crops serving as the main source of protein in the diet [15]. O’Rourke et al. [16] calculated that the P. vulgaris genome encodes 3726 TF genes classified into 52 families. In addition, very recently Bhawna et al. [17] reported the construction of a TF database for P. vulgaris (PvTFDB) that includes 2370 putative TF gene models in 49 TF families. These authors claim that the PvTFDB would expedite the functional genomic analysis of P. vulgaris TF that are key components of regulatory mechanisms involved in plant stress responses, allowing the use of this knowledge in common bean breeding programs [17]. Our group is interested in identifying common bean TF with relevant regulatory roles for the response to abiotic stresses and/or for the SNF rhizobia symbiosis. Thus, we have demonstrated the roles of PvPHR1, a TF from the MYB family that together with microRNA 399 acts in phosphorus-deficiency signaling, PvTIFY TF that responds to jasmonate and phosphorus stress, and AP2-1 TF, which is regulated by microRNA 172 in rhizobial nodulation [18,19,20]. In addition, a drought-responsive bZIP gene from tepary bean (P. acutifolius) and its P. vulgaris ortholog have been reported [21].
In this work we analyzed the P. vulgaris bZIP TF family (PvbZIP) composed of 78 members, validating the expression profile of different PvbZIP genes among various plant tissues. We investigated if PvbZIP TF participate in the common bean response to salt stress in P. vulgaris CC-25-9-N, a black-seeded cultivar, bred in Cuba by INIFAT (Instituto Nacional de Investigaciones Fundamentales en Agricultura Tropical, La Haban, Cuba) and widely used as a commercial variety in that country. The proximity of arable land to the sea occurring on islands is one of the major factors causing soil salinity and low crop production. This, plus the inadequate rainfall distribution and long periods of drought, have increased the saline areas of Cuba to around 20% [22]. We characterized the effect of salinity on CC-25-9-N plants grown in fertilized (full N-content) or SNF (Rhizobium tropici—inoculated) conditions; plants in the latter condition were more adversely affected by salinity. Our quantitative reverse-transcriptase-PCR (qRT-PCR) expression profile of PvbZIP genes led to the identification of 26 PvbZIP genes that respond to salinity in roots and/or nodules of CC-25-9-N plants. We analyzed previously reported transcriptomic data from common bean plants under salinity [14] and identified genes that co-express with salt-responsive PvbZIP genes. The coexpressed genes are likely to be involved in the common bean response to salinity based on their Gene Ontology (GO) assignment. Our data on salt responsive common bean genes may be used for further research aimed at improving salt-tolerance of this important agronomic legume.

2. Results

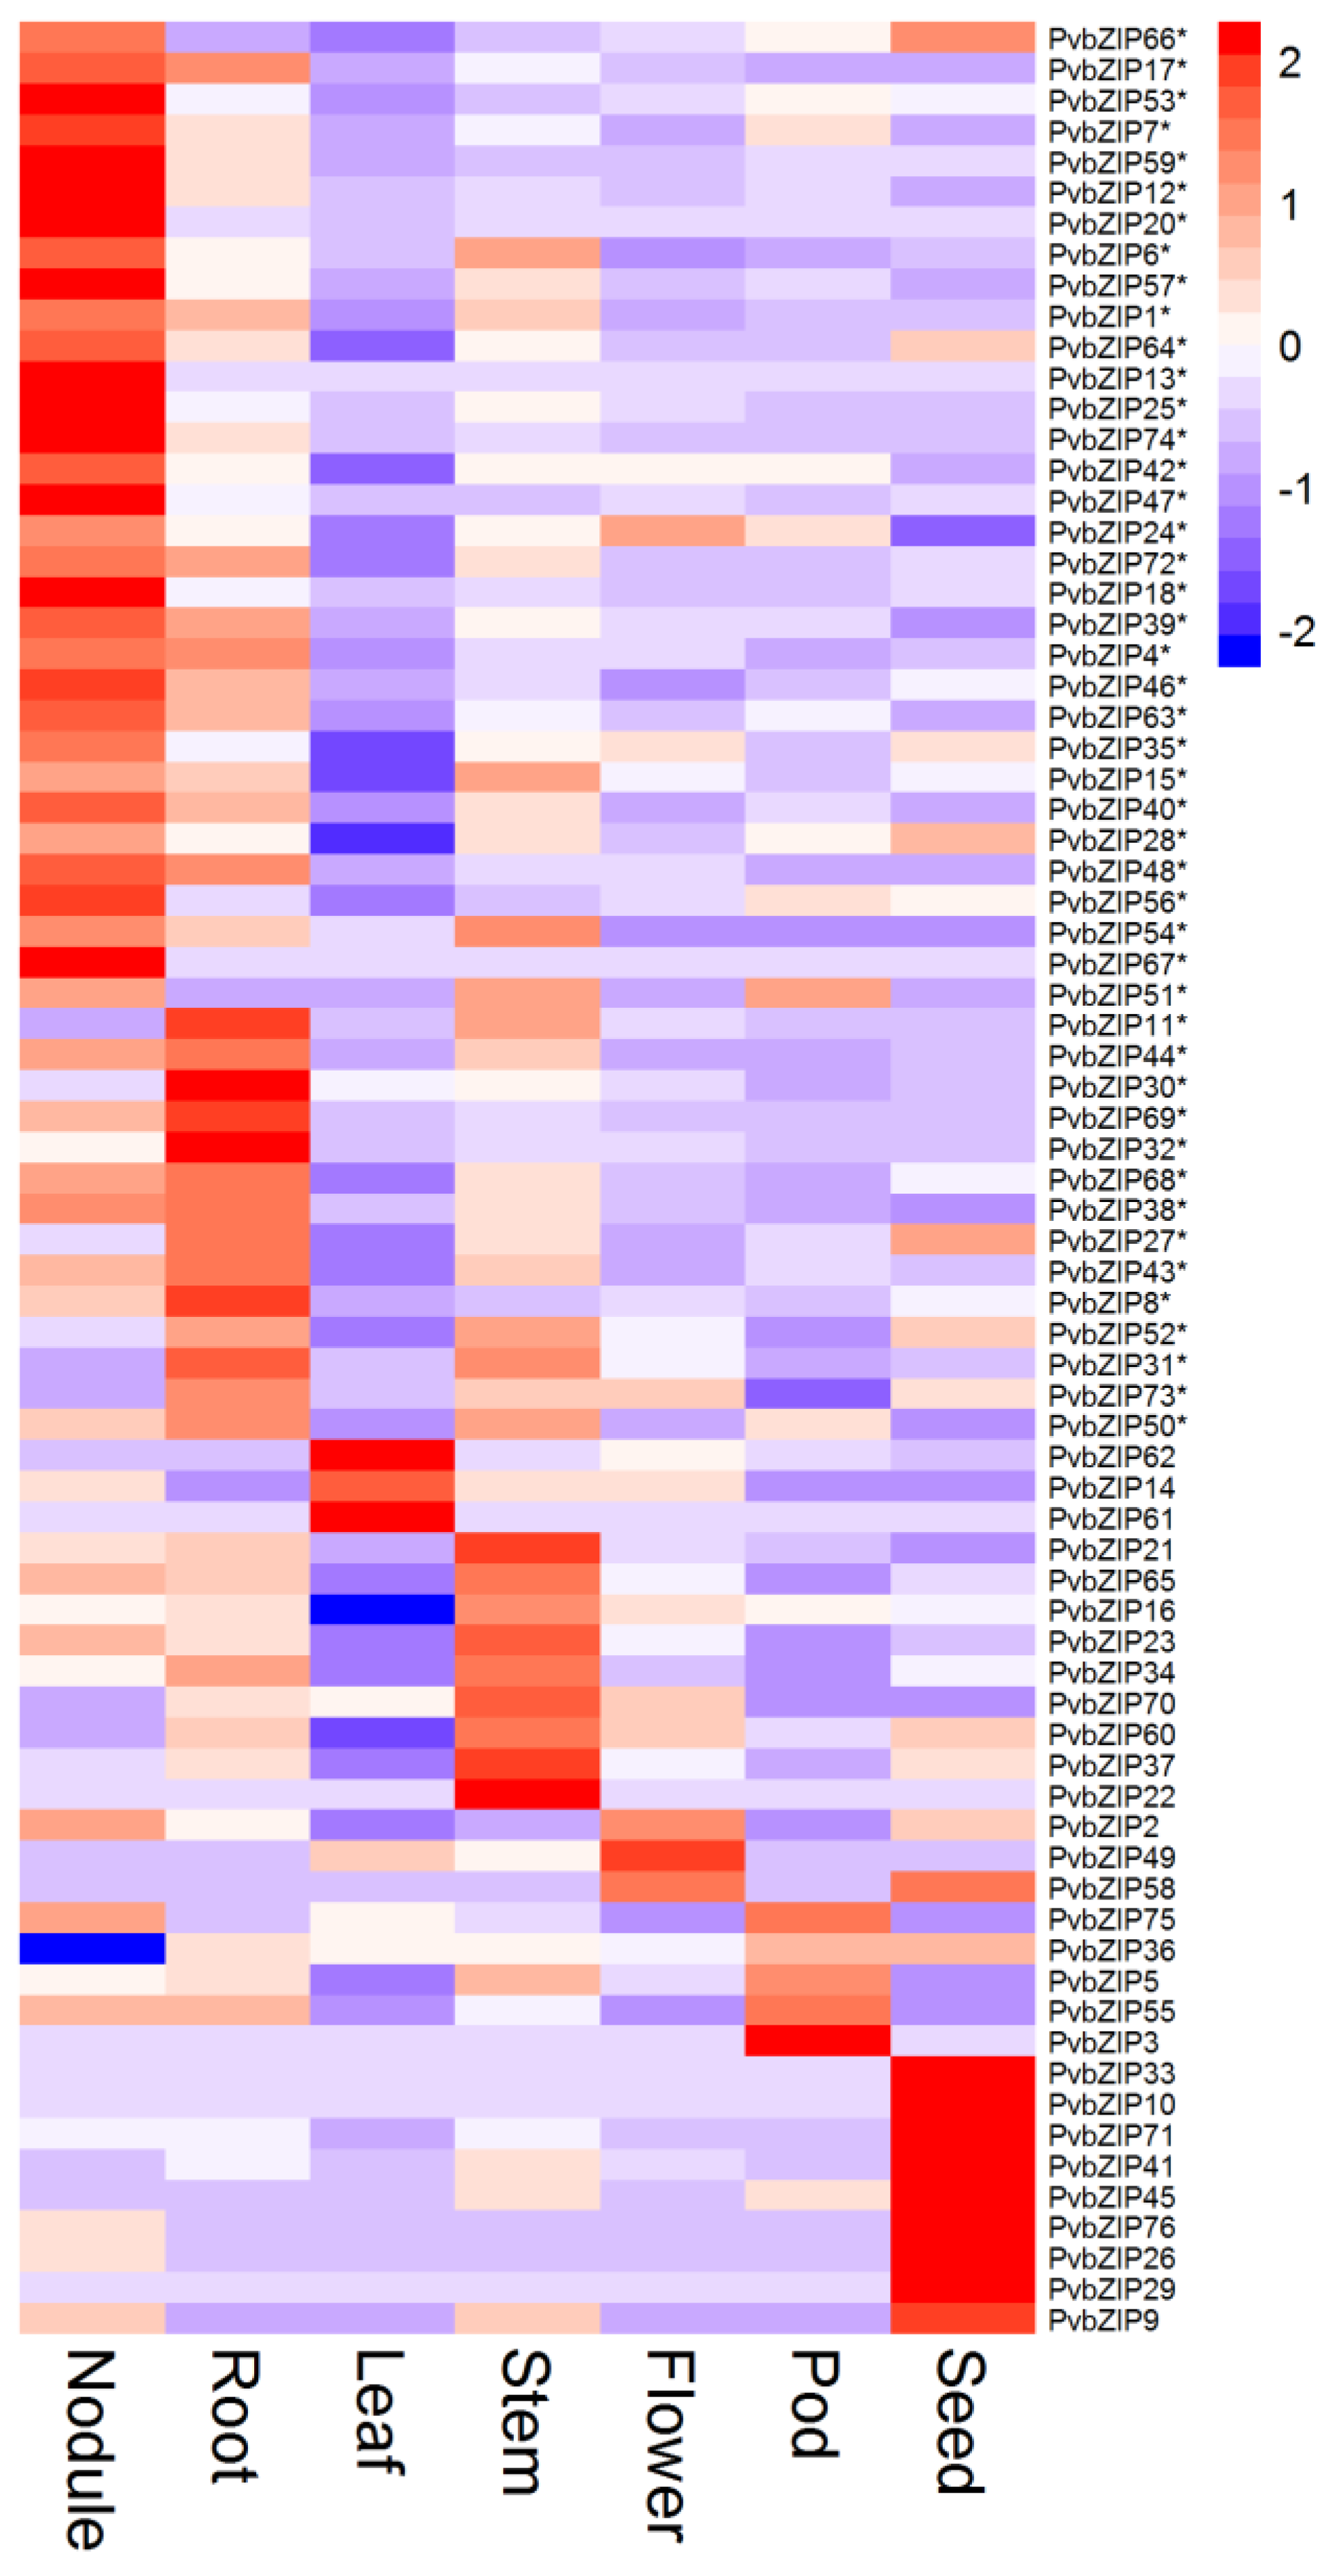
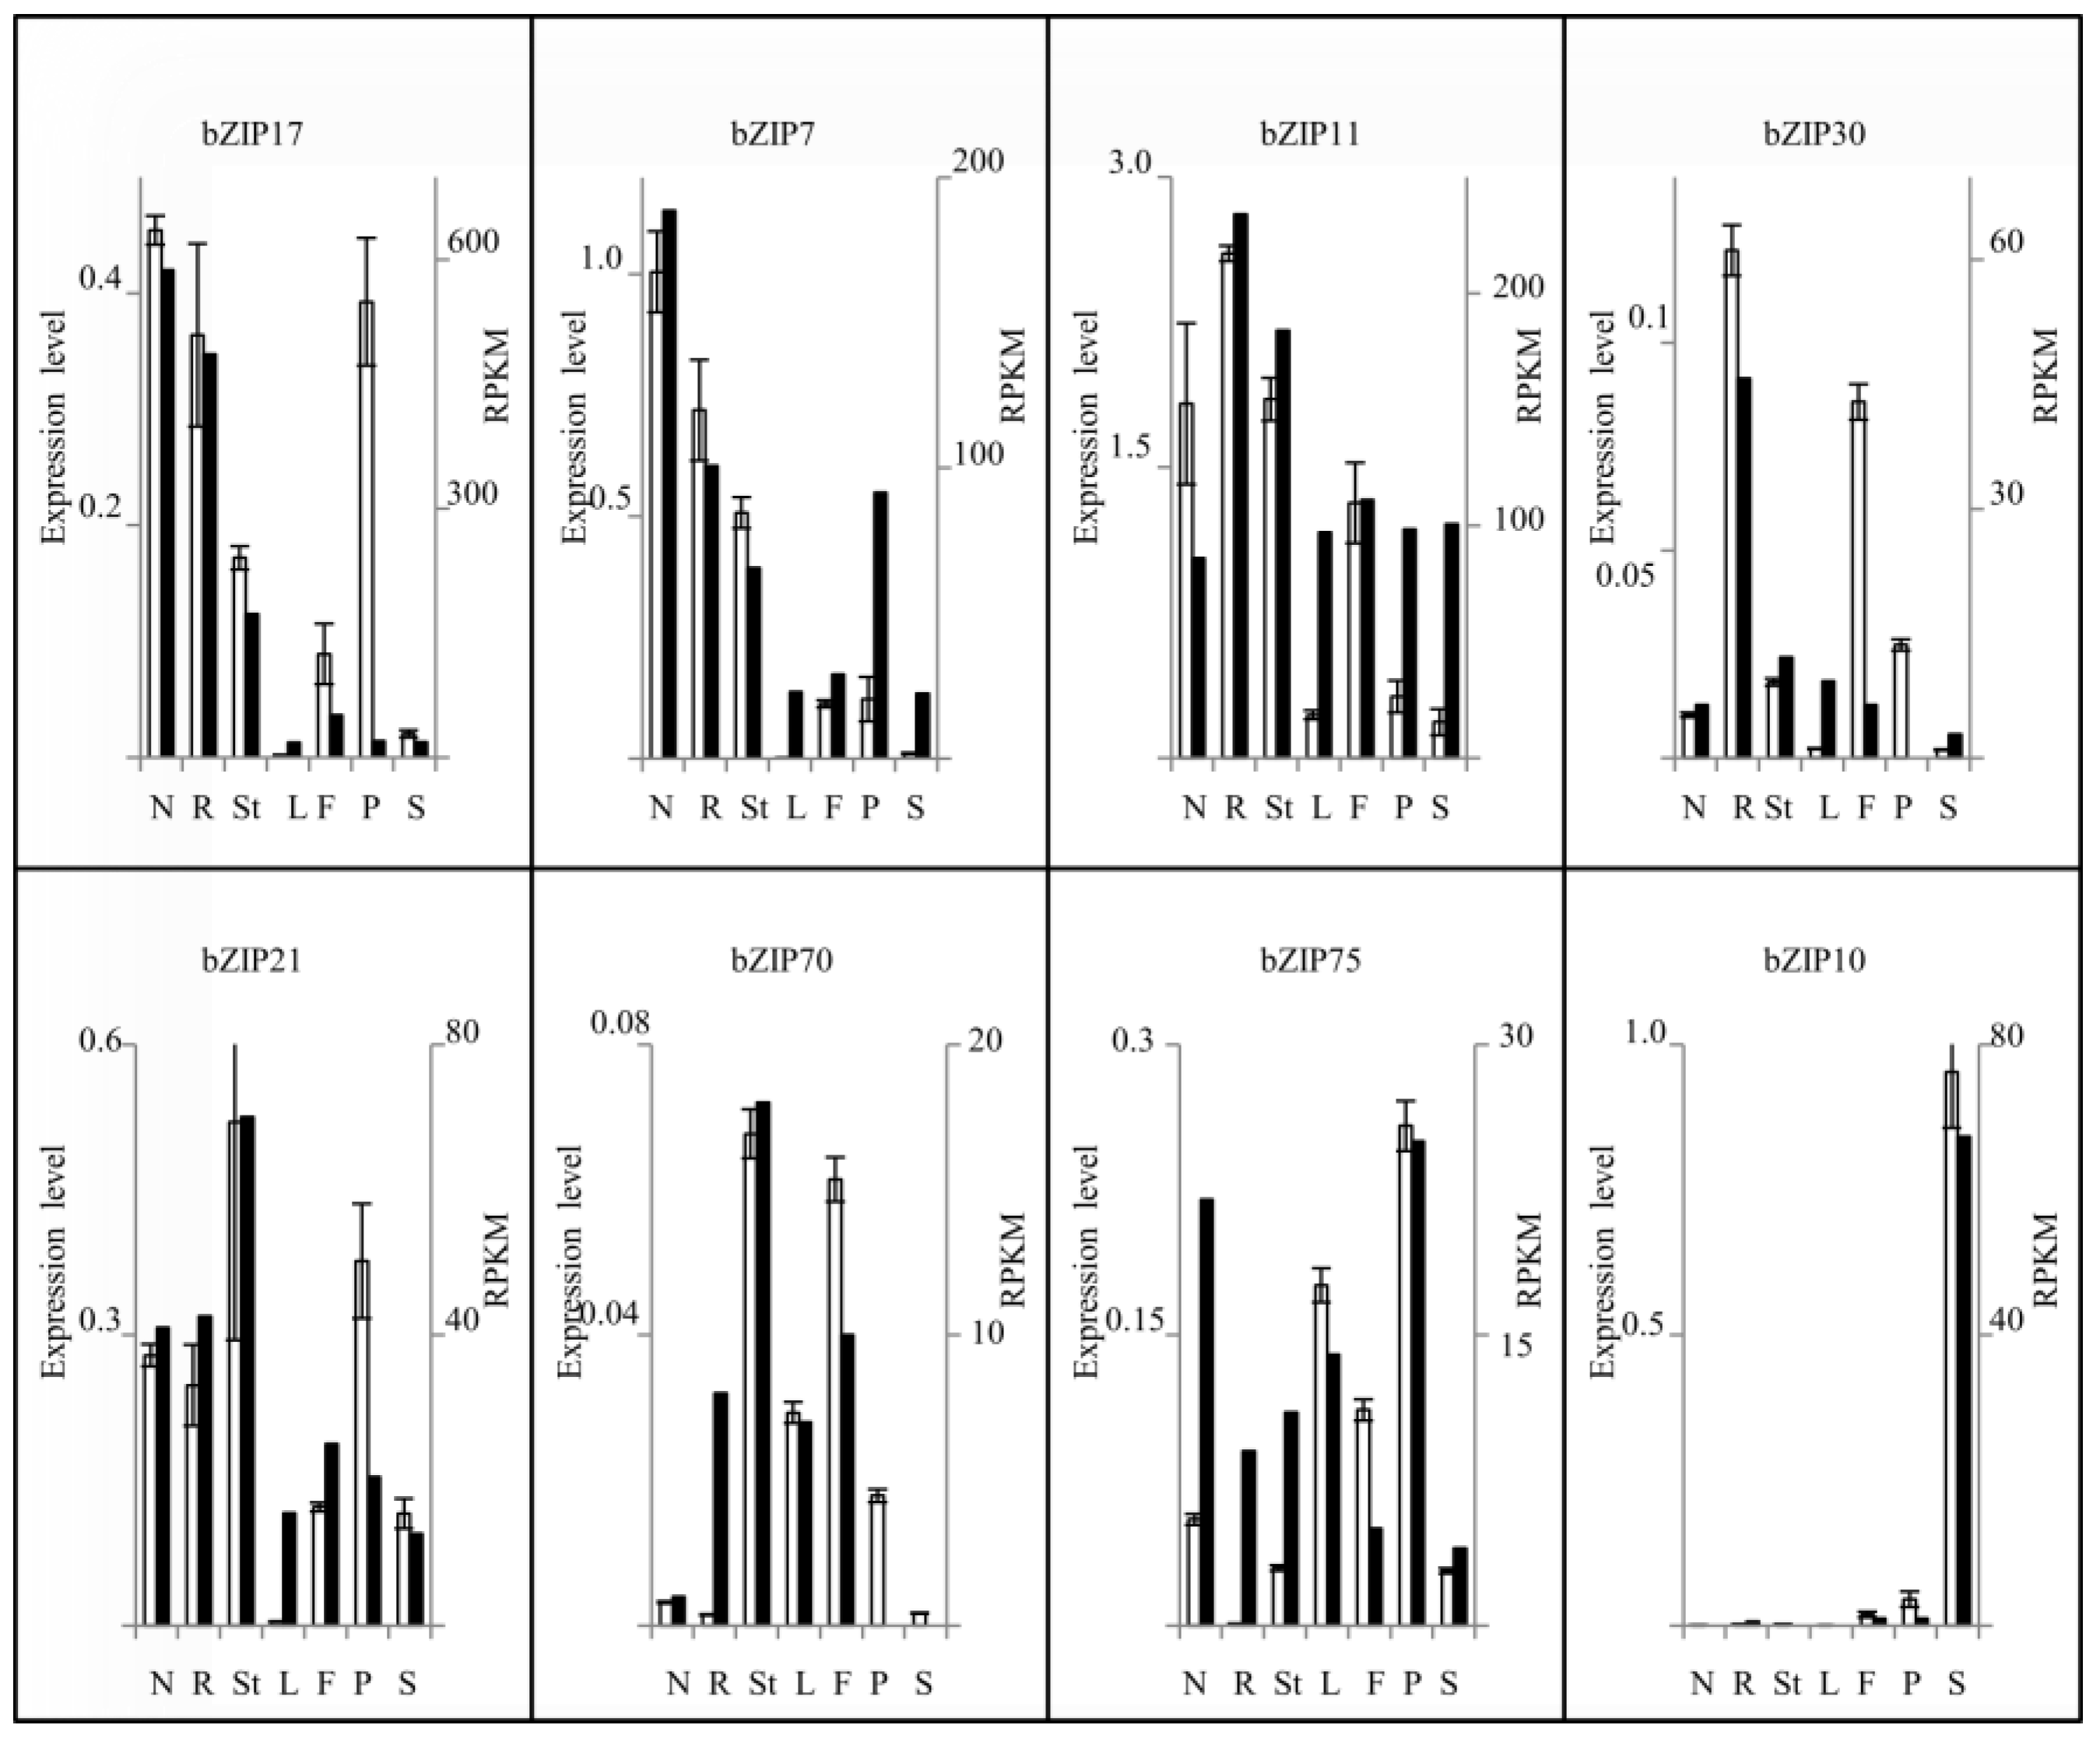
2.1. Expression Profile of P. vulgaris bZIP TF Genes in Different Plant Tissues

The set of 78 PvbZIP TF genes considered in this work are listed in Table S1. The P. vulgaris Gene Expression Atlas (Pv_GEA) [16] presents data about the expression profiles in different plant tissues of the different TF families, including the PvbZIP family. In Figure 1 we show the expression profile (heatmap as Z-scores) of the PvbZIP genes in nodule, root, leaf, stem, flower, pod, and seed tissues. The level of expression of the PvbZIP genes across different tissues according to Pv_GEA, is shown in Figure S1. Three (PvbZIP19, PvbZIP77, PvbZIP78) out of 78 PvbZIP genes were not included in Figure 1 and Figure S1 because they were not expressed in any plant tissue [16]. It is evident that the majority of PvbZIP family members (46) were more expressed in the underground tissues in comparison to the other tissues, 32 in nodules and 14 in roots. Stem and seed showed nine PvbZIP with highest expression in each tissue. Very few PvbZIP genes were highly expressed in leaf, flower and pod (3, 3, and 5, respectively).
We used qRT-PCR gene expression analysis to assess the reliability of the RNA-seq data regarding the expression profile of PvbZIP genes in different plant tissues. For this we selected PvbZIP genes that, according to Pv_GEA [16], showed highest expression in different plant tissues: two PvbZIP with highest expression in nodules (PvbZIP17 and PvbZIP7), two in root (PvbZIP11 and PvbZIP30), two in stem (PvbZIP21 and PvbZIP70), one in pod (PvbZIP75) and one in seed (PvbZIP10). For each selected PvbZIP gene, Figure 2 shows the expression level determined by qRT-PCR compared to data from RNA-seq analysis [16]. The qRT-PCR expression level of all the selected genes was highest in the same plant tissue reported in the Pv_GEA and the expression levels in other tissues showed good correspondence, as seen in Figure 2. However, there are some exceptions to the latter (i.e., PvbZIP17 in pods, PvbZIP30 in flowers and pods, PvbZIP70 in roots, PvbZIP75 in roots): the different expression levels could be attributable to different sensitivities of the two methods and/or natural variation of the plant tissues used for each approach, since these derived from experiments in different laboratories and dates. We conclude that our qRT-PCR expression analysis of selected PvbZIP genes validated the transcriptome data from the Pv_GEA.
Genes from the bZIP TF family participate in the signaling pathways for the plants’ response to salt stress [9,10]. In the next part of this work we present our analysis of PvbZIP response in common bean plants subjected to salinity. Roots are the primary targets for salt stress, which in legumes in symbiosis with rhizobia also includes root-derived nodules as the primary target. On this basis, we selected the group of 46 PvbZIP genes with root/nodule-enhanced expression, seen in Figure 1 and Figure S1, to analyze their expression profile in common bean plants under salt-stress, under both fertilized (full N-content) or SNF (Rhizobium-inoculated) conditions.

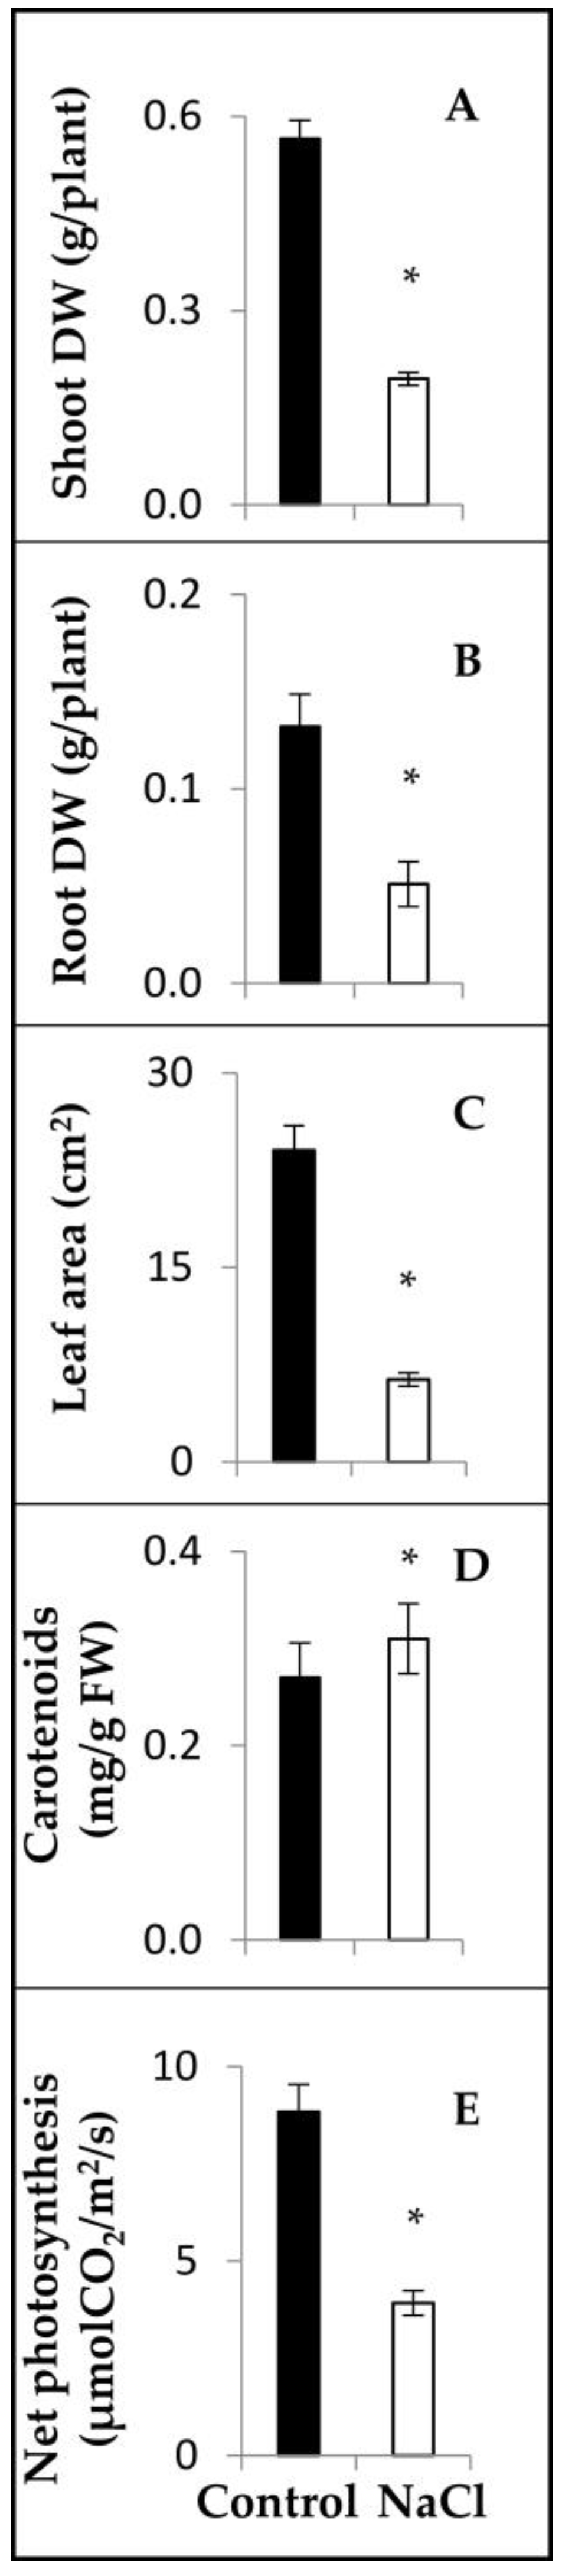
2.2. Salinity Response Profile of PvbZIP Genes from Fertilized Plants

For our analysis of common bean response to salt stress we focused on the CC-25-9-N cultivar, a commercial variety widely grown in Cuba, having in mind that the knowledge generated might be relevant for improving common bean production in this country, which has severe problems with saline soils. Soils are classified as saline when the ECe (electrical conductivity of the saturated paste) is 4 dS/m or more, which is equivalent to approximately 40 mM NaCl in saturated soil or hydroponic solution. This or higher values for ECe or NaCl concentration significantly reduces the yield of most crops [23]. For our study we used P. vulgaris CC-25-9-N plants grown in a hydroponic system with full-nutrient solution supplemented with 100 mM NaCl that was added at the beginning of the treatment. The NaCl concentration we used is within the range of that used in treatments to cause severe salt-stress in common bean [3,4,6]. We observed that the general appearance of CC-25-9-N plants was adversely affected by this treatment and the plants were harvested and analyzed after 7 days of growth, since they died soon after this period. We performed a comparative phenotypic analysis of plants growing under salinity vs. control condition (student’s t-test, p ≤ 0.03). Plant biomass was affected by salinity, as both the shoot and root dry weights decreased 66% and 61%, respectively, as seen in Figure 3A,B, compared to control plants. Salt-stressed plants showed a drastically reduced (74%) leaf area, as seen in Figure 3C. Photosynthetic pigments showed no significant change in chlorophyll a and b while the carotenoids content increased (14%) in plants under salinity with respect to control plants as shown in Figure 3D. In addition, as seen in Figure 3E, plants grown under salinity reduced their net photosynthesis 56% as compared to control plants.
Our data, shown in Figure 3, demonstrated the salt sensitivity of common bean cultivar CC-25-9-N, thus our next goal was to identify salt-responsive PvbZIP genes. We analyzed the expression of the group of 46 root/nodule-enhanced PvbZIP genes, as seen in Figure 1 and Figure S1, in roots from fertilized CC-25-9-N plants subjected to salinity vs. control treatments. Complete data set analysis is provided in Table S2. Table 1 shows 16 (35%) out of 46 differentially expressed PvbZIP genes (student’s t-tests followed by Bonferroni’s correction p ≤ 0.1), with NaCl/C expression ratio ≥1.5-fold. Eleven PvbZIP genes were up-regulated in salt-stressed roots from fertilized plants. PvbZIP13 showed the highest induction ratio (13-fold), as seen in Table 1, although its expression level in both treatments was low. In contrast, PvbZIP11, PvbZIP28, PvbZIP39, PvbZIP50 and PvbZIP66 showed the highest expression level, with induction ratios from 1.5 to 2.8, as shown in Table 1. Five PvbZIP genes were down-regulated by the salinity treatment. PvbZIP38 showed the highest down-regulation ratio (3-fold) followed by PvbZIP17 (2.8-fold), which also showed highest expression levels in both treatments, as seen in Table 1.

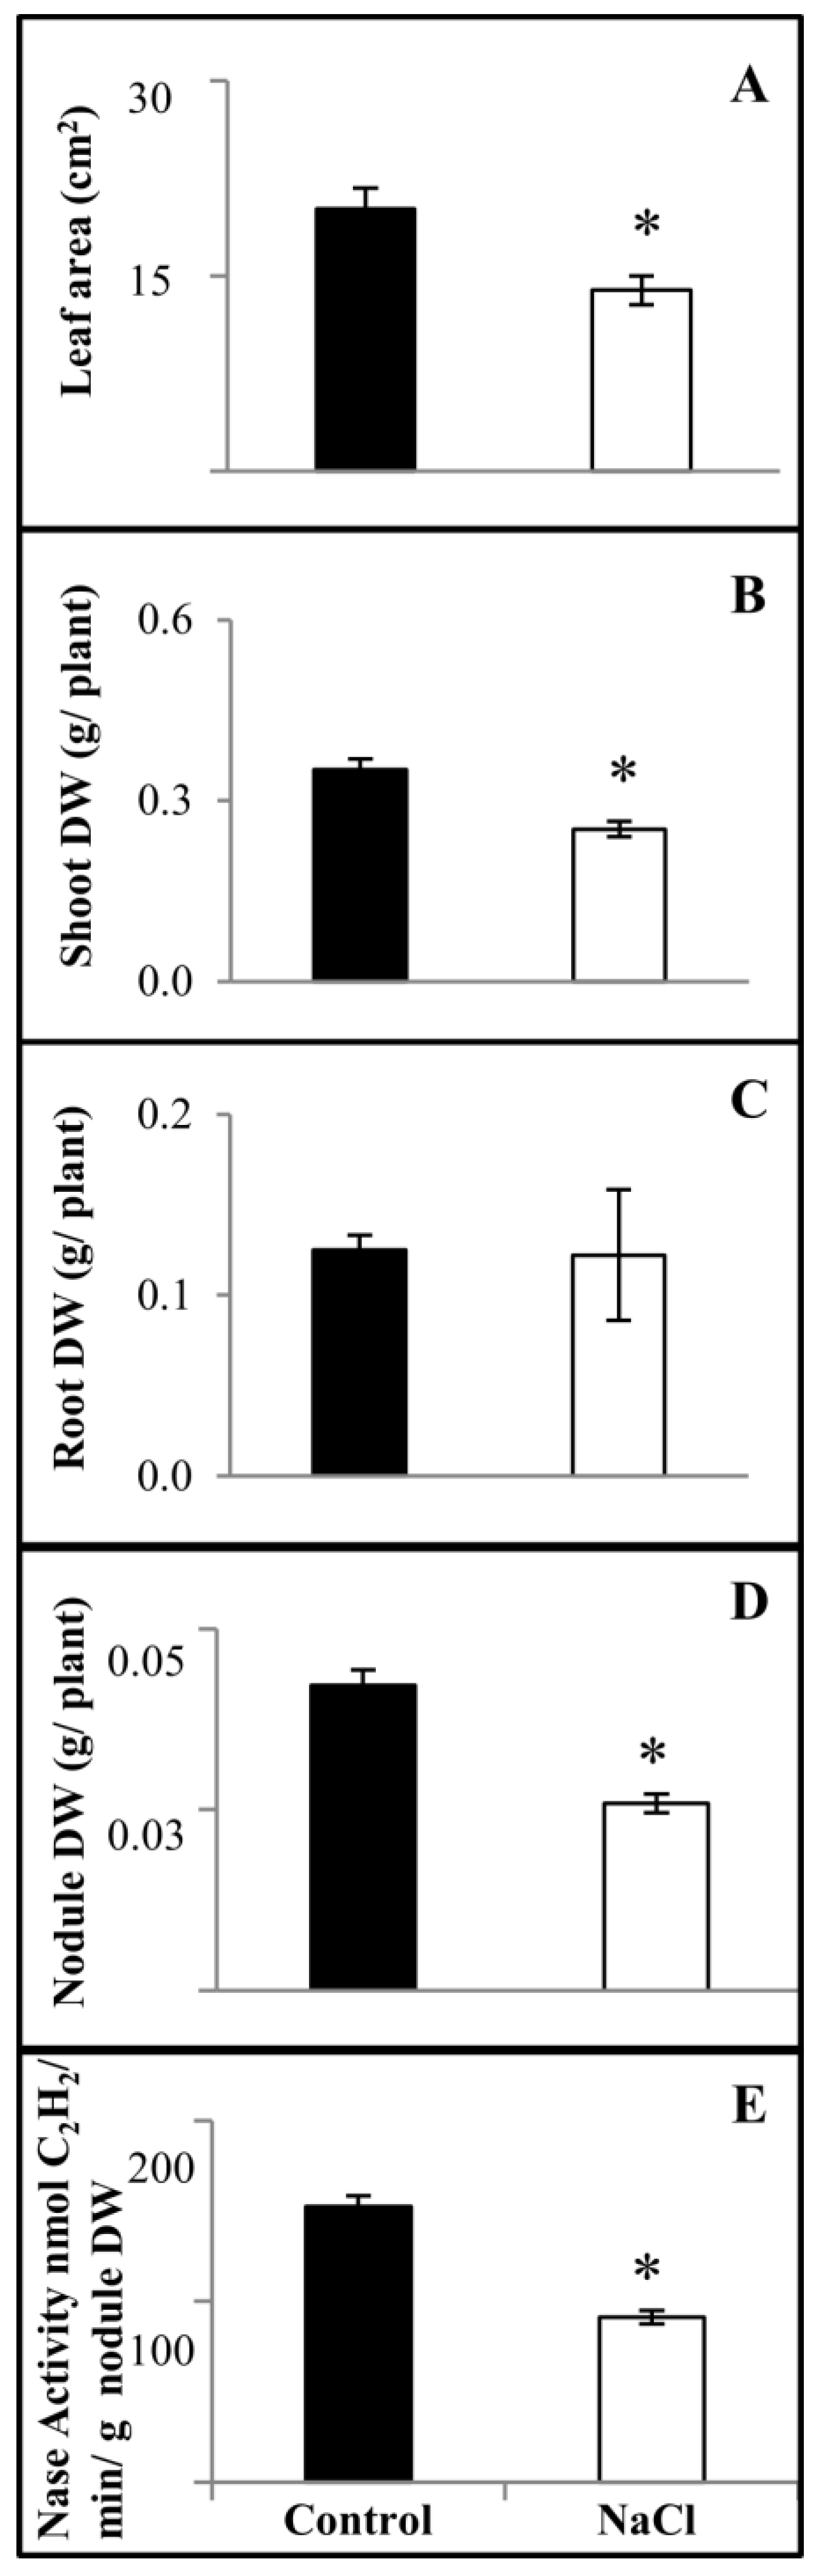
2.3. Salinity Response Profile of PvbZIP Genes from SNF Plants

The SNF is a characteristic feature of legume plants that is relevant for sustainable agriculture. Thus, in this work we analyzed the effect of salt on CC-25-9-N plants inoculated with R. tropici CIAT 899, an acid-tolerant strain [24], in a hydroponic system with N-free nutrient solution [25]. In initial trials with different NaCl content added to SNF common bean plants we observed that nodulation was drastically inhibited when 20 mM NaCl was added, causing very few small and inactive nodules to be formed, while higher NaCl concentrations totally prevented nodulation. Thus, we selected 15 mM NaCl for the salinity-treatment of rhizobia-inoculated common bean plants grown hydroponically. Figure 4 shows the phenotypes of these plants as compared to control plants (student’s t-test, p ≤ 0.01). The leaf area of salt-stressed SNF plants decreased 31%, as seen in Figure 4A. The shoot biomass of stressed plants decreased 28% compared to control plants, shown in Figure 4B,C, but no significant effect was observed in their root dry weight. The effect of salt on the common bean-rhizobia symbiosis was evident in terms of nodule biomass and nitrogenase specific activity, both of which decreased to about 40% of the values for control plants, as seen in Figure 4D,E.
We then performed the expression profile of PvbZIP genes on roots and nodules of salt-stressed SNF plants. Table 2 shows 18 (39%) differentially expressed PvZIP genes (student’s t-tests followed by Bonferroni’s correction p ≤ 0.1), with NaCl/C expression ratio ≥1.5-fold, in the underground tissues of SNF plants. In roots, 9 (20%) PvbZIP genes were up-regulated with expression ratios (NaCl vs. C) up to 2.7-fold and one gene was down-regulated. The PvbZIP6, PvbZIP8, PvbZIP28, PvbZIP53 and PvbZIP54 genes showed the highest up-regulation ratios, as seen in Table 2. PvbZIP6, PvbZIP53, and PvbZIP66 had the highest expression levels, which were even higher than those observed for PvbZIP genes in fertilized root, shown in Table 1 and Table 2. Only PvbZIP30 was down-regulated in salt-stressed SNF roots. The salinity response of PvbZIP genes in mature nodules included 1 up-regulated and 12 down-regulated genes. In general, as seen in Table 2, the PvbZIP gene expression levels were lower in nodules than in roots. PvbZIP50 showed the highest down-regulation ratio (13-fold) in salt-stressed nodules followed by PvbZIP8 and PvbZIP39 (ca. 5-fold), as shown in Table 2.

2.4. Exploring the Downstream PvbZIP Regulation in Salt-Stressed Plants

To our knowledge the only available transcriptomic data from common bean plants under salinity stress are those reported by Hiz et al. [14] for the Turkish salt-tolerant variety “Ispir”. A comparative analysis of the 26 root/nodule salt-responsive genes we identified for the CC-25-N-9 variety, shown in Table 1 and Table 2, and the differentially expressed genes for the Ispir variety [14] revealed PvbZIP38 and PvbZIP63 as differentially expressed in salt-stressed common bean plants from both varieties. We hypothesized that genes with an expression pattern similar to PvbZIP38 and PvbZIP63 are likely to be involved in the response to salinity, thus providing information on the possible mechanism of action of salt-responsive PvbZIP genes. To gain insight into the downstream regulation of PvbZIP TF in salinity, we analyzed transcriptome data [14] and identified 554 genes coexpressed with PvbZIP38 and PvbZIP63. From these, 327 genes were assigned to a Gene Ontology (GO) category. Table 3 shows 4 GO categories statistically over-represented for coexpressed genes, each category includes from 2 to 50 genes. Interestingly, most of these GO categories were assigned to molecular functions known to be relevant for the response to salinity in different plants [2,26], such as defense against oxidative and osmotic stresses (GO:0016491, GO:0004657) and transcriptional regulation/signal transduction (GO:0044212).

3. Discussion

Most of the world’s land surfaces endangered by salinity are in the tropics and Mediterranean regions [27]. In the Americas this characteristic is frequently observed in Caribbean Islands because of their proximity to the sea. Our analysis shows that the Cuban common bean cultivar CC-25-9-N is adversely affected by salinity, an environmental stress common on this and other Caribbean islands. Fertilized CC-25-9-N plants under salinity treatment showed decreased leaf area and net photosynthesis. Photosynthesis is among the primary processes affected by salinity or drought in several plant species. This effect may be due to factors such as a decrease in leaf expansion and the closure of stomata in response to leaf turgor decline, which reduces CO2 availability by limiting its diffusion. This in turn reduces Rubisco activity, or causes alterations in photosynthetic metabolism by inhibition of several enzymes by excess Na+ and limitation of K+ as cofactor [28]. A secondary effect related to photosynthetic decrease is the oxidative stress generated during salinity [29]. Carotenoids, bound to photosystems I and II in the chloroplast, protect against damaging effects of reactive oxygen species and are essential for chloroplast function [30]. The observed increase in the carotenoid content of salt-stressed common bean leaves could be part of the plant antioxidant defense system. The lack of sufficient photosynthate would result in overall plant growth decrease consistent with the decreased shoot and root biomass observed in plants under salinity treatment.
Despite extensive use of the CC-25-9-N cultivar in Cuban agriculture, to our knowledge its symbiotic capacity had not been evaluated. In this work we showed that CC-25-9-N common bean establishes an efficient symbiosis with the R. tropici CIAT 899, an acid-tolerant strain [24], and as expected, this symbiosis was drastically affected by salinity. In agreement with previous reports [5,31], common bean SNF plants were less tolerant to salinity than fertilized plants. The effects of salt-stress on the legume-rhizobia symbiosis may be due to factors such as failure of rhizobia to become established in the rhizosphere, reduced infection that results in lowered nodulation, and the negative effect of salt on nitrogenase enzymatic activity [5,30]. Consequently, shoot biomass and leaf area of inoculated salt-stressed plant were affected by the limitation of N2-fixation.
In this work we validated transcriptomic data from the Pv_GEA [16]. The majority of the PvbZIP genes (46) are highly expressed in underground tissues [16], the primary target of soil salinity. We identified 26 (57%) root/nodule-enhanced PvbZIP genes that respond to salinity in cultivar CC-25-9-N. Sixteen PvbZIP responded to salt only in one of the analyzed tissues (fertilized roots, SNF roots or nodules) whereas 10 PvbZIP responded in more than one tissue, being PvbZIP28, PvbZIP30 and the PvbZIP57 responding in the three tissues. It is possible that the PvbZIP genes also respond to salt-stress in other plant tissues (leaves, stem, flowers, and seeds) that were not included in our analysis.
Wang et al. [12] classified legume bZIP genes into different groups according to identified conserved motifs other than the bZIP. This classification evidenced that the PvbZIP salt-responsive genes identified in this work corresponded mainly to groups S, D, I and A, which included 2 to 5 salt-responsive PvbZIP genes each, something that is in agreement with the most abundant groups of drought- and salt-responsive MtbZIP [12]. Although very few of the additional motifs found in bZIP genes have an assigned function, it has been proposed that group-specific motifs could help determining specific roles of the members of each group [12]. For example, specific motifs identified for group-A Arabidopsis and legume bZIP genes represent potential casein kinase II phosphorylation sites [9,12]. Group-A Arabidopsis bZIP include ABI, ABF or AREB TF that are known to play important roles in ABA or stress signaling and are activated post-transcriptionally by phosphorylation [9].
In attempt to explore their regulatory roles we analyzed reported transcriptomic data [14] to identify genes that significantly coexpress with PvbZIP salt-responsive genes. A total of 554 coexpressed genes were identified and subjected to GO enrichment analysis. The most abundant GO category (molecular function) statistically over-represented for genes coexpressed with salt-responsive PvbZIP38 and PvbZIP63 was “oxidase activity” that included 50 genes. In addition, the “proline dehydrogenase activity” GO category included two genes. Salinity causes water deficit in plants as a result of osmotic effects and this leads to oxidative stress because of the formation of reactive oxygen species [26]. These two enriched GO categories would participate in alleviating osmotic and oxidative stress in common bean exposed to salinity. A common plant salinity-response to cope with osmotic stress and prevent water loss is the accumulation of different osmolytes such as sugars, sugar alcohols, glycine-betaine and proline [2], whose biosynthetic pathway includes the proline dehydrogenase enzyme. Coexpressed genes assigned to the “oxidase activity” category are annotated as enzymes/proteins with known important roles in the plant response to oxidative stress, such as peroxidase, alcohol dehydrogenase, glutaredoxin C-11, cinnamyl alcohol dehydrogenase, cytochrome P450, 2og-FeII oxygenase family proteins, beta-carotene 3-hydroxylase, and electron transport oxidoreductase. Eighteen coexpressed genes were assigned to the “transcription factor activity, sequence-specific DNA binding” GO molecular function, as well as other very similar molecular function categories such as “sequence-specific DNA-binding” (GO:0043565), “regulatory region binding” (GO:0000975), “transcriptional regulatory region DNA binding” (GO:0044212). This overrepresented GO included TF genes from the ERF (9 genes), HB (4 genes) and WRKY (2 genes). TF from these families are known to be involved in the response to salt and other abiotic stresses.
A search of TF binding sites (TFBS) in the 5′ promoter region of the PvbZIP coexpressed genes revealed those from NAC, LIM, PROM and ALFIN families, present in more than 80% of coexpressed genes. Interestingly, the overexpression of Alfin1 in transgenic alfalfa (Medicago sativa) resulted in the enhanced expression of a salt-inducible gene in roots and increased root growth under normal and saline conditions, thus increasing plant growth and salt tolerance [32]. Also TF from the NAC family are involved in responses to salinity in rice and tomato plants [33,34]. Arabidopsis seeds overexpressing the rice NAC gene ONAC063 showed enhanced tolerance to high-salinity and osmotic pressure [33]. Though TFBS for PvbZIP TF were not detected as over-represented in the coexpressed genes the binding of the TF to yet unknown DNA sequences cannot be excluded. An alternative interpretation of the latter is that salt-responsive PvbZIP exert indirect transcriptional regulation upon coexpressed genes in common bean.
Our data lead us to propose that PvbZIP genes are relevant regulators that act together with other TF (ERF, WRKY, HB, ALFIN, NAC) in signaling pathways for the control of gene expression that allow common bean plant cells to cope with the ionic, osmotic and oxidative stresses generated by salinity. Data presented in this work form a basis for further analysis to demonstrate specific roles of candidate PvbZIP TF in the response of common bean roots/nodules to salinity using reverse genetic approaches, such as those previously reported by our group [18,20]. Such studies may result in the PvbZIP-mediated improvement of common bean tolerance to salt-stress, a serious constraint for crop production of this important grain legume in Cuba and other countries suffering high soil salinity.

4. Materials and Methods

4.1. Selection of the P. vulgaris bZIP Genes

Our selection of the whole set of P. vulgaris bZIP genes to be analyzed in this work (PvbZIP) was based in those reported in the Pv_GEA [16], in the PvTFDB [17] and by Wang et al. [12]. We individually analyzed the protein sequences encoded by each of these genes for the presence and the integrity of the characteristic and highly conserved bZIP domain (IPR004827) using InterProScan (http://www.ebi.ac.uk/interpro/), confirming a set of 78 PvbZIP TF genes that were considered as the whole P. vulgaris gene set of this TF family. This set included every PvbZIP gene reported by Wang et al. [12], thus we adopted the nomenclature used in that publication. Our set includes six additional PvbZIP genes, which we designated with the corresponding consecutive numbers (PvbZIP73 to PvbZIP78). The complete list of PvbZIP genes considered in this work is provided in Table S1.

4.2. Plant Material and Growth Conditions

To validate RNA-seq expression data of PvbZIP genes through real-time quantitative reverse-transcriptase-PCR (qRT-PCR) analysis, the common bean cultivar, plant growth conditions and tissues collected were similar to those reported by O’Rourke et al. [16]. Seeds from the Mesoamerican cultivar Negro Jamapa 81 were surface-sterilized and germinated at 28 °C on sterile, moistened filter paper in darkness for 3 days. Germinated seedlings were sown in pots with vermiculite and inoculated with 1 mL of a saturated liquid culture of the acid-tolerant Rhizobium tropici CIAT 899 strain [24]. Pots were watered 3 days per week with N-free Summerfield plant nutrient solution [35]. Plants were grown under controlled environmental conditions (26–28 °C, 70% humidity, 16-h photoperiod) for 21 days post-inoculation (dpi) before harvesting nodule, root, stem, pod and seed tissues for gene expression analysis by qRT-PCR.
Characterization of the response to salinity was performed on common bean plants from the Cuban (Mesoamerican) black-seeded CC-25-9-N cultivar that is widely grown in this country, where salinity is a major constraint for crop production. CC-25-9-N seeds were supplied by the INIFAT, Cuba. Germinated CC-25-9-N seedlings were grown in a hydroponic system under controlled environmental conditions as previously described [25]. The hydroponic plastic trays contained 8 L of Franco/Munns nutrient solution [36] that was aerated with aquarium air pumps. The volume and pH (6.5) of the nutrient solution in the trays were controlled throughout the experiment. For fertilized conditions, full-nutrient solution [36] containing 5 mM NH4NO3 was used. Plants were harvested for analysis after 7 days of growth in control (full-nutrient) or in salt-stress condition where 100 mM NaCl was added to the nutrient solution at the start of plant growth. For SNF conditions germinated seedlings were inoculated with 20 mL of Rhizobium tropici CIAT 899 [24] saturated liquid culture for each tray. Inoculated plants were grown in N-free nutrient solution in control condition or in salt-stress condition where 15 mM NaCl was added at the time of inoculation. This NaCl concentration was selected based in the results of a phenotypic analysis of SNF plants subjected to a different NaCl concentration ranging from 5 to 50 mM as compared to control treatment. Plants were harvested for phenotypic analysis at 17 dpi. At harvesting time, root and nodule tissues were collected directly into liquid nitrogen and preserved at −80 °C until used for RNA isolation.
Both control and salinity (fertilized or SNF) treatments consisted of three independent plastic trays with 10–15 plants per tray. Three different sets of plants were considered for analysis. From the total plants in each treatment (30–45 plants) a different set of harvested plants were used for each phenotypic, biochemical or molecular analysis.

4.3. Phenotypic Analysis

Comparative phenotypic analysis of CC-25-9-N plants grown under salinity vs. control conditions was performed. From the total number of plants in each experiment, three plants were harvested for determinations of leaf area, tissue dry weight, net photosynthesis and pigment content.
For leaf area calculation, all the leaves from each plant were removed and scanned and the area of each was calculated using the Image J program [37]. The total leaf area per plant was obtained by adding the areas of all the leaves from each plant. For calculation of tissue dry weight, shoot, root or nodule samples were dried in an oven at 90 °C for three days and then weighed on an analytical balance.
Net photosynthesis was determined in fertilized plants grown for seven days under salinity or control conditions. Measurements were made on leaf samples (9 cm2) with 185 µmol photons/m2/s illumination and air water-saturated flow using an Infra-Red Gas Analyzer open system (Qubit Systems Inc. Kingston, ON, Canada).
Photosynthetic pigments were extracted with 80% (v/v) acetone from frozen leaf samples (~0.2 g) obtained from plants used for net photosynthesis determinations. Carotenoids and chlorophyll (a and b) were determined spectrophotometrically at 470 nm, 649 nm and 664 nm wavelengths, respectively, as reported [38]. The final concentration of pigments is expressed based on the leaf surface area.
Nitrogenase activity was determined in detached nodulated roots from 10 plants from each treatment using the acetylene reduction assay, essentially as described by Hardy et al. [39]. Specific activity is expressed as nmol ethylene/min/g nodule dry weight.
Student’s t test p ≤ 0.01 was used to analyze the difference in each parameter of salt-stressed plants as compared to control plants.

4.4. RNA Isolation and qRT-PCR

The qRT-PCR technology was used to analyze the expression profile of selected PvbZIP genes in different tissues from Negro Jamapa 81 plants and also the expression of root/nodule-enhanced PvbZIP in underground tissues of CC-25-9-N plants grown under salt stress vs. control condition.
Total RNA was isolated from frozen tissues: 100 mg nodules, 250 mg roots, or 200 mg other plant tissues from plants grown in control or salinity conditions using Trizol reagent (Life Technologies, Carlsbad, CA, USA) following the manufacturer’s instructions. Genomic DNA removal, cDNA synthesis, and quality verification for qRT-PCR were performed as reported [40].
Resulting cDNAs were then diluted and used to perform qRT-PCR assays using SYBR Green PCR Master Mix (Applied Biosystems, Foster city, CA, USA), following the manufacturer’s instructions. The sequences of specific oligonucleotide primers for each PvbZIP gene subjected to qRT-PCR expression analysis are provided in Table S1. Assays were run in 96-well plates using the 7300 Real-Time PCR System and 7300 System Software (Applied Biosystems, Foster city, CA, USA) with settings of: 50 °C for 2 min, 95 °C for 10 min, and 40 cycles of 95 °C for 15 s and 57 °C for 60 s. Three biological replicates were carried out for the determination of the transcript level of each PvbZIP gene; RNA was extracted from different sets of plants grown under the same treatment (control or salinity).
In each experiment of common bean plants under salinity vs. control condition, the expression of an ascorbate-peroxidase gene (Phvul.009G126500), a marker gene for oxidative stress occurring in salinity and other stresses [41], was determined by qRT-PCR. The increased expression of the marker gene as well as the affected phenotypic parameters indicated that stress was induced by the salt treatment.
Relative expression for each sample was calculated with the comparative Ct method. The Ct value obtained after each reaction was normalized with the Ct value of the UBC9 (Phvul.006G110100) gene for expression levels of transcripts. Statistical analysis of gene expression in samples from salinity vs. control treatments was performed using multiple paired student’s t-tests followed by Bonferroni’s correction (p ≤ 0.1) to assess differences between experimental conditions. The complete data set from qRT-PCR determinations of the 46 PvbZIP genes analyzed is provided in Table S2.

4.5. Analysis of Genes Co-Expressed with Salt-Responsive PvbZIP Genes

Hiz et al. [14], reported RNA-seq data from six libraries of the salt-tolerant “Ispir” common bean variety. The six samples were obtained from leaves and roots (2 replicates) of plants under salinity and control treatments. In this work the RNA-seq libraries from Hiz et al. [14], were mapped to the P. vulgaris genome sequence [42] using two different algorithms, gsnap [43], and TopHat [44]. Mapped reads from the two algorithms were used as input for Cufflinks [45], for gene expression profile. Genes differentially expressed between libraries were identified using NOIseq [46], with thresholds of >2-fold change in expression between libraries and a probability of differential expression >0.9. From such analysis we identified two PvbZIP genes (PvbZIP38: Phvul.006G101700 and PvbZIP63: Phvul.010G108800), out of 33, as being differentially expressed in salt vs. control tissues both in the “Ispir” and CC-25-N-9 varieties. We analyzed the set of differentially expressed genes obtained for the “Ispir” variety in salinity vs. control treatments [14], to identify those with an expression pattern similar to PvbZIP38 and PvbZIP63, designated coexpressed genes. Genes were identified as coexpressed if the Pearson correlation was greater than 0.8. Gene ontology (GO) enrichment was performed on the coexpressed genes.
The CLOVER program [47] was used to identify transcription factor binding sites (TFBS) in the 5′ promoter region of coexpressed genes. For this analysis 1500 bp sequences from the region upstream of the transcription start site of each gene was retrieved from the common bean genome sequence.

Supplementary Materials

The following are available online at https://www.mdpi.com/2077-0472/8/10/160/s1, Figure S1: Level of expression of the PvbZIP genes across different tissues, Table S1: Phaselus vulgaris bZIP genes and primer sequences used for qRT-PCR expression analysis, Table S2: Expression analysis (qRT-PCR) of PvbZIP genes in roots from fertilized plants and roots and nodules from SNF plants in salinity and control treatments.

Author Contributions

Conceptualization, G.H. and L.A.; Methodology: L.A., M.R., R.R. and E.O.; Investigation: L.A., M.R., L.P.Í., R.R., E.O. and G.H.; Formal Analysis: L.P.Í.; Writing-Original draft preparation: L.A. and G.H.; Writing—Reviewing & Editing: G.H. Supervision: G.H.; Funding acquisition: G.H. and M.R.

Funding

This work was supported in part by Dirección General de Asuntos del Personal Académico (DGAPA)—UNAM (grant No. PAPIIT IN200816). L.A. was initially supported by the United Nations University—Biotechnology for Latin America and the Caribbean program; now she is a doctoral student from Programa de Doctorado en Ciencias Biomédicas, Universidad Nacional Autónoma de México (UNAM) and receives the fellowship No. 582722 from CONACYT.

Acknowledgments

We are grateful to Alfonso Leija and Sara I. Fuentes for technical assistance, to Ricardo Cerda for his participation in the initial stages of the work, to Damien Formey and Remo Chiozzotto for advice in figure design and to Michael Dunn for critical review of the English language.

Conflicts of Interest

The authors declare no conflict of interest.

References

  1. Graham, P.H.; Vance, C.P. Legumes: Importance and constraints to greater use. Plant Physiol. 2003, 131, 872–877. [Google Scholar] [CrossRef] [PubMed]
  2. Mahajan, S.; Tuteja, N. Cold, salinity and drought stresses: An overview. Arch. Biochem. Biophys. 2005, 444, 139–158. [Google Scholar] [CrossRef] [PubMed]
  3. Wignarajah, K. Growth-Response of Phaseolus vulgaris to Varying Salinity Regimes. Environ. Exp. Bot. 1990, 30, 141–147. [Google Scholar] [CrossRef]
  4. Delgado, M.J.; Ligero, F.; Lluch, C. Effects of Salt Stress on Growth and Nitrogen-Fixation by Pea, Faba-Bean, Common Bean and Soybean Plants. Soil Biol. Biochem. 1994, 26, 371–376. [Google Scholar] [CrossRef]
  5. Cordovilla, M.P.; Ligero, F.; Lluch, C. Effect of salinity on growth, nodulation and nitrogen assimilation in nodules of faba bean (Vicia faba L.). Appl. Soil Ecol. 1999, 11, 1–7. [Google Scholar] [CrossRef]
  6. Gama, P.B.S.; Inanaga, S.; Tanaka, K.; Nakazawa, R. Physiological response of common bean (Phaseolus vulgaris L.) seedlings to salinity stress. Afr. J. Biotechnol. 2007, 6, 88. [Google Scholar]
  7. Huang, G.T.; Ma, S.L.; Bai, L.P.; Zhang, L.; Ma, H.; Jia, P.; Liu, J.; Zhong, M.; Guo, Z.F. Signal transduction during cold, salt, and drought stresses in plants. Mol. Biol. Rep. 2012, 39, 969–987. [Google Scholar] [CrossRef] [PubMed]
  8. Sun, X.; Li, Y.; Cai, H.; Bai, X.; Ji, W.; Ding, X.; Zhu, Y. The Arabidopsis AtbZIP1 transcription factor is a positive regulator of plant tolerance to salt, osmotic and drought stresses. J. Plant Res. 2012, 125, 429–438. [Google Scholar] [CrossRef] [PubMed]
  9. Jakoby, M.; Weisshaar, B.; Droge-Laser, W.; Vicente-Carbajosa, J.; Tiedemann, J.; Kroj, T.; Parcy, F.; bZIP Research Group. bZIP transcription factors in Arabidopsis. Trends Plant Sci. 2002, 7, 106–111. [Google Scholar] [CrossRef]
  10. Uno, Y.; Furihata, T.; Abe, H.; Yoshida, R.; Shinozaki, K.; Yamaguchi-Shinozaki, K. Arabidopsis basic leucine zipper transcription factors involved in an abscisic acid-dependent signal transduction pathway under drought and high-salinity conditions. Proc. Natl. Acad. Sci. USA 2000, 97, 11632–11637. [Google Scholar] [CrossRef] [PubMed] [Green Version]
  11. Libault, M.; Joshi, T.; Benedito, V.A.; Xu, D.; Udvardi, M.K.; Stacey, G. Legume transcription factor genes: What makes legumes so special? Plant Physiol. 2009, 151, 991–1001. [Google Scholar] [CrossRef] [PubMed]
  12. Wang, Z.; Cheng, K.; Wan, L.; Yan, L.; Jiang, H.; Liu, S.; Lei, Y.; Liao, B. Genome-wide analysis of the basic leucine zipper (bZIP) transcription factor gene family in six legume genomes. BMC Genom. 2015, 16, 1053. [Google Scholar] [CrossRef] [PubMed]
  13. Liao, Y.; Zou, H.F.; Wei, W.; Hao, Y.J.; Tian, A.G.; Huang, J.; Liu, Y.F.; Zhang, J.S.; Chen, S.Y. Soybean GmbZIP44, GmbZIP62 and GmbZIP78 genes function as negative regulator of ABA signaling and confer salt and freezing tolerance in transgenic Arabidopsis. Planta 2008, 228, 225–240. [Google Scholar] [CrossRef] [PubMed]
  14. Hiz, M.C.; Canher, B.; Niron, H.; Turet, M. Transcriptome analysis of salt tolerant common bean (Phaseolus vulgaris L.) under saline conditions. PLoS ONE 2014, 9, e92598. [Google Scholar] [CrossRef] [PubMed]
  15. Broughton, W.J.; Hernández, G.; Blair, M.; Beebe, S.; Gepts, P.; Vanderleyden, J. Beans (Phaseolus spp.)—Model food legumes. Plant Soil 2003, 252, 55–128. [Google Scholar] [CrossRef]
  16. O’Rourke, J.A.; Iniguez, L.P.; Fu, F.; Bucciarelli, B.; Miller, S.S.; Jackson, S.A.; McClean, P.E.; Li, J.; Dai, X.; Zhao, P.X.; et al. An RNA-Seq based gene expression atlas of the common bean. BMC Genom. 2014, 15, 866. [Google Scholar] [CrossRef] [PubMed]
  17. Bhawna, V.S.B.; Gajula, M.P. PvTFDB: A Phaseolus vulgaris transcription factors database for expediting functional genomics in legumes. Database 2016, 2016. [Google Scholar] [CrossRef] [PubMed]
  18. Valdes-Lopez, O.; Arenas-Huertero, C.; Ramirez, M.; Girard, L.; Sanchez, F.; Vance, C.P.; Luis Reyes, J.; Hernandez, G. Essential role of MYB transcription factor: PvPHR1 and microRNA: PvmiR399 in phosphorus-deficiency signalling in common bean roots. Plant Cell Environ. 2008, 31, 1834–1843. [Google Scholar] [CrossRef] [PubMed] [Green Version]
  19. Aparicio-Fabre, R.; Guillen, G.; Loredo, M.; Arellano, J.; Valdes-Lopez, O.; Ramirez, M.; Iniguez, L.P.; Panzeri, D.; Castiglioni, B.; Cremonesi, P.; et al. Common bean (Phaseolus vulgaris L.) PvTIFY orchestrates global changes in transcript profile response to jasmonate and phosphorus deficiency. BMC Plant Biol. 2013, 13, 26. [Google Scholar] [CrossRef] [PubMed]
  20. Nova-Franco, B.; Iniguez, L.P.; Valdes-Lopez, O.; Alvarado-Affantranger, X.; Leija, A.; Fuentes, S.I.; Ramirez, M.; Paul, S.; Reyes, J.L.; Girard, L.; et al. The micro-RNA72c-APETALA2-1 node as a key regulator of the common bean-Rhizobium etli nitrogen fixation symbiosis. Plant Physiol. 2015, 168, 273–291. [Google Scholar] [CrossRef] [PubMed]
  21. Rodriguez-Uribe, L.; O’Connell, M.A. A root-specific bZIP transcription factor is responsive to water deficit stress in tepary bean (Phaseolus acutifolius) and common bean (P. vulgaris). J. Exp. Bot. 2006, 57, 1391–1398. [Google Scholar] [CrossRef] [PubMed]
  22. González, M.C.; Pérez, N.; Cristo, E.; Rodríguez, M.; Borrás, O. Development of salinity-tolerant rice varieties using biotechnological and nuclear techniques. In Induced Plant Mutations in the Genomics Era; Shu, G.Y., Ed.; FAO (Food and Agriculture Organization of the United Nations): Rome, Italy, 2009; pp. 138–140. [Google Scholar]
  23. Munns, R.; Tester, M. Mechanisms of salinity tolerance. Annu. Rev. Plant Biol. 2008, 59, 651–681. [Google Scholar] [CrossRef] [PubMed]
  24. Graham, P.H.; Draeger, K.J.; Ferrey, M.L.; Conroy, M.J.; Hammer, B.E.; Martinez, E.; Aarons, S.R.; Quinto, C. Acid Ph Tolerance in Strains of Rhizobium and Bradyrhizobium, and Initial Studies on the Basis for Acid Tolerance of Rhizobium tropici Umr1899. Can. J. Microbiol. 1994, 40, 198–207. [Google Scholar] [CrossRef]
  25. Valdes-Lopez, O.; Yang, S.S.; Aparicio-Fabre, R.; Graham, P.H.; Reyes, J.L.; Vance, C.P.; Hernandez, G. MicroRNA expression profile in common bean (Phaseolus vulgaris) under nutrient deficiency stresses and manganese toxicity. New Phytol. 2010, 187, 805–818. [Google Scholar] [CrossRef] [PubMed]
  26. Parida, A.K.; Das, A.B. Salt tolerance and salinity effects on plants: A review. Ecotoxicol. Environ. Saf. 2005, 60, 324–349. [Google Scholar] [CrossRef] [PubMed]
  27. Shamseldin, A.; Werner, D. High salt and high pH tolerance of new isolated Rhizobium etli strains from Egyptian soils. Curr. Microbiol. 2005, 50, 11–16. [Google Scholar] [CrossRef] [PubMed]
  28. Munns, R.; James, R.A.; Lauchli, A. Approaches to increasing the salt tolerance of wheat and other cereals. J. Exp. Bot. 2006, 57, 1025–1043. [Google Scholar] [CrossRef] [PubMed] [Green Version]
  29. Chaves, M.M.; Flexas, J.; Pinheiro, C. Photosynthesis under drought and salt stress: Regulation mechanisms from whole plant to cell. Ann. Bot. 2009, 103, 551–560. [Google Scholar] [CrossRef] [PubMed]
  30. Farooq, M.; Wahid, A.; Kobayashi, N.; Fujita, D.; Basra, S.M.A. Plant Drought Stress: Effects, Mechanisms and Management. In Sustainable Agriculture; Lichtfouse, E., Navarrete, M., Debaeke, P., Véronique, S., Alberola, C., Eds.; Springer: Dordrecht, The Netherlands, 2009; pp. 153–188. [Google Scholar] [Green Version]
  31. Bouhmouch, I.; Souad-Mouhsine, B.; Brhada, F.; Aurag, J. Influence of host cultivars and Rhizobium species on the growth and symbiotic performance of Phaseolus vulgaris under salt stress. J. Plant Physiol. 2005, 162, 1103–1113. [Google Scholar] [CrossRef] [PubMed]
  32. Winicov, I. Alfin1 transcription factor overexpression enhances plant root growth under normal and saline conditions and improves salt tolerance in alfalfa. Planta 2000, 210, 416–422. [Google Scholar] [CrossRef] [PubMed]
  33. Yokotani, N.; Ichikawa, T.; Kondou, Y.; Matsui, M.; Hirochika, H.; Iwabuchi, M.; Oda, K. Tolerance to various environmental stresses conferred by the salt-responsive rice gene ONAC063 in transgenic Arabidopsis. Planta 2009, 229, 1065–1075. [Google Scholar] [CrossRef] [PubMed]
  34. Yang, R.; Deng, C.; Ouyang, B.; Ye, Z. Molecular analysis of two salt-responsive NAC-family genes and their expression analysis in tomato. Mol. Biol. Rep. 2011, 38, 857–863. [Google Scholar] [CrossRef] [PubMed]
  35. Summerfield, R.J.; Huxley, P.A.; Minchin, F.R. Plant Husbandry and Management-Techniques for Growing Grain Legumes under Simulated Tropical Conditions in Controlled Environments. Exp. Agric. 1977, 13, 81–92. [Google Scholar] [CrossRef]
  36. Franco, A.A.; Munns, D.N. Nodulation and growth of Phaseolus vulgaris in solution culture. Plant Soil 1982, 66, 149–160. [Google Scholar] [CrossRef]
  37. Abramoff, M.D.; Magalhães, P.J.; Ram, S.J. Image Processing with Image J. Biophoton. Int. 2004, 11, 42. [Google Scholar]
  38. Lichtenthaler, H.K. Chlorophylls and carotenoids: Pigments of photosynthetic biomembranes. In Methods in Enzymology; Academic Press: Cambridge, MA, USA, 1987; Volume 148, pp. 350–382. [Google Scholar]
  39. Hardy, R.W.; Holsten, R.D.; Jackson, E.K.; Burns, R.C. The acetylene-ethylene assay for n(2) fixation: Laboratory and field evaluation. Plant Physiol. 1968, 43, 1185–1207. [Google Scholar] [CrossRef] [PubMed]
  40. Hernandez, G.; Ramirez, M.; Valdes-Lopez, O.; Tesfaye, M.; Graham, M.A.; Czechowski, T.; Schlereth, A.; Wandrey, M.; Erban, A.; Cheung, F.; et al. Phosphorus stress in common bean: Root transcript and metabolic responses. Plant Physiol. 2007, 144, 752–767. [Google Scholar] [CrossRef] [PubMed]
  41. Ramirez, M.; Guillen, G.; Fuentes, S.I.; Iniguez, L.P.; Aparicio-Fabre, R.; Zamorano-Sanchez, D.; Encarnacion-Guevara, S.; Panzeri, D.; Castiglioni, B.; Cremonesi, P.; et al. Transcript profiling of common bean nodules subjected to oxidative stress. Physiol. Plant. 2013, 149, 389–407. [Google Scholar] [CrossRef] [PubMed]
  42. Schmutz, J.; McClean, P.E.; Mamidi, S.; Wu, G.A.; Cannon, S.B.; Grimwood, J.; Jenkins, J.; Shu, S.; Song, Q.; Chavarro, C.; et al. A reference genome for common bean and genome-wide analysis of dual domestications. Nat. Genet. 2014, 46, 707–713. [Google Scholar] [CrossRef] [PubMed] [Green Version]
  43. Wu, T.D.; Nacu, S. Fast and SNP-tolerant detection of complex variants and splicing in short reads. Bioinformatics 2010, 26, 873–881. [Google Scholar] [CrossRef] [PubMed] [Green Version]
  44. Kim, D.; Pertea, G.; Trapnell, C.; Pimentel, H.; Kelley, R.; Salzberg, S.L. TopHat2: Accurate alignment of transcriptomes in the presence of insertions, deletions and gene fusions. Genome Biol. 2013, 14, R36. [Google Scholar] [CrossRef] [PubMed] [Green Version]
  45. Trapnell, C.; Williams, B.A.; Pertea, G.; Mortazavi, A.; Kwan, G.; van Baren, M.J.; Salzberg, S.L.; Wold, B.J.; Pachter, L. Transcript assembly and quantification by RNA-Seq reveals unannotated transcripts and isoform switching during cell differentiation. Nat. Biotechnol. 2010, 28, 511–515. [Google Scholar] [CrossRef] [PubMed] [Green Version]
  46. Tarazona, S.; Furio-Tari, P.; Turra, D.; Pietro, A.D.; Nueda, M.J.; Ferrer, A.; Conesa, A. Data quality aware analysis of differential expression in RNA-seq with NOISeq R/Bioc package. Nucleic Acids Res. 2015, 43, e140. [Google Scholar] [CrossRef] [PubMed]
  47. Frith, M.C.; Fu, Y.; Yu, L.; Chen, J.F.; Hansen, U.; Weng, Z. Detection of functional DNA motifs via statistical over-representation. Nucleic Acids Res. 2004, 32, 1372–1381. [Google Scholar] [CrossRef] [PubMed] [Green Version]
Figure 1. Heatmap of the of P. vulgaris bZIP TF genes that are expressed in different plant tissues. Gene IDs are from www.phytozome.net/commonbean.php. Genes with highest expression in nodule or root are indicated with asterisks. Expression values were extracted from Pv_GEA. Expression patterns (as Z-scores) are indicated in a color scale where red indicates high expression and blue indicates low expression.
Agriculture 08 00160 g001
Figure 2. Expression level comparisons of quantitative reverse-transcriptase-PCR (qRT-PCR) and RNA-seq results for selected PvbZIP genes. For qRT-PCR expression analysis tissues were obtained from common bean plants (cultivar Negro Jamapa 81) grown under conditions like those used for transcriptomic analysis [16]. N: Nodule; R: Root; St: Stem; L: Leaf; F: Flower; P: Pod; S: Seed. White bars refer to relative expression level determined by qRT-PCR, based on cycle threshold (Ct) value normalized with the expression of the housekeeping UBC9 gene. Values represent the average ± SD from three biological replicates. Black bars refer to reads/Kb/Million (RPKM) values from the RNA-seq analysis available at the Pv_GEA (http://plantgrn.noble.org/pvGEA/).
Agriculture 08 00160 g002
Figure 3. Effect of salinity on fertilized common bean plants. Plants of cultivar CC-25-9-N were grown under control condition (black bars) or salinity treatment (100 mM NaCl, white bars). Shoot (A) and root (B) dry weight, leaf area (C), carotenoids content (D) and net photosynthesis (E) were determined after 7 days of growth. Values represent the average ± SD from three biological replicates from different plant sets. Asterisks indicate significantly different means between plants grown under salinity vs. control treatments (Student’s t-test, p ≤ 0.03).
Agriculture 08 00160 g003
Figure 4. Effect of salinity on SNF common bean plants. Cultivar CC-25-9-N plants were inoculated with Rhizobium tropici CIAT899 and were grown under control (black bars) or saline (15 mM NaCl, white bars) conditions. Leaf area (A), shoot (B), root (C) and nodule (D) dry weight and nitrogenase specific activity (acetylene reduction assay) (E) were determined at 15 dpi. Values represent the average ± SD from three (AC) or ten (D,E) biological replicates from different plant sets. Asterisks indicate significantly different means between plants grown under salinity vs. control treatments (Student’s t-test, p ≤ 0.01).
Agriculture 08 00160 g004
Table 1. P. vulgaris bZIP (PvbZIP) genes significantly differentially expressed (≥1.5-fold) in roots of NaCl-stressed fertilized plants identified by real-time RT-PCR.
Normalized Expression Level aExpression Ratio b
Gene IDNaClControlNaCl/C
Up-regulated
PvbZIP114.1 ± 0.022.8 ± 0.311.5
PvbZIP131 × 10−1 ± 0.011 × 10⁻² ± 0.0013.0
PvbZIP202 × 10−1 ± 0.011 × 10⁻¹ ± 0.012.7
PvbZIP281.1 ± 0.040.4 ± 0.052.8
PvbZIP392.2 ± 0.171.4 ± 0.041.6
PvbZIP501.1 ± 0.084 × 10⁻² ± 0.012.7
PvbZIP512 × 10−2 ± 0.001 × 10⁻² ± 0.002.0
PvbZIP570.3 ± 0.010.2 ± 0.011.7
PvbZIP630.2 ± 0.020.1 ± 0.002.5
PvbZIP662.1 ± 0.041.2 ± 0.021.7
PvbZIP740.1 ± 0.010.1 ± 0.011.9
Down-regulated
PvbZIP170.5 ± 0.031.3 ± 0.08−2.8
PvbZIP300.2 ± 0.040.5 ± 0.01−2.3
PvbZIP320.4 ± 0.020.6 ± 0.02−1.8
PvbZIP380.2 ± 0.010.5 ± 0.04−3.0
PvbZIP440.6 ± 0.071.1 ± 0.02−1.7
a Genes expression levels were determined by qRT-PCR, the average from three biological replicates ± SD is shown. Data were analyzed by student’s t-tests followed by Bonferroni’s correction p ≤ 0.1. b For ratios lower than 1 (down-regulated in salinity) the inverse of the ratio was estimated and the sign was changed.
Table 2. bZIP genes significantly differentially expressed (≥1.5-fold) in roots or nodules of NaCl-stressed symbiotic N2-fixation (SNF) plants identified by real-time RT-PCR.
ROOTSNODULES
Normalized Expression Level aExpression Ratio b Normalized Expression Level aExpression Ratio b
Gene IDNaClControlNaCl/CGene IDNaClControlNaCl/C
Up-regulatedUp-regulated
PvbZIP68.4 ± 0.313.8 ± 0.202.2PvbZIP303 × 10−1 ± 0.021 × 10⁻¹ ± 0.022.3
PvbZIP81 × 10−1 ± 0.002 × 10⁻² ± 0.002.7Down-regulated
PvbZIP242.6 ± 0.221.3 ± 0.161.9PvbZIP82 × 10−3 ± 0.001 × 10⁻² ± 0.00−4.9
PvbZIP281 × 10−1 ± 0.014 × 10⁻² ± 0.002.0PvbZIP283 × 10−3 ± 0.001 × 10⁻² ± 0.00−2.5
PvbZIP522.2 ± 0.061.4 ± 0.181.6PvbZIP321 × 10−1 ± 0.011 × 10⁻¹ ± 0.01−1.7
PvbZIP5335.8 ± 4.8614.0 ± 0.912.6PvbZIP391 × 10−1 ± 0.024 × 10⁻¹ ± 0.02−4.8
PvbZIP544 × 10−2 ± 0.002 × 10⁻² ± 0.002.2PvbZIP421 × 10−1 ± 0.011 × 10⁻¹ ± 0.01−1.5
PvbZIP573.8 ± 0.102.1 ± 0.261.8PvbZIP501 × 10−3 ± 0.001 × 10⁻¹ ± 0.02−13.2
PvbZIP6615.4 ± 2.509.0 ± 0.321.7PvbZIP531.8 ± 0.013.5 ± 0.01−1.9
Down-regulatedPvbZIP563 × 10−1 ± 0.026 × 10⁻¹ ± 0.03−1.9
PvbZIP302.7 ± 0.064.9 ± 0.30−1.8PvbZIP571 × 10−2 ± 0.001 × 10⁻² ± 0.00−1.9
PvbZIP633 × 10−1 ± 0.035 × 10⁻¹ ± 0.01−2.1
PvbZIP681 × 10−3 ± 0.004 × 10⁻³ ± 0.00−3.8
PvbZIP692 × 10−1 ± 0.023 × 10⁻¹ ± 0.00−1.9
a Genes expression levels were determined by qRT-PCR, the average from three biological replicates (± SD) is shown. Data were analyzed by student’s t-tests followed by Bonferroni’s correction p ≤ 0.1. b For ratios lower than 1 (down-regulated in salinity) the inverse of the ratio was estimated and the sign was changed.
Table 3. Gene ontology (GO) categories statistically over-represented for genes coexpressed with salt-responsive PvbZIP38 and PvbZIP63.
GO IdentifierDescription (Molecular Function)pNumber of Genes
GO:0016491oxidoreductase activity0.00150
GO:0003700transcription factor activity, sequence-specific DNA binding0.00718
GO:0015116sulfate transmembrane transporter activity0.0033
GO:0004657proline dehydrogenase activity0.0012

