Using Optical Sensors to Identify Water Deprivation, Nitrogen Shortage, Weed Presence and Fungal Infection in Wheat
Abstract
:1. Introduction
2. Experimental Section
2.1. Experimental Design
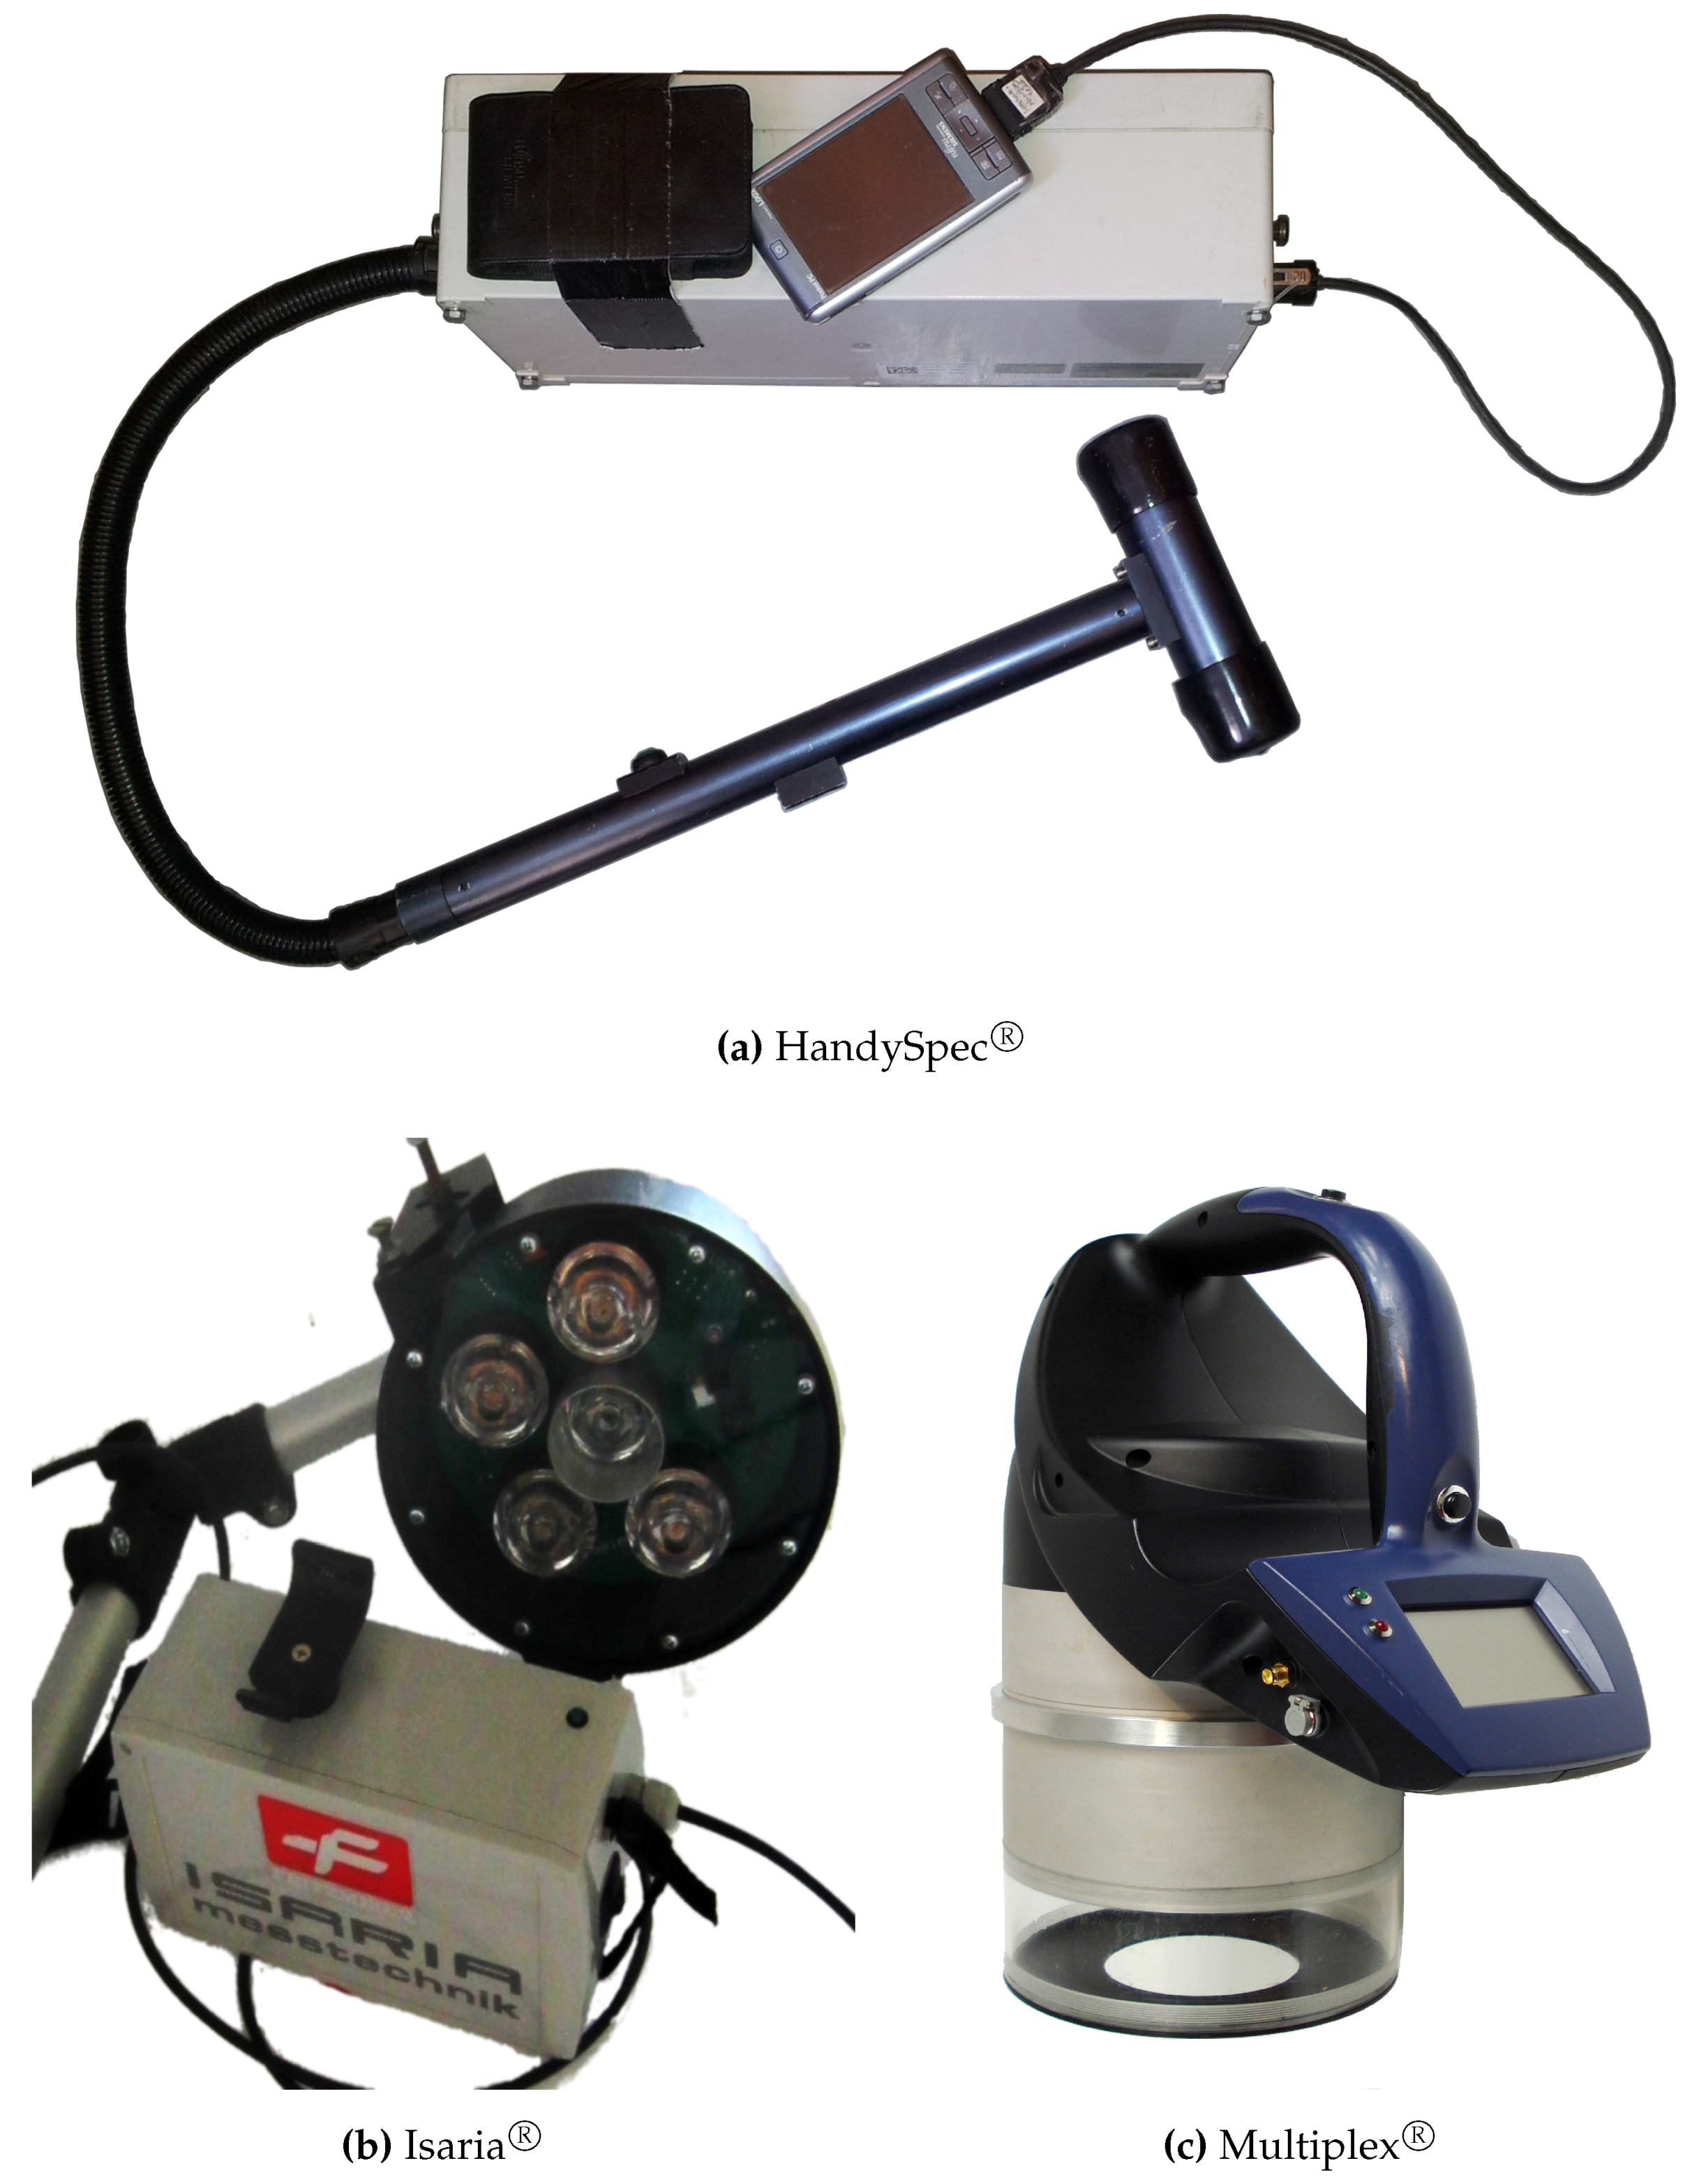
2.2. Sensors
2.2.1. HandySpec
2.2.2. Isaria
2.2.3. Multiplex
2.3. Data Processing and Statistical Analyses
3. Results
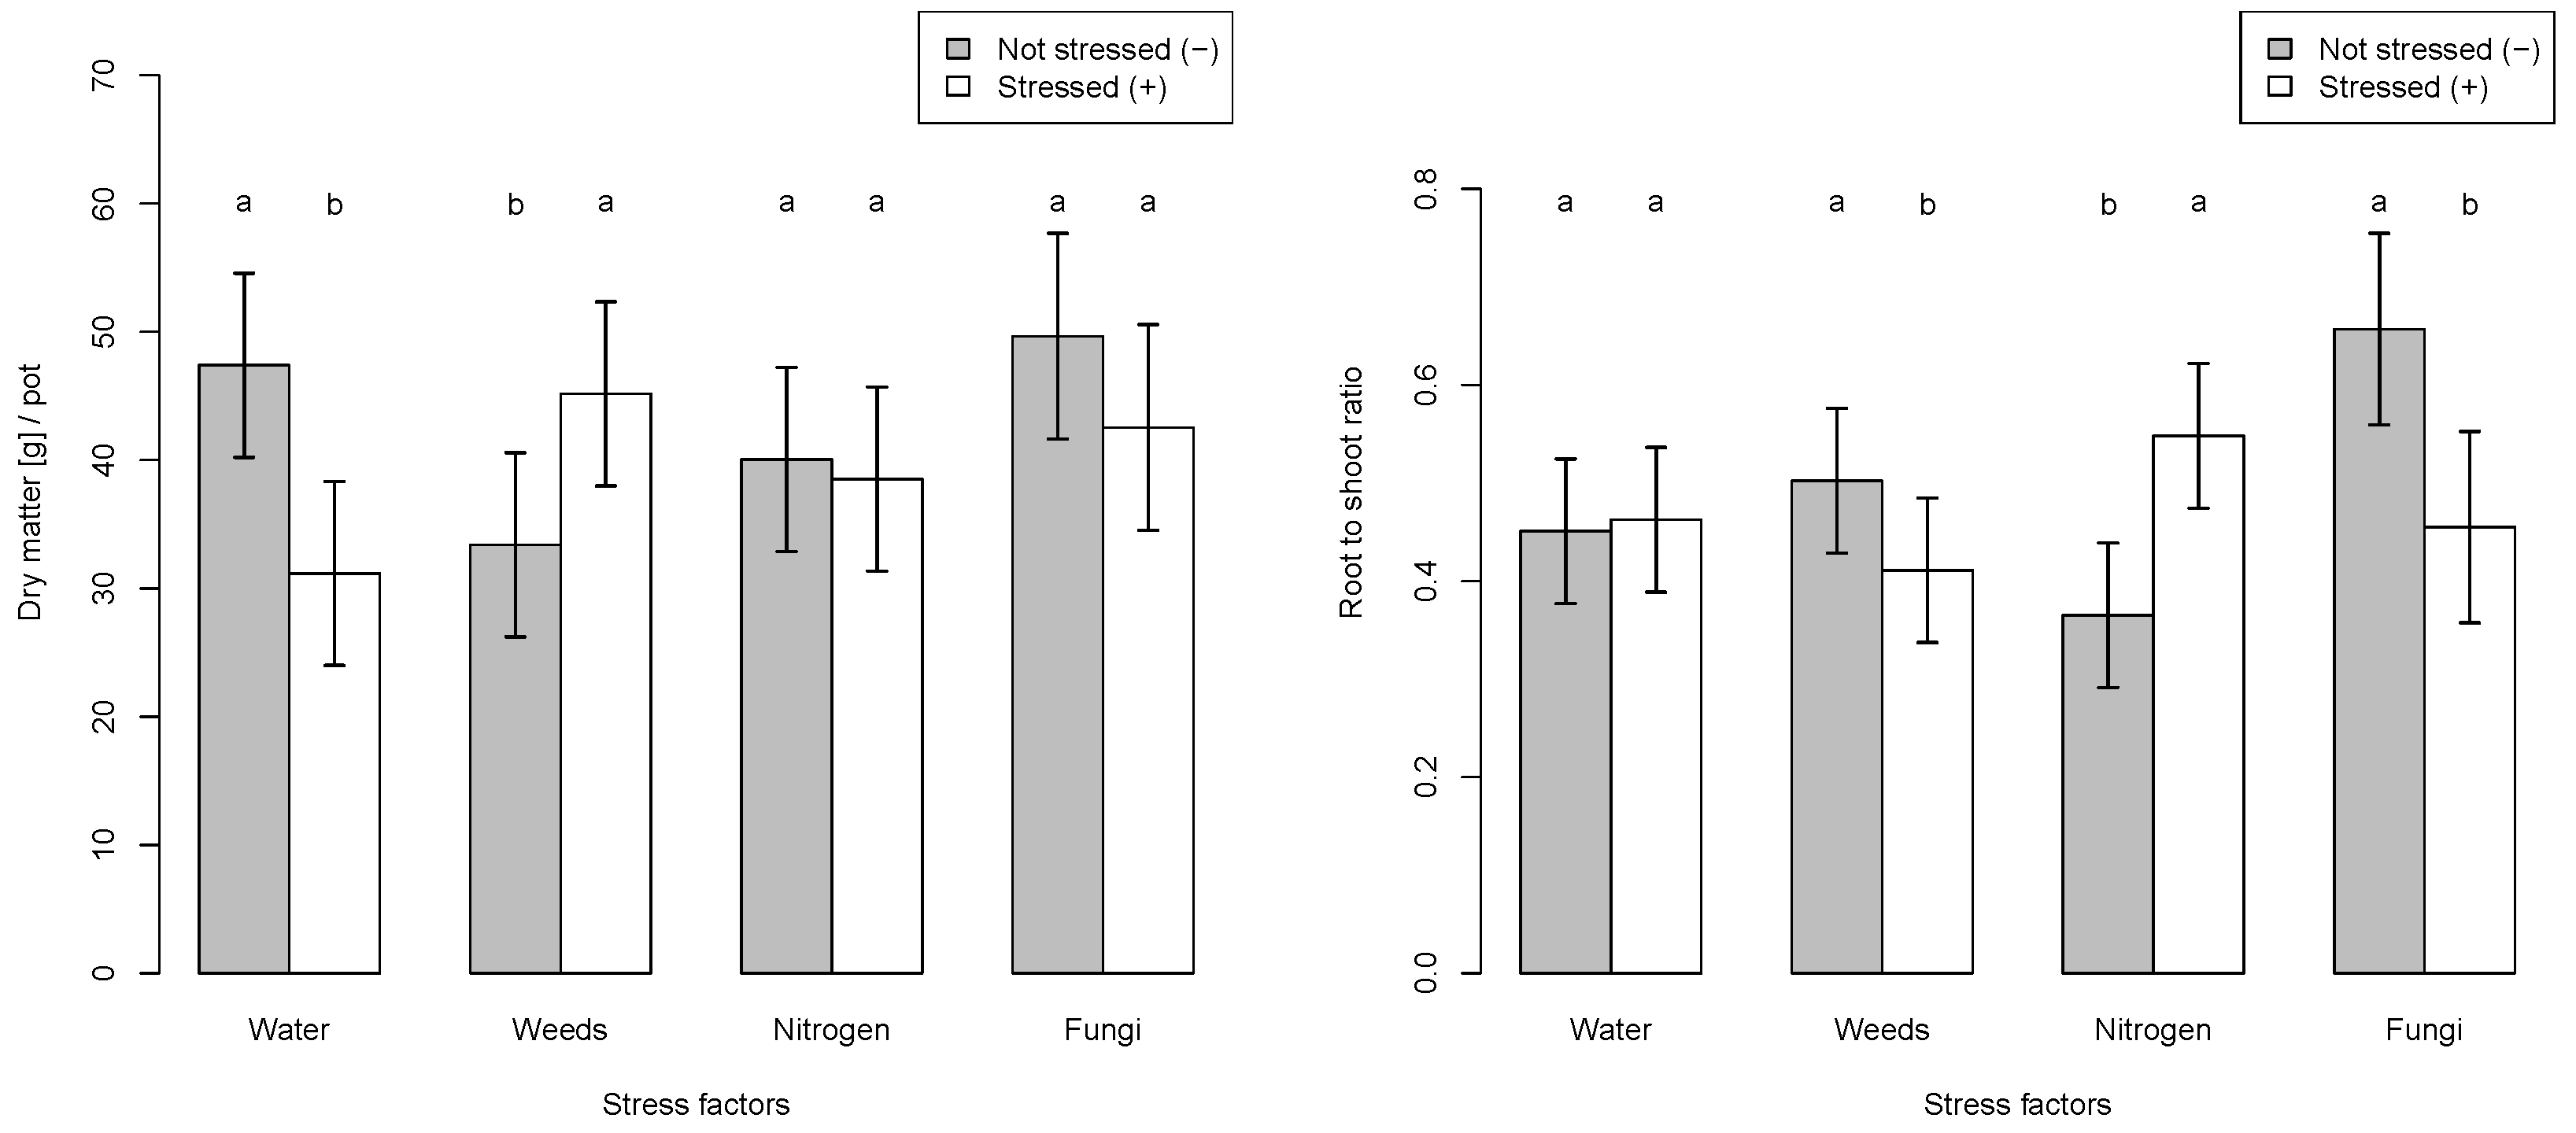
3.1. Single Stressors
3.1.1. HandySpec
3.1.2. Isaria
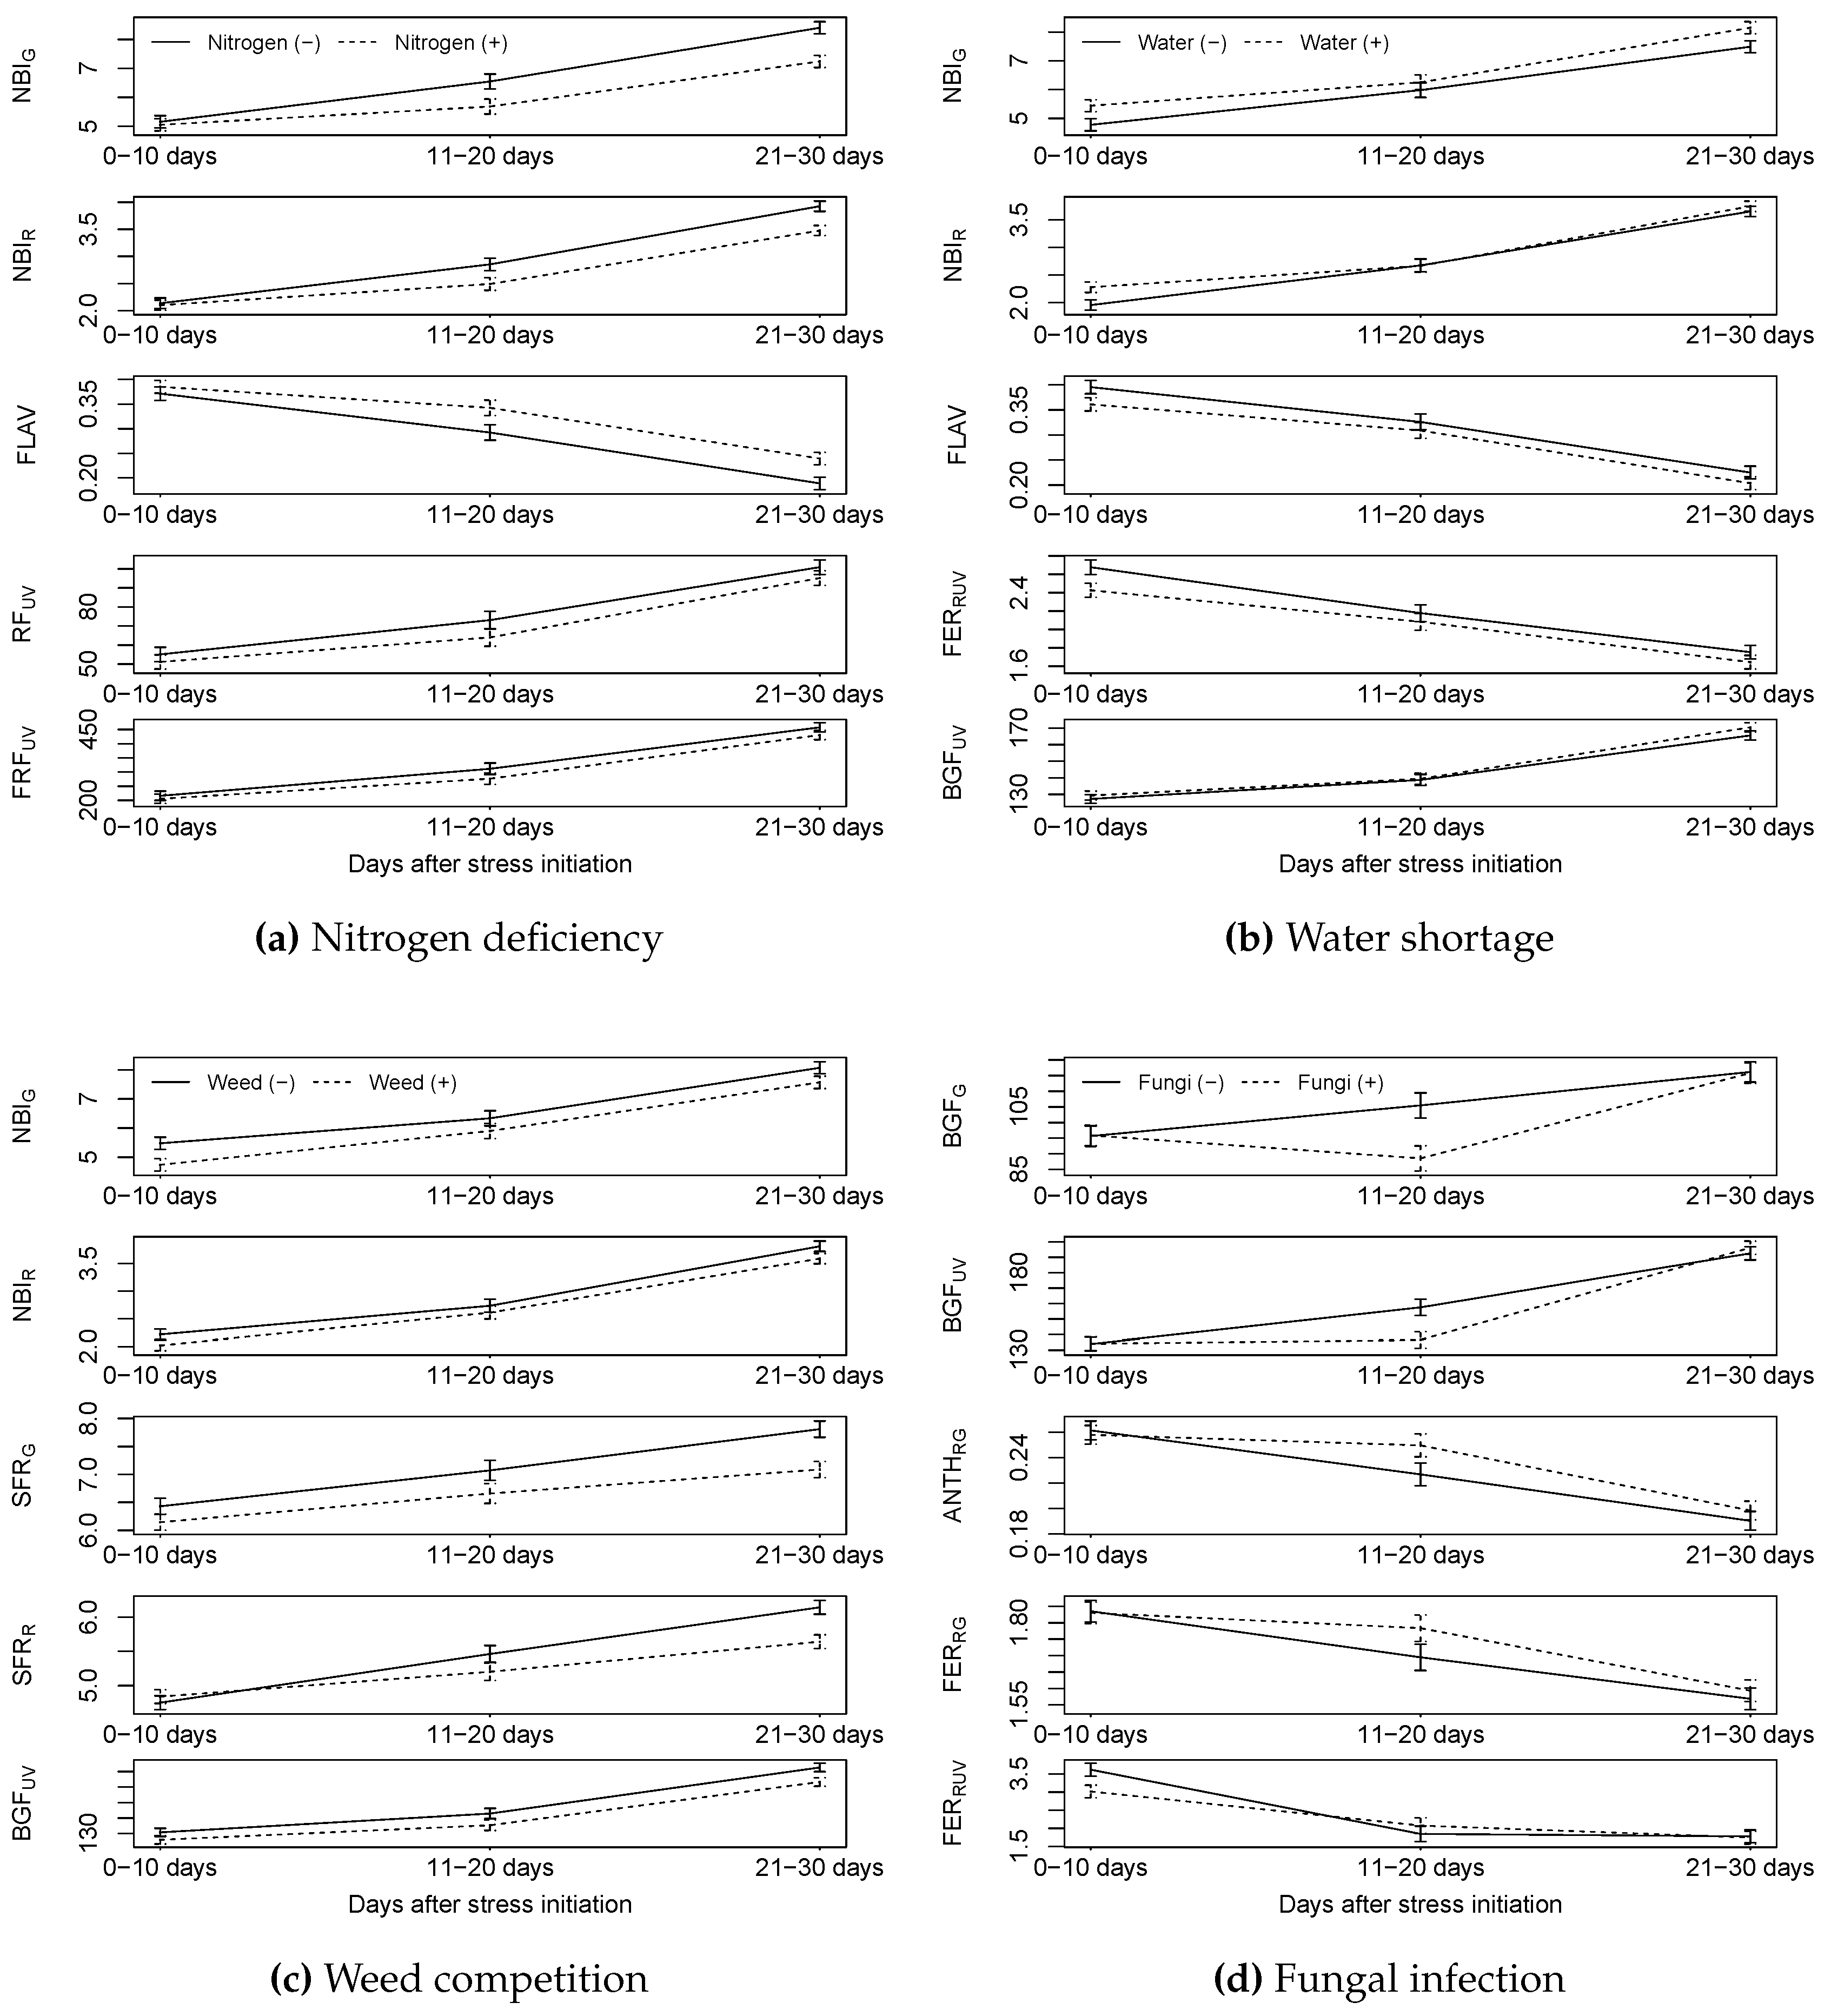
3.1.3. Multiplex
3.2. Combinations of Stressors
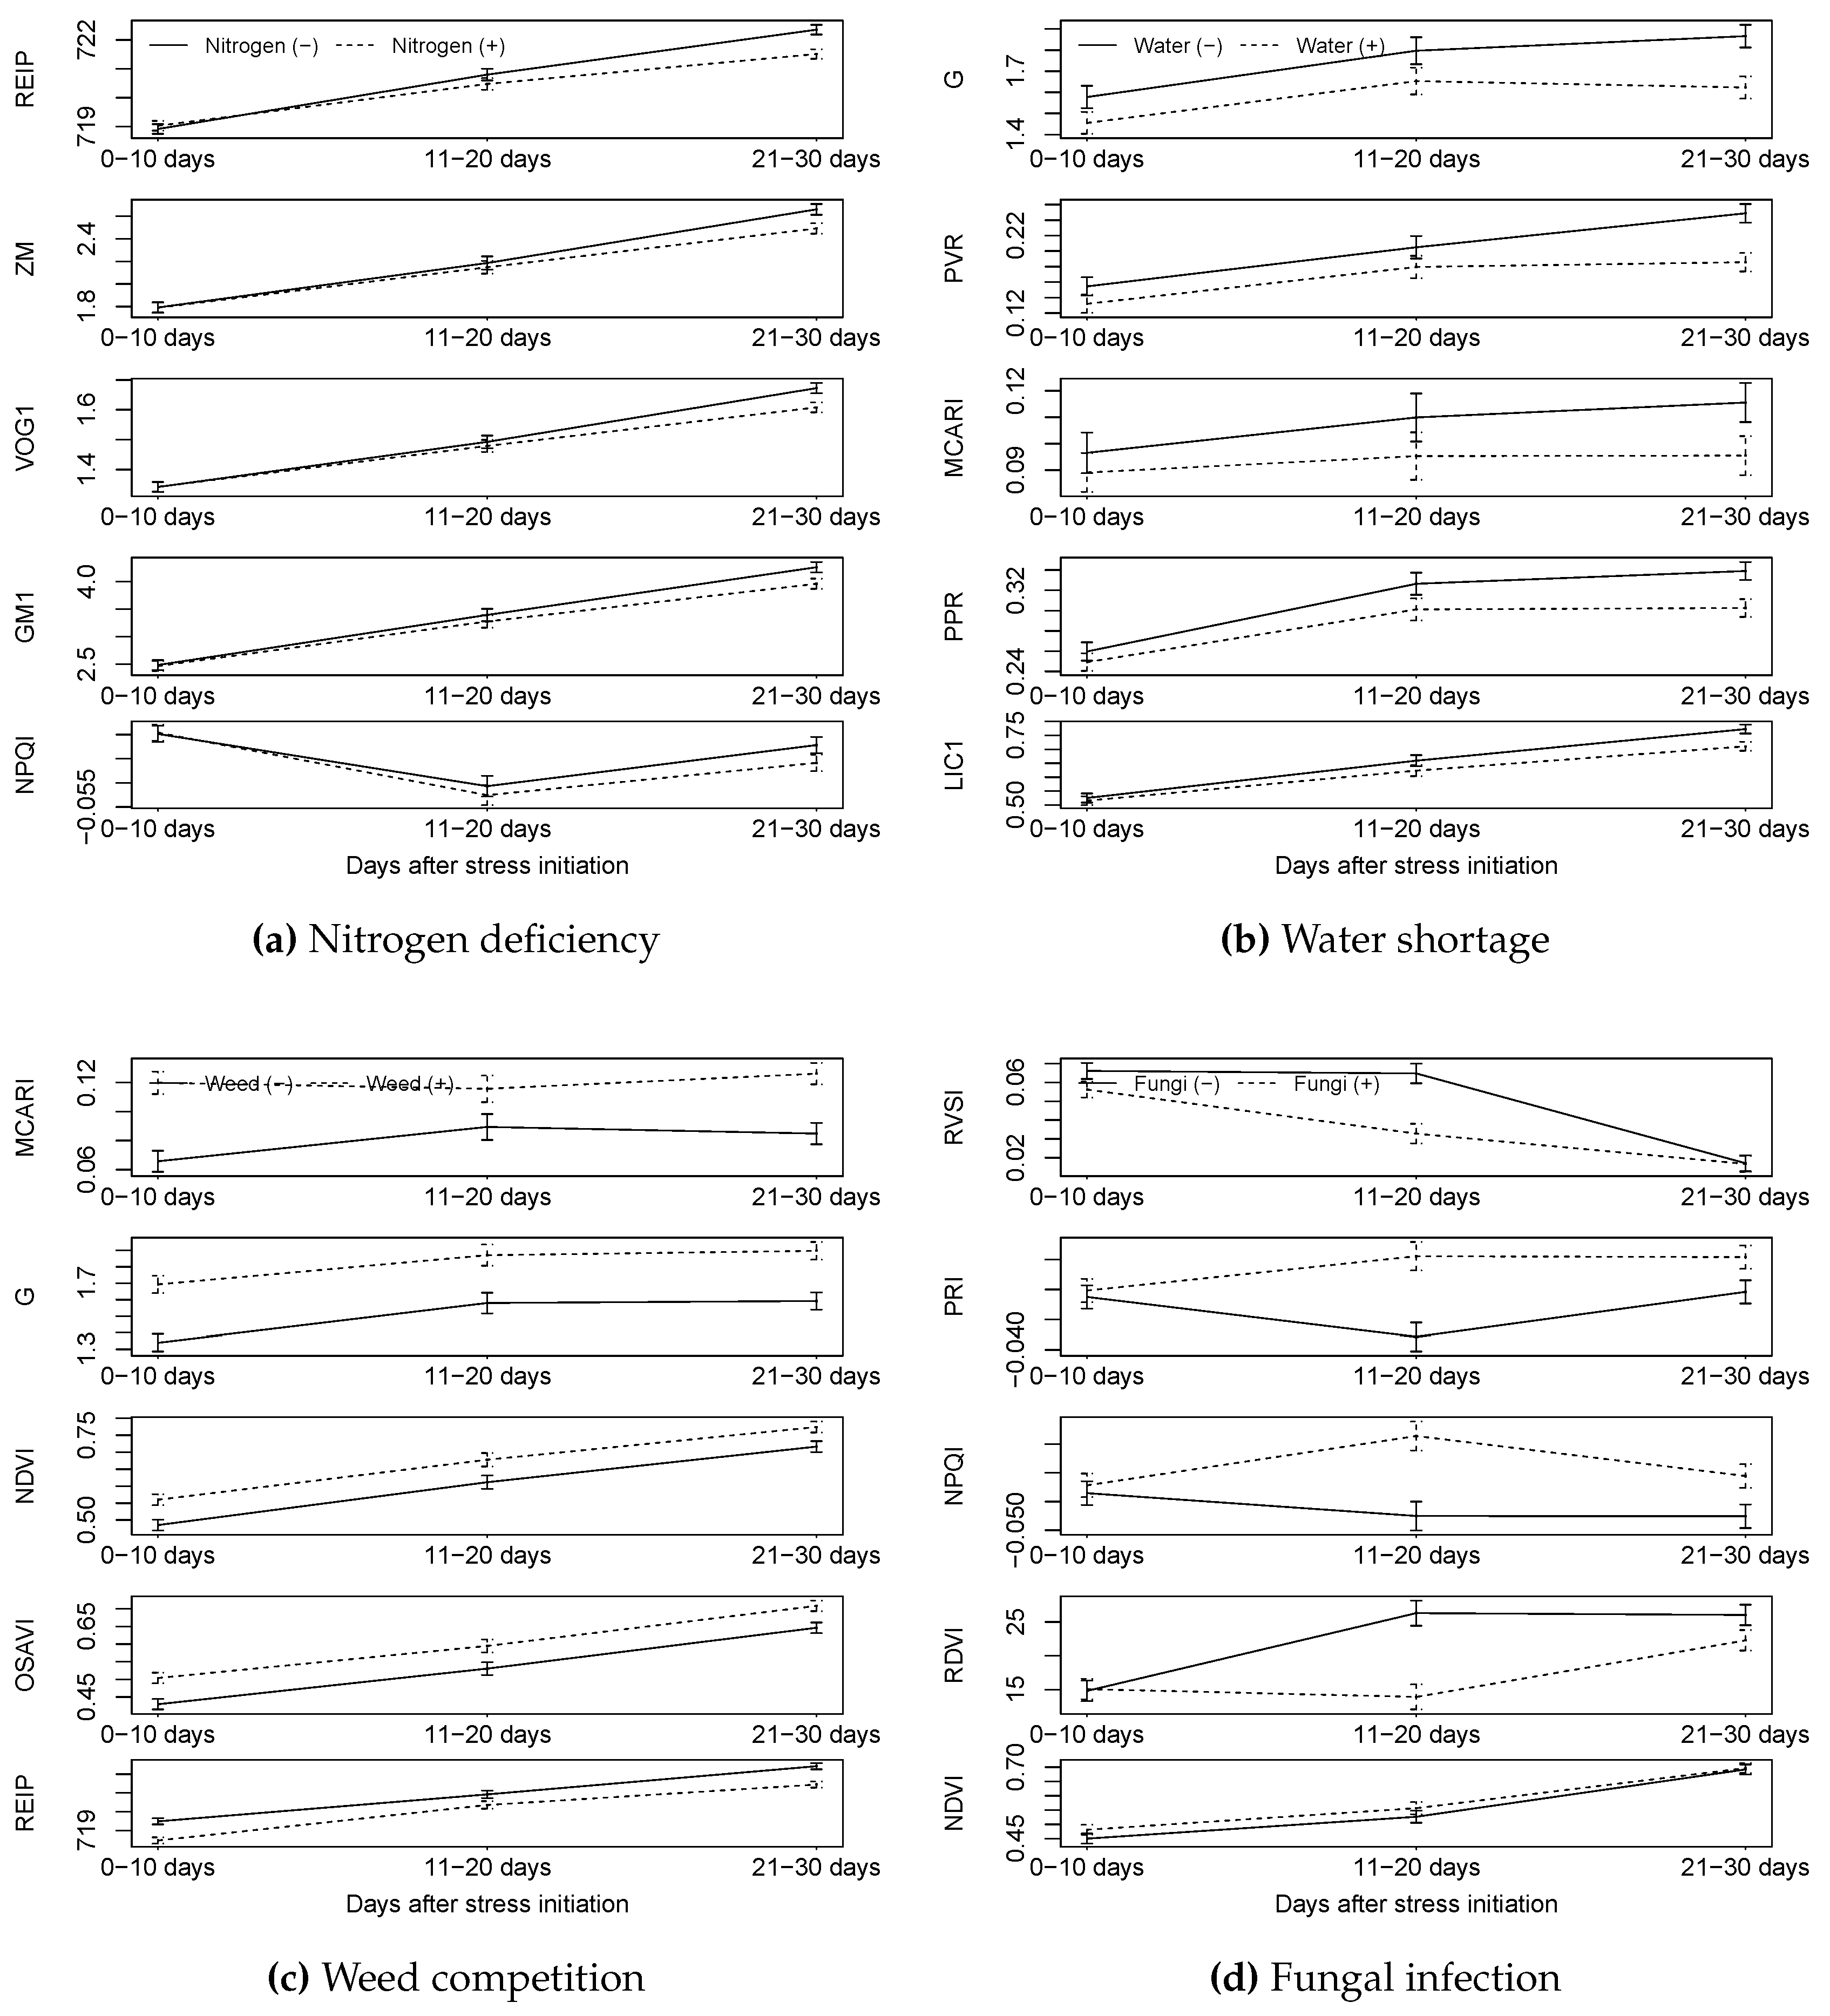
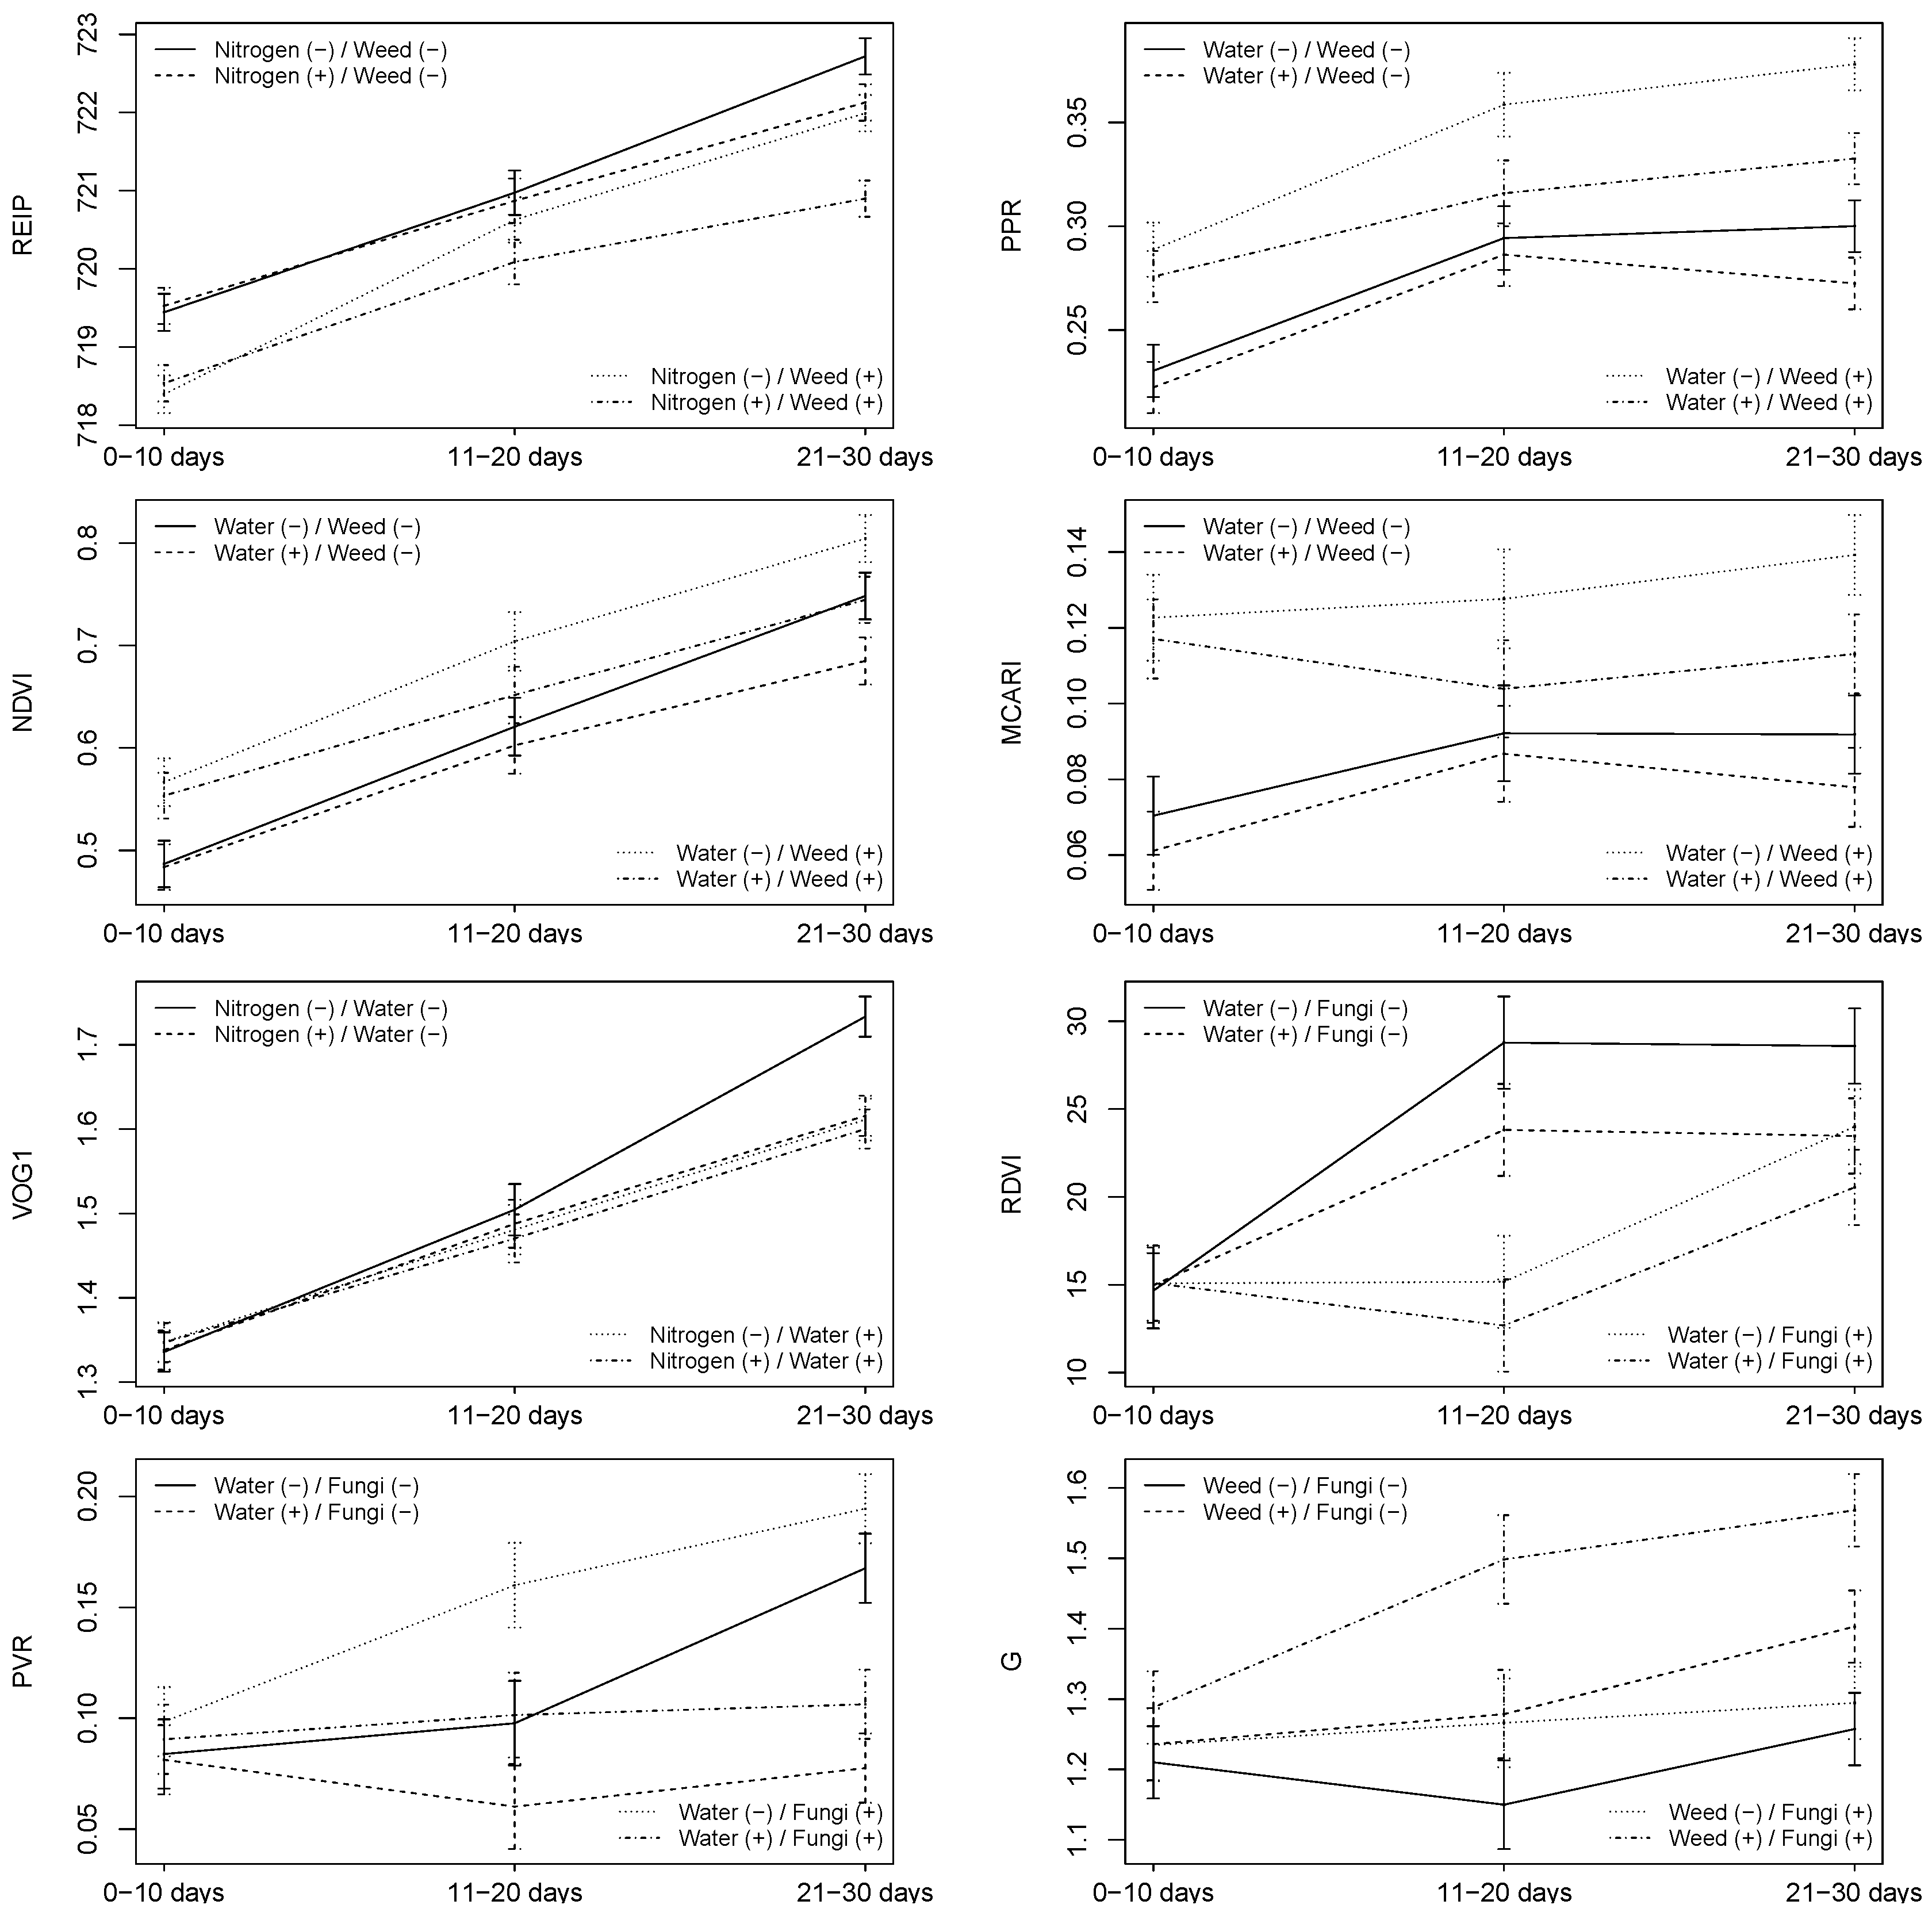
3.2.1. HandySpec
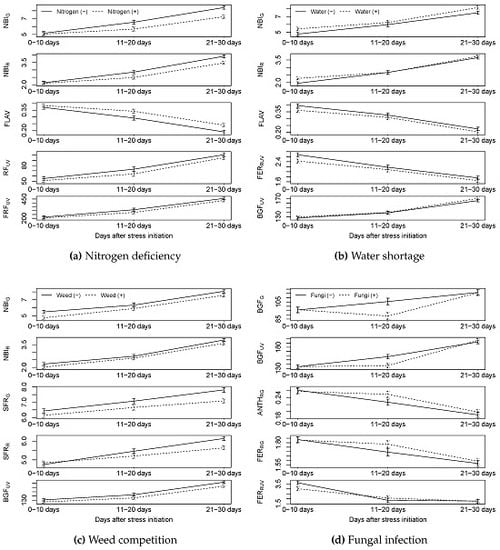
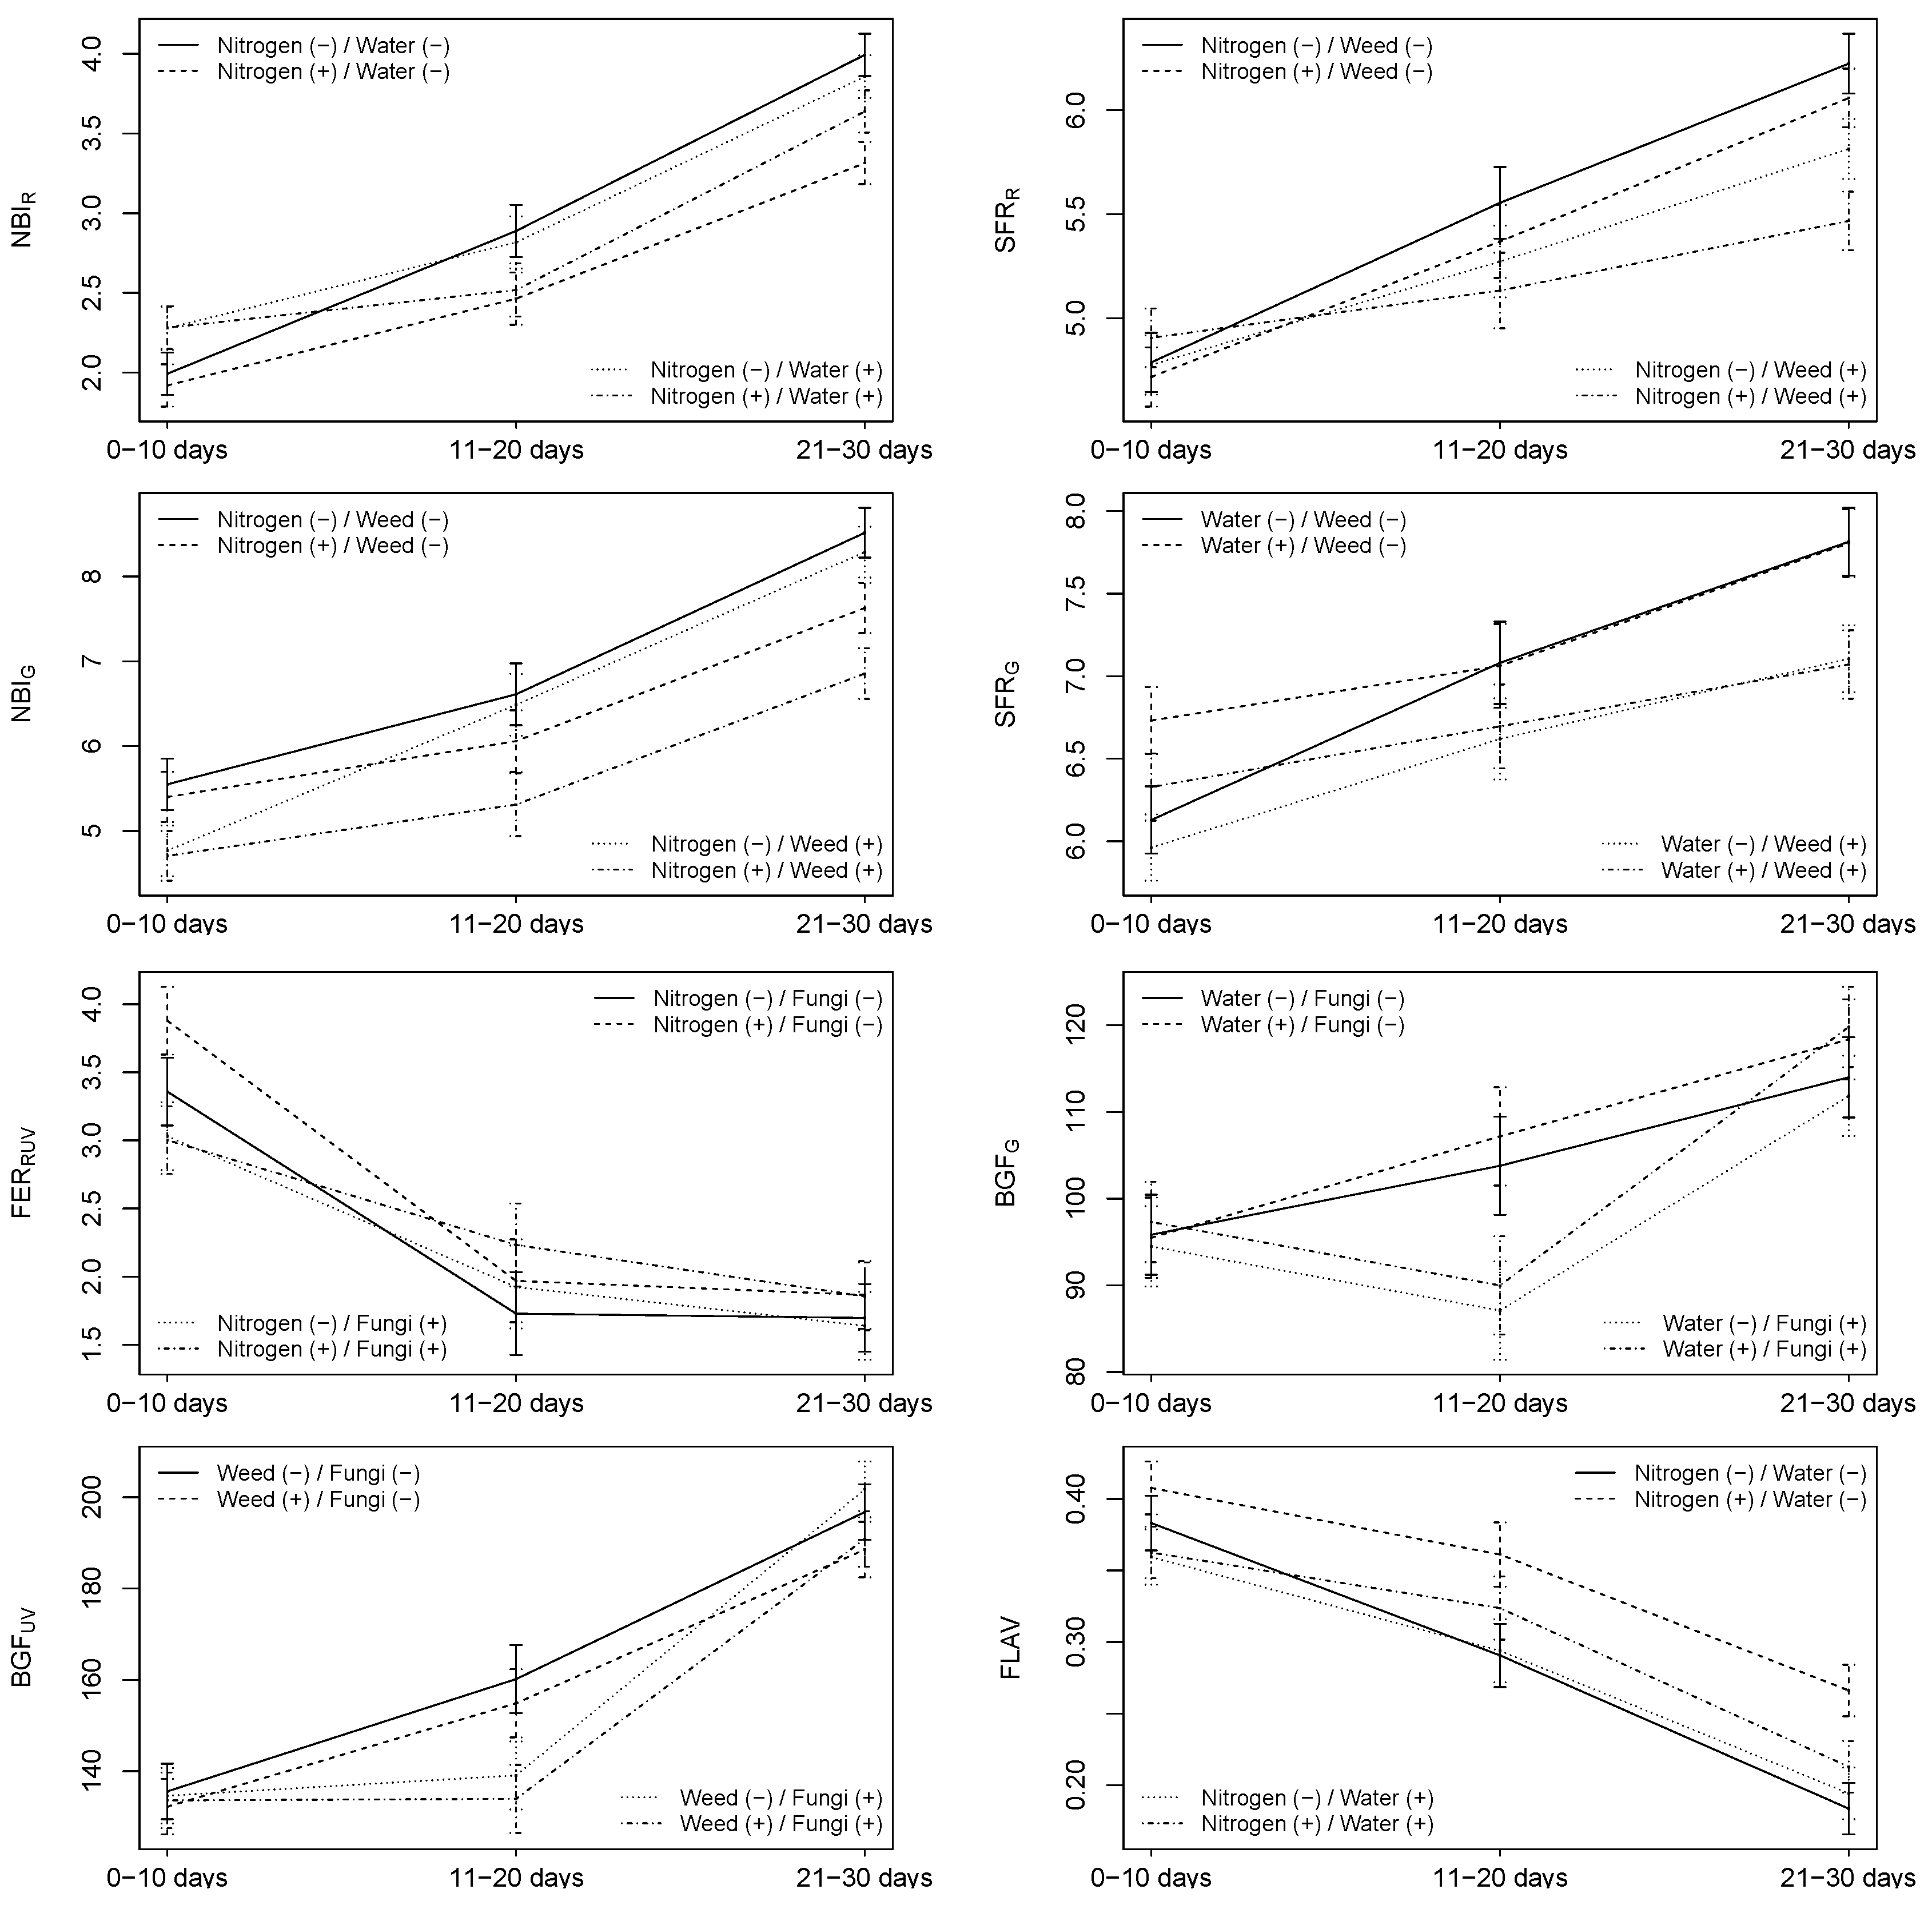
3.2.2. Multiplex
4. Discussion
4.1. Could Nitrogen Deficiency Stress Be Detected by the Sensors?
4.2. Could Water Stress Be Detected by the Sensors?
4.3. Could Weed Competition Be Detected by the Sensors?
4.4. Could Fungal Infection Be Detected by Sensors?
4.5. Could Combinations of Stressors Be Detected by Sensors?
5. Conclusions
Acknowledgments
Author Contributions
Conflicts of Interest
References
- Farooq, M.; Hussain, M.; Wahid, A.; Siddique, K.H.M. Drought Stress in Plants: An Overview. In Plant Responses to Drought Stress; Springer: Berlin, Germany; Heidelberg, Germany, 2012; pp. 1–33. [Google Scholar]
- Oerke, E. Crop losses to pests. J. Agric. Sci. 2006, 144, 31–43. [Google Scholar] [CrossRef]
- Zhao, G.; Miao, Y.; Wang, H.; Su, M.; Fan, M.; Zhang, F.; Jiang, R.; Zhang, Z.; Liu, C.; Liu, P.; et al. A preliminary precision rice management system for increasing both grain yield and nitrogen use efficiency. Field Crops Res. 2013, 154, 23–30. [Google Scholar] [CrossRef]
- San Martín, C.; Andújar, D.; Fernández-Quintanilla, C.; Dorado, J. Spatial distribution patterns of weed communities in corn fields of Central Spain. Weed Sci. 2015, 63, 936–945. [Google Scholar] [CrossRef]
- Tremblay, N.; Wang, Z.; Cerovic, Z.G. Sensing crop nitrogen status with fluorescence indicators. A review. Agron. Sustain. Dev. 2011, 32, 451–464. [Google Scholar] [CrossRef]
- Peteinatos, G.G.; Weis, M.; Andújar, D.; Rueda Ayala, V.; Gerhards, R. Potential use of ground-based sensor technologies for weed detection. Pest Manag. Sci. 2014, 70, 190–199. [Google Scholar] [CrossRef] [PubMed]
- Govender, M.; Govender, P.J.; Weiersbye, I.M.; Witkowski, E.T.F.; Ahmed, F. Review of commonly used remote sensing and ground-based technologies to measure plant water stress. Water SA 2009, 35, 741–752. [Google Scholar] [CrossRef]
- Thenkabail, P.S.; Lyon, J.G.; Huete, A. (Eds.) Hyperspectral Remote Sensing of Vegetation; Taylor & Francis, CRC Press: Boca Raton, FL, USA, 2011.
- Tilling, A.K.; O’Leary, G.J.; Ferwerda, J.G.; Jones, S.D.; Fitzgerald, G.J.; Rodriguez, D.; Belford, R. Remote sensing of nitrogen and water stress in wheat. Field Crops Res. 2007, 104, 77–85. [Google Scholar] [CrossRef]
- Li, F.; Miao, Y.; Hennig, S.D.; Gnyp, M.L.; Chen, X.; Jia, L.; Bareth, G. Evaluating hyperspectral vegetation indices for estimating nitrogen concentration of winter wheat at different growth stages. Precis. Agric. 2010, 11, 335–357. [Google Scholar] [CrossRef]
- Bauriegel, E.; Giebel, A.; Herppich, W.B. Hyperspectral and chlorophyll fluorescence imaging to analyze the impact of Fusarium culmorum on the photosynthetic integrity of infected wheat ears. Sensors 2011, 11, 3765–3779. [Google Scholar] [CrossRef] [PubMed]
- Backoulou, G.F.; Elliott, N.C.; Giles, K.L.; Mirik, M. Processed multispectral imagery differentiates wheat crop stress caused by greenbug from other causes. Comput. Electron. Agric. 2015, 115, 34–39. [Google Scholar] [CrossRef]
- Cartelat, A.; Cerovic, Z.; Goulas, Y.; Meyer, S.; Lelarge, C.; Prioul, J.L.; Barbottin, A.; Jeuffroy, M.H.; Gate, P.; Agati, G.; et al. Optically assessed contents of leaf polyphenolics and chlorophyll as indicators of nitrogen deficiency in wheat (Triticum aestivum L.). Field Crops Res. 2005, 91, 35–49. [Google Scholar] [CrossRef]
- Bürling, K.Z.C.; Cornic, G.; Ducruet, J.; Noga, G.; Hunsche, M. Fluorescence-based sensing of drought-induced stress in the vegetative phase of four contrasting wheat genotypes. Environ. Exp. Bot. 2013, 89, 51–59. [Google Scholar] [CrossRef]
- Strachan, I.B.; Pattey, E.; Boisvert, J.B. Impact of nitrogen and environmental conditions on corn as detected by hyperspectral reflectance. Remote Sens. Environ. 2002, 80, 213–224. [Google Scholar] [CrossRef]
- Vogelmann, J.E.; Rock, B.N.; Moss, D.M. Red edge spectral measurements from sugar maple leaves. Int. J. Remote Sens. 1993, 14, 1563–1575. [Google Scholar] [CrossRef]
- Lin, C.; Popescu, S.C.; Huang, S.C.; Chang, P.T.; Wen, H.L. A novel reflectance-based model for evaluating chlorophyll concentrations of fresh and water-stressed leaves. Biogeosciences 2015, 12, 49–66. [Google Scholar] [CrossRef]
- Suárez, L.; Zarco-Tejada, P.; Sepulcre-Cantó, G.; Pérez-Priego, O.; Miller, J.; Jiménez-Muñoz, J.; Sobrino, J. Assessing canopy PRI for water stress detection with diurnal airborne imagery. Remote Sens. Environ. 2008, 112, 560–575. [Google Scholar] [CrossRef]
- Zarco-Tejada, P.; González-Dugo, V.; Berni, J. Fluorescence, temperature and narrow-band indices acquired from a UAV platform for water stress detection using a micro-hyperspectral imager and a thermal camera. Remote Sens. Environ. 2012, 117, 322–337. [Google Scholar] [CrossRef]
- Metternicht, G. Vegetation indices derived from high-resolution airborne videography for precision crop management. Int. J. Remote Sens. 2003, 24, 2855–2877. [Google Scholar] [CrossRef]
- Vrindts, E.; Baerdemaeker, J.D.; Ramon, H. Weed Detection using canopy reflection. Precis. Agric. 2002, 3, 63–80. [Google Scholar] [CrossRef]
- Haboudane, D.; Miller, J.R.; Pattey, E.; Zarco-Tejada, P.J.; Strachan, I.B. Hyperspectral vegetation indices and novel algorithms for predicting green LAI of crop canopies: Modeling and validation in the context of precision agriculture. Remote Sens. Environ. 2004, 90, 337–352. [Google Scholar] [CrossRef]
- Longchamps, L.; Panneton, B.; Samson, G.; Leroux, G.; Thériault, R. Discrimination of corn, grasses and dicot weeds by their UV-induced fluorescence spectral signature. Precis. Agric. 2010, 11, 181–197. [Google Scholar] [CrossRef]
- Tyystjärvi, E.; Norremark, M.; Mattila, H.; Keranen, M.; Hakala-Yatkin, M.; Ottosen, C.; Rosenqvist, E. Automatic identification of crop and weed species with chlorophyll fluorescence induction curves. Precis. Agric. 2011, 12, 546–563. [Google Scholar] [CrossRef]
- Rumpf, T.; Mahlein, A.K.; Steiner, U.; Oerke, E.C.; Dehne, H.W.; Plümer, L. Early detection and classification of plant diseases with Support Vector Machines based on hyperspectral reflectance. Comput. Electron. Agric. 2010, 74, 91–99. [Google Scholar] [CrossRef]
- Zhang, J.; Pu, R.; Huang, W.; Yuan, L.; Luo, J.; Wang, J. Using in-situ hyperspectral data for detecting and discriminating yellow rust disease from nutrient stresses. Field Crops Res. 2012. [Google Scholar] [CrossRef]
- Bauriegel, E.; Herppich, W.B. Hyperspectral and chlorophyll fluorescence imaging for early detection of plant diseases, with special reference to Fusarium spec. infections on wheat. Agriculture 2014, 4, 32–57. [Google Scholar] [CrossRef]
- Calderón, R.; Navas-Cortés, J.A.; Zarco-Tejada, P.J. Early detection and quantification of verticillium wilt in olive using hyperspectral and thermal imagery over large areas. Remote Sens. 2015, 7, 5584–5610. [Google Scholar] [CrossRef]
- Karimi, Y.; Prasher, O.S.; Patel, M.R.; Kim, H.S. Application of support vector machine technology for weed and nitrogen stress detection in corn. Comput. Electron. Agric. 2006, 51, 99–109. [Google Scholar] [CrossRef]
- Mitscherlich, E.A. Das Gesetz des Miniraums und das Gesetz des abhnehlmenden Bodenertrags. Land. Jahrb 1909, 38, 5371–5552. [Google Scholar]
- Hess, M.; Barralis, G.; Bleiholder, H.; Buhr, L.; Eggers, T.; Hack, H.; Stauss, R. Use of the extended BBCH scale—General for the descriptions of the growth stages of mono and dicotyledonous weed species. Weed Res. 1997, 37, 433–441. [Google Scholar] [CrossRef]
- Rouse, J.W.; Haas, R.H.; Schell, J.A.; Deering, D.W.; Harlan, J.C. Monitoring the Vernal Advancement and Retrogradation (Greenwave Effect) of Natural Vegetation; Texas A & M University, Remote Sensing Center: College Station, TX, USA, 1974. [Google Scholar]
- Rondeaux, G.; Steven, M.; Baret, F. Optimization of soil-adjusted vegetation indices. Remote Sens. Environ. 1996, 55, 95–107. [Google Scholar] [CrossRef]
- Roujean, J.L.; Breon, F.M. Estimation PAR absorbed by vegetation from bi-directional reflectance measurements. Remote Sens. Environ. 1995, 51, 375–384. [Google Scholar] [CrossRef]
- Guyot, G.; Baret, F.; Major, D.J. High spectral resolution: Determination of spectral shifts between the red and infrared. Int. Arch. Photogram. Remote Sens. 1988, 11, 750–760. [Google Scholar]
- Zarco-Tejada, P.; Berjón, A.; López-Lozano, R.; Miller, J.; Martín, P.; Cachorro, V.; González, M.; de Frutos, A. Assessing vineyard condition with hyperspectral indices: Leaf and canopy reflectance simulation in a row-structured discontinuous canopy. Remote Sens. Environ. 2005, 99, 271–287. [Google Scholar] [CrossRef]
- Daughtry, C.S.; Walthall, C.L.; Kim, M.S.; Brown de Colstoun, E.; McMurtrey, J.E. Estimating corn leaf chlorophyll concentration from leaf and canopy reflectance. Remote Sens. Environ. 2000, 74, 229–239. [Google Scholar] [CrossRef]
- Barnes, J.; Balaguer, L.; Manrique, E.; Elvira, S.; Davison, A. A reappraisal of the use of DMSO for the extraction and determination of chlorophylls a and b in lichens and higher plants. Environ. Exp. Bot. 1992, 32, 85–100. [Google Scholar] [CrossRef]
- Gitelson, A.A.; Merzlyak, M.N. Remote estimation of chlorophyll content in higher plant leaves. Int. J. Remote Sens. 1997, 18, 2691–2697. [Google Scholar] [CrossRef]
- Lichtenthaler, H.K. Vegetation stress: An introduction to the stress concept in plants. J. Plant Physiol. 1996, 148, 4–14. [Google Scholar] [CrossRef]
- Zarco-Tejada, P.J.; Miller, J.R.; Noland, T.L.; Mohammed, G.H.; Sampson, P.H. Scaling-up and model inversion methods with narrow-band optical indices for chlorophyll content estimation in closed forest canopies with hyperspectral data. IEEE Trans. Geosci. Remote Sen. 2001, 39, 1491–1507. [Google Scholar] [CrossRef]
- Gamon, J.A.; Peñuelas, J.; Field, C.B. A narrow-waveband spectral index that tracks diurnal changes in photosynthetic efficiency. Remote Sens. Environ. 1992, 41, 35–44. [Google Scholar] [CrossRef]
- Carter, G.A. Ratios of leaf reflectances in narrow wavebands as indicators of plant stress. Int. J. Remote Sens. 1994, 15, 697–703. [Google Scholar] [CrossRef]
- Merton, R. Monitoring Community Hysteresis Using Spectral Shift Analysis and the Red-Edge Vegetation Stress Index; Jet Propulsion Laboratory: Pasadena, CA, USA, 1998. [Google Scholar]
- FORCE-A. Users Guide, Multiplex 3, Hand-Held Multi-Parameter Optical Sensor; FORCE-A, Centre Universitaire Paris-Sud ORSAY: Cedex, France, 2010. [Google Scholar]
- Ghozlen, N.B.; Cerovic, Z.G.; Germain, C.; Toutain, S.; Latouche, G. Non-destructive optical monitoring of grape maturation by proximal sensing. Sensors 2010, 10, 10040–10068. [Google Scholar] [CrossRef] [PubMed]
- Cerovic, Z.; Moise, N.; Agati, G.; Latouche, G.; Ghozlen, N.B.; Meyer, S. New portable optical sensors for the assessment of winegrape phenolic maturity based on berry fluorescence. J. Food Compos. Anal. 2008, 21, 650–654. [Google Scholar] [CrossRef]
- R Development Core Team. R: A Language and Environment for Statistical Computing; R Foundation for Statistical Computing: Vienna, Austria, 2008. [Google Scholar]
- Boochs, F.; Kupfer, G.; Dockter, K.; Kühbauch, W. Shape of the red edge as vitality indicator for plants. Int. J. Remote Sens. 1990, 11, 1741–1753. [Google Scholar] [CrossRef]
- Miller, J.R.; Hare, E.W.; Wu, J. Quantitative characterization of the vegetation red edge reflectance 1. An inverted-Gaussian reflectance model. Int. J. Remote Sens. 1990, 11, 1755–1773. [Google Scholar] [CrossRef]
- Belanger, M.; Miller, J.; Boyer, M. Comparative relationships between some red edge parameters and seasonal leaf chlorophyll concentrations. Can. J. Remote Sens. 1995, 21, 16–21. [Google Scholar] [CrossRef]
- Zhao, D.; Reddy, K.R.; Kakani, V.G.; Reddy, V. Nitrogen deficiency effects on plant growth, leaf photosynthesis, and hyperspectral reflectance properties of sorghum. Eur. J. Agron. 2005, 22, 399–403. [Google Scholar] [CrossRef]
- Corp, L.A.; Middleton, E.M.; Campbell, P.E.; Huemmrich, K.F.; Daughtry, C.S.; Russ, A.; Cheng, Y.B. Spectral indices to monitor nitrogen-driven carbon uptake in field corn. J. Appl. Remote Sens. 2010, 4. [Google Scholar] [CrossRef]
- Zarco-Tejada, P.J.; Berjón, A.; Miller, J.R. Stress detection in crops with hyperspectral remote sensing and physical simulation models. In Proceedings of the Airborne Imaging Spectroscopy Workshop, Bruges, Belgium, 8 October 2004.
- Zarco-Tejada, P.J.; Miller, J.R.; Harron, J.; Hu, B.; Noland, T.L.; Goel, N.; Mohammed, G.H.; Sampson, P. Needle chlorophyll content estimation through model inversion using hyperspectral data from boreal conifer forest canopies. Remote Sens. Environ. 2004, 89, 189–199. [Google Scholar] [CrossRef]
- Campbell, P.E.; Middleton, E.; Corp, L.; Kim, M. Contribution of chlorophyll fluorescence to the apparent vegetation reflectance. Sci. Total Environ. 2008, 404, 433–439. [Google Scholar] [CrossRef] [PubMed]
- Agati, G.; Foschi, L.; Grossi, N.; Volterrani, M. In field non-invasive sensing of the nitrogen status in hybrid bermudagrass (Cynodon dactylon × C. transvaalensis Burtt Davy) by a fluorescence-based method. Eur. J. Agron. 2015, 63, 89–96. [Google Scholar] [CrossRef]
- Agati, G.; Foschi, L.; Grossi, N.; Guglielminetti, L.; Cerovic, Z.G.; Volterrani, M. Fluorescence-based versus reflectance proximal sensing of nitrogen content in Paspalum vaginatum and Zoysia matrella turfgrasses. Eur. J. Agron. 2013, 45, 39–51. [Google Scholar] [CrossRef]
- Longchamps, L.; Khosla, R. Early detection of nitrogen variability in maize using fluorescence. Agron. J. 2014, 106, 511–518. [Google Scholar] [CrossRef]
- Cerovic, Z.; Ounis, A.; Cartelat, A.; Latouche, G.; Goulas, Y.; Meyer, S.; Moya, I. The use of chlorophyll fluorescence excitation spectra for the nondestructive in situ assessment of UV-absorbing compounds in leaves. Plant Cell Environ. 2002, 25, 1663–1676. [Google Scholar] [CrossRef]
- Bilger, W.; Veit, M.; Schreiber, L.; Schreiber, U. Measurement of leaf epidermal transmittance of UV radiation by chlorophyll fluorescence. Physiol. Plant 1997, 101, 754–763. [Google Scholar] [CrossRef]
- Bilger, W.; Johnsen, T.; Schreiber, U. UV-excited chlorophyll fluorescence as a tool for the assessment of UV-protection by the epidermis of plants. J. Exp. Bot. 2001, 52, 2007–2014. [Google Scholar] [CrossRef] [PubMed]
- Kusnierek, K.; Korsaeth, A. Simultaneous identification of spring wheat nitrogen and water status using visible and near infrared spectra and powered partial least squares regression. Comput. Electron. Agric. 2015, 117, 200–213. [Google Scholar] [CrossRef]
- Wang, C.; Qi, J.; Moran, S.; Marsett, R. Soil moisture estimation in a semiarid rangeland using ERS-2 and TM imagery. Remote Sens. Environ. 2004, 90, 178–189. [Google Scholar] [CrossRef]
- Peteinatos, G.G.; Keller, M.; Weis, M.; Gerhards, R. Comparison of Isaria Sensor with a Typical Spectrometer in a Series of Diverse Conditions; Edicions de la Universitat de Lleida: Lleida, Spain, 2013; pp. 32–33. [Google Scholar]
- Latouche, G.; Debord, C.; Raynal, M.; Milhade, C.; Cerovic, Z.G. First detection of the presence of naturally occurring grapevine downy mildew in the field by a fluorescence-based method. Photochem. Photobiol. Sci. 2015, 14, 1807–1813. [Google Scholar] [CrossRef] [PubMed]

| Treatment | 1 | 2 | 3 | 4 | 5 | 6 | 7 | 8 | 9 | 10 | 11 | 12 | 13 | 14 | 15 | 16 |
|---|---|---|---|---|---|---|---|---|---|---|---|---|---|---|---|---|
| Fungi | + | + | + | + | + | + | + | + | − | − | − | − | − | − | − | − |
| Water | + | + | + | + | − | − | − | − | + | + | + | + | − | − | − | − |
| Nitrogen | + | + | − | − | + | + | − | − | + | + | − | − | + | + | − | − |
| Weeds | + | − | + | − | + | − | + | − | + | − | + | − | + | − | + | − |
| Index Reference | Explanation | Formula |
|---|---|---|
| Structural indices | (HandySpec®) | |
| NDVI [32] | Normalized Difference Vegetation Index | |
| OSAVI [33] | Optimized Soil-Adjusted Vegetation Index | |
| RDVI [34] | Renormalized Difference Vegetation Index | |
| Red Edge Inflection Point | (HandySpec® & Isaria®) | |
| REIP [35] | Red Edge Inflection Point | |
| Chlorophyll indices | (HandySpec®) | |
| G [36] | Greenness Index | |
| MCARI [37] | Modified Chlorophyll Absorption in Reflectance Index | |
| NPQI [38] | Normalized Phaeophytinization Index | |
| PPR [20] | Plant Pigment Ratio | |
| PVR [20] | Photosynthetic Vigor Ratio | |
| VOG1 [16] | Simple Ratio 740/720 | |
| GM1 [39] | Simple Ratio 750/550 | |
| LIC1 [40] | Lichtenthaler Index 1 | |
| ZM [41] | Zarco-Tejada & Miller | |
| Stress–Pigment indices | (HandySpec®) | |
| PRI [42] | Photochemical Reflectance Index | |
| CTR1 [43] | Simple Ratio 695/420 | |
| RVSI [44] | Red-edge Vegetation Stress Index | |
| Fluorescence indices | (Multiplex®) | |
| ANTH [45] | Anthocyanins | |
| RFR [45] | Red Fluorescence (Red Excitation) | — |
| FRFUV [45] | Infra-red Fluorescence (UV Excitation) | — |
| BGFG [45] | Blue Green Fluorescence (Green Excitation) | — |
| BGFUV [45] | Blue Green Fluorescence (UV Excitation) | — |
| FERRUV [45] | Fluorescence Excitation Ratio (Red & UV Excitation) | |
| FERRG [45] | Fluorescence Excitation Ratio (Red & Green Excitation) | |
| FLAV [45] | Flavonoids | |
| NBIG [45] | Nitrogen Balance Index | |
| NBIR [45] | Nitrogen Balance Index | |
| SFRG [45] | Simple Fluorescence Ratio (Green Excitation) | |
| SFRR [45] | Simple Fluorescence Ratio (Red Excitation) |
| HandySpec® | Isaria® | Multiplex® | |
|---|---|---|---|
| Type | Spectrometer | Spectrometer | Fluorometer |
| Has Illumination | No | Yes | Yes |
| Needs Calibration | Yes | No | No |
| Plant-Sensor Distance (cm) | 60 | 10 | |
| Field of View (cm2) | 200 | 700 | 50 |
| Index | Nitrogen Deficiency | Water Shortage | Weed Competition | Fungal Infection | ||||||||
|---|---|---|---|---|---|---|---|---|---|---|---|---|
| − | + | Sign | − | + | Sign | − | + | Sign | − | + | Sign | |
| REIP | 721 | 720 | *** | 720 | 721 | * | 721 | 720 | *** | 722 | 721 | *** |
| NDVI | 0.64 | 0.63 | NS | 0.65 | 0.62 | *** | 0.60 | 0.67 | *** | 0.56 | 0.58 | ** |
| PVR | 0.19 | 0.18 | NS | 0.20 | 0.17 | *** | 0.15 | 0.22 | *** | 0.10 | 0.12 | *** |
| OSAVI | 0.58 | 0.56 | NS | 0.58 | 0.56 | ** | 0.54 | 0.60 | *** | 0.52 | 0.51 | NS |
| MCARI | 0.11 | 0.11 | NS | 0.12 | 0.10 | *** | 0.08 | 0.14 | *** | 0.06 | 0.05 | *** |
| RVSI | 0.030 | 0.032 | NS | 0.028 | 0.034 | ** | 0.034 | 0.028 | *** | 0.047 | 0.036 | *** |
| RDVI | 23.5 | 22.8 | NS | 24.0 | 22.3 | * | 20.6 | 25.7 | *** | 21.9 | 17.5 | *** |
| G | 1.68 | 1.65 | NS | 1.75 | 1.58 | *** | 1.50 | 1.83 | *** | 1.26 | 1.36 | *** |
| ZM | 2.23 | 2.15 | *** | 2.23 | 2.15 | ** | 2.15 | 2.23 | ** | 2.07 | 2.09 | NS |
| NPQI | −0.043 | −0.045 | ** | −0.045 | −0.044 | NS | −0.046 | −0.042 | *** | −0.046 | −0.039 | *** |
| PRI | −0.021 | −0.024 | * | −0.02 | −0.025 | *** | −0.026 | −0.019 | *** | −0.033 | −0.027 | *** |
| CTR1 | 1.52 | 1.56 | * | 1.52 | 1.55 | * | 1.53 | 1.55 | NS | 1.51 | 1.40 | *** |
| LIC1 | 0.64 | 0.63 | NS | 0.65 | 0.61 | *** | 0.60 | 0.66 | *** | 0.56 | 0.58 | ** |
| VOG1 | 1.51 | 1.48 | ** | 1.50 | 1.48 | ** | 1.48 | 1.50 | NS | 1.46 | 1.47 | NS |
| GM1 | 3.40 | 3.24 | *** | 3.38 | 3.26 | * | 3.22 | 3.42 | *** | 2.93 | 2.88 | NS |
| PPR | 0.29 | 0.30 | NS | 0.30 | 0.28 | *** | 0.26 | 0.32 | *** | 0.22 | 0.22 | NS |
| Index | Nitrogen Deficiency | Water Shortage | Weed Competition | Fungal Infection | ||||||||
|---|---|---|---|---|---|---|---|---|---|---|---|---|
| − | + | Sign | − | + | Sign | − | + | Sign | − | + | Sign | |
| REIP | 724 | 723 | NS | 723 | 724 | NS | 725 | 722 | *** | 726 | 726 | NS |
| IBI | 79.6 | 76.3 | NS | 80.8 | 75.1 | NS | 64.3 | 91.6 | *** | 63.2 | 64.5 | NS |
| Index | Nitrogen Deficiency | Water Shortage | Weed Competition | Fungal Infection | ||||||||
|---|---|---|---|---|---|---|---|---|---|---|---|---|
| − | + | Sign | − | + | Sign | − | + | Sign | − | + | Sign | |
| 147 | 146 | NS | 146 | 148 | ** | 150 | 144 | *** | 162 | 158 | ** | |
| 80.1 | 73.5 | *** | 76.7 | 76.8 | NS | 74.7 | 78.8 | * | 101 | 100 | NS | |
| 347 | 315 | *** | 327 | 335 | NS | 332 | 331 | NS | 462 | 465 | NS | |
| 88.8 | 90.1 | NS | 88.9 | 90 | NS | 90.6 | 88.3 | ** | 106 | 102 | *** | |
| 7.15 | 7.03 | NS | 7.00 | 7.19 | * | 7.35 | 6.83 | *** | 7.80 | 7.75 | NS | |
| 5.48 | 5.38 | * | 5.37 | 5.48 | * | 5.54 | 5.32 | *** | 6.35 | 6.41 | NS | |
| 2.08 | 2.33 | *** | 2.29 | 2.12 | ** | 2.16 | 2.25 | NS | 2.49 | 2.31 | * | |
| 0.29 | 0.33 | *** | 0.32 | 0.29 | *** | 0.30 | 0.31 | ** | 0.35 | 0.34 | NS | |
| 1.80 | 1.83 | NS | 1.83 | 1.80 | NS | 1.83 | 1.80 | NS | 1.70 | 1.73 | * | |
| 0.25 | 0.25 | NS | 0.25 | 0.25 | NS | 0.25 | 0.25 | NS | 0.23 | 0.23 | * | |
| 6.83 | 6.15 | *** | 6.22 | 6.76 | *** | 6.74 | 6.24 | *** | 6.34 | 6.47 | NS | |
| 3.04 | 2.72 | *** | 2.80 | 2.97 | *** | 2.97 | 2.79 | *** | 3.14 | 3.17 | NS | |
© 2016 by the authors; licensee MDPI, Basel, Switzerland. This article is an open access article distributed under the terms and conditions of the Creative Commons Attribution (CC-BY) license (http://creativecommons.org/licenses/by/4.0/).
Share and Cite
Peteinatos, G.G.; Korsaeth, A.; Berge, T.W.; Gerhards, R. Using Optical Sensors to Identify Water Deprivation, Nitrogen Shortage, Weed Presence and Fungal Infection in Wheat. Agriculture 2016, 6, 24. https://doi.org/10.3390/agriculture6020024
Peteinatos GG, Korsaeth A, Berge TW, Gerhards R. Using Optical Sensors to Identify Water Deprivation, Nitrogen Shortage, Weed Presence and Fungal Infection in Wheat. Agriculture. 2016; 6(2):24. https://doi.org/10.3390/agriculture6020024
Chicago/Turabian StylePeteinatos, Gerassimos G., Audun Korsaeth, Therese W. Berge, and Roland Gerhards. 2016. "Using Optical Sensors to Identify Water Deprivation, Nitrogen Shortage, Weed Presence and Fungal Infection in Wheat" Agriculture 6, no. 2: 24. https://doi.org/10.3390/agriculture6020024
APA StylePeteinatos, G. G., Korsaeth, A., Berge, T. W., & Gerhards, R. (2016). Using Optical Sensors to Identify Water Deprivation, Nitrogen Shortage, Weed Presence and Fungal Infection in Wheat. Agriculture, 6(2), 24. https://doi.org/10.3390/agriculture6020024


