Productive Efficiency of Potato and Melon Growing Farms in Uzbekistan: A Two Stage Double Bootstrap Data Envelopment Analysis

Abstract
:1. Introduction
2. Methods
2.1. Data Envelopment Analysis
 and q outputs
  , which constitute a production set T:

 :
:

 such that:


 from Equation (4). SE gives information about returns to scale in crop production. It is calculated by dividing TEcrs by TEvrs [16] and measured using the following formula, which results in a score between zero and one:

 . If TEvrs and TENIRS are unequal and SE is less than one, the farm is said to be operating under increasing returns to scale (IRS). In contrast, if these scores are equal and SE is less than one, the farm is said to be operating under decreasing returns to scale (DRS).
2.2. Truncated Regression

 is the TEvrs score for each farm i, zi is the vector of factors which are assumed to impact on TEvrs (dependent variable). β is the vector of parameters and εi is the continuous, and identically and independently distributed random variable,
  with left-truncation at
  .
.2.3. Bootstrapping in DEA
3. Data

| Variable | Units | Potatoes | H-W Melons | ||
|---|---|---|---|---|---|
| Mean | SD | Mean | SD | ||
| Output | Tons | 20.4 | 17.76 | 9.45 | 8.75 |
| Land | ha | 1 | 0.8 | 0.5 | 0.5 |
| Labor | Man-days | 906 | 729.6 | 450.5 | 457 |
| Seeds | Kg | 3125 | 2536.8 | 2.5 | 2 |
| Nitrogen fertilizer | Kg | 184 | 150.4 | 43.5 | 49 |
| Diesel fuel | Kg | 299 | 244 | 94.5 | 98.5 |
| Other expenses | 1000 UZS | 76 | 62.4 | 34 | 32.5 |
4. Results and Discussion
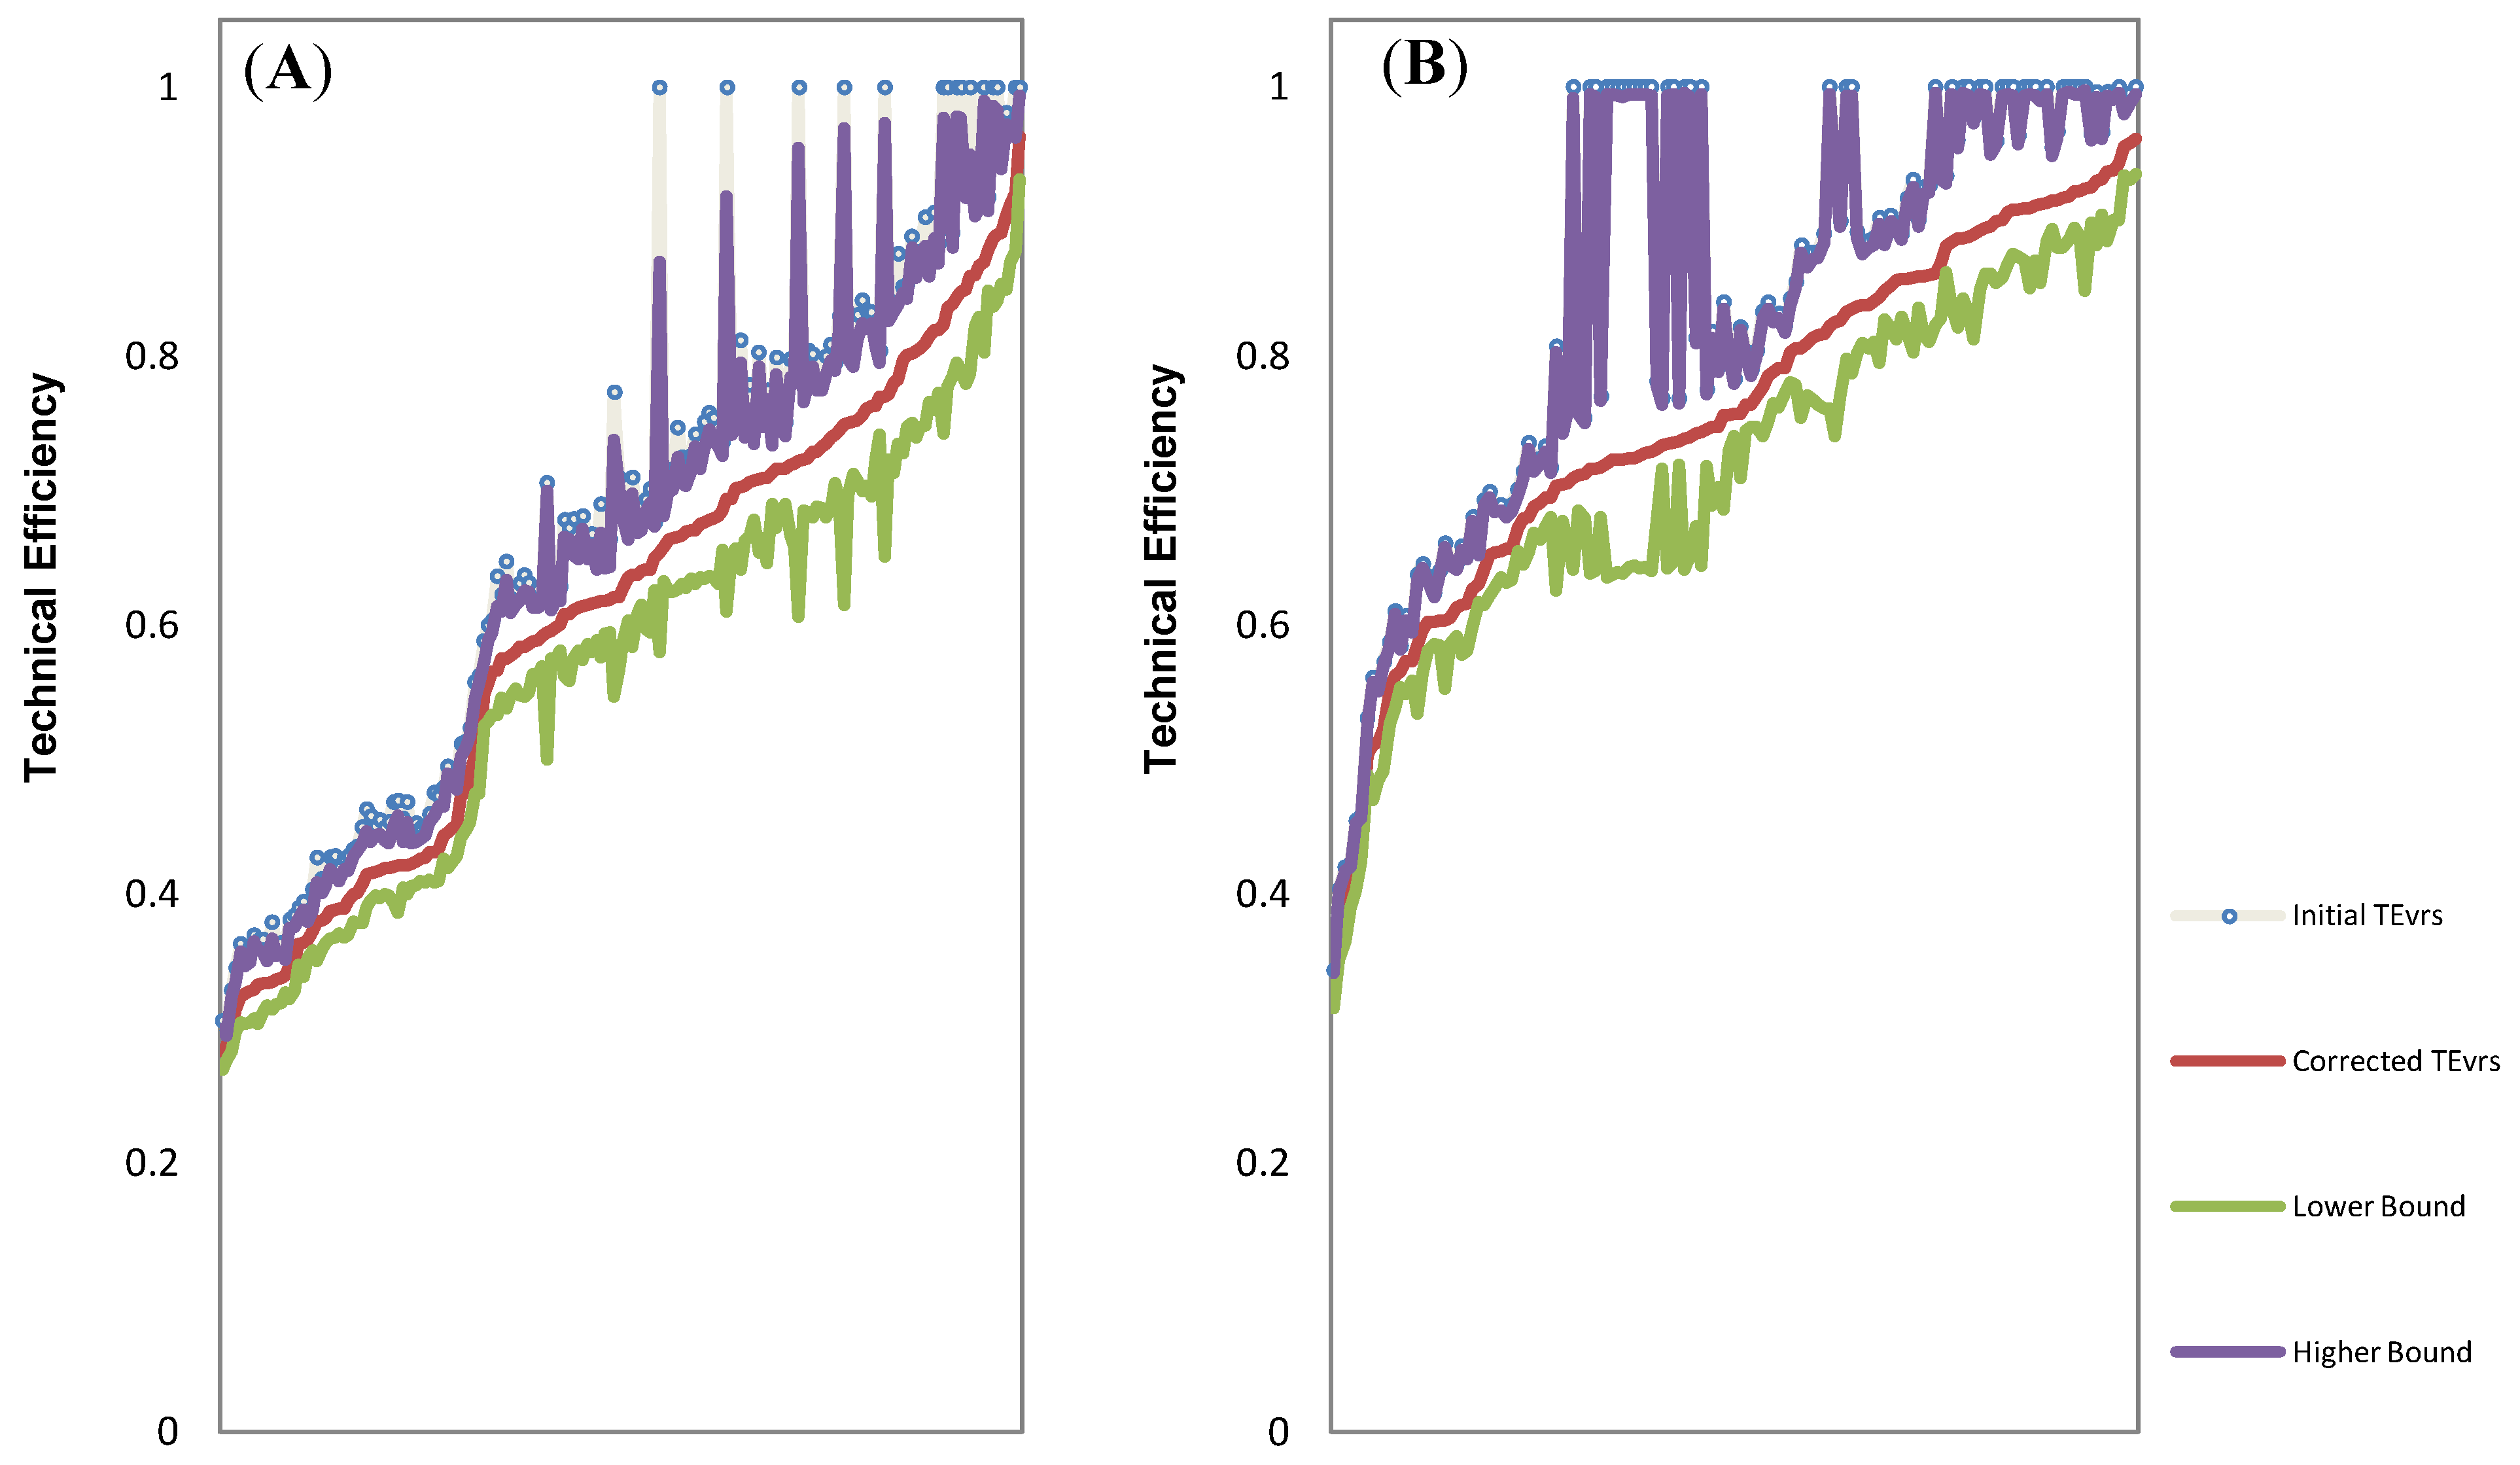
4.1. Technical Efficiency
| Initial TECRS | Initial TEVRS | % of farms with TEVRS = 1 | Bias-Corrected TEVRS Single | Lower-Bound 95% CI Single | Higher-Bound 95% CI Single | |
|---|---|---|---|---|---|---|
| Potato Producing Farms | ||||||
| Location | ||||||
| Pooled Sample | 0.63 | 0.67 | 8.43 | 0.59 | 0.58 | 0.66 |
| Khorezm Region | 0.64 | 0.68 | 9.57 | 0.59 | 0.57 | 0.67 |
| Fergana Region | 0.68 | 0.75 | 25.4 | 0.68 | 0.65 | 0.76 |
| Grown Area | ||||||
| Up to 1.0 | 0.67 | 0.73 | 34.62 | 0.64 | 0.62 | 0.72 |
| 1.1 and Above | 0.64 | 0.74 | 24.1 | 0.60 | 0.59 | 0.73 |
| Bonitet Score | ||||||
| Up to 50.0 | 0.80 | 0.80 | 33.33 | 0.71 | 0.67 | 0.79 |
| 51.0–60.0 | 0.63 | 0.66 | 7.46 | 0.55 | 0.54 | 0.65 |
| 61.0 and Above | 0.69 | 0.75 | 14.67 | 0.66 | 0.63 | 0.74 |
| H-W Melon Producing Farms | ||||||
| Location | ||||||
| Pooled Sample | 0.78 | 0.84 | 29.66 | 0.76 | 0.72 | 0.83 |
| Khorezm Region | 0.82 | 0.85 | 33.9 | 0.77 | 0.73 | 0.85 |
| Fergana Region | 0.81 | 0.91 | 51.85 | 0.80 | 0.73 | 0.90 |
| Grown Area | ||||||
| Up to 1.0 | 0.78 | 0.84 | 28.68 | 0.75 | 0.71 | 0.83 |
| 1.1 and Above | 0.86 | 1.00 | 89.00 | 0.99 | 0.98 | 1.00 |
| Bonitet Score | ||||||
| Up to 50.0 | 0.83 | 0.88 | 52.78 | 0.75 | 0.69 | 0.87 |
| 51.0–60.0 | 0.79 | 0.86 | 36.96 | 0.75 | 0.69 | 0.85 |
| 61.0 and Above | 0.86 | 0.91 | 44.44 | 0.85 | 0.80 | 0.91 |
4.2. Scale Efficiency
| Khorezm Region (North-Western) | Fergana Region (Eastern) | ||||||||
|---|---|---|---|---|---|---|---|---|---|
| SE | SE = 1 | DRS | IRS | SE | SE = 1 | DRS | IRS | ||
| Potatoes | 0.96 | 39.1 | 53.9 | 7 | 0.89 | 9.5 | 74.6 | 15.9 | |
| H and W Melons | 0.96 | 35.6 | 39.8 | 24.6 | 0.9 | 29.6 | 48.1 | 22.2 | |
4.3. Factors Explaining Differences in DEA Efficiency Scores
| Variable | Potato | H−W Melons | ||
|---|---|---|---|---|
| Parameter Estimate | Parameter Estimate | |||
| (S.E.) | (S.E.) | |||
| (95% C.I.) | (95% C.I.) | |||
| Constant | 4.229 *** | 1.91 *** | ||
| 0.579 | 0.342 | |||
| 3.108 | 5.349 | 1.288 | 2.892 | |
| Region | 0.115 | 0.141 | ||
| 0.189 | 0.134 | |||
| −0.243 | 0.444 | −0.289 | 0.398 | |
| Bonitet score | −0.017 ** | −0.011 ** | ||
| 0.007 | 0.005 | |||
| −0.0321 | −0.004 | −0.019 | 0.05 | |
| Farm size | −0.009 * | 0.004 | ||
| 0.005 | 0.003 | |||
| −0.018 | 0.002 | −0.01 | 0.01 | |
| Water availability | −0.711 *** | −0.326 *** | ||
| 0.239 | 0.117 | |||
| −1.149 | −0.254 | −0.535 | 1.956 | |
| Crop diversification index a | −0.452 ** | −0.079 | ||
| 0.182 | 0.097 | |||
| −0.798 | −0.115 | −0.227 | 0.226 | |
| Dependency ratio b | −0.416 ** | −0.103 * | ||
| 0.175 | 0.061 | |||
| −0.769 | −0.1 | −0.203 | 0.569 | |
| Potential to work in larger land area | −0.064 * | 0.109 | ||
| 0.035 | 0.105 | |||
| −0.13 | 0.004 | −0.304 | 0.341 | |
| Distance to market | −0.173 * | 0.0001 | ||
| 0.097 | 0.018 | |||
| −0.343 | 0.034 | −0.039 | 0.049 | |
| Chemicals | 0.248 ** | |||
| 0.113 | ||||
| −1.423 | 0.451 | |||
| Obsolete canal | 0.057 | |||
| 0.173 | ||||
| −0.278 | 0.368 | |||

5. Conclusions
Conflicts of Interest
Acknowledgements
Appendix
| Variable | Unit | Potatoes | H-W Melons | ||
|---|---|---|---|---|---|
| Mean | SD | Mean | SD | ||
| Farm Characteristics | |||||
| Region | Dummy
(Khorezm = 1; Fergana = 0) | 0.65 | 0.48 | 0.81 | 0.39 |
| Bonitet score | Index (1-100) | 59 | 12 | 60 | 12 |
| Farm size | Ha | 17.3 | 19 | 14.6 | 17.5 |
| Water availability | Dummy
(Received Enough Water = 1; Not Enough = 0) | 0.66 | 0.47 | 0.7 | 0.46 |
| Crop Diversification index | Index | 0.64 | 0.43 | 0.79 | 0.85 |
| Dependency ratio | Ratio | 1.09 | 1 | 1.1 | 0.94 |
| Potential to work in larger land area | Dummy
(Yes = 1; No = 0) | 0.54 | 0.5 | 0.57 | 0.5 |
| Chemicals | Dummy
(Yes = 1; No = 0) | 0.54 | 0.5 | 0.63 | 0.49 |
| Obsolete canal | Dummy
(Yes = 1; No = 0) | 0.63 | 0.48 | 0.52 | 0.5 |
| Distance to market | Km | 9.61 | 2.63 | 9.86 | 2.92 |
References
- Bokusheva, R.; Hockmann, H.; Kumbhakar, S.C. Dynamics of productivity and technical efficiency in Russian agriculture. Eur. Rev. Agric. Econ. 2012, 39, 611–637. [Google Scholar] [CrossRef]
- Swinnen, J.F.M.; Vranken, L. Reforms and agricultural productivity in Central and Eastern Europe and the Former Soviet Republics: 1989–2005. J. Prod. Anal. 2010, 33, 241–258. [Google Scholar] [CrossRef]
- Wandel, J.; Pieniadz, A.T. What is success and what is failure of transition? A critical review of two decades of agricultural reform in the Europe and Central Asia region. Post Communist Econ. 2011, 23, 139–162. [Google Scholar] [CrossRef]
- Center for Economic Research (CER), Almanac of Uzbekistan 2011; Print Media: Tashkent, Uzbekistan, 2011.
- Olimjanov, O.; Mamarasulov, K. Economic and Social Context of the Vegetable System in Uzbekistan. In Increasing Market Oriented Vegetable Production in Central Asia and the Caucasus through Collaborative Research and Development; Kalb, T., Mavlyanova, R.F., Eds.; AVRDC publication: Tashkent, Uzbekistan, 2006; pp. 91–95. [Google Scholar]
- Amara, N.; Traoré, N.; Landry, R.; Romain, R. Technical efficiency and farmers’attitudes toward technological innovation: The case of the potato farmers in Quebec. Can. J. Agric. Econ. 1999, 47, 31–43. [Google Scholar]
- Adewumi, M.O.; Adebayo, F.A. Profitability and technical efficiency of sweet potato production in Nigeria. J. Rural Dev. 2008, 31, 105–120. [Google Scholar]
- Nyagaka, D.O.; Obare, G.A.; Omiti, J.M.; Nguyo, W. Technical efficiency in resource use: Evidence from smallholder Irish potato farmers in Nyandarua North District, Kenya. Afr. J. Agric. Res. 1984, 5, 1179–1186. [Google Scholar]
- Ibrahim, U.W. Analysis of Production Efficiency and Profitability of Watermelon in Kaga and Kukawa Local Government Areas of Borno State. Master Thesis, Ahmadu Bello University, Zaria, Nigeria, 2011. [Google Scholar]
- Charnes, A.; Cooper, W.W.; Rhodes, E. Measuring the efficiency of decision making units. Eur. J. Oper. Res. 1978, 2, 429–444. [Google Scholar] [CrossRef]
- Charnes, A.; Cooper, W.W.; Karwan, K.R.; Wallace, W.A. A chance-constrained goal programming model to evaluate response resources for marine pollution disasters. J. Environ. Econ. Manag. 1979, 6, 244–274. [Google Scholar] [CrossRef]
- Charnes, A.; Cooper, W.W.; Rhodes, E. Evaluating program and managerial efficiency: An application of data envelopment analysis to program follow through. Manag. Sci. 1981, 27, 668–697. [Google Scholar] [CrossRef]
- Banker, R.D.; Charnes, A.; Cooper, W.W. Some models for estimating technical and scale inefficiencies in data envelopment analysis. Manag. Sci. 1984, 30, 1078–1092. [Google Scholar] [CrossRef]
- Farrell, M.J. The measurement of productive efficiency. J. R. Stat. Soc. 1957, 120, 253–290. [Google Scholar]
- Shephard, R.W.; Gale, D.; Kuhn, H.W. Theory of Cost and Production Functions; Princeton University Press: Princeton, NJ, USA, 1970. [Google Scholar]
- Coelli, T.J.; Prasada Rao, D.S.P.; O’Donnell, C.J.; Battese, G.E. An Introduction to Efficiency and Productivity Analysis, 2nd ed.; Springer: New York, NY, USA, 2005. [Google Scholar]
- Simar, L.; Wilson, P.W. Estimation and inference in two-stage, semi-parametric models of production processes. J. Econom. 2007, 136, 31–64. [Google Scholar] [CrossRef]
- Simar, L.; Wilson, P. Sensitivity analysis of efficiency scores: How to bootstrap in nonparametric frontier models. Manag. Sci. 1998, 44, 49–61. [Google Scholar] [CrossRef]
- Simar, L.; Wilson, P.W.A. General methodology for bootstrapping in non-parametric frontier models. J. Appl. Stat. 2000, 27, 779–802. [Google Scholar] [CrossRef]
- Greene, W.H. The Econometric Approach to Efficiency Analysis. In The Measurement of Productive Efficiency and Productivity Growth; Fried, C.A.H., Lovell, K., Schmidt, S., Eds.; Oxford University Press: Oxford, UK, 2008; pp. 92–250. [Google Scholar]
- Wilson, P.W. FEAR: A software package for frontier efficiency analysis with R. Socio. Econ. Plan. Sci. 2008, 42, 247–254. [Google Scholar] [CrossRef]
- Tischbein, B.; Awan, U.K.; Abdullaev, I.; Bobojonov, I.; Conrad, C.; Jabborov, H.; Forkutsa, I.; Ibrakhimov, M.; Poluasheva, G. Water Management in Khorezm: Current Situation and Options for Improvement (Hydrological Perspective). In Cotton, Water, Salts and Soums—Economic and Ecological Restructuring in Khorezm, Uzbekistan; Martius, C., Lamers, J.P.A., Vlek, P.L.G., Eds.; Springer: Heidelberg, Germany, 2012; pp. 69–92. [Google Scholar]
© 2013 by the authors; licensee MDPI, Basel, Switzerland. This article is an open access article distributed under the terms and conditions of the Creative Commons Attribution license (http://creativecommons.org/licenses/by/3.0/).
Share and Cite
Karimov, A. Productive Efficiency of Potato and Melon Growing Farms in Uzbekistan: A Two Stage Double Bootstrap Data Envelopment Analysis. Agriculture 2013, 3, 503-515. https://doi.org/10.3390/agriculture3030503
Karimov A. Productive Efficiency of Potato and Melon Growing Farms in Uzbekistan: A Two Stage Double Bootstrap Data Envelopment Analysis. Agriculture. 2013; 3(3):503-515. https://doi.org/10.3390/agriculture3030503
Chicago/Turabian StyleKarimov, Aziz. 2013. "Productive Efficiency of Potato and Melon Growing Farms in Uzbekistan: A Two Stage Double Bootstrap Data Envelopment Analysis" Agriculture 3, no. 3: 503-515. https://doi.org/10.3390/agriculture3030503
APA StyleKarimov, A. (2013). Productive Efficiency of Potato and Melon Growing Farms in Uzbekistan: A Two Stage Double Bootstrap Data Envelopment Analysis. Agriculture, 3(3), 503-515. https://doi.org/10.3390/agriculture3030503