Evaluating Alternative Methods of Soil Erodibility Mapping in the Mediterranean Island of Crete


Abstract
:1. Introduction
- To evaluate the effectiveness of human expertise in estimating the K-layer in the lack of soil maps;
- To compare K-layers calculated by two alternative methods, i.e., from geologic or soil data; and
- To compare soil erosion risk maps created with the RUSLE model for each of the alternatives of the K-layer (see point 2).
2. Materials and Methods
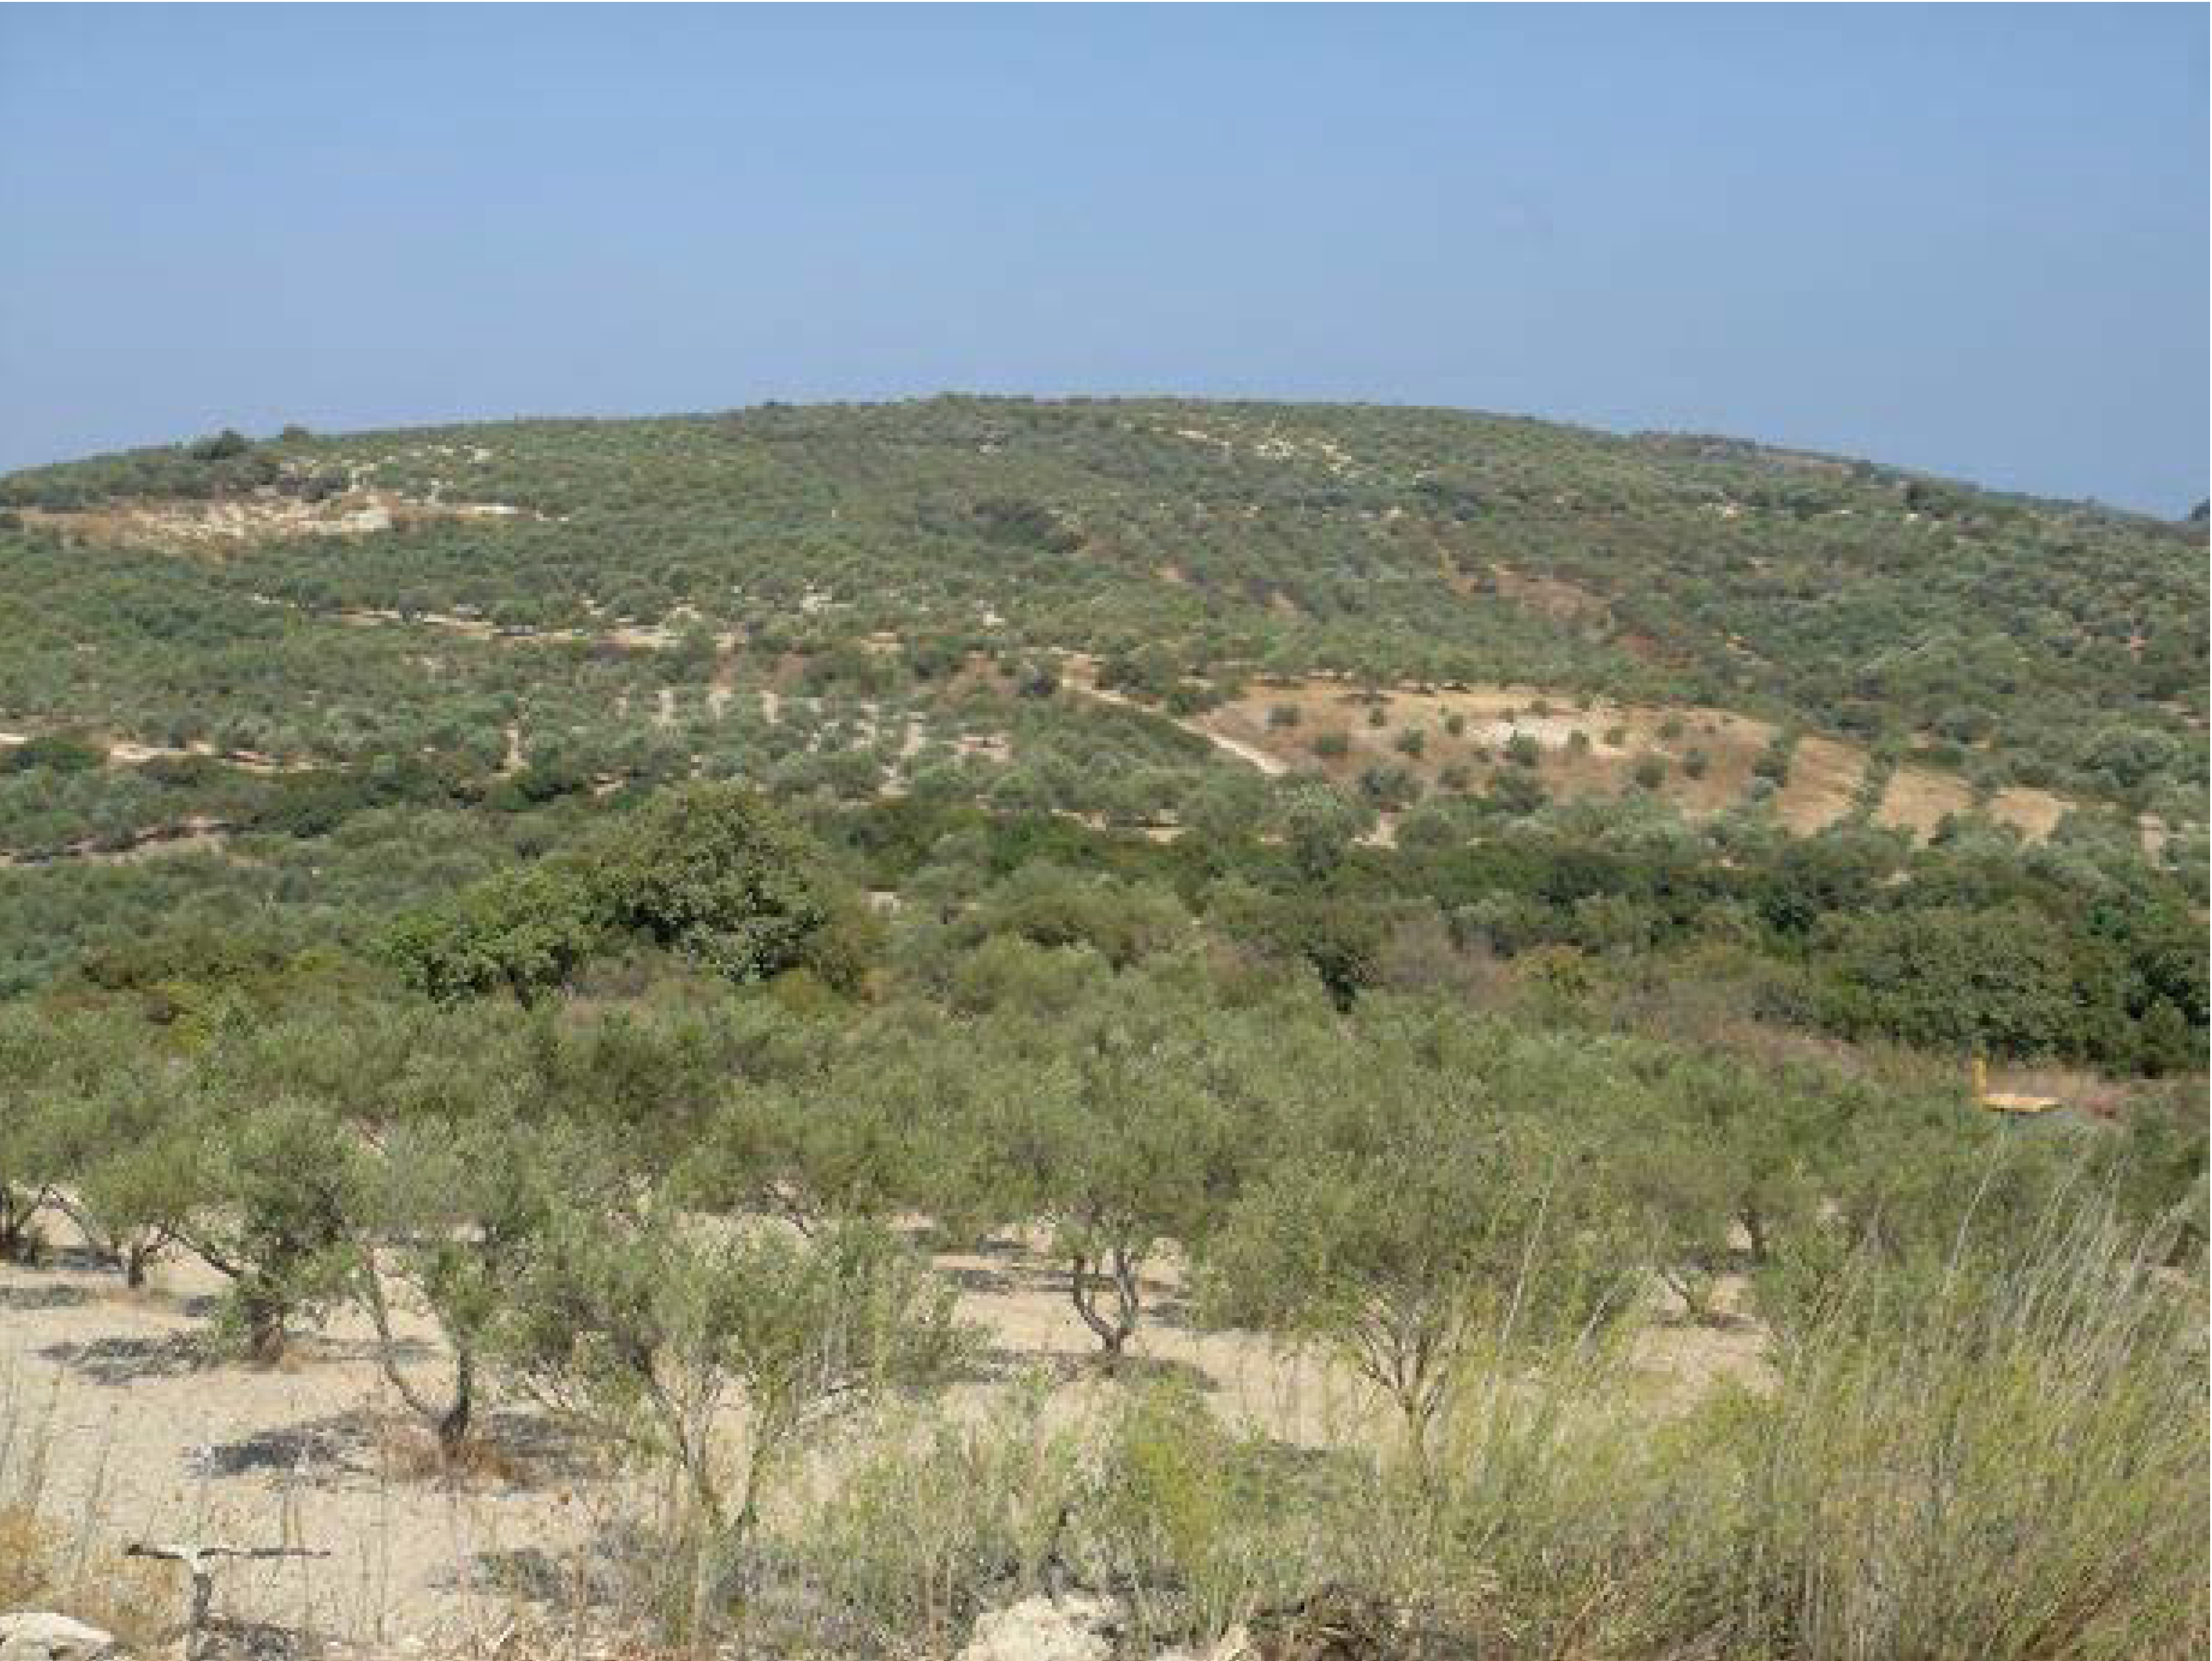
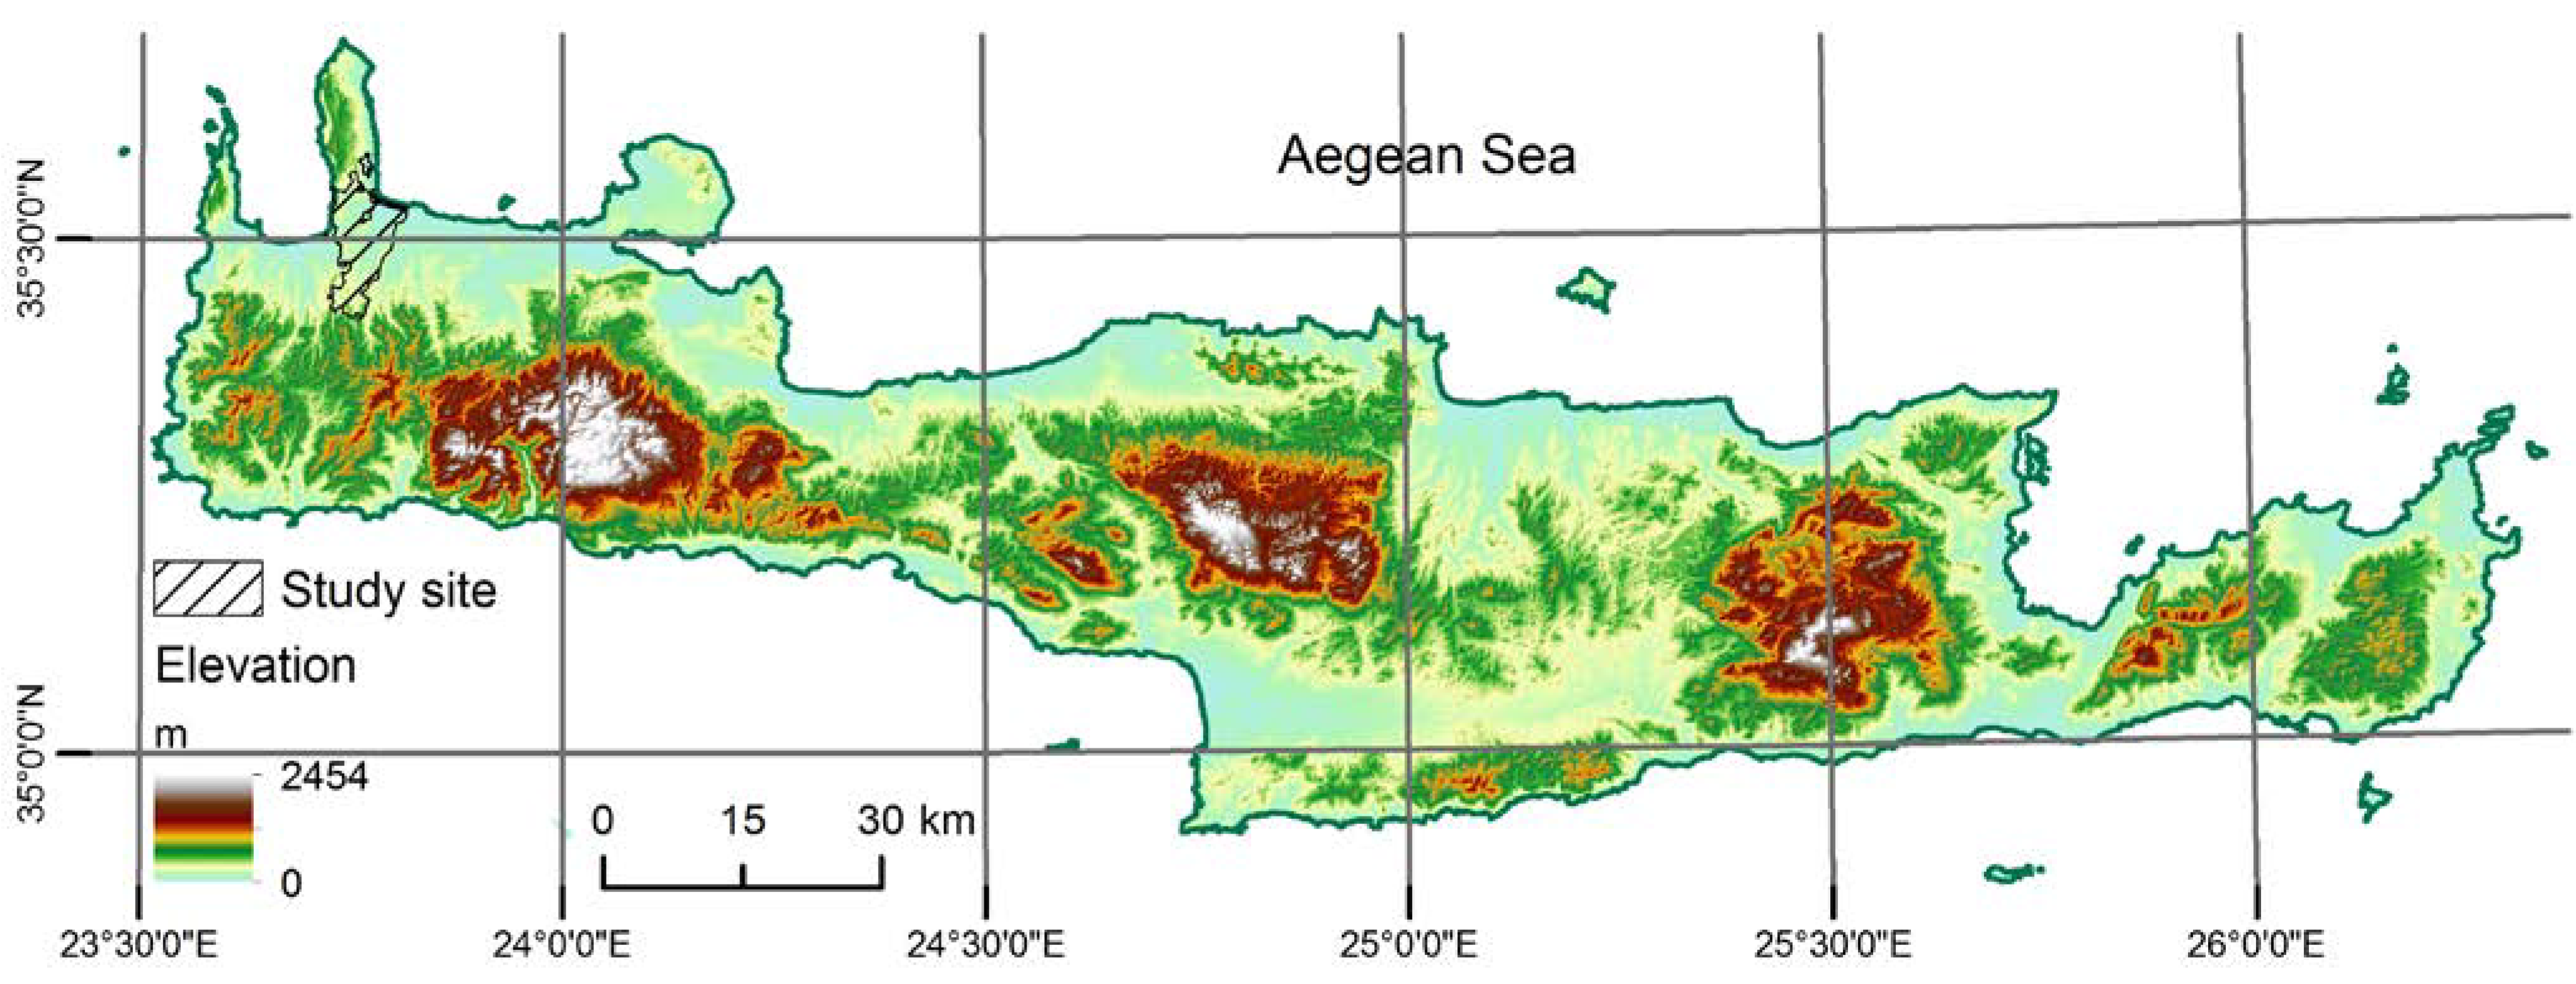
2.1. Study Area

2.2. Dataset Description
- Geological map sheets of the area on a 1:50,000 scale. The map sheets were scanned and merged into a mosaic in order to derive a single geologic background. Then, the outlines of the geologic units were digitized;
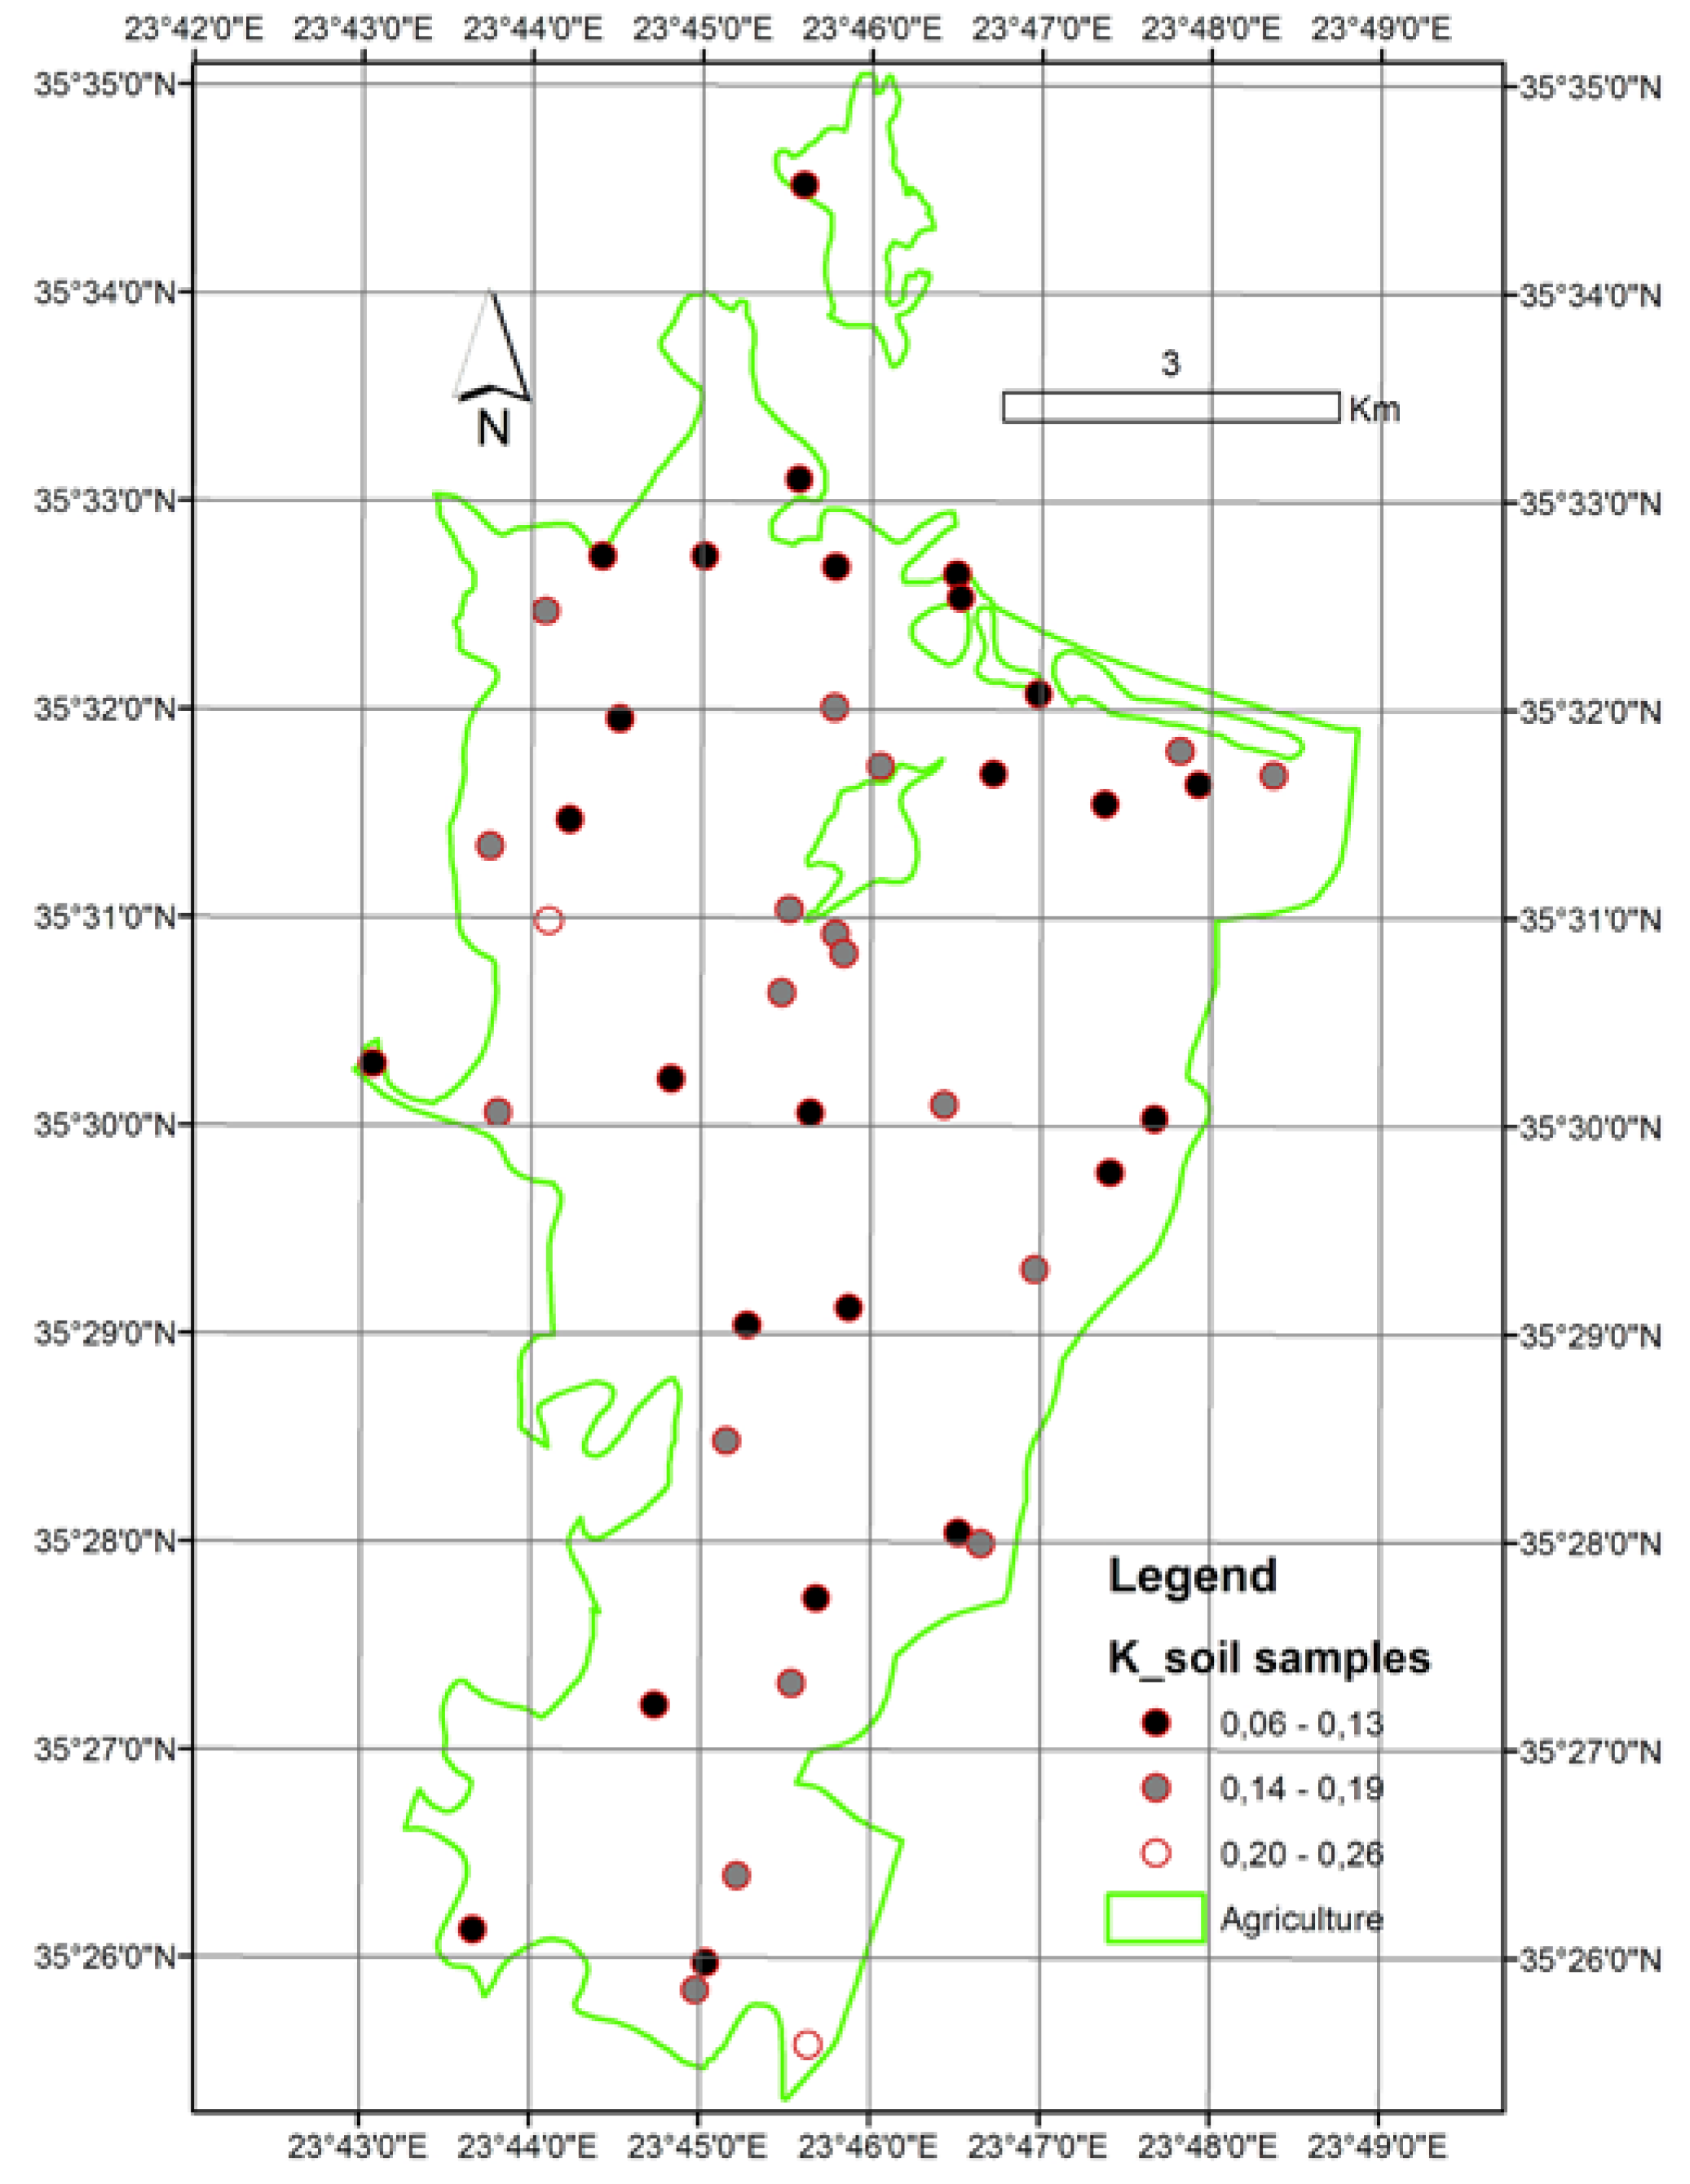
- Soil data retrieved with a field survey at 45 sampled locations randomly selected throughout the study area after stratification according to the geologic units. The density of sampling was estimated in one sample per 1.5 km2 on average. It was estimated that sampled points were allocated into homogeneous sub-areas and, thus, were representative of their sites.
- The samples were extracted from the topsoil (depth <15 cm). Fine silt and sand percentage, organic matter content, permeability class and structure class were calculated in the laboratory after international soil analysis standards;
- A yearly distribution of the mean monthly rainfall in the study area calculated from 22-year long recordings (1971–1992) and derived from two meteorological stations in the area, namely Drapanias and Tavronitis stations;
- A digital elevation model (DEM) of the study area, created from available point raster files with 20 m resolution as (x,y,z) files, with non-linear rubber sheeting and an output cell size of 4 m. The RMS error in z (elevation) was found to be 5.21 m after testing at 33 trigonometric points; and
- A QuickBird satellite image acquired on November 16, 2002, covering a swath of 16.5 km by 16.5 km, with a good geometric accuracy. The image was the result of orthorectification and fusion of the panchromatic (gray scale) and multispectral components in the laboratory. The final product was a 0.62 m pixel size image with four spectral bands.
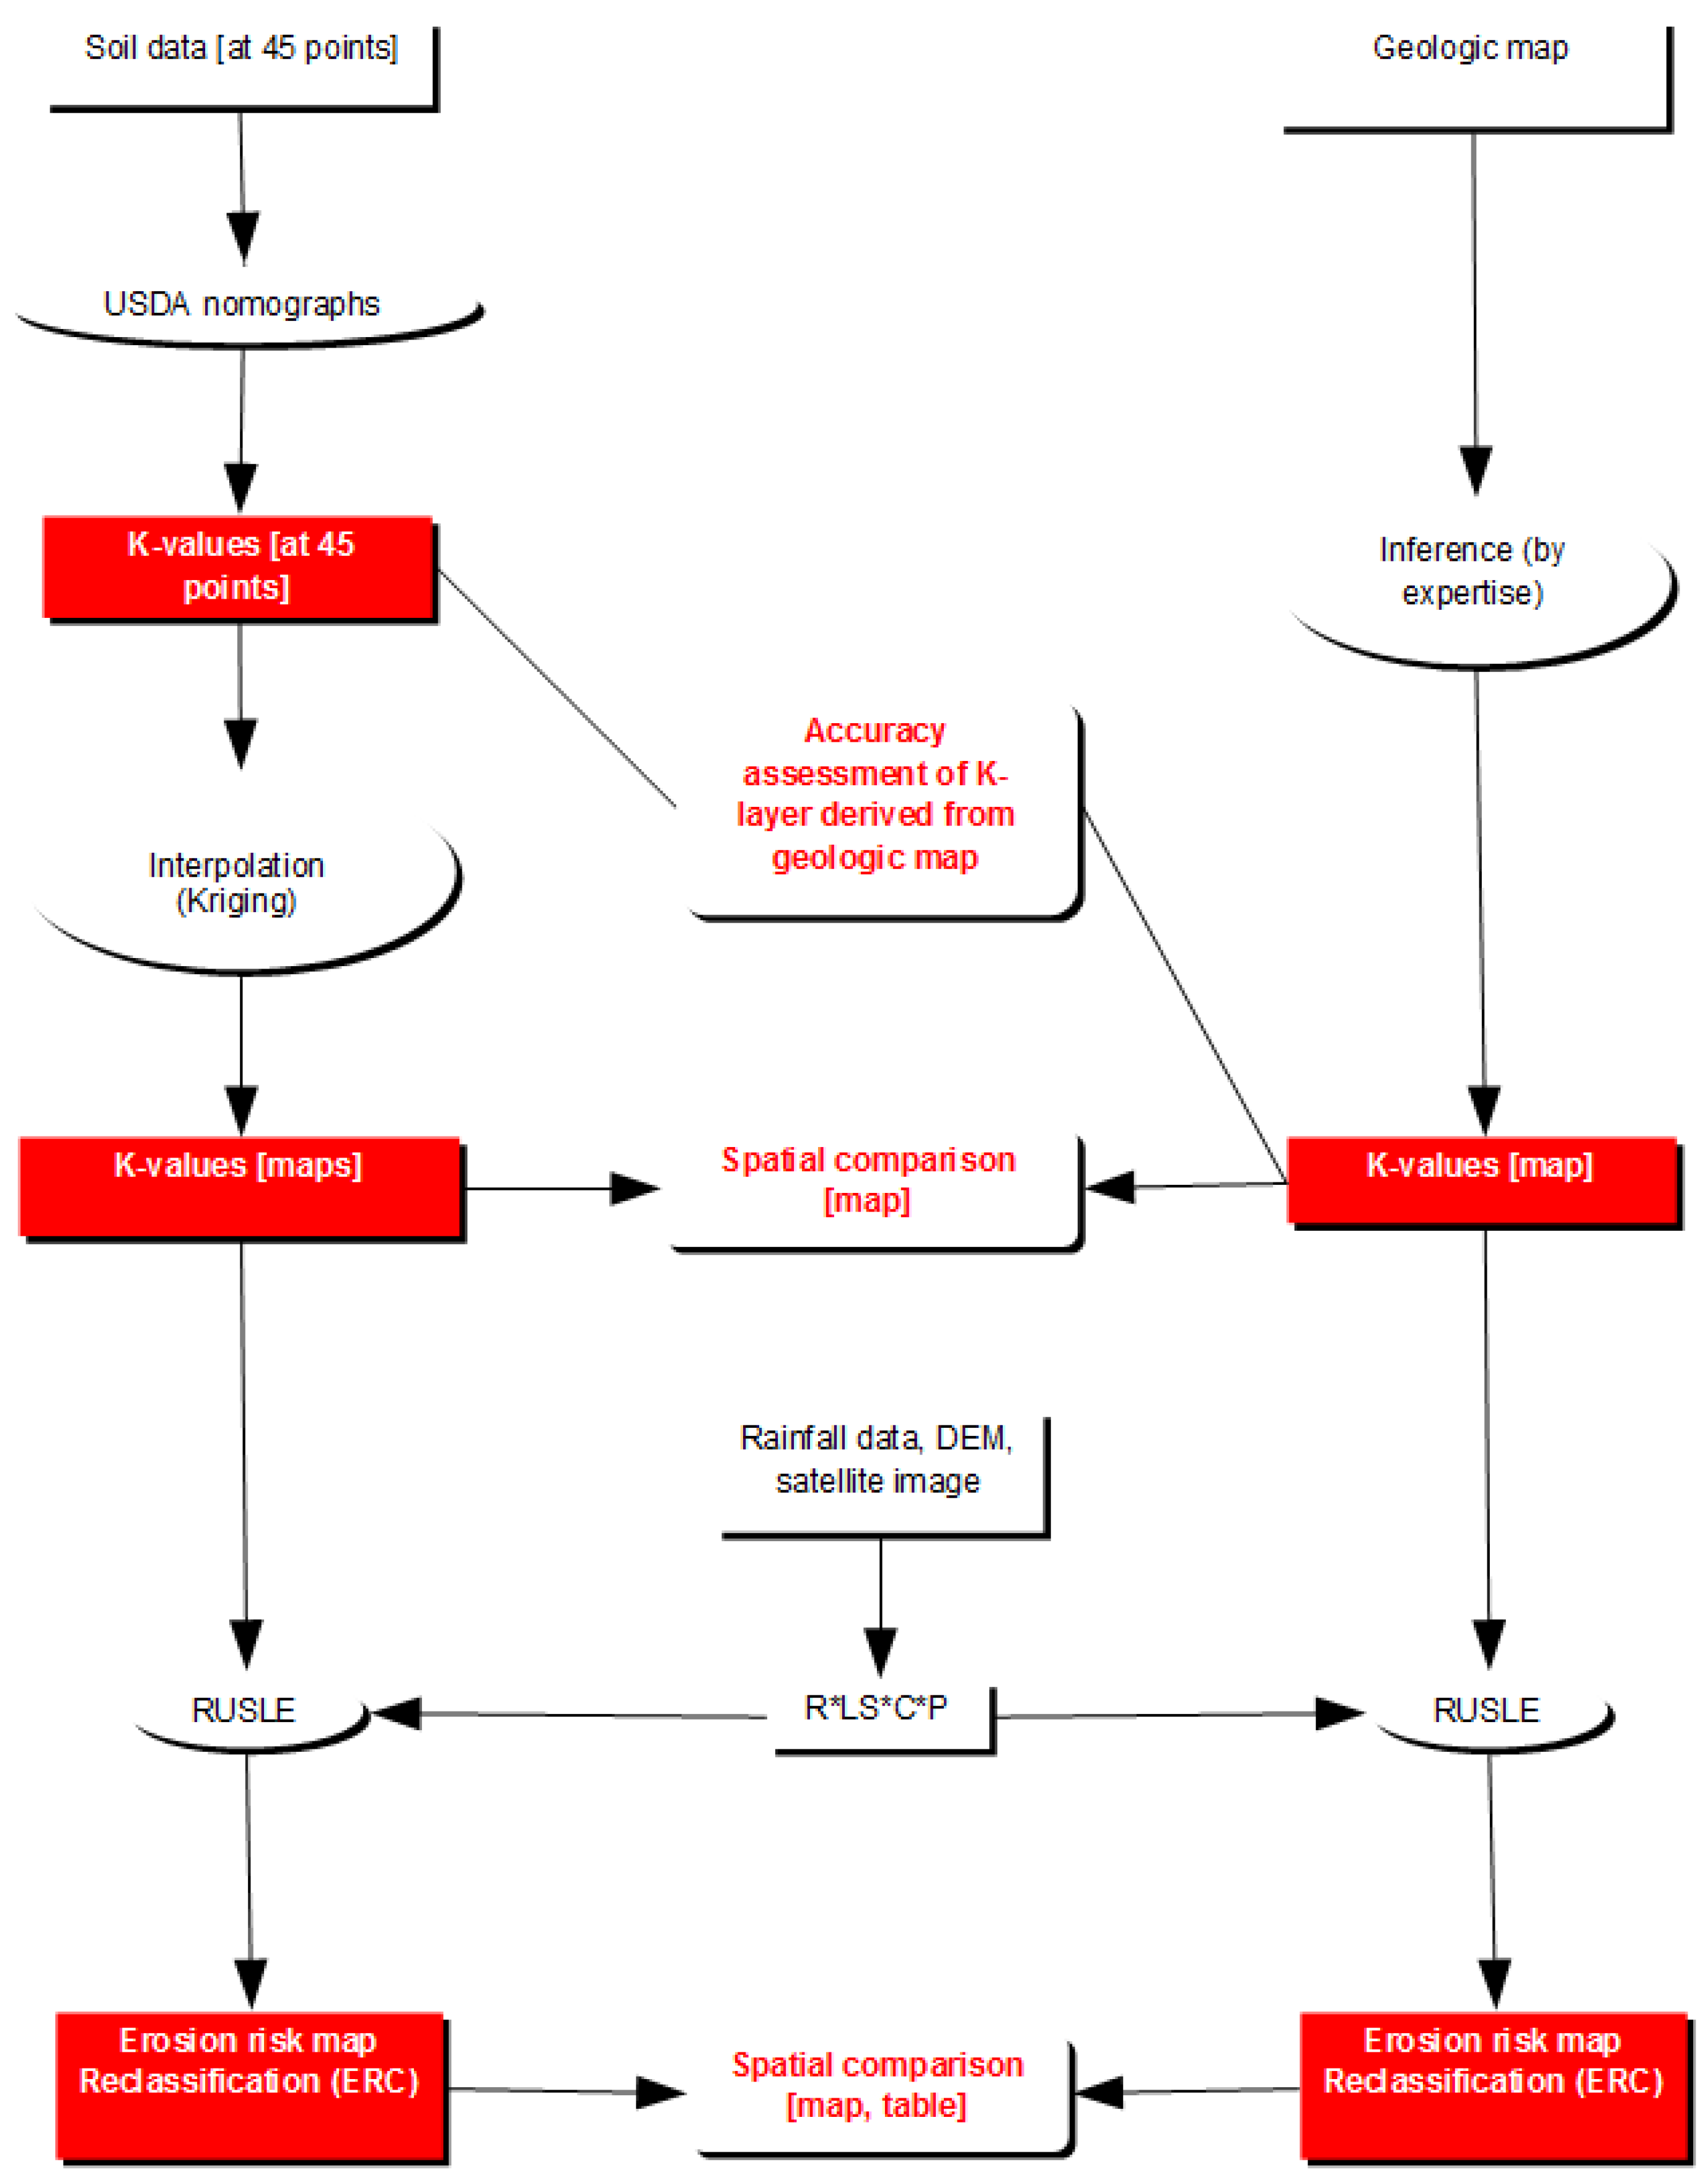
2.3. Methodology Overview
2.4. K-Values Derived from the Geological Map
- Determination of the soil texture class for each type of geological formation found in the study site based on soil genesis rules [22]. Soil texture is a parameter strongly influenced by the process of soil formation, due to rock weathering. It must be noted, though, that different geologic formations may result in the same or different soil textures.
- Conversion of the soil texture value into a K-value according to the knowledge of the local conditions, especially regarding physiographic processes and levels of organic matter content in the area. The physiography of Kolymvari is characterized as hilly to semi-mountainous, while the organic matter levels range between 0% and 6% (3% on average).

| Parent material (geologic map) | Soil texture * | K-value |
|---|---|---|
| Alluvial deposits | SL–L | 0.15 |
| Limestone | C, SiC | 0.4 |
| Peridotite | CL–C | 0.5 |
| Granite | S–SL | 0.2 |
| Schists | L | 0.7 |
| Gneiss | S, LS,L | 0.3 |
| Tertiary deposits | SL–L | 0.15 |
2.5. K-Values Derived from the Soil Samples
2.6. Generation of K-Layers
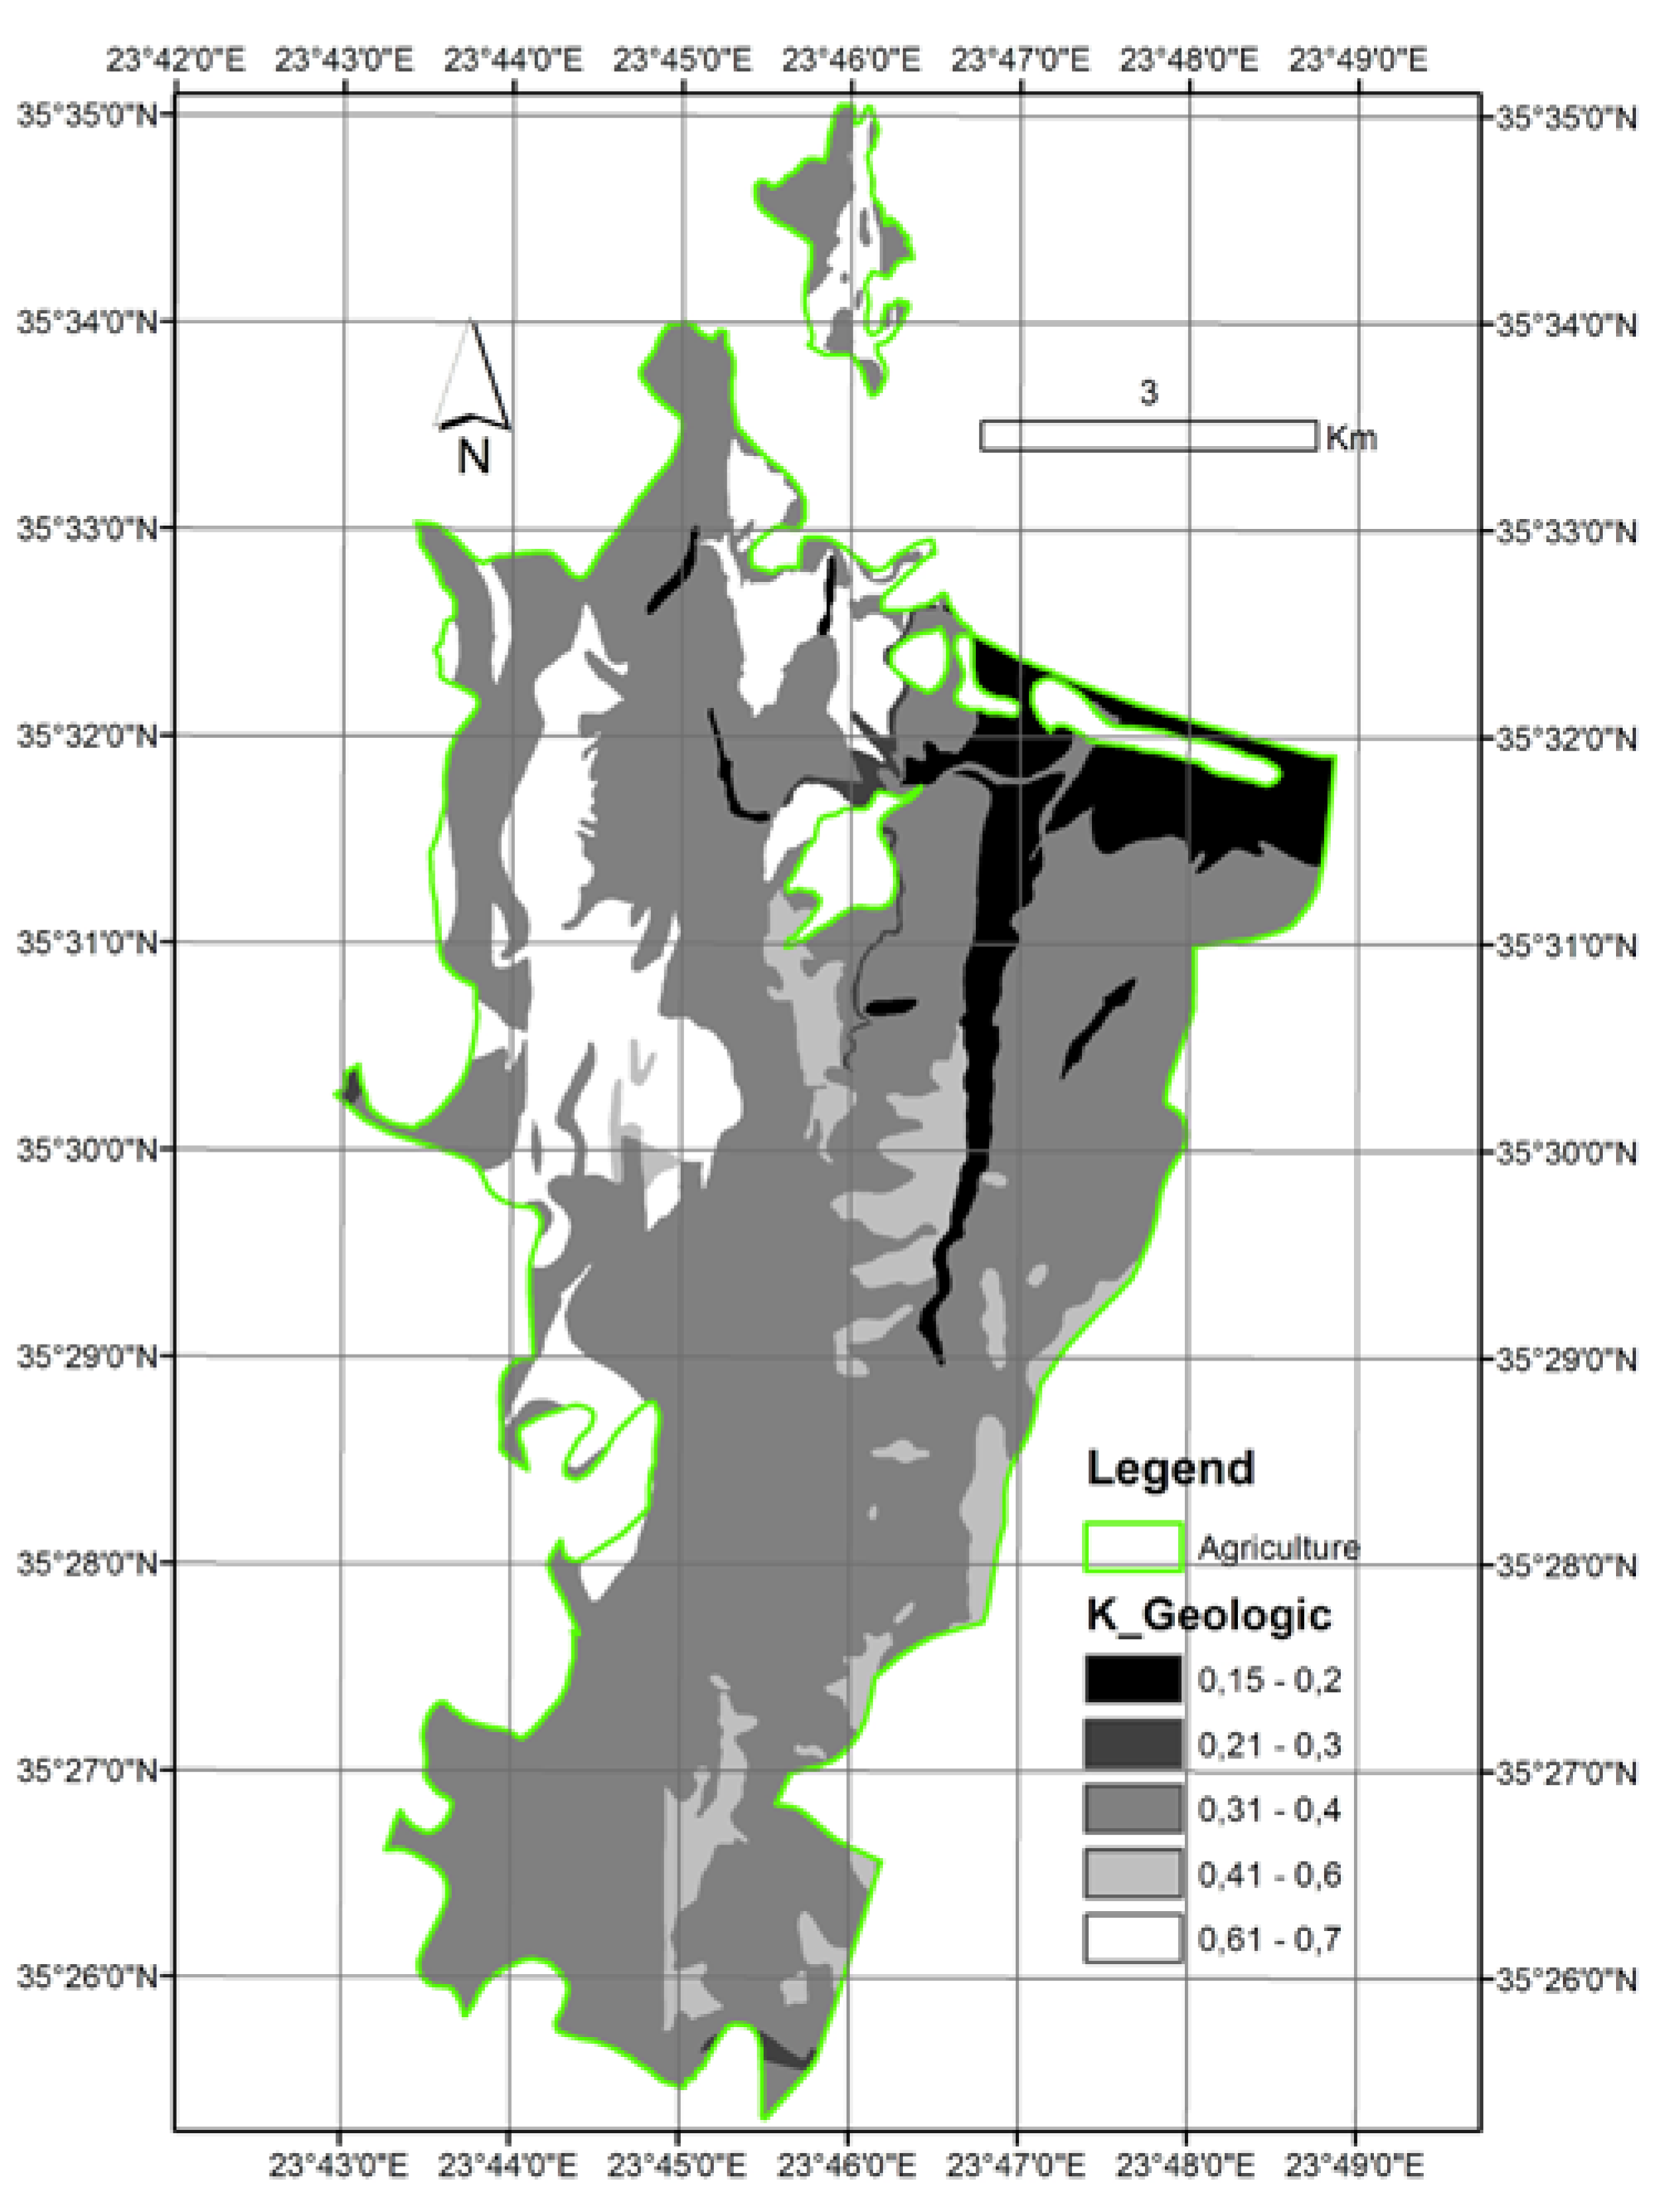
- A layer where a single K-value was assigned to each geologic formation according to the interpretation made (based on soil genesis rules) by the soil expert (Figure 5); and
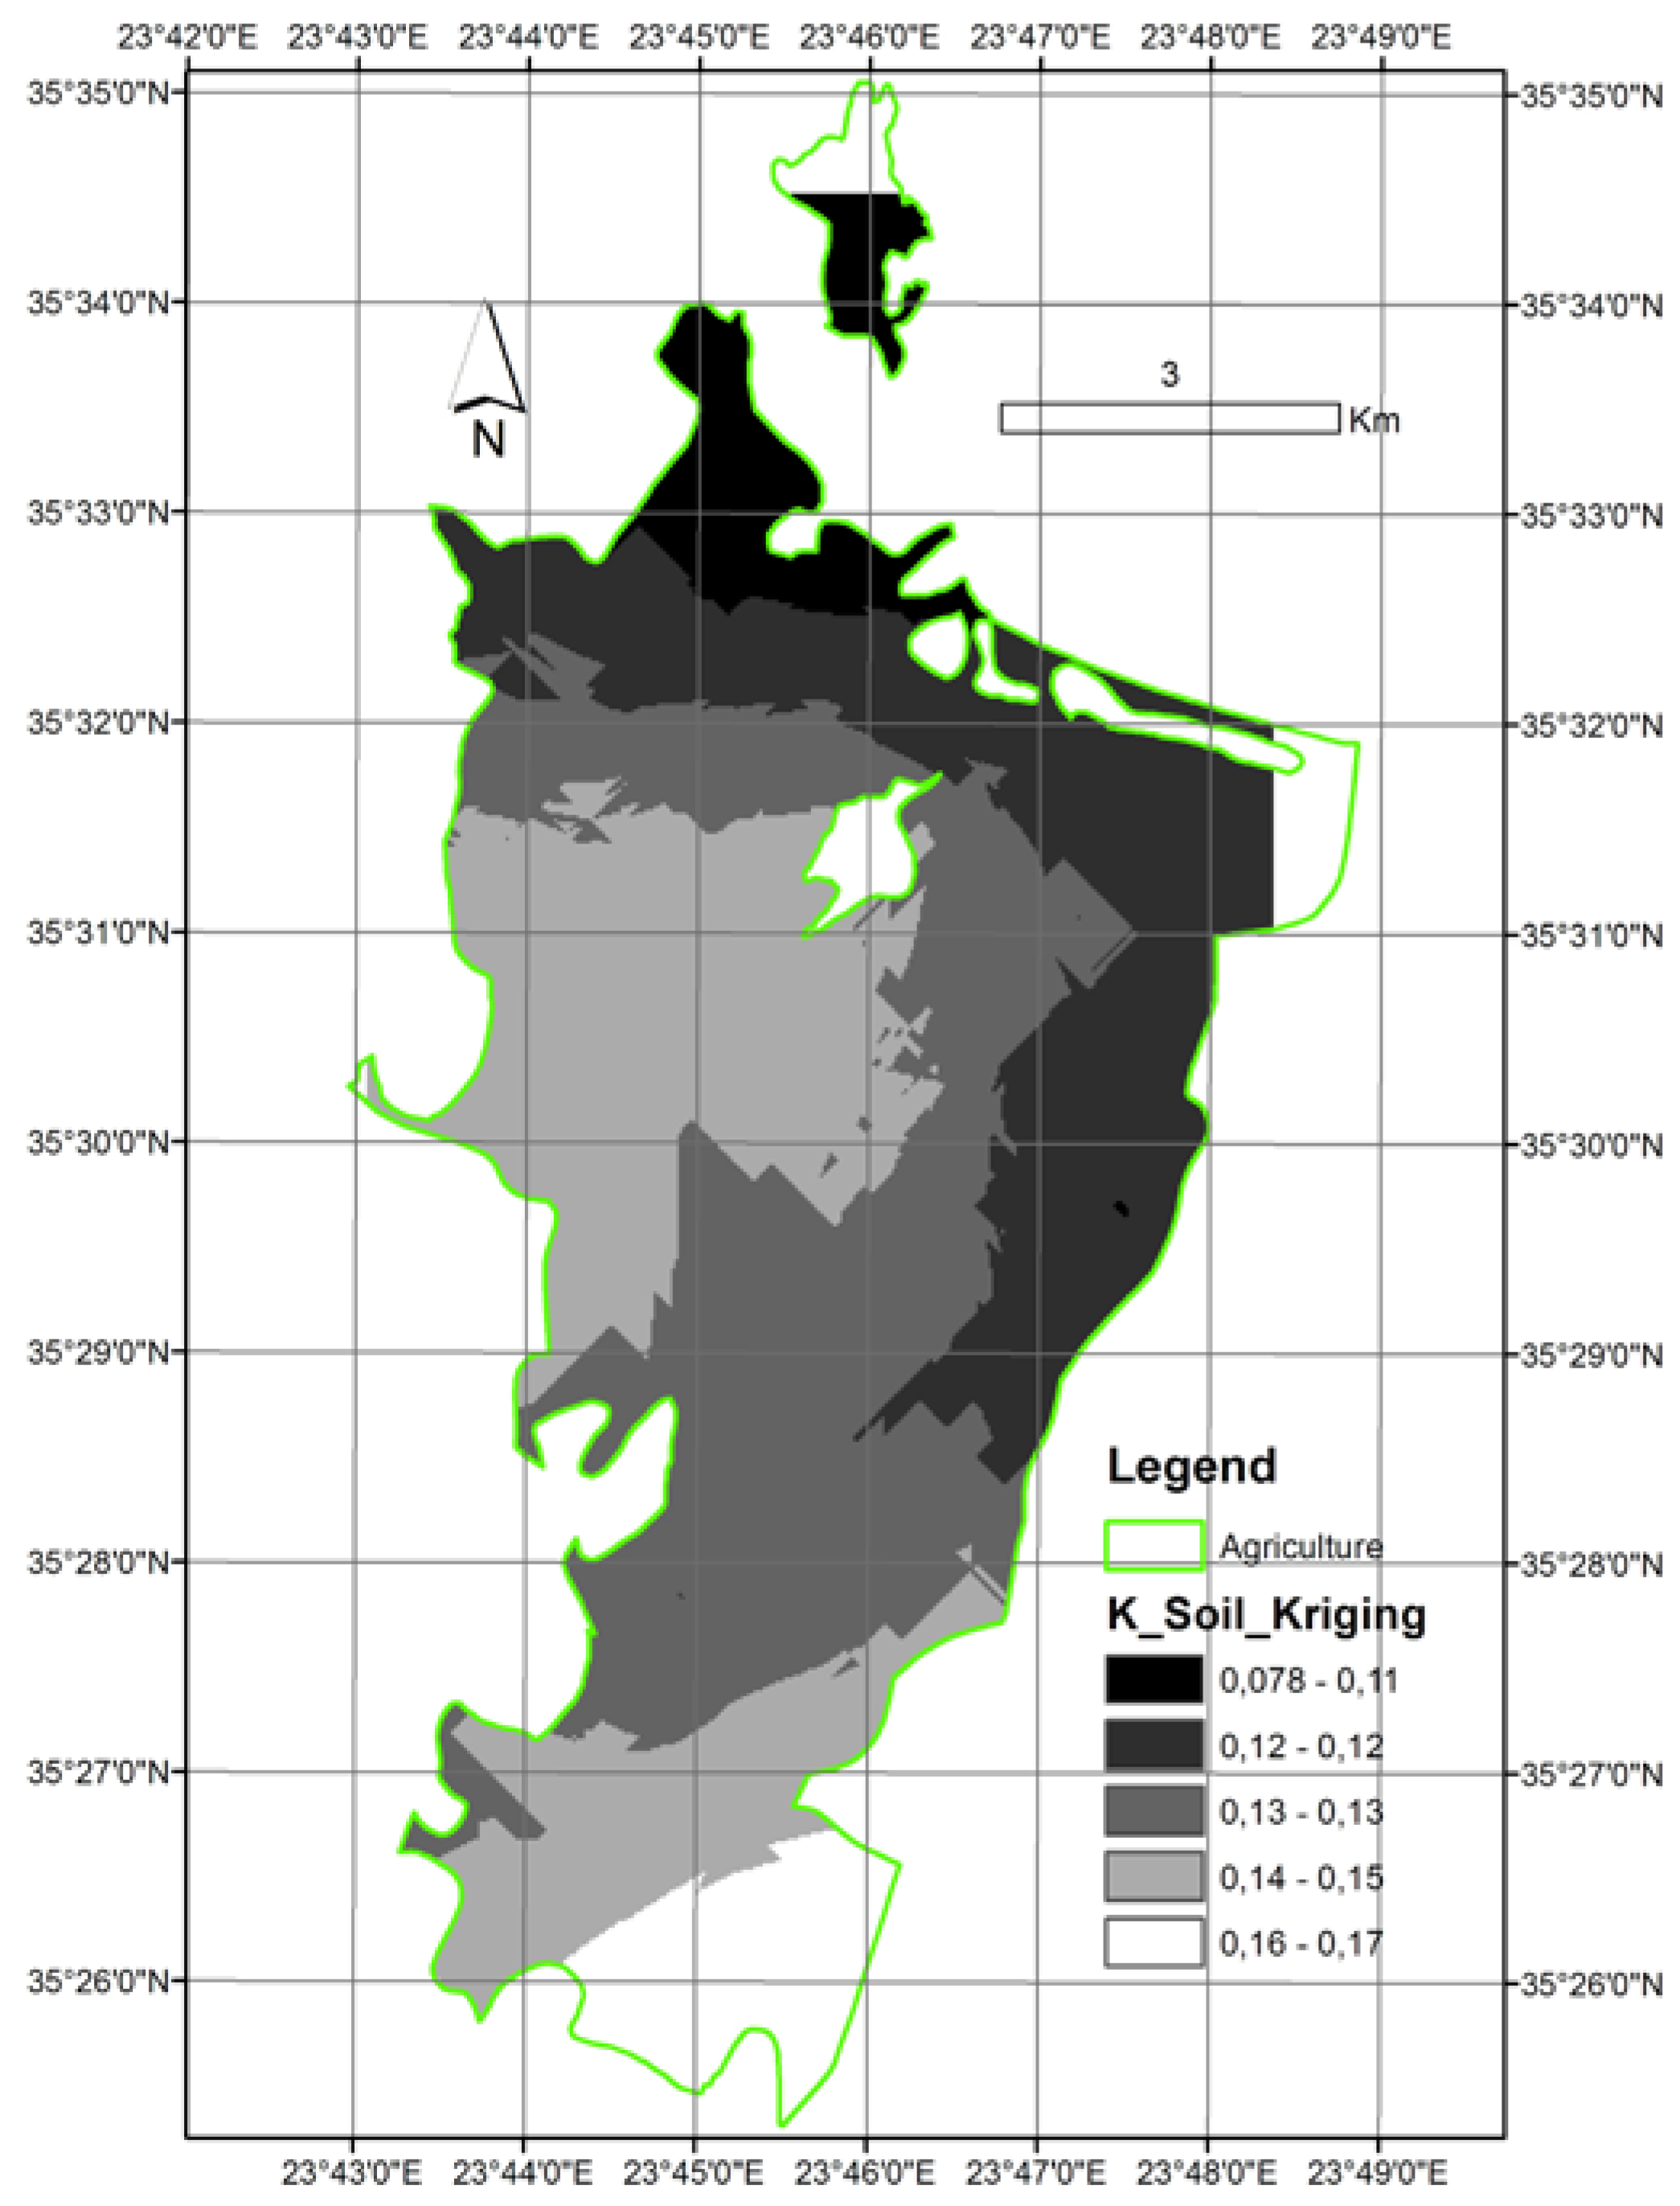
- A layer generated with spatial interpolation of the K-values calculated with the K-nomographs at the sampled locations. Interpolation is the procedure of predicting the value of attributes at un-sampled sites from measurements made at point locations within the same area. There are several interpolation methods with contradicting references about their performance. In this study, Ordinary Kriging interpolation was employed, as it is reported to perform better for non-grid sampling schemes [23,24] (Figure 6).


2.7. Generation of R, LS, C and P Layers
- The R-factor (climate attributes) was estimated using a regression of precipitation versus elevation, as it is accepted that climate varies strongly with elevation. Elevation is an excellent statistical predictor variable, because it is sampled at a far greater spatial density than climate variables and is often estimated on a regular grid (i.e., DEM). Extrapolation of the two stations’ data in this study was done by linear regression [25];
- The LS-factor (terrain attributes) was derived based on the D8 (deterministic-eight node) algorithm, which takes into account the 3 × 3 matrix moving on a DEM starting from the inner grid cell and analyzes the relationship with the neighboring cells [26];
- The C-factor (vegetation attributes) was derived from the NDVI (normalized difference vegetation index) after conversion with a monotonically decreasing sigmoid function with two control inflection points (zero and one). NDVI expresses the coverage potential of vegetation, and because the area is covered by permanent crops, the season of image acquisition (November) was appropriate for differentiating the presence and conditions of green vegetation in the study site [27,28]; and
- The P-factor (management attributes) was estimated by allocating features protective to soil erosion, e.g., terraces and roads parallel to the contours, with image processing techniques applied on the QuickBird imagery [29].
3. Results and Analyses
3.1. Accuracy Assessment of K-values Derived from the Geologic Map

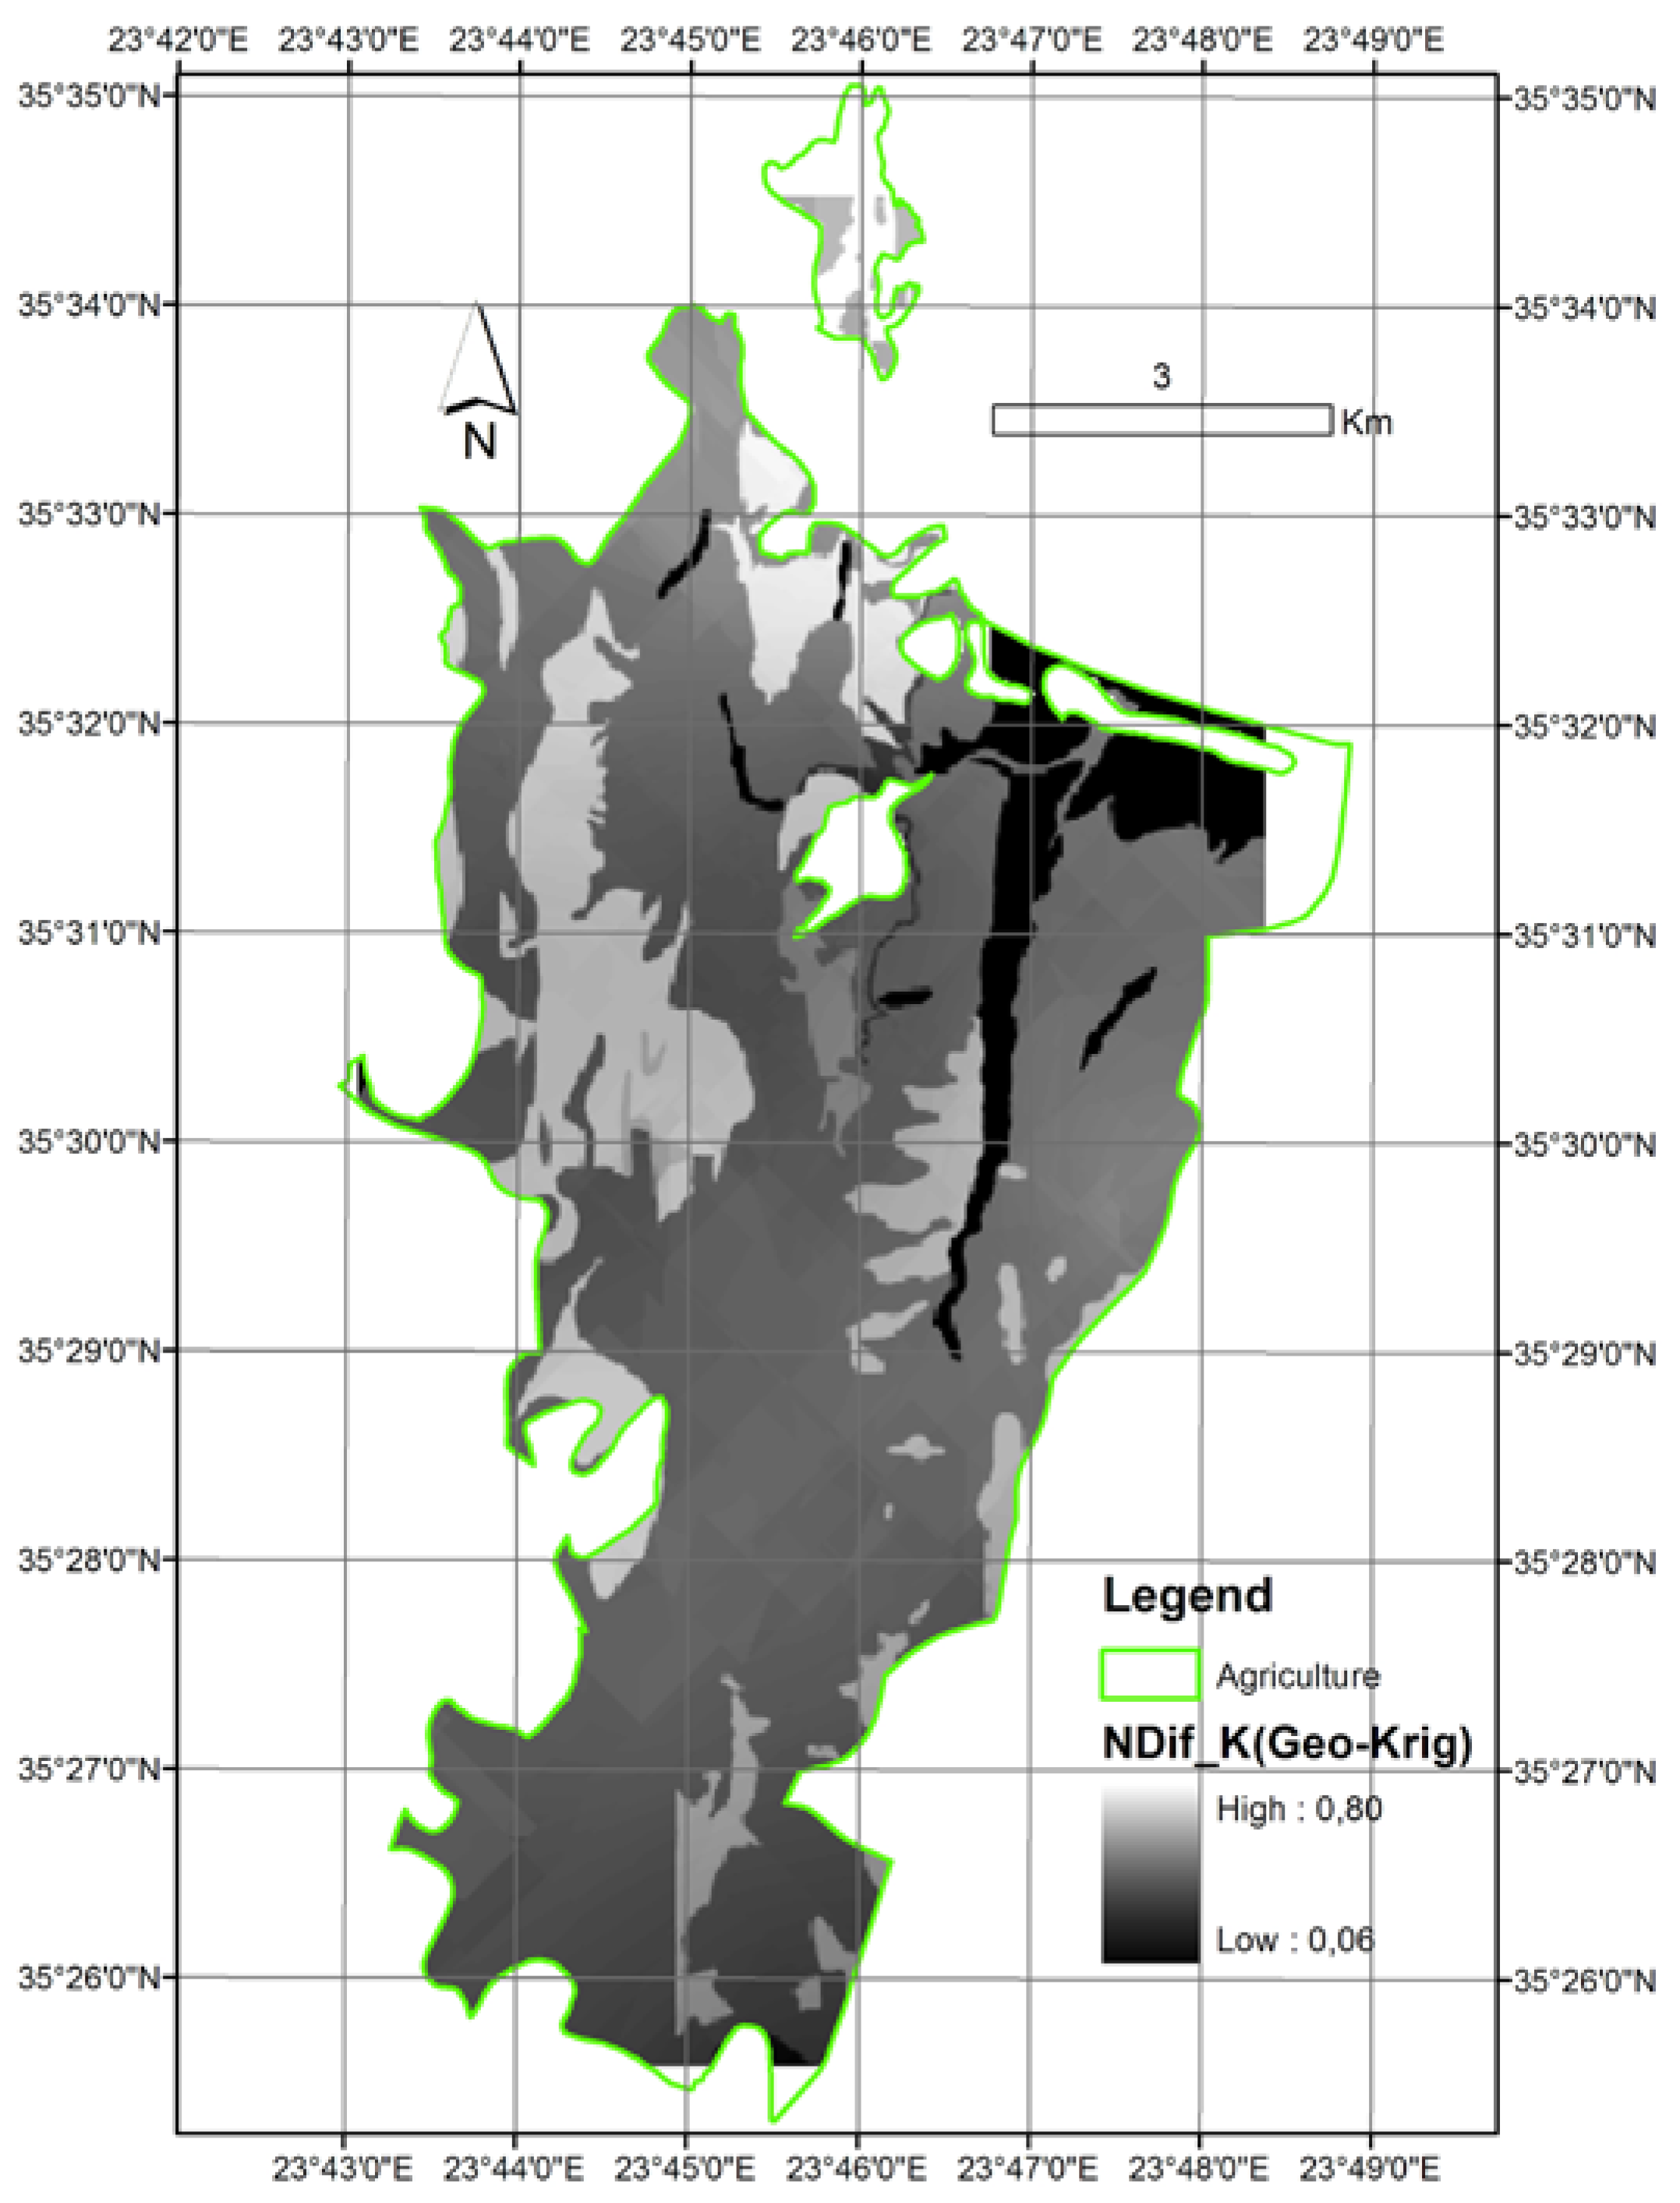
3.2. Comparison of K-Layers
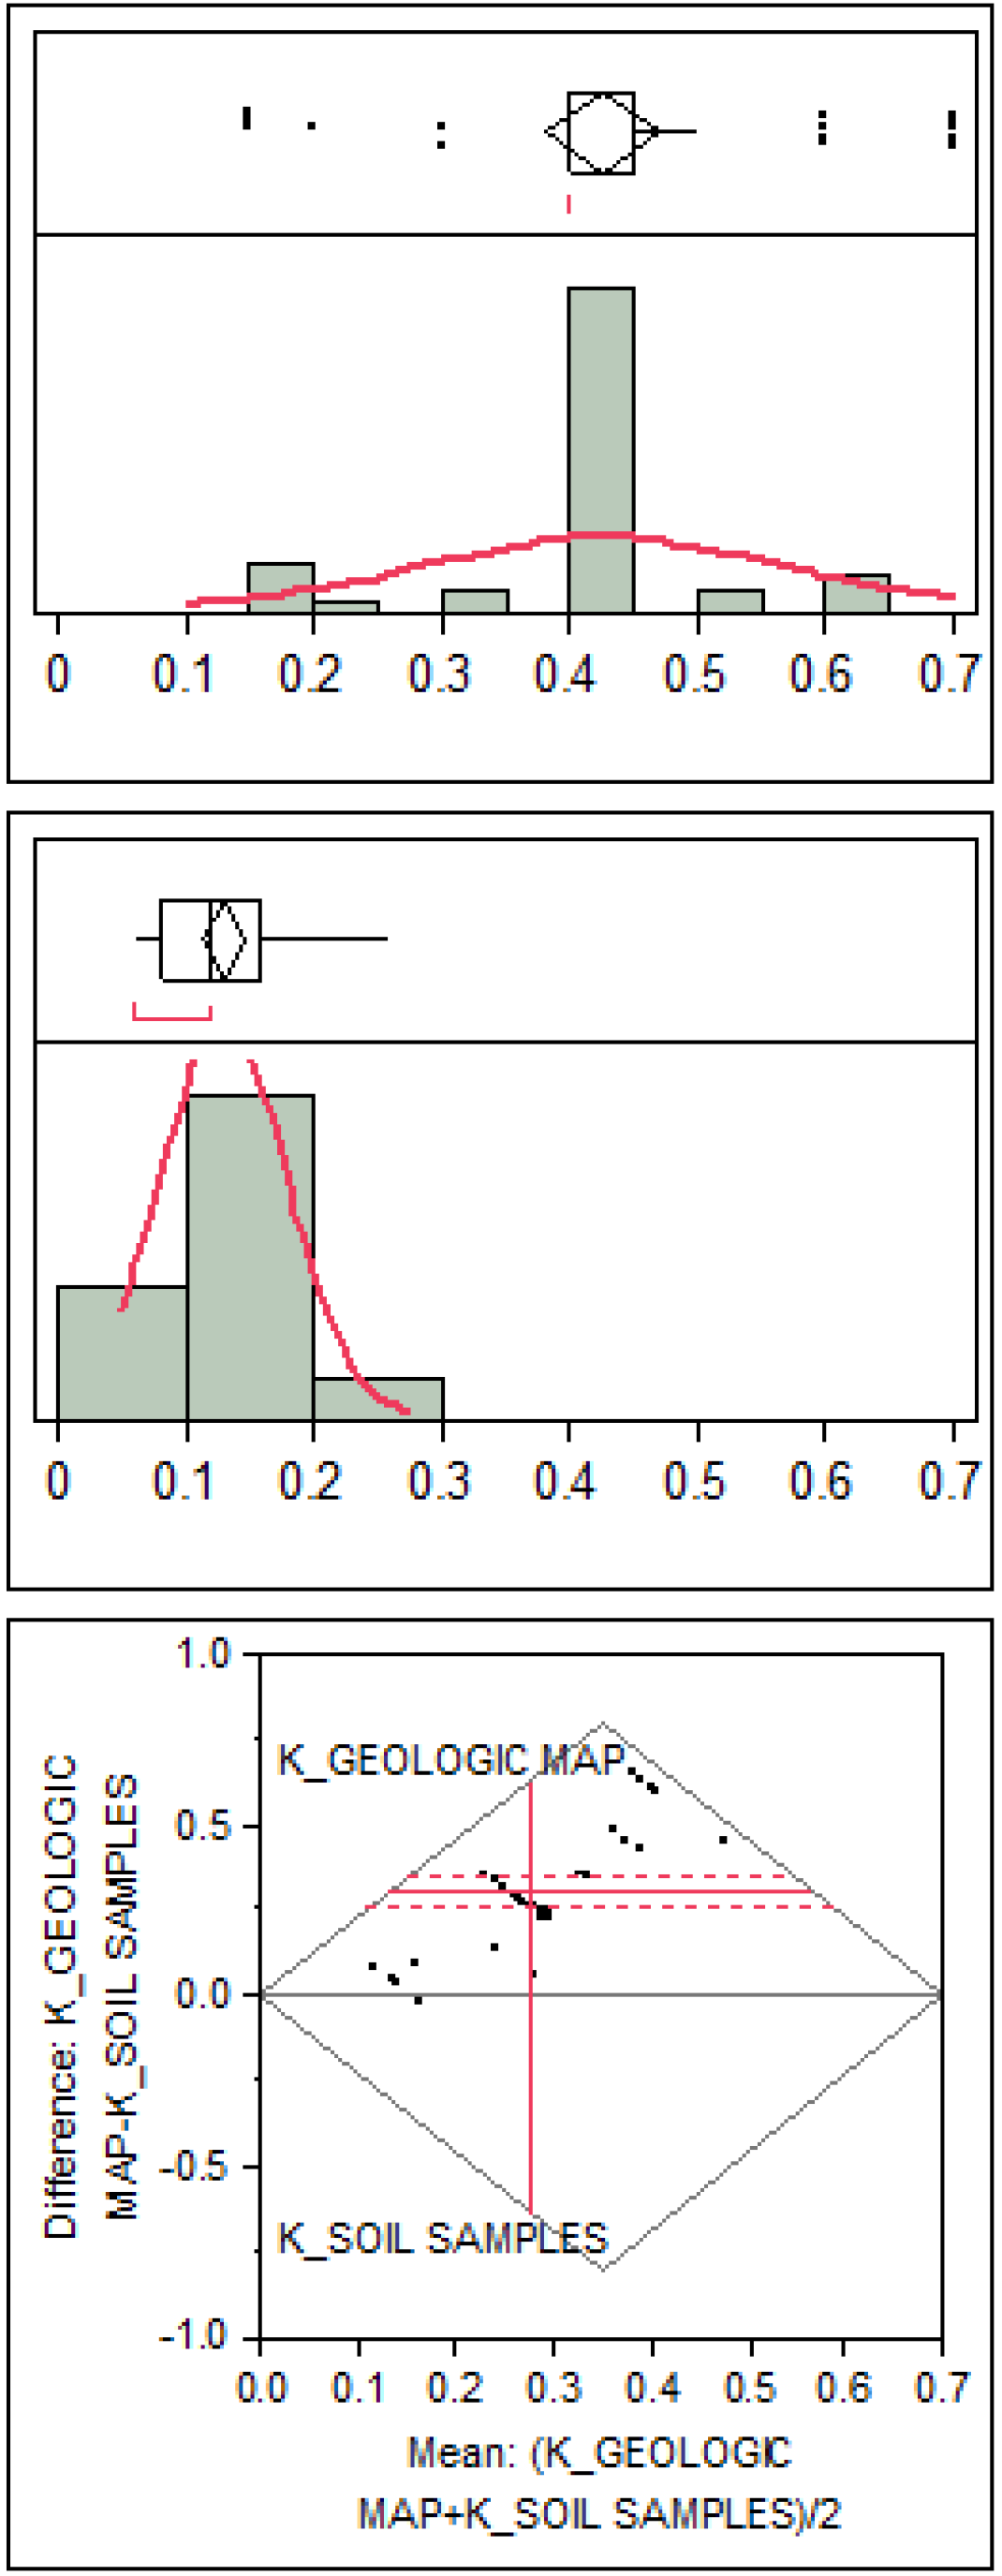
- The pattern of the geological map was predominant in the difference map. This was expected, given the fact that values change distinctly in the geologic map, whereas values change gradually in interpolation surfaces (Figure 8).
- A big mean normalized difference (0.52) was found between the two K-layers, while for the great extent of the study area, the normalized difference was larger than 0.40.

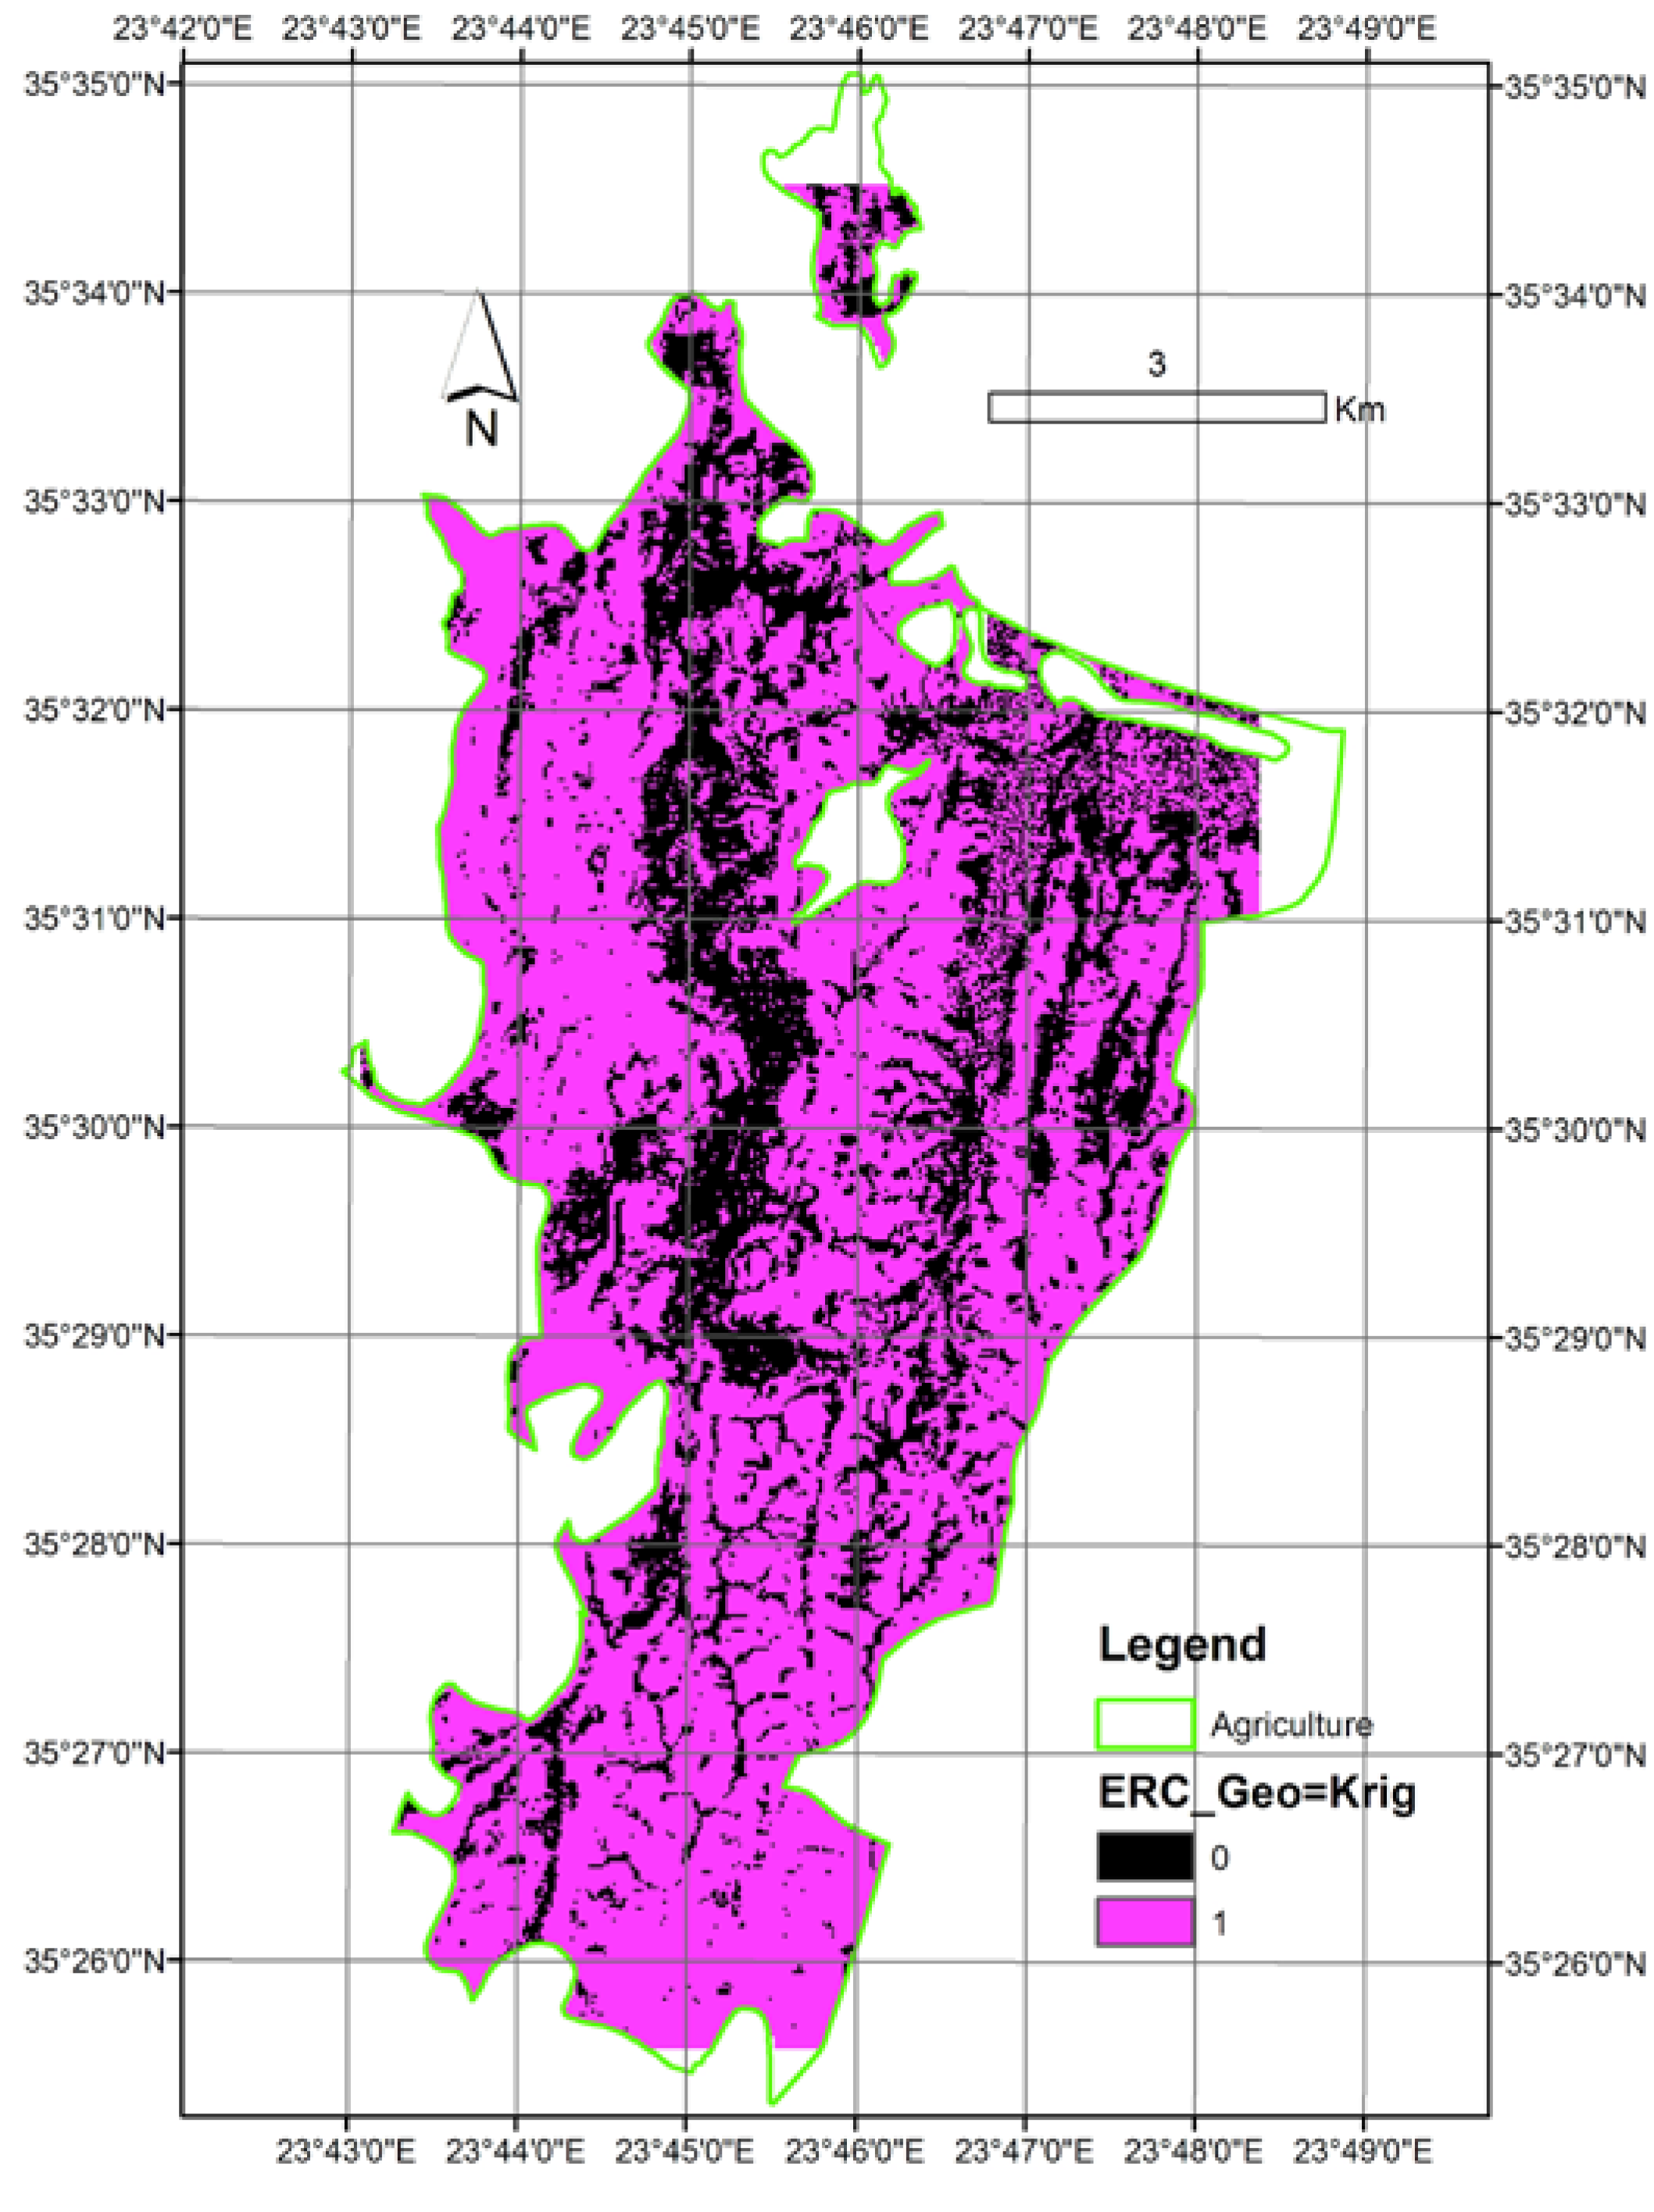
3.3. Comparison of Erosion Risk Maps
- One using as input the K-layer derived from the geologic map; and
- One using as input the K-layer derived from the soil samples with Ordinary Kriging interpolation.
| Erosion class | ERC1 | ERC2 | ERC3 | ERC4 | ERC5 |
|---|---|---|---|---|---|
| Loss t/ha/year | 0–5 | 5–10 | 10–20 | 20–40 | >40 |
| Classification | Very slight | Slight | Moderate | Severe | Very severe |

| Methods | K from geologic map | K from interpolated K values | ||
|---|---|---|---|---|
| Erosion Risk Class | Extent (ha) | Proportion of ERC over the total study area (%) | Extent (ha) | Proportion of ERC over the total study area (%) |
| Very slight—ERC1 | 105 | 1.5 | 225 | 3.4 |
| Slight—ERC2 | 162 | 2.3 | 344 | 5.2 |
| Moderate—ERC3 | 244 | 3.5 | 601 | 9.0 |
| Severe—ERC4 | 373 | 5.4 | 1037 | 15.6 |
| Very severe—ERC5 | 6039 | 87.3 | 4474 | 66.8 |
| Total | 6923 | 100 | 6681 * | 100 |
| Soil samples | Geologic map | Totals | ||||
|---|---|---|---|---|---|---|
| ERC-1 | ERC-2 | ERC-3 | ERC-4 | ERC-5 | ||
| ERC-1 | 1,083 | 904 | 796 | 247 | 104 | 3,134 |
| ERC-2 | 119 | 886 | 1,218 | 1,889 | 699 | 4,811 |
| ERC-3 | 30 | 139 | 935 | 1,949 | 5,346 | 8,399 |
| ERC-4 | 5 | 24 | 131 | 718 | 13,612 | 14,490 |
| ERC-5 | 0 | 3 | 40 | 178 | 62,174 | 62,395 |
| Totals | 1,237 | 1,956 | 3,120 | 4,981 | 81,935 | 93,229 |
4. Conclusions
- The study area was highly disturbed by anthropogenic activities (long agricultural history), rendering the assumptions made about undisturbed soils non-realistic;
- The soil expert considered that the area was very poor in organic matter, which was proved not to be true. Based on average Greek standards, an assumption was made for values <2%, while the mean value was found to be 3%. As a consequence, the inferred K-values were overestimated; and
- Unlike a physiographic map, a geologic map contains limited information, rendering estimations by inference much more uncertain.
- Some specific soil properties might have affected soil erodibility more than others and, moreover, by a different degree throughout the study site. This idea has been expressed originally by [16]; and
- Some of the sampled soil properties were not measured, but estimated by expertise (good knowledge of the study site from previous work). These properties were the soil structure and permeability, which are reported to be of high importance in estimating K. This fact increased uncertainty in K-estimations from soil properties.
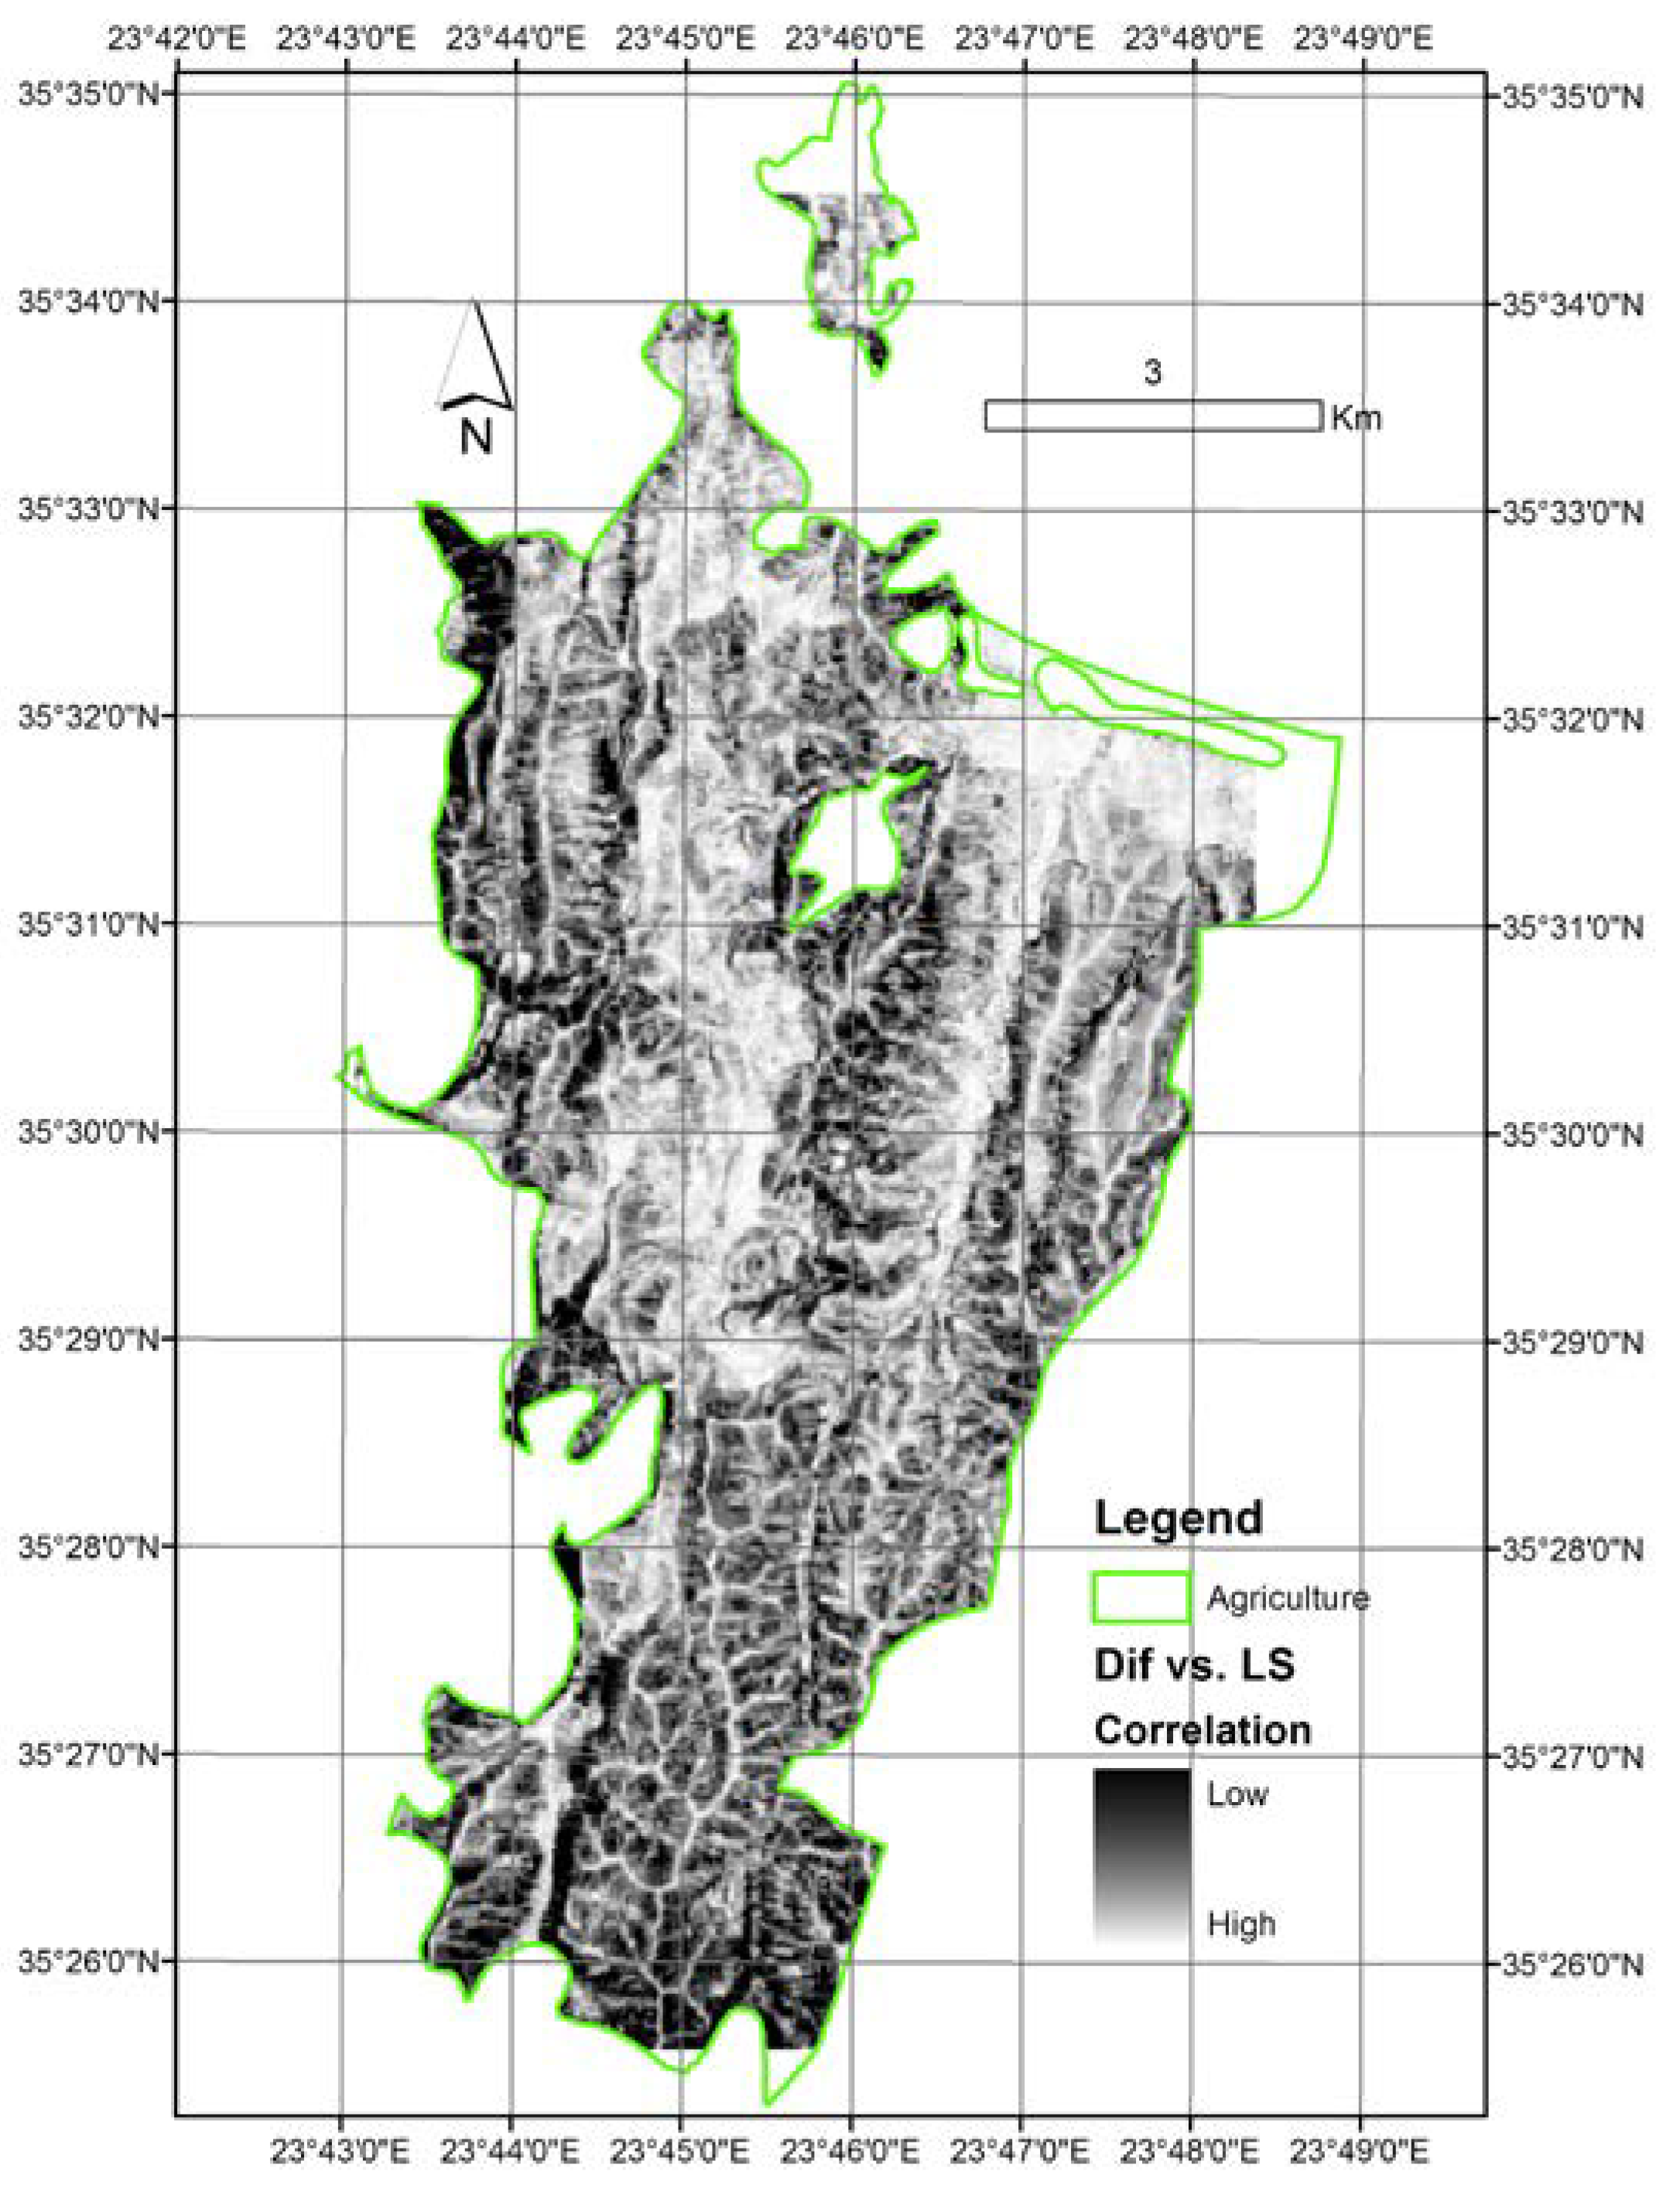
- High correlation with the LS-layer in some specific areas, which means that in these areas, the topography was a major attributor to the different estimations by the two alternatives. This observation is in line with the suggestion of using physiographic maps instead of soil maps made by [16]; and
- Medium correlation with the C-layer for the entire area, which means that the vegetation cover was a standard moderate attributor to the error.
- The reclassification in ERC resulted in an overall similarity of the two erosion maps, which exceeded 70%;
- Moreover, in ERC5, the level of similarity exceeded 76%; and
- Regrouping ERC4 and ERC5 resulted in a level of similarity between the two alternatives, which exceeded 88%.
- Different sources of soil information (geologic, physiographic, soil and imagery datasets); and
- Soil-related patterns as an additional parameter of soil erodibility.
Acknowledgements
References
- Foster, G.R.; Meyer, L.D. A Closed-form Soil Erosion Equation for Upland Areas. In Sedimentation Symposium in Honor Porf. H.A. Einstein; Sten, H.W., Ed.; Colorado State University: Ft. Collins, CO, USA, 1972; pp. 12:1–12:19. [Google Scholar]
- Sanders, D.W. Sloping Land: Soil Erosion Problems and Soil Conservation Requirements. In Land Evaluation for Land-use Planning and Conservation in Sloping Areas; Siderius, W., Ed.; Institute for Land Reclamation and Improvement: Wageningen, The Netherlands, 1986; pp. 40–50. [Google Scholar]
- Wischmeier, W.H.; Smith, D.D. Predicting Rainfall Erosion Losses from Cropland East of the Rocky Mountains; Agricultural Research Service, U. S. Department of Agriculture in Cooperation with Purdue Agricultural Experiment Station: Washington, DC, USA, 1978. [Google Scholar]
- Kinnell, P.I.A. Raindrop-impact-induced erosion processes and prediction: A review. Hydrol. Process. 2005, 19, 2815–2844. [Google Scholar] [CrossRef]
- Le Bissonnais, Y.; Cerdan, O.; Lecomte, V.; Benkhadra, H.; Souchere, V.; Martin, P. Variability of soil surface characteristics influencing runoff and interril erosion. Catena 2005, 62, 111–124. [Google Scholar] [CrossRef]
- Aksoy, H.; Kavvas, M.L. A review of hillslope and watershed scale erosion and sediment transport models. Catena 2005, 64, 247–271. [Google Scholar] [CrossRef]
- De Vente, J.; Poesen, J. Predicting soil erosion and sediment yield at the basin scale: Scale issues and semi-quantitative models. Earth Sci. Rev. 2005, 71, 95–125. [Google Scholar] [CrossRef]
- Garcia-Ruiz, J.M. The effect of land uses on soil erosion in Spain: A review. Catena 2010. [Google Scholar] [CrossRef]
- Boardman, J. Soil erosion science: Reflections on the limitations of current approaches. Catena 2006, 68, 73–86. [Google Scholar] [CrossRef]
- Proposal for a Directive of the European Parliament and of the Council Establishing a Framework for the Protection of Soil and Amending Directive 2004/35/EC; European Commission: Brussels, Belgium, 2006.
- Integration of Environment into EU Agriculture Policy; The IRENA Indicator-Based Assessment Report; København, K. (Ed.) European Environment Agency: Copenhagen, Denmark, 2006.
- Millington, A.C. Reconnaissance Scale Soil Erosion Mapping Using a Simple Geographic Information System in the Humid Tropics. In Land Evaluation for Land-use Planning and Conservation in Sloping Areas; Siderius, W., Ed.; Institute for Land Reclamation and Improvement: Wageningen, The Netherlands, 1986; pp. 64–81. [Google Scholar]
- Merritt, W.S.; Letcher, R.A.; Jakeman, A.J. A review of erosion and sediment transport models. Environ. Model. Softw. 2003, 18, 761–799. [Google Scholar] [CrossRef]
- Karydas, C.G.; Panagos, P.; Gitas, I.Z. A classification of water erosion models according to their geospatial characteristics. Int. J. Dig. Earth 2002, 16, 663–680. [Google Scholar] [CrossRef]
- Van Rompaey, A.J.J.; Govers, G. Data quality and model complexity for regional scale soil erosion prediction. Int. J. Geogr. Inf. Sci. 2002, 16, 663–680. [Google Scholar]
- Perez-Rodriguez, R.; Marques, M.J.; Bienes, R. Spatial variability of the soil erodibility parameters and their relation with the soil map at subgroup level. Sci. Total Environ. 2007, 378, 166–173. [Google Scholar]
- Jetten, V.; de Roo, A.; Favis-Mortlock, D. Evaluation of field-scale and catchment-scale soil erosion models. Catena 1999, 37, 521–541. [Google Scholar]
- IUSS Working Group WRB, World Reference Base for Soil Resources 2006, 2nd ed.; World Soil Resources Reports No. 103; FAO: Italy, 2006.
- Beaufoy, G. The Environmental Impact of Olive Oil Production in European Union (Report); European Forum on Nature Conservation and Pastoralism: Madrid, Spain, 2000. [Google Scholar]
- Renard, K.; Foster, G.R.; Weesies, G.A.; Porter, J.P. RUSLE Revised universal soil loss equation. J. Soil Water Conserv. 1991, 46, 30–33. [Google Scholar]
- Desmet, P.; Grovers, G. A GIS procedure for automatically calculating the USLE LS factor on topographically complex landscape units. J. Soil Water Conserv. 1996, 51, 427–433. [Google Scholar]
- Buol, S.W.; Southard, R.J.; Graham, R.C.; McDaniel, P.A. Soil Genesis and Classification, 5th ed.; Iowa State University Press: Ames, IA, USA, 2003; p. 494. [Google Scholar]
- Mueller, T.G.; Pusuluri, N.B.; Mathias, K.K.; Cornelius, P.L.; Barnhisel, R.I.; Shearer, S.A. Map quality for ordinary kriging and inverse distance weighted interpolation. Soil Sci. Soc. Am. 2001, 68, 2042–2047. [Google Scholar]
- Schloeder, C.A.; Zimmerman, N.E.; Jacobs, M.J. Comparison of methods for interpolating soil properties using limited data. Soil Sci. Soc. Am. 2001, 65, 470–479. [Google Scholar] [CrossRef]
- Daly, C.; Gibson, W.P.; Taylor, G.H.; Johnson, G.L.; Pasteris, P. A knowledge-based approach to the statistical mapping of climate. Climate Res. 2002, 22, 99–113. [Google Scholar] [CrossRef]
- Gallant, J.C.; Wilson, J. TAPES-G: A grid-based terrain analysis program for the environmental sciences. Comput. Geosci. 1996, 22, 713–722. [Google Scholar] [CrossRef]
- De Jong, S.M.; Paracchini, M.L.; Bertolo, F.; Folving, S.; Megier, J.; de Roo, A.P.J. Regional assessment of soil erosion using the distributed model SEMMED and remotely sensed data. Catena 1999, 37, 291–308. [Google Scholar] [CrossRef]
- Vrieling, A. Satellite remote sensing for water erosion assessment: A review. Catena 2006, 65, 2–18. [Google Scholar] [CrossRef]
- Karydas, C.G.; Sekuloska, T.; Silleos, G. Quantification and site-specification of the support practice factor when mapping soil erosion risk associated with olive plantations in the Mediterranean island of Crete. Environ. Monit. Assess. 2008, 149, 19–28. [Google Scholar] [CrossRef]
- Sall, J.; Creighton, L.; Lehman, A. Jmp Start Statistics: A Guide to Statistics and Data Analysis Using Jmp and Jmp in Software, 3rd ed.; Thomson: Cary, NC ,USA, 2007. [Google Scholar]
- Torri, D.; Poesen, J.; Borselli, L. Predictability and uncertainty of the soil erodibility factor using a global dataset. Catena 1997, 31, 1–22. [Google Scholar] [CrossRef]
- ISOTEIA—Integrated System for the Promotion of Territorial & Environmental Impact Assessment in the Framework of Spatial Planning Digital Support Centre for Strategic Environmental Assessement (SEA). Available online: http://193.218.36.11:8012/ (accessed on 27 Jun 2013).
© 2013 by the authors; licensee MDPI, Basel, Switzerland. This article is an open access article distributed under the terms and conditions of the Creative Commons Attribution license (http://creativecommons.org/licenses/by/3.0/).
Share and Cite
Karydas, C.G.; Petriolis, M.; Manakos, I. Evaluating Alternative Methods of Soil Erodibility Mapping in the Mediterranean Island of Crete. Agriculture 2013, 3, 362-380. https://doi.org/10.3390/agriculture3030362
Karydas CG, Petriolis M, Manakos I. Evaluating Alternative Methods of Soil Erodibility Mapping in the Mediterranean Island of Crete. Agriculture. 2013; 3(3):362-380. https://doi.org/10.3390/agriculture3030362
Chicago/Turabian StyleKarydas, Christos G., Marinos Petriolis, and Ioannis Manakos. 2013. "Evaluating Alternative Methods of Soil Erodibility Mapping in the Mediterranean Island of Crete" Agriculture 3, no. 3: 362-380. https://doi.org/10.3390/agriculture3030362