Review

Environmentally Extended Input-Output Models in Agriculture: A Bibliometric Review

Department of Agricultural, Forestry, Food and Environmental Sciences, University of Basilicata, 85100 Potenza, Italy
*
Author to whom correspondence should be addressed.
Agriculture 2026, 16(7), 786; https://doi.org/10.3390/agriculture16070786
Submission received: 18 February 2026 / Revised: 30 March 2026 / Accepted: 31 March 2026 / Published: 2 April 2026
(This article belongs to the Section Agricultural Economics, Policies and Rural Management)

Abstract

This review paper synthesizes the application and evolution of environmentally extended input–output (EEIO) analysis in agricultural research, drawing on 647 publications (Scopus and Web of Science, 1978–2025) following the PRISMA method and using the Bibliometrix package in the R statistical computing environment. EEIO has become a leading method for assessing system-level environmental impacts by quantifying direct and indirect flows across complete supply chains. Bibliometric and thematic analyses reveal accelerated growth since 2015 and four principal domains of enquiry: emissions embodied in trade, water-resource management, energy and climate impacts, and the sustainability of agri-food supply chains. EEIO’s principal value lies in its capacity to support production- versus consumption-based accounting and to reveal intersectoral trade-offs that single-sector approaches overlook. However, standard EEIO frameworks remain constrained by fixed technical coefficients, coarse sectoral aggregation, and uncertainty in environmental extensions, which limit their capacity to resolve farm-scale processes, structural change, and feedbacks. To enhance analytical rigor and policy relevance, we advocate hybridization with life-cycle and farm-level data, development of higher-resolution multi-regional EEIO tables, incorporation of stochastic and scenario analyses, dynamic formulations to capture technological change, and adoption of open-data standards with transparent reporting. Advancing these priorities will improve comparability, reproducibility and the practical uptake of EEIO for evidence-based transitions in agricultural systems.

1. Introduction

The environmental impact of agricultural production systems has become an increasing concern for scholars in recent decades [1]. Such emphasis reflects the growing global concerns about sustainability and the urgent necessity for policy frameworks with the potential to address the various challenges arising in agriculture [2]. Agriculture is among the sectors imposing the greatest pressure on the environment, both through direct impacts on ecosystems and through indirect effects that are transmitted along supply chains [3,4].
Modern agriculture affects the environment not only via land use and irrigation water withdrawals, but also through greenhouse-gas emissions, disruptions of biogeochemical cycles, and pressures on environmental quality associated with the use of chemical inputs—such as pesticides and fertilizers—and with production intensification, which can entail deforestation, destruction of natural habitats, and consequent biodiversity loss [5,6,7]. In addition, some components of the environmental footprint attributable to agricultural production do not originate solely from on-farm cropping or livestock activities, but rather arise across the broader supply chain [8]. Illustrative examples encompass the industrial production of agrochemicals, including pesticides, fertilizers, and antibiotics, and the post-harvest storage and transportation to processing facilities or final consumers. This complexity and intersectoral interconnectedness imply that analytical approaches confined solely to on-farm activities may underestimate overall environmental impacts, as they neglect the upstream burdens embodied in intermediate inputs and transmitted across supply chains [5,9]. These interconnections are notably evident when examining climate change and the environmental burden of agriculture: a significant portion of emissions associated with agrifood products derive from indirect processes occurring along the value chain, rendering footprint assessments highly sensitive to the delineation of system boundaries [10,11]. Similarly, assessments of water use in agriculture must be beyond direct withdrawals by the agrifood sector; this has led to the growing prominence of concepts such as the water footprint and virtual water, which quantify the water embedded in traded commodities and thereby reveal the spatial redistribution of water demand and associated environmental pressures across geographic regions and economic sectors [12,13,14,15]. In this regard, environmentally extended accounting studies indicate that agricultural production and the food industry often dominate both the intensity and the overall magnitude of the water footprint, and that part of the virtually embodied water in produced goods is exported through trade flows—reinforcing the need for analytical tools capable of capturing the economic system as a whole, rather than focusing solely on the point of production [16,17].
This emerging need aligns with the systems approach that is increasingly promoted internationally to transform agrifood systems. The FAO has explicitly advocated this perspective, underscoring that a systems approach is essential to analyze and manage intersectoral interdependencies, cascading effects, and trade-offs among environmental, economic, and social objectives [18,19]. Such an approach recognizes that interventions at one stage of the value chain can propagate and generate unexpected consequences elsewhere in the production system and across other sectors [20]. In doing so, there is a clear need for analytical tools able to capture intersectoral interdependencies by tracking production from its origin to final consumption. Among the available models, Environmentally Extended Input–Output (EEIO) models provide a framework capable of representing intersectoral linkages while attributing environmental pressures not only to direct production processes but also to the indirect supply-chain activities activated by final demand [21,22,23]. Indeed, EEIO analysis originated from extending Wassily Leontief’s 1930s input-output economic model by attaching environmental data—such as resource use or pollutant emissions—to industrial sectors. It evolved to bridge the gap between traditional monetary economic transactions and physical environmental flows, enabling analysis of environmental impacts across supply chains. In the agrifood context, this approach helps clarify how agrifood production and consumption activate energy, chemical, and material inputs across the entire supply chain, and how these inputs contribute to emissions, resource use, and overall pollution [5,16]. Consequently, the use of EEIO models is now well established for footprint estimation and environmental accounting, and is widely applied to analyze emissions embodied along global value chains [24,25]. EEIO approaches enable the analysis of material flows embodied in goods by reconstructing all stages of the supply chain and identifying the points at which environmental pressures are generated most intensively [26,27]. Such studies highlight the pivotal role of agriculture in the use of water and land, whereas construction and industrial activities are often responsible for higher energy requirements—creating trade-off configurations that require intersectoral analytical tools to be interpreted correctly. In addition, the relevance of EEIO models is further reinforced by growing interest in the Water–Energy–Food (WEF) nexus, which seeks to investigate interdependencies among water resources, energy systems, and food production and consumption [28].
Despite the maturity of EEIO modelling and its expanding application across sectors, there remains a need to clarify how EEIO approaches have been applied to agricultural systems and how these applications have evolved over time. The growing corpus of studies on footprints, the water–energy–food nexus, and related themes makes it timely to map EEIO applications in order to identify dominant research topics, methodological shifts, and emerging trajectories shaped by recent empirical and technical developments. At the same time, the rising demand for economy-wide analyses to inform international policy agendas underscores the importance of understanding how EEIO has been used—and how it can be further used—as a systems-oriented tool to support the sustainable transformation of agrifood systems. In this respect, bibliometric studies are especially useful, as they provide a structured way to monitor the development of a research field and to trace how scholarly debates have evolved. The main objective of this study is to analyze the literature on EEIO applications to agricultural systems through a bibliometric approach. Specifically, the study aims to reconstruct the evolution of scientific output in this domain, identify the key authors and institutions that have shaped it, map the thematic and methodological trajectories that have defined the use of EEIO approaches in agriculture, and—through keyword co-occurrence analysis combined with thematic clustering of the assembled literature—identify the principal domains in which EEIO methodologies are currently applied within agricultural contexts (emissions trading, water management, energy-climate impacts, and agri-food chain sustainability). In fulfilling these aims, the analysis clarifies how EEIO evidence has been generated and how it can more effectively support research and policy for the sustainable transformation of agrifood systems.
The remainder of the paper is organized as follows. Section 2 introduces the EEIO framework that forms the analytical foundation of the study. Section 3 outlines the methodological approach and describes the data sources utilized in the analysis. Section 4 presents the empirical results, followed by Section 5, which interprets the findings and situates them within the broader literature and policy context. Section 6 concludes the paper by summarizing the key contributions and identifying directions for future research.

2. Environmentally Extended Input-Output Models: A General Overview

The Input-Output model, introduced by Nobel Prize winner Wassily Leontief at the end of the thirties [29,30], analyzes economic systems by quantifying the direct and indirect interdependencies among sectors in satisfying final demand [31]. By tracing flows of goods and services from primary inputs through successive stages of intermediate production to final consumption, the model enables the reconstruction of economic value chains. When extended to incorporate environmental or resource accounting—often termed environmentally extended input-output analysis—it can adopt a “cradle-to-grave” perspective, following economic activity from raw material extraction to end-use disposal. The primary concept of this analysis lies in the definition of the economic system as a set of sectors that produce goods and services, with each sector purchasing production inputs from the other sectors that make up the economic system [32,33]. The classical IO approach supposes that the inputs used in production are in fixed proportions and consequently there are constant returns to scale. This assumption leads to the definition of the matrix of technical coefficients A = [ a i j ] and to express the system as x = A x + f , where x is the vector of the outputs and f is the vector of the final demand. Rearranging the terms yields the fundamental Leontief equation: x = ( I − A ) − 1 f , where ( I − A ) − 1 is the Leontief inverse, conventionally denoted by L in the literature. This matrix captures the whole production needs, both direct and indirect, necessary to satisfy any final demand shock [22].
The IO framework is widely used to measure, to understand sectoral interdependencies and analyze the effects that new policies or exogenous demand shocks can have on the economic system and how these propagate within the various sectors with which the economy is described [34,35,36]. Despite its analytical power, the monetary-only IO framework proved insufficient for capturing biophysical realities such as resource scarcity and environmental pressures—a limitation that motivated scholars in the 1960s–70s to integrate physical flows of energy, materials, and emissions into the model. This extension yielded EEIO analysis, which quantifies the direct and indirect ecological burdens associated with economic activity [37,38]. The EEIO model links environmental satellite accounts to the economic structure of the IO model that allow to estimate the environmental impact of all production sectors and consequently also the impact that can be generated by any demand shocks with the same mechanism explained in the previous studies.
In the EEIO implementation, the direct environmental intensities are represented by the coefficients d k j ,which constitute the intensity matrix D . Its each element quantifies the amount of environmental pressure k —such as cubic meters of water consumed, hectares of land occupied, or tons of CO2 emitted—generated per monetary unit of output by sector j [22]. By combining the direct environmental intensity matrix D —whose elements d k j represent environmental pressure k per monetary unit of sector j output—with the Leontief inverse L , the EEIO framework captures both direct and indirect environmental impacts embedded in final demand. The product D * = D L yields the matrix of total environmental intensities, where each element reflects the full supply-chain burden (direct plus upstream indirect) associated with one unit of final demand. Hence, multiplying D by a final demand vector f gives the total environmental pressure p attributable to that demand; i.e., p =   D * f = D L f [39].
The EEIO model is particularly well-suited for assessing environmental implications across the entire economy precisely because it accounts for sectoral interdependencies. By tracing supply-chain linkages through the Leontief inverse, the model captures both direct and upstream indirect impacts, thereby providing a comprehensive and accurate quantification of the environmental footprint embedded in production and final demand [26]. In the literature, the EEIO model is widely used to calculate impact coefficients for emissions propagating them throughout the production chain [40], for example an application on the economy of Croatia reflects how the carbon footprint changes when emissions are attributed to sectoral output compared to when they are attributed to final demand, highlighting the role played by indirect emissions that are incorporated in the intermediate inputs used for the production of the final output needed to meet final demand [41]. Moreover, recent research demonstrates that EEIO-based footprint estimates, with their economy-wide coverage, effectively complement bottom-up approaches by capturing upstream supply-chain impacts that would otherwise be omitted or truncated in process-based assessments [42].
When the analytical focus shifts to agri-food systems, the value of a framework capable of estimating aggregate environmental pressures becomes evident. Agricultural production draws heavily on natural capital and is tightly integrated with energy, chemical, manufacturing and logistics activities; consequently, a systems-level perspective that quantifies embodied resource use and emissions is essential [43]. The EEIO model permits estimation of water, energy, land and pollutant burdens embedded in intersectoral flows associated with production, processing, transport, distribution and final consumption, thereby furnishing a rigorous basis for policy appraisal across the food supply chain [44,45]. Empirical applications attest to the method’s versatility; for instance, EEIO studies have quantified the water consumption and greenhouse-gas emissions embodied in food waste, providing an evidential foundation for assessing anti-waste interventions [46]. In another related work, ref. [47] reconstructed virtual grey-water flows within interprovincial agricultural exchanges, enabling the identification of critical nodes for water-quality management. Investigations of urban supply chains that integrate carbon and water accounting reveal that agriculture often displays a high intensity of embodied water even when aggregate emission profiles are dominated by other sectors, thereby underscoring the necessity of multi-indicator evaluations [48,49]. Therefore, the primary contribution of this review is to provide a consolidated, evidence-based roadmap that both clarifies how EEIO has been employed in agri-food research and guides future methodological refinement and policy translation. These findings aim to inform researchers and decision-makers on where EEIO analysis can most effectively support sustainable food-system governance and where further methodological development is required.

3. Research Methodology

3.1. Methods

Bibliometric analysis is a highly useful tool for researchers, as it allows us to quantitatively examine the evolution of scientific production and to assess techniques, methodologies and research trends within a given topic. Through the systematic analysis of publications over time, it enables the identification of correlations, collaboration networks, development trajectories and emerging trends, thereby offering a clear and structured overview of the state of the art in a specific field. One of the main advantages of these approaches, as highlighted by [50], is their capacity to facilitate reproducible and dependable processes, thereby minimizing errors associated with manual and qualitative analyses of extensive datasets. Bibliometric analysis also supports the definition of research objectives, the delimitation of the field of inquiry and the identification of atypical results or gaps and trajectories that warrant further investigation. Building on these advantages, this study employs a bibliometric methodological framework to offer a comprehensive analysis of publication trends over time, identify the most influential authors, journals, and articles, and perform citation, collaboration, and keyword analyses.

3.2. Data Collection, Cleaning and Preprocessing

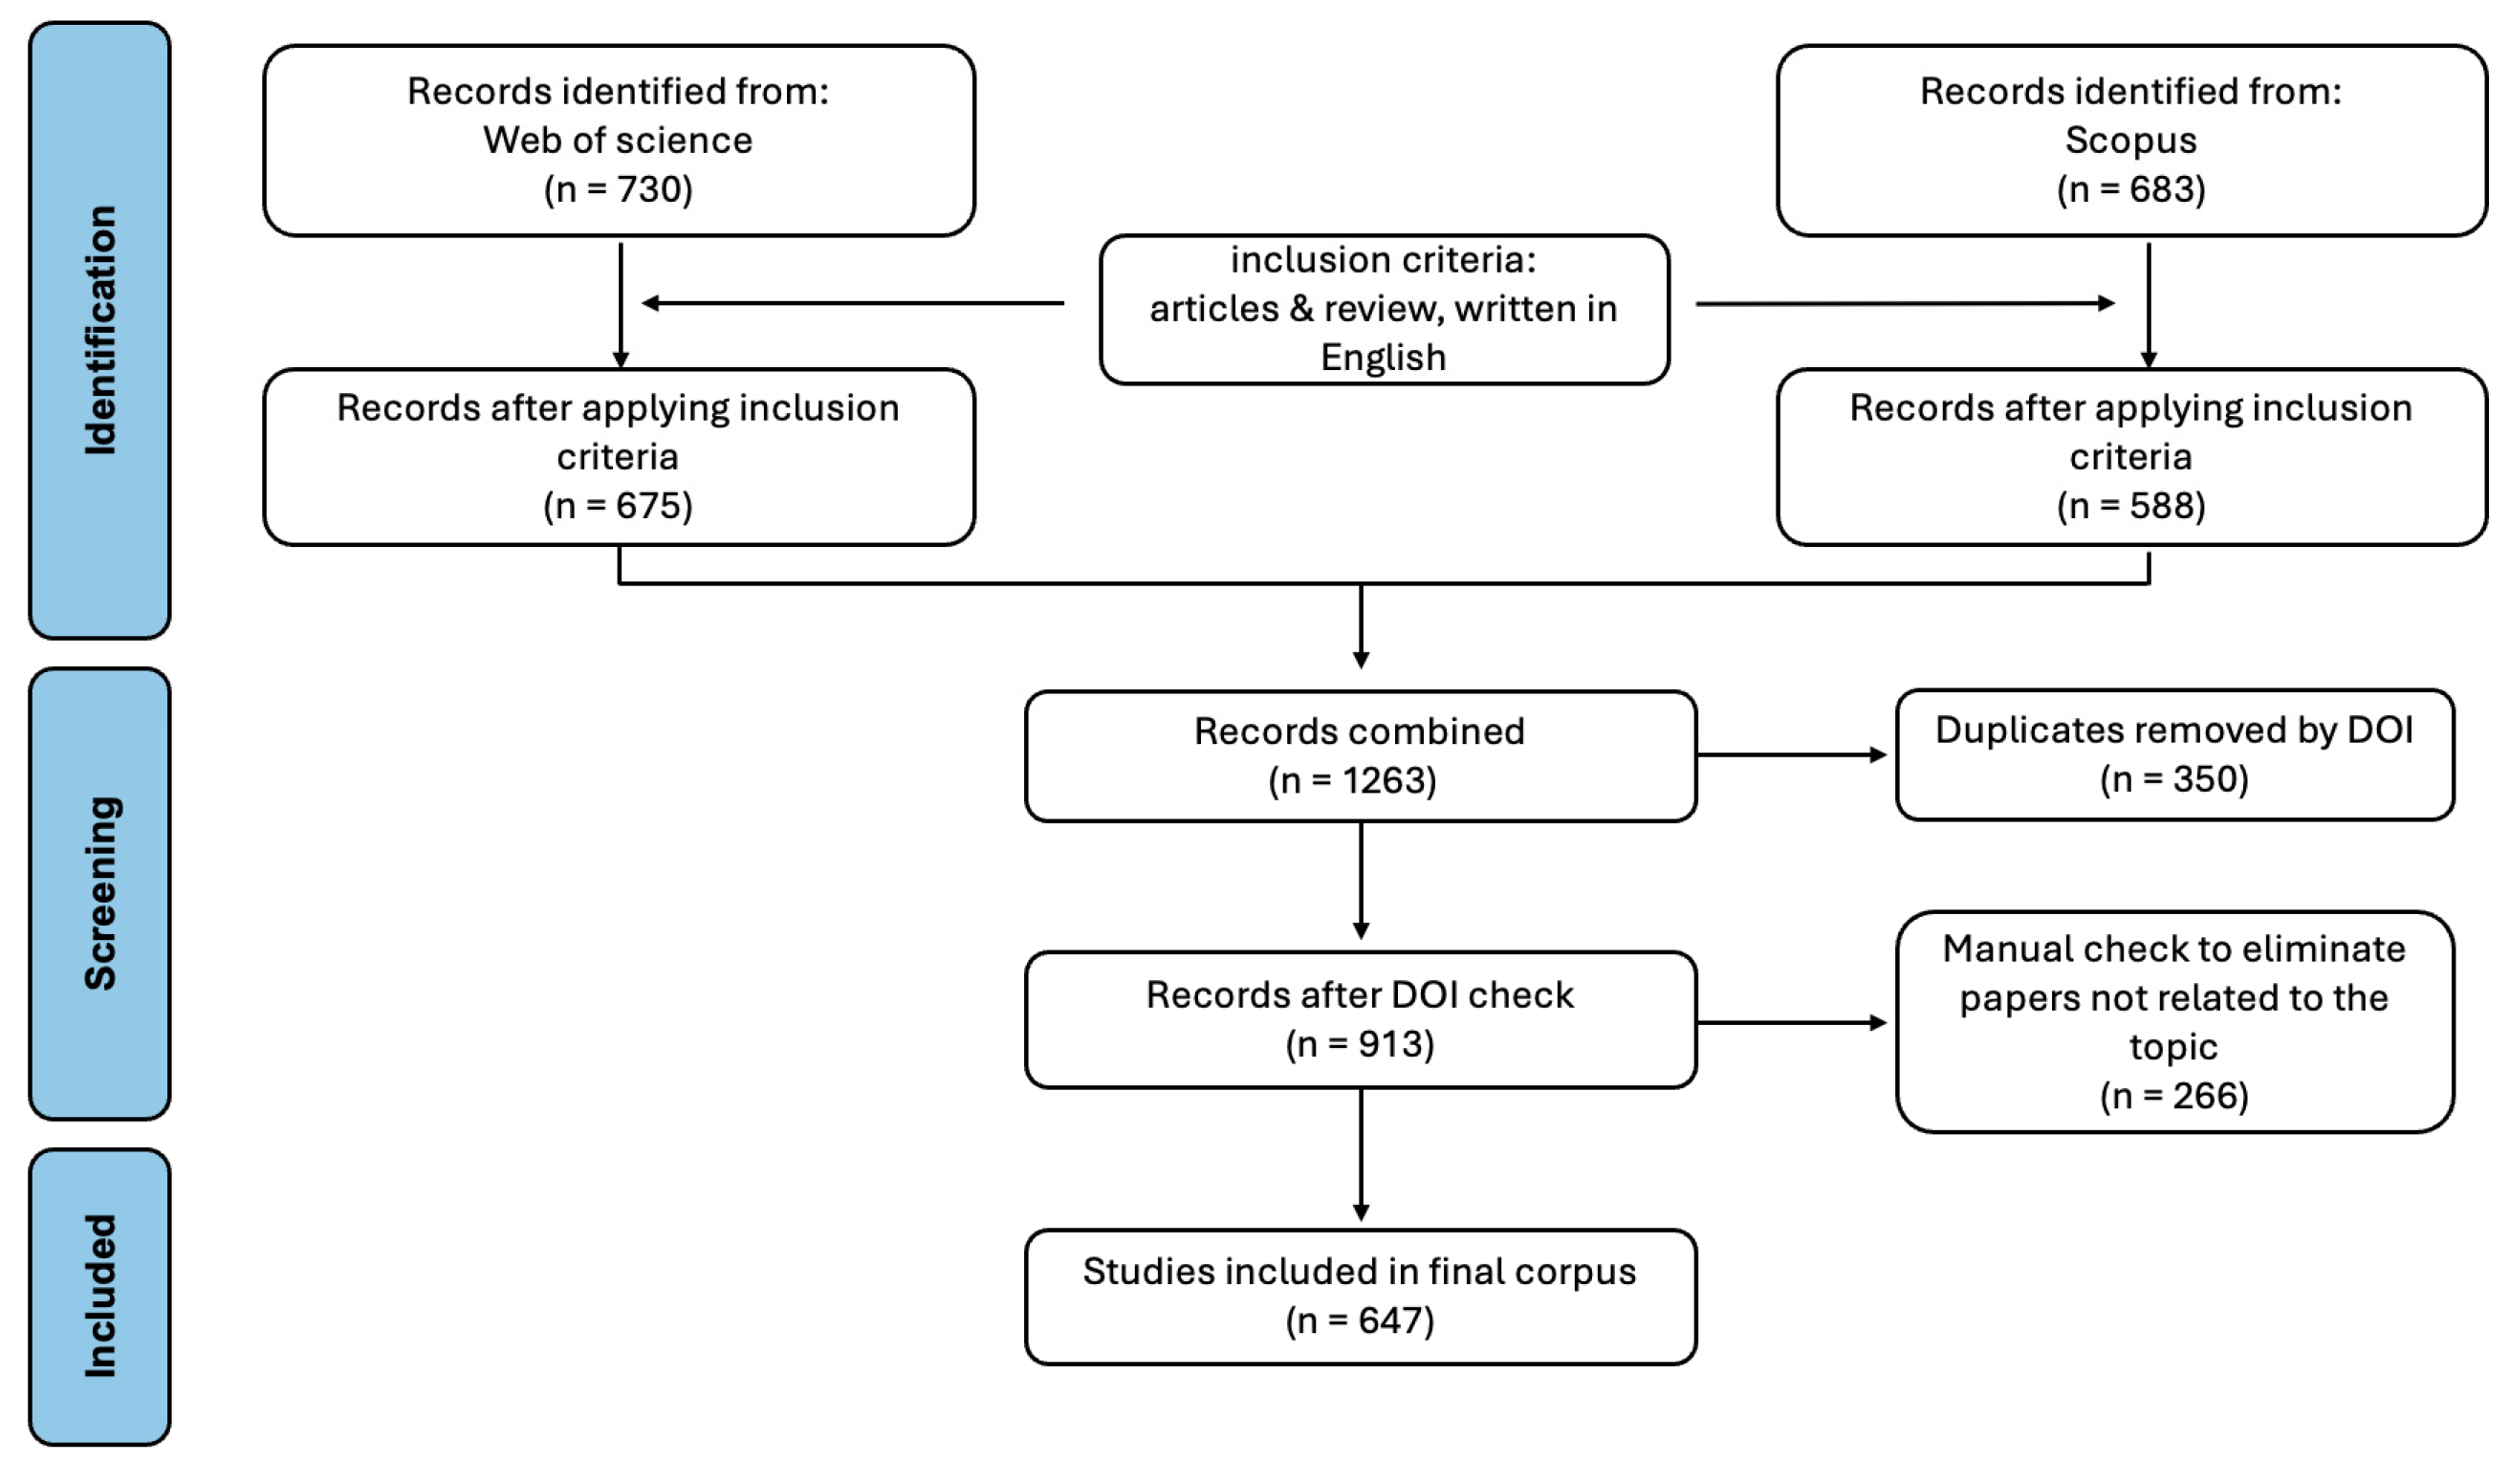
A systematic literature search for studies applying EEIO models in agriculture was conducted using two major bibliographic databases: Web of Science and Scopus. These complementary resources were chosen to maximize coverage across disciplines and publication venues, given their extensive, heterogeneous collections and established editorial standards. Results retrieved from both platforms were merged and deduplicated using Digital Object Identifiers (DOIs) so that each study was represented only once in the final corpus. This approach reduced redundancy and helped ensure the integrity of the dataset used to characterize the contemporary research landscape [51,52]. The PRISMA framework was used to report transparently the identification and selection of bibliographic records included in the final dataset. In this bibliometric review, PRISMA served to outline the main stages of the workflow rather than to support a qualitative appraisal of the full text of individual studies. These stages comprised database identification, application of eligibility filters, removal of duplicate records, and final inclusion. Figure 1 summarizes the record selection process and provides an overview of how the bibliometric dataset was assembled.
The final bibliometric corpus used for the analyses was constructed on the basis of predefined inclusion and exclusion criteria. Only records retrieved through the search strategies applied in Web of Science and Scopus were retained, provided they were written in English and classified as articles or reviews in the field of agricultural systems. This approach is consistent with the scope of the study, which maps EEIO-based research across the broader agricultural and agri-food domain, including trade- and policy-oriented contributions insofar as they operationally employ an input–output or EEIO framework. Furthermore, Records were excluded if they appeared in both databases, were published in a language other than English, or belonged to document types other than articles and reviews. Accordingly, relevance was determined at the bibliographic record level through search strings and database filters rather than through manual full-text screening. This approach is consistent with the bibliometric design of the study, although it may have allowed a small number of borderline records to remain in the dataset. Since the two databases are different, it was necessary to develop two separate search queries, as Web of Science and Scopus rely on different syntaxes for searches within their respective platforms. We begin with the analysis conducted in Web of Science. The query, based on the Topic Search (TS) field, was as follows:
TS = ((((Environment*-Extended OR Environment* OR Extended) AND (Input-Output analysis OR Input-Output table* OR Input-Output matri* OR Input-Output model*)) OR (EEIO OR EE-IO OR EE-IOT OR EE-IOTs)) AND (agricultur*)).
This query returned 730 records. The results were then refined by applying inclusion criteria that limited the set to papers and review articles written in English, yielding a final sample of 675 English-language articles and reviews retrieved from Web of Science. Asterisks are used at the end of certain terms in the query to ensure that all words sharing the same root as the preceding string are captured. This device allows the query to be streamlined while at the same time avoiding the loss of potential synonyms, thereby enabling the selection of the largest possible number of relevant articles.
In Scopus, given its slightly different search system, the query had to be adapted. Instead of Topic Search, we used the field TITLE-ABS-KEY, which allows searching within titles, abstracts and keywords. The query used in Scopus was:
TITLE-ABS-KEY ((((Environment*-Extended OR Environment* OR Extended) AND (“Input-Output analysis” OR “Input-Output table*” OR “Input-Output matri*” OR “Input-Output model*”)) OR (EEIO OR “EE-IO” OR EE-IOT OR EE-IOTs)) AND (agricultur*)).
This search identified a total of 683 documents. The results were then refined by applying inclusion criteria that limited the set to papers and review articles written in English, yielding a final sample of 588 English-language articles and reviews retrieved from Scopus.
Across the two database searches, a total of 1263 English-language articles and reviews were initially identified. Following the removal of duplicate records through a data-cleaning procedure conducted in R, based on identical DOI entries, 350 duplicates were excluded, resulting in a dataset of 913 unique publications. Subsequently, a manual screening was performed to remove papers not relevant to the research topic. After this selection process, the final corpus consisted of 647 English-language articles and reviews.
This search and screening strategy enabled the construction of a temporal and geographical overview of EEIO-based research in the agricultural domain, while also facilitating the identification of the most research-active countries, the authors exerting the greatest scholarly influence, and the journals most central to the dissemination of EEIO-related studies. In addition, keyword co-occurrence analysis combined with thematic clustering of the assembled literature revealed the principal domains in which EEIO methodologies are currently applied within agricultural contexts. These domains arise directly from the intersection of EEIO techniques and agriculture-specific terms. They encompass studies on emissions trading that examine the integration of agricultural sectors into carbon markets, offset schemes, and the economic consequences of emission permits under EEIO frameworks; research on water management that applies EEIO analysis to evaluate virtual water flows, water footprints, and scarcity effects linked to agricultural production and trade; investigations of energy-climate impacts that quantify energy consumption patterns and broader greenhouse gas emissions—extending beyond trading mechanisms—arising from agricultural activities and supply chains; and assessments of agri-food chain sustainability that explore the overall environmental performance of food systems, including multi-regional supply linkages, waste management practices, and circular economy indicators in the agricultural sector. In this way, the approach offers a structured portrayal of the field’s evolution and underscores the key contributions that have shaped the use of EEIO models in analyzing agricultural systems across these critical areas.

3.3. Data Analysis and Visualization

All analyses were conducted in R (R Core Team, 2025) using R version 4.4.3 (28 February 2025), with the Bibliometrix package introduced by [53] in the R statistical computing environment. The final dataset covered the period 1978–2025, and the bibliometric analyses presented here therefore reflect the entire study period. Bibliometrix supports text mining and science-mapping procedures, enabling the systematic examination and visualization of complex bibliometric data.
In this study, we combined conceptual structure analysis based on co-occurrence with author-specified keywords to examine EEIO applications in the agricultural sector, identify the main thematic areas, and detect emerging research frontiers. Overall, this bibliometric approach provides a comprehensive and in-depth view of the research landscape on the use of EEIO methodology in agriculture and supports evidence-based strategic research planning and decision-making.

4. Results

4.1. Descriptive Features of the Extracted Data

This section summarizes the main descriptive indicators of the database under analysis. We first provide a concise overview of the dataset’s composition, then examine the temporal dynamics of scholarly output to identify trends over time, and finally analyze the geographic distribution of publications to reveal the countries and regions that have contributed most substantially to this research field.

4.1.1. General Overview

Table 1 briefly presents the descriptive information on the dataset analyzed, thereby providing a general overview that serves to frame the present study and guide the subsequent discussion.
The period under investigation extends from 1978 to 2025, during which a total of 647 scholarly publications were disseminated across 235 journals. The annual growth rate observed over these five decades is 8.94%, indicating sustained expansion in the field. The mean citation count of 35.68 per document and an average annual citation rate of 4.13 per document. These averages reflect a skewed citation profile in which a subset of publications accrues substantially more attention than the remainder of the sample. The mean document age is seven years, indicating that the dataset predominantly comprises work published within the last decade.
The collection is characterized by substantial topical diversity, reflected in 1922 authors’ keywords and 3800 Keywords Plus entries, which together signal a broad and interdisciplinary research agenda. The selected documents list 2374 distinct authors contributing a total of 3066 authorships. Collaborative activity is pronounced: the mean number of authors per paper is 4.74, only 40 papers are single-authored, and 25.66% of publications involve international co-authorship, underscoring frequent cooperation among research teams across national boundaries.

4.1.2. Temporal and Geographical Trend

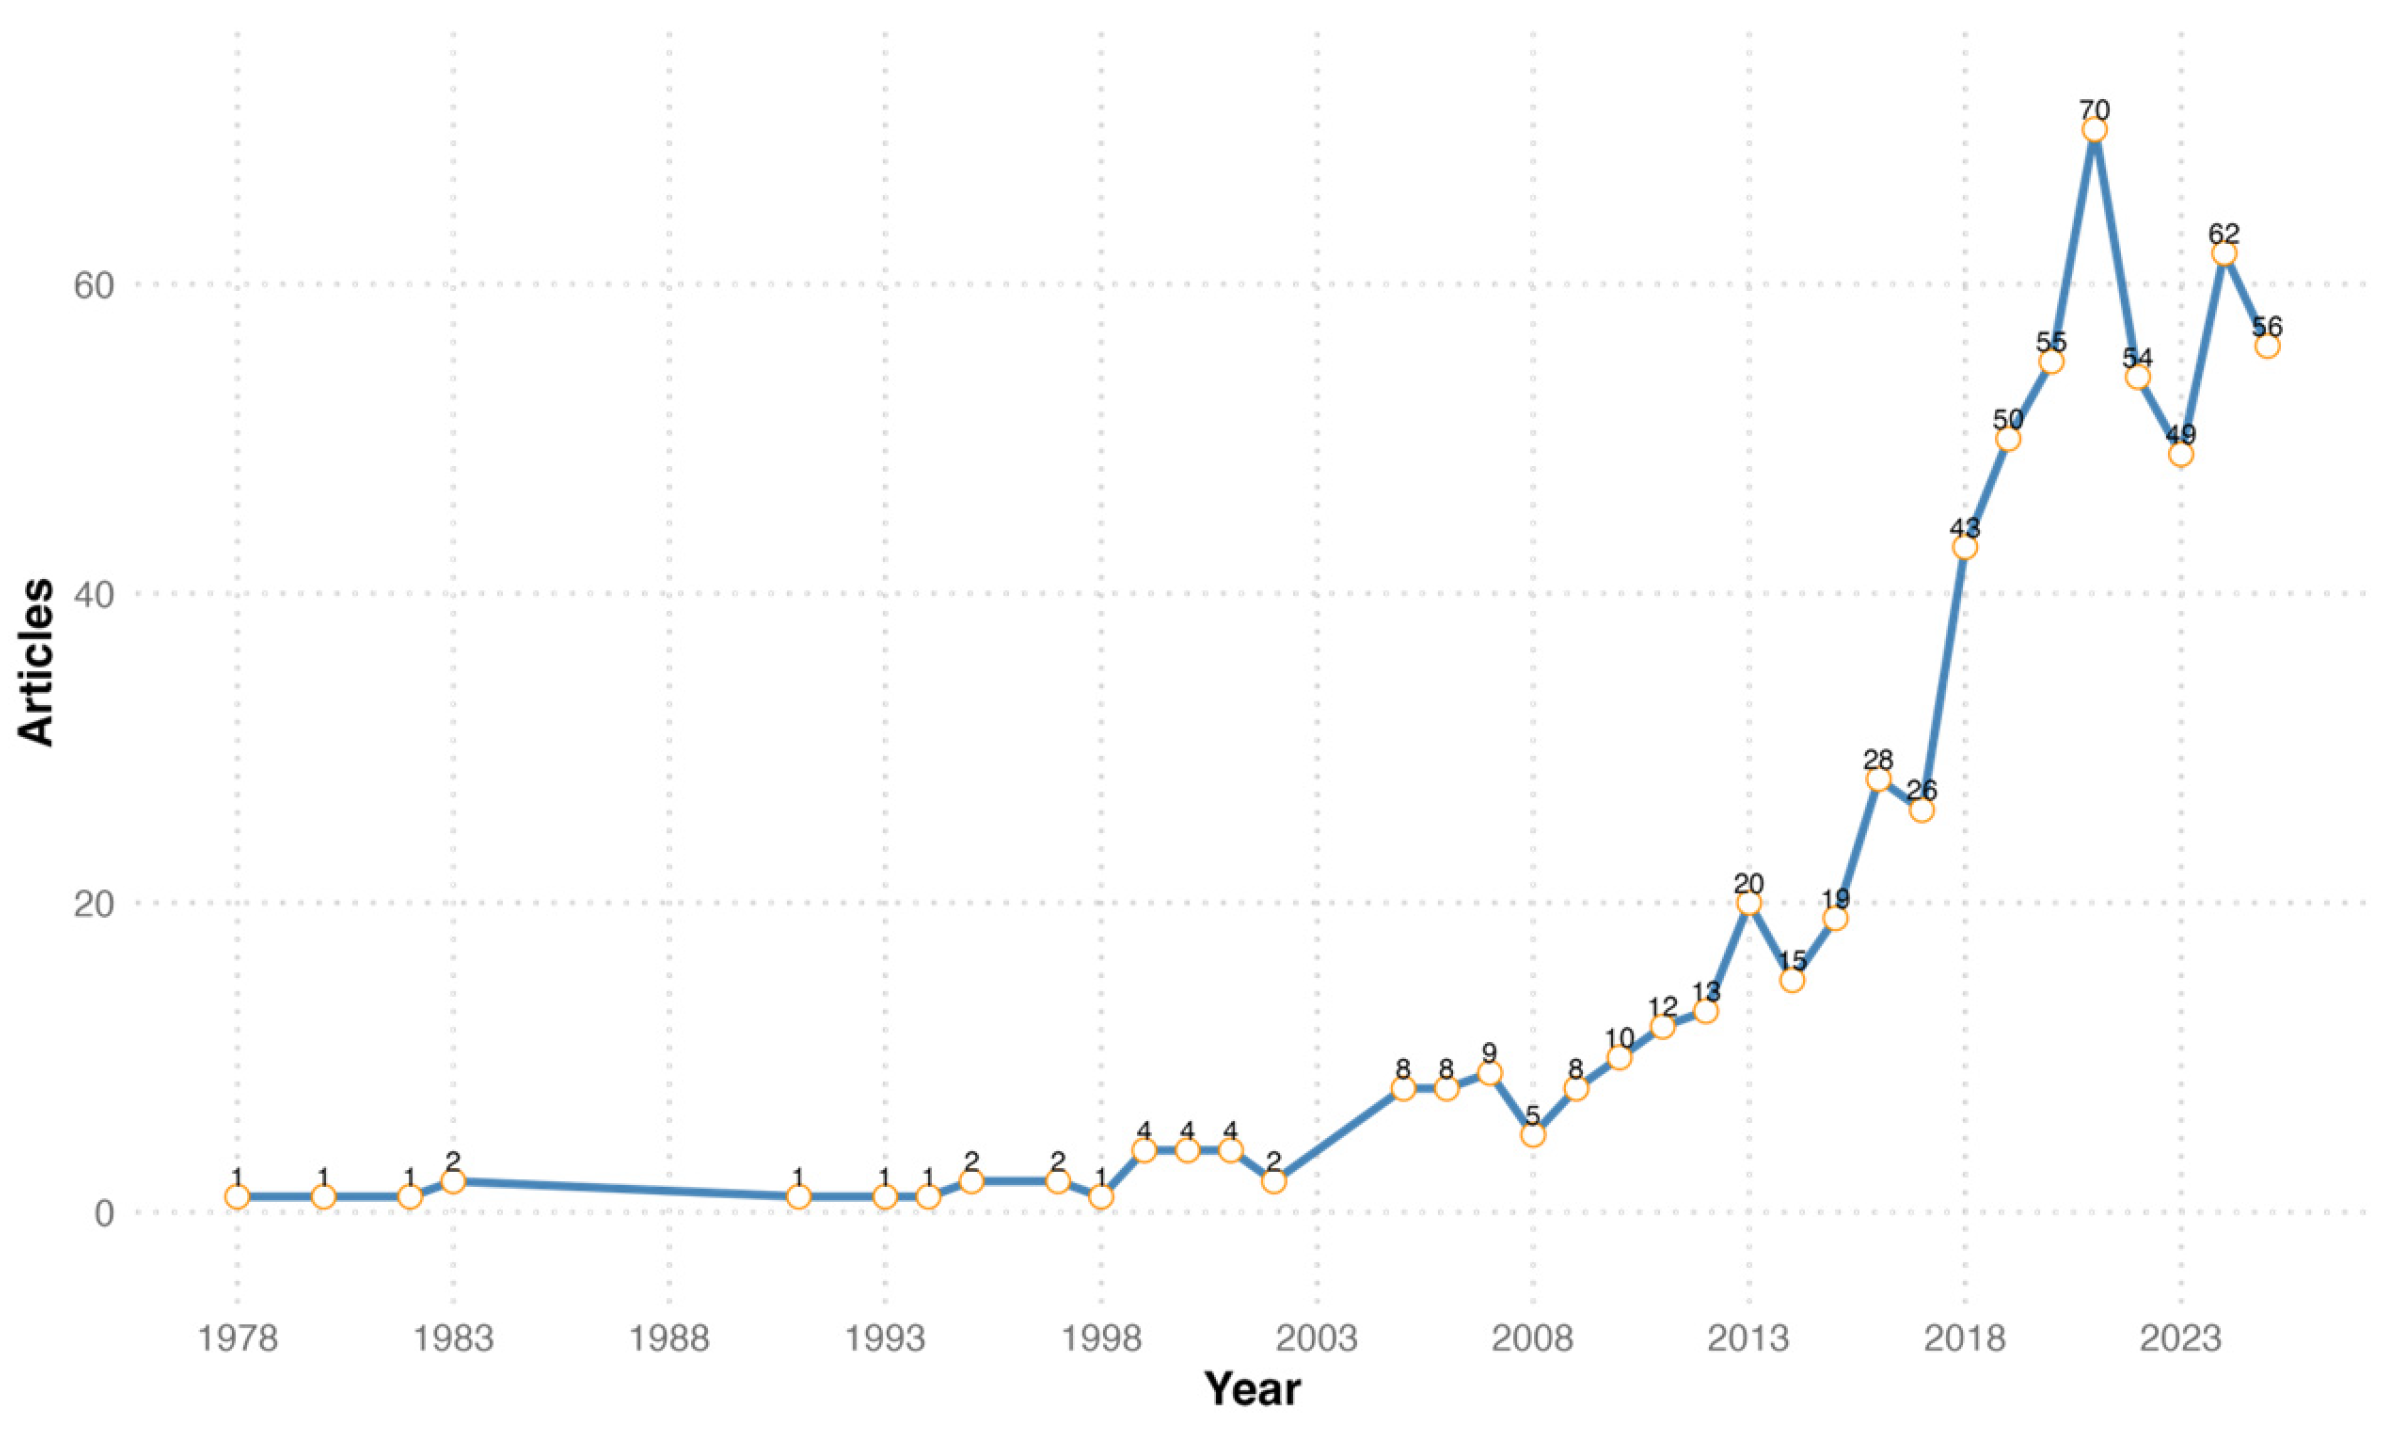
Figure 2 illustrates the evolution of publications and citations of the selected articles over the years. The output has followed a steady upward trajectory in this context. Applications of the EEIO model in agriculture have increased markedly over time. The highest growth rate occurred around the time of the Paris climate agreements; indeed, from 2015 onwards, there has been an exponential increase in publications, underscoring the importance of the topic and the attention it has attracted from the scientific community, likely supported by dedicated funding schemes from national governments.
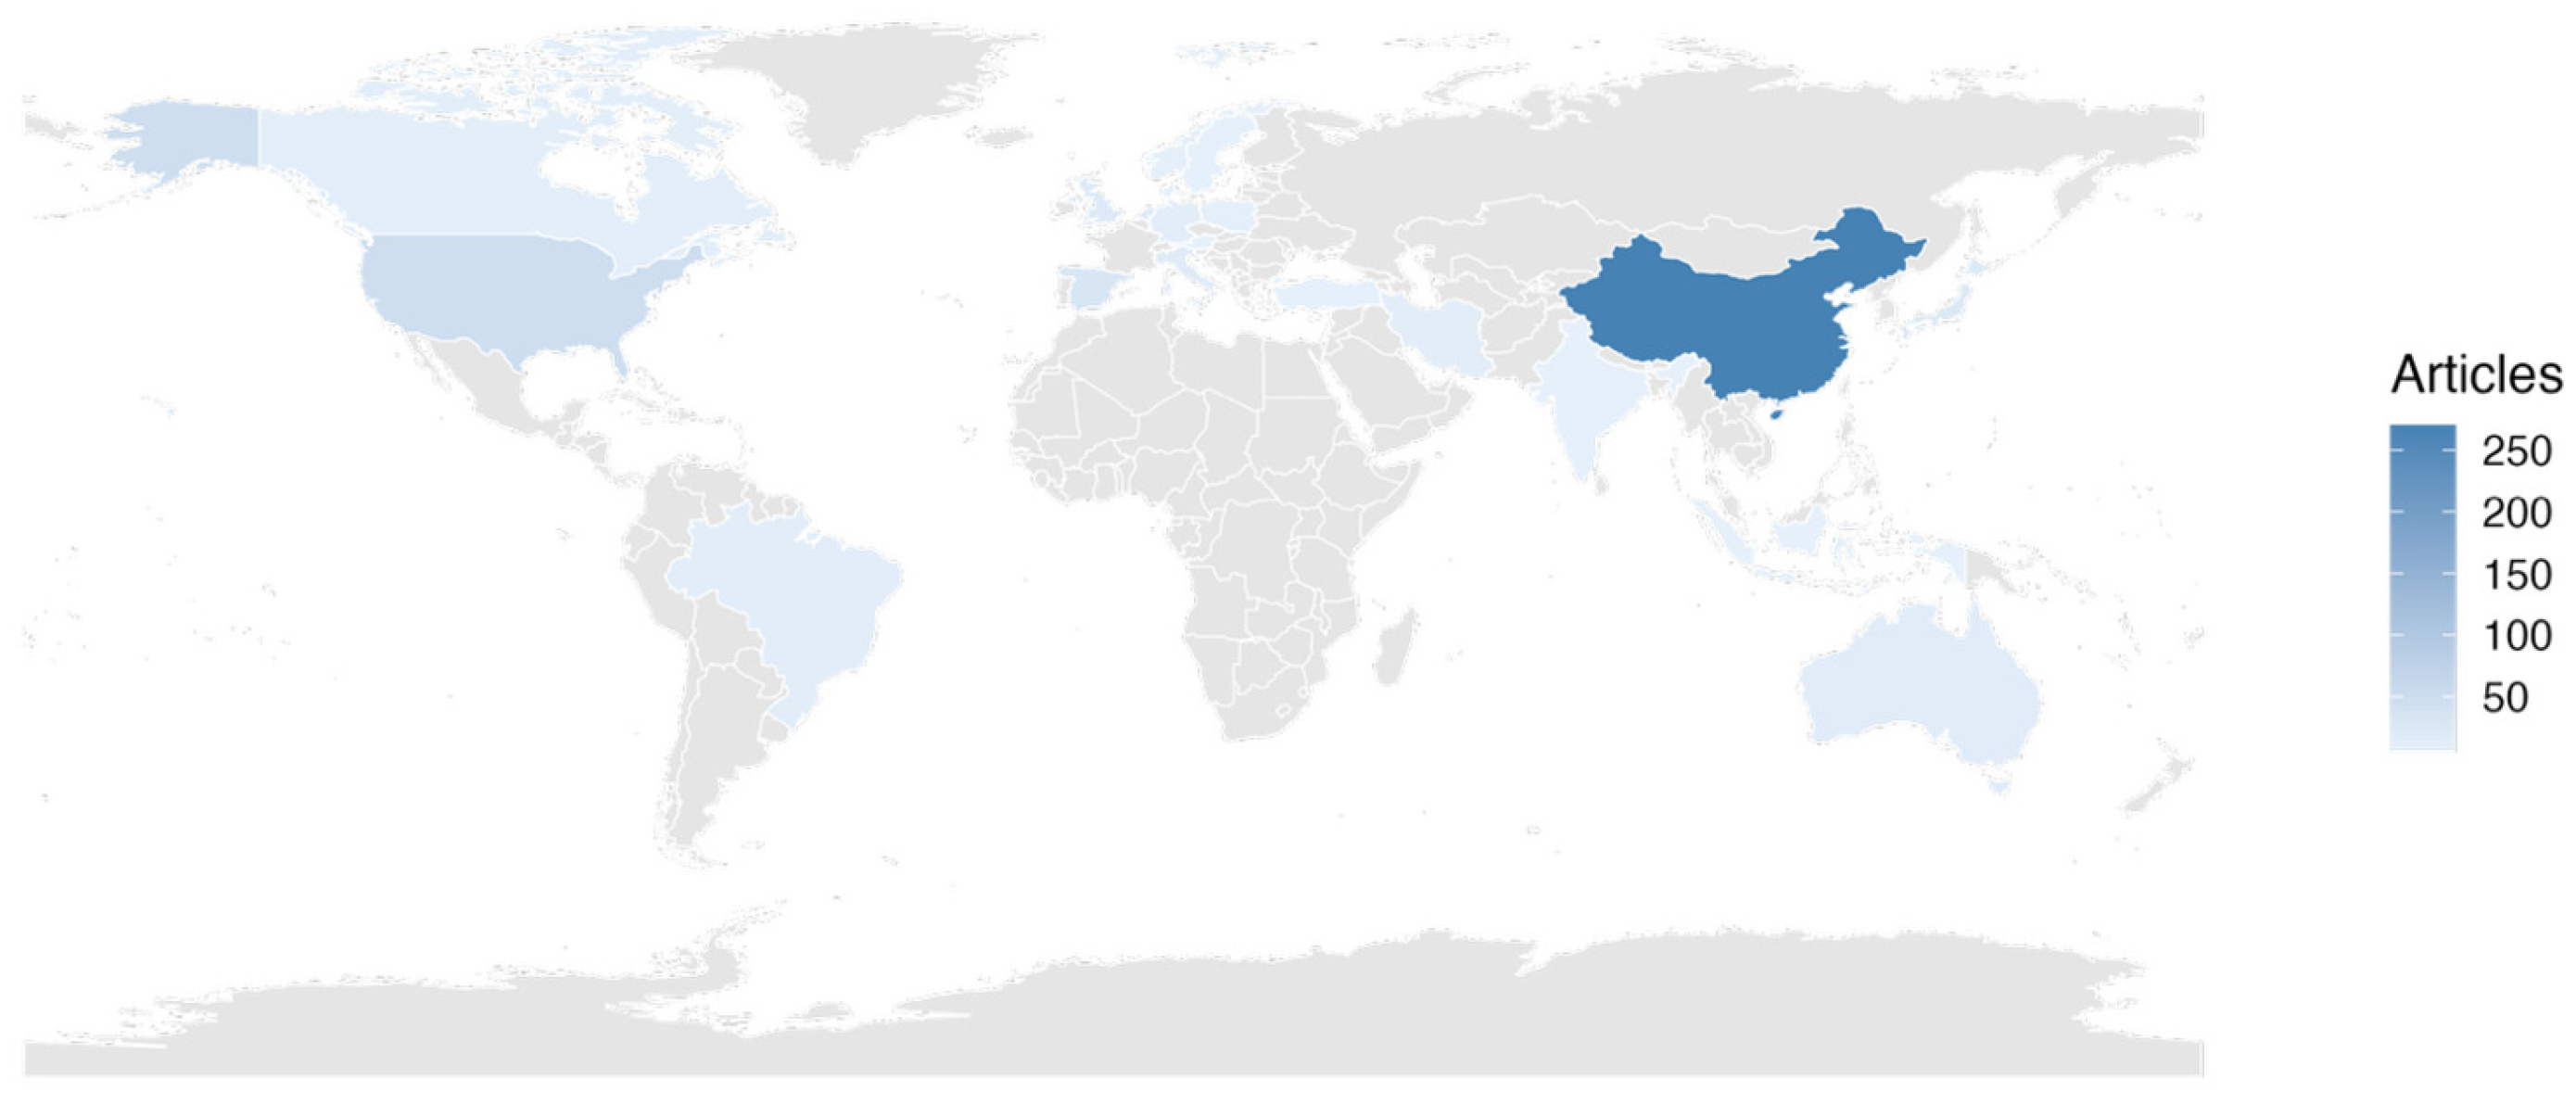
Figure 3 indicates the top 20 countries that have contributed most to the application of the EEIO model to the agricultural system. China dominates the ranking, with a total of 270 published papers, and is therefore highlighted in red in the figure, followed by the United States with 47 papers and Spain with 29. Overall, the top 20 countries account for 82% of all contributions included in our dataset. One factor that may help explain China’s predominance in this field is the significant role the country plays within global agri-food supply chains.
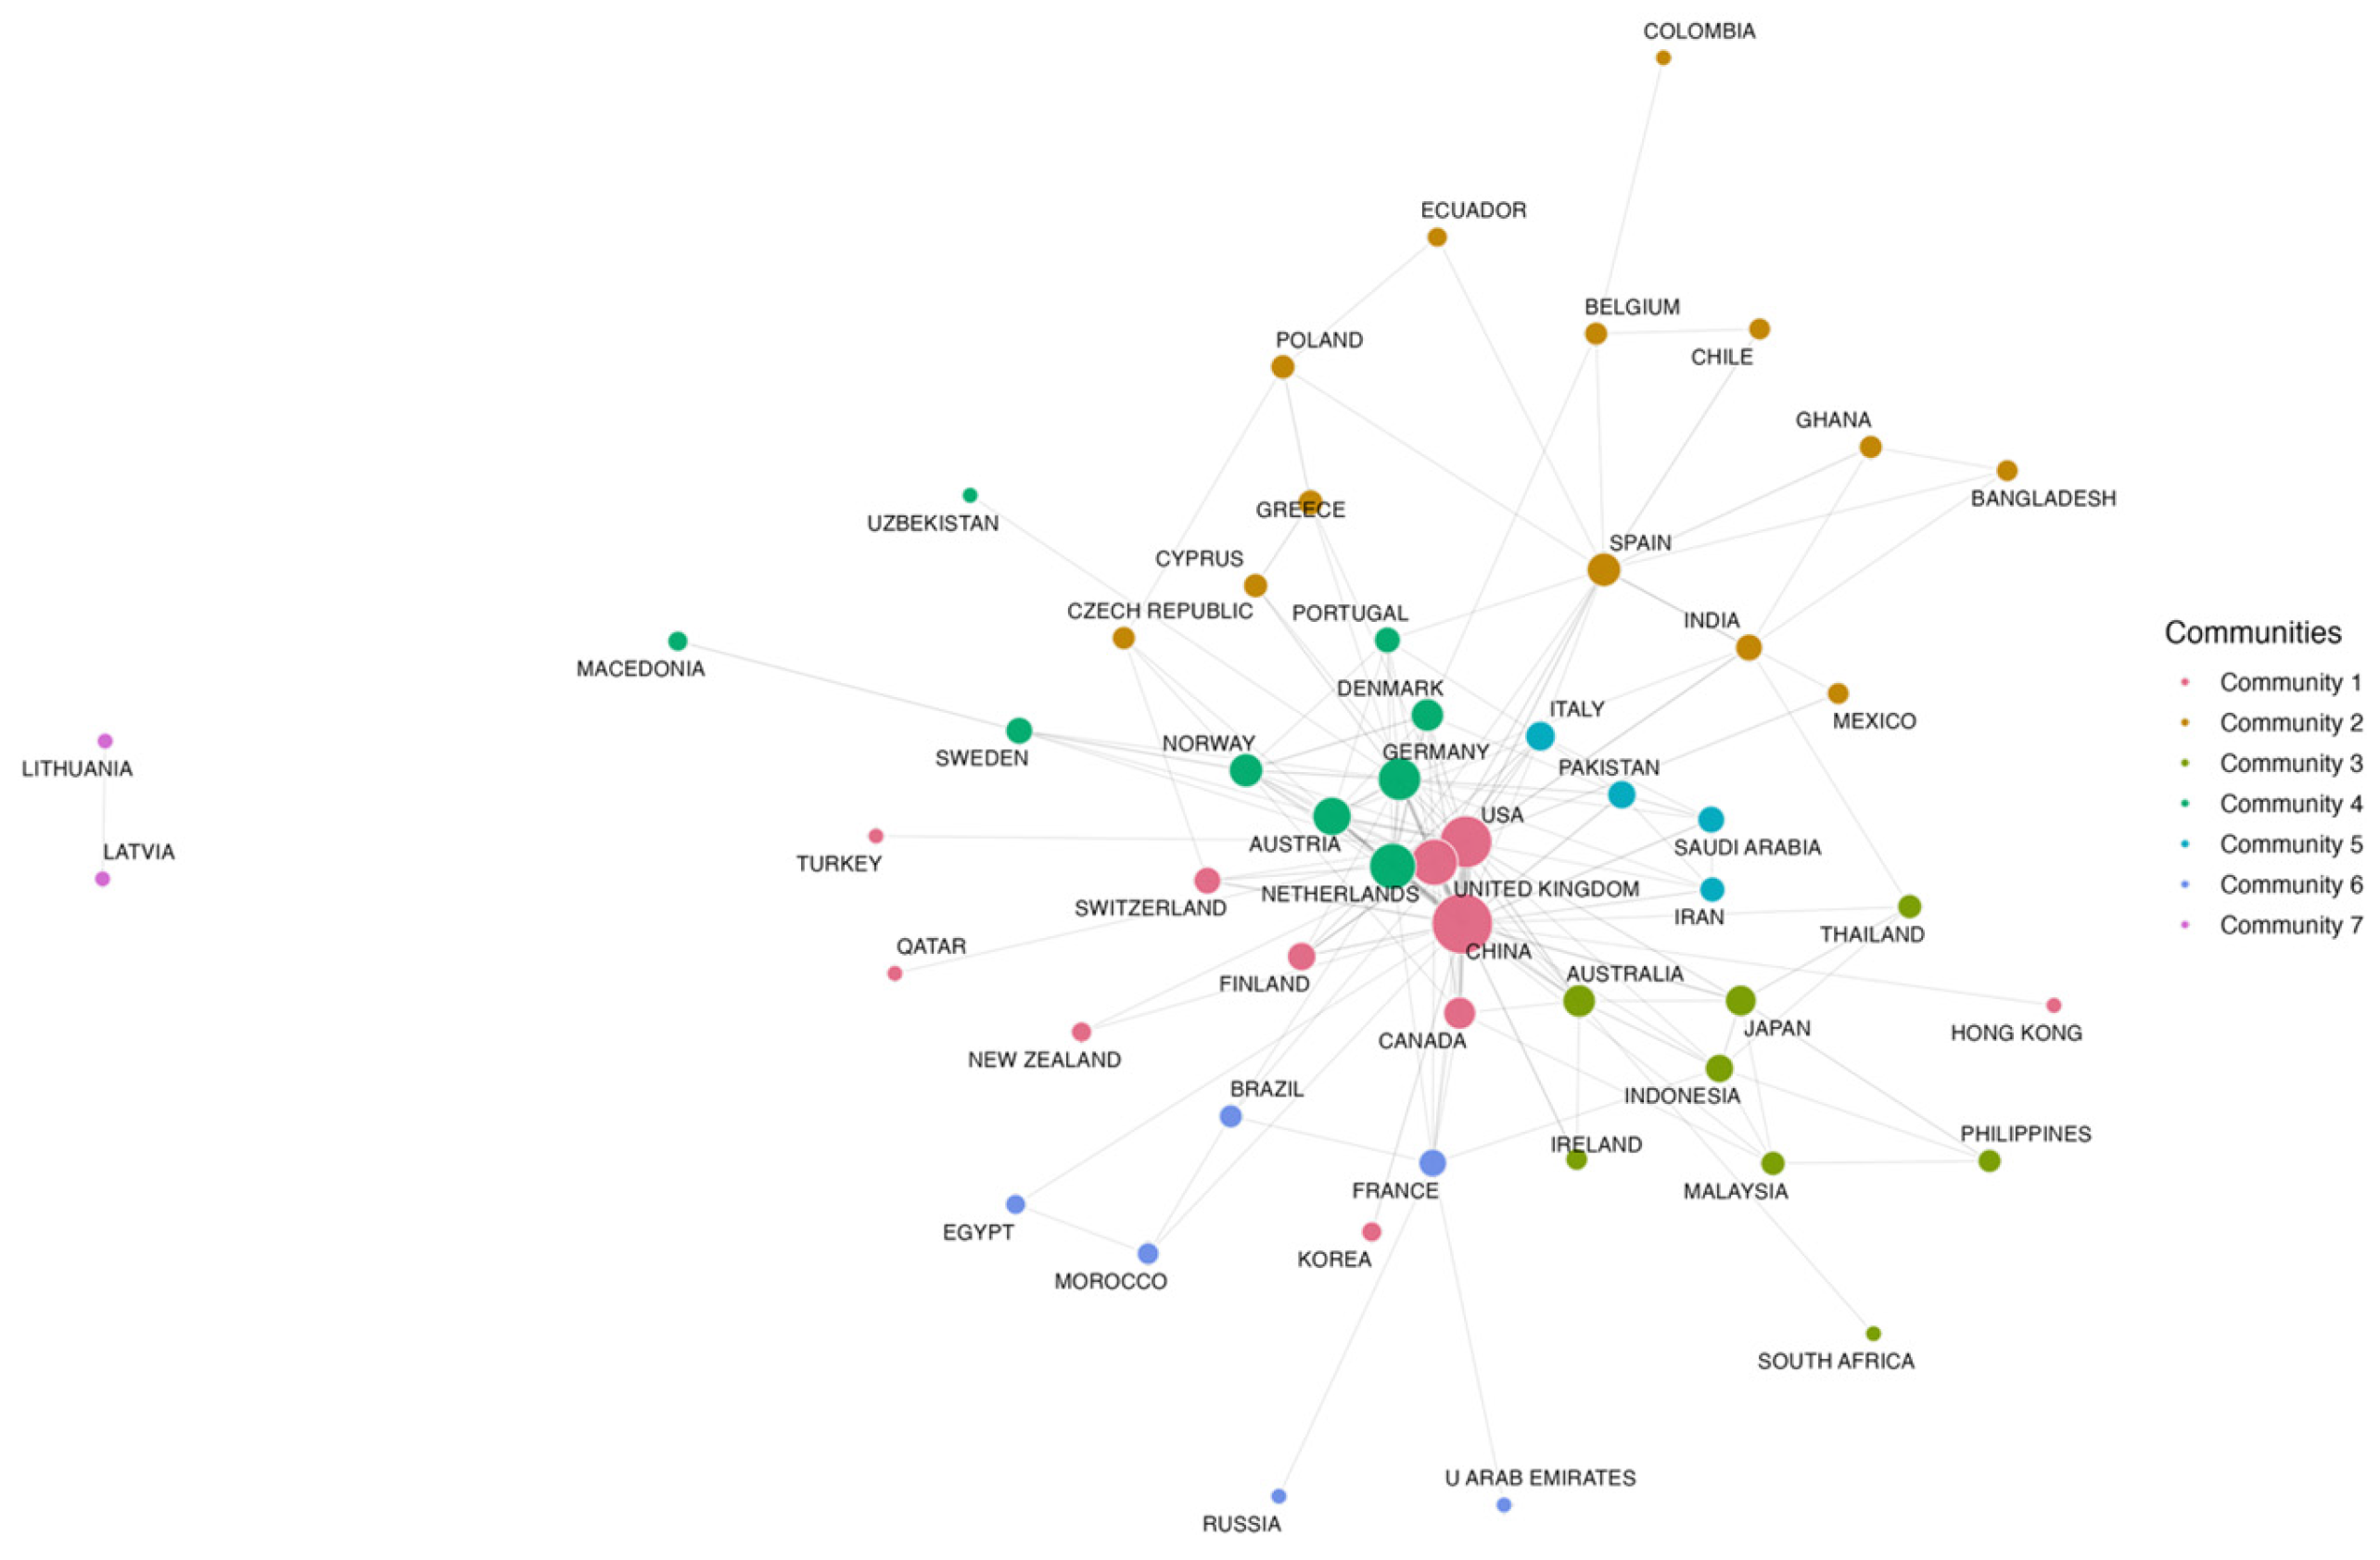
To provide a more detailed picture of international collaboration, Figure 4 presents the collaboration network linking countries worldwide. The finding reveals distinct communities of cooperation among scholars from different countries. China, recognized as the leading contributor to the literature on the application of the EEIO model in agricultural systems, occupies a central position in the collaboration network, acting as a crucial node for many international partners and displaying a strong connection with the United States. A prominent European collaborative cluster also emerges, involving Italy, Germany, the Netherlands, the United Kingdom, and Norway.
Based on the aforementioned findings, the contributing countries may be classified according to two complementary dimensions—shared regulatory frameworks and levels of economic development—to enhance interpretability within a policy-relevant analytical framework. This classification reveals distinct clusters that align research agendas with institutional contexts and national priorities. A prominent European collaborative cluster emerges, encompassing Italy, Germany, the Netherlands, the United Kingdom, and Norway. These nations operate under harmonized regulatory architectures, most notably the European Union’s Common Agricultural Policy (CAP), the Green Deal, and associated environmental directives. Such frameworks promote standardized application of environmentally extended input–output (EEIO) models and facilitate cross-border data sharing, thereby enabling coordinated research on sustainable agriculture and resource management. The data further exhibit a clear dichotomy between emerging and developed economies. China, as a leading emerging economy, directs its research output toward strengthening global agri-food supply-chain resilience and safeguarding domestic food security. In contrast, the United States—alongside the European cluster—represents developed economies characterized by mature environmental accounting standards and an emphasis on technological innovation in sustainable agriculture. This grouping underscores how regulatory cohesion and developmental stage jointly shape the orientation and applicability of scholarly contributions in the field.
While this review provides a comprehensive overview of EEIO applications in agriculture, several limitations must be acknowledged. First, the geographical distribution of publications is heavily skewed, with China accounting for a disproportionate volume of the literature (270 papers vs. 47 for the US). This dominance may reflect specific national funding priorities rather than a global consensus, potentially limiting the generalizability of the findings to regions with lower research output. Second, the reliance on English-language databases may exclude significant local policy studies published in native languages, particularly within the European and South American contexts. Finally, the correlation between publication spikes and policy events (e.g., the 2015 Paris Agreement) is observational; while funding schemes likely supported this growth, direct causal links between specific national policies and publication output require further granular analysis.

4.2. Keywords Analysis

An analysis of the keywords provides insight into the conceptual structure of the field and helps delineate the principal thematic domains that have shaped scholarly developments in the application of EEIO models to the agricultural sector. The analysis was conducted by considering both Keywords Plus (ID) and Author Keywords (DE), and then performing a cluster analysis on the 100 most frequently used keywords in order to identify the main thematic areas. The analysis concludes with an examination of temporal trends over the last ten years, with the aim of understanding the directions in which research is currently evolving.

4.2.1. Most Frequent Keywords

Table 2 and Table 3, respectively, indicate the top twenty DE keywords, i.e., those provided directly by the authors, and the top twenty ID keywords, which are automatically assigned by the databases in which the articles are indexed.
A comparative analysis of the two tables reveals no substantial differences in the dominant themes identified by author-supplied keywords (DE) and database-assigned keywords (ID). The primary distinction lies in the absolute frequency of term occurrence. In both cases, the core vocabulary centers squarely on the Input–Output framework, with terms such as “input-output analysis,” “input-output model,” and “input-output” among the most frequently cited. A meaningful point of comparison between DE and ID concerns the main application topics: both tables consistently feature keywords related to climate change and resource use, including “carbon/carbon footprint”, “land use”, “water supply/water footprint”, and “energy”. This pattern indicates that the EEIO approach is primarily employed in the literature to quantify environmental pressures along agricultural supply chains. Likewise, the presence of terms such as “virtual water” and “water footprint” in Table 2 suggests a specific author-driven focus on water resources and on the pressures that agricultural production systems exert on them.
A further comparison concerns analytical approaches. The DE keywords (Table 2) explicitly highlight specific methodological techniques, as reflected in the recurrent use of terms such as “multi-regional input-output analysis/model”, “structural decomposition analysis”, “Structural path analysis” and “life cycle assessment”. These keywords indicate that authors frequently frame their contributions through emphasis on the analytical methods employed. In contrast, the ID keywords (Table 3) place greater emphasis on broader thematic categories—such as “environmental impact”, “economic analysis”, “trade”, and “consumption”—which is consistent with the logic of automated indexing adopted by the bibliographic databases in which these contributions are recorded. Finally, based on geographical analysis, the prominence of the term “China” reinforces the centrality of the Chinese context within scientific output in this research domain. Overall, the comparison between DE and ID keywords provides a concise overview of the field: it confirms a strong focus on key environmental dimensions of agricultural-system analysis (carbon, water, land, and energy), while also highlighting the diversity of analytical approaches employed, including multi-regional input-output analysis (MRIO), structural decomposition analysis (SDA), spatial analysis (SPA), and integrated input-output–life cycle assessment (IO–LCA) frameworks.

4.2.2. Cluster Analysis

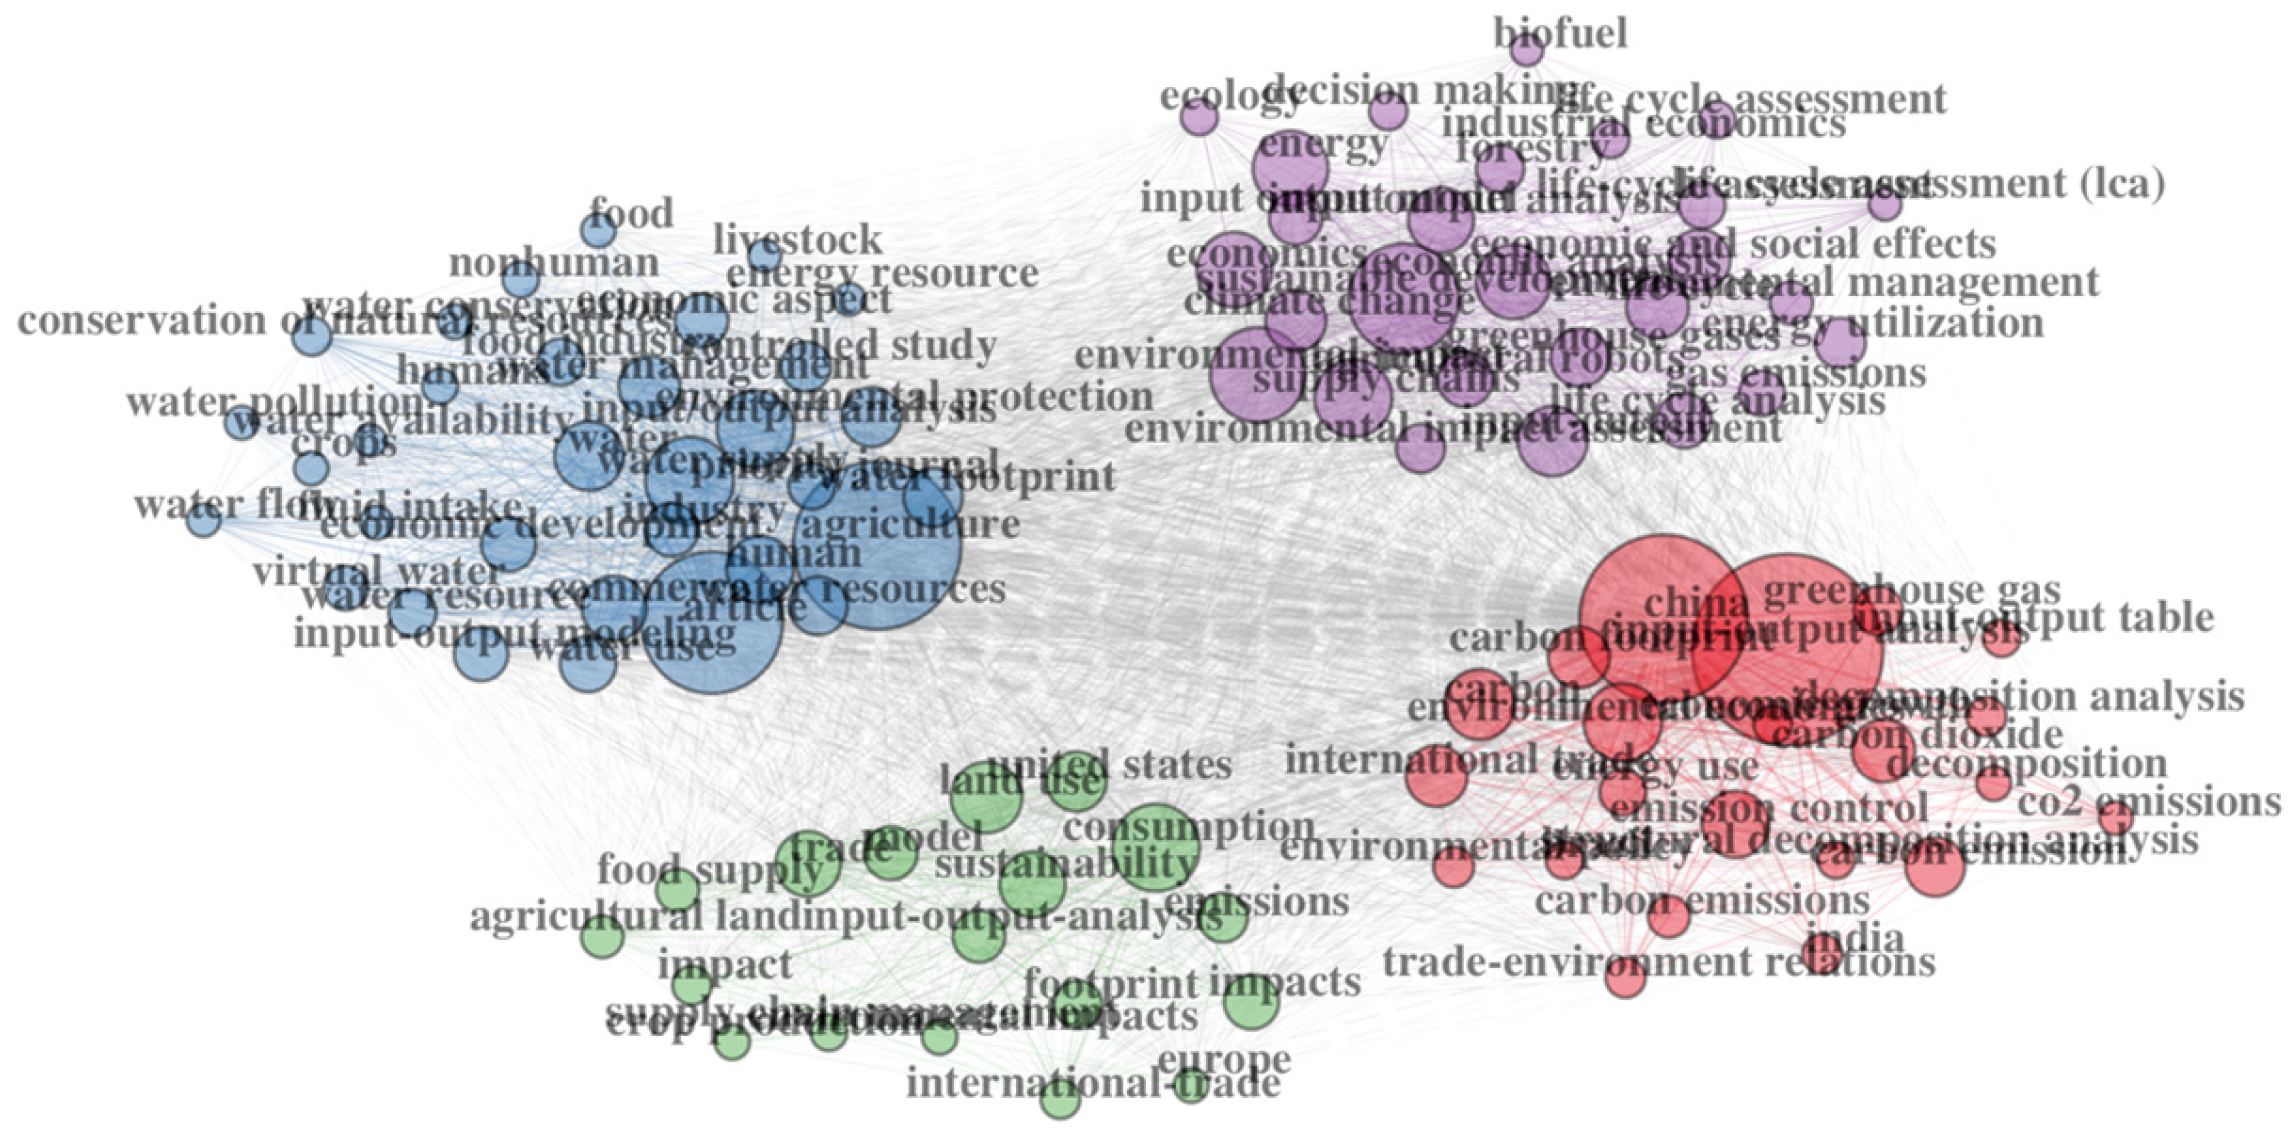
To obtain a more detailed description of the topics addressed and of the application of the EEIO model to agriculture, we performed a co-occurrence analysis of keywords, focusing on the 100 most frequent terms in the corpus under study. The keyword map, shown in Figure 5, was generated using the Bibliometrix library, which enabled us to construct semantic networks based on the frequency with which terms co-occur within the documents analyzed. Partitioning the keyword map into clusters enabled the identification of coherent thematic groupings, which in turn elucidate the principal lines of inquiry in studies applying the model to the agricultural sector.
The effort to identify the principal thematic cores within the literature on Environmentally Extended Input–Output (EEIO) applications in agriculture led to the delineation of four distinct thematic clusters. Each cluster captures a coherent set of research orientations and recurring concepts within the field. These clusters are outlined below:
  • Cluster 1—Carbon, trade, and environmental policy (red): This cluster encompasses keywords pertaining to emissions estimation, the design of environmental policies, and the reconstruction of international flows associated with the production and consumption of agricultural goods. The thematic core centers on analyzing emissions embodied in trade by tracing flows along the entire agrifood value chain. This underscores the ability of EEIO analysis to assign environmental pressures not only to the geographic sites of production but also to the demand- and trade-driven systems that induce agricultural activity. In this regard, agriculture emerges as a pivotal component of the global carbon budget and of related mitigation efforts, because its climate footprint is determined by intersectoral linkages and cross-border exchanges generated by the international fragmentation of production.
  • Cluster 2—Agriculture and water resources (blue): This cluster encompasses terms associated with agricultural systems and water-resource management, thereby underscoring the relevance of the EEIO framework in this domain. In particular, EEIO enables water use to be traced across the entire supply chain, supporting the identification of hotspots and the assessment of inefficiencies within agrifood production. Beyond conventional water-footprint accounting, this cluster also reflects broader perspectives in which water is examined as a fundamental component of the WEF nexus. In this case, EEIO has been widely applied to link demand for agricultural products not only to direct water withdrawals, but also to the energy use and chemical inputs required for production, thus providing an integrated view of intersectoral interdependencies.
  • Cluster 3—Energy and environmental/climate impacts (purple): This cluster includes keywords that relate to analyses of the energy and climate impacts of agricultural systems, often referencing integrated methodological approaches, such as the combined use of EEIO and Life Cycle Assessment. The cluster indicates that emissions and energy use extend beyond agriculture’s sectoral boundaries and must be assessed across entire supply chains to accurately capture their magnitude and distribution. This perspective underscores the importance of EEIO analysis for quantifying climate-related environmental pressures and for clarifying trade-offs between productivity, energy efficiency, and reductions in greenhouse gas emissions.
  • Cluster 4—Sustainability of agrifood supply chains (green): The principal focus of this cluster is the sustainability of agrifood supply and value chains, signaling a body of research devoted to holistic assessments of sustainability performance—encompassing management practices, traceability mechanisms, and governance of the transition. Within this framework, EEIO analysis contributes to these evaluations by mapping the relationships among intermediate inputs, production activities, and final consumption, and by supplying comparable indicators that can guide policy and strategic decisions to reshape agrifood systems.

4.2.3. Trend Topics

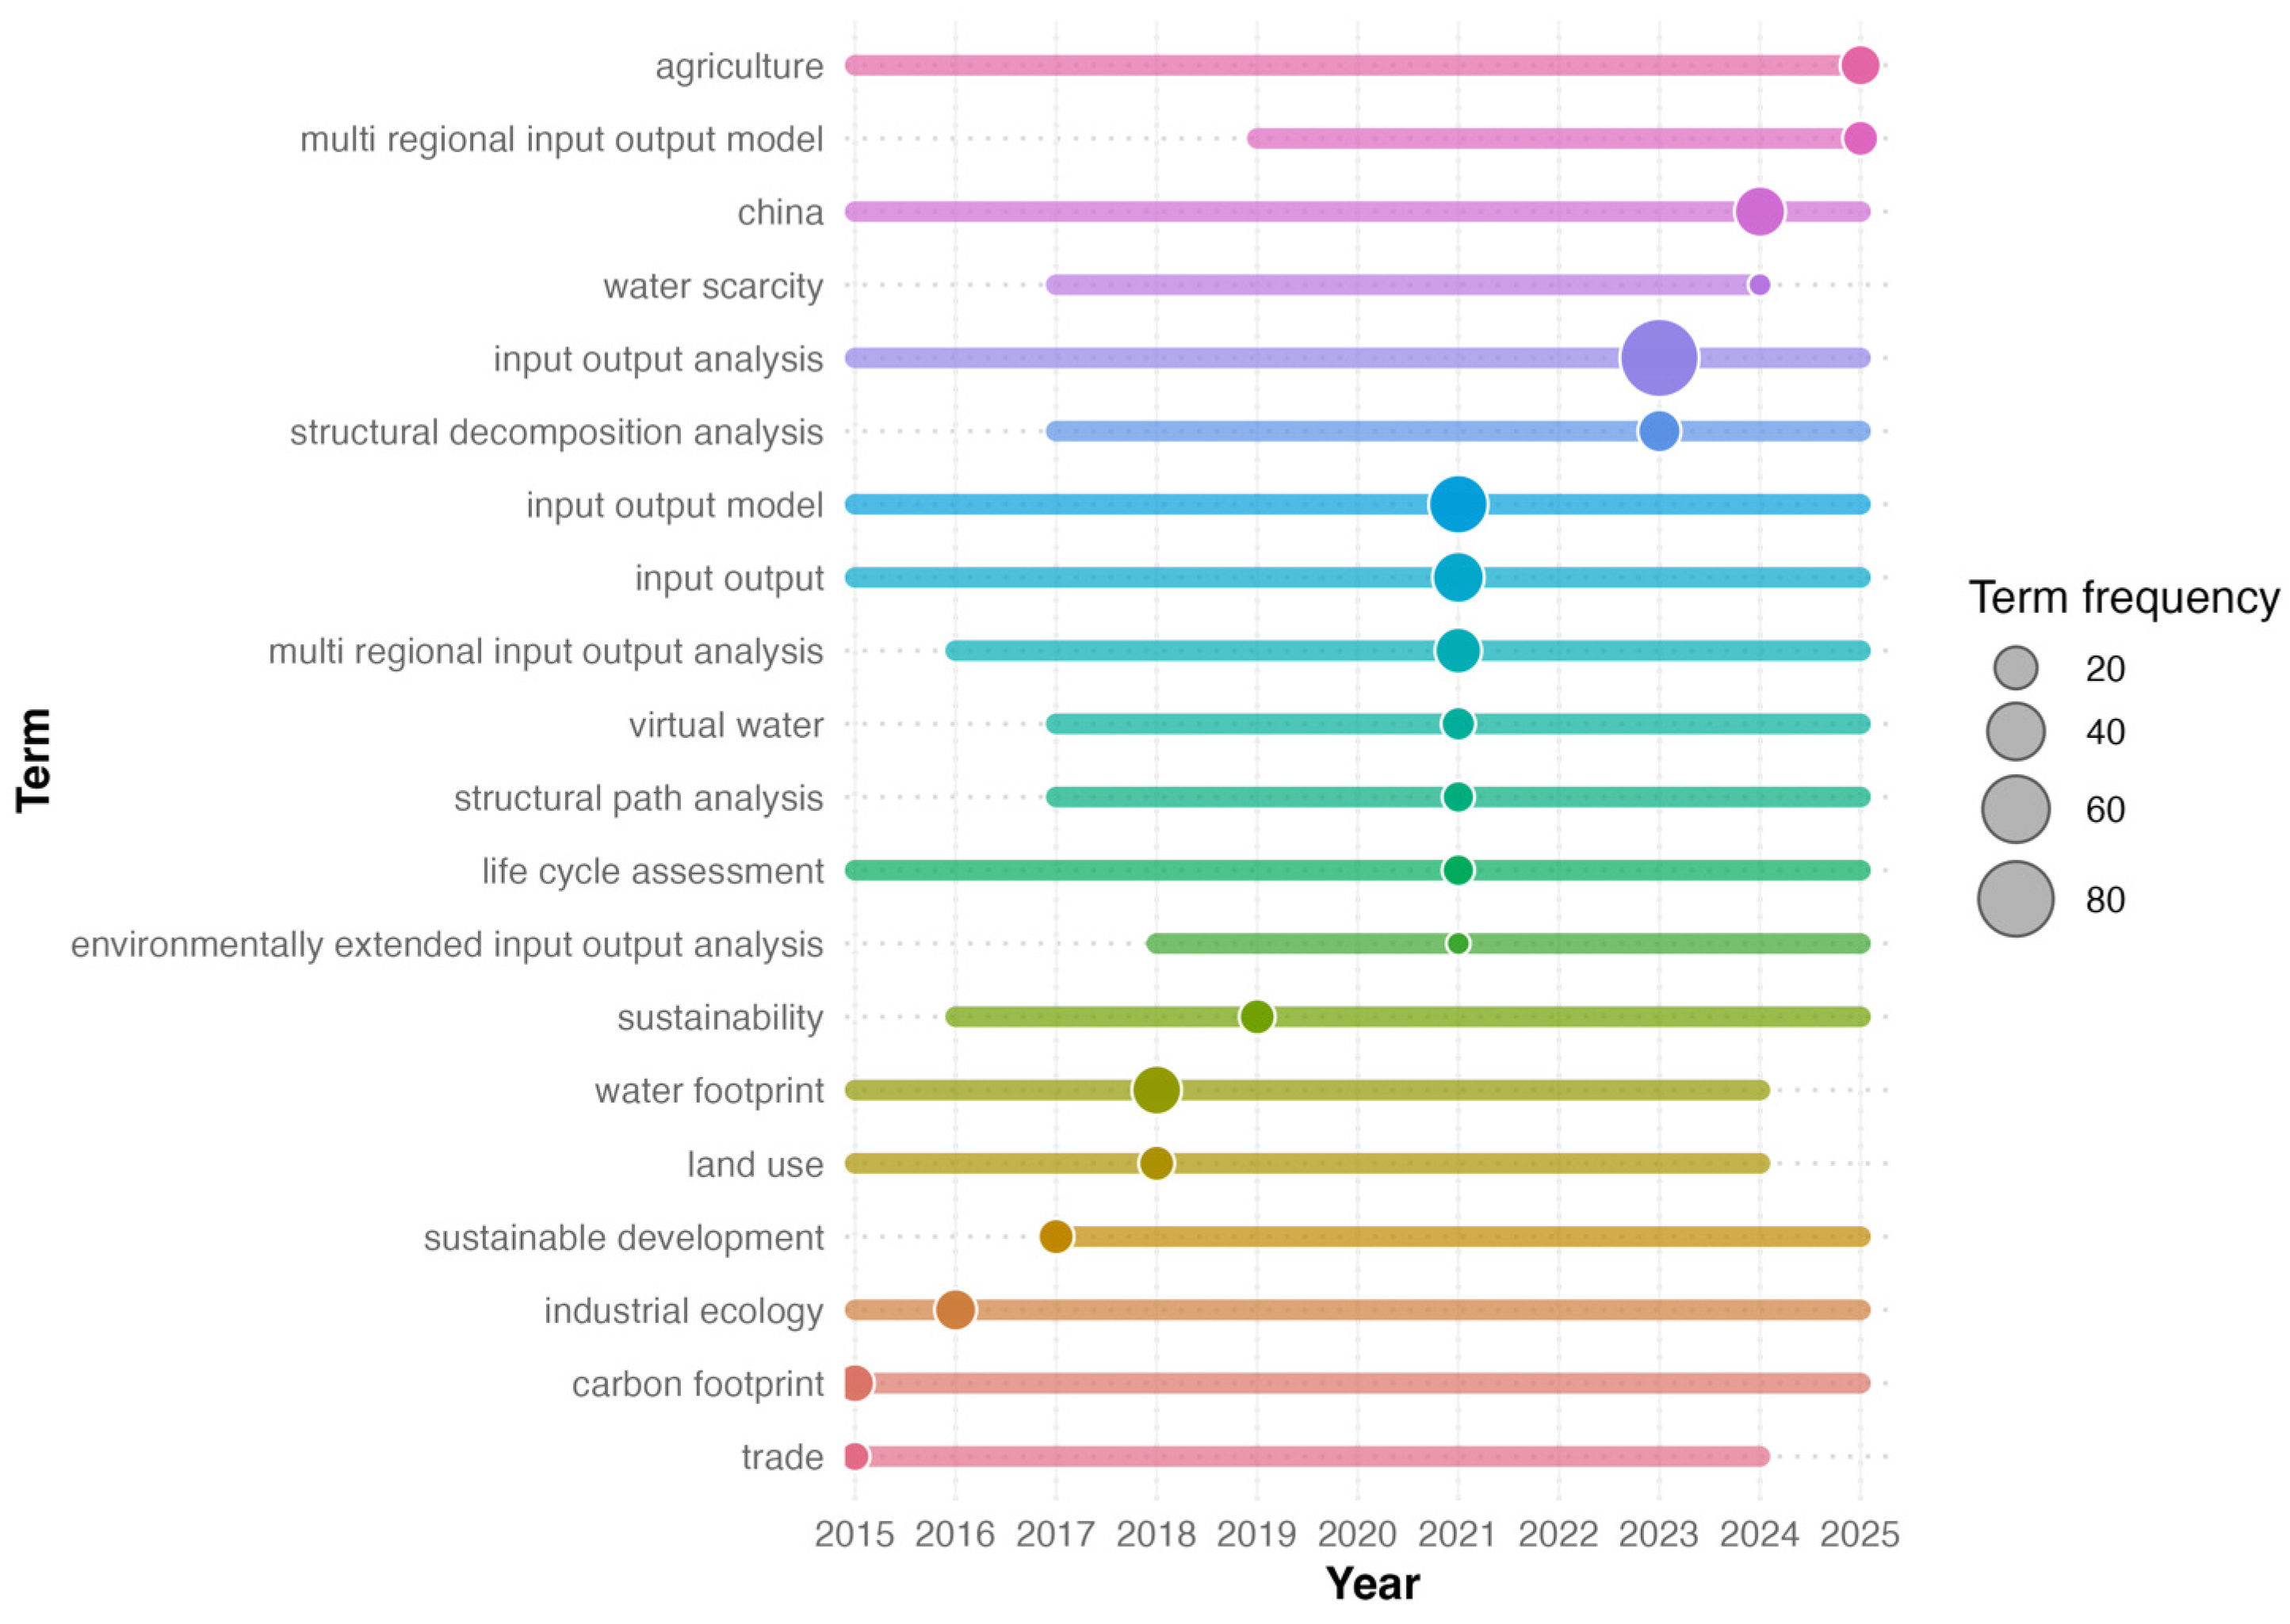
Regarding the keywords, Figure 6 depicts the trend topics by tracing the temporal evolution of the most relevant terms over the last decade, thereby identifying the most recent research frontiers that have emerged in the application of the EEIO model to the agricultural system.
Several terms have remained stable over the periods, including “agriculture”, “input–output analysis”, “input–output model”, and its variants such as “multi-regional input–output model”. The sustained prominence of these keywords corroborates the robustness of the search strategy and affirms that the analysis remains tightly focused on applications of the input–output framework to the agricultural sector. At the same time, recurrent references to life cycle assessment, sustainability, and land use indicate an ongoing convergence between EEIO methodologies, life cycle analysis, and empirical assessments of the environmental impacts of agricultural systems. In addition, a number of topics have gained prominence in recent years, giving rise to new research lines in the analysis of agricultural systems. Among these are structural decomposition analysis and structural path analysis—two analytical techniques that, when integrated with the EEIO framework, enable the decomposition of environmental impacts and the identification of the underlying drivers of emissions or resource use. The growing global attention to water resource management and the increasing awareness of water scarcity are likewise reflected in the scientific literature, as shown by the expanding body of research on water footprint and virtual water. Similarly, terms related to the environmental impacts of agricultural systems continue to consolidate, with research strands devoted to the estimation of carbon footprint, sustainability and sustainable development which are themselves linked to the efforts that have characterized international climate policies in recent years, increasingly aimed at the environmental impact of production systems.
Given the substantial contribution of agricultural production to global climate change, the sector is increasingly examined through the lens of EEIO modelling. This framework supports intersectoral analyses capable of capturing the complexity of interconnected economic activities and their associated environmental impacts.

4.3. Journal Analysis

Examining the journals that have published a significant body of research on the use of EEIO models in agricultural system analysis over time allows for the identification of the outlets that serve as key platforms for disseminating findings in this domain. Such an examination helps researchers recognize the central venues within the field and can guide informed decisions about suitable journals for submitting their work.

4.3.1. Top 20 Journals

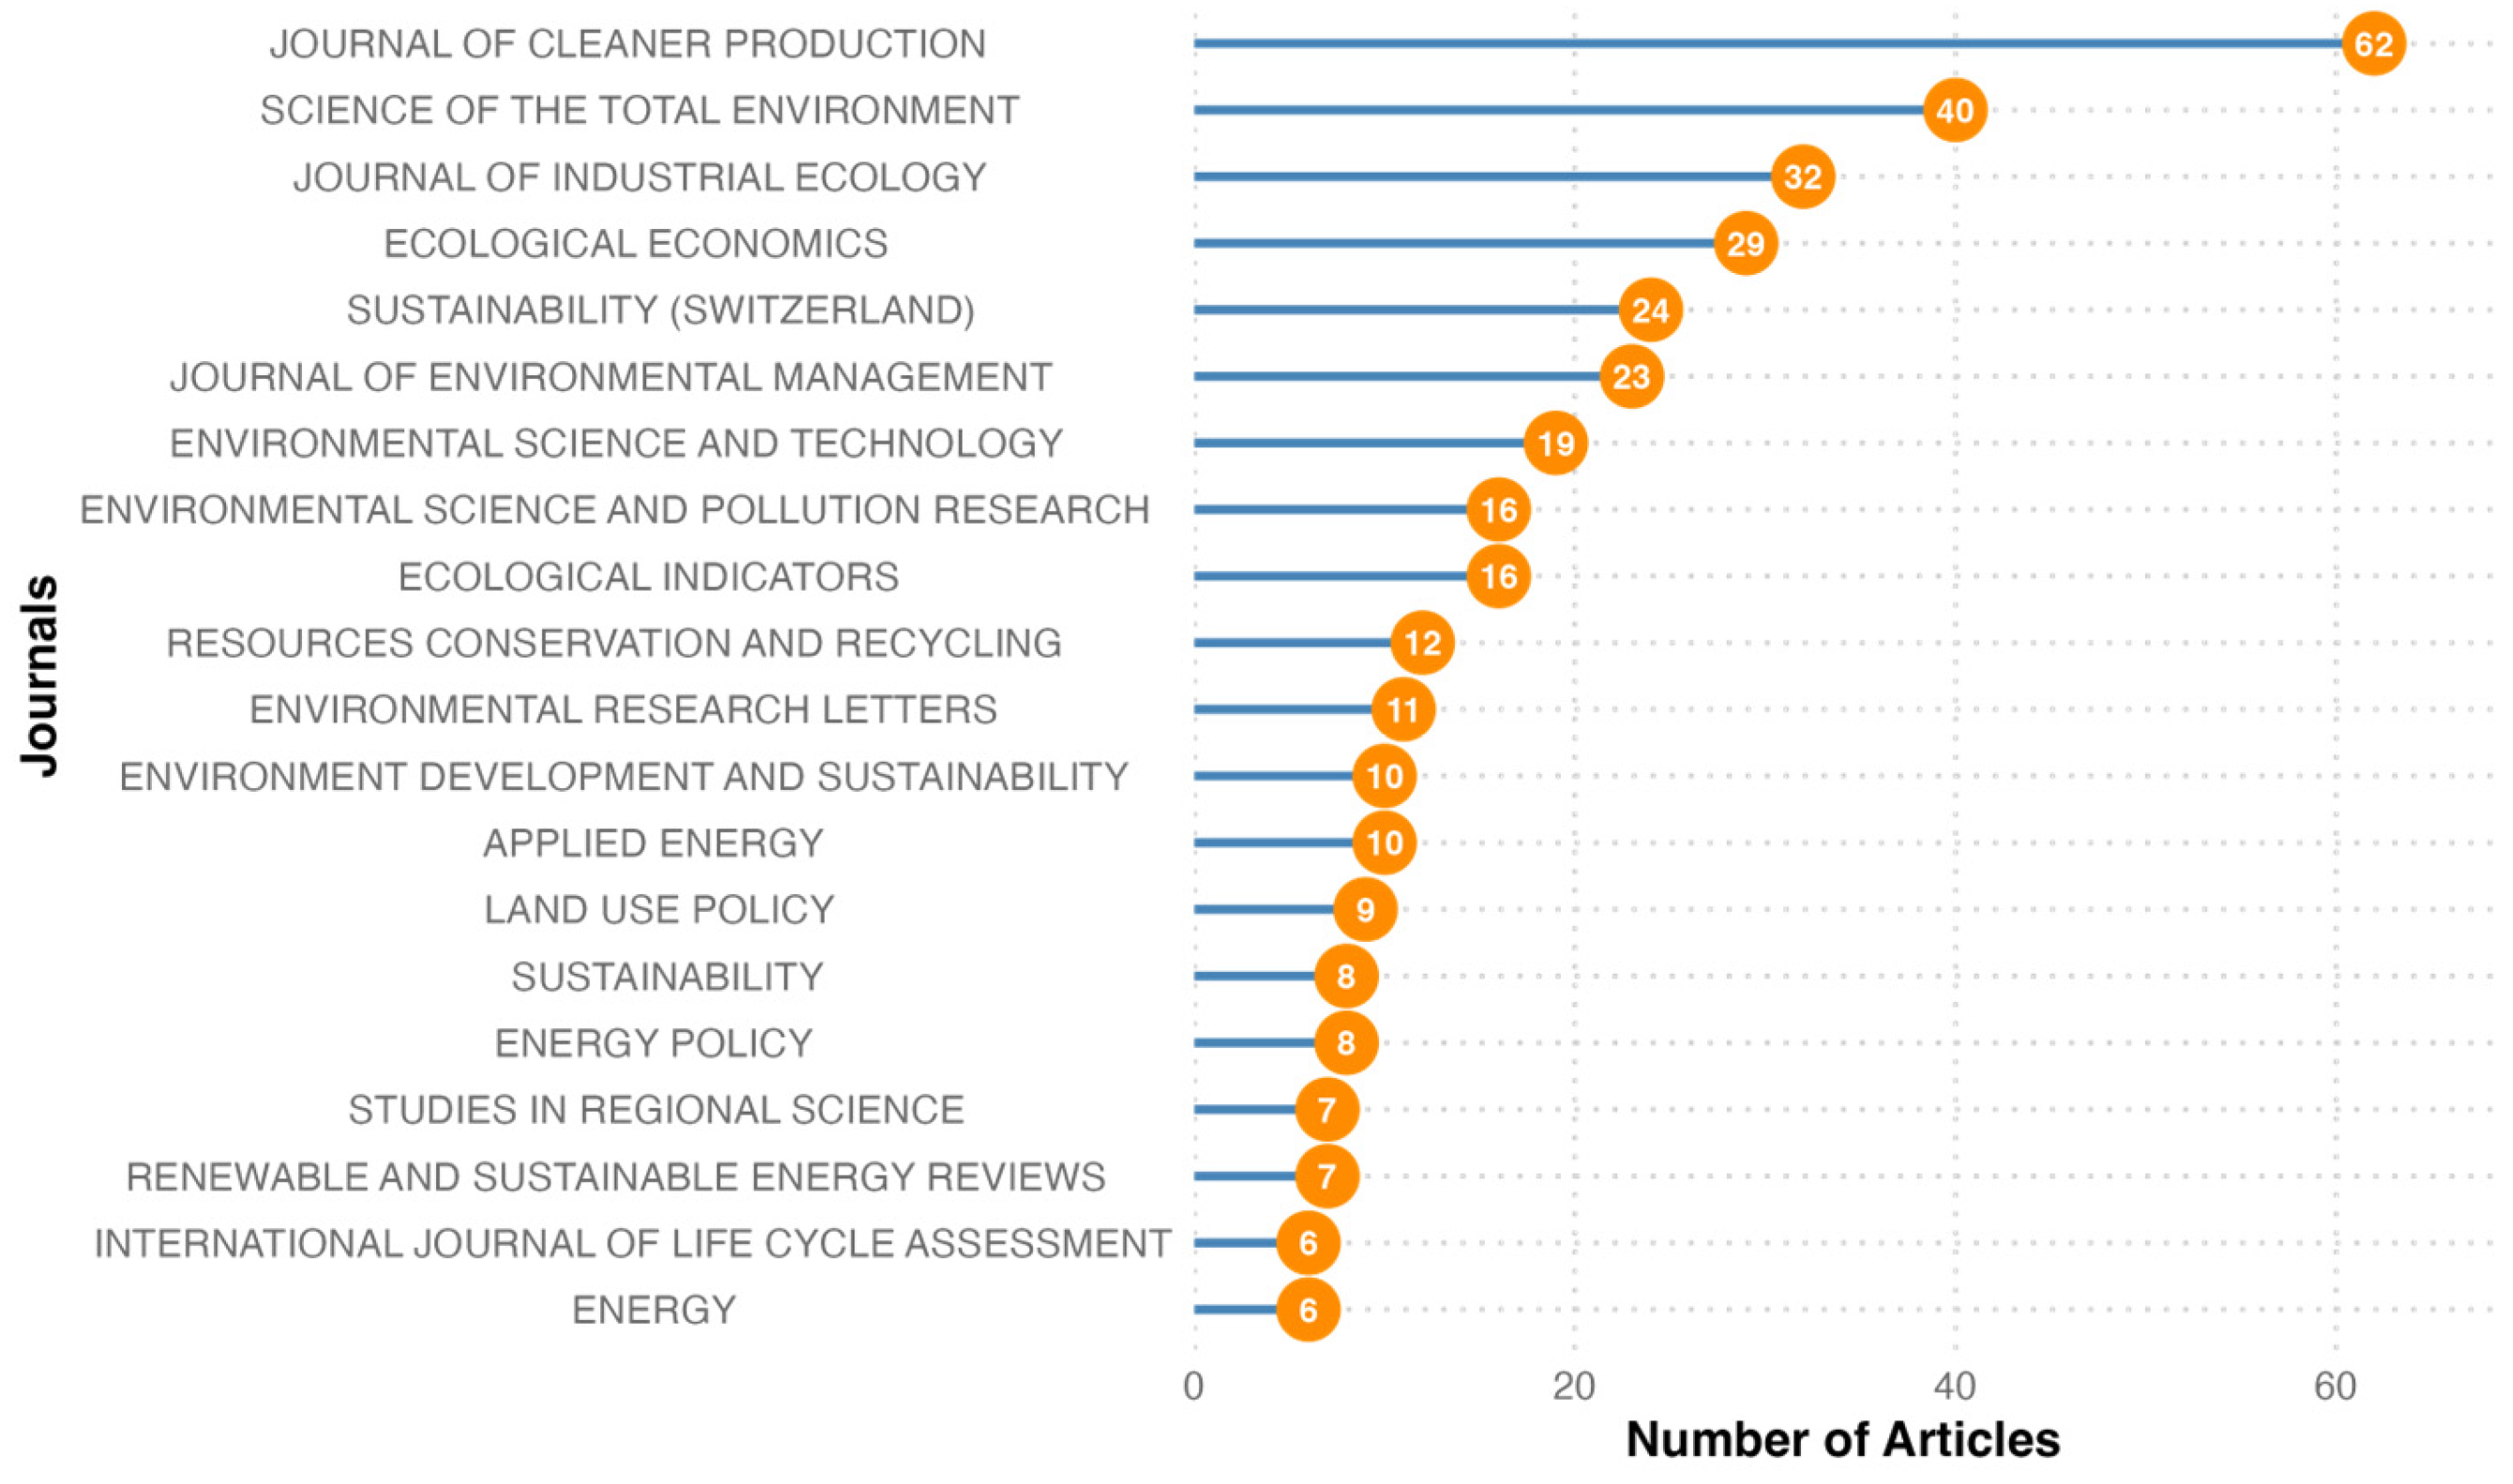
Figure 7 presents a ranking of the 20 journals according to the number of articles on the topic published over the years. As can be seen, the top positions are occupied by journals oriented towards environmental issues and sustainability.
The Journal of Cleaner Production emerges as the leading publication outlet, with 62 articles on the application of EEIO models to agricultural systems, substantially surpassing all other journals. It is followed by Science of the Total Environment with 40 articles and the Journal of Industrial Ecology with 32. A second group of prominent journals includes Ecological Economics with 29 articles, Sustainability (Switzerland) with 24, and the Journal of Environmental Management with 23. Other relevant contributions come from Environmental Science and Technology with 19 articles, as well as Environmental Science and Pollution Research and Ecological Indicators, each with 16, which contribute meaningfully to the development of the literature on EEIO applications in the agricultural domain.
Journals with a narrower focus on agri-food systems or land and energy policy occupy the lower portion of the publication ranking; examples include Land Use Policy; Energy Policy; and Renewable and Sustainable Energy Review. Because rankings based solely on publication counts provide only a partial picture of a journal’s influence, we also constructed an alternative ranking based on impact indicators, presented in Table 4.
The prominence of the Journal of Cleaner Production and Science of the Total Environment is reinforced when impact metrics are considered: the two journals exhibit the highest h-indices in the set (27 and 24, respectively) and have accumulated the largest totals of citations (2199 and 2071). Their m-index values exceed 1.5, signaling sustained citation growth over time. Accounting for these impact indicators alters the ordering of the remaining titles, producing a noticeable rearrangement of the mid- and lower-tier positions in the ranking. The Journal of Applied Energy is a remarkable example of the limitations of a purely quantitative assessment based on publication numbers: it had only 10 articles in the previous ranking and placed 13th. However, when the impact metrics are considered—it exhibits a highly influential profile with a total of 1068 citations and an h-index of 9—indicating that articles published in this journal tend, on average, to be highly cited. Furthermore, journals such as Energy Policy and Land Use Policy rise in the ranking when impact metrics are considered. These outlets pair strong h-index values with substantial overall citation counts, positioning them as especially suitable venues for work aimed at achieving high scientific visibility.
It is also worth noting that more recent journals such as Sustainability (Switzerland) and Sustainability have relatively high m-index values given the year in which they began publishing on the topic, suggesting a rapid growth of interest in EEIO applications to agriculture, including in open-access or more general sustainability-oriented journals.

4.3.2. Bradford’s Low

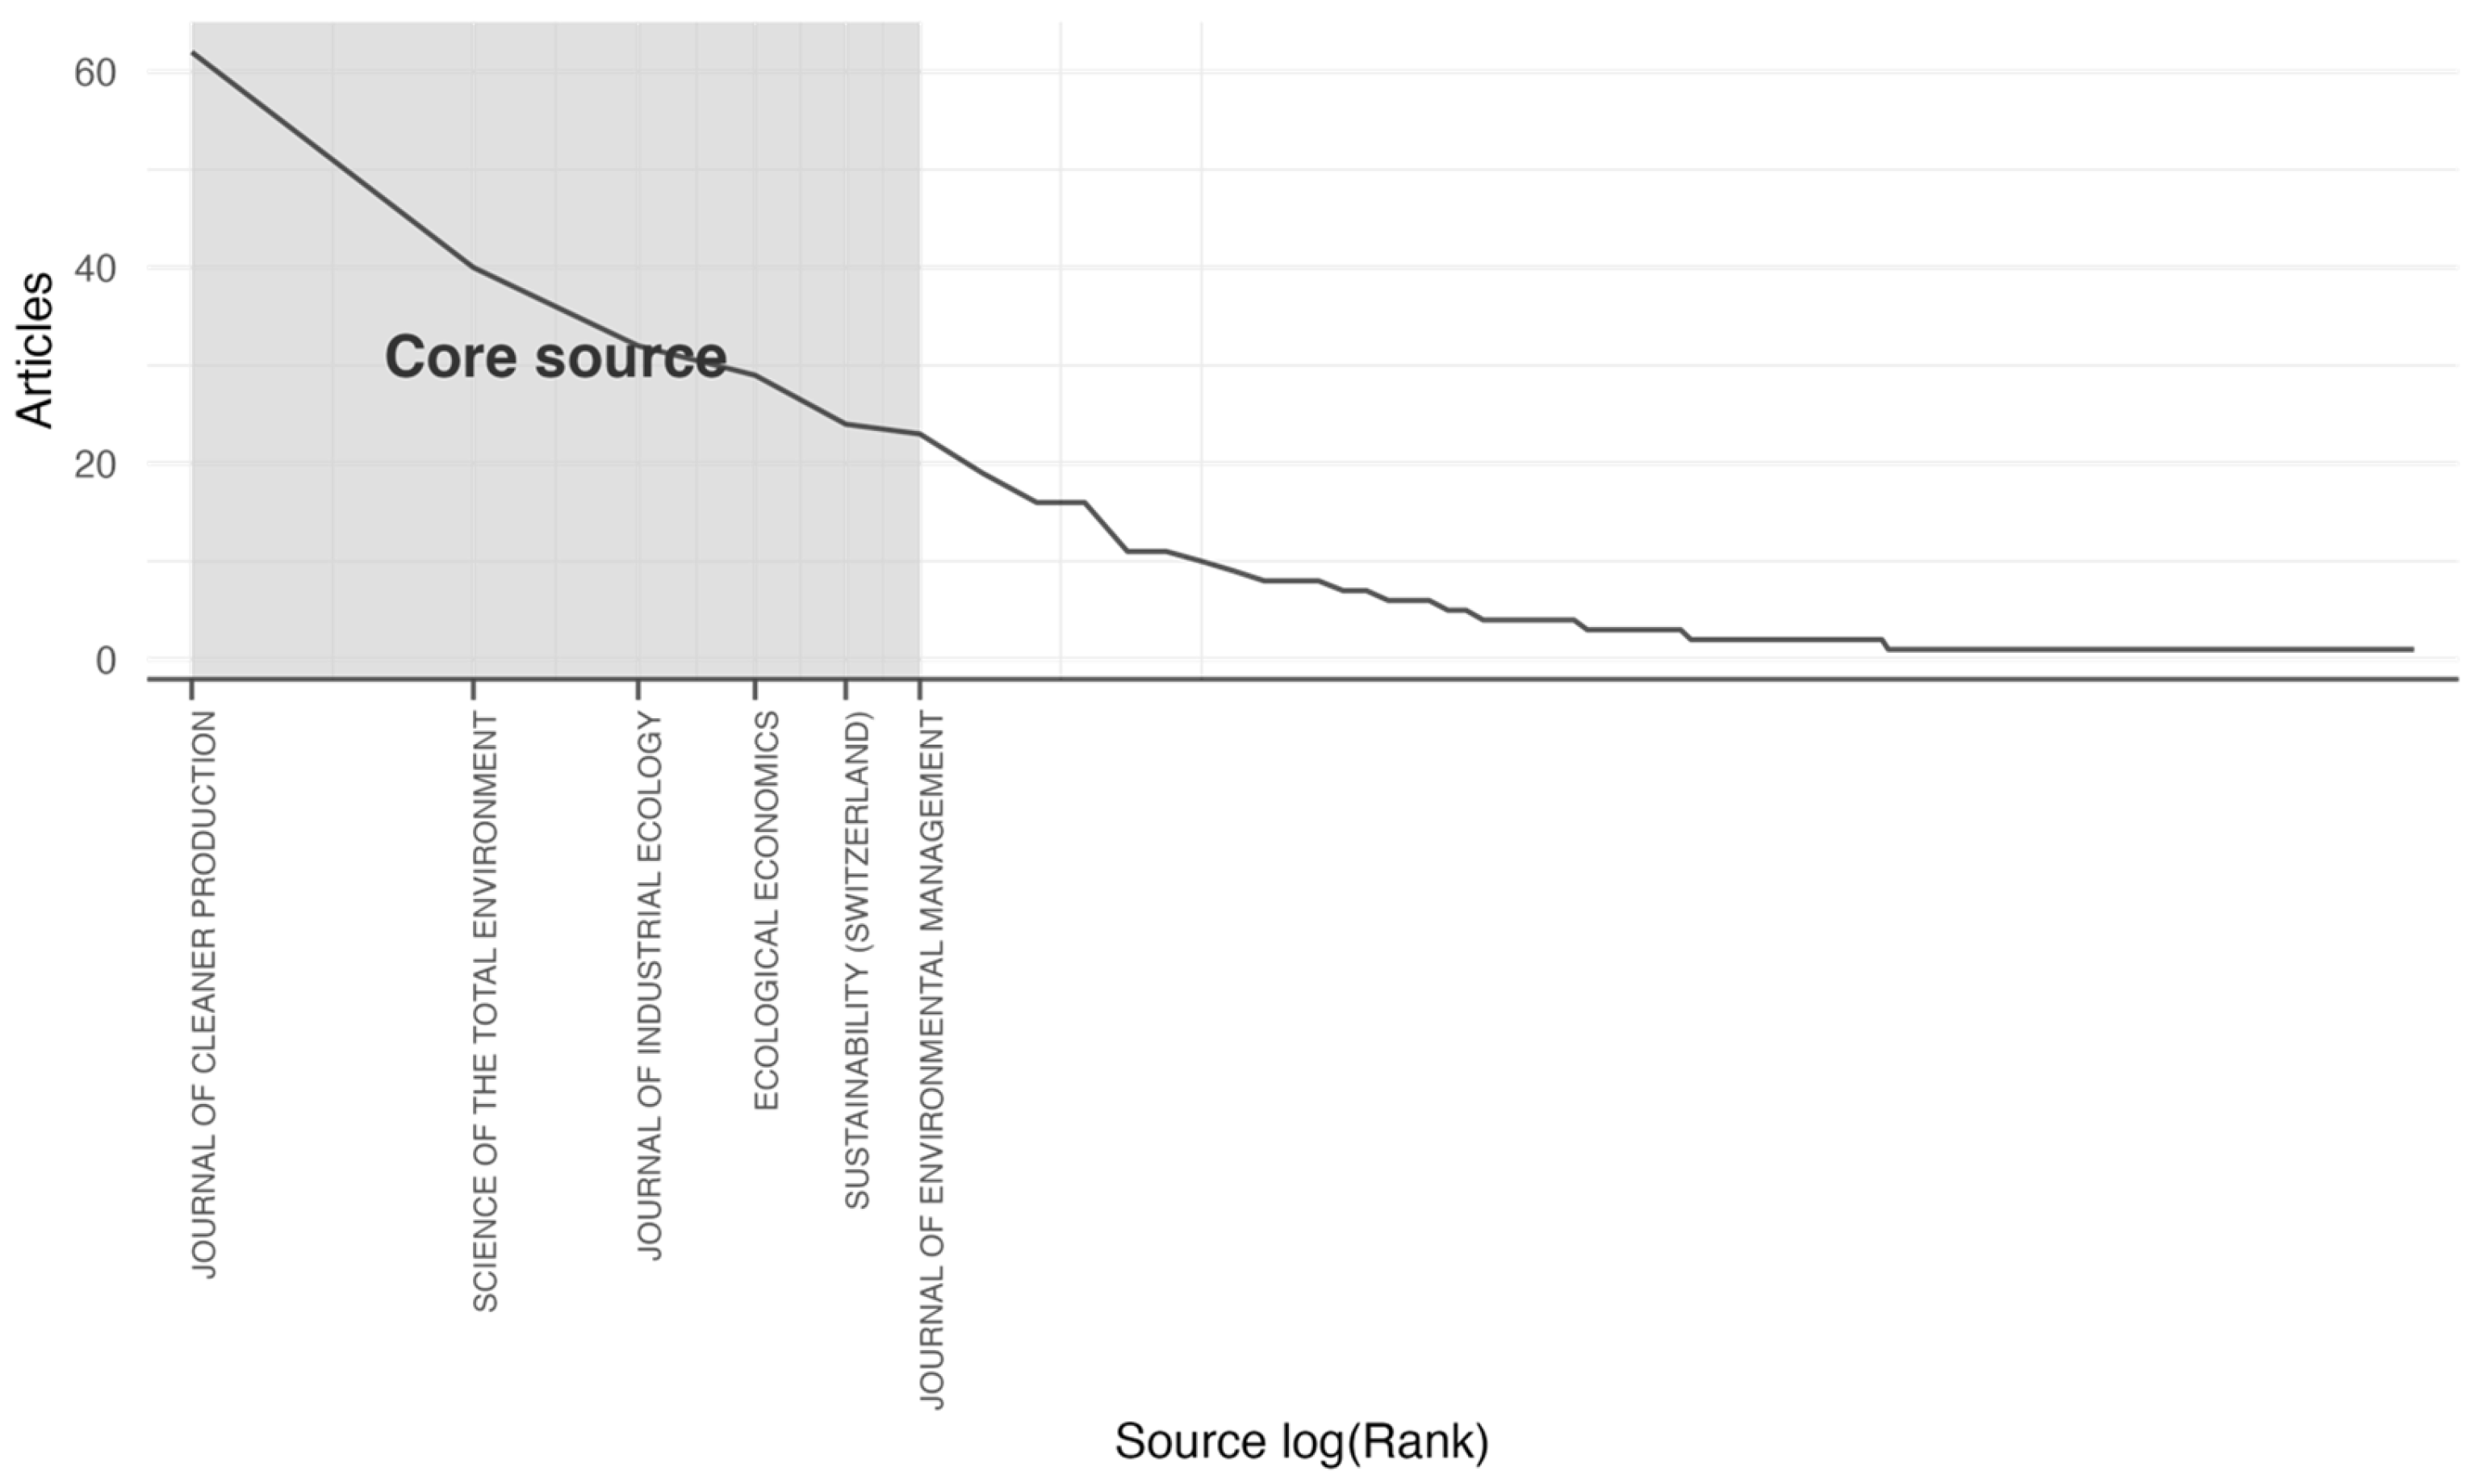
To deepen the bibliometric assessment and pinpoint the field’s most authoritative outlets, we applied Bradford’s law [54,55]. This bibliometric principle holds that publications on a given topic concentrate in a relatively small core of journals, while the remaining literature is progressively dispersed across an expanding number of more peripheral outlets. By partitioning our dataset into Bradford zones, we were able to identify the compact set of journals that generate the bulk of EEIO–agriculture research and to characterize the distribution of the remaining contributions across less central venues.
Figure 8 shows the application of Bradford’s law to the journals included in the studied dataset. The downward-sloping curve highlights an initial zone in which the highest number of publications is concentrated relative to the number of journals involved, marked by a grey box that denotes the segment of “core sources”. Beyond this initial area, the curve gradually flattens, delineating intermediate and peripheral zones characterized by a growing number of sources but a decreasing number of publications.
Table 5: Summarized results of the application of Bradford’s law.
Zone 1, which corresponds to the “core source” area, comprises only 6 journals that together account for 210 articles, i.e., 32.5% of the entire corpus analyzed. This zone represents the core of the scientific literature on the application of the EEIO model to agriculture, and the journals it contains constitute an essential reference base for those engaged in methodological or applied research in this field. As shown in the table, the remaining published papers are distributed across an increasingly large number of scientific journals.
The application of Bradford’s law thus makes it possible to identify a central nucleus of journals in which publications on the topic under analysis are concentrated.

4.4. Paper Analysis

Analysing the documents in the corpus by identifying those most frequently cited in reference lists, those most cited globally and those most cited locally makes it possible to sketch an overall picture of the theoretical and applied evolution of research on agricultural systems using the EEIO model.

4.4.1. Milestones of the Basic Theory

Tracing the manuscripts most frequently cited within the reference lists of our corpus permits the identification of the foundational works that underpin the theoretical framework under study and, in doing so, delineates the principal milestones in the field’s intellectual development. Table 6 reports the twenty manuscripts that occur most often across the bibliographies of the corpus.
The finding indicates that the core reference literature in the field largely consists of the classic contributions to input–output analysis. The handbook of [22] occupies the foremost position, offering an authoritative and wide-ranging treatment of input–output methods and their extensions. It is followed by the foundational contributions of [29,38], whose work constitutes the conceptual core of both input–output analysis and its environmental adaptations. Alongside these theoretical cornerstones, we find authors who have shaped the recent evolution of the Input–Output framework, such as [57,68,69]. Through their work, they have introduced multi-regional databases, new environmental indicators and increasingly sophisticated methods for tracing environmental footprints, thereby contributing to the advancement of the theoretical framework.

4.4.2. Most Cited Papers

Table 7 summarizes the 20 papers in the corpus that have received the highest number of citations over time, highlighting their substantial relevance and scientific visibility.
The most highly cited document is a review study done by [70], which addresses strategies for achieving carbon neutrality in production systems and has accumulated 921 citations. Although it does not focus exclusively on the agricultural sector, this work helps define the broader context in which applications of the EEIO model are becoming increasingly relevant. It is followed by the contribution of [57], with 701 citations, which examines the structure and construction method of EXIOBASE, one of the most important multiregional databases for analyzing global agricultural flows, material consumption footprints, and environmental interdependencies.
The other highly cited studies in this context underscore the central role of environmentally extended Input–Output approaches in three main areas: (i) land use and its close links with biodiversity and economic growth [72]; (ii) the water–land–agriculture nexus, explored in the works [28,61,77]; and (iii) the analysis of energy flows in the production of agricultural goods in studies such as [75,79]. Taken together, these findings show that the papers attracting the greatest attention within the scientific community are those dealing with the sustainability of resource use, environmental accounting, and the tracing and impact of agri-food flows along global value chains.

4.4.3. Local Cited Papers

An indicator that helps to complete the analytical picture is the Local Citation Score (LCS), which identifies the papers within the corpus that have received the highest number of citations from other studies in the same corpus. Table 8 summarizes the 20 papers with the highest local citation scores.
The article by [28], which examines the global land–water nexus, records the highest local citation count and is widely cited both within the corpus and in the broader scholarly literature. It is followed by contributions centered on the energy analysis of agricultural production systems [79], the development and application of environmental indicators [87,88], and research on water footprints and virtual water trade [17,82].
A noteworthy pattern emerges when comparing global and local citation metrics: certain studies—such as [72]—exhibit high global citation counts but relatively modest local citations. This indicates that, although these works hold considerable influence across the wider scientific community, they are less deeply embedded within the specific citation network of publications applying the EEIO framework to agricultural systems.

4.5. Authors’ Analysis

Analyzing the authors represented in our corpus allows us to identify the principal contributors to the literature and to characterize the scholarly community advancing the application of the Environmentally Extended Input–Output model to agricultural systems. This author-level analysis reveals patterns of productivity, influence and collaboration, highlighting core researchers, emerging voices and collaborative clusters that have shaped the field’s intellectual trajectory and guided its methodological development.

4.5.1. Author Productivity and Their Ranking

Table 9 reports the ranking of authors in the corpus based on their total number of publications.
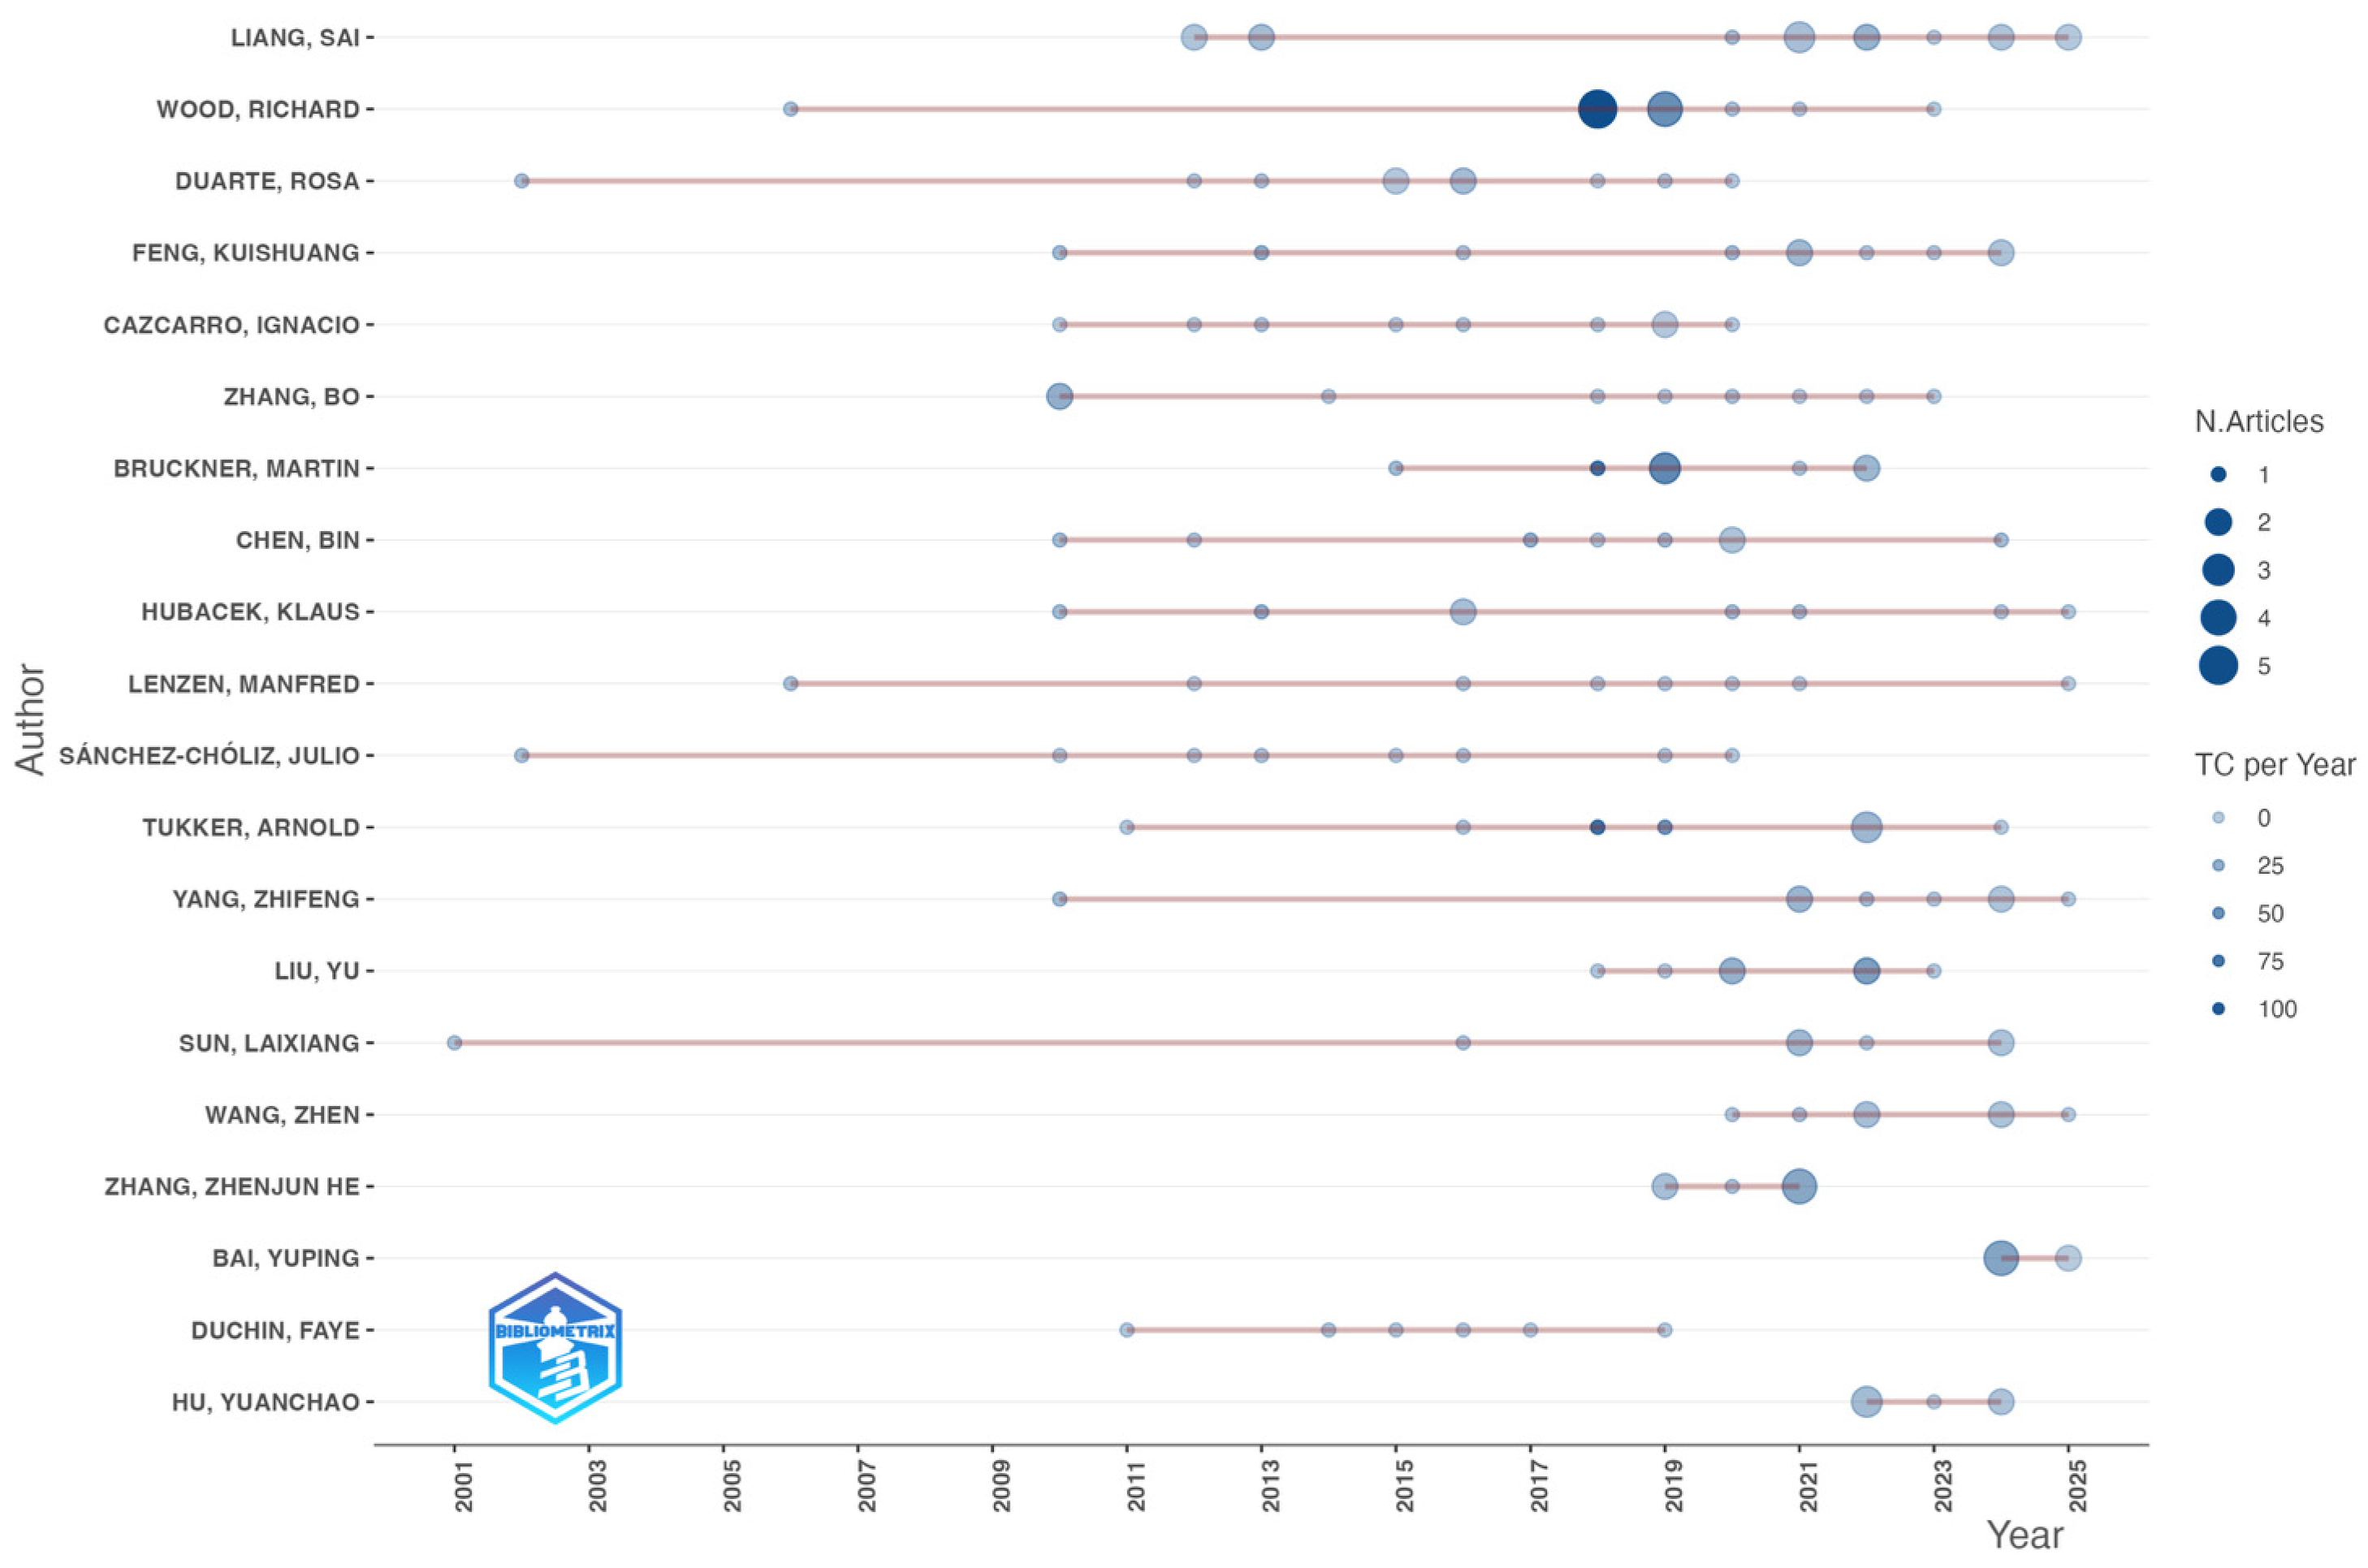
As can be tracked, the top positions are occupied by a small group of authors with very high scientific productivity. At the top of the list is Sai Liang with 15 articles, followed by Richard Wood with 13 papers, Rosa Duarte with 10, and Kuishuang Feng with 10 documents, as well as two authors with 9 contributions each: Bo Zhang and Martin Bruckner. This group of researchers forms the backbone of the field that is advancing the application of environmentally extended input–output modelling to the agri-food sector
To provide a more comprehensive and nuanced understanding of the most prolific authors, we analyzed, for each individual, their publications within our corpus over time, along with the corresponding annual citation counts. The detailed results are presented in Figure 9.
Results indicate that some authors not only maintain a high level of continuity in their scientific output, but also record pronounced peaks in the number of citations received in specific years. Authors such as Wood, Bruckner, Feng and Chen display the highest annual citation counts, indicating the substantial impact of their work on the topic under examination. At a more aggregate level, this figure also reveals an expansionary phase in publications beginning around 2015, coinciding with intensified efforts by national governments to reduce their environmental impact and to combat climate change.

4.5.2. Lotka’s Law

Building on Lotka’s law, introduced in 1926 by Alfred J. Lotka [99], we investigated the productivity patterns of the authors within our dataset. This law enables the characterization of author productivity by analyzing the distribution of published articles in the corpus under study [100]. The results, reported in Table 10, show that 84% of the authors in our corpus have published only one article on the topic, a value substantially higher than the theoretical prediction of 64%. This indicates a broad participation by occasional authors or by scholars approaching this research area for the first time. A small minority of authors, just 10%, have produced two articles, and the share of those with three or more publications declines steadily thereafter. This configuration points to an expanding field of research, in which a small, established core of authors with a sustained focus on the topic coexists with a long tail of contributors who sporadically add to the literature on the application of the EEIO model to the study of agricultural systems.

4.5.3. Authors Network

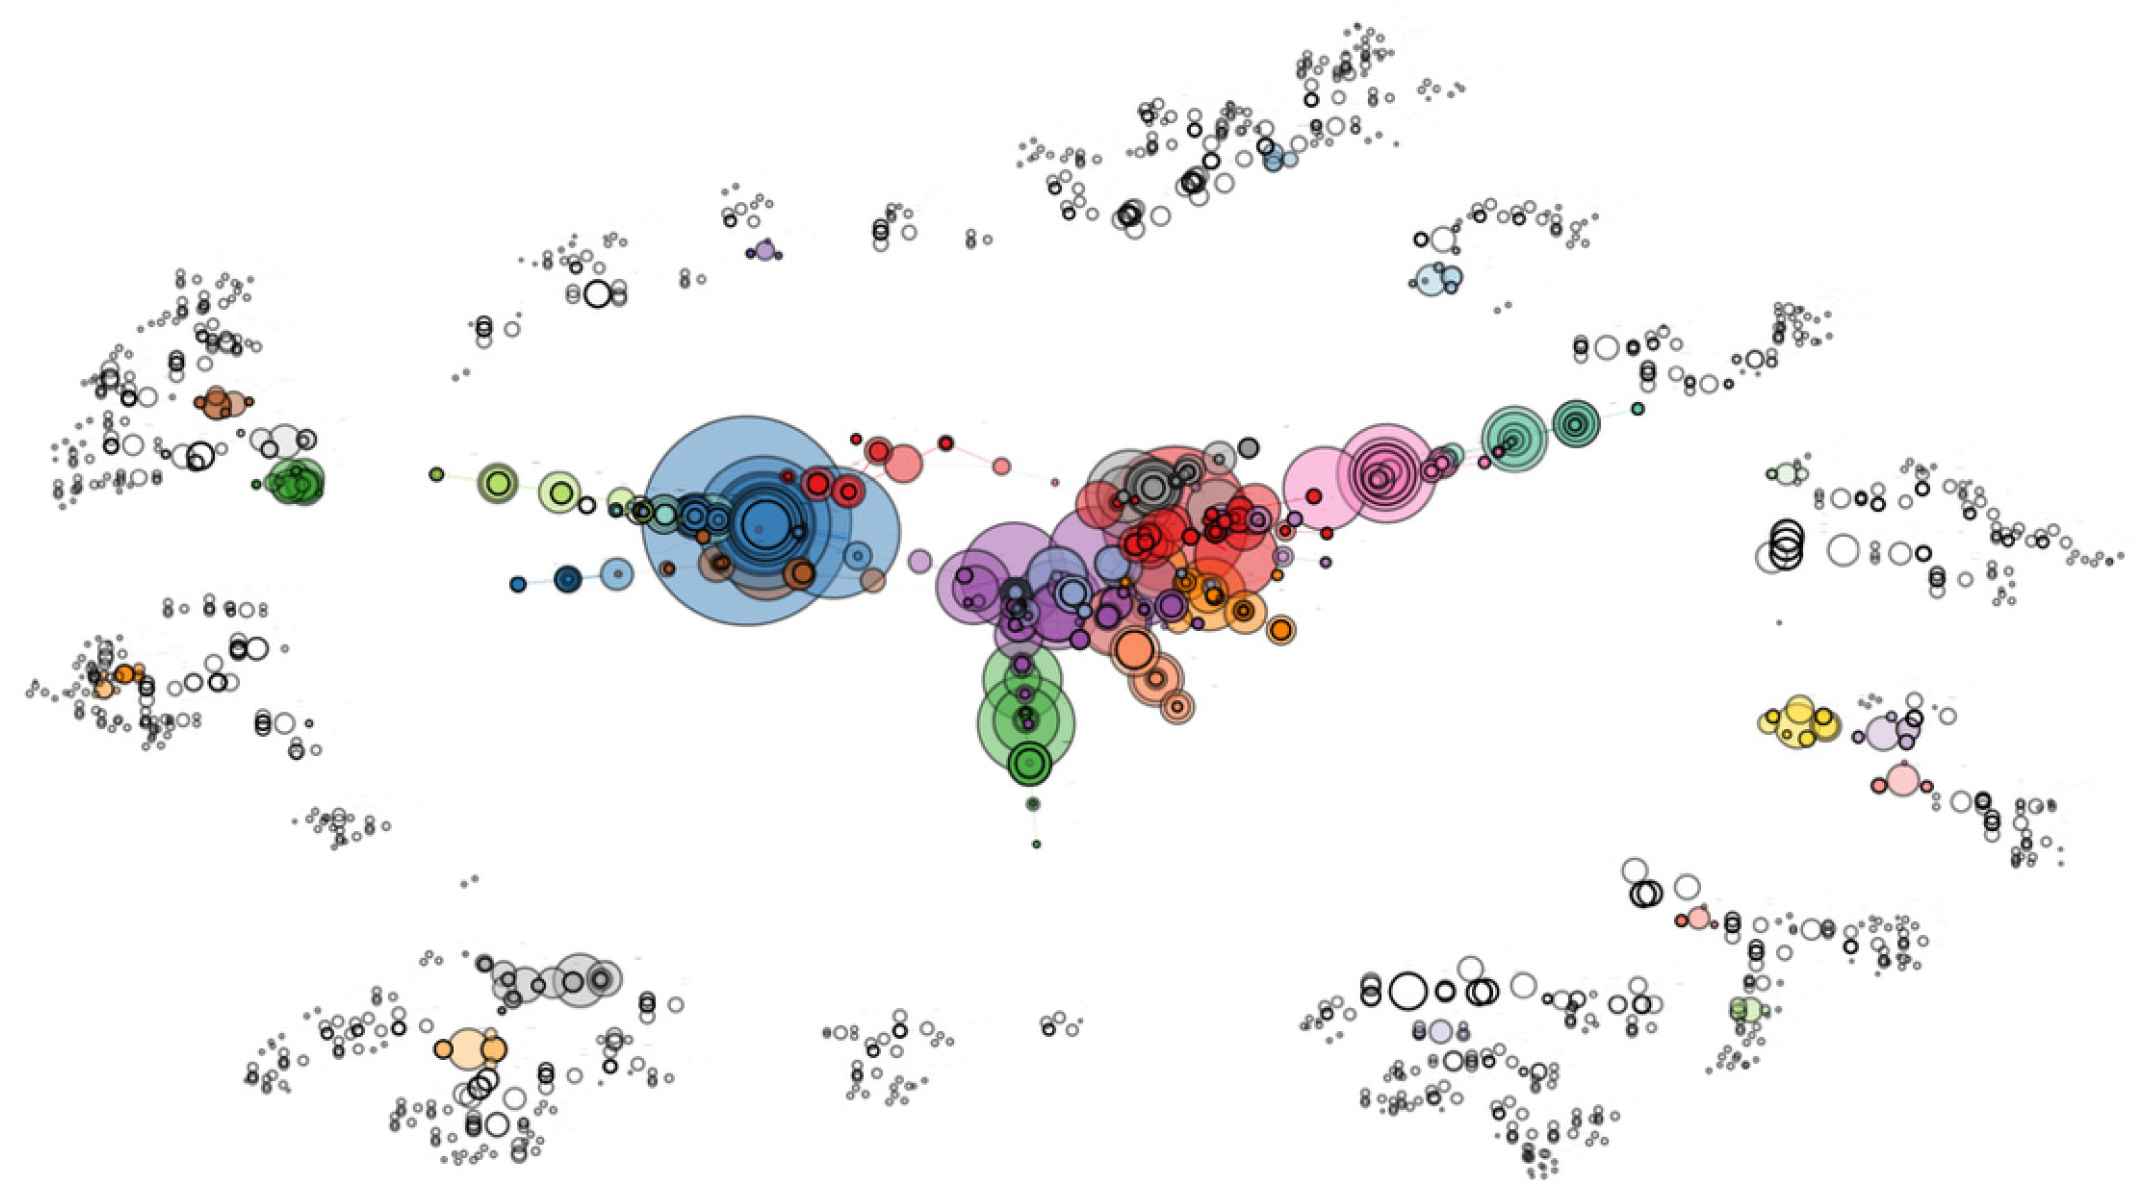
To conclude the authorship analysis, attention turns to co-authorship networks to characterize inter-author linkages. Figure 10 maps the authors in the corpus, offering a visual account of the collaboration structure.
It can be observed that the peripheral areas of the authorship network exhibit a high degree of fragmentation, characterized by small and weakly connected clusters. In contrast, progressively more cohesive and highly interconnected groups emerge toward the center, corresponding to the core of the corpus.
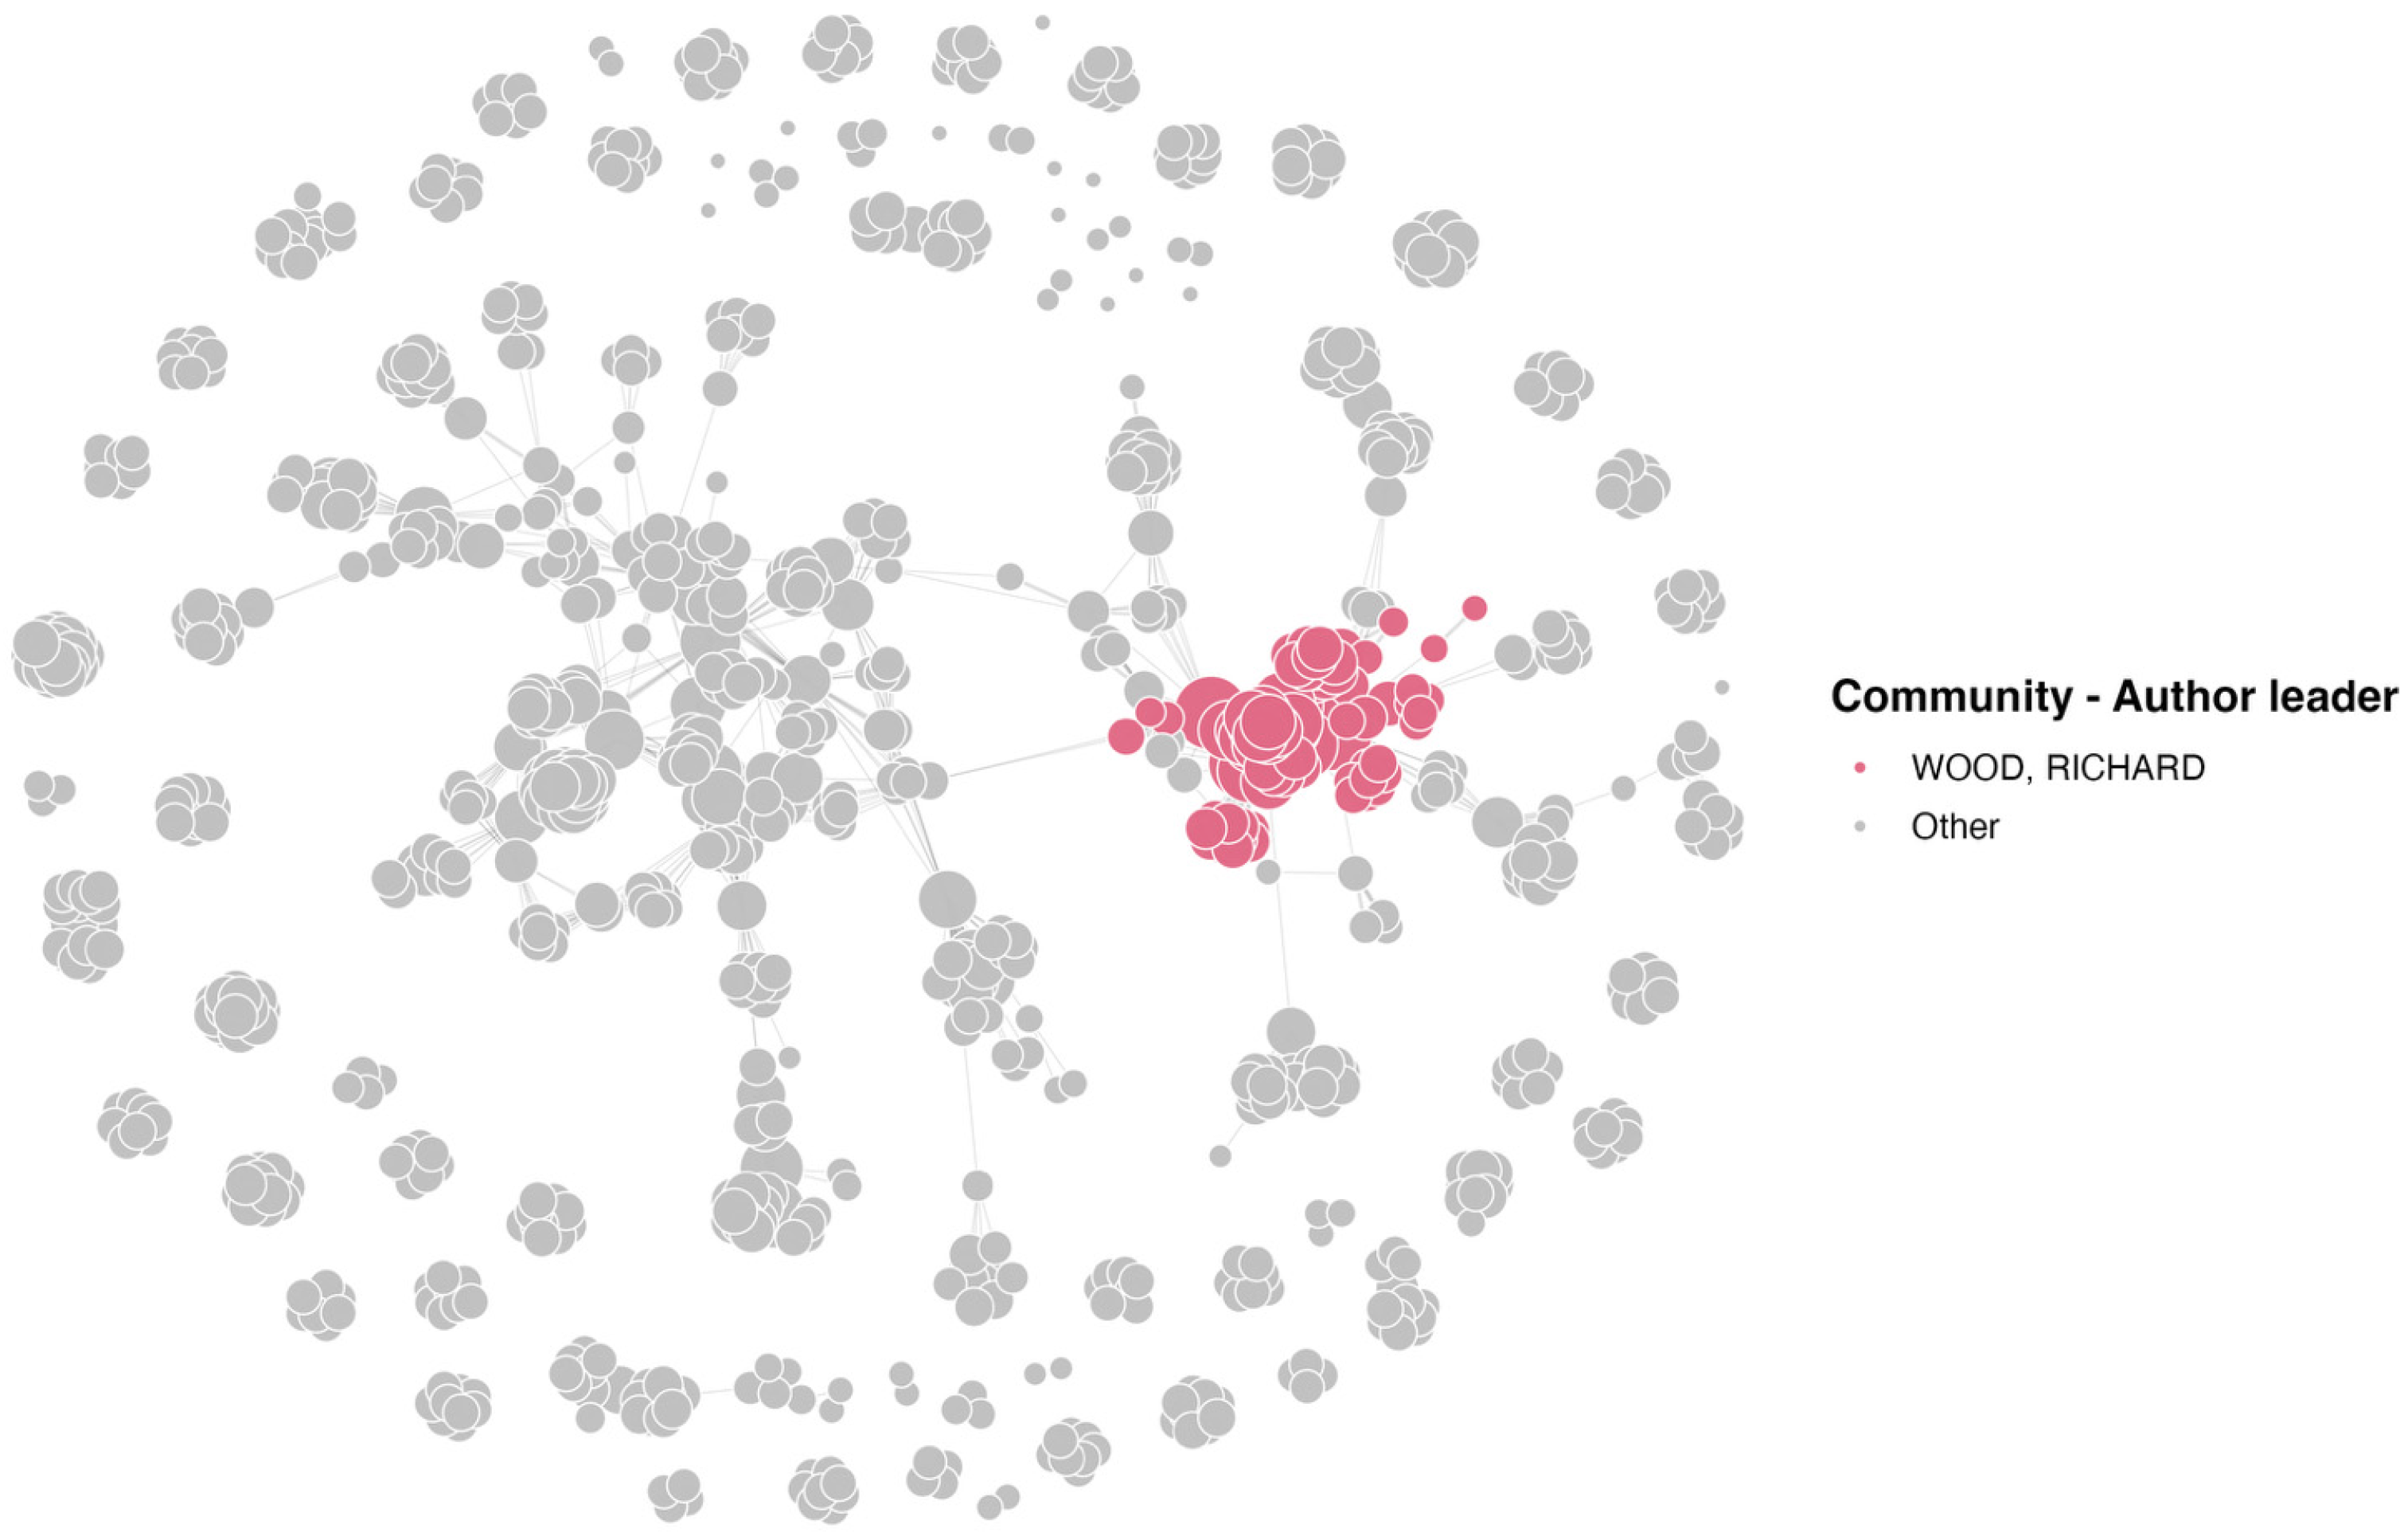
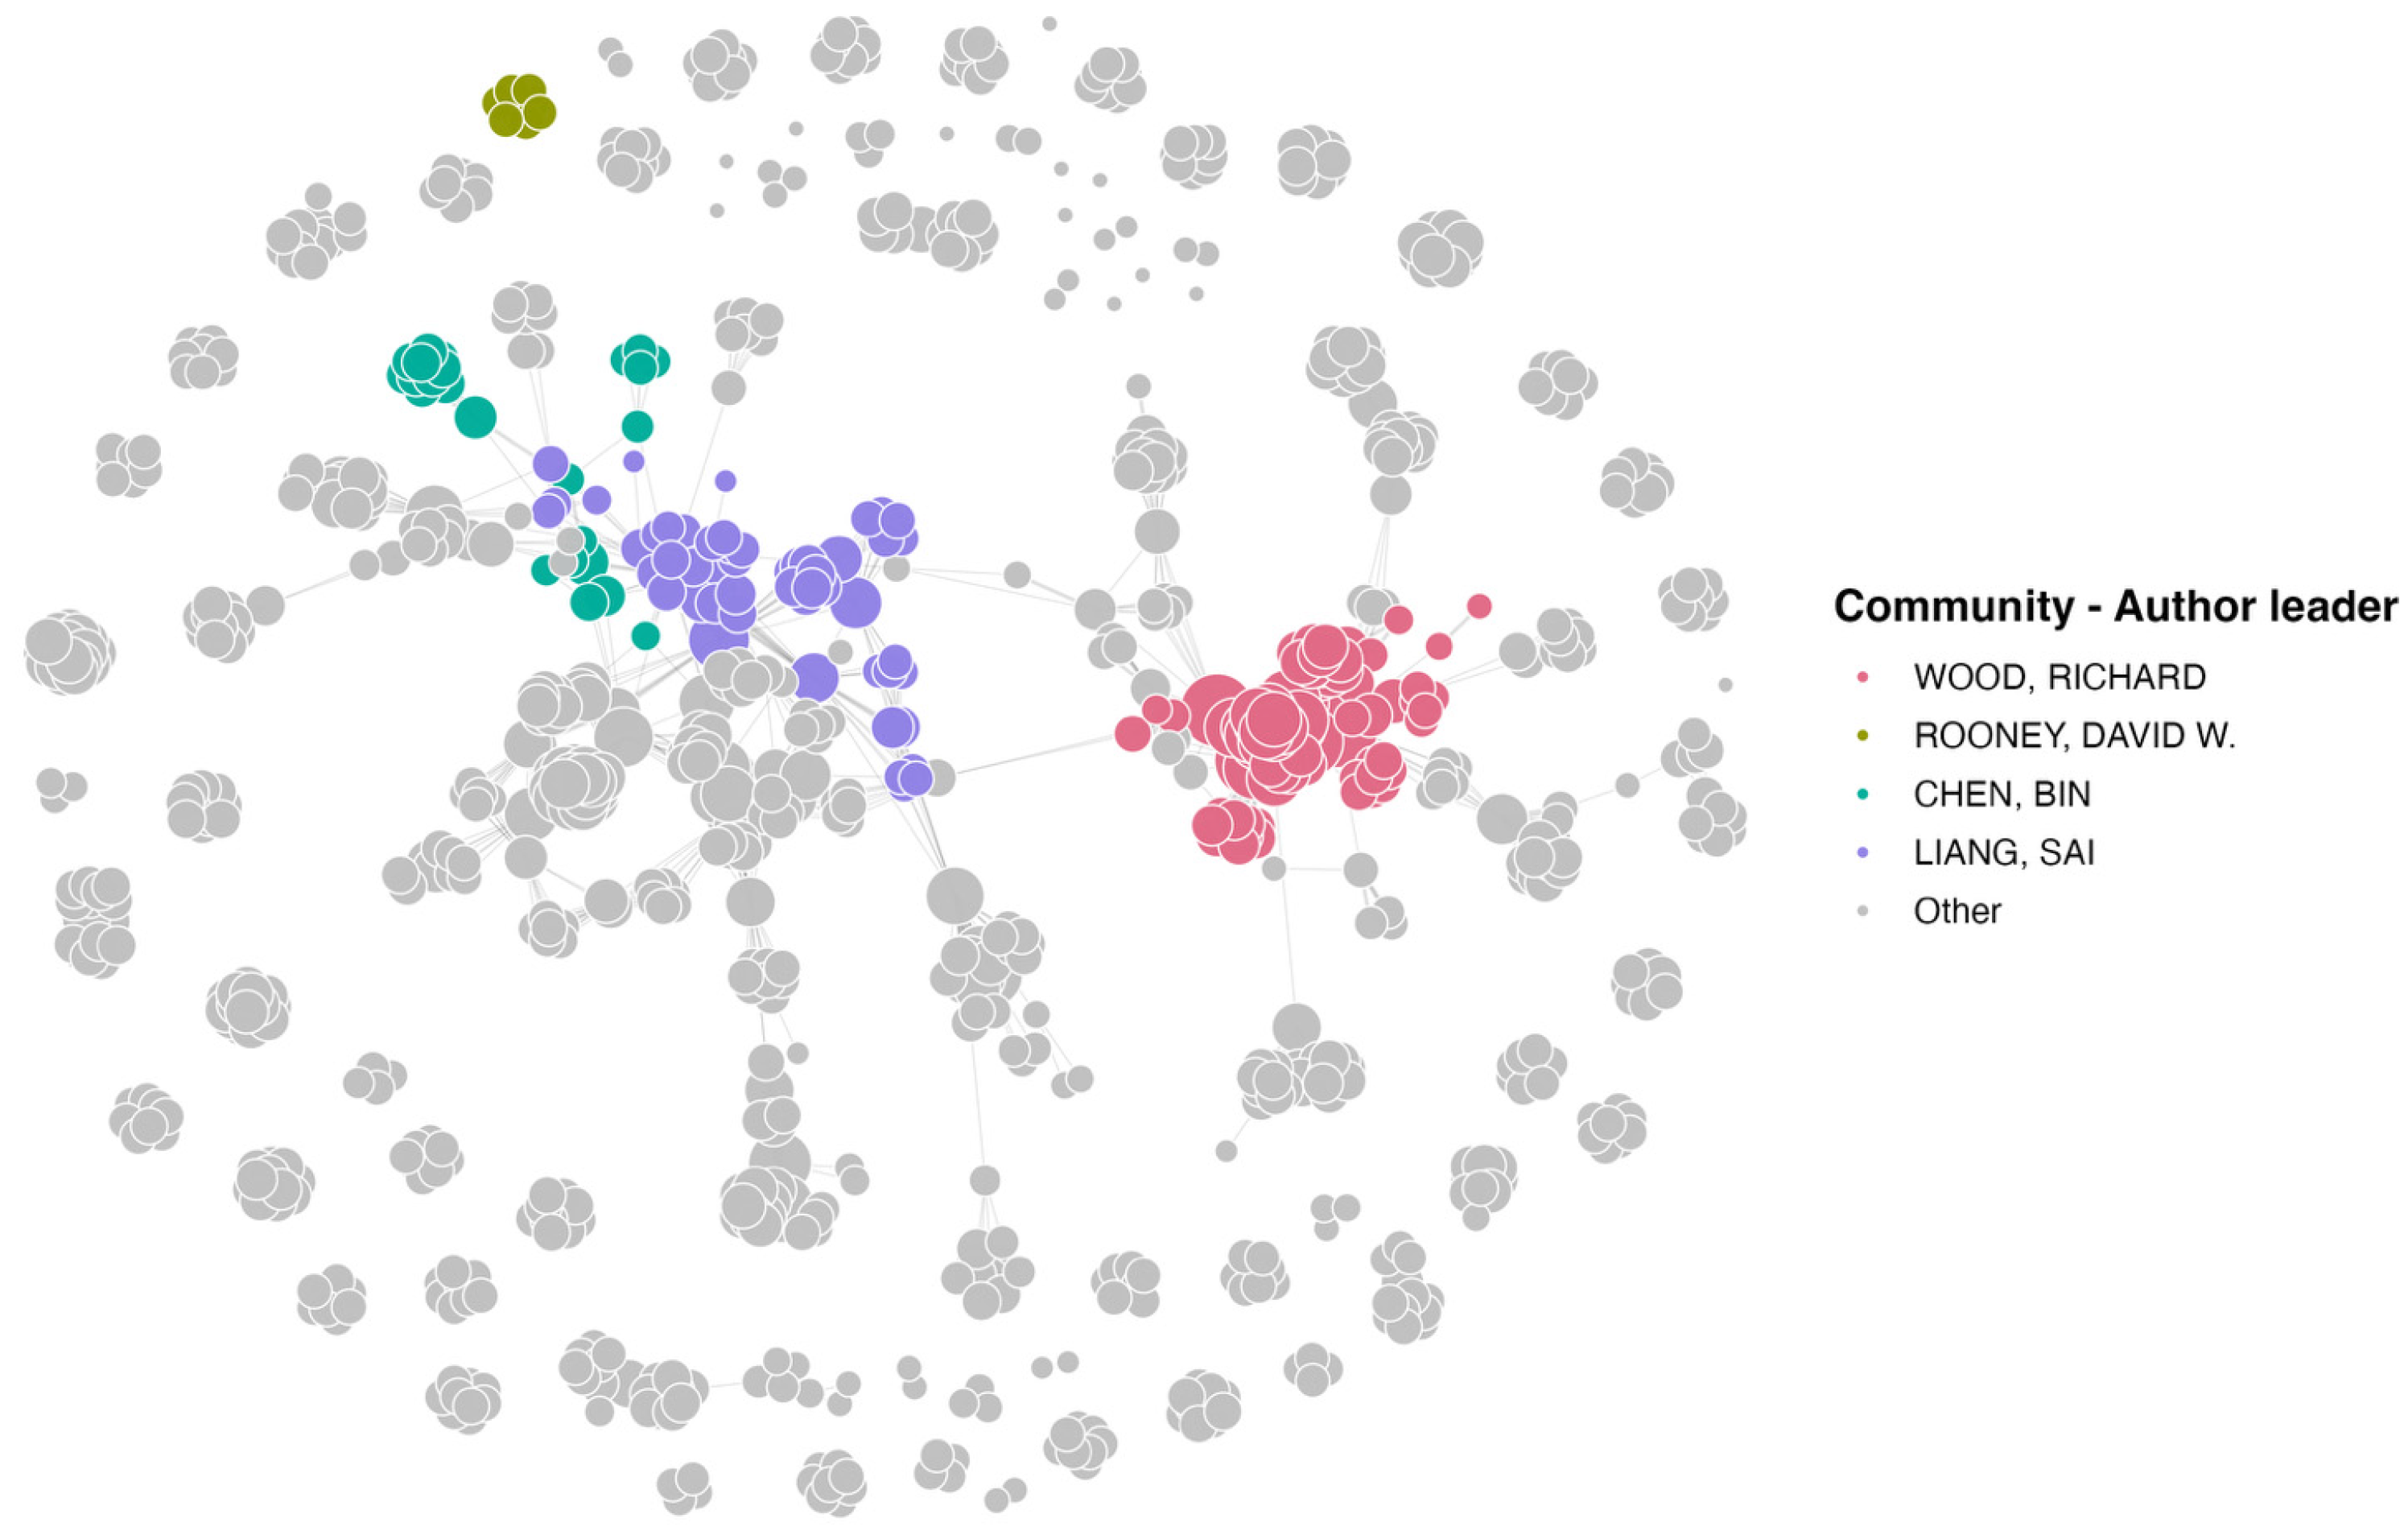
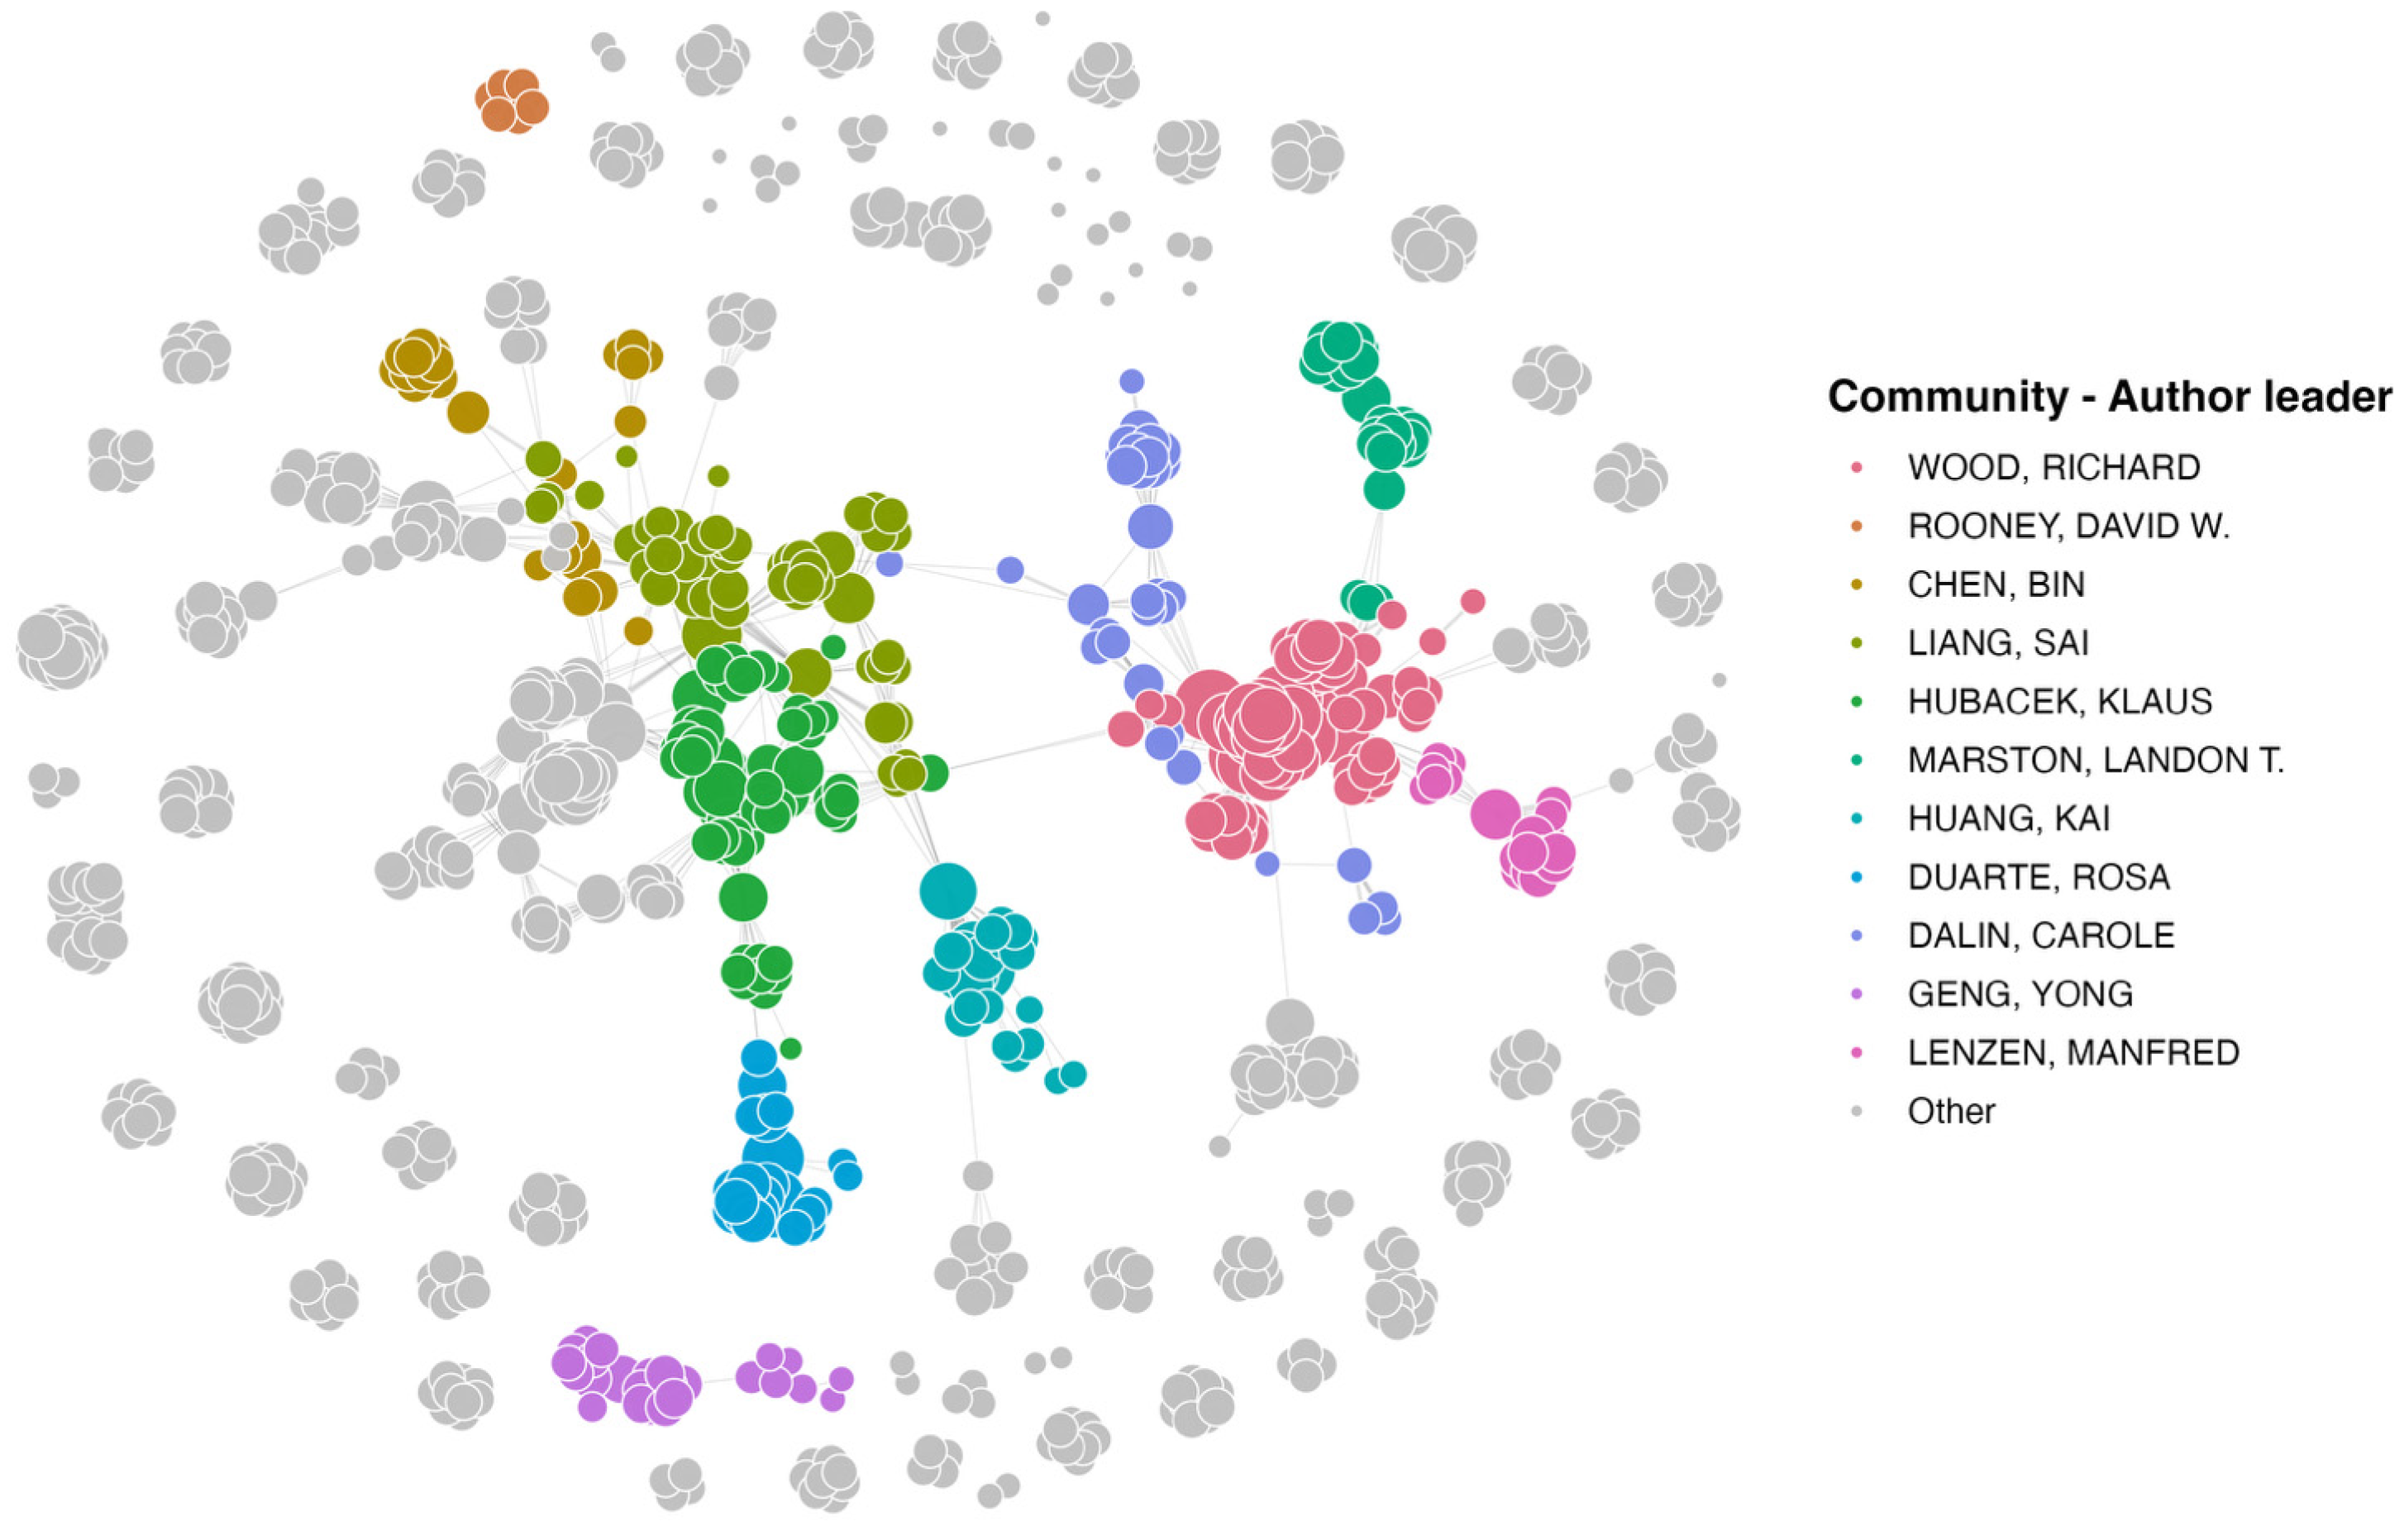
To obtain a clearer level of detail, Figure 11, Figure 12 and Figure 13 show the progression of the cumulative citation impact of the top 1000 authors by number of citations, corresponding to the central group in Figure 9. This progressive view of 25–50–75% of total impact makes it possible to identify the author communities that exert the greatest influence on the research topic, moving from an overall picture to a more fine-grained analysis. This is complemented by Table 11, which reports, for each identified community, the top 10 authors by number of citations, together with additional useful information such as the total number of authors in the community and the overall citation count of the community.
Figure 11 presents the top 25% of citations among the 1000 most-cited authors. The results reveal a single dominant community, which is labelled after Richard Wood, as he emerges as the most influential author within this group, with 1647 citations related to the topic under examination. Overall, this community comprises 86 authors and a total of 28,368 citations. Among its most prominent members are Martin Bruckner, Arnold Tukker, Thomas Kastner, Nina Eisenmenger and Konstantin Stadler, whose work has contributed to the construction and evolution of the current research framework on sustainability, environmental footprints and material flows through applications of the EEIO model to agricultural systems. This community represents the main theoretical reference point for EEIO-based research.
Figure 12 illustrates the expansion of the citation threshold to 50%, revealing three additional author communities, namely the “Ronney David”, “Chen Bin” and “Linag Sai” communities. Together, these groups account for an additional 25% of total citations.
The Ronney David community, led by the eponymous author with 921 individual citations, is composed of 8 author and comprises a total of 7368; it is characterized by a focus on energy analysis of agricultural system bio-energy domain. The Chen Bin community, led by the eponymous author with 725 individual citations, is composed of 26 authors and comprises a total of 6438 citations; it is characterized by a strong focus on the water–energy–land nexus and on the accounting of environmental impacts. The Linag Sai community, headed by the author of the same name with 516 individual citations, includes 58 authors and totals 5580 citations, and is mainly centered on climate change and environmental impact assessment.
The thematic and methodological affinity between these areas is evident in the figure, which shows the two communities clustered closely and densely interconnected. Raising the inclusion threshold brings additional research themes into view, thereby clarifying the domains of application and the specific specializations represented by authors in the corpus.
Finally, Figure 13 shows the expansion to 75% of total citations among the top 1000 authors in the corpus. The network becomes progressively more diversified, with communities of smaller size, as also indicated in Table 11. It is nonetheless apparent that many of the identified communities remain centered on the “Wood Richard” core, indicating a close alignment in the themes addressed. By contrast, communities such as the “Hubacek Klaus” cluster—comprising 57 authors and accounting for 5483 total citations—point to complementary lines of inquiry, including research focused on the climate change and environmental impact assessment.

5. Discussions

This study systematically reconstructs the evolution of the EEIO framework as applied to the agricultural sector and moves beyond a mere bibliometric account. Over the past decade the literature shows a marked increase in EEIO adoption, reflecting a clear demand for methods that represent the economy as an integrated system rather than as a collection of isolated sectors. By explicitly modelling intersectoral linkages and environmental flows across full supply chains [101], EEIO approaches provide policymakers with robust quantitative instruments to design and assess sustainability strategies for agrifood systems. This methodological expansion has occurred in tandem with intensified global concern for environmental degradation, climate-change mitigation, the Sustainable Development Goals (SDGs), and the stewardship of increasingly scarce natural resources.
A review of keyword clusters and prevailing themes in EEIO studies applied to agricultural systems points to several research directions that currently guide the field. One prominent direction relates to climate change and is increasingly reinforced by public investment, particularly within Europe, aimed at developing analytical frameworks capable of assigning responsibility along complete production chains [97]. A critical interpretation of these clusters reveals significant implications for the future development of EEIO research in agriculture. The prominence of Cluster 1 (Carbon, trade, and environmental policy) and Cluster 3 (Energy and climate impacts) suggests that the field is transitioning from static environmental accounting toward dynamic driver analysis. The increasing frequency of keywords such as “structural decomposition analysis” and “structural path analysis” indicates that future research must prioritize identifying the specific socioeconomic drivers of environmental pressure rather than merely quantifying footprints. This has encouraged a growing body of work on emissions embodied in intermediate inputs and on the distinction between production- and consumption-based impact accounting, which is central to the formulation of effective mitigation policies for agriculture [102]. Similarly, the convergence of EEIO with LCA observed in the keyword trends points to a necessary methodological evolution: hybrid modeling. Future research should aim to reconcile the sectoral breadth of EEIO with the process-level detail of LCA to address the limitations of sectoral aggregation, particularly in heterogeneous agricultural systems. A second direction reflects the consolidation of the Water–Energy–Food nexus as both an analytical lens and a policy-oriented framework [49]. From this perspective, EEIO models are especially valuable because they allow interconnections among resources and sectors to be examined within a single, coherent structure [63,103]. A third direction is linked to the expanding attention given to global value chains, which necessitates multi-country assessments of agricultural impacts. Recognition that a considerable share of environmental pressures is embedded in intersectoral and international exchanges highlights the relevance of EEIO for capturing cross-border effects and for framing agrifood sustainability within an increasingly globalized economy characterized by fragmented production processes [80,104]. The bibliometric findings also offer explicit insights into how EEIO trends relate to sustainability policies and agri-food system transformation. The observed exponential increase in publications post-2015 correlates strongly with the Paris Agreement and the adoption of the SDGs, suggesting that EEIO is increasingly utilized as a monitoring tool for Nationally Determined Contributions (NDCs) and international climate commitments. Furthermore, the strong association between “international trade” and “carbon footprint” keywords reflects the growing policy relevance of consumption-based accounting in the context of emerging regulations such as Carbon Border Adjustment Mechanisms (CBAM). The geographical analysis further elucidates divergent policy priorities: the European cluster’s focus aligns with the EU Green Deal and CAP, emphasizing regulatory harmonization and cross-border data sharing. In contrast, China’s dominance in the literature reflects policy priorities centered on domestic food security and supply-chain resilience. This dichotomy suggests that future EEIO applications must be context-sensitive, tailored to either support regulatory compliance in developed economies or enhance supply-chain stability in emerging economies. Within this context, the main application areas that emerge—such as emissions embodied in trade, water-resource use, energy and climate-related impacts, and the sustainability of agrifood supply chains—can be understood as methodological responses to these broader strategic demands [94,105]. Assessments of embodied emissions, for instance, are closely linked to evaluating climate-policy outcomes and to identifying situations in which apparent reductions in one region are offset by increased pressures elsewhere. Similarly, the strong emphasis on water-related analyses reflects the central role of agriculture in water security and system resilience, while illustrating the capacity of EEIO approaches to operationalize concepts such as water footprints in a manner that remains consistent with underlying economic structures and international trade relations.
With respect to energy and broader environmental impacts, energy is a fundamental determinant of agricultural performance and supply-chain outcomes: shifts in energy use, efficiency, or sourcing can substantially alter environmental results across production stages [106,107]. The literature increasingly documents trade-offs whereby productivity gains that lower impacts in one segment may amplify pressures elsewhere through greater fertilizer inputs, higher overall energy demand, and increased emissions from transport and logistics. Environmentally extended input–output analysis is well-suited to reveal these dynamics because it explicitly represents indirect and upstream linkages that single-sector methods typically overlook. By quantifying both direct and indirect flows, EEIO enables more reliable assessments of whether proposed interventions produce genuine net improvements or simply relocate environmental burdens across sectors or regions [108].
The analysis of scientific-community structure and collaboration patterns indicates that the EEIO analysis in agricultural research is entering a phase of consolidation. A small set of well-established hubs coexists with a widening periphery of emerging contributors, a pattern that reflects both the recognition of EEIO as a standard analytical tool and the entry of new research groups responding to novel policy questions and increasingly detailed datasets. This diversification of contributors—drawn from a range of disciplinary backgrounds—underscores the cross-cutting nature and growing relevance of the framework. Nonetheless, the application of EEIO to agricultural systems encounters several important methodological limitations that must be acknowledged when interpreting results for policy use [45]. First, core modelling assumptions—fixed technical coefficients, linear relationships, and homogeneous sectoral technologies—constrain the capacity of EEIO to capture intra-sectoral heterogeneity, structural change, and adaptive responses to external shocks [109,110]. Second, the sectoral aggregation embedded in conventional IO tables tends to mask variation among the disparate activities included within the agricultural sector [111]. Third, environmental extensions are vulnerable to uncertainty, data inconsistencies, and researcher choices in accounting methods, all of which reduce comparability across studies [112,113]. However, a transparent assessment requires acknowledging limitations inherent to both the EEIO framework and this bibliometric study. Regarding the bibliometric methodology, the geographical distribution of publications is heavily skewed, with China accounting for a disproportionate volume of the literature, which may reflect specific national funding priorities rather than a global consensus. Additionally, the reliance on English-language databases may exclude significant local policy studies, and the correlation between publication spikes and policy events remains observational rather than causal. These constraints do not negate the value of EEIO; rather, they indicate where careful qualification and transparent reporting are required when using EEIO outputs to inform policy [114].
These limitations also delineate a targeted research agenda that is closely aligned with the main themes identified in this review. Future studies should first use structural decomposition and structural path analysis to isolate the socioeconomic drivers behind embodied emissions, water use, and energy demand, rather than only reporting aggregate footprints. They should also develop hybrid EEIO–LCA frameworks, ideally tested on specific agrifood commodities or supply chains, to combine EEIO’s sector-wide coverage with the process-level detail needed to reduce aggregation bias. In parallel, multi-regional EEIO tables with higher sectoral and spatial resolution are needed to better represent international trade, supply-chain fragmentation, and regional heterogeneity, particularly in the context of climate policy and carbon border measures. Because environmental extensions and accounting choices can materially affect results, future work should apply formal uncertainty analysis, including stochastic simulation and sensitivity testing, to identify which assumptions most influence outcomes. Another priority is to extend EEIO into dynamic formulations that can capture technological change, substitution effects, and policy scenarios over time. Finally, EEIO should be coupled more systematically with land-use, ecological, and socio-economic models to examine feedbacks, trade-offs, and distributional effects across the water–energy–food nexus, while greater use of open data, harmonized indicators, and transparent reporting standards would improve reproducibility and cross-study comparability. Advancing these directions would make EEIO applications in agrifood systems more robust, policy-relevant, and actionable.

6. Conclusions

This study synthesizes how EEIO models have been deployed to study agricultural systems, based on a systematic corpus of 647 publications retrieved from Scopus and Web of Science covering 1978–2025. The bibliometric and keyword analyses show a clear acceleration of research since 2015, reflecting broader uptake of EEIO as a method for tracing economy-wide interdependencies and their environmental consequences. Four principal application domains emerge from the literature: emissions embodied in trade, water resource management, energy and climate-related impacts, and the sustainability of agri-food supply chains. At the country level, China is both the most prolific contributor and a central node in international collaboration networks.
These results confirm the practical value of EEIO for framing system-level questions in agriculture, while also underscoring well-documented methodological constraints. Fixed technical coefficients, coarse sectoral aggregation, and uncertainty in environmental extensions limit the capacity of standard EEIO results to resolve farm-scale or crop-specific processes. Consequently, findings based on EEIO demand careful interpretation when used to inform strategic decision making or policy design. To strengthen the evidence base and policy relevance of future work, we recommend three complementary directions. First, improve data resolution and harmonization by developing higher spatial and sectoral disaggregation and by standardizing environmental extension methods across databases. Second, integrate EEIO with higher resolution approaches, such as process-based life cycle assessment, farm-level surveys, remote sensing and agent-based models, to reconcile economy-wide accounting with production system detail. Third, adopt robust uncertainty and sensitivity analyses together with scenario exploration to make policy inferences more transparent and defensible. Additional priorities include expanding multi-regional EEIO frameworks to better capture trade-mediated impacts, and enhancing engagement with stakeholders and policymakers so that model outputs are interpretable and actionable.
In sum, EEIO remains a powerful framework for analyzing the complex interactions between agricultural production, intermediate demands and environmental pressures. Its capacity to inform a sustainable transition of agrifood systems will be greatest where improved data, methodological pluralism and explicit treatment of uncertainty are used to link economy-wide insights to the realities of specific crops, supply chains and governance contexts.


Author Contributions

Conceptualization, G.G., M.Z., M.C., S.R. and M.V.; methodology, G.G., M.Z. and M.V.; formal analysis, G.G. and M.Z.; investigation, G.G. and M.Z.; data curation, G.G. and M.Z.; writing—original draft preparation, G.G. and M.Z.; writing—review and editing, G.G., M.Z. and M.V.; visualization, M.C.; supervision, M.V. and S.R. project administration, M.V.; funding acquisition, M.V. All authors have read and agreed to the published version of the manuscript.

Funding

We acknowledge financial support under the National Recovery and Resilience Plan (NRRP), Mission 4, Component 2, Investment 1.1, Call for tender No. 104 published on 2 February 2022 by the Italian Ministry of University and Research (MUR), funded by the European Union—NextGenerationEU—A environmentally extended Rural-Urban model to study the Ecosystems-Economy-Society nexus (RUEESnexus)—n. 2022Z879W3—Grant Assignment Decree No. 967 adopted on 30 June 2023 by the Italian Ministry of Ministry of University and Research (MUR). This work reflects only the authors’ views and opinions, and neither the Ministry for University and Research nor the EUropean Commission can be considered responsible for them.

Data Availability Statement

Publicly available datasets were analyzed in this study. These data can be found at the following: https://www.scopus.com/pages/home#researcher-discovery (accessed on 15 November 2025) and https://www.webofscience.com/wos/woscc/advanced-search (accessed on 15 November 2025).

Conflicts of Interest

The authors declare no conflicts of interest.

References

  1. Amiri, Z.; Asgharipour, M.R.; Campbell, D.E.; Armin, M. A Sustainability Analysis of Two Rapeseed Farming Ecosystems in Khorramabad, Iran, Based on Emergy and Economic Analyses. J. Clean. Prod. 2019, 226, 1051–1066. [Google Scholar] [CrossRef] [Scilit]
  2. Camanzi, L.; Alikadic, A.; Compagnoni, L.; Merloni, E. The Impact of Greenhouse Gas Emissions in the EU Food Chain: A Quantitative and Economic Assessment Using an Environmentally Extended Input-Output Approach. J. Clean. Prod. 2017, 157, 168–176. [Google Scholar] [CrossRef] [Scilit]
  3. Kanianska, R. Agriculture and Its Impact on Land-Use, Environment, and Ecosystem Services. In Landscape Ecology—The Influences of Land Use and Anthropogenic Impacts of Landscape Creation; InTech: Nappanee, Indiana, 2016. [Google Scholar]
  4. Mahmood, H.; Hassan, M.S.; Meraj, G.; Furqan, M. Agriculture’s Role in Environmental Sustainability: A Comprehensive Review of Challenges and Solutions. Chall. Sustain. 2024, 12, 178–189. [Google Scholar] [CrossRef] [Scilit]
  5. Engström, R.; Wadeskog, A.; Finnveden, G. Environmental Assessment of Swedish Agriculture. Ecol. Econ. 2007, 60, 550–563. [Google Scholar] [CrossRef] [Scilit]
  6. Tilman, D.; Fargione, J.; Wolff, B.; D’Antonio, C.; Dobson, A.; Howarth, R.; Schindler, D.; Schlesinger, W.H.; Simberloff, D.; Swackhamer, D. Forecasting Agriculturally Driven Global Environmental Change. Science 2001, 292, 281–284. [Google Scholar] [CrossRef] [Scilit]
  7. Weinzettel, J.; Hertwich, E.G.; Peters, G.P.; Steen-Olsen, K.; Galli, A. Affluence Drives the Global Displacement of Land Use. Glob. Environ. Change 2013, 23, 433–438. [Google Scholar] [CrossRef] [Scilit]
  8. Garcia, S.; Rushforth, R.; Ruddell, B.L.; Mejia, A. Full Domestic Supply Chains of Blue Virtual Water Flows Estimated for Major U.S. Cities. Water Resour. Res. 2020, 56, e2019WR026190. [Google Scholar] [CrossRef] [Scilit]
  9. Lenzen, M. Errors in Conventional and Input-Output—Based Life—Cycle Inventories. J. Ind. Ecol. 2000, 4, 127–148. [Google Scholar] [CrossRef] [Scilit]
  10. Matthews, H.S.; Hendrickson, C.T.; Weber, C.L. The Importance of Carbon Footprint Estimation Boundaries. Environ. Sci. Technol. 2008, 42, 5839–5842. [Google Scholar] [CrossRef] [Scilit] [PubMed]
  11. Peters, G.P.; Hertwich, E.G. CO2 Embodied in International Trade with Implications for Global Climate Policy. Environ. Sci. Technol. 2008, 42, 1401–1407. [Google Scholar] [CrossRef] [Scilit]
  12. Hoekstra, A.Y.; Chapagain, A.K. Water Footprints of Nations: Water Use by People as a Function of Their Consumption Pattern. Water Resour. Manag. 2006, 21, 35–48. [Google Scholar] [CrossRef] [Scilit]
  13. Aldaya, M.M.; Chapagain, A.K.; Hoekstra, A.Y.; Mekonnen, M.M. The Water Footprint Assessment Manual; Routledge: London, UK, 2012; ISBN 9781136538520. [Google Scholar]
  14. Dong, H.; Geng, Y.; Sarkis, J.; Fujita, T.; Okadera, T.; Xue, B. Regional Water Footprint Evaluation in China: A Case of Liaoning. Sci. Total Environ. 2013, 442, 215–224. [Google Scholar] [CrossRef] [Scilit]
  15. Braungart, M.; McDonough, W.; Bollinger, A. Cradle-to-Cradle Design: Creating Healthy Emissions—A Strategy for Eco-Effective Product and System Design. J. Clean. Prod. 2007, 15, 1337–1348. [Google Scholar] [CrossRef] [Scilit]
  16. Dong, G.; Mao, X.; Zhou, J.; Zeng, A. Carbon Footprint Accounting and Dynamics and the Driving Forces of Agricultural Production in Zhejiang Province, China. Ecol. Econ. 2013, 91, 38–47. [Google Scholar] [CrossRef] [Scilit]
  17. Yu, Y.; Feng, K.; Hubacek, K.; Sun, L. Global Implications of China’s Future Food Consumption. J. Ind. Ecol. 2016, 20, 593–602. [Google Scholar] [CrossRef] [Scilit]
  18. Strassner, C.; Kahl, J. Understanding a Food Systems Approach. In Organic Food Systems: Meeting the Needs of Southern Africa; CABI: Wallingford, UK, 2020; pp. 51–59. [Google Scholar]
  19. De Matteis, L.; Mattioni, D.; Garcia Campos, P.; Ilie, E.T.; Wiegers, E.; Hawkes, C. International Experiences of Systems Approaches: Re-Thinking Policies and Governance to Transform Agrifood Systems. Philos. Trans. R. Soc. B Biol. Sci. 2025, 380, 20240159. [Google Scholar] [CrossRef] [Scilit]
  20. FAO. Transforming Food and Agriculture Through a Systems Approach; FAO: Rome, Italy, 2025; ISBN 978-92-5-139963-7. [Google Scholar]
  21. Pang, Q.; Lv, X.; Zhang, L. Industrial Trade and Embodied Energy Transfer Patterns Analysis in China: A Perspective of Multilayer Complex Networks. Energy 2025, 332, 137264. [Google Scholar] [CrossRef] [Scilit]
  22. Miller, R.E.; Blair, P.D. Input-Output Analysis; Cambridge University Press: Cambridge, UK, 2009; ISBN 9780521739023. [Google Scholar]
  23. Shmelev, S.E. A Key Sector Approach to the Environmentally Extended Input-Output Analysis of the UK Economy. In Sustainability Analysis; Palgrave Macmillan: London, UK, 2012; pp. 69–99. [Google Scholar]
  24. Minx, J.C.; Wiedmann, T.; Wood, R.; Peters, G.P.; Lenzen, M.; Owen, A.; Scott, K.; Barrett, J.; Hubacek, K.; Baiocchi, G.; et al. Input–output analysis and carbon footprinting: An overview of applications. Econ. Syst. Res. 2009, 21, 187–216. [Google Scholar] [CrossRef] [Scilit]
  25. Hertwich, E.G.; Peters, G.P. Carbon Footprint of Nations: A Global, Trade-Linked Analysis. Environ. Sci. Technol. 2009, 43, 6414–6420. [Google Scholar] [CrossRef] [Scilit] [PubMed]
  26. Guan, S.; Han, M.; Wu, X.; Guan, C.; Zhang, B. Exploring Energy-Water-Land Nexus in National Supply Chains: China 2012. Energy 2019, 185, 1225–1234. [Google Scholar] [CrossRef] [Scilit]
  27. Cao, Q.; Song, J.; Liu, C.; Yang, W. Evolving Water, Energy and Carbon Footprints in China’s Food Supply Chain. J. Clean. Prod. 2023, 423, 138716. [Google Scholar] [CrossRef] [Scilit]
  28. Chen, B.; Han, M.Y.; Peng, K.; Zhou, S.L.; Shao, L.; Wu, X.F.; Wei, W.D.; Liu, S.Y.; Li, Z.; Li, J.S.; et al. Global Land-Water Nexus: Agricultural Land and Freshwater Use Embodied in Worldwide Supply Chains. Sci. Total Environ. 2018, 613–614, 931–943. [Google Scholar] [CrossRef] [Scilit]
  29. Leontief, W.W. Quantitative Input and Output Relations in the Economic Systems of the United States. Rev. Econ. Stat. 1936, 18, 105. [Google Scholar] [CrossRef] [Scilit]
  30. Georgescu-Roegen, N.; Leontief, W.W. The Structure of the American Economy, 1919–1939: An Empirical Application of Equilibrium Analysis. Econometrica 1951, 19, 351. [Google Scholar] [CrossRef] [Scilit]
  31. Du, Q.; Liao, C.-Y.; Mao, Y.-H. Quantitative Analysis on L.-K. Hua’s Input-Output Model. Discret. Contin. Dyn. Syst.-S 2025, 18, 2912–2923. [Google Scholar] [CrossRef] [Scilit]
  32. Tran, T.K.; Sato, H.; Namatame, A. Key Economic Sectors and Their Transitions: Analysis of World Input-Output Network. In Robustness in Econometrics; Springer International Publishing: Cham, Switzerland, 2017; pp. 381–399. [Google Scholar]
  33. Gymnopoulos, A.; Tsaliki, P. Production, Nonproduction Sectors, and Economic Growth: An Input-Output Analysis of the US Economy, 1995–2018. Rev. Radic. Political Econ. 2026, 58, 157–171. [Google Scholar] [CrossRef] [Scilit]
  34. Vltavska, K.; Fischer, J. Macroeconomic impact of expenditures on higher education: Regional input-output analysis. J. Effic. Responsib. Educ. Sci. 2017, 10, 116–120. [Google Scholar] [CrossRef] [Scilit]
  35. Gürkan, Y.; Keçeli, S. The Intersectoral Linkage Effects in Turkish Economy: An Application of Static Leontief Model. Panoeconomicus 2009, 56, 301–326. [Google Scholar] [CrossRef] [Scilit]
  36. Tounsi, S.; Ezzahid, E.H.; El Alaoui, A.; Nihou, A. Key Sectors in the Moroccan Economy: An Application of Input-Output Analysis. Economics 2013, 7, 1–19. [Google Scholar] [CrossRef] [Scilit]
  37. Ayres, R.U.; Kneese, A.V. Production, Consumption, and Externalities. In The Roots of Logistics; Springer: Berlin/Heidelberg, Germany, 2012; pp. 363–388. [Google Scholar]
  38. Leontief, W. Environmental Repercussions and the Economic Structure: An Input-Output Approach. Rev. Econ. Stat. 1970, 52, 262. [Google Scholar] [CrossRef] [Scilit]
  39. Yokoi, R.; Kanemoto, K.; Itsubo, N.; Motoshita, M. Potential Impact of Abiotic Resource Use Considering Country-Specific Supply Chain: Consumption-Based Characterization and Normalization Utilizing a Multi-Regional Input–Output Model. Int. J. Life Cycle Assess. 2025, 30, 2003–2019. [Google Scholar] [CrossRef] [Scilit]
  40. Yu, H.; Zhang, S.; Sun, M.; Xu, C. Environmental Extended Multiregional Input–Output Model Unveiling the Microfiber Footprint Embodied in the Textile Interprovincial Trade in China. Environ. Sci. Technol. Lett. 2025, 12, 1567–1574. [Google Scholar] [CrossRef] [Scilit]
  41. Fotova Čiković, K.; Keček, D.; Mikulić, D. An Application of an Environmentally Extended Input-Output Model to the Assessment of CO2 Emissions of Croatian Economic Sectors. Croat. Oper. Res. Rev. 2025, 16, 137–150. [Google Scholar] [CrossRef] [Scilit]
  42. Sun, Y.-Y.; Cadarso, M.A.; Driml, S. Tourism Carbon Footprint Inventories: A Review of the Environmentally Extended Input-Output Approach. Ann. Tour. Res. 2020, 82, 102928. [Google Scholar] [CrossRef] [Scilit]
  43. Schepelmann, P.; Vercalsteren, A.; Acosta-Fernandez, J.; Saurat, M.; Boonen, K.; Christis, M.; Marin, G.; Zoboli, R.; Maguire, C. Driving Forces of Changing Environmental Pressures from Consumption in the European Food System. Sustainability 2020, 12, 8265. [Google Scholar] [CrossRef] [Scilit]
  44. Horvath, A.; Qin, Y. An Integrated Food-Energy-Water Systems Model for Tackling Questions Related to Agricultural Produce and Food Supply Chains. In Proceedings of the 22nd EGU General Assembly, Online, 4–8 May 2020. [Google Scholar]
  45. Canning, P.; Rehkamp, S.; Yi, J. Environmental Input-Output (EIO) Models for Food Systems Research: Application and Extensions. In Food Systems Modelling; Elsevier: Amsterdam, The Netherlands, 2022; pp. 179–212. [Google Scholar]
  46. Reutter, B.; Lant, P.; Reynolds, C.; Lane, J. Food Waste Consequences: Environmentally Extended Input-Output as a Framework for Analysis. J. Clean. Prod. 2017, 153, 506–514. [Google Scholar] [CrossRef] [Scilit]
  47. Xu, C.-G.; Cai, J.; Yu, Y.-S.; Yan, K.-F.; Li, X.-S. Effect of Pressure on Methane Recovery from Natural Gas Hydrates by Methane-Carbon Dioxide Replacement. Appl. Energy 2018, 217, 527–536. [Google Scholar] [CrossRef] [Scilit]
  48. Lu, Y.; Chen, B. Energy-Water Nexus in Urban Industrial System. Energy Procedia 2016, 88, 212–217. [Google Scholar] [CrossRef] [Scilit]
  49. Sturla, G.; Ciulla, L.; Rocchi, B. Natural and Social Scarcity in Water Footprint: A Multiregional Input–Output Analysis for Italy. Ecol. Indic. 2023, 147, 109981. [Google Scholar] [CrossRef] [Scilit]
  50. Tennakoon, S.M.A.V.S. Multi-Regional Input-Output Analysis (MRIO): Exploring Trends and Gaining Key Insights Through Bibliometric Analysis. Manag. Dyn. Knowl. Econ. 2024, 12, 321–341. [Google Scholar] [CrossRef] [Scilit]
  51. Alharbi, F.; Gufran, K.; Alqerban, A.; Alqahtani, A.S.; Asiri, S.N.; Almutairi, A. Evaluation of Compliance with the Preferred Reporting Items for Systematic Reviews and Meta-Analyses (PRISMA) Guidelines for Conducting and Reporting Systematic Reviews in Three Major Periodontology Journals. Open Dent. J. 2024, 18, 1–10. [Google Scholar] [CrossRef] [Scilit]
  52. Moher, D.; Liberati, A.; Tetzlaff, J.; Altman, D.G. Preferred Reporting Items for Systematic Reviews and Meta-Analyses: The PRISMA Statement. BMJ 2009, 339, b2535. [Google Scholar] [CrossRef] [PubMed]
  53. Aria, M.; Cuccurullo, C. Bibliometrix: An R-Tool for Comprehensive Science Mapping Analysis. J. Informetr. 2017, 11, 959–975. [Google Scholar] [CrossRef] [Scilit]
  54. Bradford, S.C. Sources of Information on Specific Subjects. Eng. Illus. Wkly. J. 1934, 137, 85–86. [Google Scholar]
  55. Desai, N.; Veras, L.; Gosain, A. Using Bradford’s Law of Scattering to Identify the Core Journals of Pediatric Surgery. J. Surg. Res. 2018, 229, 90–95. [Google Scholar] [CrossRef] [Scilit]
  56. Lenzen, M.; Moran, D.; Kanemoto, K.; Geschke, A. Building Eora: A global multi-region input–output database at high country and sector resolution. Econ. Syst. Res. 2013, 25, 20–49. [Google Scholar] [CrossRef] [Scilit]
  57. Stadler, K.; Wood, R.; Bulavskaya, T.; Södersten, C.; Simas, M.; Schmidt, S.; Usubiaga, A.; Acosta-Fernández, J.; Kuenen, J.; Bruckner, M.; et al. EXIOBASE 3: Developing a Time Series of Detailed Environmentally Extended Multi-Regional Input-Output Tables. J. Ind. Ecol. 2018, 22, 502–515. [Google Scholar] [CrossRef] [Scilit]
  58. Wiedmann, T. A Review of Recent Multi-Region Input–Output Models Used for Consumption-Based Emission and Resource Accounting. Ecol. Econ. 2009, 69, 211–222. [Google Scholar] [CrossRef] [Scilit]
  59. Lenzen, M.; Moran, D.; Bhaduri, A.; Kanemoto, K.; Bekchanov, M.; Geschke, A.; Foran, B. International Trade of Scarce Water. Ecol. Econ. 2013, 94, 78–85. [Google Scholar] [CrossRef] [Scilit]
  60. Lenzen, M.; Moran, D.; Kanemoto, K.; Foran, B.; Lobefaro, L.; Geschke, A. International Trade Drives Biodiversity Threats in Developing Nations. Nature 2012, 486, 109–112. [Google Scholar] [CrossRef] [Scilit]
  61. Yu, Y.; Feng, K.; Hubacek, K. Tele-Connecting Local Consumption to Global Land Use. Glob. Environ. Change 2013, 23, 1178–1186. [Google Scholar] [CrossRef] [Scilit]
  62. Hoekstra, A.Y.; Mekonnen, M.M. The Water Footprint of Humanity. Proc. Natl. Acad. Sci. USA 2012, 109, 3232–3237. [Google Scholar] [CrossRef] [Scilit] [PubMed]
  63. Steen-Olsen, K.; Weinzettel, J.; Cranston, G.; Ercin, A.E.; Hertwich, E.G. Carbon, Land, and Water Footprint Accounts for the European Union: Consumption, Production, and Displacements through International Trade. Environ. Sci. Technol. 2012, 46, 10883–10891. [Google Scholar] [CrossRef] [Scilit] [PubMed]
  64. Lenzen, M.; Kanemoto, K.; Moran, D.; Geschke, A. Mapping the Structure of the World Economy. Environ. Sci. Technol. 2012, 46, 8374–8381. [Google Scholar] [CrossRef] [Scilit] [PubMed]
  65. Wiedmann, T.; Lenzen, M.; Turner, K.; Barrett, J. Examining the Global Environmental Impact of Regional Consumption Activities—Part 2: Review of Input–Output Models for the Assessment of Environmental Impacts Embodied in Trade. Ecol. Econ. 2007, 61, 15–26. [Google Scholar] [CrossRef] [Scilit]
  66. Wood, R.; Stadler, K.; Bulavskaya, T.; Lutter, S.; Giljum, S.; De Koning, A.; Kuenen, J.; Schütz, H.; Acosta-Fernández, J.; Usubiaga, A.; et al. Global Sustainability Accounting—Developing EXIOBASE for Multi-Regional Footprint Analysis. Sustainability 2014, 7, 138–163. [Google Scholar] [CrossRef] [Scilit]
  67. Zhang, C.; Anadon, L.D. A Multi-Regional Input–Output Analysis of Domestic Virtual Water Trade and Provincial Water Footprint in China. Ecol. Econ. 2014, 100, 159–172. [Google Scholar] [CrossRef] [Scilit]
  68. Wiedmann, T.; Lenzen, M. Environmental and Social Footprints of International Trade. Nat. Geosci. 2018, 11, 314–321. [Google Scholar] [CrossRef] [Scilit]
  69. Zhao, X.; Liu, J.; Liu, Q.; Tillotson, M.R.; Guan, D.; Hubacek, K. Physical and Virtual Water Transfers for Regional Water Stress Alleviation in China. Proc. Natl. Acad. Sci. USA 2015, 112, 1031–1035. [Google Scholar] [CrossRef] [Scilit]
  70. Chen, L.; Msigwa, G.; Yang, M.; Osman, A.I.; Fawzy, S.; Rooney, D.W.; Yap, P.-S. Strategies to Achieve a Carbon Neutral Society: A Review. Environ. Chem. Lett. 2022, 20, 2277–2310. [Google Scholar] [CrossRef] [Scilit]
  71. van Ittersum, M.K.; Rabbinge, R. Concepts in Production Ecology for Analysis and Quantification of Agricultural Input-Output Combinations. Field Crops Res. 1997, 52, 197–208. [Google Scholar] [CrossRef] [Scilit]
  72. Marques, A.; Martins, I.S.; Kastner, T.; Plutzar, C.; Theurl, M.C.; Eisenmenger, N.; Huijbregts, M.A.J.; Wood, R.; Stadler, K.; Bruckner, M.; et al. Increasing Impacts of Land Use on Biodiversity and Carbon Sequestration Driven by Population and Economic Growth. Nat. Ecol. Evol. 2019, 3, 628–637. [Google Scholar] [CrossRef] [Scilit]
  73. Ngoc, U.N.; Schnitzer, H. Sustainable Solutions for Solid Waste Management in Southeast Asian Countries. Waste Manag. 2009, 29, 1982–1995. [Google Scholar] [CrossRef] [Scilit] [PubMed]
  74. Chen, G.Q.; Zhang, B. Greenhouse Gas Emissions in China 2007: Inventory and Input–Output Analysis. Energy Policy 2010, 38, 6180–6193. [Google Scholar] [CrossRef] [Scilit]
  75. Kizilaslan, H. Input–Output Energy Analysis of Cherries Production in Tokat Province of Turkey. Appl. Energy 2009, 86, 1354–1358. [Google Scholar] [CrossRef] [Scilit]
  76. Graedel, T.E. Material Flow Analysis from Origin to Evolution. Environ. Sci. Technol. 2019, 53, 12188–12196. [Google Scholar] [CrossRef] [Scilit]
  77. Duarte, R.; Sánchez-Chóliz, J.; Bielsa, J. Water Use in the Spanish Economy: An Input–Output Approach. Ecol. Econ. 2002, 43, 71–85. [Google Scholar] [CrossRef] [Scilit]
  78. Fang, D.; Chen, B. Linkage Analysis for the Water–Energy Nexus of City. Appl. Energy 2017, 189, 770–779. [Google Scholar] [CrossRef] [Scilit]
  79. Esengun, K.; Gündüz, O.; Erdal, G. Input–Output Energy Analysis in Dry Apricot Production of Turkey. Energy Convers. Manag. 2007, 48, 592–598. [Google Scholar] [CrossRef] [Scilit]
  80. Hertwich, E.G.; Wood, R. The Growing Importance of Scope 3 Greenhouse Gas Emissions from Industry. Environ. Res. Lett. 2018, 13, 104013. [Google Scholar] [CrossRef] [Scilit]
  81. Yu, Y.; Hubacek, K.; Feng, K.; Guan, D. Assessing Regional and Global Water Footprints for the UK. Ecol. Econ. 2010, 69, 1140–1147. [Google Scholar] [CrossRef] [Scilit]
  82. Zhao, X.; Yang, H.; Yang, Z.; Chen, B.; Qin, Y. Applying the Input-Output Method to Account for Water Footprint and Virtual Water Trade in the Haihe River Basin in China. Environ. Sci. Technol. 2010, 44, 9150–9156. [Google Scholar] [CrossRef] [Scilit]
  83. Wang, Z.; Huang, K.; Yang, S.; Yu, Y. An Input–Output Approach to Evaluate the Water Footprint and Virtual Water Trade of Beijing, China. J. Clean. Prod. 2013, 42, 172–179. [Google Scholar] [CrossRef] [Scilit]
  84. Liu, D.; Guo, X.; Xiao, B. What Causes Growth of Global Greenhouse Gas Emissions? Evidence from 40 Countries. Sci. Total Environ. 2019, 661, 750–766. [Google Scholar] [CrossRef] [Scilit]
  85. Read, Q.D.; Brown, S.; Cuéllar, A.D.; Finn, S.M.; Gephart, J.A.; Marston, L.T.; Meyer, E.; Weitz, K.A.; Muth, M.K. Assessing the Environmental Impacts of Halving Food Loss and Waste along the Food Supply Chain. Sci. Total Environ. 2020, 712, 136255. [Google Scholar] [CrossRef] [Scilit] [PubMed]
  86. Wang, X.-C.; Klemeš, J.J.; Wang, Y.; Dong, X.; Wei, H.; Xu, Z.; Varbanov, P.S. Water-Energy-Carbon Emissions Nexus Analysis of China: An Environmental Input-Output Model-Based Approach. Appl. Energy 2020, 261, 114431. [Google Scholar] [CrossRef] [Scilit]
  87. Bruckner, M.; Fischer, G.; Tramberend, S.; Giljum, S. Measuring Telecouplings in the Global Land System: A Review and Comparative Evaluation of Land Footprint Accounting Methods. Ecol. Econ. 2015, 114, 11–21. [Google Scholar] [CrossRef] [Scilit]
  88. Guo, S.; Shen, G.Q.; Chen, Z.-M.; Yu, R. Embodied Cultivated Land Use in China 1987–2007. Ecol. Indic. 2014, 47, 198–209. [Google Scholar] [CrossRef] [Scilit]
  89. Schaffartzik, A.; Haberl, H.; Kastner, T.; Wiedenhofer, D.; Eisenmenger, N.; Erb, K. Trading Land: A Review of Approaches to Accounting for Upstream Land Requirements of Traded Products. J. Ind. Ecol. 2015, 19, 703–714. [Google Scholar] [CrossRef] [Scilit]
  90. Cazcarro, I.; Duarte, R.; Sánchez-Chóliz, J. Downscaling the Grey Water Footprints of Production and Consumption. J. Clean. Prod. 2016, 132, 171–183. [Google Scholar] [CrossRef] [Scilit]
  91. Tellarini, V.; Caporali, F. An Input/Output Methodology to Evaluate Farms as Sustainable Agroecosystems: An Application of Indicators to Farms in Central Italy. Agric. Ecosyst. Environ. 2000, 77, 111–123. [Google Scholar] [CrossRef] [Scilit]
  92. Virtanen, Y.; Kurppa, S.; Saarinen, M.; Katajajuuri, J.-M.; Usva, K.; Mäenpää, I.; Mäkelä, J.; Grönroos, J.; Nissinen, A. Carbon Footprint of Food—Approaches from National Input–Output Statistics and a LCA of a Food Portion. J. Clean. Prod. 2011, 19, 1849–1856. [Google Scholar] [CrossRef] [Scilit]
  93. Houshyar, E.; Grundmann, P. Environmental Impacts of Energy Use in Wheat Tillage Systems: A Comparative Life Cycle Assessment (LCA) Study in Iran. Energy 2017, 122, 11–24. [Google Scholar] [CrossRef] [Scilit]
  94. Mayer, A.; Mubako, S.; Ruddell, B.L. Developing the Greatest Blue Economy: Water Productivity, Fresh Water Depletion, and Virtual Water Trade in the Great Lakes Basin. Earths Future 2016, 4, 282–297. [Google Scholar] [CrossRef] [Scilit]
  95. Nabavi-Pelesaraei, A.; Rafiee, S.; Mohtasebi, S.S.; Hosseinzadeh-Bandbafha, H.; Chau, K. Energy Consumption Enhancement and Environmental Life Cycle Assessment in Paddy Production Using Optimization Techniques. J. Clean. Prod. 2017, 162, 571–586. [Google Scholar] [CrossRef] [Scilit]
  96. Taki, M.; Soheili-Fard, F.; Rohani, A.; Chen, G.; Yildizhan, H. Life Cycle Assessment to Compare the Environmental Impacts of Different Wheat Production Systems. J. Clean. Prod. 2018, 197, 195–207. [Google Scholar] [CrossRef] [Scilit]
  97. Bruckner, M.; Häyhä, T.; Giljum, S.; Maus, V.; Fischer, G.; Tramberend, S.; Börner, J. Quantifying the Global Cropland Footprint of the European Union’s Non-Food Bioeconomy. Environ. Res. Lett. 2019, 14, 045011. [Google Scholar] [CrossRef] [Scilit]
  98. Feng, W.; Cai, B.; Zhang, B. A Bite of China: Food Consumption and Carbon Emission from 1992 to 2007. China Econ. Rev. 2020, 59, 100949. [Google Scholar] [CrossRef] [Scilit]
  99. Lotka, A.J. The Frequency Distribution of Scientific Productivity. J. Wash. Acad. Sci. 1926, 16, 317–323. [Google Scholar]
  100. Kawamura, M.; Thomas, C.D.L.; Tsurumoto, A.; Sasahara, H.; Kawaguchi, Y. Lotka’s Law and Productivity Index of Authors in a Scientific Journal. J. Oral Sci. 2000, 42, 75–78. [Google Scholar] [CrossRef] [Scilit]
  101. Cahyadi, E.R.; Hidayati, N.; Zahra, N.; Arif, C. Integrating Circular Economy Principles into Agri-Food Supply Chain Management: A Systematic Literature Review. Sustainability 2024, 16, 7165. [Google Scholar] [CrossRef] [Scilit]
  102. Zhao, L.; Lv, Y.; Wang, C.; Xue, J.; Yang, Y.; Li, D. Embodied Greenhouse Gas Emissions in the International Agricultural Trade. Sustain. Prod. Consum. 2023, 35, 250–259. [Google Scholar] [CrossRef] [Scilit]
  103. Vallejos, X.; Hidalgo, S.; González, B.; Neumann, P. Estimation of the Water Footprint of Wood Construction in Chile Using a Streamlined Input–Output-Based Model. Sustainability 2025, 17, 1061. [Google Scholar] [CrossRef] [Scilit]
  104. Attinasi, M.-G.; Boeckelmann, L.; de Castro Martins, B.; Meunier, B.; Borin, A.; Conteduca, F.P.; Mancini, M. Supply Chain Decoupling in Green Products: A Granular Input-Output Analysis. Energy Econ. 2025, 149, 108773. [Google Scholar] [CrossRef] [Scilit]
  105. Liu, X.; Cifuentes-Faura, J.; Shi, W.; Tian, C. Exploring the Carbon Emission Transfers Pathway to Address the Issue of Sustainable Development: A Multi-Regional Input–Output Perspective. Sustain. Dev. 2025, 33, 5676–5703. [Google Scholar] [CrossRef] [Scilit]
  106. Corigliano, O.; Morrone, P.; Algieri, A. Navigating the Challenges of Sustainability in the Food Processing Chain: Insights into Energy Interventions to Reduce Footprint. Energies 2025, 18, 296. [Google Scholar] [CrossRef] [Scilit]
  107. Sampedro, J.; Kyle, P.; Ramig, C.W.; Tanner, D.; Huster, J.E.; Wise, M.A. Dynamic Linking of Upstream Energy and Freight Demands for Bio and Fossil Energy Pathways in the Global Change Analysis Model. Appl. Energy 2021, 302, 117580. [Google Scholar] [CrossRef] [Scilit]
  108. Vercalsteren, A.; Christis, M.; Geerken, T.; Van der Linden, A. Policy Needs (to Be) Covered by Static Environmentally Extended Input–Output Analyses. Econ. Syst. Res. 2020, 32, 121–144. [Google Scholar] [CrossRef] [Scilit]
  109. Avelino, A.F.T. Disaggregating Input–Output Tables in Time: The Temporal Input–Output Framework. Econ. Syst. Res. 2017, 29, 313–334. [Google Scholar] [CrossRef] [Scilit]
  110. Altimiras-Martin, A. A Supply-Driven Model Consuming Simultaneously All Primary Inputs: Unfolding Analytical Potential beyond the Ghosh Model. Econ. Syst. Res. 2024, 36, 249–264. [Google Scholar] [CrossRef] [Scilit]
  111. Steen-Olsen, K.; Owen, A.; Hertwich, E.G.; Lenzen, M. Effects of sector aggregation on CO2 multipliers in multiregional input–output analyses. Econ. Syst. Res. 2014, 26, 284–302. [Google Scholar] [CrossRef] [Scilit]
  112. Chircop, J.; Tarsalewska, M.; Trzeciakiewicz, A. Learning to Be Green: Accounting Comparability and Environmental Violations. Br. Account. Rev. 2025, 57, 101240. [Google Scholar] [CrossRef] [Scilit]
  113. Nadiminti, V.; Nerius, E. A Systematic Review of Environmental Accounting. Interdiscip. J. Papua New Guin. Univ. Technol. 2025, 27, 1–13. [Google Scholar] [CrossRef] [Scilit]
  114. Zhao, Y.; Zhang, J.; Li, S.; Yu, M. Greenhouse Gas Accounting and Emission Reduction in Prefabricated Construction: Insights from Extended Input-Output Analysis. Constr. Innov. 2025, 26, 1252–1277. [Google Scholar] [CrossRef] [Scilit]
Figure 1. PRISMA flow diagram of the study-selection process for EEIO applications.
Agriculture 16 00786 g001
Figure 2. Trend article published over time (1978–2025).
Agriculture 16 00786 g002
Figure 3. Publications by country (1978–2025). Note: Darker shades indicate higher publication output, while grey indicates countries outside the selected group.
Agriculture 16 00786 g003
Figure 4. Countries’ collaboration network (1978–2025). Note: Nodes represent countries, node size reflects their publication relevance in the dataset, links indicate collaboration ties, and colors identify different collaboration communities.
Agriculture 16 00786 g004
Figure 5. Cluster Map of the Top 100 Keywords in the EEIO–Agriculture Literature. Note: Nodes represent keywords, node size reflects their frequency of occurrence, links indicate co-occurrence relationships, and colors identify thematic clusters.
Agriculture 16 00786 g005
Figure 6. Trends of the Top 20 Topics Over the Last Decade in the EEIO–Agriculture Literature.
Agriculture 16 00786 g006
Figure 7. Top 20 Journals in the EEIO–Agriculture Literature (1978–2025).
Agriculture 16 00786 g007
Figure 8. Core sources by Bradford’s Law. Note: The grey box marks the core-source area across Bradford zones.
Agriculture 16 00786 g008
Figure 9. Top 20 author productivity over time in the EEIO–agriculture literature. Note: Each circle represents an article in a given year; circle size indicates the number of articles, and darker blue indicates higher citations per year.
Agriculture 16 00786 g009
Figure 10. Distribution of Authors Across the Study Dataset in the EEIO–agriculture literature. Note: nodes represent authors, links indicate co-authorship relationships, and colors identify collaboration communities.
Agriculture 16 00786 g010
Figure 11. Citation-Filtered Author Collaboration Network (Top 25% of 1000 samples). Note: Nodes represent authors, links indicate collaboration ties, and colors identify the main author communities.
Agriculture 16 00786 g011
Figure 12. Citation-Filtered Author Collaboration Network (Top 50% of 1000 samples). Note: Nodes represent authors, links indicate collaboration ties, and colors identify the main author communities.
Agriculture 16 00786 g012
Figure 13. Citation-Filtered Author Collaboration Network (Top 75% of 1000 samples). Note: Nodes represent authors, links indicate collaboration ties, and colors identify the main author communities.
Agriculture 16 00786 g013
Table 1. Summary of studied dataset.
General Information
Timespan1978–2025
Sources (Journals, Books, etc.)235
Documents647
Annual Growth Rate %8.94
Document Average Age7.97
Average citations per doc35.61
Annual average citations per document4.136
References24,351
Document Types
article609
article; booksmchapter1
article; early access7
article; processing paper6
review24
Document Contents
Keywords Plus (ID)3800
Author’s Keywords (DE)1922
Authors
Number of Authors2374
Author appearances3066
Authors of single-authored docs40
Authors Collaboration
Single-authored docs40
Documents per Author0.273
Co-Authors per Doc4.74
International co-authorships %25.66
Table 2. Top 20 selected keywords by Authors.
KeywordFrequencyPercentage
input output analysis892.85
input output model411.31
China381.22
Water footprint341.09
Agriculture321.02
Input-output300.960
Industrial ecology240.768
Structural decomposition analysis230.736
Carbon footprint190.608
Input-Output analysis190.608
Multi-regional input-output190.608
Structural path analysis170.544
Sustainability170.544
land use160.512
Sustainable development160.512
virtual water150.480
Life cycle assessment140.448
Greenhouse gas emissions130.416
Trade120.384
energy110.352
Table 3. Top 20 selected keywords in the literature.
KeywordFrequencyPercentage
Input-output analysis2471.96
China2111.67
agriculture1821.44
consumption1230.974
article1100.871
sustainable development960.760
trade790.626
Environmental economics780.618
Environmental impact760.602
Water supply710.562
Energy680.539
Carbon650.515
Footprint580.459
Impact580.459
Input-Output analysis570.452
sustainability560.444
Input-output550.436
Input/output analysis550.436
Economic analysis540.428
Carbon emission530.420
Table 4. Top 20 journals based on H-Index.
RankJournal NameH IndexG IndexM IndexTotal CitationNo. PapersPublication Year
1Journal of Cleaner Production27451.682199622011
2Science of the Total Environment24401.712071402013
3Ecological Economics20290.621501291995
4Journal of Industrial Ecology20320.901946322005
5Environmental Science and Technology16190.801231192007
6Ecological Indicators13161389162014
7Journal of Environmental Management13230.52623232002
8Applied Energy9100.501068102009
9Sustainability (Switzerland)9140.90241242017
10Environmental Research Letters8110.80469112017
11Environmental Science and Pollution Research8120.67167162015
12Land Use Policy890.6733592015
13Energy Policy780.3572382007
14Renewable and Sustainable Energy Reviews670.432772012
15Sustainability680.613282017
16Energy560.3311362012
17International Journal of Life Cycle Assessment560.2913862010
18Environment Development and Sustainability220.501522023
19Resources Conservation and Recycling110.121812019
20Studies in Regional Science120.04872006
Note: H-Index: measures productivity and scientific impact; G-Index: measure of an author’s citation performance; M-Index: H-index normalized by academic career length.
Table 5. Summary of Bradford’s law.
ZoneNumber of Cumulative ArticlesNumber of Sources
Zone 12106
Zone 243137
Zone 3646194
Total646237
Table 6. Top 20 most cited manuscripts.
RankAuthorYearDOICitation
1[22]200910.1017/CBO978051162698287
2[38]197010.2307/192629467
3[29]193610.2307/192783753
4[56]201310.1080/09535314.2013.76993846
5[57]201810.1111/JIEC.1271538
6[58]200910.1016/j.ecolecon.2009.08.02638
7[59]201310.1016/J.ECOLECON.2013.06.01833
8[60]201210.1038/NATURE1114532
9[7]201310.1016/J.GLOENVCHA.2012.12.01032
10[61]201310.1016/J.GLOENVCHA.2013.04.00632
11[62]201210.1073/PNAS.110993610931
12[63]201210.1021/ES301949T31
13[64]201210.1021/ES300171X30
14[65]200710.1016/J.ECOLECON.2006.12.00329
15[66]201410.3390/SU701013828
16[67]201410.1016/J.ECOLECON.2014.02.00628
17[11]200810.1021/ES072023K27
18[68]201810.1038/S41561-018-0113-927
19[25]200910.1021/ES803496A25
20[69]201510.1073/PNAS.140413011225
Table 7. Top 20 cited papers.
RankAuthorJournalYearDOITC
1[70]Environmental Chemistry Letters202210.1007/s10311-022-01435-8921
2[57]Journal of Industrial Ecology201810.1111/jiec.12715701
3[71]Field Crops Research199710.1016/S0378-4290(97)00037-3492
4[72]Nature Ecology & Evolution201910.1038/s41559-019-0824-3364
5[61]Global Environmental Change201310.1016/j.gloenvcha.2013.04.006320
6[73]Waste Management200910.1016/j.wasman.2008.08.031312
7[74]Energy Policy201010.1016/j.enpol.2010.06.004304
8[75]Applied Energy200910.1016/j.apenergy.2008.07.009292
10[28]Science of the Total Environment201810.1016/j.scitotenv.2017.09.138273
11[76]Environmental Science and Technology201910.1021/acs.est.9b03413233
12[77]Ecological Economics200210.1016/S0921-8009(02)00183-0229
13[78]Applied Energy201710.1016/j.apenergy.2016.04.020226
14[79]Energy Conversion and Management200710.1016/j.enconman.2006.06.006222
15[80]Environmental Research Letters201810.1088/1748-9326/aae19a219
16[81]Ecological Economics201010.1016/j.ecolecon.2009.12.008213
17[82]Environmental Science and Technology201010.1021/es100886r212
18[83]Journal of Cleaner Production201310.1016/j.jclepro.2012.11.007193
19[84]Science of the Total Environment201910.1016/j.scitotenv.2019.01.197181
19[85]Science of the Total Environment202010.1016/j.scitotenv.2019.136255178
20[86]Applied Energy202010.1016/j.apenergy.2019.114431177
Table 8. Top 20 local cited papers.
AuthorDOIYearLCSGCS
[28]10.1016/j.scitotenv.2017.09.138201816273
[79]10.1016/j.enconman.2006.06.006200714222
[87]10.1016/j.ecolecon.2015.03.008201511152
[88]10.1016/j.ecolind.2014.05.0192014852
[89]10.1111/jiec.122582015853
[90]10.1016/j.jclepro.2015.07.1132016648
[17]10.1111/jiec.123922016658
[91]10.1016/S0167-8809(99)00097-32000565
[92]10.1016/j.jclepro.2011.07.00120115140
[93]10.1016/j.energy.2017.01.0692017561
[1]10.1016/j.jclepro.2019.04.0912019569
[49]10.1016/j.ecolind.2023.1099812023518
[94]10.1002/2016EF0003712016426
[2]10.1016/j.jclepro.2017.04.1182017441
[95]10.1016/j.jclepro.2017.06.07120174106
[96]10.1016/j.jclepro.2018.06.1732018485
[72]10.1038/s41559-019-0824-320194364
[97]10.1088/1748-9326/ab07f52019461
[98]10.1016/j.chieco.2016.06.0072020442
[8]10.1029/2019WR0261902020434
Note: GCS: Global Cited Score.
Table 9. Top 20 Authors.
RankAuthorsArticles
1Liang, Sai15
2Wood, Richard13
3Duarte, Rosa10
4Feng, Kuishuang10
5Cazcarro, Ignacio9
6Zhang, Bo9
7Bruckner, Martin8
8Chen, Bin8
9Hubacek, Klaus8
10Lenzen, Manfred8
11Sánchez-Chóliz, Julio8
12Tukker, Arnold8
13Yang, Zhifeng8
14Liu, Yu7
15Sun, Laixiang7
16Wang, Zhen7
17Zhang, Zhenjun He7
18Bai, Yuping6
19Duchin, Faye6
20Hu, Yuanchao6
Table 10. Output of Lotka’s law.
Documents WrittenN. of AuthorsProportion of AuthorsTheoretical Estimates
1200184%64%
223410%16%
3713%7%
4311%4%
5161%3%
650%2%
740%1%
870%1%
920%1%
1020%1%
1310%0%
1510%0%
Table 11. Top 10 authors among all studied communities.
CommunityAuthorTotal Citation Single AuthorNo. Author Inside CommunityTotal Citation of Community
WOOD, RICHARDWood, Richard16478628,368
Bruckner, Martin1427
Tukker, Arnold1233
Kastner, Thomas1154
Eisenmenger, Nina1118
Stadler, Konstantin1103
Plutzar, Christoph1065
Theurl, Michaela C.1065
Giljum, Stefan914
De Koning, Arjan820
ROONEY, DAVIDRooney, David W.92187368
Chen, Lin921
Fawzy, Samer921
Msigwa, Goodluck921
Osman, Ahmed I.921
Yang, Mingyu921
Yap, Pow Seng921
Yap, Pow-Seng921
CHEN, BINChen, Bin725266438
Chen, G. Q.616
Chen, Guoqian596
Zhang, Bo587
Han, M. Y.417
Fang, Delin283
Chen, B.273
Li, J. S.273
Li, Z.273
Liu, S. Y.273
LIANG, SAILiang, Sai516585580
Liu, Yu401
Yang, Zhifeng397
Xu, Ming296
Zhang, Tianzhu250
Xie, Yulei230
Ji, Ling193
Xu, Wenhao193
Zhao, Hongyan148
Zhang, Qiang148
HUBACEK, KLAUSHubacek, Klaus816575483
Feng, Kuishuang812
Yu, Yang598
Guan, Dabo409
Sun, Laixiang342
Zhao, Xu277
Zhao, Dandan193
Liu, Junguo188
Tillotson, Martin173
Wang, Saige143
MARSTON, LANDONMarston, Landon T.236272980
Read, Quentin D.194
Brown, Samuel178
Brown, Samuel P.178
Cuellar, Amanda D.178
Finn, Steven M.178
Gephart, Jessica A.178
Gephart, Jessica A…178
Meyer, Ellen178
Muth, Mary K.178
HUANG, KAIHuang, Kai215271730
Yu, Yajuan215
Wang, Zhen149
Li, Cai138
Shi, Zhihua107
Wang, Ling107
Yu, Shuxia107
Yan, Hua98
Liu, Gang90
Hu, Yuanchao83
DUARTE, ROSADuarte, Rosa562281727
Cazcarro, Ignacio263
Duchin, Faye188
Sanchez-Choliz, Ju…148
Serrano, Ana127
Sarasa, Cristina31
Amponsah, Samuel K.26
Arto, Inaki26
Asenso, Joseph K.26
Ofori-Danson, Patr…26
DALIN, CAROLEDalin, Carole215331702
Newbold, Tim201
Weinzettel, Jan139
Pfister, Stephan136
Scherer, Laura103
Ye, Quanliang99
Sun, Zhongxiao75
Behrens, Paul70
Zhuo, La56
Scherer, Laura A.47
GENG, YONGGeng, Yong341261607
Dong, Huijuan339
Tsuyoshi, Fujita280
Kang, Jianing104
Chen, Yihui59
Moss, Dana Avery59
Qian, Yiying59
Tian, Xu59
Yu, Yanhong59
Zhong, Shaozhuo59
LENZEN, MANFREDLenzen, Manfred292201571
Dey, C172
Dey, Christopher J.172
Lenzen, M172
Lundie, S172
Lundie, Sven172
Wood, R172
Malik, Arunima111
Geschke, Arne66
Singh, Shweta34
Disclaimer/Publisher’s Note: The statements, opinions and data contained in all publications are solely those of the individual author(s) and contributor(s) and not of MDPI and/or the editor(s). MDPI and/or the editor(s) disclaim responsibility for any injury to people or property resulting from any ideas, methods, instructions or products referred to in the content.