1. Introduction
The field of animal genetics has undergone a significant transformation due to the advent of high-throughput sequencing and genotyping technologies, particularly the use of single-nucleotide polymorphism (SNP) arrays. Single-nucleotide polymorphisms are abundant, stable, and uniformly distributed across the genome, making them ideal markers for both population-level analyses and precise kinship estimation [
1]. The practical use of genomic tools for kinship assessment in local cattle populations remains limited, especially in the smallholder sector. Most studies on indigenous beef cattle in South Africa have focused on population structure, breed characterization, or admixture analyses [
2,
3,
4,
5,
6], with few attempting to reconstruct or verify within-breed kinship in the absence of reliable pedigree data. Moreover, widely used computational algorithms for relationship inference often assume random or genetically homogeneous populations, which can lead to biased results when applied to structured or admixed populations such as those found in communal farming systems [
7].
Livestock production is indispensable in the global agricultural economy and remains a key contributor to household livelihoods, food security, and socioeconomic development, particularly in low- and middle-income countries. In South Africa, cattle are highly valued not only for their sociocultural significance but also because they are a primary source of animal protein and income for farmers [
8,
9]. Indigenous breed such as the Nguni and Bonsmara, a composite breed, are widely distributed across diverse agro-ecological zones and have been strategically bred for traits such as disease tolerance, adaptability, and productivity [
10,
11]. These breeds have been reported to have originated from crossing taurine and indicine to form a Sanga (
Bos Taurus africanus) breed from the East-Africa and found a niche in Southern Africa through human migration [
6,
12]. The successful implementation of breeding and genetic improvement strategies depends fundamentally on the availability of accurate genealogical or pedigree data. Accurate kinship estimation is critical not only for controlling inbreeding but also for improving selection decisions and ensuring long-term genetic gain.
The probability that two alleles in an individual are identical by descent (IBD) can be used to investigate the level of inbreeding in a population [
13]. In addition, genomic relationship matrices, which quantify the overall genomic similarity between pairs of individuals, can be used to accurately reconstruct pedigrees with or without relationship records. Single-nucleotide polymorphism data can be used to identify Mendelian errors among recorded parent–offspring pairs, providing an effective quality control measure when only partial lineages are available in a population [
14]. SNP data provides a powerful, marker-based alternative to infer genetic relationships, population structure, inbreeding, QTL mapping and demographic history, offering insights that would otherwise be impossible to obtain. For construction of pedigrees through SNPs markers, it is possible to establish relationship clusters through phylogeny and network analysis, allowing for a more precise assignment of individuals to their lineage of origin [
15] and to classify pairwise relationships into well-defined kinship categories.
The ability to validate pedigree information and infer kinship using SNP data, even in the absence of genealogical records, holds great potential for beef cattle breeds kept by smallholder farmers where pedigree and performance recording are often limited or non-existent. By demonstrating the extent of pedigree misclassification and highlighting the utility of genomic information in resolving complex relationships, this study provides valuable insights for managing inbreeding and designing more efficient and genetically sustainable smallholder breeding programs where animal recording is limited. The aim of this study was to use both pedigree records and high-density SNP data to reconstruct pedigrees and verify kinship relationships for two Sanga breeds, Nguni and Bonsmara beef cattle of South Africa.
2. Materials and Methods
2.1. Animal Selection and Sample Collection
This study used the available pedigree data from the Agricultural Research Council (ARC), Integrated Registration and Genetic Information System (INTERGIS), and the DNA profiling databases to select Bonsmara and Nguni animals for genotyping. Hair samples were obtained from the ARC-Animal Production (ARC-AP) Biobank. This study was conducted following approval by the ARC-AP Ethics Committee (APAEC 2020/17) and University of Pretoria Ethics Committee (NAS374/2022).
A total of 311 Bonsmara animals were selected from different families originating from two temperate regions (Gauteng and Northwest provinces). Based on the pedigree information, 52 half-sib families with identifiable sire–offspring pairs were included in the selection. Bonsmara animals consisted of multi-generational relationships including grandparents, parents and offspring relationships. For Nguni population, a total of 119 parent–offspring pairs were selected from three farming districts in the temperate coastal region (Eastern Cape). The average half-sib family sizes for Nguni and Bonsmara were 2.8 and 6.0, respectively.
2.2. DNA Extraction and Genotyping
Hair samples from 311 Bonsmara and 119 Nguni animals were sent to the Agricultural Research Council—Biotechnology Platform (ARC—BTP, Pretoria, South Africa) for genomic DNA extraction and genotyping using the BovineSNP50 BeadChip (Illumina Inc., San Diego, CA, USA) [
16]. DNA samples were quantified using Qubit v3.0 spectrophotometer to meet DNA concentration of ≥50.0 ng/µL for high-quality and appropriate quantities of DNA before SNP genotyping. Samples were genotyped in two groups per breed, one group on BovineSNP50 BeadChip (90% of the total samples, i.e., 103 Nguni and 279 Bonsmara) and the second group on Illumina
® BovineHD 777K BeadChip (10% of the total samples, i.e., 16 Nguni and 32 Bonsmara), to allow for imputation. Illumina Genome Studio v2.0.5 software was used for SNP calling, and data was converted into PLINK v1.9 input format [
1].
2.3. Data Imputation
Imputation was performed using Beagle v5.4 with genotypes from Nguni and Bonsmara cattle. A subset (16 Nguni and 32 Bonsmara) of animals including grandparents, parents, and offspring in the Bonsmara population, and parent–offspring pairs in the Nguni population, was selected as reference individuals for imputation to high density, using samples genotyped with the Illumina BovineHD 777K SNP panel. About 10 percent of the population was used as reference individuals in both breeds.
Imputation was conducted from a lower-density SNP50K panel to a 777K panel using Beagle’s [
17] default parameters as follows:
The analysis was executed with a set of optimized parameters, which were specifically reduced to improve performance and minimize computing time. Haplotype estimation and genotype phasing were conducted over a burn-in period of 6 iterations and 12 main iterations, with the Hidden Markov Model (HMM) for phasing configured to use 280 model states (phase-states). For the subsequent imputation of ungenotyped markers, the HMM was set to utilize 1600 model states (imp-states). This imputation process required a minimum cM length of 6.0 cM (imp-segment) for haplotype segments to be incorporated into the HMM statistics. Short Identity-by-State (IBS) segments were detected using a cM step length (imp-step) of 0.1 over 7 steps (imp-n steps). Furthermore, to manage marker density, individual markers were aggregated into a single unit if the maximum cM distance between them did not exceed 0.005 (cluster). General settings included an estimated effective population size (ne) of 1,000,000 for the phased data and a maximum cM length of 400 cM for the sliding window (window). Finally, the output files were configured to include both the probability of alleles 1 and 2 (ap = true) and the genotype probability (gp = true).
For the updated assembly coordinates, a web-based version of the University of California, Santa Cruz (UCSC) LiftOver program URL
https://genome.ucsc.edu/cgi-bin/hgLiftOver (accessed on 23 November 2023) was used to update genome coordinates from
Bos_taurus_UMD3.1 to the latest assembly coordinates of ARS-UCD1.2 using imputed data containing 732,570 SNP markers, from the initial 772,071 SNPs markers before imputation. This study applied a simplified approach for imputation accuracy such as the use of the Concordance Rate (CR), calculated by comparing the imputed marker genotypes against the actual genotypes present in the original 50K panel. The CR represents the proportion of correctly imputed genotypes at these masked sites. From the initial and final number of markers, the imputation accuracy was estimated at 94.9%. The remaining marker set was subjected to quality control for downstream analysis.
2.4. Data Filtering and Quality Control
Using PLINK v1.9, quality control analyses for genotype data were performed on 119 Nguni samples with 485,236 SNPs and 311 Bonsmara samples with 465,097 SNPs. Genome-wide Mendelian inconsistencies were tested on all samples, and individuals with more than 5% uncalled genotypes (call rate < 0.95), low minor allele frequencies (MAF < 0.05), and a p-value less than 0.0001 for the Hardy–Weinberg equilibrium test were removed for further analysis. SNPs that had duplicate genomic positions were also excluded.
2.5. Kinship Relationship Estimation
Relationships between animals were estimated using kinship-based inference for genome-wide association studies (KING) software v2.2.8 from Manichaikul et al. [
7], which applies a robust algorithm to infer pairwise relatedness from genomic data. This approach estimates the degree of relatedness between individuals by measuring IBD from genome-wide SNP data, without requiring complete pedigree information. KING assumes that allele frequencies are known and account for the population structure by incorporating PCA before IBD-based kinship inference.
The relationship coefficient between each pair of individuals, denoted by
, represents the probability that two alleles at a locus are identical by descent between individuals (
i and
j). In this study, kinship was inferred both within and between family structures, based on heterozygosity and allele sharing across the filtered SNPs [
7].
To infer kinship between family relationship structures, the following equation was used:
where
is the total number of SNPs at which both individuals of the pair are heterozygous,
is the total number of SNPs at which both individuals are homozygous on both major and minor alleles, and
and
is the total number of heterozygotes for the
i-th and
j-th individuals of the pair.
To infer kinship within family relationship structures, the following equation was used:
where
is the relationship coefficient of individuals
i and
j.
NAa,Aa is the total number of SNPs at which both individuals of the pair are heterozygous; and
is the total number of SNPs at which one individual is the homozygous major and the other the homozygous minor genotype.
and
are the numbers of heterozygotes for the
i-th and
j-th individuals, respectively, including SNPs with missing genotypes in both individual pairs. In addition, KING also calculates
π0, the probability that two individuals share zero alleles IBD at a given locus. These two measures were used in combination to classify pairwise relationships, as shown in
Table 1.
This classification scheme was used to infer kinship within and between individuals of the Nguni and Bonsmara breeds. The threshold values of
, defined as the probability that two alleles sampled at random from two individuals, are identical by descend, and
,
,
denote the probability that the two individuals share zero, one or two alleles identical by descent, respectively.
Table 1 provides a robust framework for categorizing relationships into biologically meaningful degrees of relatedness, such as monozygotic twins, parent–offspring, full siblings, second-degree relatives (e.g., half-siblings), and third-degree relatives (e.g., cousins), as well as unrelated pairs. Kingship coefficient is a function of IBD-sharing statistics with relationship
Inference criteria presented in
Table 1 are derived using the power of 2, with the basis that this is the natural scale of the kinship and zero-IBD sharing statistics.
2.6. Parent-Offspring Relationships
All possible pairings of diploid individuals were analyzed using PLINK [
1] for computing IBD sharing probabilities, using the ‘PI_HAT’ parameter. The expected value for most-like first-degree relatedness, which is parent–offspring, is 0.5 for both IBD and genomic relationship (GR). The probabilities of IBD1 (sharing1 allele) and IBD2 (sharing both alleles) across the genome were measured. The proportion of IBDs shared between genomes was calculated as Pr
(IBD1) × 0.5 + Pr
(IBD2), whereas the GR was calculated using the following equation [
13]:
where
Gij is the estimated GR between the
i-th and
j-th individuals, and
xin and
xjn refer to the number of reference alleles for the
i-th and
j-th individuals at SNP
n, respectively, and take a value of 0, 1 or 2 if the genotype at SNP
n is
aa,
Aa or
AA (alleles are arbitrarily called A or a), respectively. And
pn is the frequency of the reference allele at SNP
n, and
N is the number of SNPs. A total of 7021 (Nguni) and 48,205 (Bonsmara) pairings with a PI_HAT value greater than 0.45 were selected before estimating the number of Mendelian errors (ME) based on a hypothesis that the two individuals were parent and offspring: for example, if an individual had an
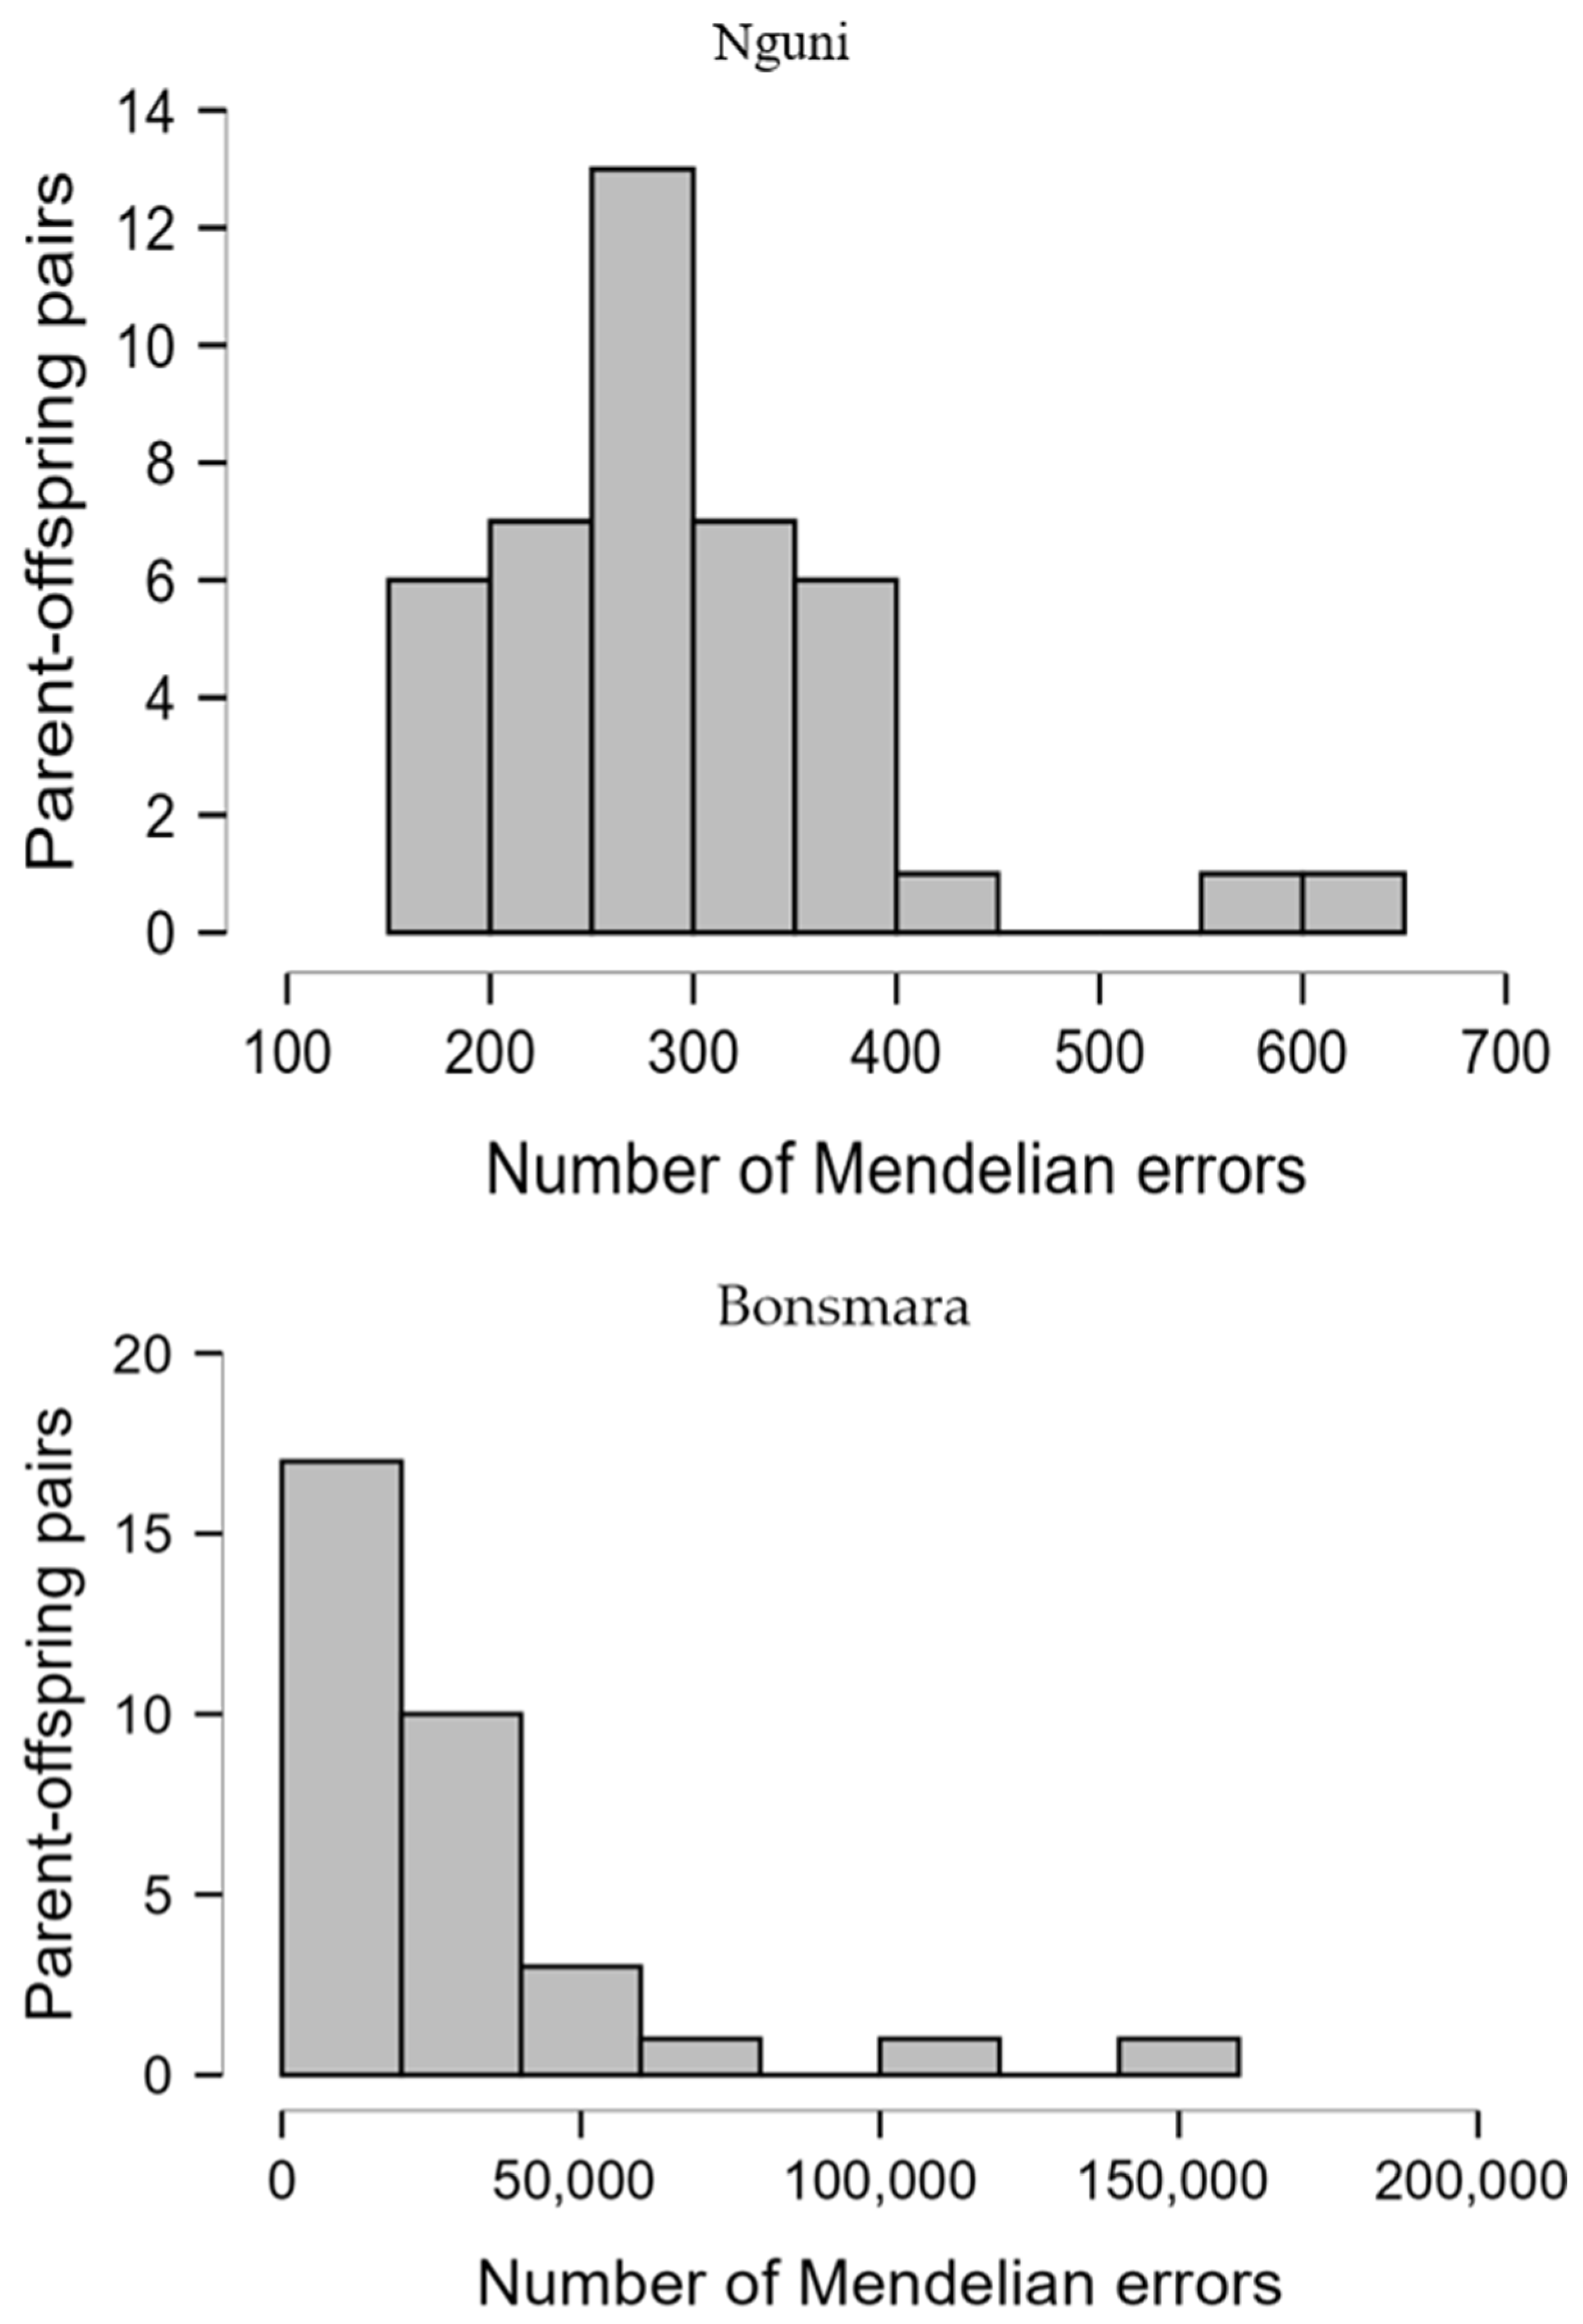
AA SNP genotype at a given locus and the other individual of the pairing had a BB SNP at the same locus, this was considered a Mendelian inheritance error for a parent–offspring relationship. Any pairings showing fewer than 600 ME when using the initial set of SNPs were considered as high-confidence parent–offspring relations (duos).
2.7. Inbreeding Coefficient
Using the PLINK software, the following genetic parameters were determined: inbreeding coefficient (F
IS) using het function, and observed and expected heterozygosity (H
O; H
E) using hardy function. The expected heterozygosity (H
E) of a population refers to the probability that any individual in the population is heterozygous at any point, while the observed heterozygosity (H
O) refers to the proportion of the individuals in the population who are heterozygous at a certain locus [
18].
2.8. Genetic Distance
Genetic distance between population pairs (pairwise F
ST) and the analysis of the main components of variability PCA were performed. Based on the calculated values of genetic distances between individuals per breed, using the SplitsTree v6.4.17 program [
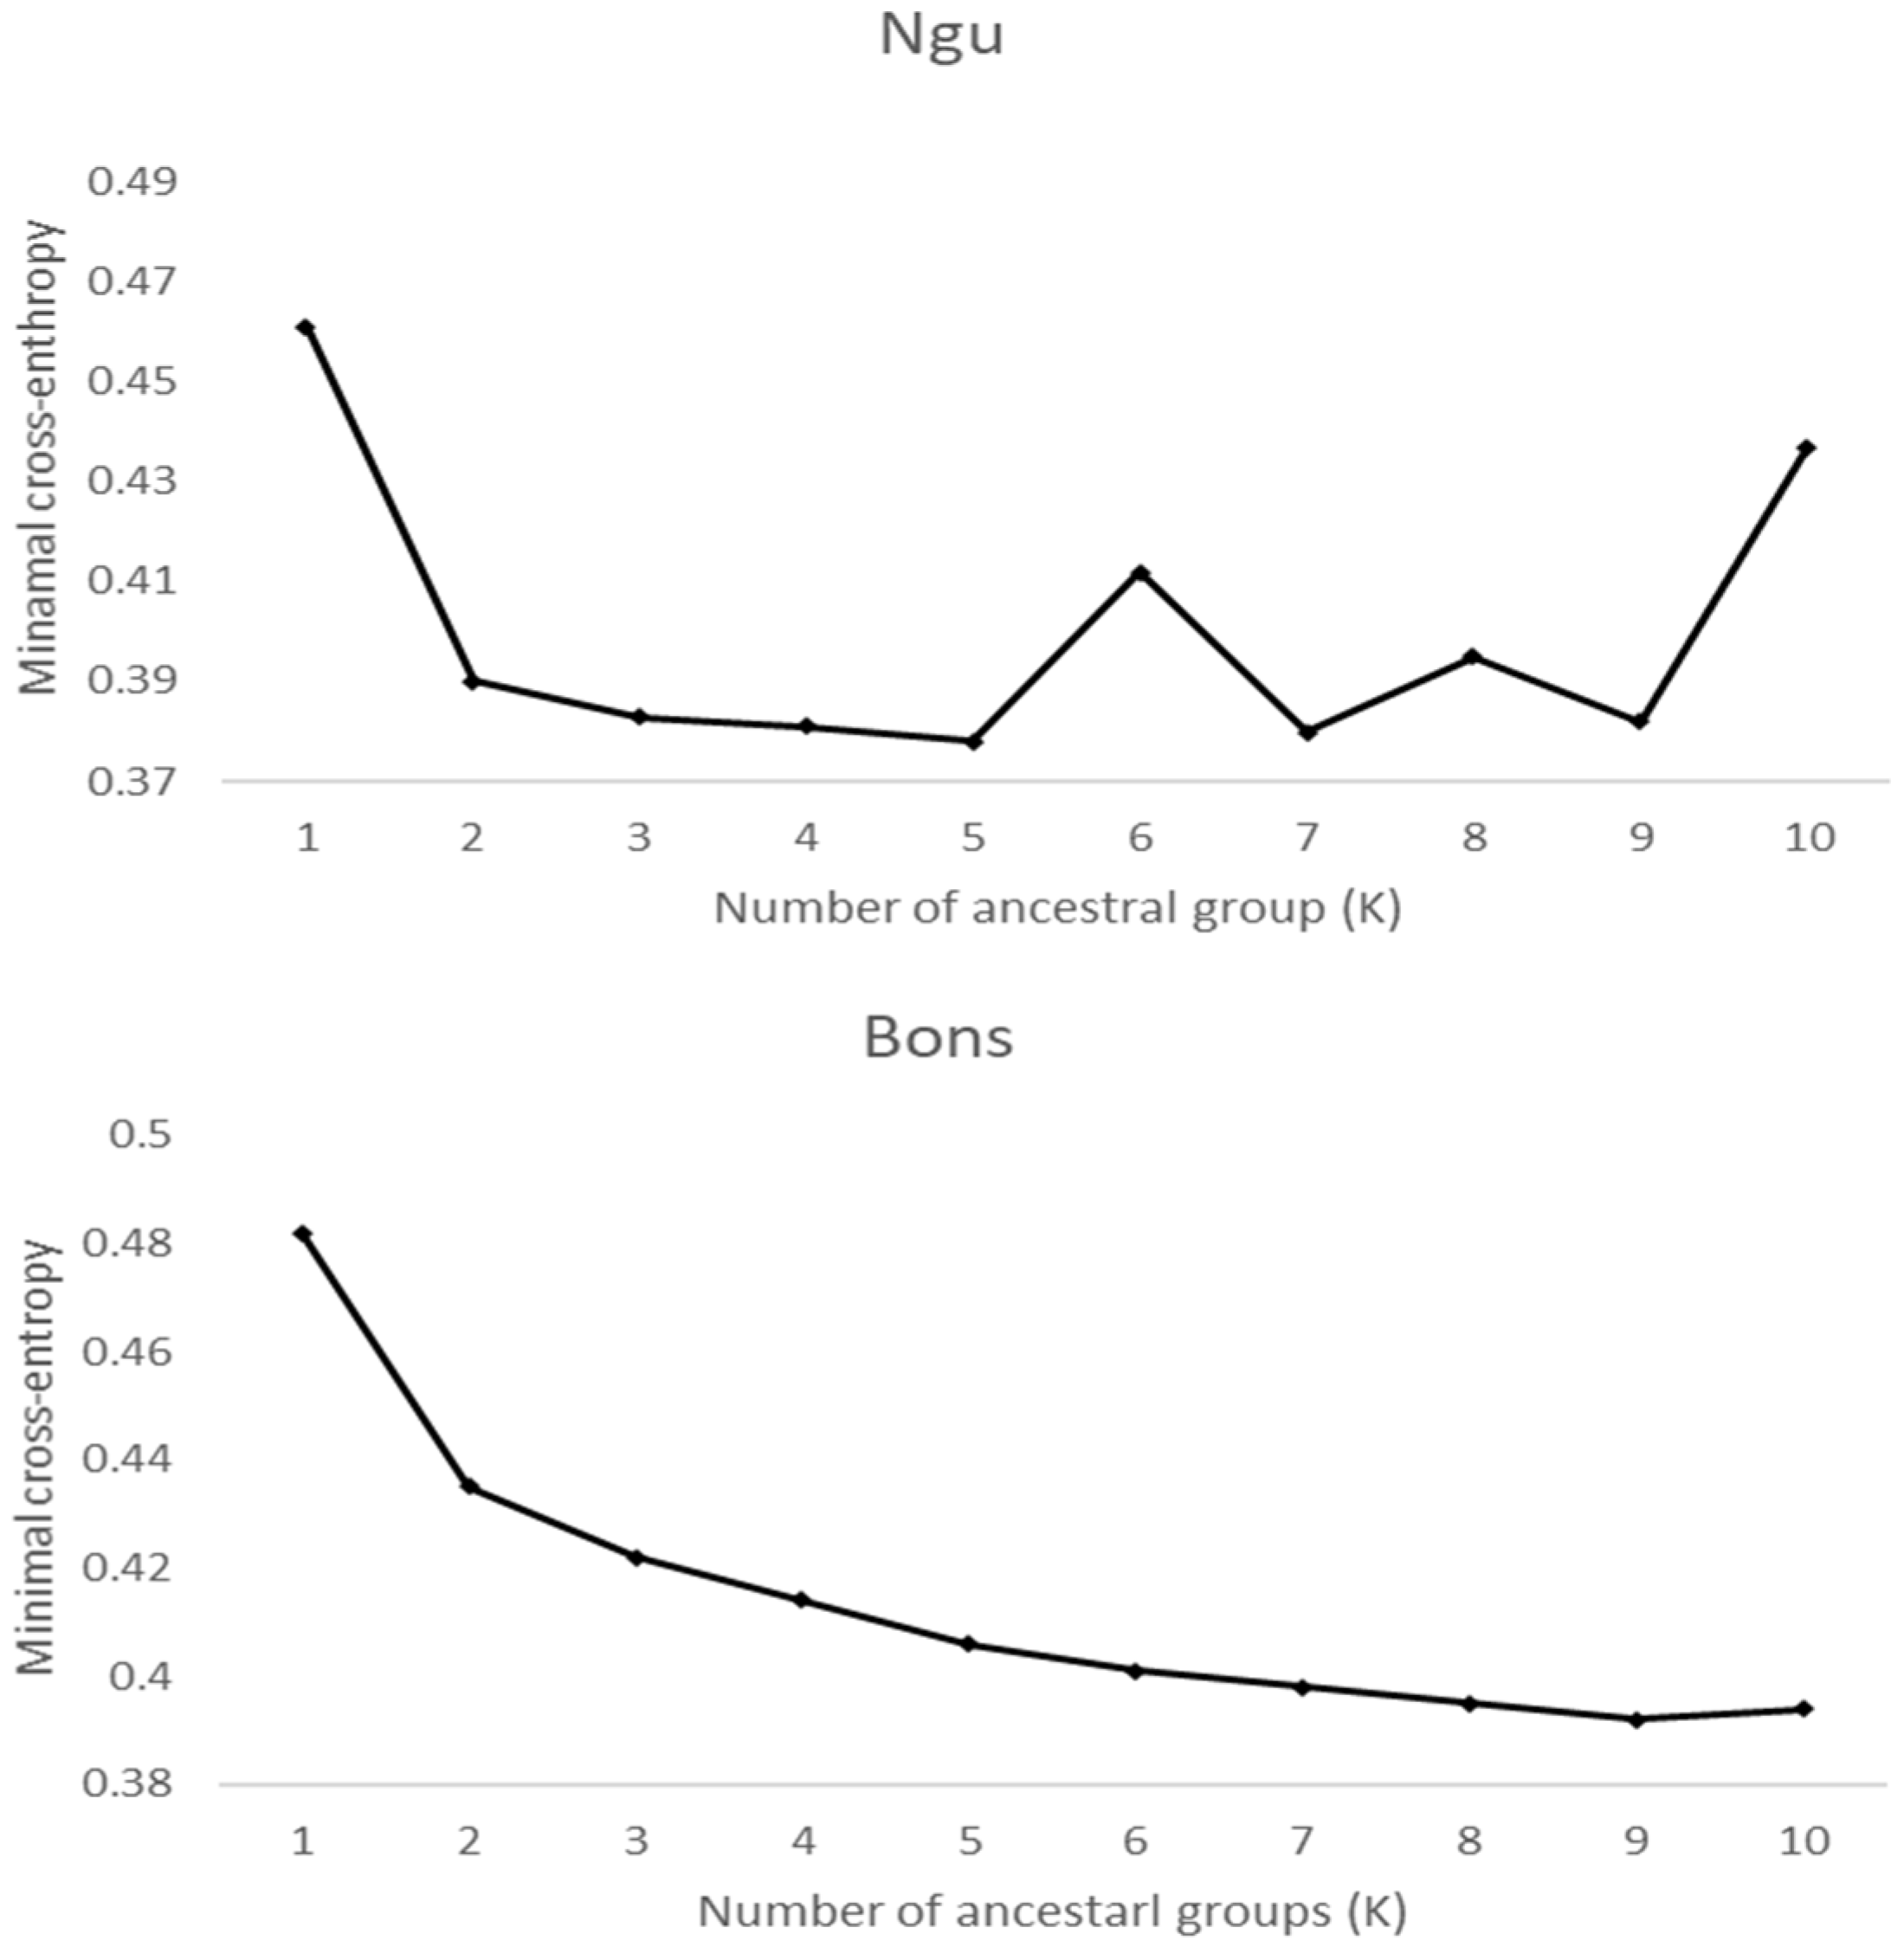
19], a phylogenetic tree was created by the neighbor-joining (NJ) method. The normality of the data distribution was tested using the Shapiro–Wilk test, and the Pearson correlation coefficient was estimated using data obtained from the full set of SNP markers between IBD and genomic distance. Genetic distance trees for the breeds were plotted using the SplitsTree program. Furthermore, the number of ancestral populations (
K) for the two cattle breeds were determined using the cross-entropy approach. The method involved applying
K values from 1 to 10 to identify the minimum cross-validation error.
4. Discussion
The present study provides new insights into the utility of SNP-based pedigree reconstruction and kinship inference in Sanga cattle breeds. By integrating genomic and pedigree information, this study demonstrated the potential of high-density SNP data to reveal hidden or misclassified relationships, validate parentage, and enhance the reliability of pedigree records. The findings highlight the importance of genomic tools in enhancing management of genetic diversity in populations where pedigree data could be prone to recording errors. The mapping of ambiguous regions and coordinate shifts from LiftOver were reduced by the use of the updated species-specific chain file, ensuring reproducibility of the imputed genotypes from SNP data. All variants that failed to map or mapped to multiple locations were removed from the analysis. The availability of SNP markers, combined with imputation methods and an updated genome assembly for accurate marker positions, enhances the accuracy and reliability of molecular markers for QTL mapping, GWAS studies and pedigree analysis [
20]. Understanding genetic structures and inter-individual relationships is critical for designing effective breeding programs and conservation of genetic diversity in livestock populations [
10].
This study utilized PCA as an exploratory tool to visualize population structure, as well as SNP-based IBD estimation, using KING and PLINK software to assess the accuracy of recorded pedigrees and infer kinship relationships in two South African cattle breeds, Bonsmara and Nguni. The findings underscore three major insights: pedigree inaccuracies, distinct patterns of population structure suggestive of varied inbreeding levels, and the potential of genomic data to approximate kinship in the absence of reliable pedigree records.
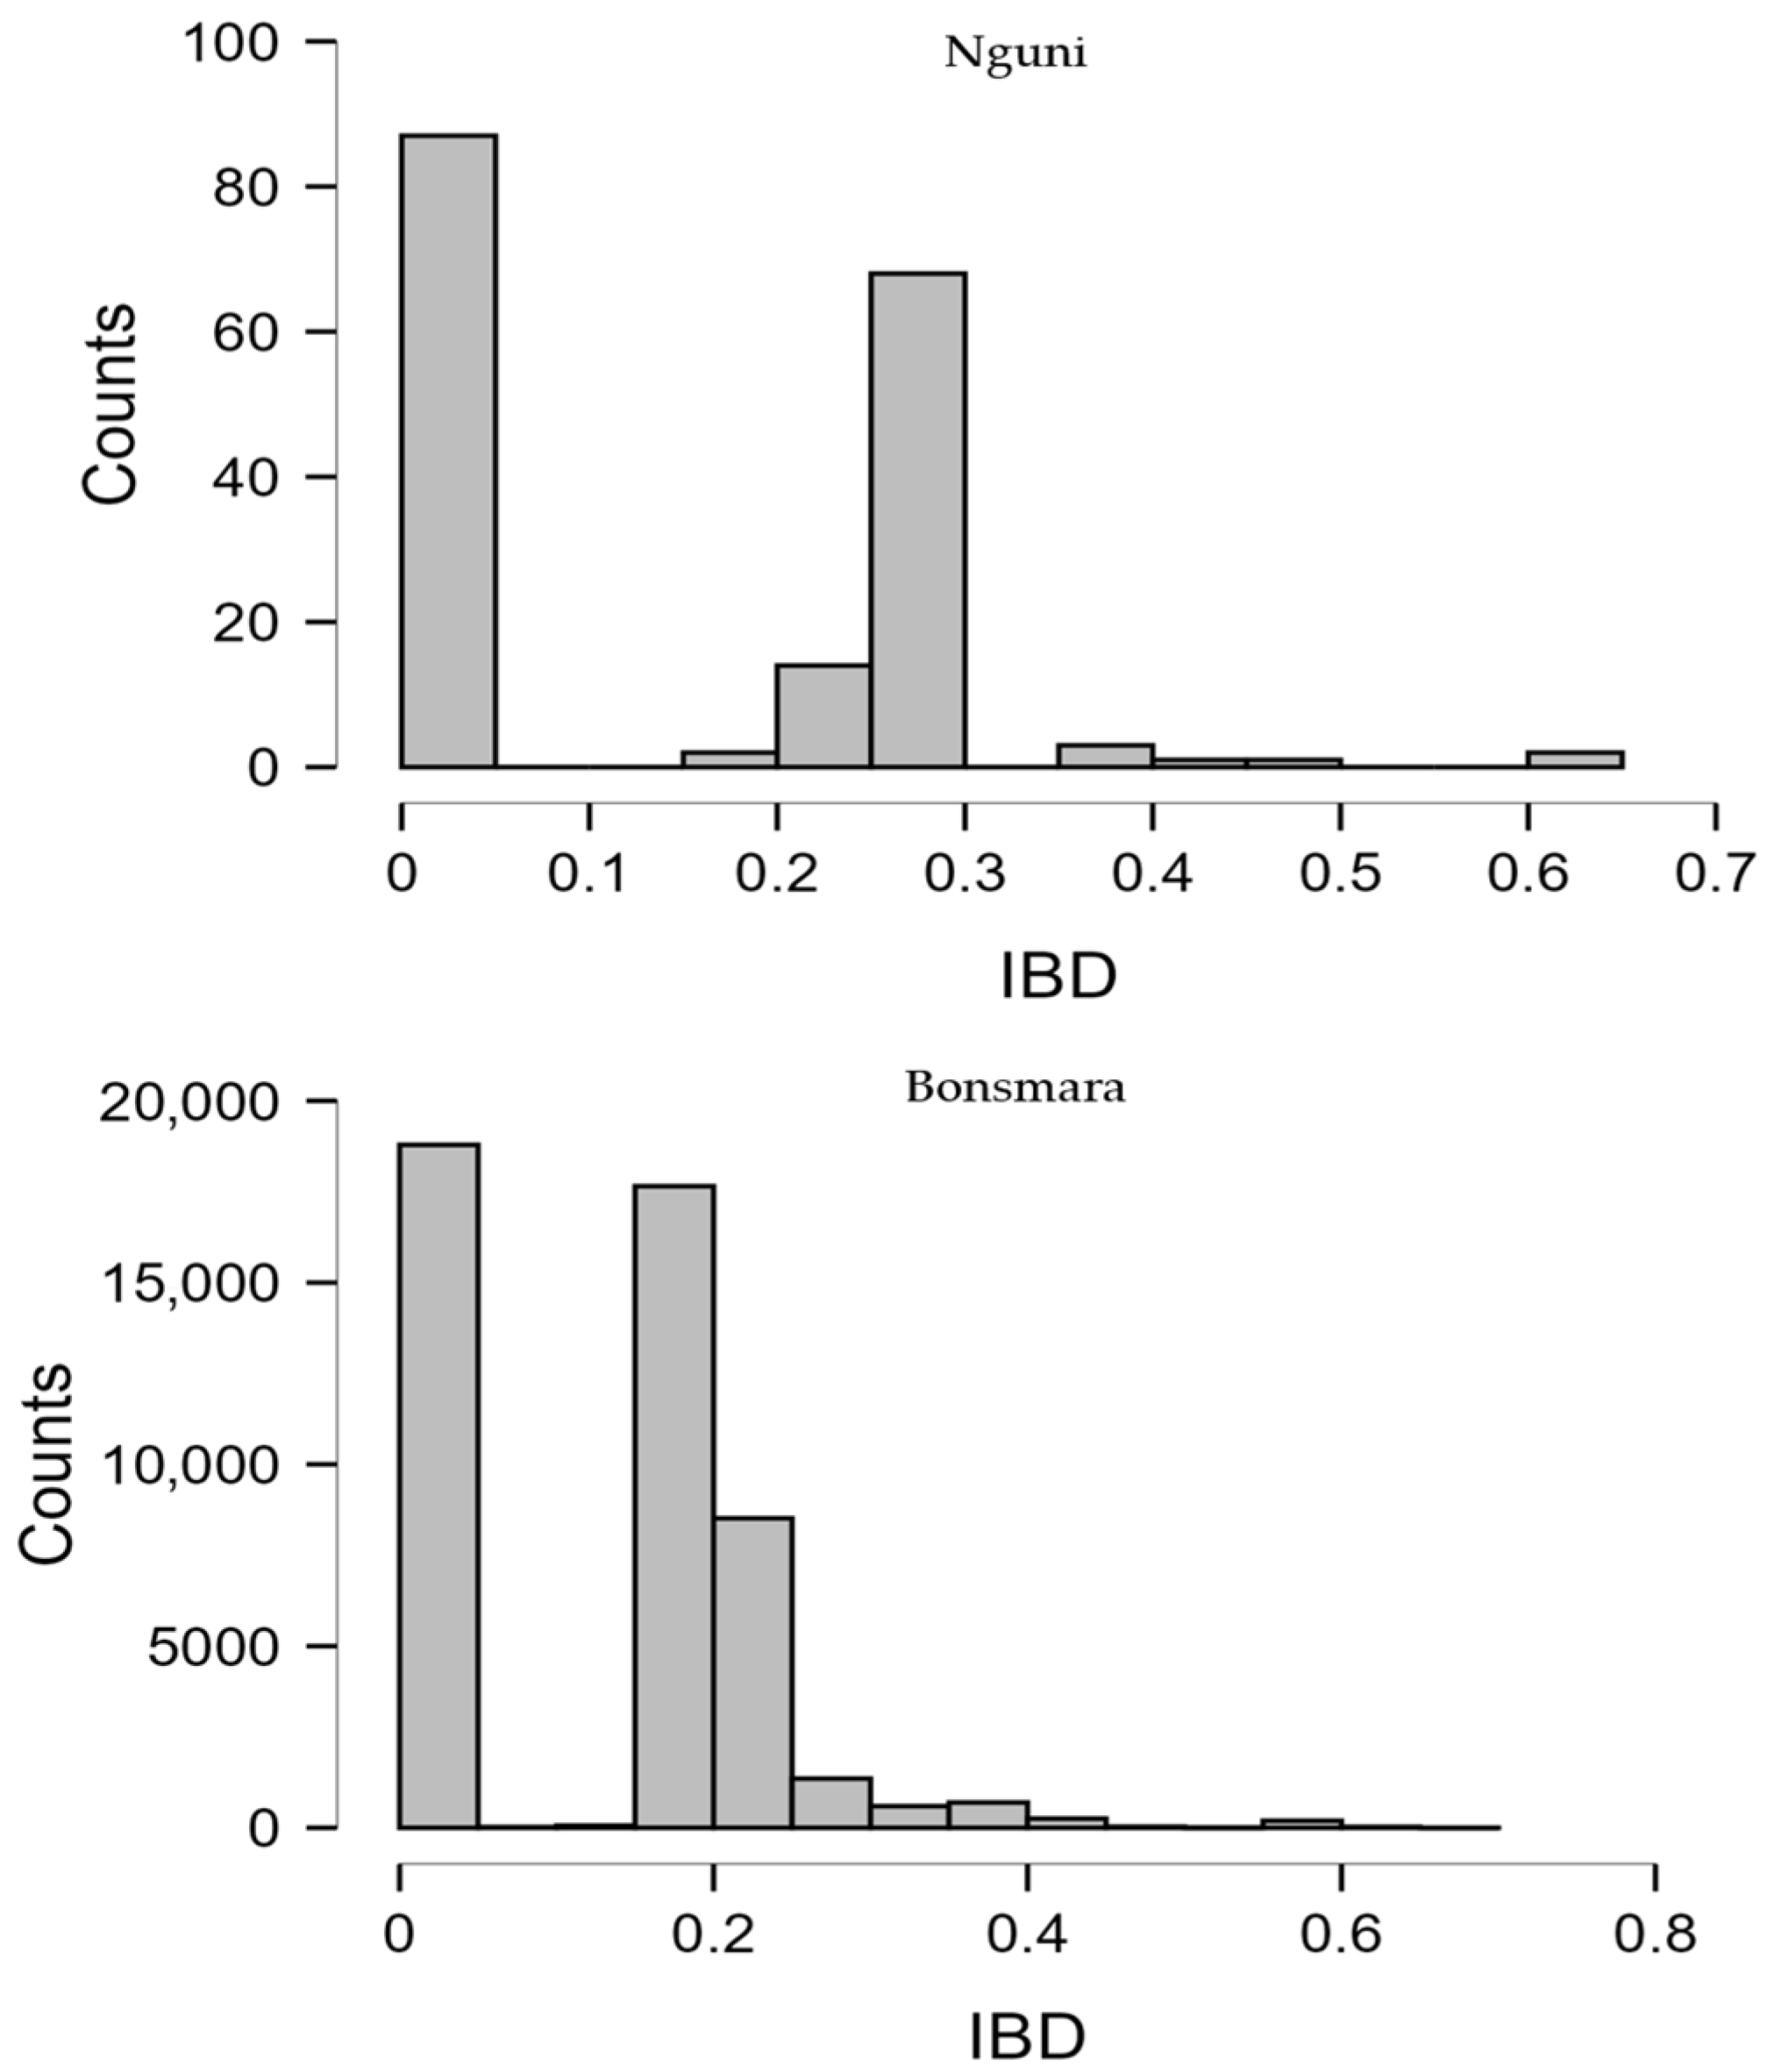
The inference of breed-specific levels of relatedness using IBD values from KING and PLINK software revealed pedigree inconsistencies in the dataset analyzed for Bonsmara. The Nguni breed lacked formal pedigree records, and the genomic data enabled the reconstruction of putative kinship structures for the animals in this study. In Nguni, genomic data revealed 49 and 40 parent–offspring pairs using KING and PLINK, respectively. In contrast, the Bonsmara breed, which had documented pedigrees, showed numerous inconsistencies when pedigree records were compared with SNP-derived kinship estimates. Notably, KING identified 62 parent–offspring pairs, while PLINK only identified 11. These discrepancies suggest possible underreporting or misclassifications in the pedigree database.
SNP-based IBD inference represents a statistical estimation rather than biological validation [
18,
21]. The kinship categories generated by KING and PLINK are sensitive to factors such as genotyping quality, marker density, allele frequency distribution, and algorithmic thresholds. Accordingly, while these results strongly suggest mis-recordings, the inferred kinship relationships should be interpreted as probabilistic estimates rather than definitive familial classifications. Our findings are consistent with prior studies, including that of Gorbach et al. [
22] and Siderits et al. [
21], which documented the consequences of inaccurate pedigree recording on estimates of genetic parameters and selection decisions in both African and European livestock populations.
The identification of two monozygotic twin pairs, which is an uncommon occurrence in cattle, demonstrates the sensitivity of high-density SNP data for detecting close genetic relationships. This could, however, also indicate some potential laboratory errors during processing or duplicated samples. Similar with Bonsmara results, these results should be treated as statistical approximations rather than biological certainties. Nevertheless, in data-sparse systems, SNP-based inference offers a practical tool for mapping genetic relationships and understanding herd demography in the absence of traditional recording materials [
18].
In addition to IBD analysis, Mendelian error was used as another robust approach to exclude inconsistent relationships. With the threshold of 600 ME, a total of 41 and 21 parent–offspring pairs were identified for Nguni and Bonsmara, respectively. This ME threshold was similar to Muranty et al. [
14] in investigating complex pedigree with generational gaps in grapes. Using Mendelian errors as an exclusion approach to assess relatedness provides a simpler and more efficient method to build pedigrees using SNP markers [
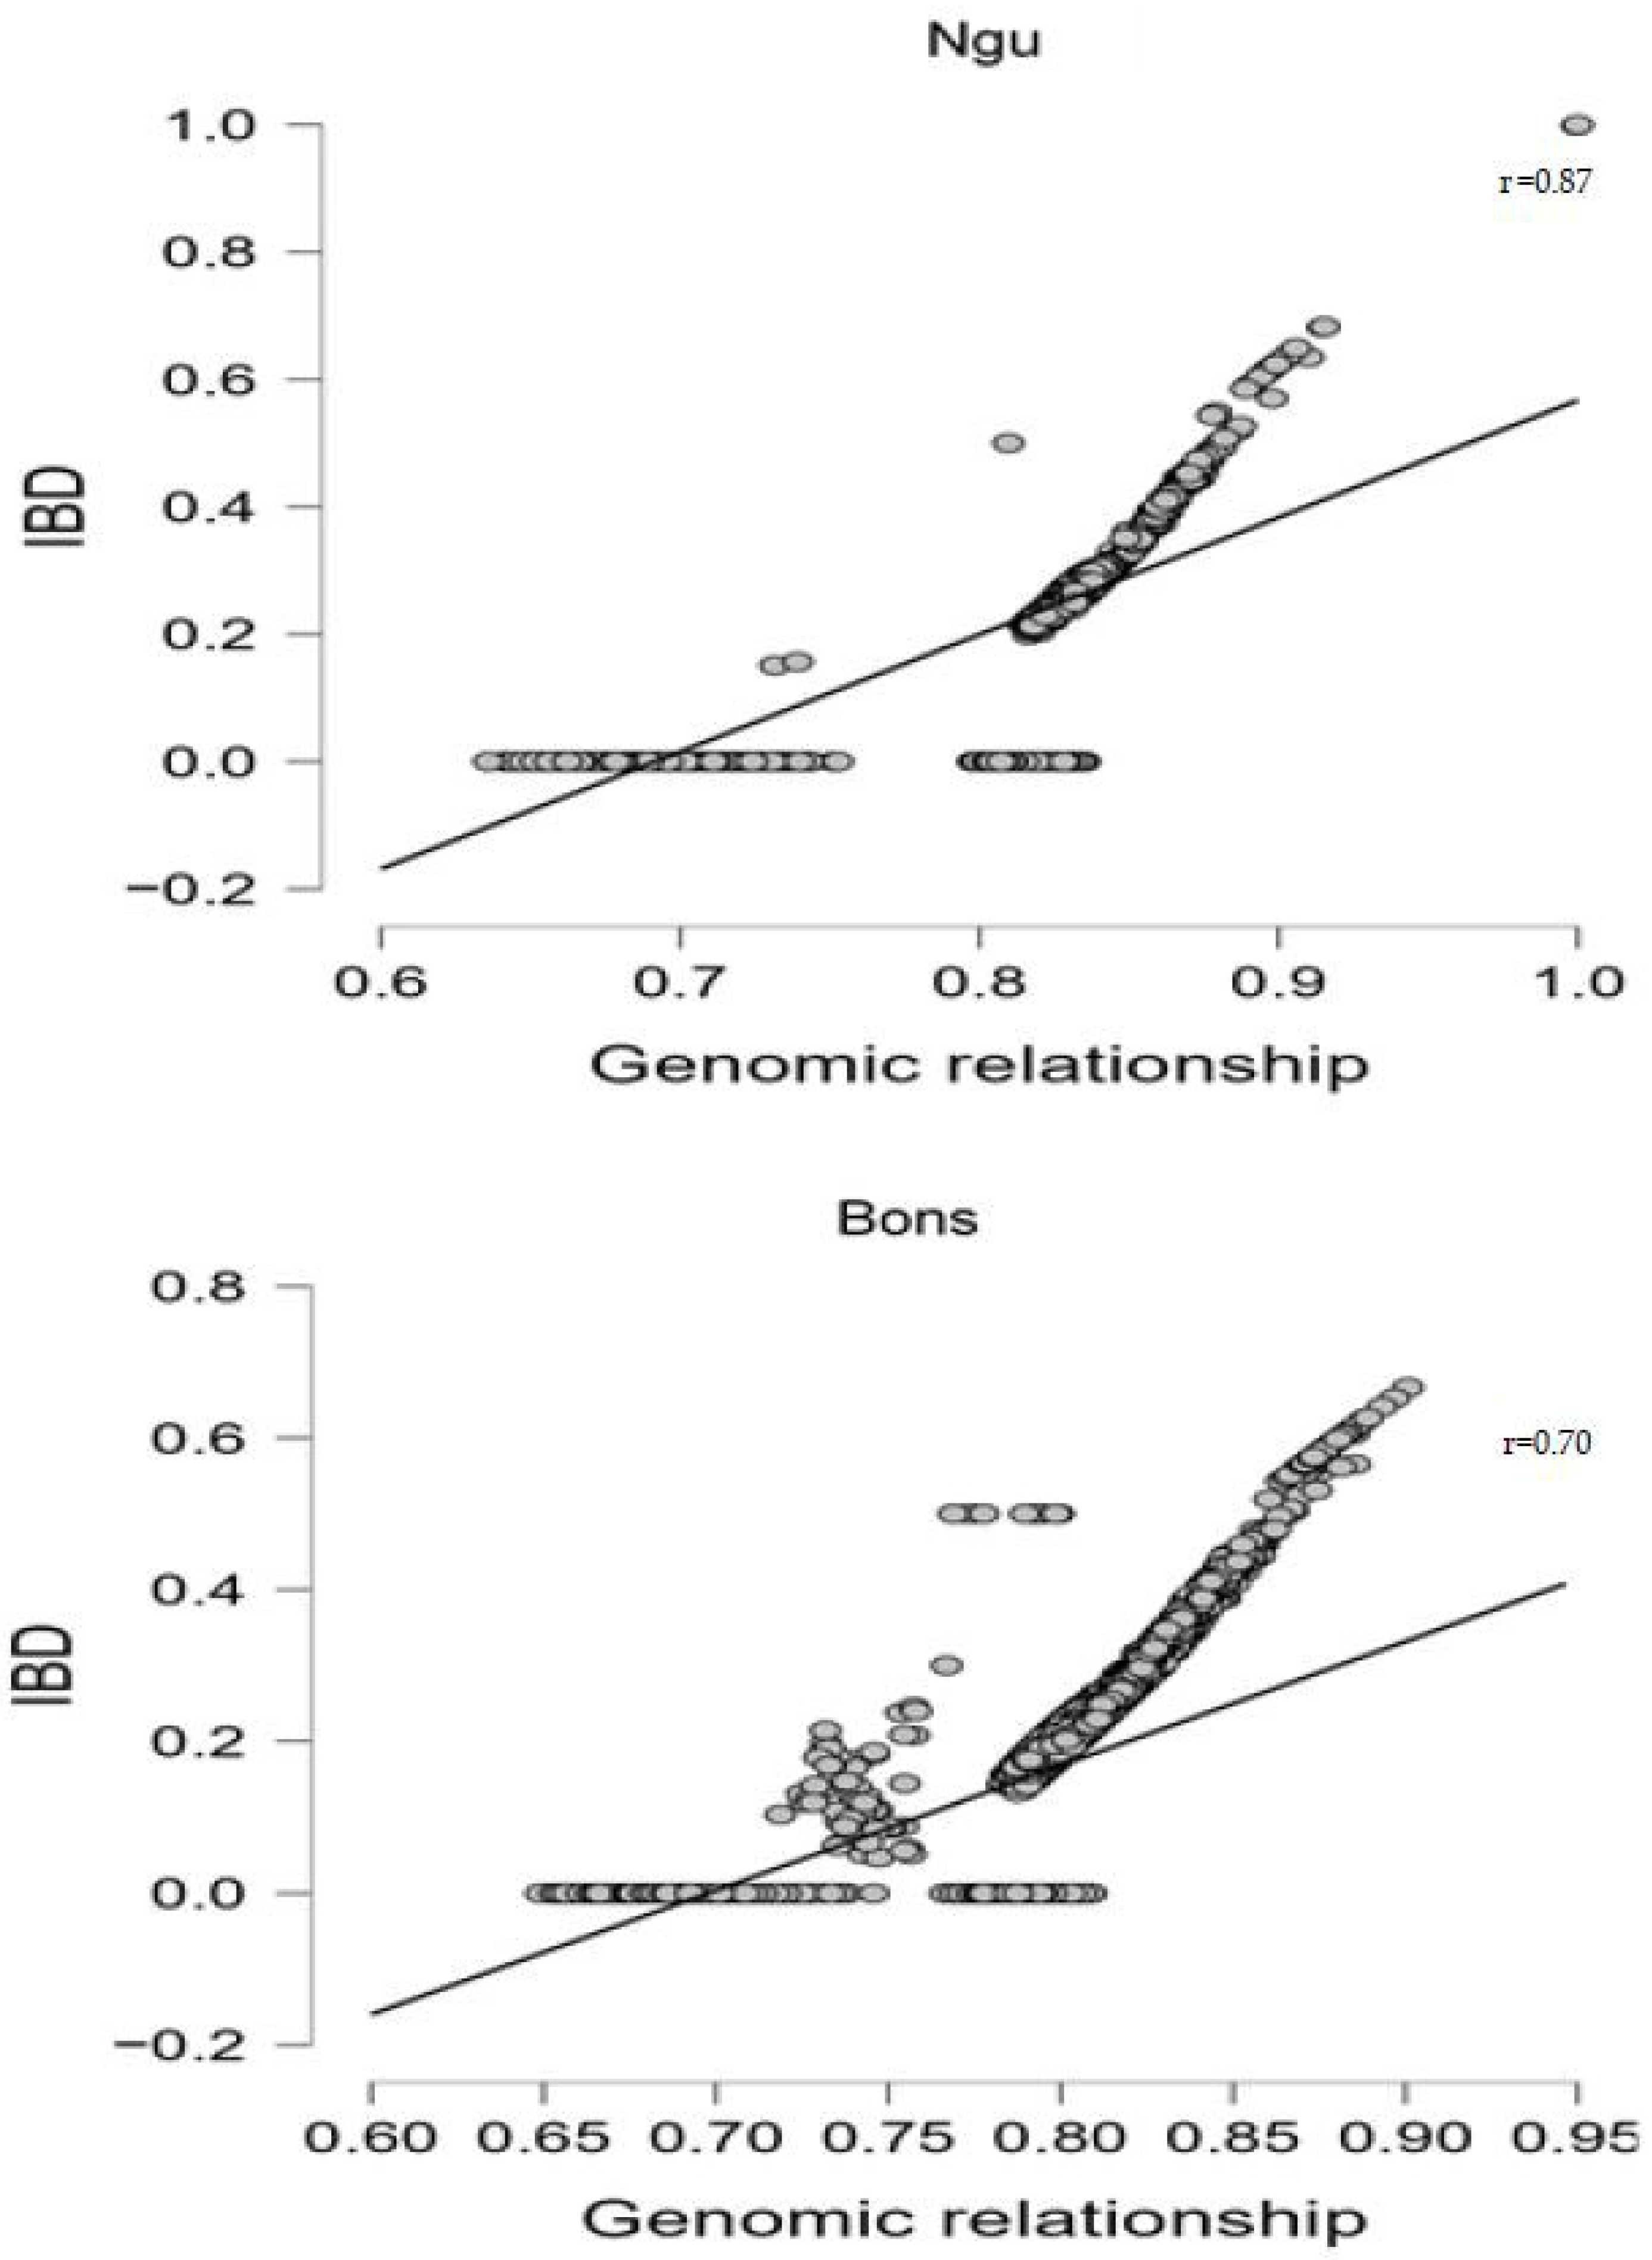
23]. This provides a more robust tool that can be considered in breeding strategies that require accurate pedigree information. Moreover, the observed genomic relatedness coefficients exhibited a strong positive correlation with expected IBD values, particularly supporting the identification of parent–offspring pairs. Non-parent–offspring pairs were characterized by genomic relatedness values consistent with an absence of recent IBD, allowing for accurate differentiation within the breed.
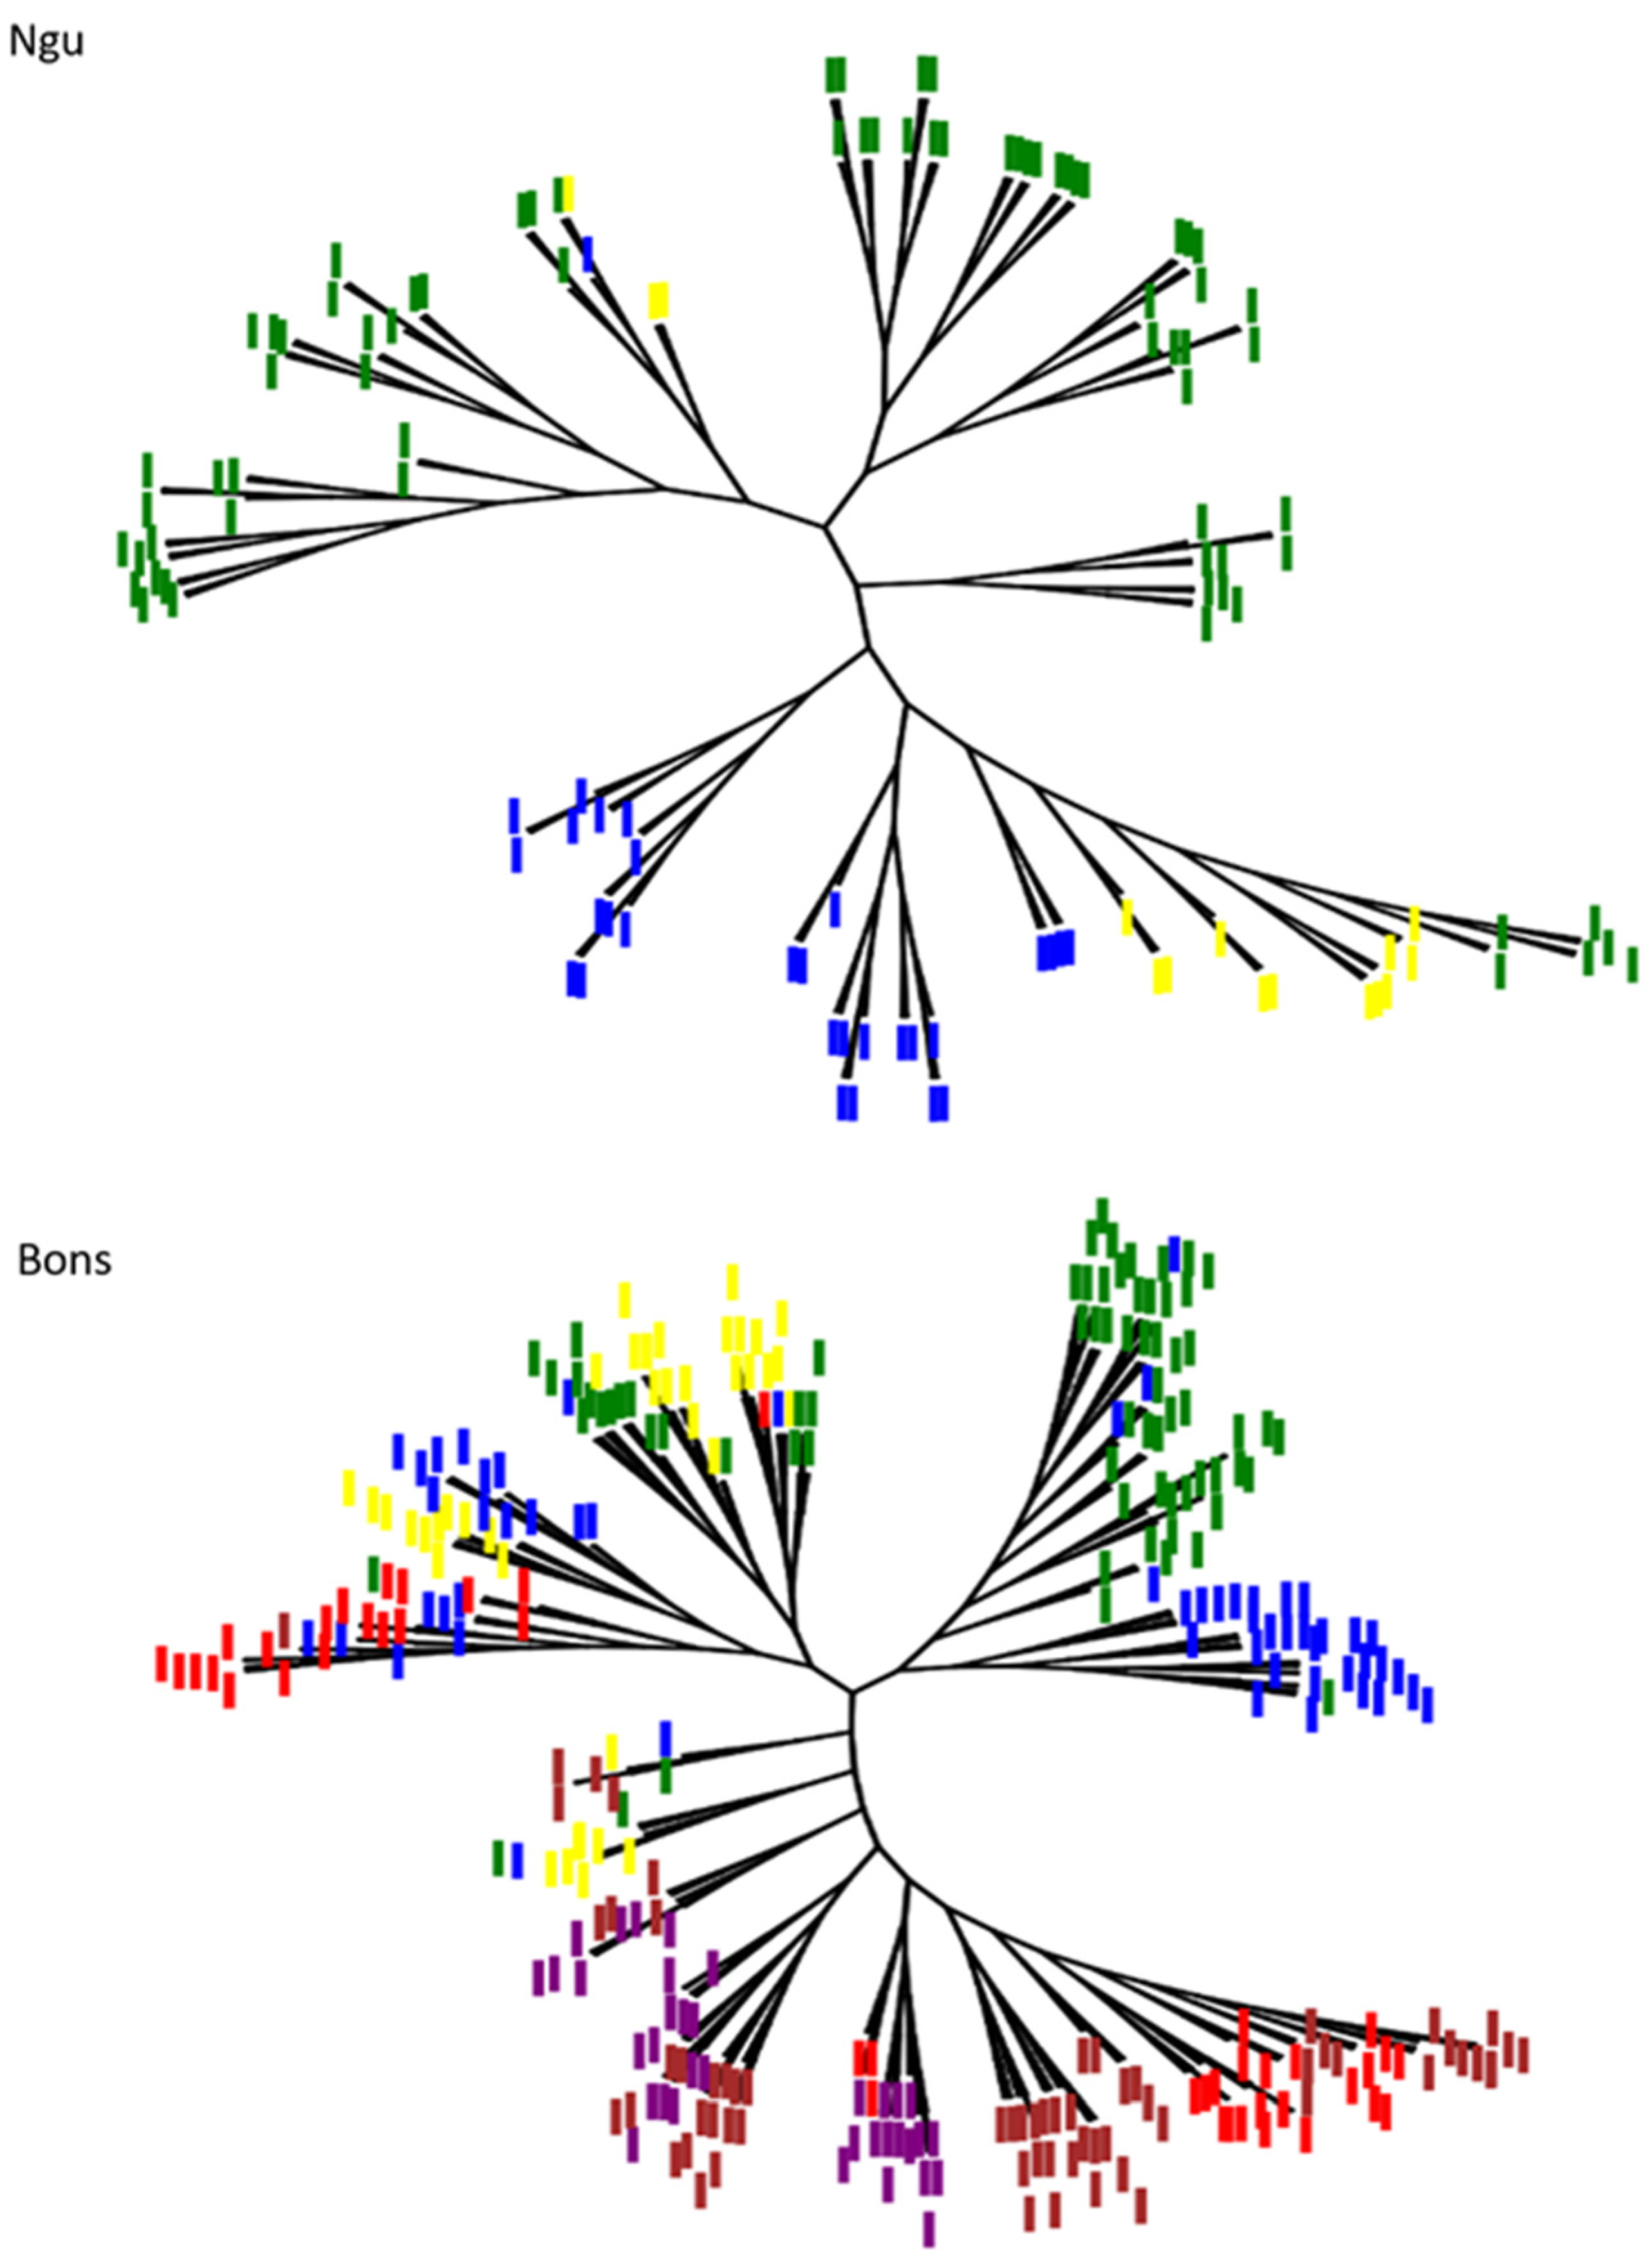
The genomic network analysis showed all inferred level of relatedness, where half-sibs was dominant in both breeds. The networks demonstrated the potential to trace interconnectedness of an individual within a population, which could be informative for forensic applications and breeding strategies aimed at reducing inbreeding [
19]. However, the network analysis based on neighbor-joining method using genomic relationships confirmed the existence of parent–offspring pairs with a few individuals showing multiple contributions across the two family groups. This could be due to sale or exchange of animals that were subsequently recorded in new family lines, while genetically it originated from different families. Such occurrences are common in the farming industry as they facilitate flow of genetic materials between farms.
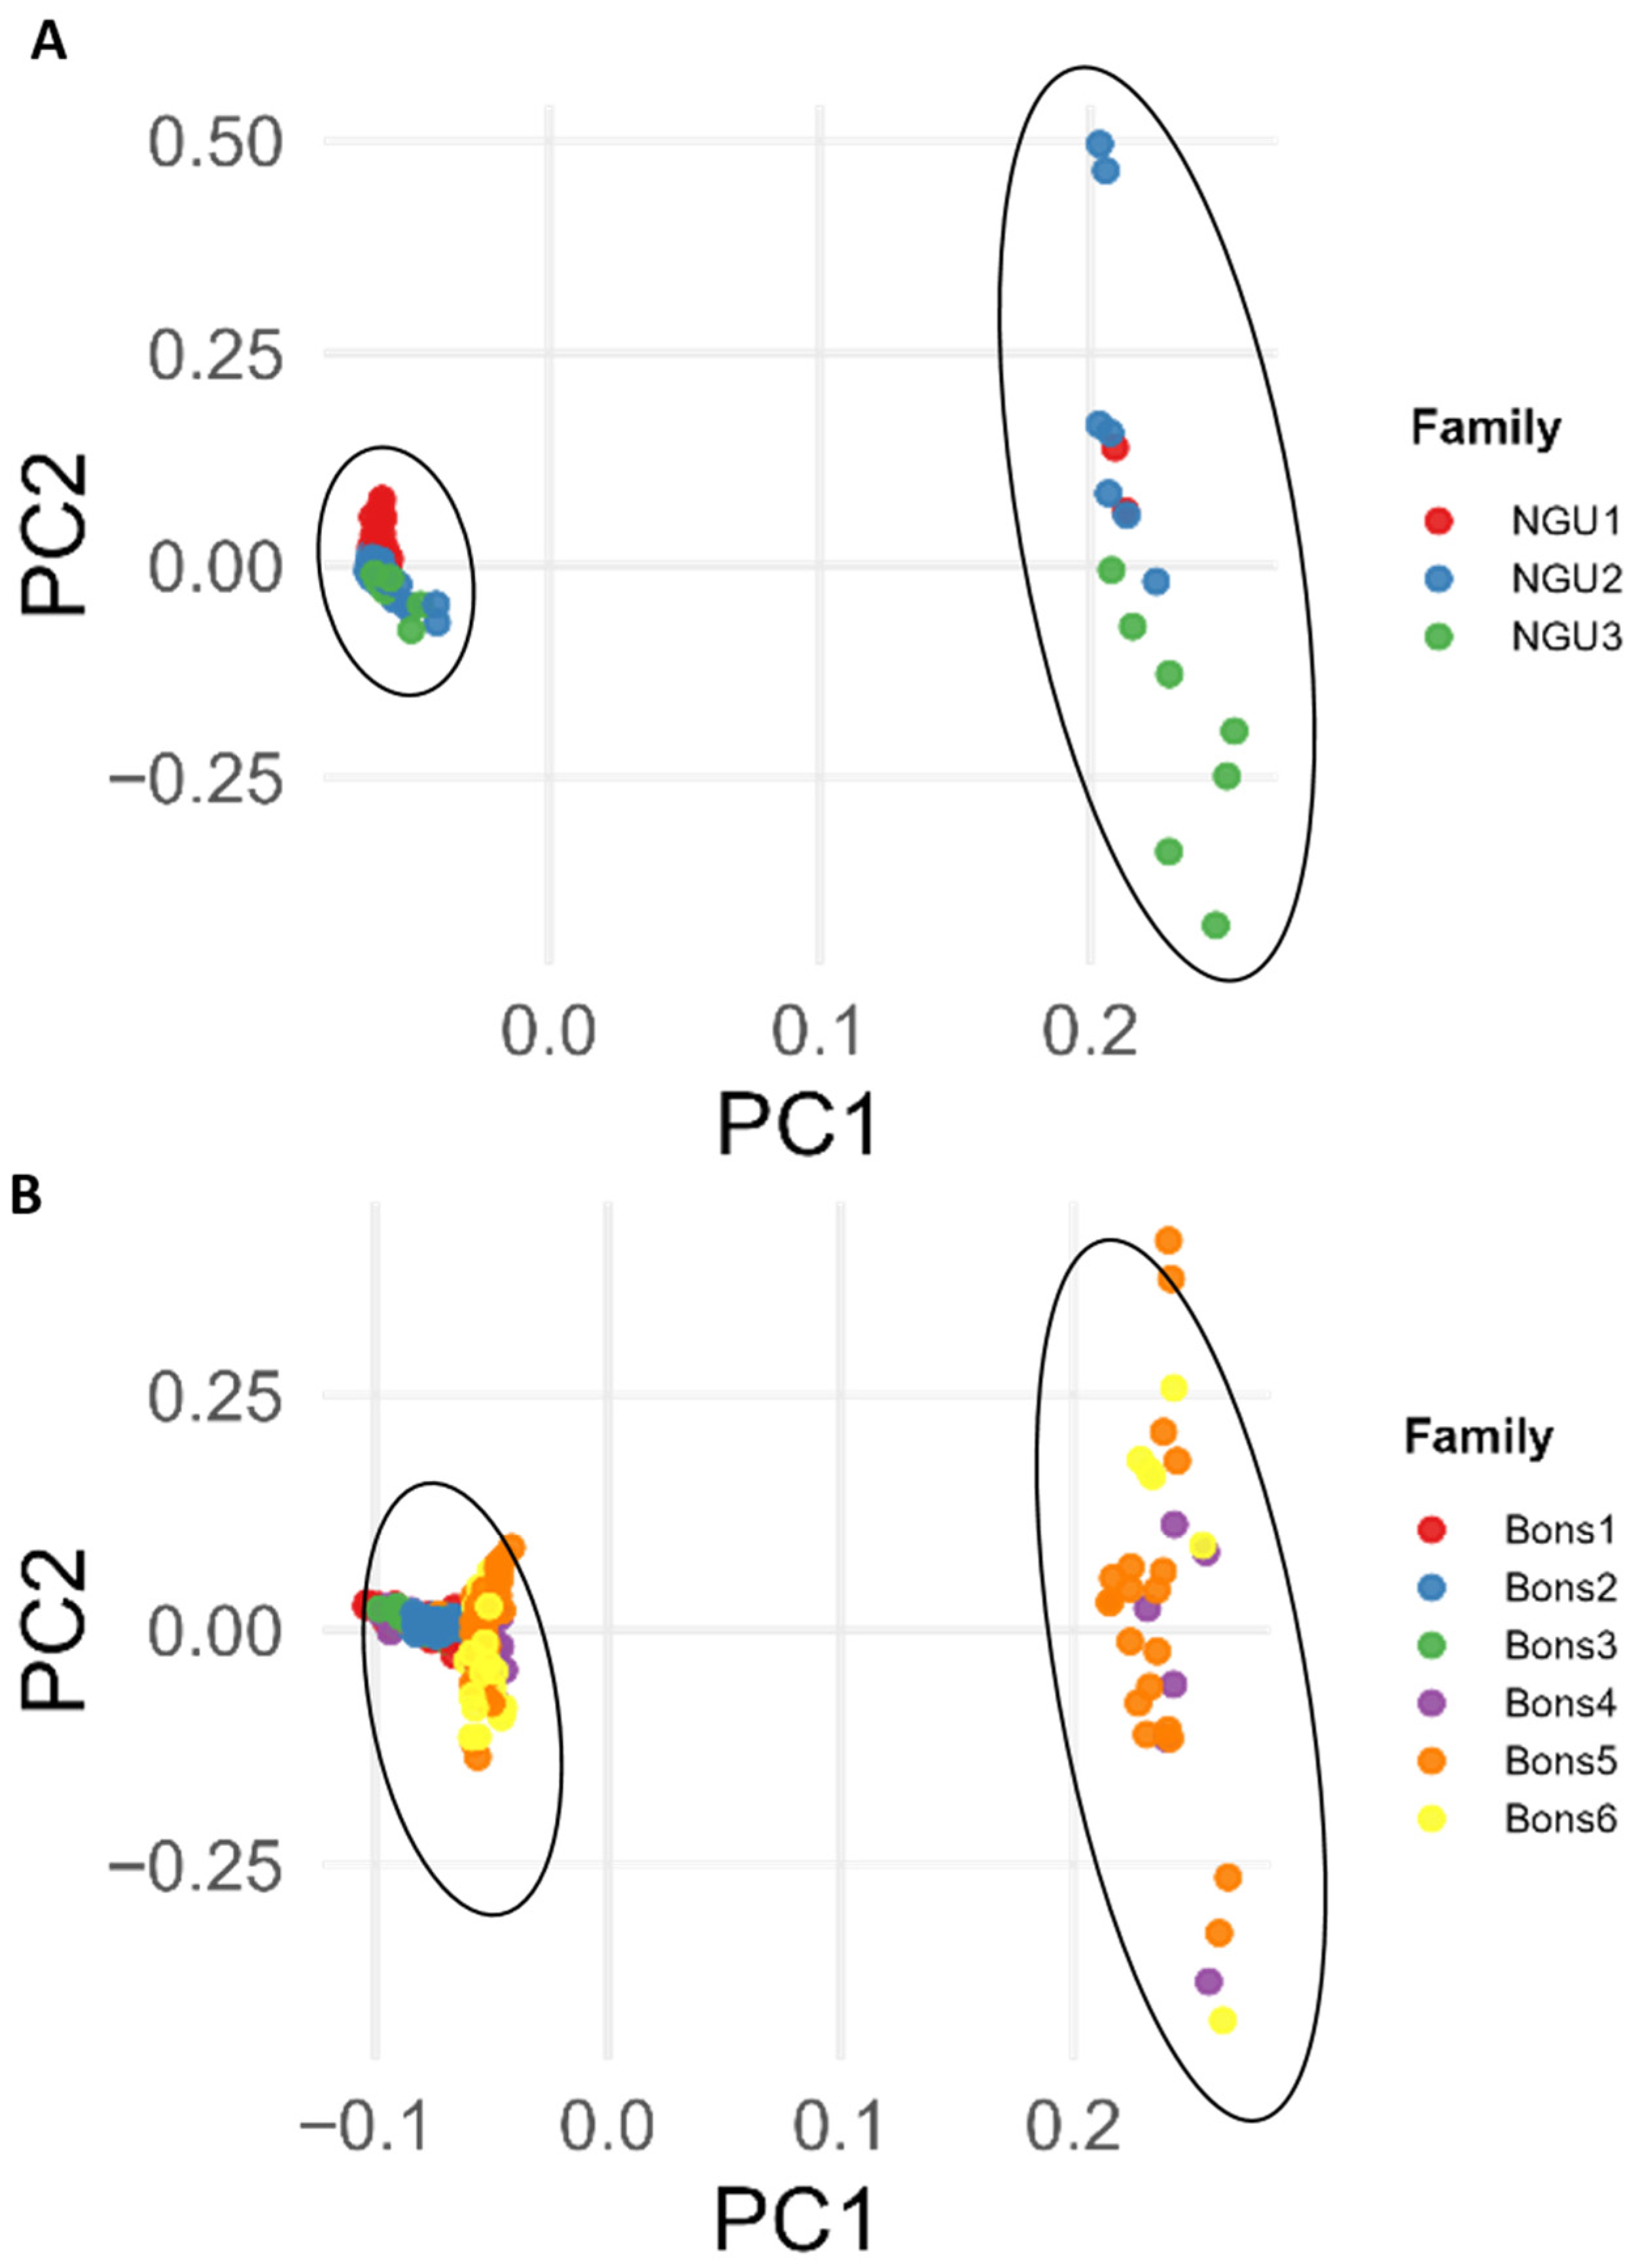
Population structure using PCA revealed marked differences between the two breeds. In Bonsmara, individual clustering was tighter, which is consistent with elevated within-population relatedness. For this study, Bonsmara animals were selected from the two regions and from a relatively small dataset. This pattern is likely due to the repeated use of selected elite sires in commercial breeding programs, which can reduce genetic variation. In contrast, the Nguni population showed more dispersed clustering patterns, indicating greater heterogeneity and lower relatedness. These patterns likely reflect the communal breeding practices that dominate indigenous cattle systems, where mating is more random and gene flow occurs across herds through shared grazing and multi-sire exposure. However, it is essential to note that PCA is fundamentally a dimensionality reduction technique that is designed to summarize genetic variation, but it cannot infer specific pairwise relationships. Clustering patterns observed in PCA may reflect subpopulation structure, historical admixture, or batch effects, but they do not confirm familial relationships. Thus, in this study, PCA was used solely for visualizing population-level genetic structure and not as evidence of individual-level kinship.
The practical value of SNP-based kinship estimation is evident in both breeding contexts. In structured commercial herds like Bonsmara, correcting pedigree errors with genomic data can enhance selection accuracy and reduce inbreeding depression. Incorporating validated relationship matrices into genomic evaluations facilitates the accurate estimation of genetic parameters such as heritability and supports the implementation of genomic estimated breeding values (GEBVs). Strategies like optimum contribution selection (OCS), which balances genetic gain with inbreeding control, depend on reliable kinship matrices which high-density SNP data can provide [
24].
In communal systems, where recording of pedigree is not done routinely, genomic tools offer an opportunity for designing structured community-based breeding programs. Reconstructed pedigrees enable the identification of distinct maternal and paternal lines, which can be used to implement rotational mating schemes that preserve genetic diversity. This approach is particularly valuable in the face of environmental stressors, including climate change and emerging diseases, where genetic variability buffers against population collapse [
25,
26].
Moreover, the real-time integration of genomic data into mobile-based herd management systems, as explored in recent digital agriculture initiatives in sub-Saharan Africa [
26,
27], could democratize access to breeding insights. By enabling communal farmers to make data-driven mating decisions, these technologies offer scalable pathways to improving livestock productivity while safeguarding genetic diversity.
Overall, this study demonstrates that high-density SNP genotyping can serve as a robust, scalable approach to verifying pedigree accuracy and estimating kinship in South African cattle populations. Whether in formal commercial systems or data-deficient communal herds, genomic tools offer a scientifically grounded framework for enhancing genetic management, supporting sustainable breeding strategies, and securing long-term livestock productivity.





 ,
,