Article

The Water Lifting Performance of a Photovoltaic Sprinkler Irrigation System Regulated by Solar-Coupled Compressed-Air Energy Storage


1
College of Water Resources and Architectural Engineering, Northwest A&F University, Xianyang 712100, China
2
Xinjiang Research Institute of Agriculture in Arid Areas, Urumqi 830091, China
3
Scientific Research Institute of Irrigation and Water Problems, Ministry of Water Resources of the Republic of Uzbekistan, Tashkent 100187, Uzbekistan
*
Author to whom correspondence should be addressed.
Agriculture 2026, 16(2), 154; https://doi.org/10.3390/agriculture16020154
Submission received: 10 November 2025 / Revised: 18 December 2025 / Accepted: 6 January 2026 / Published: 8 January 2026
(This article belongs to the Section Agricultural Water Management)

Abstract

Solar-driven irrigation, a promising clean technology for agricultural water conservation, is constrained by mismatched photovoltaic (PV) pump outflow and irrigation demand, alongside unstable PV output. While compressed-air energy storage (CAES) shows mitigation potential, existing studies lack systematic explorations of pump water-lifting characteristics and supply capacity under coupled meteorological and air pressure effects, limiting its practical promotion. This study focuses on a solar-coupled compressed-air energy storage regulated sprinkler irrigation system (CAES-SPSI). Integrating experimental and theoretical methods, it establishes dynamic flow models for three DC diaphragm pumps considering combined PV output and outlet back pressure, introduces pressure loss and drop coefficients to construct a nozzle pressure dynamic model via calibration and iteration, and conducts a 1-hectare corn field case study. The results indicate the following: pump flow increases with PV power and decreases with outlet pressure (model deviation < 9.24%); nozzle pressure in pulse spraying shows logarithmic decline; CAES-SPSI operates 10 h/d, with hourly water-lifting capacity of 0.317–1.01 m3/h and daily cumulation of 6.71 m3; and the low-intensity and long-duration mode extends irrigation time, maintaining total volume and optimal soil moisture. This study innovatively incorporates dynamic air pressure potential energy into meteorological-PV coupling analysis, providing a universal method for quantifying pump flow changes, clarifying CAES-SPSI’s water–energy coupling mechanism, and offering a design basis for its agricultural application feasibility.

1. Introduction

Solar irrigation represents an innovative technology that harnesses clean energy for agricultural irrigation, serving as a proactive approach to mitigate energy consumption in irrigation, decrease greenhouse gas emissions, and address power supply challenges in remote regions. This technology has seen widespread implementation globally [1,2]. For instance, Ahmed and Helgason [3] developed a solar-powered center pivot sprinkler system in Canada. Santra [4] employed small pivot sprinklers equipped with solar-powered heads in drought-prone areas of India. Additionally, Li introduced a solar-powered reel sprinkler in China and proposed an optimization method for the configuration of photovoltaic systems [5]. These initiatives aim to maximize the utilization of decentralized, small-scale solar renewable energy sources to reduce both energy consumption and operational costs associated with irrigation systems.
While solar irrigation offers significant advantages in energy conservation and emission reduction, the implementation of solar photovoltaic power generation faces challenges such as variable output, low energy density, and a mismatch between photovoltaic production and the demands of irrigation systems [6]. These issues complicate the assurance of irrigation quality and restrict the broader application of photovoltaic irrigation. One potential solution is to enhance solar power generation through storage solutions. Commonly utilized storage devices include elevated water tanks and batteries. Elevated water tanks are particularly well-suited for micro-irrigation systems with lower operational heads [7], whereas larger battery banks are typically employed in sprinkler systems due to their capacity for higher working pressures; however, this significantly escalates system investment costs and may lead to environmental pollution [8].
Deutsche Gesellschaft für International Zusammenarbeit (GIZ), or the German International Cooperation, is a major German federal enterprise founded in 2011. It is dedicated to international sustainable development cooperation and international education services across over 120 countries. GIZ provided a comprehensive overview of existing photovoltaic irrigation modes, categorizing them into six distinct applications based on the type of water source and the presence of a high-level water tank [9]. However, all six categories of photovoltaic irrigation systems are constrained by variable or low water supply pressure. In sprinkler systems, fluctuations in water supply pressure or inadequate pressure can significantly impair the quality of spraying operations, leading to issues such as insufficient atomization of water flow, uneven distribution of irrigation water, and excessive kinetic energy in droplets [10]. These factors ultimately contribute to a reduced utilization efficiency of sprinkler water [11], as well as increased soil erosion and runoff [12]. Consequently, to optimize the utilization of solar clean energy in sprinkler irrigation systems, there is an urgent necessity for a sustainable and cost-effective storage solution that can efficiently harness dispersed and small-scale solar resources. This approach aims to align the supply of solar energy with the specific energy demand characteristics of sprinkler irrigation systems, thereby ensuring high-quality spraying performance.
Compressed-air energy storage (CAES) is an advanced storage technology that utilizes the pressure potential energy of air as an energy carrier, representing a highly efficient and versatile approach to energy storage [13]. It demonstrates excellent compatibility and regulation with small-scale, decentralized solar energy resources—a critical requirement for rural and remote agricultural areas where large-scale grid infrastructure is often absent [14]. CAES enables precise pressure regulation, a key advantage for sprinkler irrigation systems that rely on stable water pressure to ensure high-quality spraying. Unlike elevated water tanks, which suffer from pressure degradation as water levels drop, or battery banks that may experience voltage fluctuations under load, the CAES system improves irrigation quality by maintaining a stable pressure output: it ensures adequate atomization of water droplets, uniform water distribution across the irrigation area, and controlled droplet kinetic energy that minimizes soil erosion [15]. Building upon this, Zhang introduced an innovative clean energy supply model for irrigation systems that employs solar-coupled compressed-air energy storage regulation. This approach was implemented in sprinkler systems to facilitate high-pressure, low-intensity, and high-quality spraying [15]. The average spraying intensity achieved was approximately 1.02 mm/h, effectively mitigating the adverse effects of irrigation on soil infiltration rates. Simultaneously, this innovative energy supply approach enables intermittent pulse spraying under dynamic water pressure, allowing for flexible optimization of hydraulic performance indicators based on this characteristic, thereby demonstrating significant potential for enhancing spray uniformity [15]. Zha [16] implemented this integrated energy supply model in drip irrigation systems, achieving a water application uniformity exceeding 90% and significantly improving the anti-clogging performance of the emitters with solar energy serving as the sole power source.
However, existing research mainly focuses on improving irrigation uniformity and optimizing soil infiltration characteristics, etc. There are still obvious deficiencies in the research on the water-lifting characteristics of system pumps and water supply guarantee capacity under photovoltaic energy supply conditions. In irrigation systems based on renewable energy, the matching degree between the seasonal water demand pattern of crops and the production rhythm of renewable energy is one of the core issues that must be faced [17]. To further enhance the effective promotion and application of solar-coupled compressed-air irrigation systems in agricultural production, it is essential to delineate the water pump lifting characteristics under this energy supply mode and ascertain the system’s water supply capacity. This will facilitate alignment with both the irrigation control area and the water demand profiles of irrigated crops, thereby ensuring a reliable and economically viable water supply. The distinction between a solar-coupled compressed-air irrigation system and a conventional solar irrigation system lies in the direct connection of the water pump outlet to a closed pressure tank. Throughout the operation of the system, variations in the outlet pressure of the water pump, daily temperature and irradiance levels, as well as the output power of the photovoltaic panel will lead to alterations in the outflow characteristics of the water pump [18]. Furthermore, the jet discharge and energy release process of the tank is intricately linked to the outflow characteristics of the sprinkler nozzle [19]. The coupled dynamics of water and energy imply that the energy release through jet formation will subsequently influence both the cycles of energy storage (water pumping) and release (spraying), as well as the volume of water pumped [20]. Consequently, it is imperative to elucidate the interdependent influence mechanism between the energy discharge and energy storage process. This relationship is directly linked to irrigation reliability, specifically its ability to fulfill the configuration and design requirements of crop water requirement across varying growth stages and weather conditions, ultimately impacting the overall economic viability of the system.
In light of the aforementioned context, this study primarily investigates the following dimensions: (1) analyzing the characteristics of flow rate variations in pumps influenced by meteorological factors and outlet pressure; (2) examining energy release and pulse spray dynamics under conditions of compressed-air energy storage regulation; (3) elucidating the cyclic pulse period and daily water lifting capacity resulting from the interplay between water and energy; and (4) assessing the operational performance of photovoltaic water lifting systems for crops at various growth stages, while evaluating their implications on irrigation requirements, thereby offering insights for optimizing device design and operation.

2. Materials and Methods

2.1. Characteristics of Photovoltaic Water Lifting and Energy Storage

2.1.1. Experimental Design

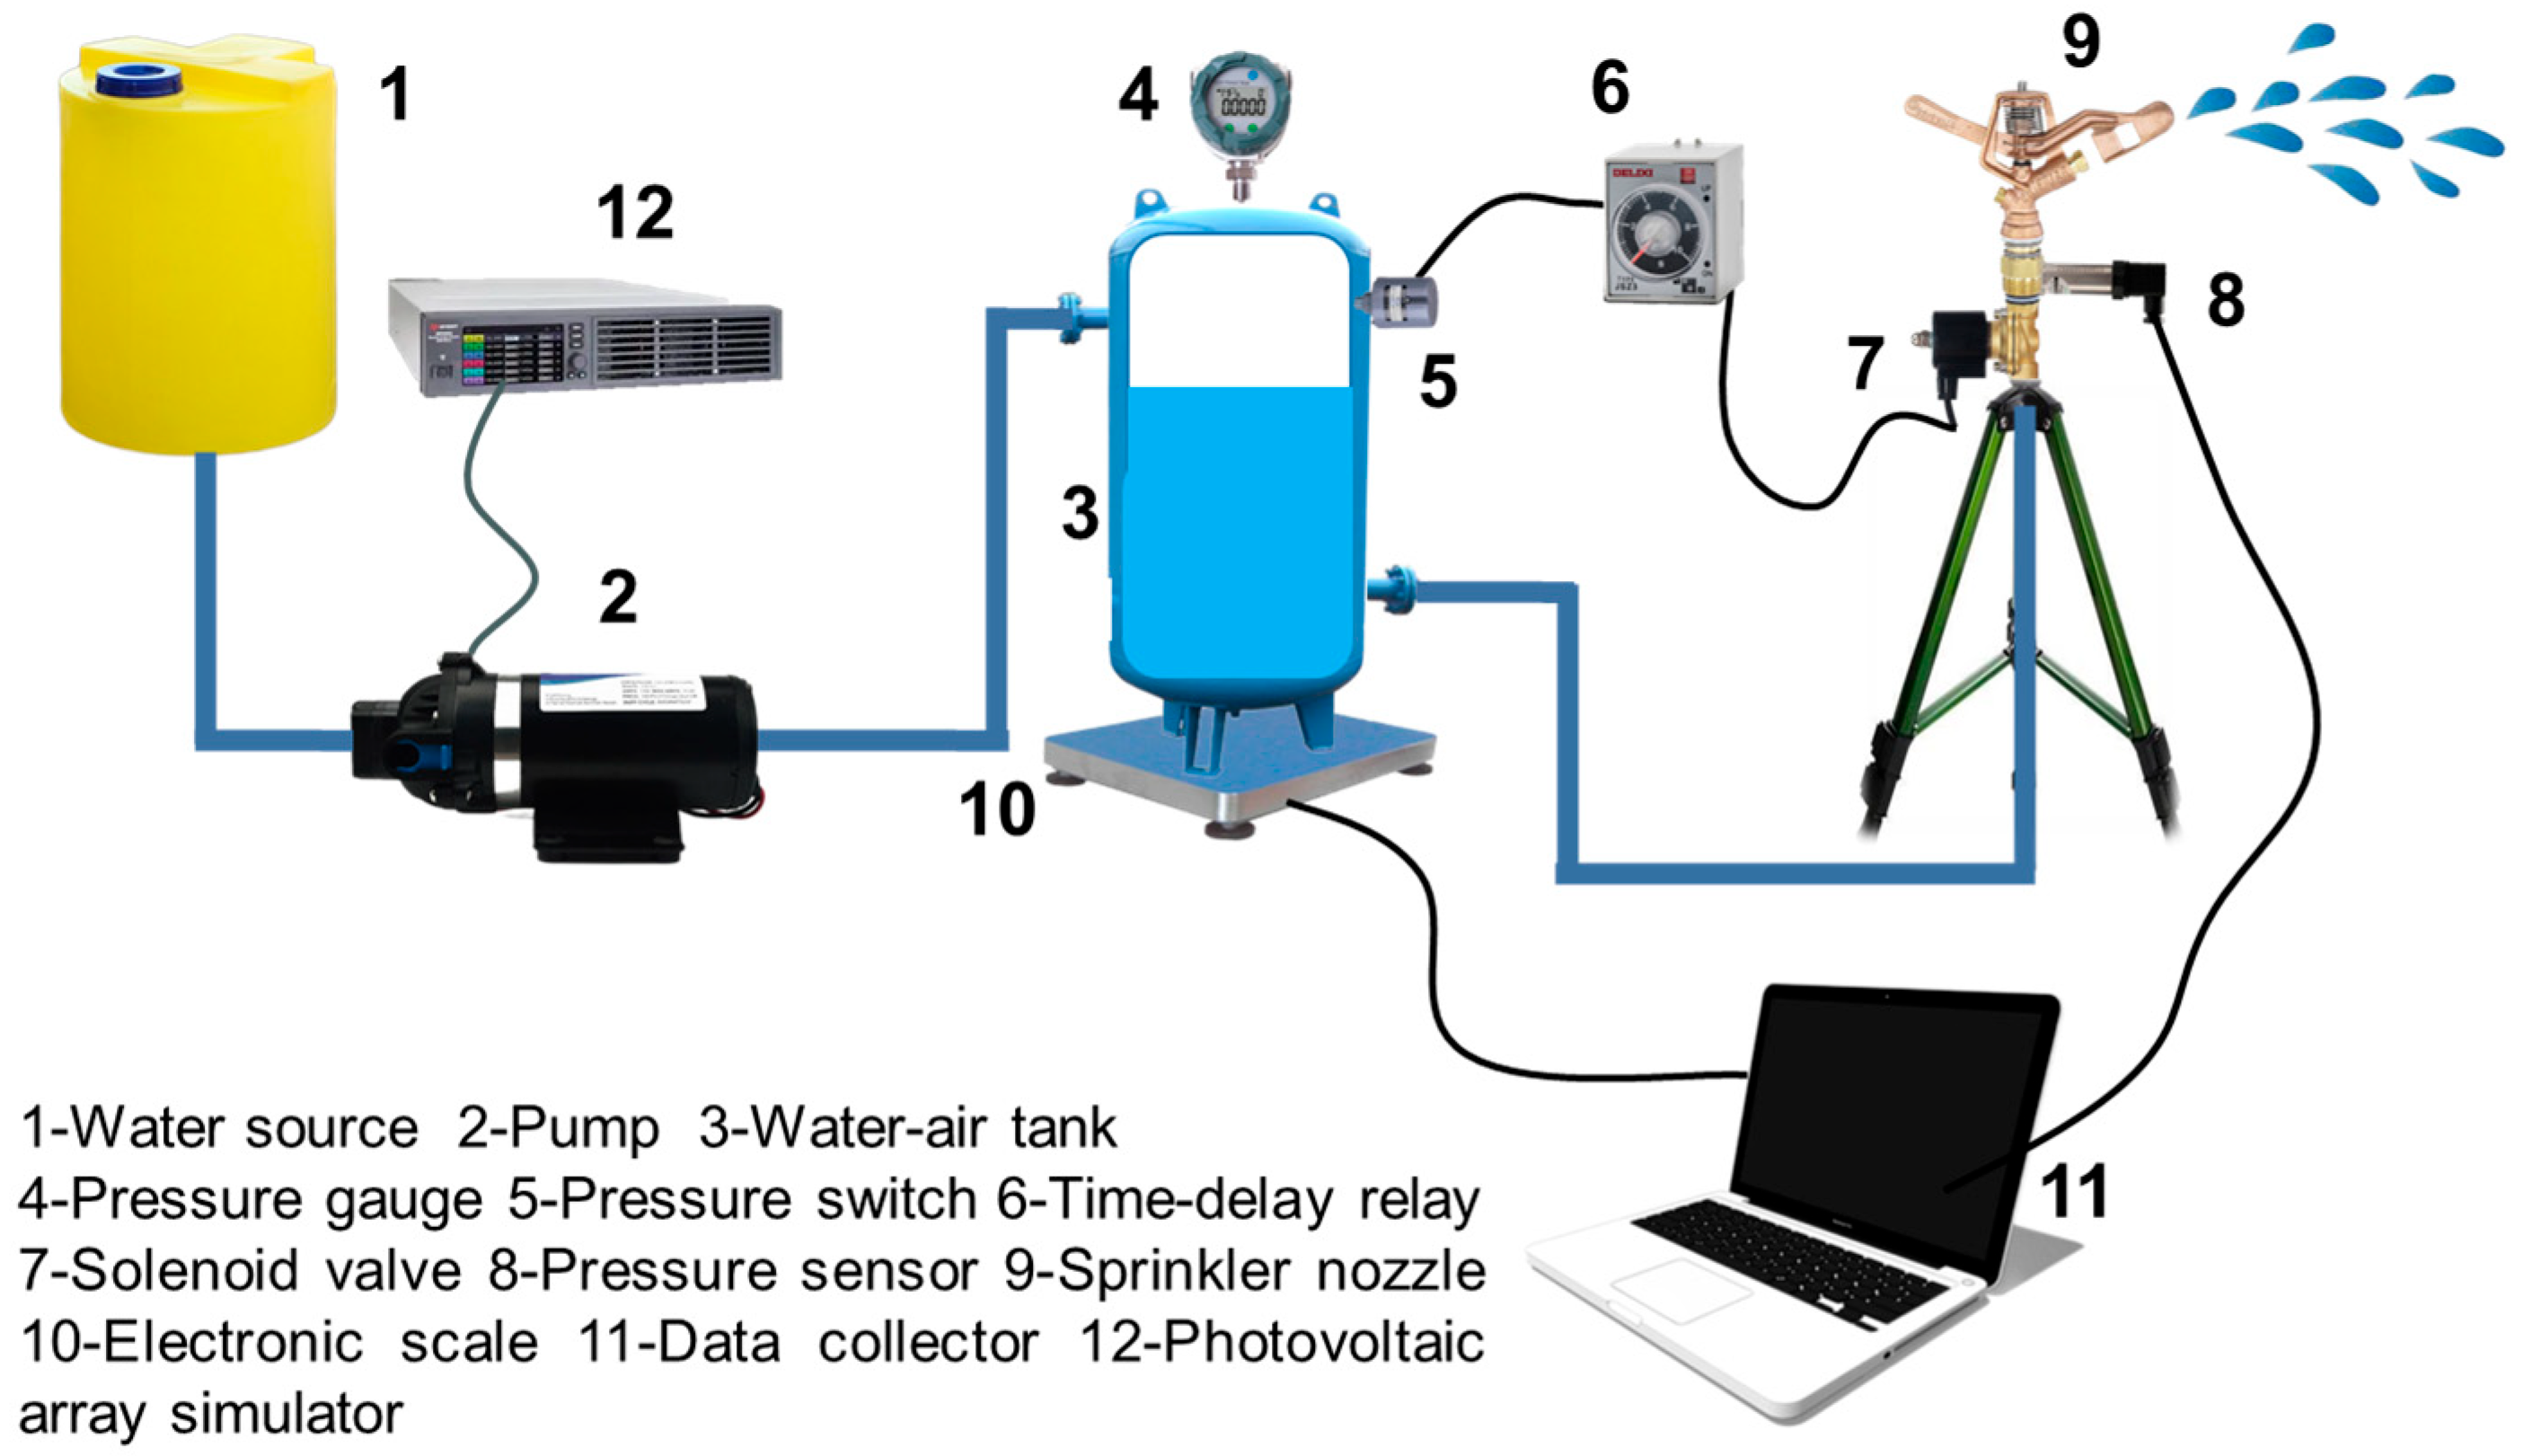
In the process of photovoltaic water pumping and energy storage, the flow rate of the water pump is influenced by both the output power of the photovoltaic system and the pressure at the pump’s outlet. To elucidate the relationship governing variations in water pump flow rates during this process, we conducted a series of relevant experiments for measurement. The experiments were carried out at the National Engineering Laboratory for Efficient Water Use in Arid and Semi-Arid Regions at Northwest A&F University (Yangling, Shaanxi), where a test platform was established to investigate photovoltaic water pumping characteristics under solar energy regulation coupled with compressed-air energy storage, as illustrated in the figure below (Figure 1).
Water source: Stores the water supply for the system. Pump: Pushes water from the source through the system. Water-air tank: A container that stores energy through compressed air. Pressure gauge: Displays the pressure inside the water-air tank. Pressure switch: Automatically controls the system (e.g., triggers pump/valve) based on pressure levels. Time-delay relay: Controls timing for system operations (delays actions like valve activation). Solenoid valve: Opens/closes the water flow path (electronically controlled); Pressure sensor: Detects real-time pressure (sends data to the collector). Sprinkler nozzle: Releases water as a spray (the end-use component). Electronic scale: Measures the weight of the water-air tank (to track water volume). Data collector: Gathers data (from sensors, scale, etc.) and sends it to the laptop. Photovoltaic array simulator: Supplies power (mimics solar panel output) to the system.
To fulfill the flow and pressure requirements for the injection of water and compressed air into the pressurized water and gas tank, this study selected three commercially available DC diaphragm pumps with varying rated powers: 5G310-160W, FYR4-350W, and YJ300-500W. To simulate the photovoltaic output of solar panels under diverse meteorological conditions, a photovoltaic array simulator model PVS1000D (650W-65V12A) was employed to edit the I-V characteristic curve, thereby achieving the desired photovoltaic output power.
The outlet of the water pump is connected to a pressure water-air tank for energy storage purposes. This tank is equipped with a digital pressure sensor and a pressure switch to monitor its internal pressure. When the air pressure within the tank reaches the predetermined upper limit, set at 0.7 MPa in this study to accommodate the operational requirements of various sprinkler types, the solenoid valve on the outlet pipe will automatically activate, releasing stored energy from the tank. Additionally, a weighing sensor is installed at the lower section of the pressure water-air tank for real-time weight monitoring. Data regarding both pressure and weight within the tank are transmitted to a computer monitoring terminal via an RS485 communication serial port every 0.1 s.
The various photovoltaic output powers are derived from the output power of the photovoltaic array simulator. For each pump test, the power is incrementally increased from 0 W to the rated power of the pump in steps of 20 W. The flow rate of the pump under different photovoltaic output powers and outlet pressure is determined through both measurement and calculation methods. During testing, real-time measurements of the water-air tank’s weight and internal pressure are conducted at 1 s intervals using pressure sensors and load cells. The process of photovoltaic water pumping and energy storage is divided into n time units with 5 s as a time unit, and the average flow rate of each time unit is taken as the characteristic flow rate of the photovoltaic output power and outlet pressure at that time unit (using the average outlet pressure of the first 5 s). Consequently, the characteristic flow rate of the pump for the i-th time unit segment (m3/h) can be expressed as follows:
q i = 0.0036 m i − m i − 1 ρ Δ t
where mi and mi−1 denote the initial and final weights of the water vapor tank at the commencement and conclusion of the i-th time unit, g; ρ represents the density of water, g/cm3; Δ t signifies the duration of the time unit, s.
Utilizing the aforementioned methodologies, the flow rates of three water pumps were sequentially measured under varying conditions of photovoltaic output power and outlet pressure, with each experimental set being replicated three times. Employing both the Levenberg–Marquardt algorithm and a universal global optimization technique, we fitted the flow rate data for these pumps, ultimately deriving a comprehensive formula for calculating pump flow that incorporates both photovoltaic output power and discharge outlet pressure.

2.1.2. The Influence of Environmental Factors on Photovoltaic Power Output

Environmental factors significantly influence the output power of solar panels, which subsequently impacts the flow rate of water pumps. The performance characteristics of solar panels are closely associated with solar irradiance and the operating temperature Tcell. By utilizing the photovoltaic component power estimation model provided by the manufacturer, one can calculate the output power at any given irradiance and temperature based on electrical performance parameters using the following equation [21]:
P p v , g e n = P p v × G θ G s t c × [ 1 + F T ( T c e l l − T s t c ) ]
where Ppv,gen represents the actual output power of the solar panel, W; Ppv represents the output power of the solar array under standard conditions, W; Gstc is the standard irradiance, 1000 W/m2 [22]; FT is the temperature factor, approximately −0.0037/°C for monocrystalline and polycrystalline silicon [21,23]; and Tcell is the operating temperature of the solar cell, °C; and Tstc is the standard temperature, 25 °C [24].
(1)
Operating Temperature of Solar Cells
The operating temperature of solar cells is calculated as follows [25]:
T c e l l = T a b m + ( ( ( N O C T − 20 ) / 800 ) × G θ )
where Tamb is the ambient temperature, in degrees Celsius; NOCT is the normal operating temperature of the cell panel, measured open-circuit in nominal terrestrial conditions [26], provided by the manufacturer, and is typically set at 45 °C.
(2)
Tilted Surface Global Irradiance
The total global irradiance on a tilted solar panel surface is composed of direct irradiance, diffuse irradiance, ground reflection irradiance, and diffuse irradiance around the sun [27]. The calculation formula is as follows:
G θ = ∫ 0 t o ( I θ + D θ + J θ + C θ ) d t
where Gθ represents the total global irradiance on the tilted surface, W/m2; Iθ represents the direct irradiance on the tilted surface, W/m2; Dθ represents the diffuse irradiance on the tilted surface, W/m2; Jθ represents the ground reflection irradiance on the tilted surface, W/m2; Cθ represents the diffuse irradiance around the sun on the tilted surface, W/m2; and t0 represents the solar irradiation time, h.
The diffuse irradiance Cθ is directly proportional to the direct irradiance Iθ, constituting 5% of the direct radiation degree [28].
G θ = ∫ 0 t 0 ( 1.05 I θ + D θ + J θ ) d t
To establish a comprehensive calculation model for solar irradiance on the tilted surface, the calculation methods and key parameters of the core components of solar irradiance on the tilted surface were first systematically sorted out and obtained through references [29,30,31]. Specifically, these components include the diffuse irradiance on the tilted surface ( D θ ), the ground reflection irradiance on the tilted surface ( J θ ), and the direct irradiance on the inclined surface ( I θ ), along with their corresponding expressions and correction coefficients. By substituting the calculation formulas and parameters of the above components into the total expression of solar irradiance on the tilted surface (Equation (5)), the complete calculation formula of solar irradiance on the tilted surface is finally derived as follows after integration and deduction:
G θ = ∫ 0 t 0 ( 1.05 I H cos i + D H ( 1 + cos θ ) / 2 + G H ρ ( 1 − cos θ ) / 2 ) d t
In the equation, I H is the direct irradiance on the horizontal surface, w/m2; G H is the horizontal surface solar radiation, w/m2, which can be obtained from the NASA Earth’s Atmosphere and Radiation database; D H represents the diffuse radiation of horizontal solar panels, measured in w/m2. Guide derived a fitting formula for the curve of horizontal solar diffuse irradiation as Equation (7) [28]. In this equation, α represents the solar zenith angle, in degrees.
D H = 16.0 α 0.5 − 0.4 α
In which, I H and G H , D H satisfy the following relationship:
G H = 1.05 I H t sin α + D H
Consequently, the output power of the photovoltaic panel can be determined for any given irradiance and ambient temperature:
P p v , g e n = P p v ( 1.0925 × 1 0 − 3 G θ − 3.7 × 1 0 − 6 G θ T a b m − 1.156 × 1 0 − 7 G θ 2 )
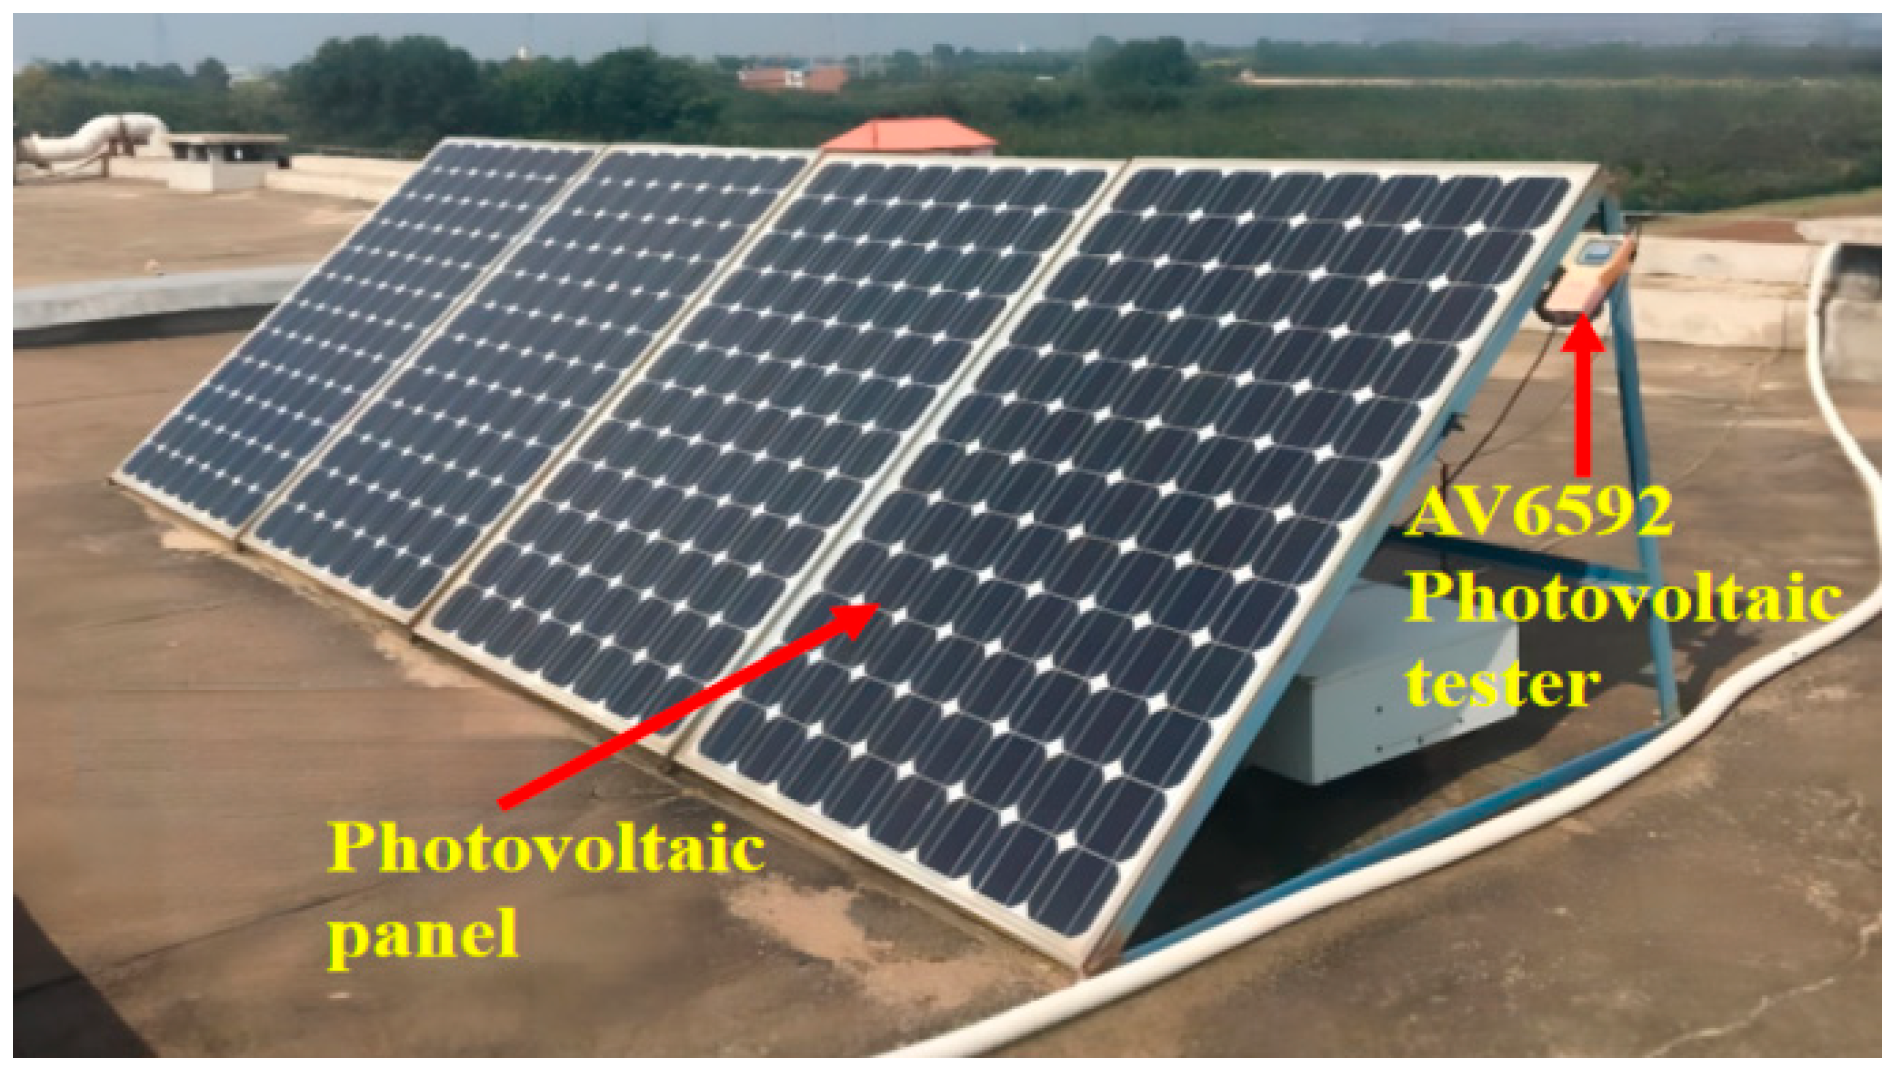
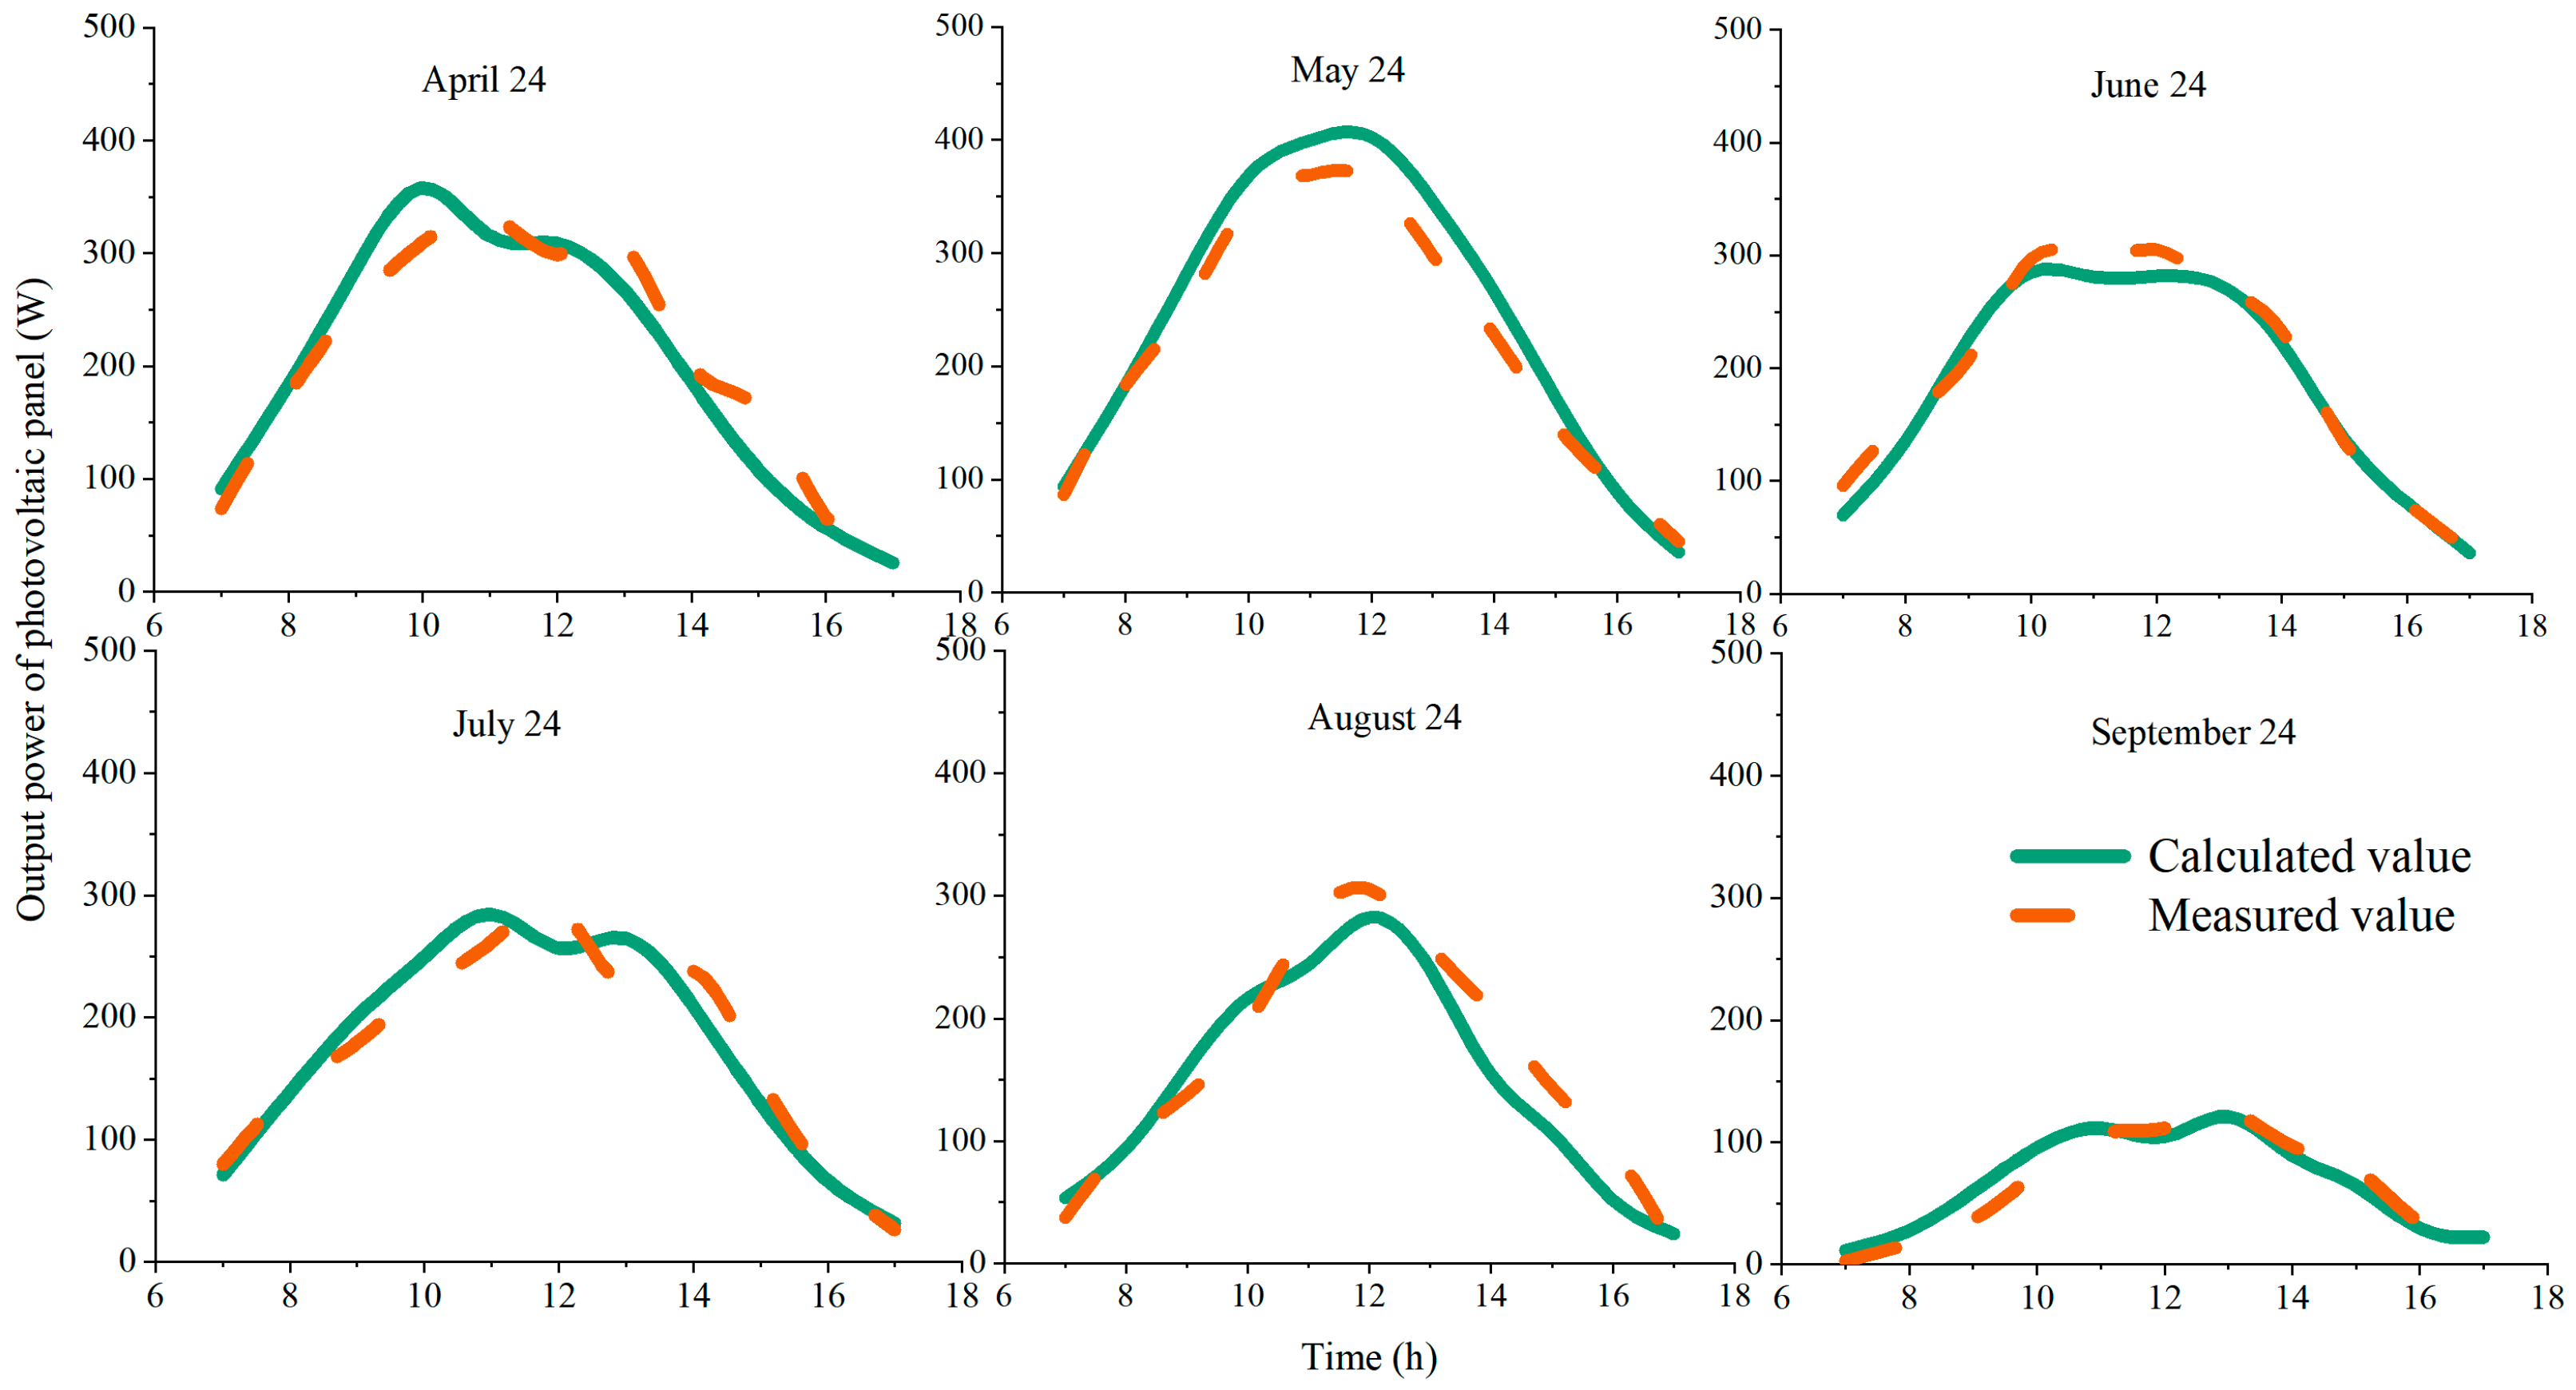
The calculation accuracy of Equations (2)–(9) were verified through experimental results (Figure 2). The validation experiment selected a monocrystalline solar cell panel with the model CS5M32, rated power of 490 W, and an angle of 30° between the solar panel and the horizontal ground. The AV6592 solar cell tester(Ceyear Technologies Co Ltd., Qingdao, China) was used to continuously monitor and collect the ambient temperature and real-time output power of the solar panel (environmental temperature: testing range of −30–100 °C, accuracy of ±1 °C; photovoltaic output power: testing range of 0.1–500 W). Solar irradiance was measured using a solar irradiance sensor, featuring a measurement range of 0–18,000 W/m2, an accuracy of ±3%, and a response time of ≤3 s. The sensor was installed at the same horizontal level as the solar panel (1.5 m above the ground) with a horizontal upward orientation to avoid shading from obstacles, ensuring consistent environmental conditions with the PV panel. All data (irradiance, ambient temperature, and PV output power) was collected every 10 min, and the collection period was from 1 April 2023 to 30 September 2023.

2.1.3. The Influence of Compressed-Air Energy Storage on Pump Outlet Pressure

In a constant-volume pressure tank, the air compression process occurs over a relatively short duration, allowing for the assumption that the temperature of the air within the tank remains unchanged. Under these conditions, the ideal gas law is applicable [32].
Divide the pumping process into several equal time intervals, assuming the interval length is t ¯ , and the average flow rate of the pump in the first interval is q 0 . Then the water pumped in the first interval is:
Δ V 0 = q 0 t ¯
The air volume in the tank at the end of the first time period is
V 1 = V 0 − Δ V 0 = V 0 − q 0 t ¯
The pressure inside the water-air tank as well as the pressure at the outlet of the water pump is
P 1 = P 0 V 0 V 1 = P 0 V 0 V 0 − Δ V 0
Similarly, we can ascertain the pressure within the water-air tank manifests as the pressure at the outlet of the water pump for the n-th time interval as follows:
P n = P 0 V 0 V n = P 0 V 0 V n − 1 − Δ V n − 1
In this equation, P 0 represents the initial pressure of the gas inside the tank, Pa; V 0 represents the initial gas volume inside the tank, m3; P n represents the air pressure inside the tank at time n, Pa; V n represents the air volume inside the tank at time n, m3.
In summary, employing an iterative calculation method allows for the determination of outlet pressure at any specified time interval during the photovoltaic water pumping process.

2.2. Characteristics of Pulse Spraying and Energy Release

2.2.1. Released Water Volume by One Pulse Spray Process

Based on pertinent research findings regarding the hydraulic performance of sprinklers, It is evident that there exists an exponential relationship between the flow rate of the sprinkler and its operating pressure based on existing research that has been conducted [33], as shown in the following equation:
q = m P n o z z l e n
In which, P n o z z l e is the working pressure of the spray gun; m and n are both fitting coefficients. Given that the operating pressure of the sprinkler nozzle is a dynamic variable influenced by the pulse jetting process of the water-air tank, the nozzle flow rate also exhibits temporal variation during a single pulse spraying event. Consequently, Equation (21) can be reformulated as
q ( t ) = m P n o z z l e ( t ) n
Assuming the duration of the pulse jet is t1, the amount of water jet within one cycle can be calculated by the following formula:
V w = ∫ 0 t 1 m P n o z z l e ( t ) n d t
From Equations (20)–(22), it is evident that the critical factor in calculating the total water volume of a pulse jet spray lies in understanding the characteristics of nozzle working pressure variations throughout the spraying process, specifically by delineating the pressure change line of the nozzle.
In the context of thermodynamic analysis of the expansion work process of compressed air, when the air within the water-air tank expands and displaces water outward, it performs expansion work on the external environment. In an infinitesimal segment of this process, let us denote the force exerted on the water as F and the displacement as dx; thus, the expansion work executed by the compressed air on its surroundings can be articulated as
δ W = F d x
At the water-vapor interface, the force F can be expressed as the product of the air pressure and the area of the water-vapor interface. Therefore, during the infinitesimal work process of air expansion, the expansion work exerted by the air on the outside is
δ W = p A d x = p d V
Consequently, when the volume of compressed air transitions from V1 to V2, the work performed by the air during expansion against the external environment can be determined through integration along the process path 1-2. During the air expansion process, the work Performed by the air is [34]
W 1 − 2 = ∫ 1 2 p d V = ∫ 1 2 P 1 V 1 V d V = P 1 V 1 ln V 2 V 1
The external work process of compressed air distinctly demonstrates a logarithmic growth characteristic. When the initial pressure within the pressure tank is maintained constant, the residual potential energy exhibits a logarithmic decline. Concurrently, the working pressure at the nozzle also follows a trend of logarithmic decrease. Thus, it can be posited that the relationship between nozzle pressure and time during the pulse spraying process is as follows, where Pmax denotes the peak pressure in the water-air tank.
P n o z z l e = a P m a x + b l n ( t ) , b < 0
To establish the pressure profile line, it is essential to further elucidate the coefficients a and b in the aforementioned equation. Specifically, coefficients a denotes the pressure loss coefficient, which characterizes the relationship between the peak nozzle pressure during pulse spraying and the peak pressure within the water-air tank; whereas coefficients b represents the pressure drop coefficient, indicating the rate of pressure decline throughout the energy release process. This latter coefficient is fundamentally determined by the quantity of energy stored within the tank and the rate at which this energy is discharged. Critical factors influencing these dynamics include the volume of the water-air tank, the maximum operational pressure, and the cross-sectional area of the nozzle.
(1)
Determination of the pressure loss coefficient a
The magnitude of the pressure loss coefficient a indicates the disparity between the nozzle pressure and that of the water-air tank, primarily influenced by the hydraulic characteristics of the piping system. This includes factors such as frictional head loss along the pipe and local head loss at the nozzle, which are contingent upon parameters like pipe length, diameter, connection fittings, and relative elevation differences. Due to dynamic fluctuations in system pressure during operation, flow within the pipe is characterized by transient behavior. To achieve a more precise coefficient estimation, it is advisable to measure pressures at both the nozzle and within the piping system.
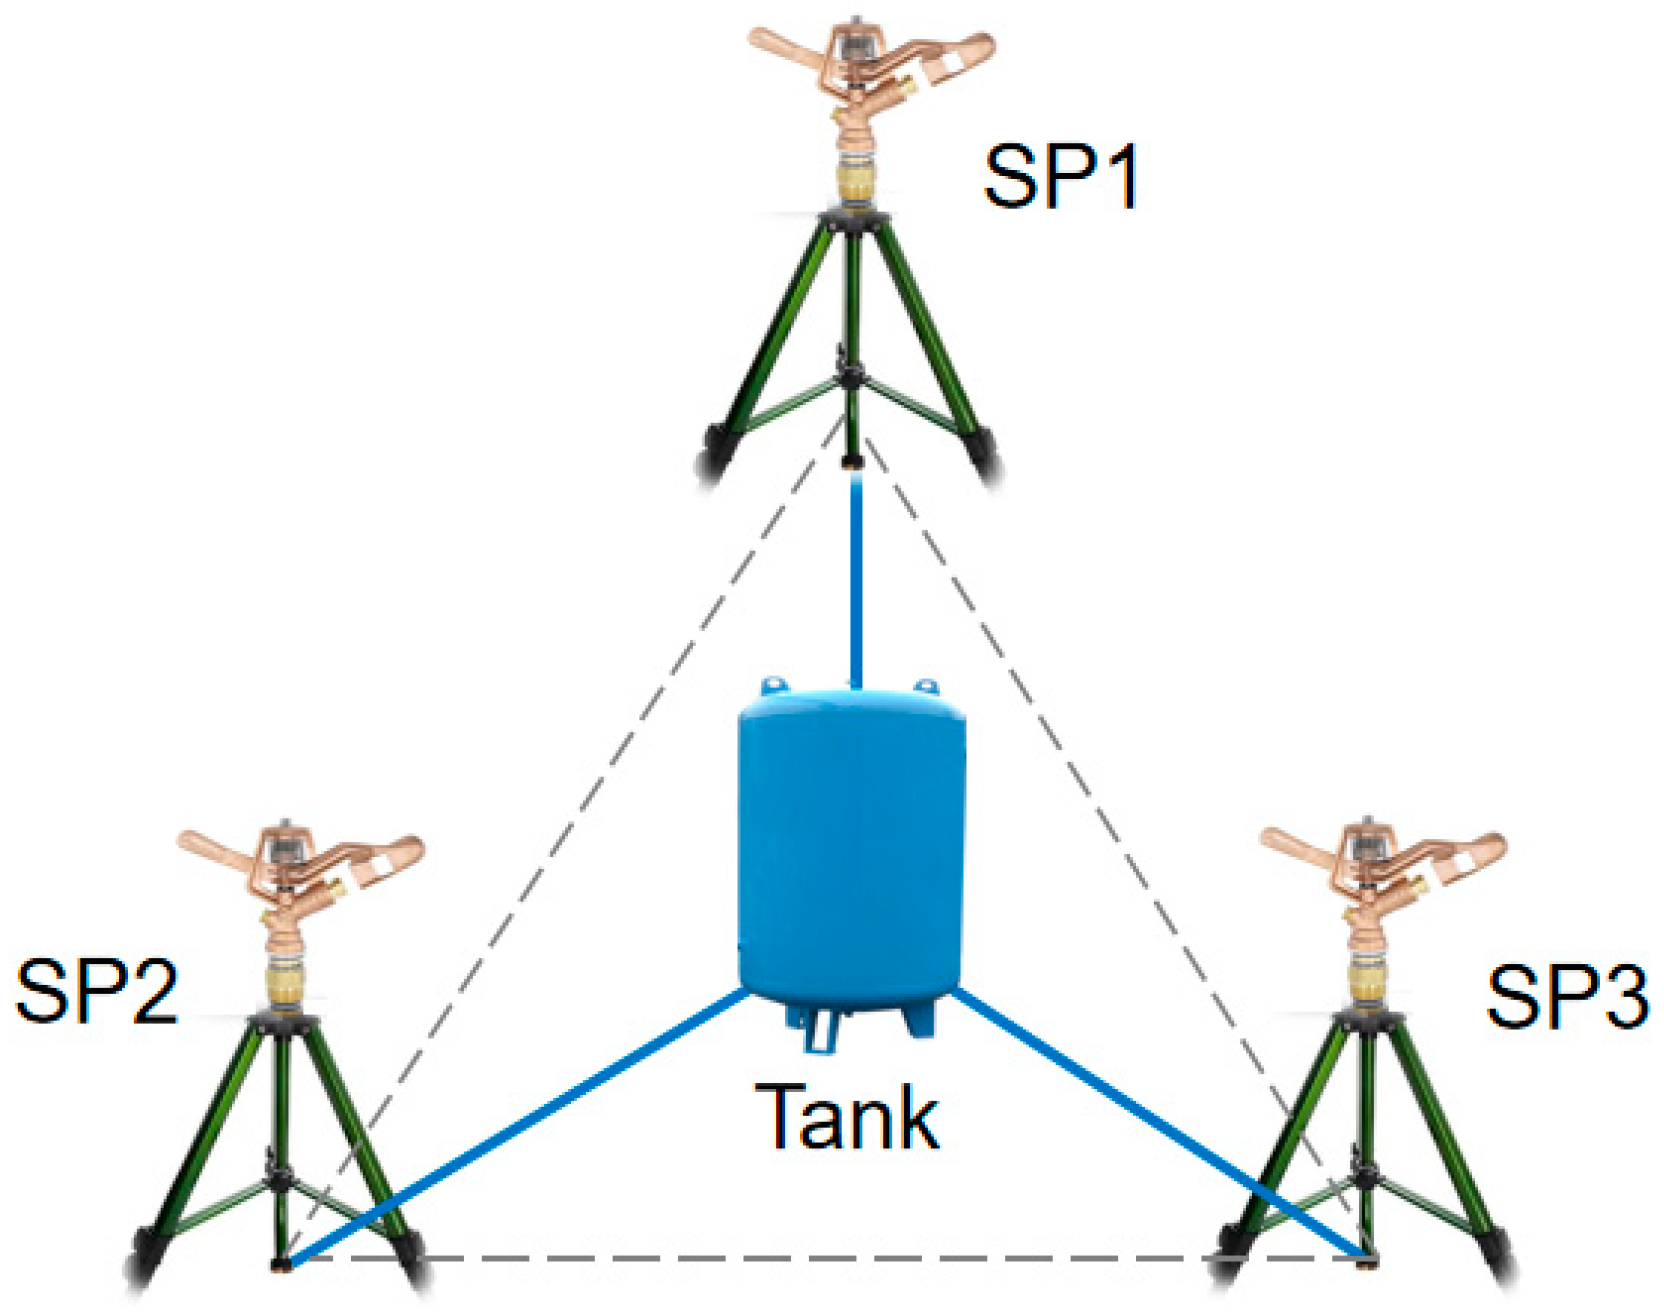
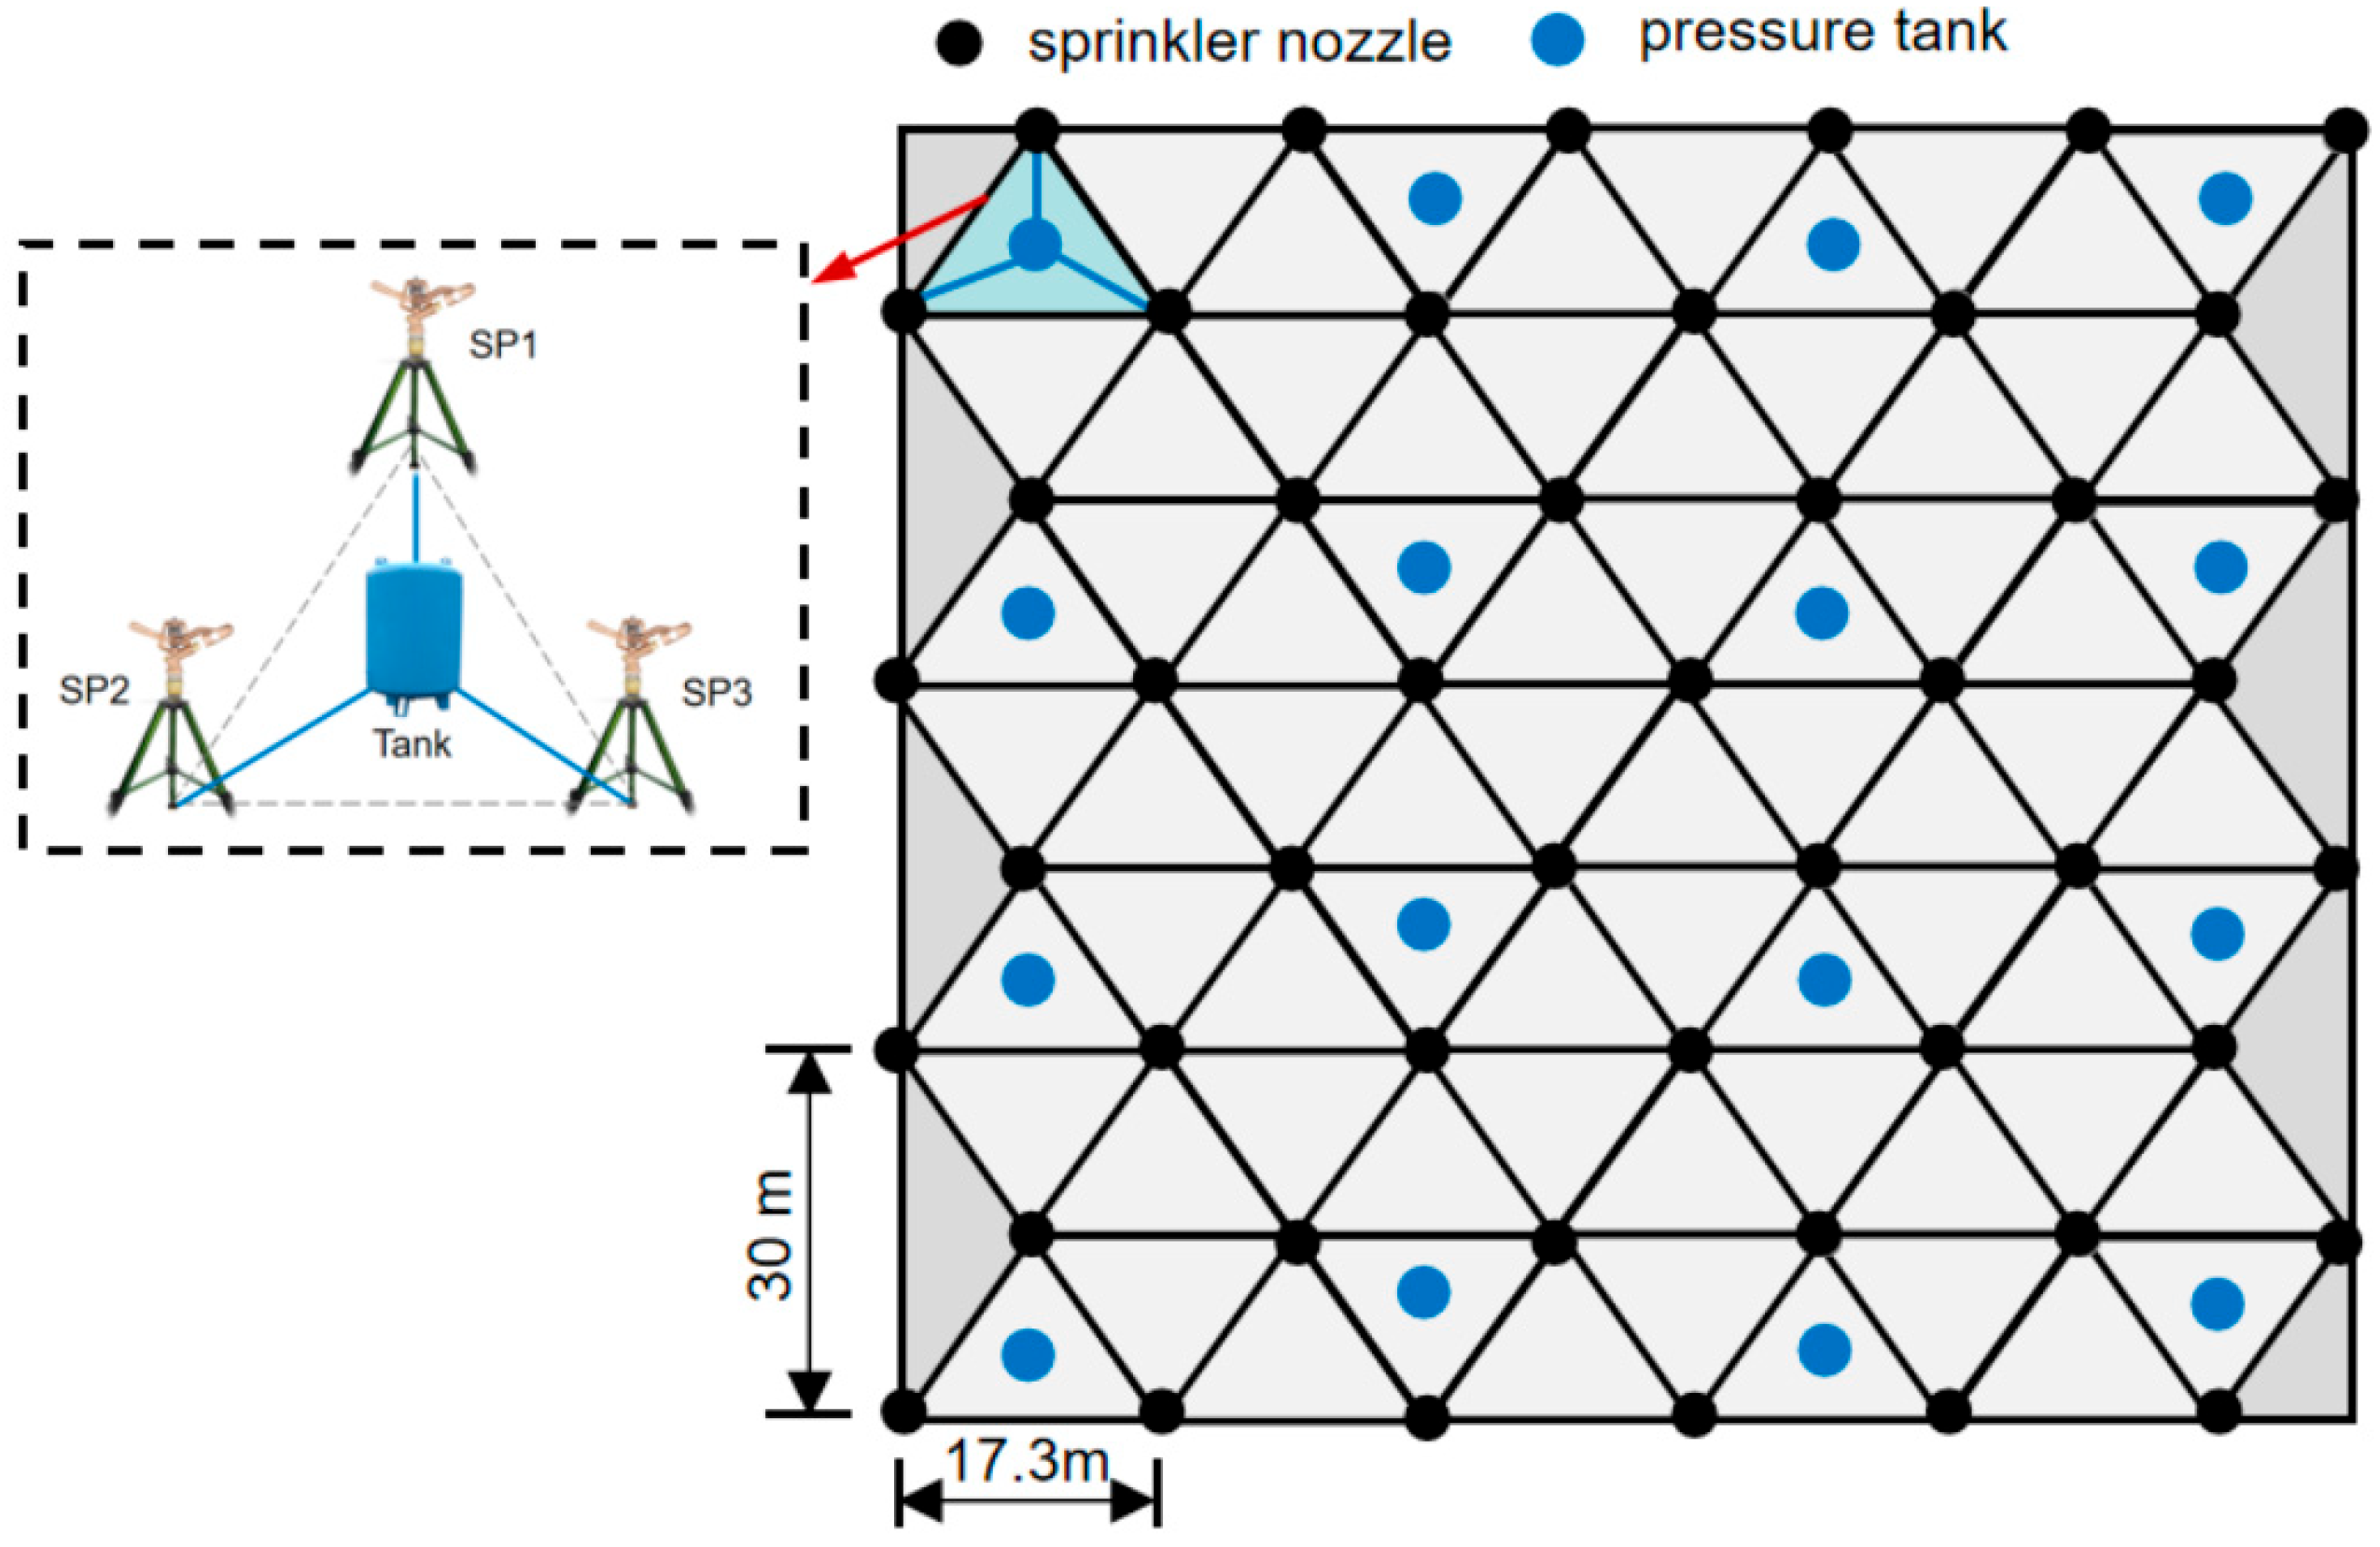
In the research, we implemented the following configuration as illustrated in Figure 3: sprinkler nozzles were arranged in a triangular formation, with a spacing of 17.3 m between adjacent nozzles. Each water-air tank, possessing a volume of 100 L, simultaneously supplied water to three nozzles positioned at a distance of 10 m from each nozzle. The connection between the water-air tanks and nozzles was facilitated by DN25 PE pipes, while maintaining a relative elevation difference of 1.6 m between the outlet of the water-air tank and the position of the nozzles. For this setup, both working pressures PT and PS at the locations of the water-air tank and nozzle were measured during pulse spraying operations and subsequently calculated the pressure loss coefficient
a = P T P S
(2)
Determination of the pressure drop coefficient b
The determination of the pressure drop coefficient b is based on the principle of mass conservation; specifically, the volume of water ejected by the nozzle corresponds to the volume discharged from the water-air tank, which can be obtained through trial calculation:
(a) Nozzle ejected water: For the selected nozzle, assign an initial value b0 to the pressure drop coefficient of the pressure process line of the nozzle, and determine the pressure change process line of the nozzle based on the set spray peak pressure aPmax and Equation (28).
P ( t ) = a P m a x + b 0 l n ( t )
Substituting the above equation into Equation (22) gives the amount of water discharged from one pulse spray process. For the ZY-2 type sprinkler nozzle selected in this study, the values of m and n are 2.877 and 0.552, respectively.
V 0 = ∫ 0 t 0 m ( a P m a x + b 0 l n ( t ) ) n d t
(b) Water-air tank discharged water: According to the principle of conservation of volume, the volume of water discharged from water-air tank must be equivalent to the volume of water being sprayed from the nozzle.
(c) The pressure values for the water tank and nozzle: According to Boyle’s law, when the water tank is at its peak pressure Pmax, the air in the tank is compressed to its minimum volume Vmin. At the end of a single pulse spray, the volume of water ejected from the water tank is Vw, and the pressure in the tank drops from Pmax to P1.
P 1 = P m a x V m a x V m i n + V w
At this point, the nozzle’s working pressure is based on the initial design pressure profile.
P 1 ′ = a P m a x + b 0 l n ( t 0 )
Utilizing the established relationship between the water-air tank pressure and the nozzle operating pressure, assess whether the correlation between the water tank pressure P1 and the nozzle outlet pressure P1′ meets specified criteria. If it does not, adjust the initial value of the pressure drop coefficient b0 accordingly: if P1 is insufficiently low, increase b0 appropriately; conversely, if P1 is excessively high, decrease b0 suitably. Repeat this process until an optimal pressure drop coefficient b is determined that aligns with acceptable standards for the relationship between P1 and P1′.

2.2.2. Pulse Spraying Cycle and Daily Photovoltaic Water Lifting Capacity

To ascertain the effective water lifting capacity of the solar-coupled compressed-air energy storage system during operational mode, it is essential to elucidate the pulsating injection frequency influenced by photovoltaic output power and pump outlet pressure. To derive the total pulsating injection frequency and daily water lifting capacity, we segment the photovoltaic output power into discrete time intervals and predict the daily photovoltaic water lifting capacity by aggregating the contributions from each interval.
(1)
Temporal output power of photovoltaic panel system
Based on the rated power of the selected pumps, appropriate rated output power of the photovoltaic panels should be matched. Regarding the 160 W, 350 W, and 500 W rated power pumps chosen in this study, Because diaphragm pumps typically have low photovoltaic input power requirements, they have high hydraulic efficiency of up to 70%, the rated output power of the photovoltaic panels is matched in accordance with the 1.4 times principle [18], with the corresponding photovoltaic output powers being 220 W, 490 W and 700 W, respectively. Furthermore, based on the photovoltaic output power calculation model proposed in Section 2.1.2, the hourly photovoltaic output power under different irradiance and ambient temperatures can be obtained.
(2)
Hourly Equivalent Flow Rate of the Pump
Each unit time period is analyzed to calculate the pressure lower limit Pmin of the water-air tank based on the selected peak pressure Pmax and discharge volume V0 during pulse spraying. Given the corresponding photovoltaic output power for each time period, substituting this into the water pump flow rate formula, considering both photovoltaic output power and outlet back pressure, yields the variation in lifting water flow rate within that range (from peak pressure to lower limit). This lifting flow undergoes a periodic cycle with energy storage and pulse spraying processes in each time period, and its average value q ¯ is taken as the equivalent flow rate of the water pump under this photovoltaic output power.
(3)
Pulse Spraying Cycle and Daily Photovoltaic Water Lifting Capacity
It is given that within a cycle, the ejection water volume of the water-air tank during the pulse spraying period is Vw, and the water lifting volume of the water pump during the water lifting stage is also Vw. Based on the calculation of the equivalent flow rate of the water pump, the time t1 required for water filling under different photovoltaic output powers at different time periods can be obtained. It is known that the duration of a single pulse spraying is t0, then the duration of the complete pulse spraying cycle is t = t0 + t1. The number of spraying cycles that can be completed per hour under different photovoltaic output powers at different time periods is as follows:
n i = 3600 / t i
In Equation (26), ni denotes the number of spraying cycles in the i-th time period, and ti represents the duration of the pulse spraying cycle in that period. The photovoltaic water lifting volume per hour is Vi = niVw, and the total daily photovoltaic water lifting volume can be acquired by accumulating the water lifting volumes in each time period.

2.3. Case Study

The mismatch between the outflow of the photovoltaic water pump and the demand of the irrigation system is a key issue restricting the application of solar water-saving irrigation technology. Therefore, based on the above research results on the photovoltaic water-lifting capacity regulated by solar-coupled compressed-air energy storage and in combination with the characteristics of the irrigation water demand of crops in actual production, a case analysis is carried out to demonstrate the adaptability of solar-coupled compressed-air photovoltaic sprinkler irrigation to the water demand patterns of crops—specifically, this case study serves as a theoretical project to test and validate the previously developed model for regulating photovoltaic water-lifting capacity via solar-coupled compressed-air energy storage. In this case, Yangling, Shaanxi Province, located in the Guanzhong Plain (34°3′ N, 108°93′ E, altitude 398 m), is taken as the research area, and a square plot with an area of 1 ha (100 m × 100 m) is selected. Taking the supplementary irrigation of summer corn as an example, the adaptability analysis of the solar-coupled compressed-air photovoltaic sprinkler irrigation system is carried out. The design of the sprinkler irrigation system in the project area adopts the configuration of a single group of solar-coupled compressed-air photovoltaic sprinkler irrigation devices shown in Figure 3. In this 1 ha project area, the numbers of sprinklers and water-air tanks are 48 and 16, respectively, as shown in Figure 4.
In this study, the CLIMWAT 2.0 and CROPWAT 8.0 software provided by FAO were employed to formulate the irrigation schedule for corn sprinkler irrigation. CLIMWAT 2.0 is clearly classified as free software (freeware), it has constructed a vast database through over 5000 meteorological stations worldwide, capable of providing agricultural meteorological data such as temperature, air humidity, wind speed, precipitation, irradiance, and evapotranspiration [35,36]; whereas CROPWAT 8.0 relies on the meteorological data provided by CLIMWAT 2.0 to formulate corresponding irrigation schemes based on different soil types and crop species [37,38]. The crop coefficient of corn is 0.3 in the early growth stage, 1.2 and 0.35 in the middle and late growth stages, respectively. It is appropriate to maintain the soil moisture content at 70% during the growth period of corn. When the soil moisture content is lower than 60–80% of the field capacity, irrigation should be implemented promptly. Additionally, the utilization coefficient of irrigation water for sprinkler irrigation was set to be 70%.

3. Results

3.1. Characteristics of Photovoltaic Water Lifting and Energy Storage

3.1.1. Pump Flow Rate Under the Joint Effect of Photovoltaic Output Power and Outlet Pressure

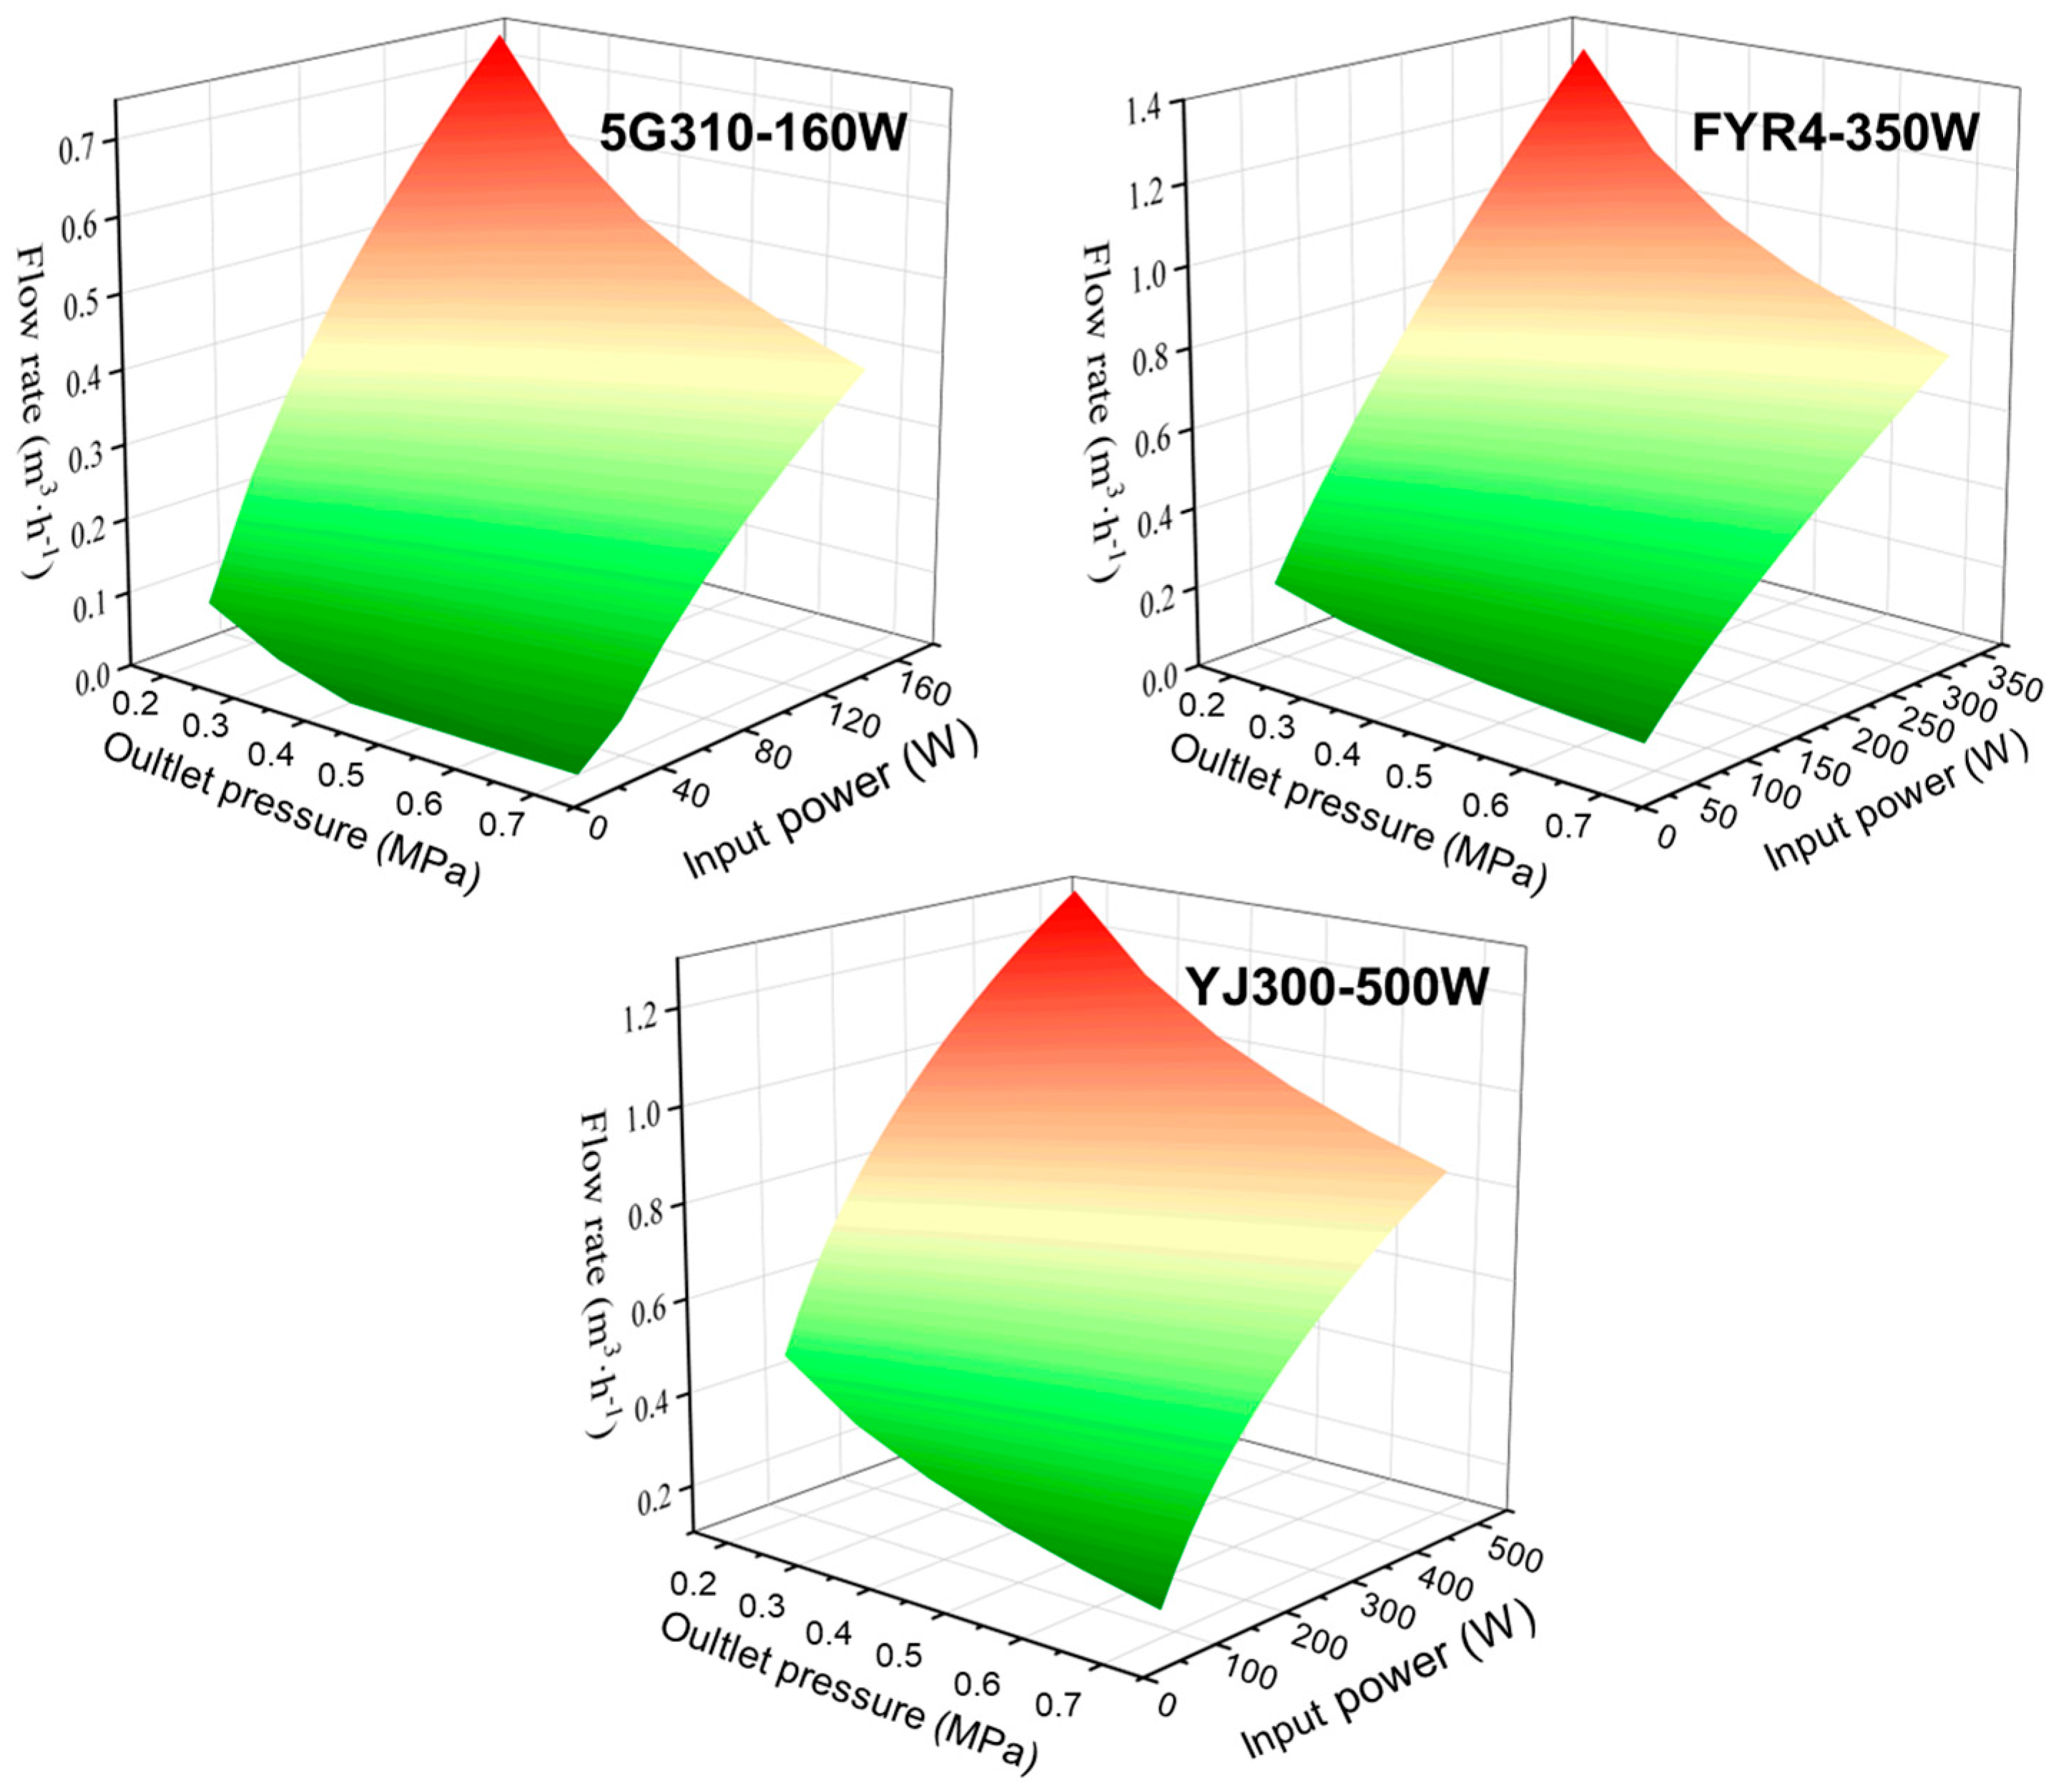
From Figure 5, it can be seen that the flow rates of the three water pumps with different rated powers increase with the increase in photovoltaic output power, while they decrease with the increase in pump outlet pressure. In addition, when the operating power of the water pump is lower than its rated power, the larger the input power, the larger the lifting flow rate per unit time.
The water flow rates of three types of pumps under different photovoltaic output powers and outlet pressure conditions were fitted by means of the Levenberg–Marquardt and Universal Global Optimization methods. The calculation formula of the water pump flow rate related to the photovoltaic output power and outlet pressure was thereby obtained, as presented in Table 1. It can be observed from the table that the goodness of fit of the pump flow rate calculation formula obtained through this method is all above 0.99. These formulas can be utilized to calculate the instantaneous flow rate of the water pump in the solar-coupled compressed-air pulse irrigation system under varying photovoltaic output powers and outlet pressure conditions.

3.1.2. The Influence of Environmental Factors on Photovoltaic Power Output

Based on the calculation model described in Section 2.1.2, the calculated values of the output power of the photovoltaic panel were obtained and compared with the actually measured output values of the photovoltaic panel, as depicted in Figure 6. In the figure, the calculated and measured results of the photovoltaic output power on the 24th day of each month from April to September 2023 were selected, totaling six time points. It can be observed from the figure that the photovoltaic output power exhibits a trend of increasing first and then decreasing within a day and maintains a relatively high level during the period from 10:00 to 14:00 each day. The good consistency between the calculated and measured values indicates that this calculation model can relatively accurately reflect the influence of environmental factors’ variations on the photovoltaic output power. Within the selected six-day time range, the peak deviation between the measured and calculated values ranges from −7.49% to 9.05%, while the deviation of the cumulative photovoltaic output for one day ranges from −4.22% to 9.24%.

3.1.3. The Influence of Compressed-Air Energy Storage on Pump Outlet Pressure

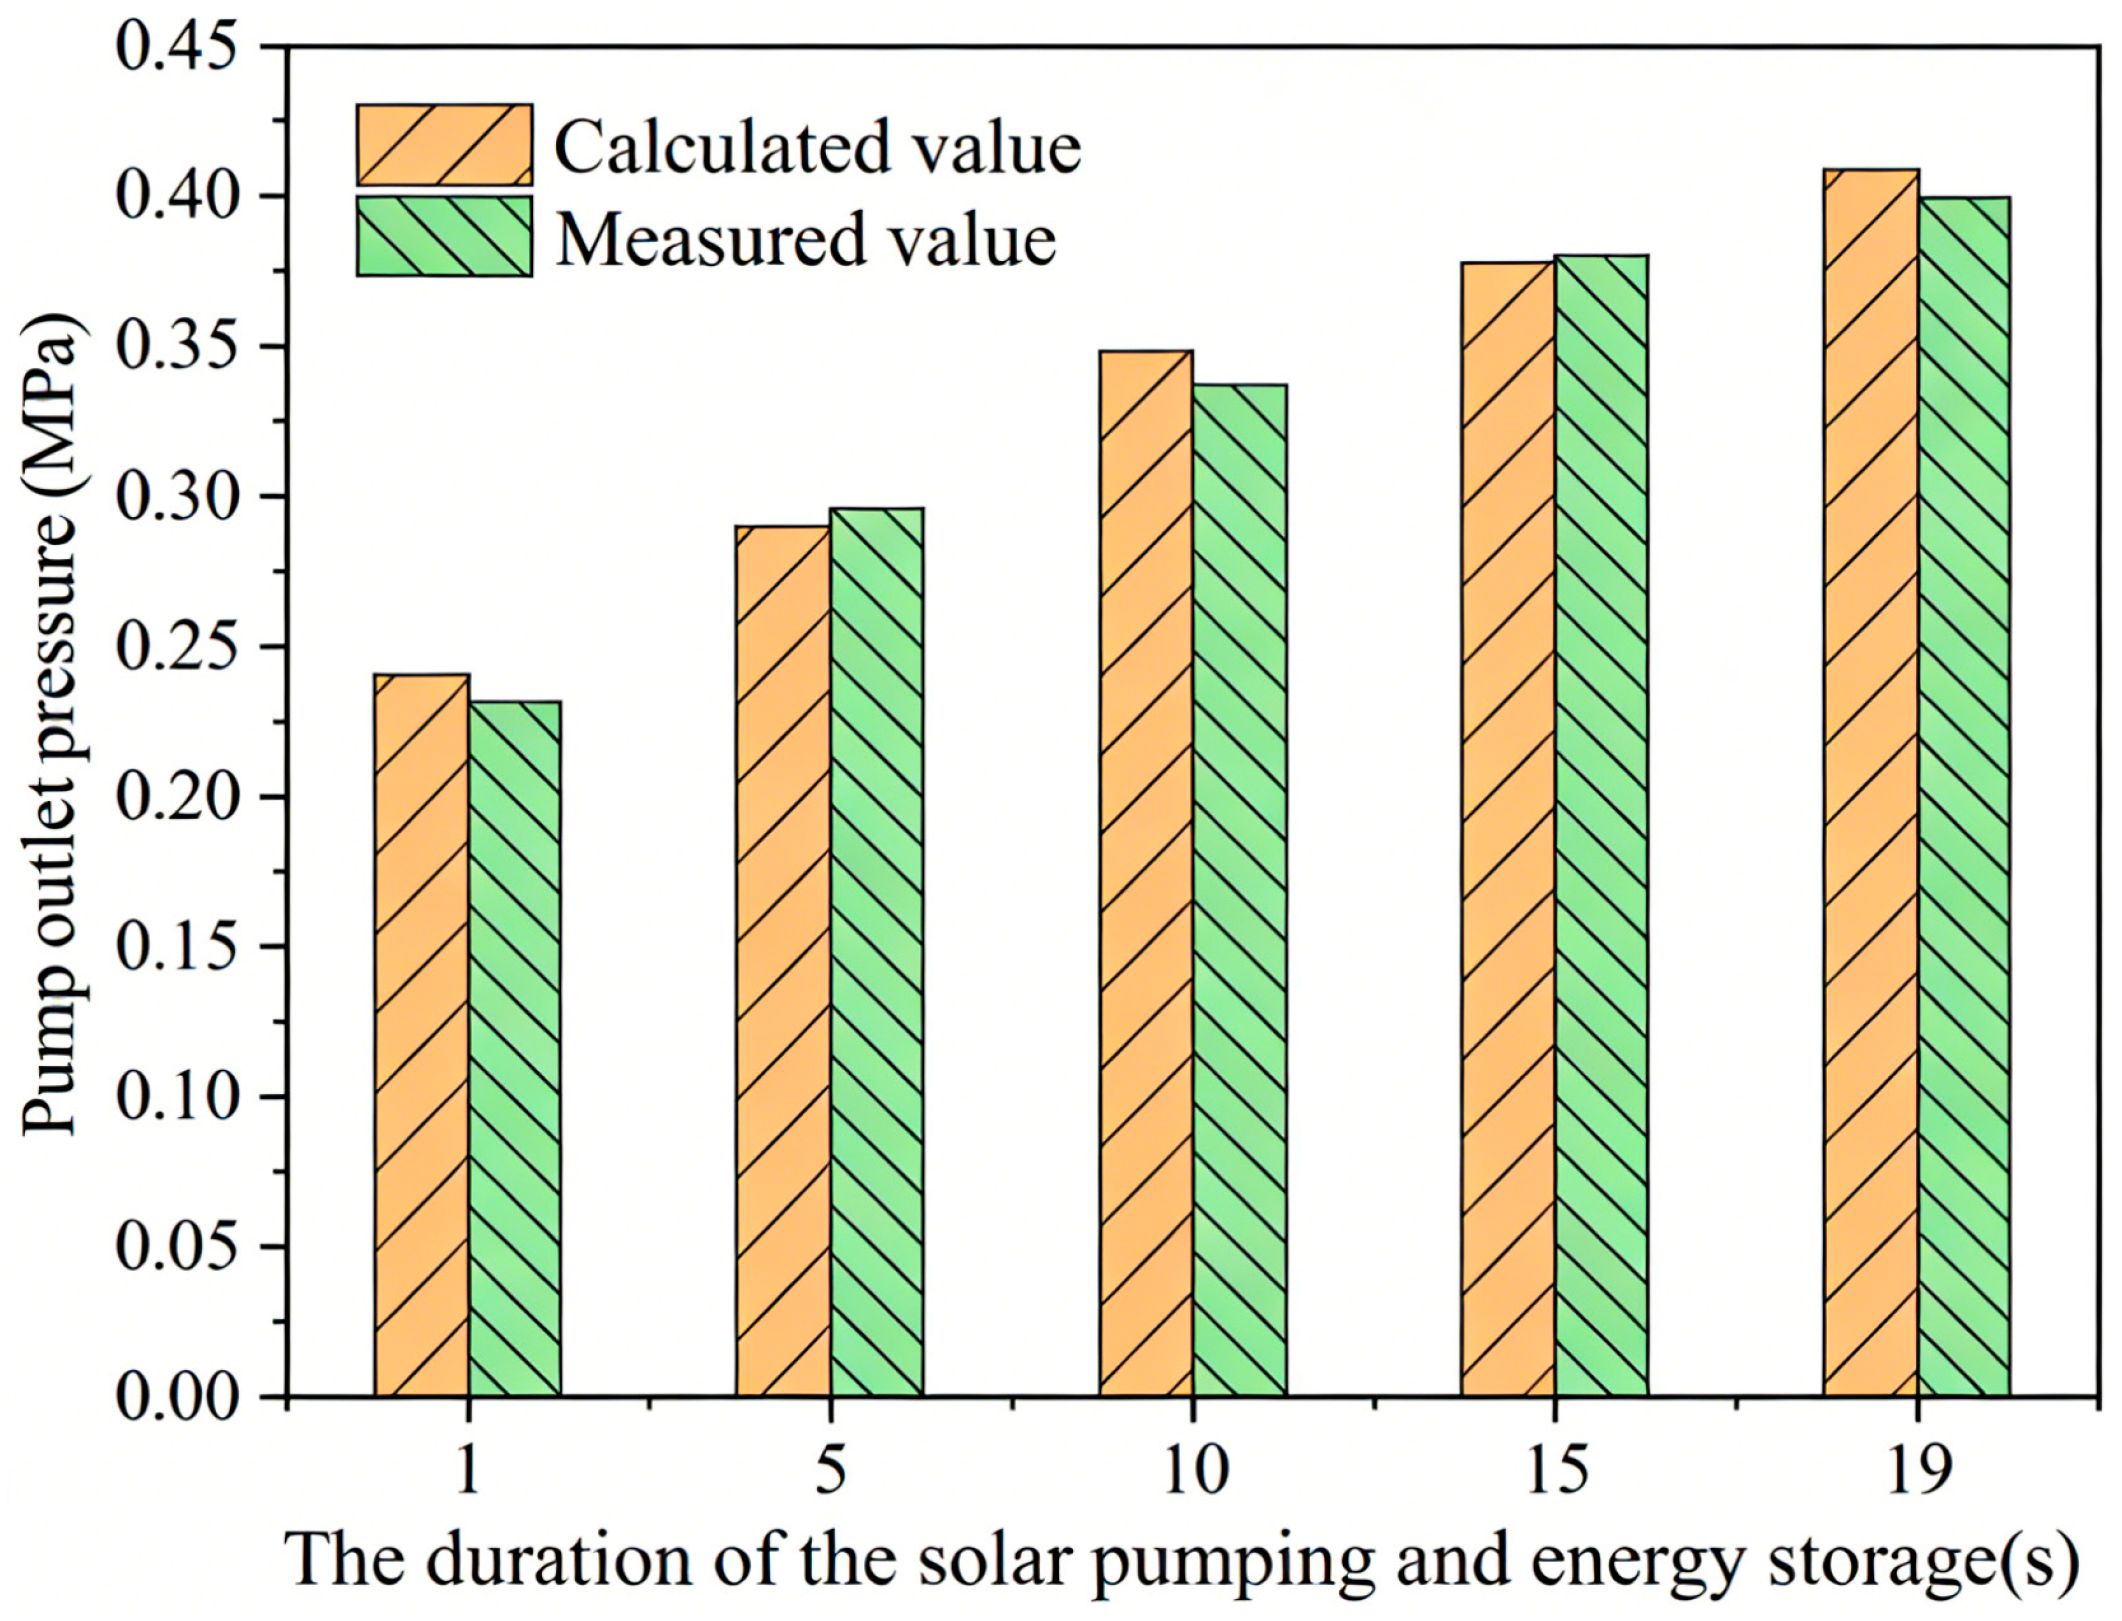
The calculation and measured values of the pressure at the pump outlet are depicted in Figure 7. In terms of the overall trend, as the process of photovoltaic water pumping and compressing the air for water-air irrigation progresses, the pressure at the pump outlet shows a linear increase. It can be seen from the figure that iterative calculations based on the assumption of ideal gas can precisely predict the pressure at the pump outlet after the connection of the water-air tank. According to the calculation results, within 19 s after the initiation of water pumping and gas compression, the measured value of the pump outlet pressure rose from 0.213 MPa to 0.4 MPa, and the measured pressure variation increased from 0.215 MPa to 0.408 MPa. The deviation between the calculated and measured results does not exceed 3.63%.

3.2. Characteristics of Pulse Spraying and Energy Release

3.2.1. Released Water Volume by One Pulse Spray Process

(1)
The pressure loss coefficient a
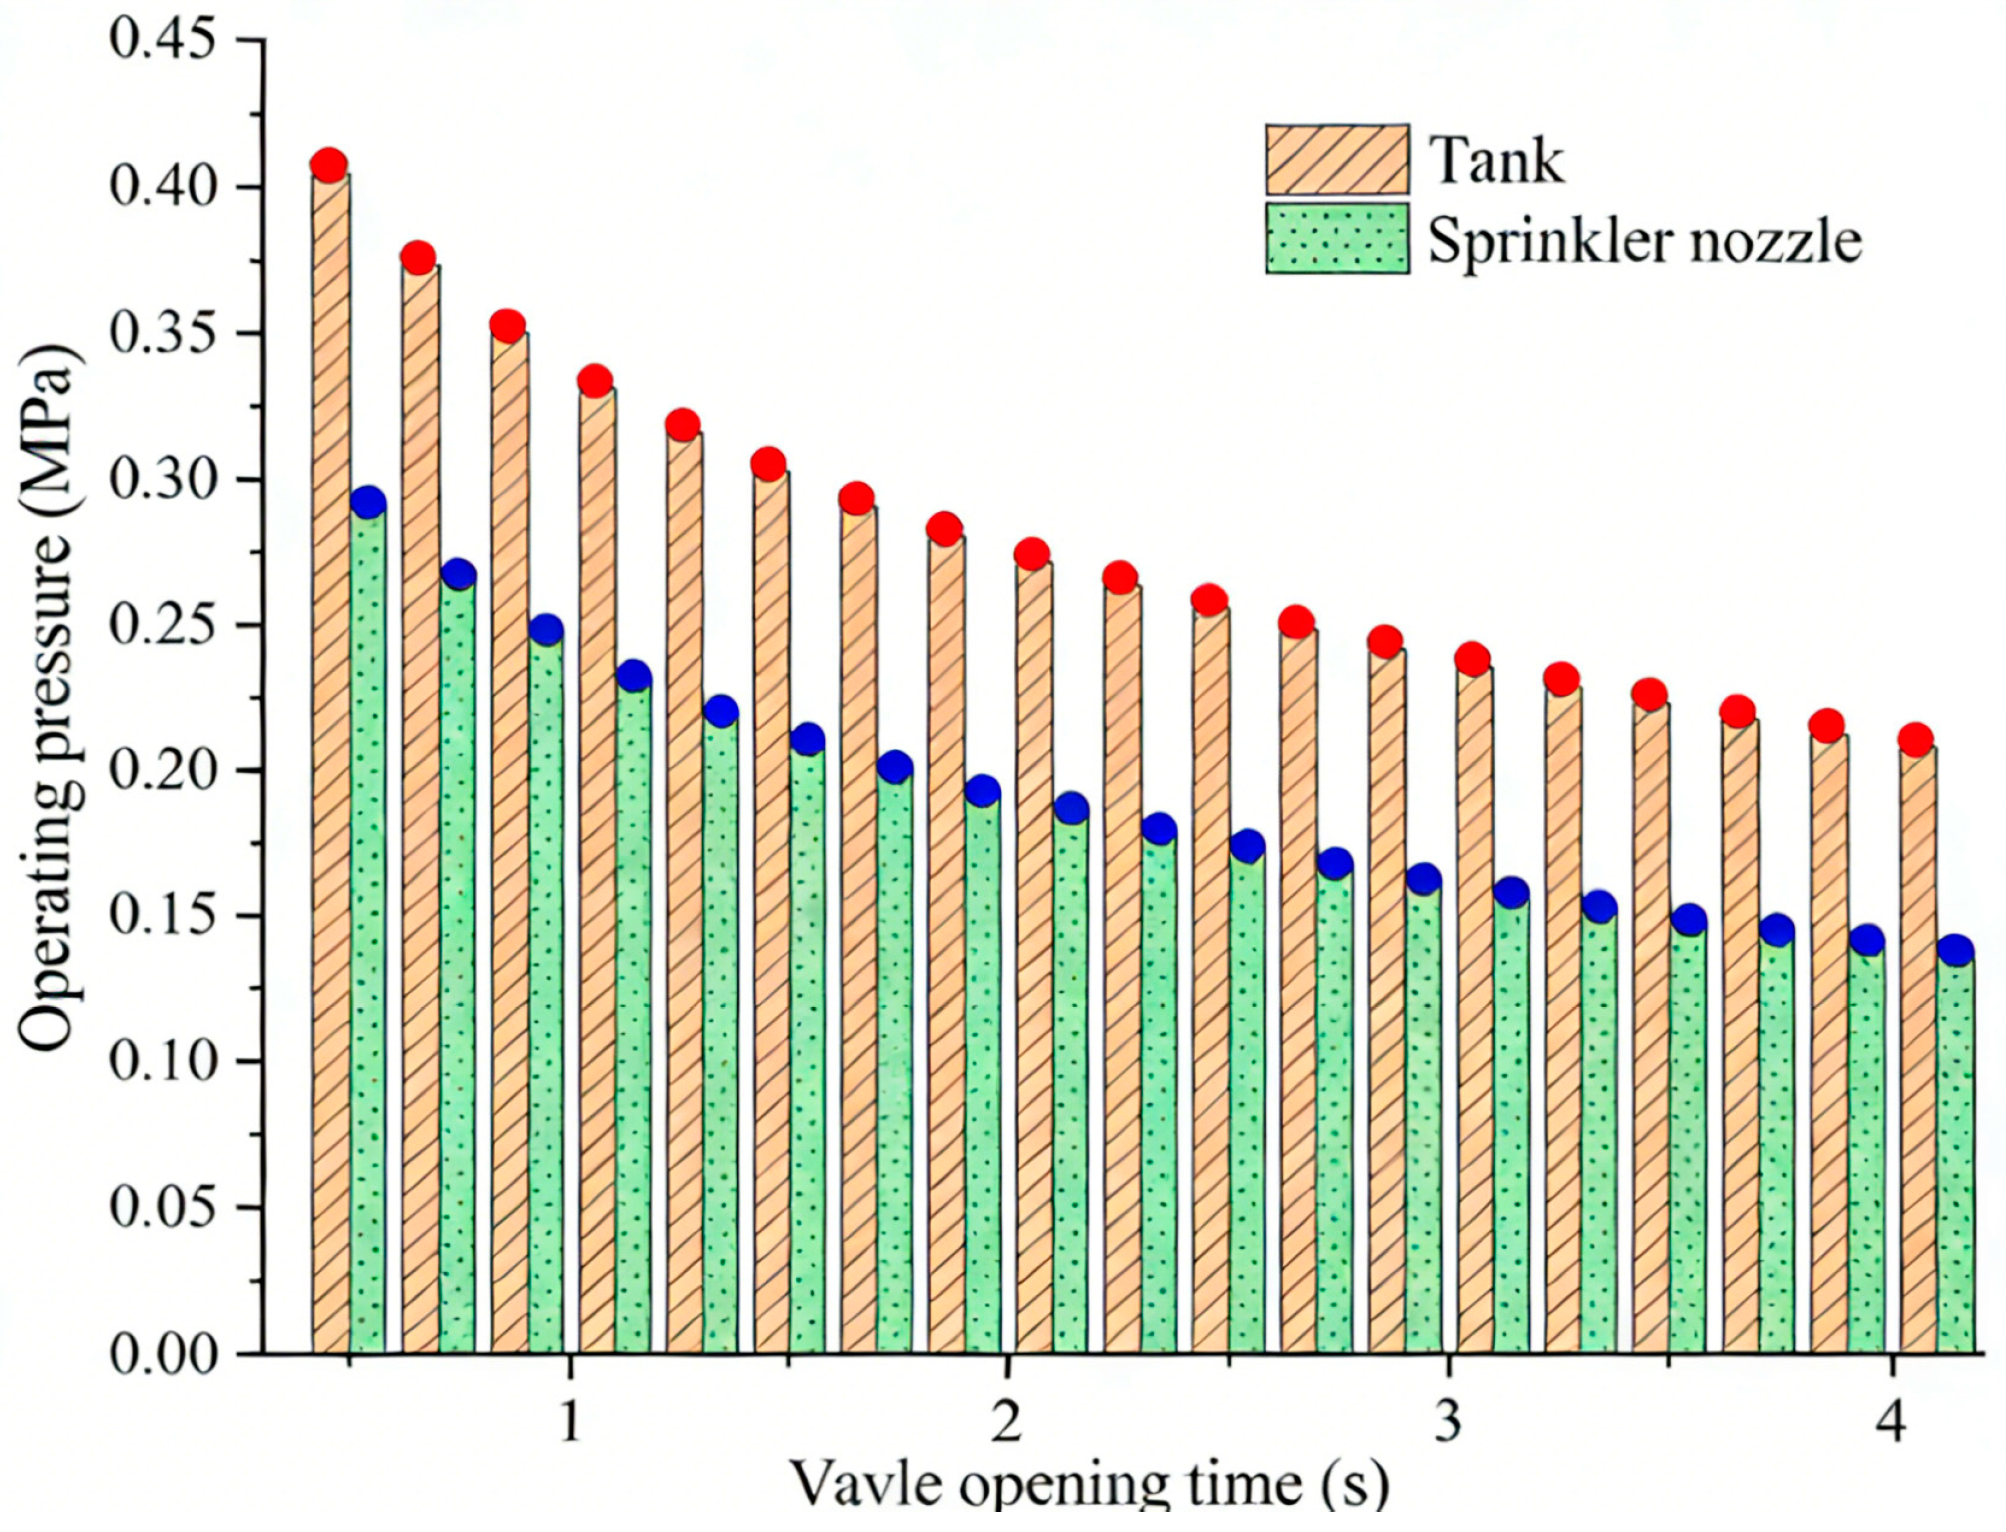
As illustrated in Figure 8, both the water-air tank and the sprinkler nozzle demonstrate a distinct logarithmic decline trend, with pressure variations exhibiting strong consistency. Concurrently, the working pressure at the nozzle remains consistently within a stable range of 64.5% to 72.1% of that in the water-air tank, displaying only minor fluctuations throughout this period. Consequently, an average fluctuation value of 67.8% is adopted as the pressure loss coefficient.
(2)
The pressure drop coefficient b
The trial calculation process of the pressure drop coefficient is presented in the Table 2. As can be seen from the table, with the decrease in the trial calculation value of the pressure drop coefficient, both the pulse spray water volume and the working pressure of the sprinkler at the end of the spraying period show an increasing trend, while the pressure inside the water-air tank shows a decreasing trend. When the pressure drop coefficient is reduced from 0.11 to 0.086, the ratio of the working pressure of the sprinkler at the end of the spraying period to the working pressure of the water-air tank rises from 0.589 to 0.780. Compared with the pressure loss coefficient deduced in the previous section, the deviation rate range is −13.127% to 15.044%. Among them, when the value of the pressure drop coefficient is 0.098, the deviation coefficient is the smallest, which is 0.737%; therefore, the value of the pressure drop coefficient b can be selected as 0.098 accordingly.
Based on the above results, the pressure change curve of the nozzle in the pulse spraying process was determined, as shown in Equation (27). By inputting the relationship between the pressure change and time into Equation (23), the total spraying volume of a single nozzle in a single pulse spraying period (4 s) was determined to be 3.597 L, and the total spraying volume of all three nozzles was determined to be 10.791 L.
P n o z z l e = 0.678 P m a x − 0.098 L n ( t )

3.2.2. Pulse Spraying Cycle and Daily Photovoltaic Water Lifting Capacity

(1)
Temporal output power of photovoltaic panel system
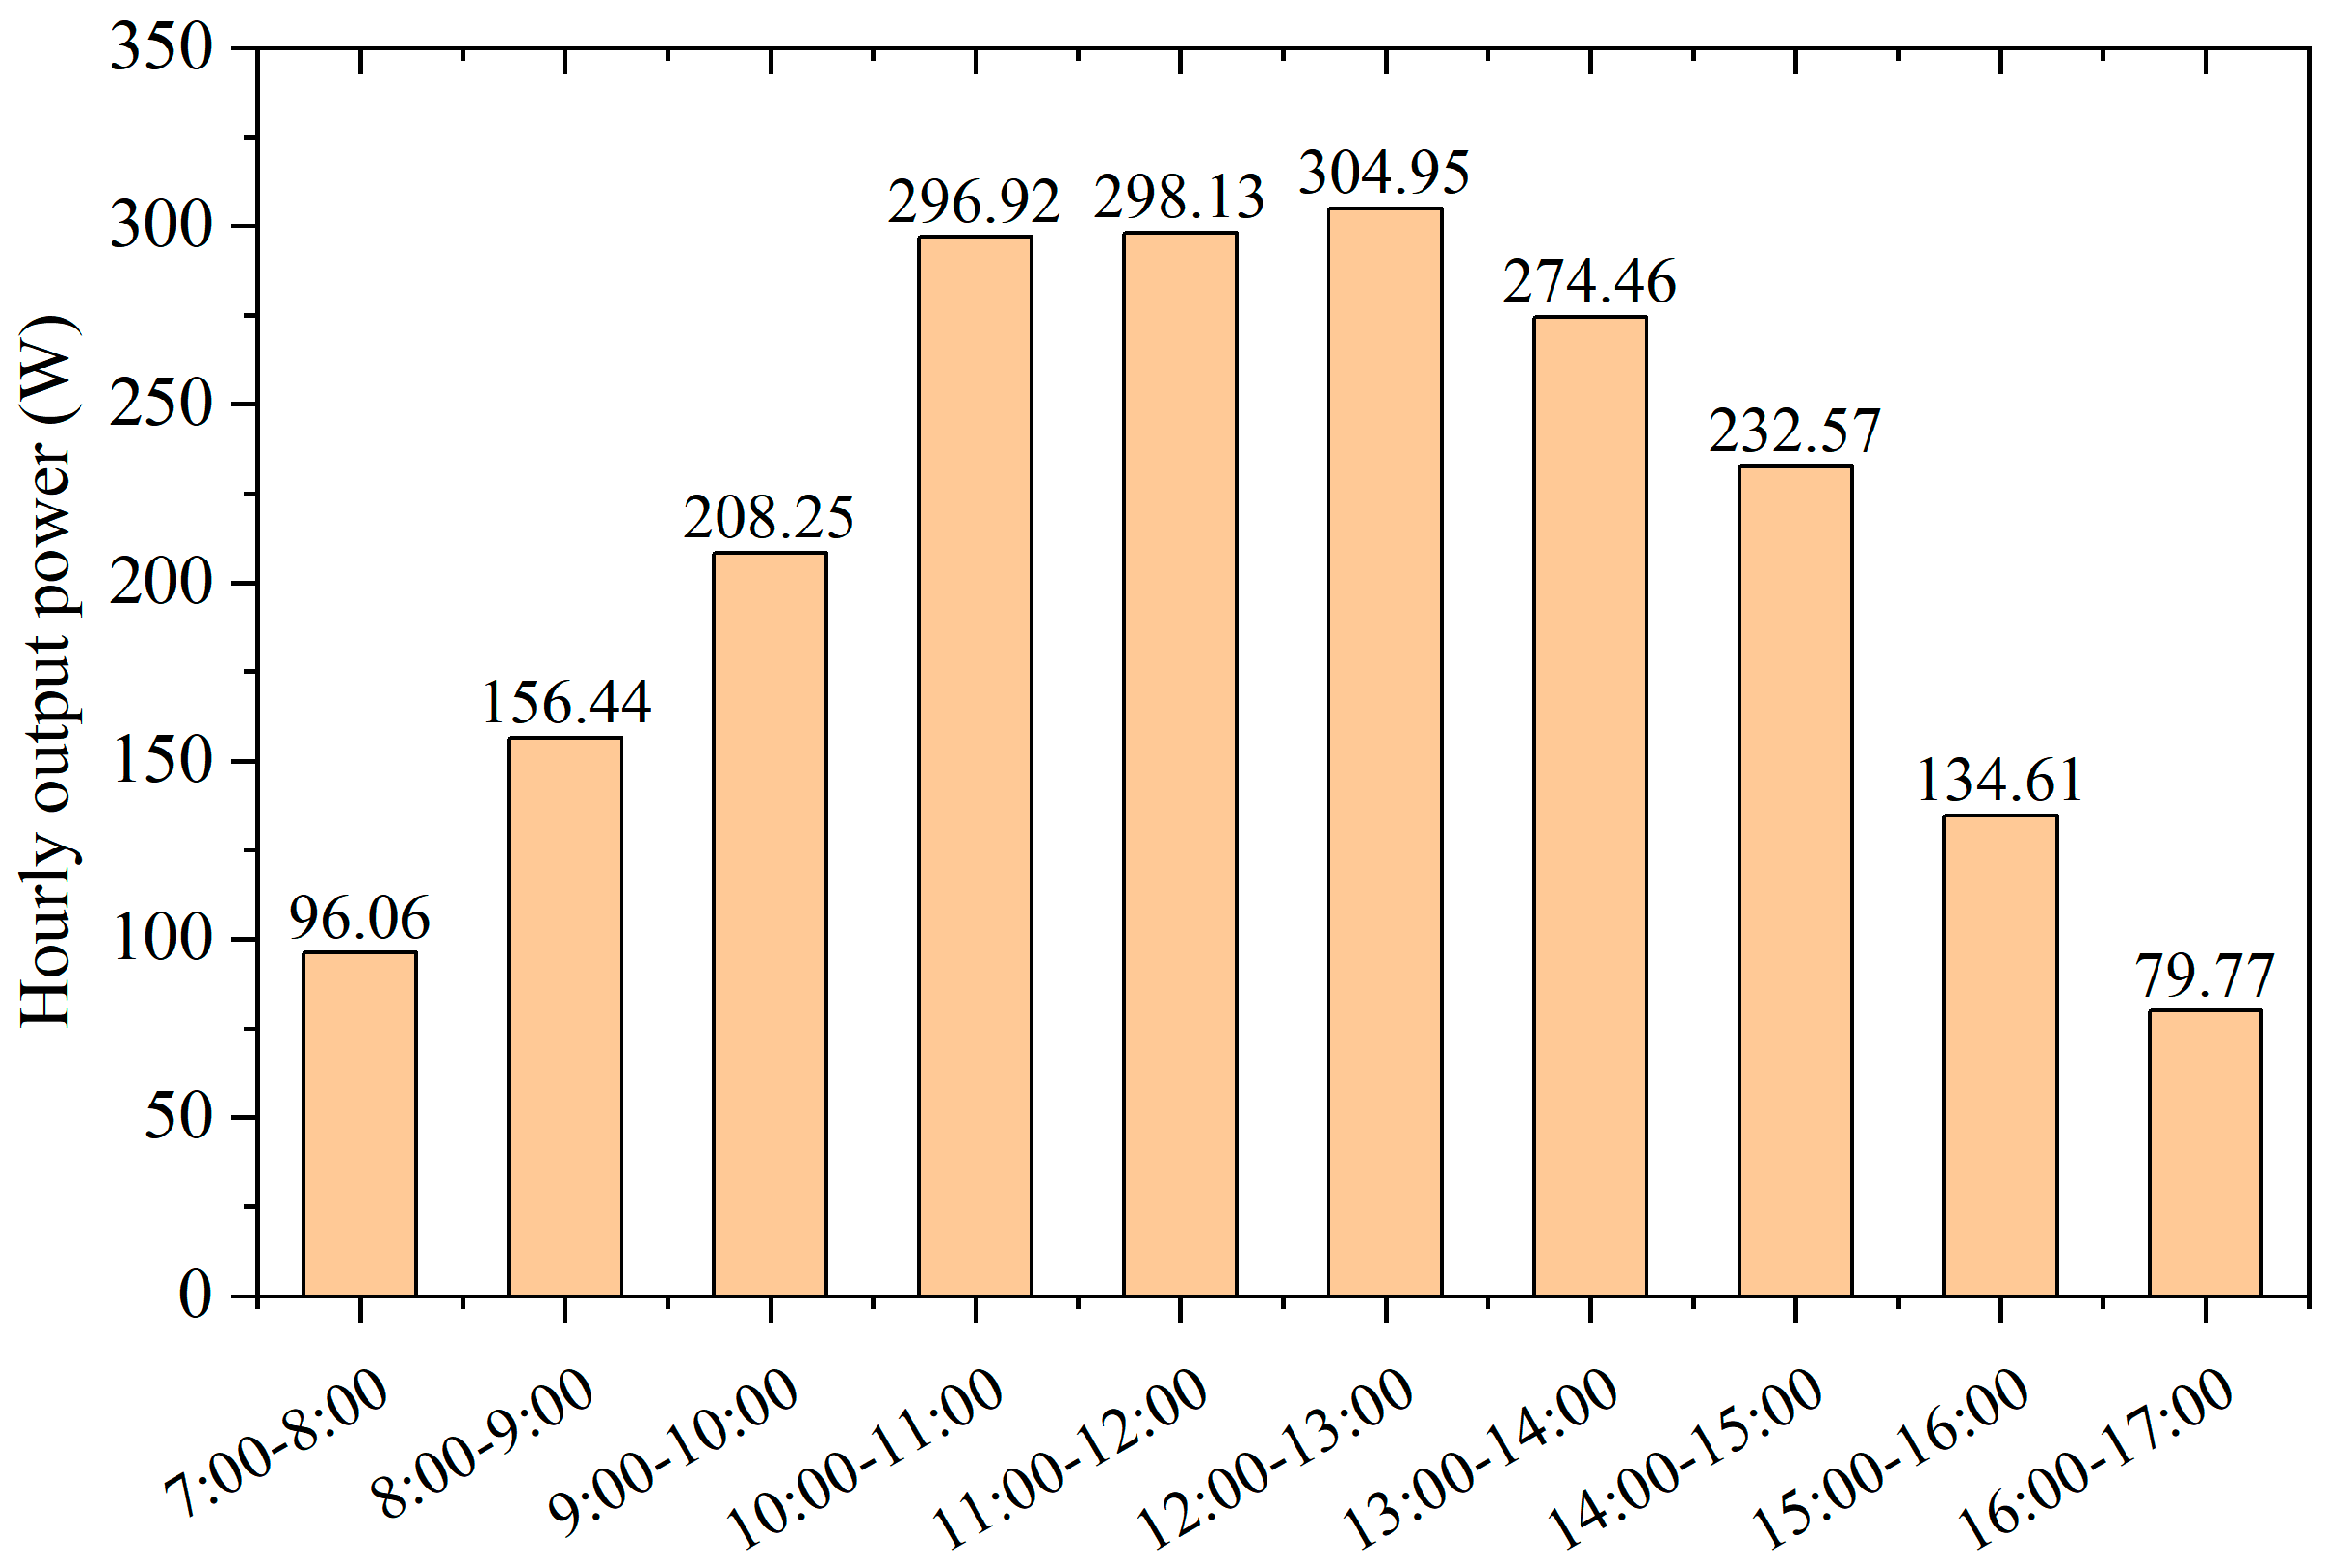
Based on the above presented photovoltaic output power calculation method, the actual output power of the photovoltaic panel under the influence of various factors (irradiance, ambient temperature, installation inclination angle, etc.) can be assessed. The following figure presents the calculated results of the hourly photovoltaic output power of a 490 W rated power solar panel (with a 30° installation inclination angle) equipped with an FYR4-350 pump on 25 June 2023. It can be observed from the figure that the photovoltaic output power exhibits a trend of increasing initially and then decreasing within a day, approximately following a parabolic distribution. The peak occurs during the 12:00–13:00 period, reaching 304.95 W. Within the 7:00–8:00 and 16:00–17:00 periods, the photovoltaic output power is both below 100 W. The periods outside of 7:00–17:00 are not included in the figure on considering that the photovoltaic output power has decreased to below 50 W. According to the suitable working power range of the FYR4-350 pump indicated in Table 1, the photovoltaic panel is unable to drive the pump to complete the energy storage and release cycle of compressed air–pulse spraying during this period.
(2)
Hourly Equivalent Flow Rate of the Pump
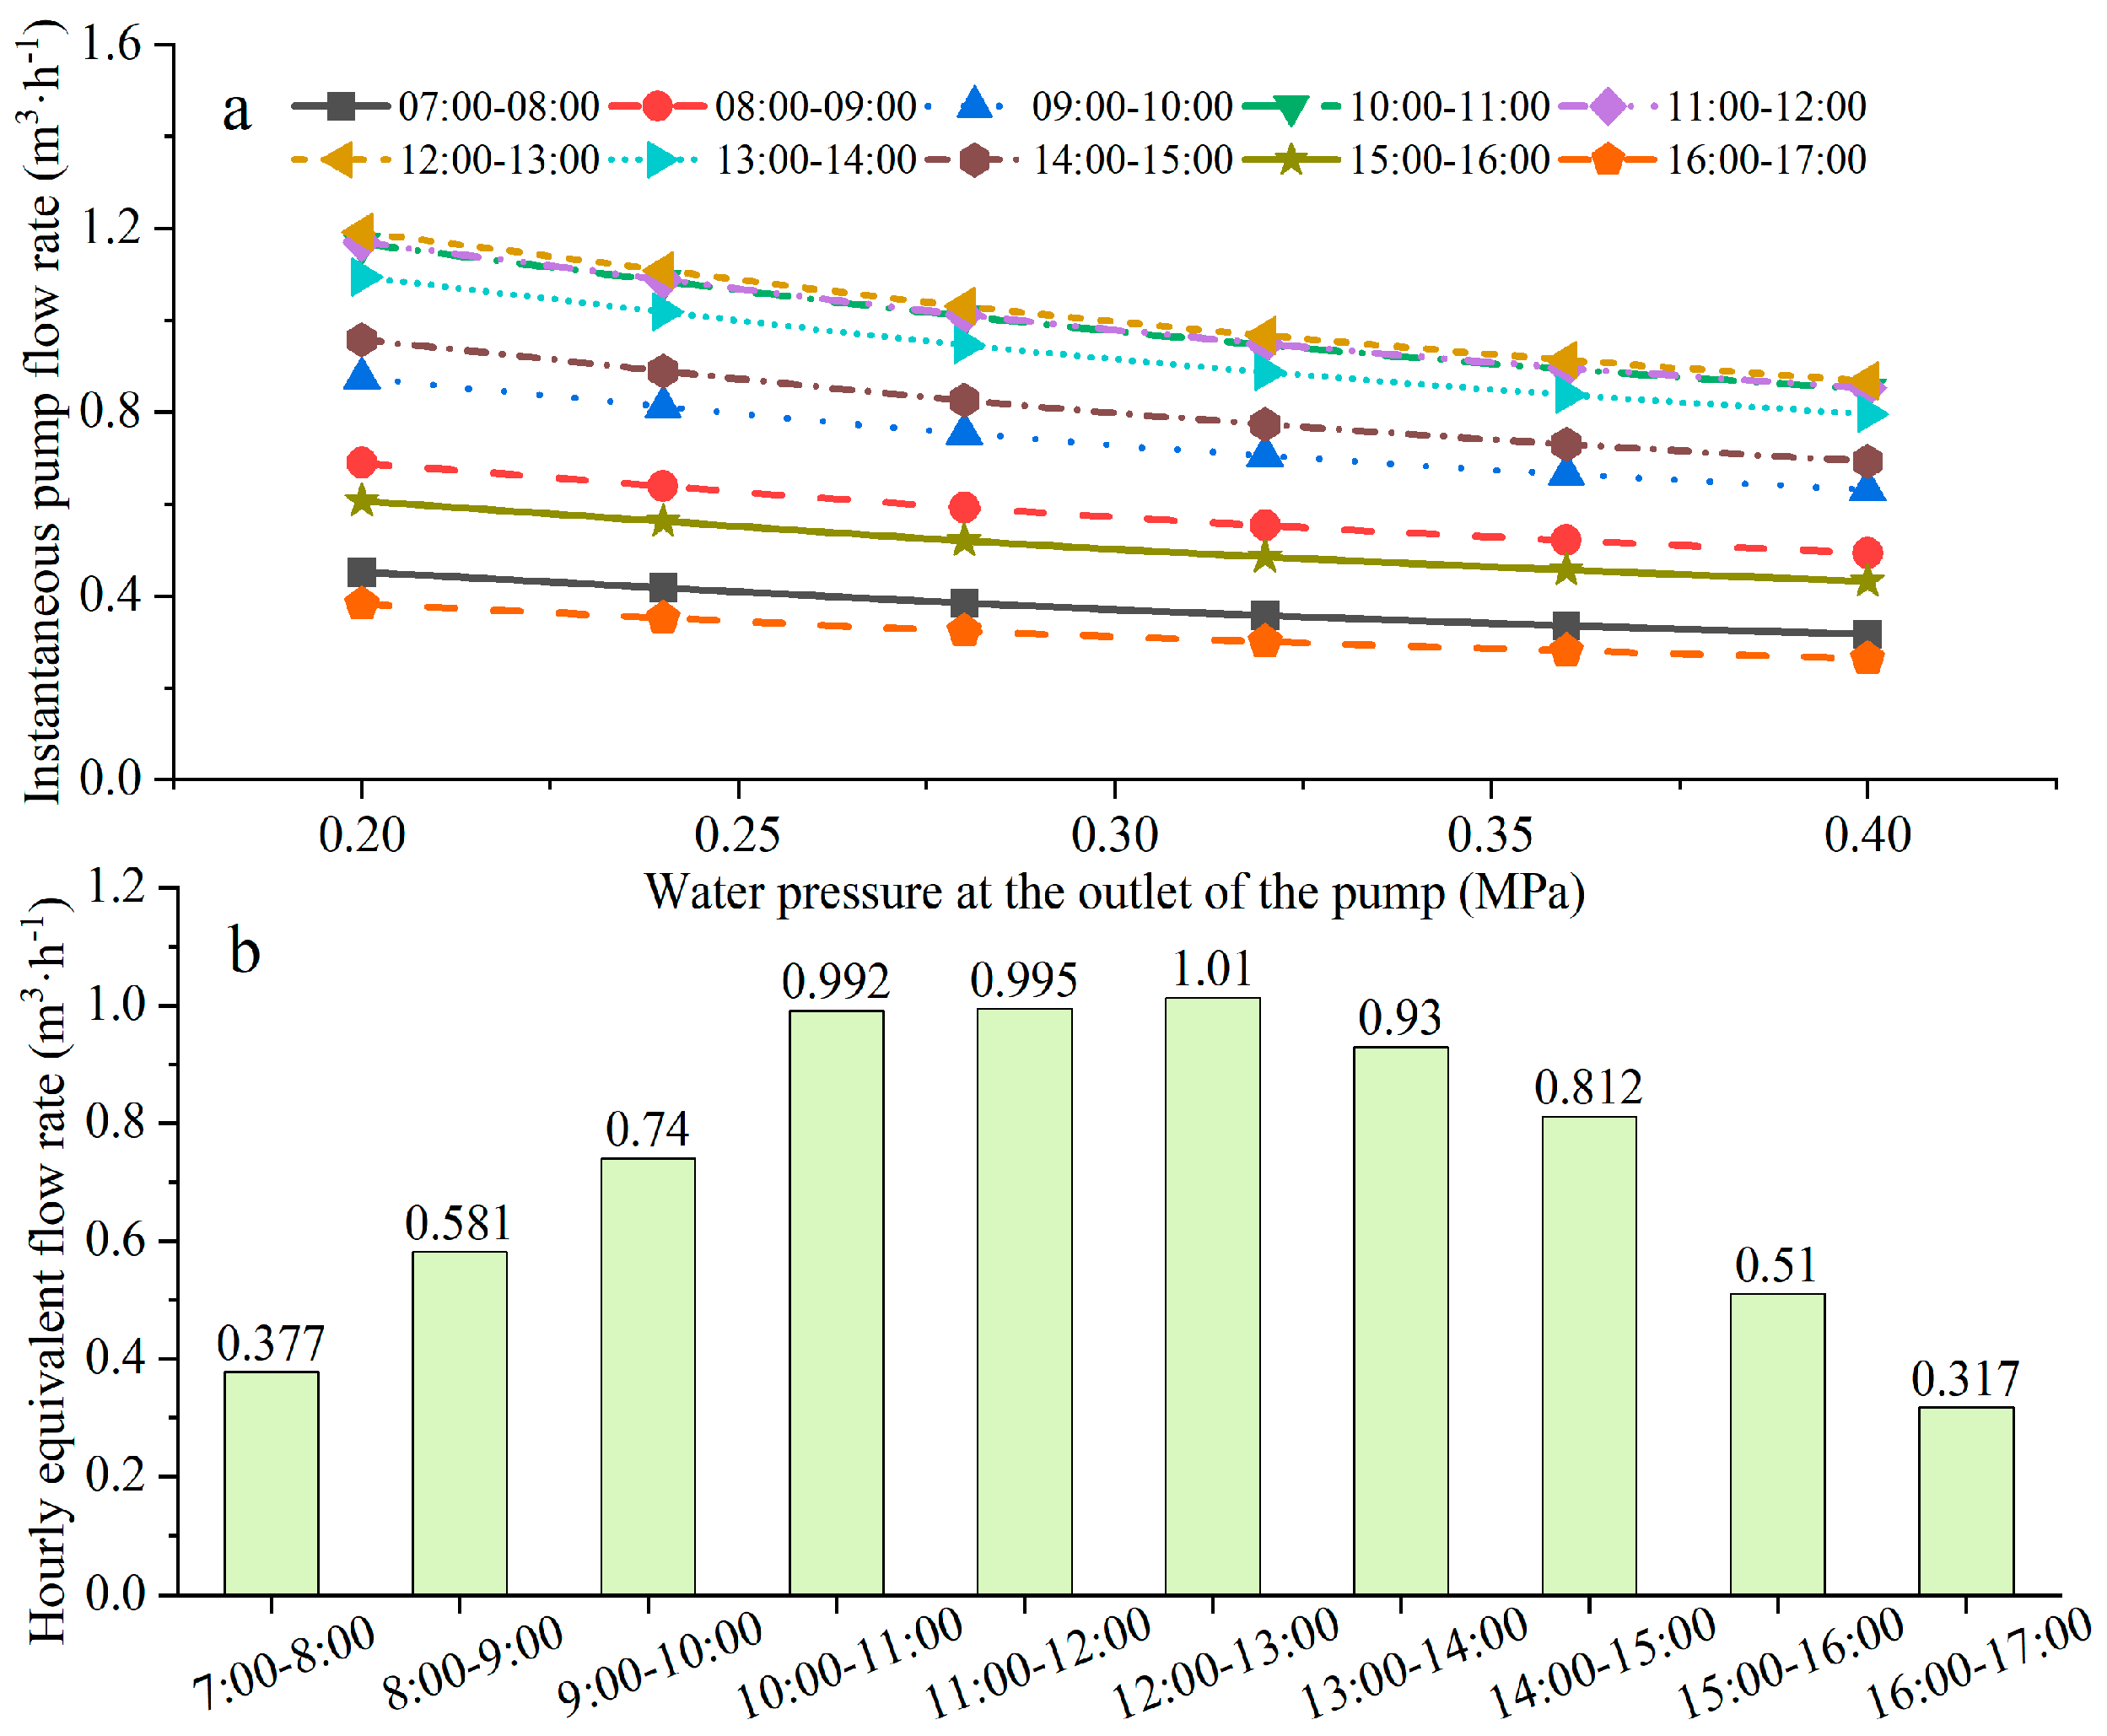
By substituting the photovoltaic output power at each time period in Figure 9 into the calculation formula of the water pump flow in Table 1, the water pump flow under different outlet pressures can be obtained, as depicted in Figure 10a. Evidently, the water pump flow exhibits significant discrepancies at different time intervals. Moreover, during the process of water pumping and compressed-air energy storage for one time, with the increase in the outlet pressure of the water pump, the water pump flow demonstrates an approximately linear downward trend. Through statistical analysis of the average flow at different outlet pressures within each time period, the variation trend of the water pumping capacity of the FYR4-350 water pump under the conditions of photovoltaic output power and outlet pressure changes is obtained, as shown in Figure 10b: The flow of this type of water pump within a day follows a normal distribution.
(3)
Pulse Spraying Cycle and Daily Photovoltaic Water Lifting Capacity
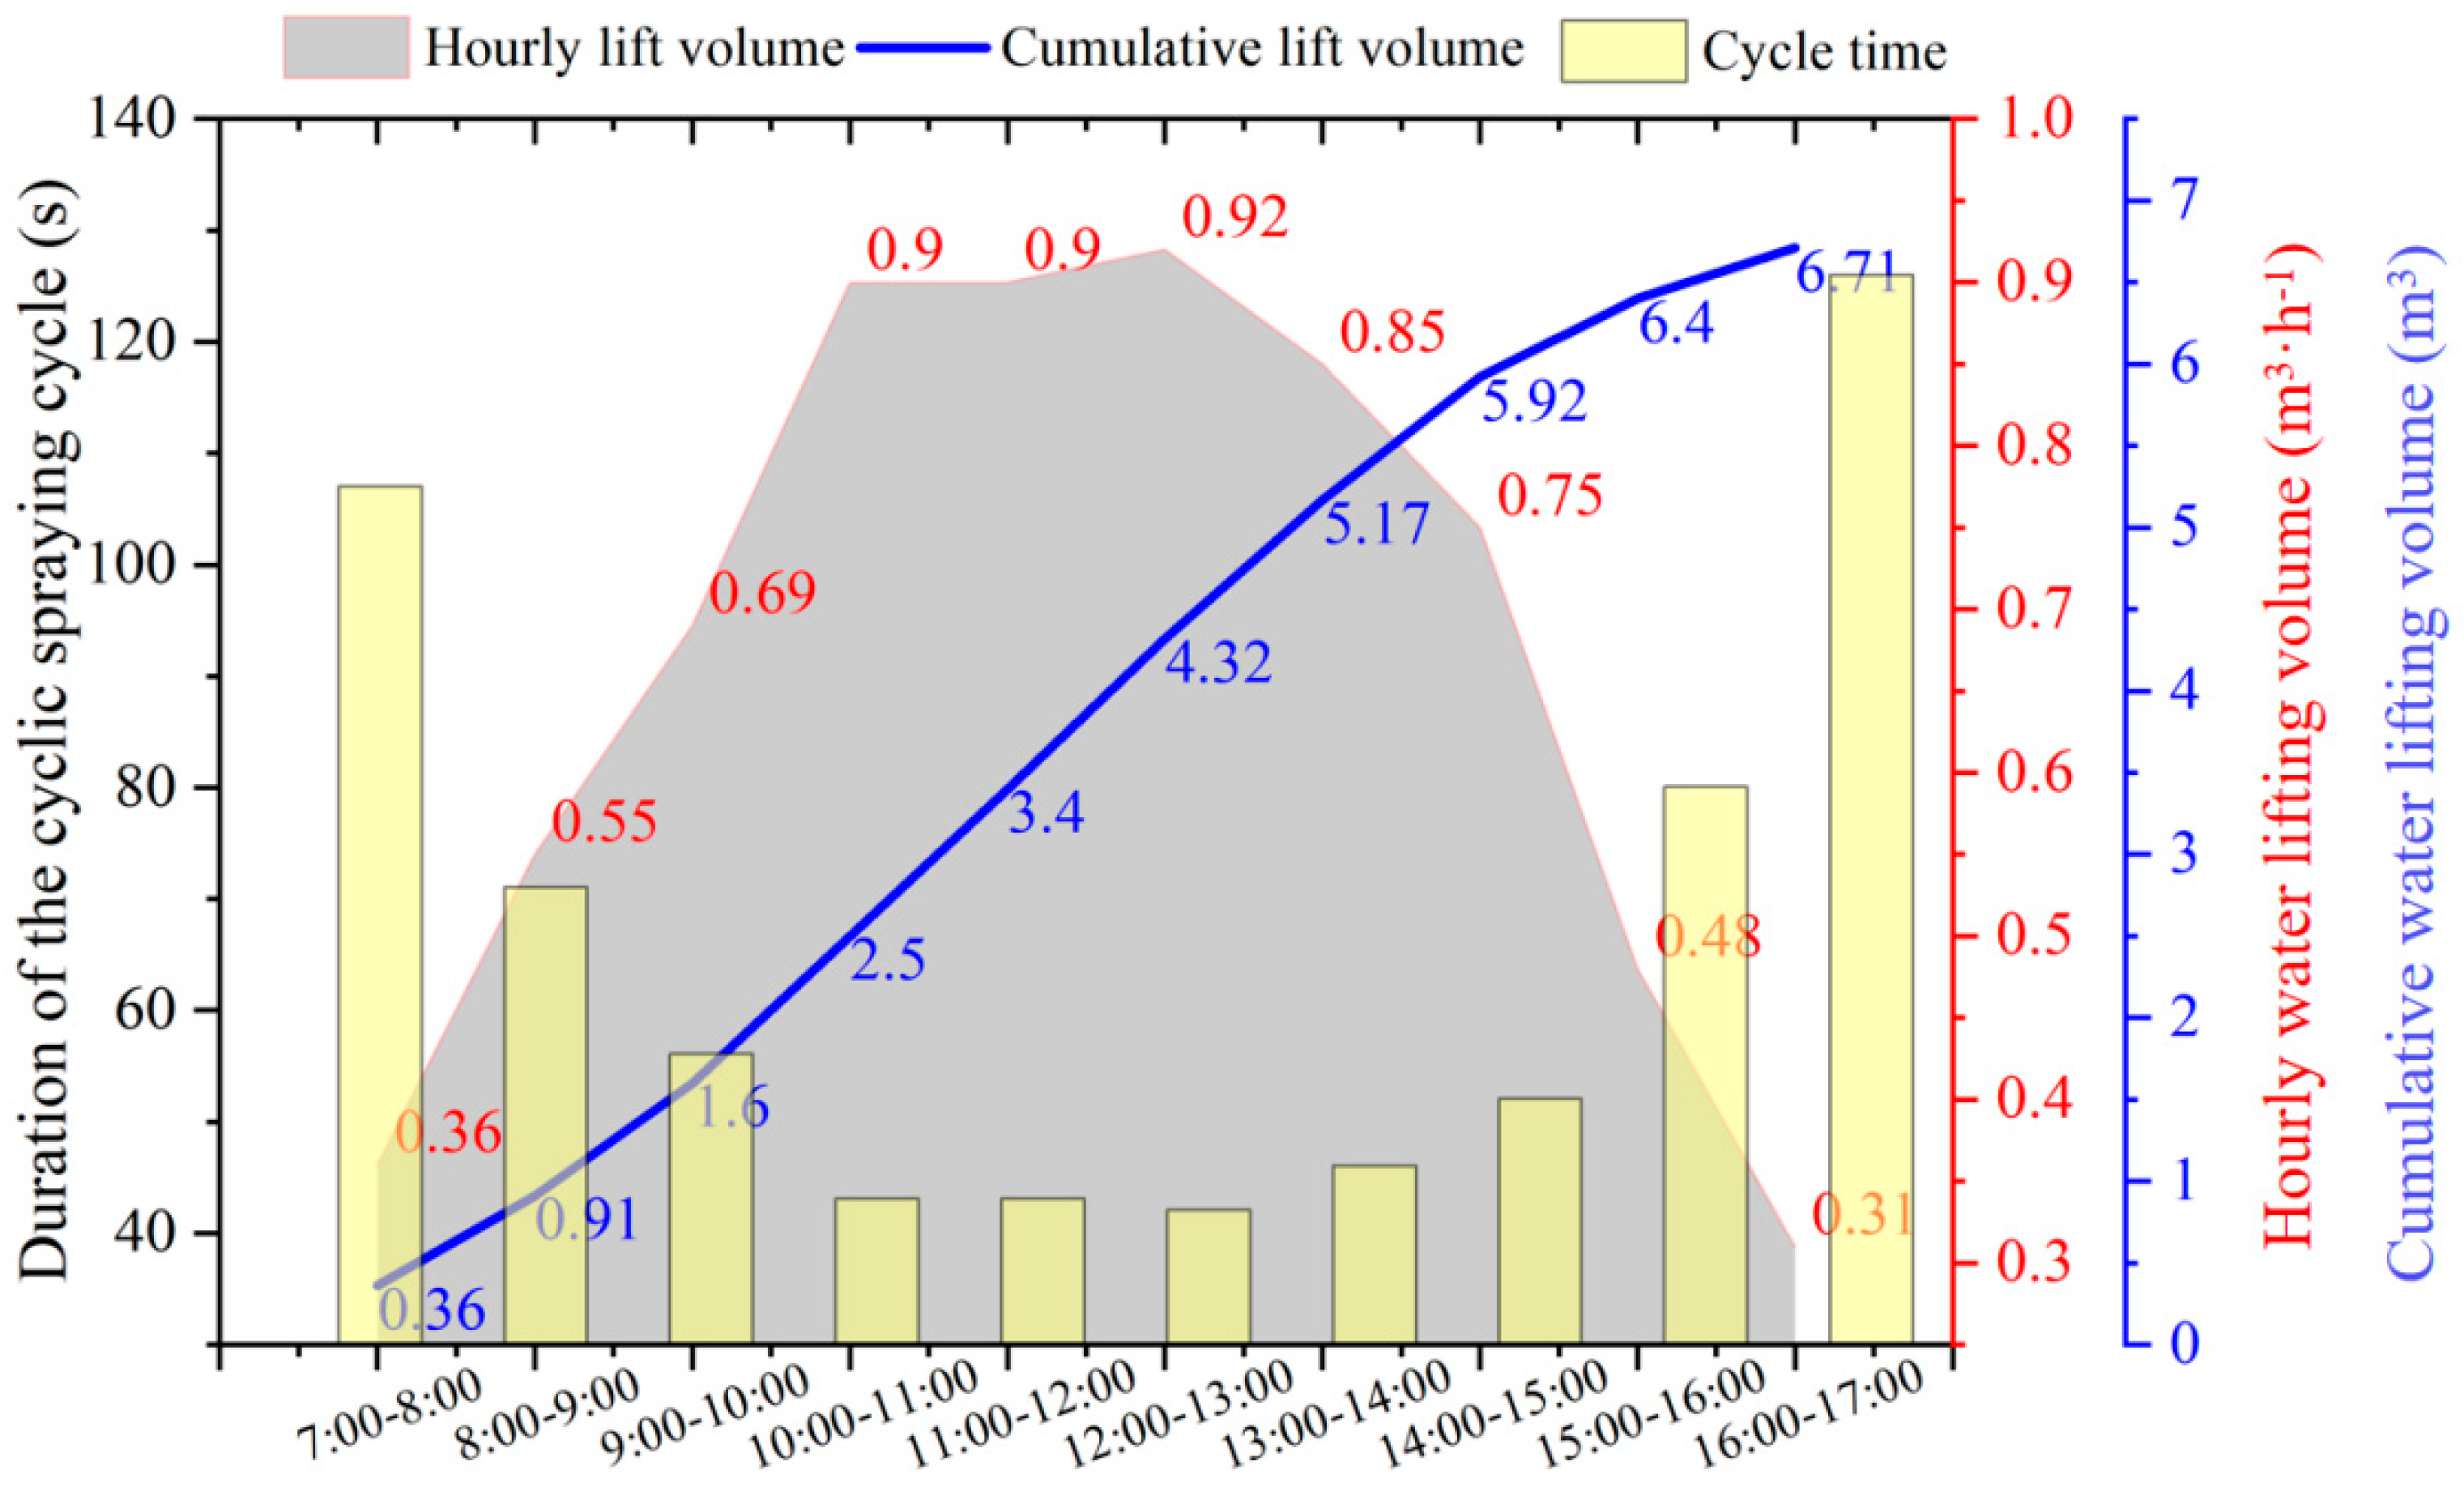
On the basis of clarifying the characteristics of the flow rate variation in the FYR4-350 pump at different times of the day, the time required to complete a cycle of pulse spraying was further calculated, as well as the photovoltaic water lifting volume at each time period and the distribution of the daily cumulative water lifting volume, as shown in Figure 11. From the perspective of the pulse spraying cycle, the time required for a complete water lifting and energy storage and pulse spraying process ranges from 42 to 126 s, among which the spraying duration is 4 s, accounting for a proportion ranging from 3.17% to 9.52% of the total duration. During the early morning and evening when the photovoltaic output power is low but still capable of meeting the starting power of the pump, the time for the pump to perform water lifting and energy storage exceeds 100 s, which implies a reduction in the number of spraying completions per unit time. As the photovoltaic output power reaches or exceeds the rated power of the pump, the pump enters a high-efficiency operation state, the time required to complete a water lifting and energy storage is shortened to approximately 40 s, and the water lifting volume per unit time increases to approximately 0.9 m3. The cumulative working hours for the entire day are 10 h, and the total water lifting volume is approximately 6.71 m3.

3.3. Case Study

Based on the hydrological yearbook data of Yangling, Shaanxi Province from 2002 to 2022, in combination with the analysis results of CLIMWAT 2.0 and CROPWAT 8.0 software, the irrigation schedule for maize in Yangling District during a typical dry year is presented in Table 3, the sowing date of corn is April 15th and the harvest date is August 17th, with the net irrigation quotas for corn cultivation in the typical dry year of 159.8 mm. Four irrigations were carried out during the entire growth period, on the 32nd, 83rd, 93rd, and 110th days after sowing, respectively, corresponding to the jointing stage (once), filling stage (twice), and maturity stage (once) of corn plants. The cumulative net irrigation quota and gross irrigation quota reached 159.8 mm and 228.3 mm, respectively. These four irrigations are all in the sensitive period of water demand for corn, which is of great significance for guaranteeing the yield of corn.
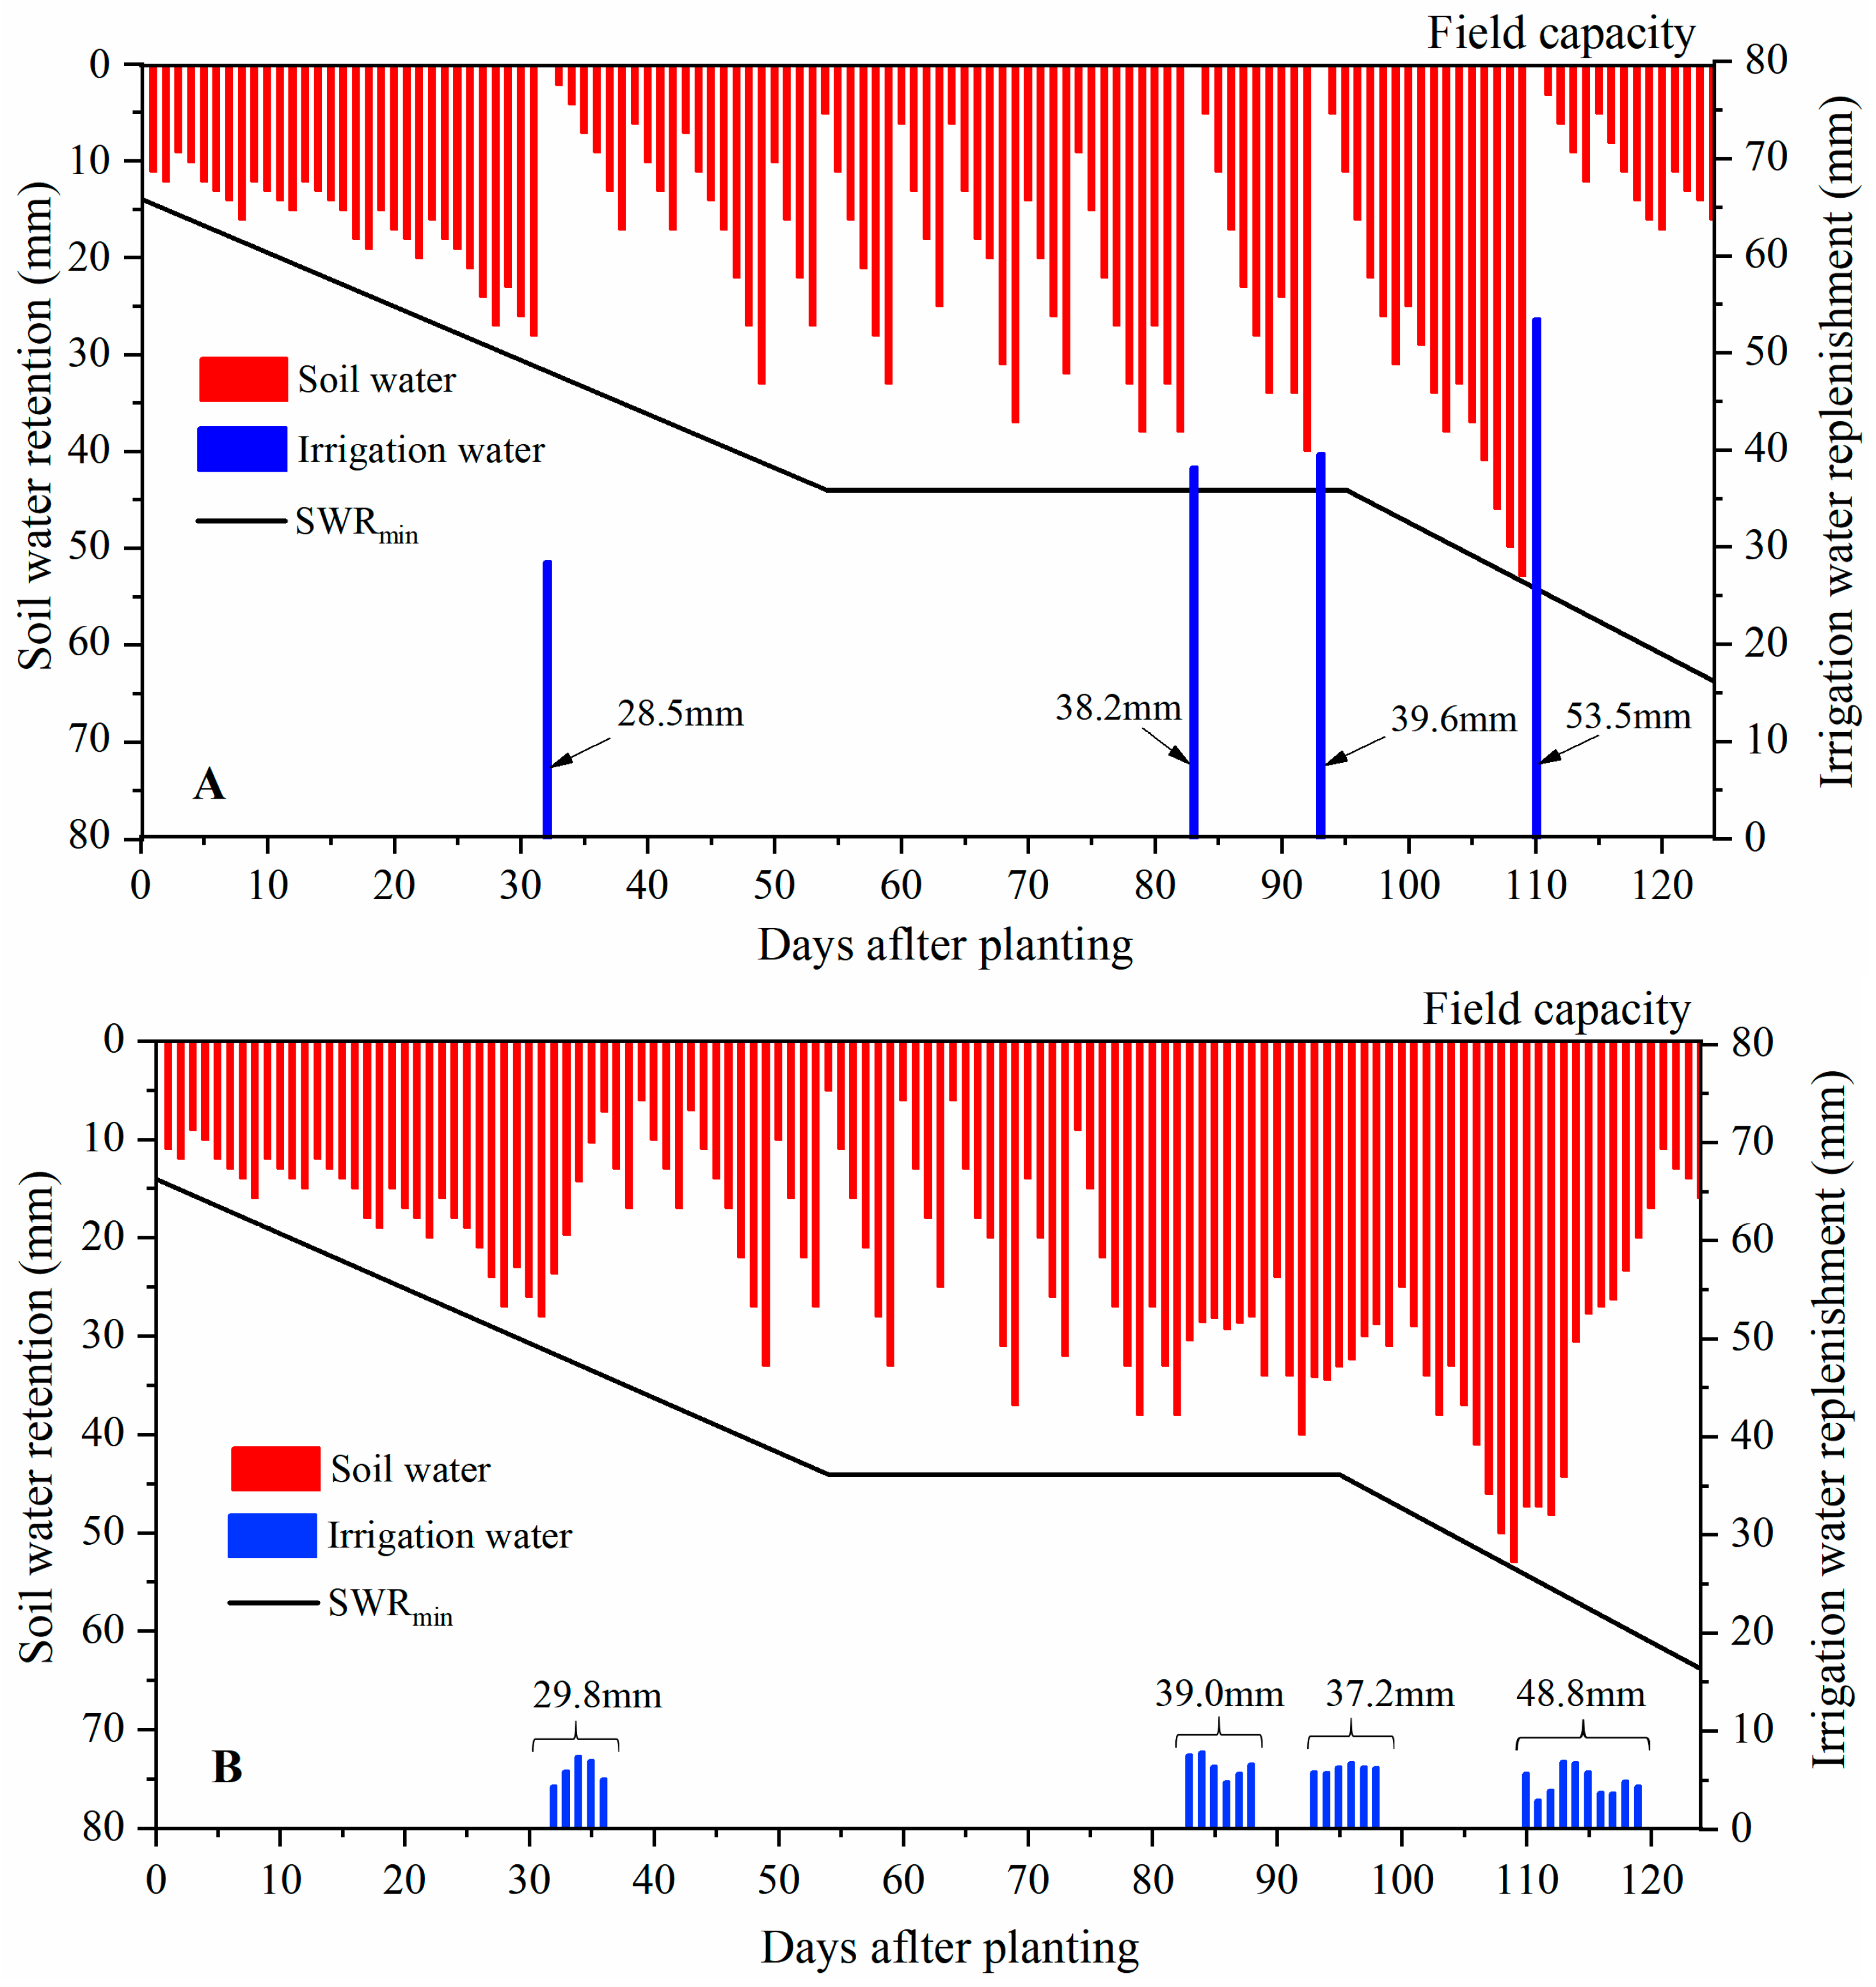
Employing the solar-coupled compressed-air cyclic pulse sprinkler irrigation device depicted in Figure 4 for photovoltaic water-lifting irrigation, and computing the sprayed water volume after triggering irrigation through the photovoltaic water-lifting capacity calculation method established in this paper, it is evident that the sprayed water volume in one day fails to meet the irrigation requirements. The irrigation quota for each time can be satisfied by appropriately prolonging the spraying days, while ensuring that the soil moisture content remains no lower than the lower limit of moisture content, as shown in Figure 12. Under the conditions of this case, the number of irrigations throughout the entire growth period remains at 4. The irrigation time for each irrigation is extended from 1 day under continuous spraying conditions to 5, 6, 6, and 10 days, respectively. The net irrigation volumes for each irrigation are 29.8, 39.0, 37.2, and 48.8 mm, respectively. The gross irrigation volumes considering the utilization coefficient of sprinkler irrigation water are 42.6, 55.7, 53.2, and 69.7 mm. The average daily irrigation volumes during the irrigation period are 8.5, 9.3, 8.9, and 7.0 mm/day, respectively. The total volume of sprinkler irrigation water throughout the entire growth period amounts to 154.9 mm (net water depth) and 221.3 mm (gross water depth), with a deviation rate from continuous sprinkler irrigation of merely 3.07%.
Judging from the available moisture within the planned moist layer of the soil, when adopting the solar-coupled compressed-air cyclic pulse sprinkler irrigation mode, the available moisture within the soil throughout the entire growth period is greater than the allowable minimum water storage volume. Different from the traditional continuous sprinkler irrigation mode, where the soil moisture content rapidly rebounds to the field capacity after a single sprinkler irrigation, in this mode, the soil moisture content exhibits a slow increase trend after the initiation of sprinkler irrigation, reflecting the operational characteristics of the photovoltaic sprinkler irrigation system regulated by solar-coupled compressed-air energy storage: through actively regulating solar energy with compressed-air energy storage, it meets the quality requirements of sprinkler irrigation water; by extending the duration of a single irrigation to utilize sufficient solar energy, it meets the total irrigation water demand of the crops.
This study enumerated the system components necessary for achieving 1-hectare sprinkler irrigation in this case (Table 4), encompassing water-air tanks, solar panels, control modules, pipes, and connectors, etc., and computed the costs associated with the system. Based on the service life of each component, they were converted into equivalent annual costs. The results indicated that the total system investment required for completing 1-hectare irrigation was 3610 $/ha (excluding labor costs), and the equivalent annual cost was 458 $/ha, which was essentially comparable to the per-mu investment of traditional sprinkler irrigation. Specifically analyzed, on the one hand, the input of water-air tanks and solar panels augmented the system investment, with these two components accounting for 52.5% of the total system investment. On the other hand, as the flow rate of this system was significantly lower than that of traditional continuous sprinkler irrigation, the required pipe diameter was notably reduced, thereby reducing the overall investment. Furthermore, during the operation of this system, there was no consumption of electricity or fossil energy, and no greenhouse gas emissions. The application of this technology in areas with scarce energy resources will bring about remarkable benefits in crop yield increase. Simultaneously, with the continuous reduction in the cost of solar panels in the international market and the further enhancement of photovoltaic conversion efficiency, this system will demonstrate stronger economic advantages.

4. Discussion

4.1. The Water Extraction Characteristics of CAES-SPSI Irrigation System

Existing studies on the water-lifting characteristics of photovoltaic systems tend to focus on the variation in water pump flow rate under the single factor of photovoltaic output [39]. This study, however, discusses the characteristics of changes in water pump outflow under the combined effect of photovoltaic output power and the changes in water pump outlet pressure caused by compressed air. Furthermore, for three commonly used DC diaphragm pumps with power ratings of 160 W, 350 W, and 500 W, a calculation formula for water pump flow rate is established, which can be used to evaluate the water-lifting capacity of the CAES-SPSI irrigation system. Simultaneously, unlike the static pressure model proposed by Chahartaghi and Hedayatpour [40] in the directly coupled photovoltaic solar water pump system, this study discloses the influence of environmental factors on the photovoltaic output characteristics, as well as the variation law of the water pump outlet pressure caused by changes in compressed air during the photovoltaic water lifting process, and constructs a calculation model between the photovoltaic output power and the water pump outlet pressure, thereby providing a universal approach for quantifying the changes in the water pump flow rate and accurately depicting the photovoltaic water lifting and compressed-air energy storage processes in different operation scenarios.
In addition, most existing studies have investigated the pressure loss of nozzles under constant pressure, or merely described phenomena such as flow rate under pulse pressure without providing specific methods, making it difficult to reflect the instantaneous pressure fluctuation law under pulse conditions [41]. To illuminate the process of energy release and pulse spraying, this study introduced the notions of pressure loss coefficient and pressure drop coefficient to mirror the variation characteristics of the working pressure of the nozzle during the spraying process. Through methods such as experimental calibration and trial calculation, a model for the dynamic change process of the nozzle’s working pressure was established, thereby deriving the water volume of a single pulse spraying during the energy release process. In combination with the variation characteristics of the water pump flow during the process of water lifting and compressed air, the frequency of pulse spraying completed within a unit time was further clarified, and based on this, the cyclic pulse period and the daily photovoltaic water lifting capacity under the water-energy coupling were obtained.
This study, with a focus on the production scenario, we further assessed the matching degree between the water lifting characteristics of the solar-coupled compressed-air cycle pulse irrigation system and the water demand characteristics of crops throughout their entire growth period. It was discovered that during the critical period of crop water demand, the CAES-SPSI system adopted a “low intensity-long duration” irrigation mode by prolonging the irrigation time, this is in sharp contrast to the traditional photovoltaic irrigation model of “high intensity-short time”, the latter is prone to cause sudden rises and falls in soil moisture, while this mode significantly extends the water supply duration through energy storage regulation [12], thereby fully exploiting solar energy for energy supply over a longer time span, ensuring the invariance of the total irrigation water volume and constantly maintaining the soil moisture content within the range suitable for crop growth.

4.2. The Applicability Analysis of the CAES-SPSI Irrigation System

Solar energy, which is an easily accessible clean energy, is increasingly being used in irrigation fields [42], playing an important role in ensuring food production, improving the dietary structure of small farmers in remote areas and enhancing people’s well-being, and promoting the UN 2030 Sustainable Development Goals [43]. At the same time, it also shows significant advantages in energy saving and emission reduction. It is generally believed that in clear weather conditions, photovoltaic pumps can extract more water, while the crops’ demand for water is also high, which is consistent with the trend of photovoltaic irrigation systems [39,44]. However, it cannot be denied that the instability of solar photovoltaic power output and the mismatch between the flow rate of photovoltaic water extraction and the demand of irrigation system will lead to serious uneven spraying and insufficient irrigation water problems, which has become the main obstacle to the development of photovoltaic water pumping irrigation [45]. Most existing studies have alleviated this problem by optimizing the capacity configuration of photovoltaic panels or introducing battery energy storage [46], but the former increases equipment costs, while the latter has limitations such as short battery life and complex maintenance. Therefore, how to solve the pressure adaptability problems, the problems of different scale power combination, and the adaptability to the water demand of crops in the process of combining photovoltaic water pumping technology with irrigation systems, requires in-depth and systematic research [47,48].
The main contribution of this research lies in targeting the new type of solar-driven water-saving irrigation method, namely the solar-coupled compressed-air cycle pulse sprinkler irrigation, based on the solar-coupled compressed-air active energy storage regulation technology proposed by Zhang [15]. It has further achieved the prediction of the outflow characteristics of the photovoltaic water pump system under the joint action of meteorological factors and air pressure potential energy, and evaluated the photovoltaic water lifting capacity of the CAES-SPSI system and its adaptability to the water demand patterns of crops. Thus, it has provided a design basis for the technical reliability and economic feasibility of the application of CAES-SPSI in production. Unlike the photovoltaic water pump outflow model based only on meteorological factors in Ziane [49], this study incorporates the dynamic changes in barometric potential energy into the coupled analysis framework for the first time, thereby providing a design basis for the technical reliability and economic feasibility of the application of CAES-SPSI in production. Compared with the single performance evaluation of traditional photovoltaic irrigation systems, such as only focusing on the daily water pumping volume [4], the dual-index evaluation system of “water lifting capacity-water demand matching degree” established in this study is more in line with the actual production needs.
According to the research findings of Santra [4], when low-power photovoltaic systems are employed to separately drive direct current (DC) water pumps and alternating current (AC) water pumps for photovoltaic water lifting irrigation, the operational duration of the DC irrigation system within a day is longer than that of the AC irrigation system. However, the AC irrigation system is capable of attaining a higher operating pressure compared to the DC irrigation system. The two irrigation systems exhibit distinct technical merits and demerits. Evidently, in the conventional photovoltaic water lifting irrigation approach, when the system is utilized for sprinkler irrigation or other irrigation systems demanding a higher water head (typically above 0.2 MPa), it might be inevitable to resort to AC water pumps, which entails the addition of an inverter and the sacrifice of the daily operational time of the irrigation system. In the CAES-SPSI system, by adopting small-flow and high-lift DC water pumps in conjunction with the active energy storage and regulation technology of solar-compressed air, the upper limit of the irrigation working pressure can reach above 0.5 MPa, being capable of readily accommodating the water head requirements of different types of irrigation systems. Moreover, the daily operational time of the system can exceed 10 h. It is more than 40% longer than the average operating time of 6 to 7 h of photovoltaic systems recorded by Sontake [50], demonstrating remarkable technical flexibility and adaptability.
When evaluating the water-lifting capacity of photovoltaic water pumps, Santra demonstrated using experiments that the flow rate of the water pump decreases as the working head rises, while it increases with the increase in irradiation intensity. He also established a flow rate calculation formula that comprehensively considers both irradiation intensity and working head (Equation (28) [4]. Nevertheless, from the perspective of the CAES-SPSI system, this result still has deficiencies. Firstly, the variation trend of horizontal irradiation intensity fails to reflect the influences of installation angle, ambient temperature, and other factors on the output power of the photovoltaic panel [51]. Secondly, the change rule of the outlet pressure of the water pump during the process of compressed-air energy storage is not reflected. The photovoltaic water pump flow rate calculation method proposed in this study takes more factors into account and has higher calculation accuracy.
Q ( l p m ) = 68.23 * * + 0.16 * * × J ( W m − 2 ) − 9.41 * * × H m R 2 = 0.75

4.3. Future Research Directions and Limitations of This Study

This study ensures that the total amount of photovoltaic water lifting fulfills the irrigation requirement. However, under the small-intensity and long-duration sprinkler irrigation conditions of the CAES-SPSI system, the disparity between the advancement of the soil moisture peak and high-intensity continuous spraying, as well as the resulting spatiotemporal characteristics of soil moisture distribution, remain to be further clarified. Disentangling these aspects is of considerable significance for guiding the efficient operation of the CAES-SPSI sprinkler pattern and aligning it with the root distribution range of crops during different growth periods. Consequently, subsequent studies can be carried out through indoor soil tank experiments in combination with numerical simulation methods. Additionally, the long-duration and low-intensity sprinkler irrigation may exert a sustained influence on the microclimate of the crop canopy and the microenvironment of the root zone soil, thereby altering the temperature gradient and water potential gradient in farmland. These alterations will potentially impact the “air-soil-crop” continuum as well as the respiration and evapotranspiration of crops, which have not been adequately explored and warrant further research efforts in this regard. Notably, future investigations should also integrate economic analyses (such as cost–benefit assessment of different irrigation methods) and environmental impact evaluations (such as carbon footprint of the system and effects on soil biodiversity) to achieve a more comprehensive optimization of the CAES-SPSI system.
In this study, photovoltaic water pumping characteristic tests and evaluations were only carried out for three common types of small-power direct current water pumps available on the market. However, the proposed computational framework and method have universal reference value. For other types of water pump and nozzle systems, adaptive adjustments and calculation applications can be carried out based on the methodological approach established in this paper. Based on our research experience, small-flow and high-head direct current water pumps demonstrate more superior economic performance in the CAES-SPSI system. Furthermore, since the CAES-SPSI system cannot be initiated and operated during consecutive cloudy days or at night, the assessment of the irrigation water supply guarantee rate should be conducted in accordance with different influencing scenarios during the design process to meet the actual water demand. When necessary, the use of storage batteries or fossil energy as emergency reserve energy sources could be considered, or the exploration of adopting complementary supply patterns of multiple clean energy sources such as wind power and photovoltaic power could be pursued.

5. Conclusions

To facilitate the application of the solar-coupled compressed-air pulse cyclic sprinkler irrigation system, this paper conducted experimental and theoretical studies on the outflow characteristics of the photovoltaic water pump system under the combined effect of meteorological factors and air pressure potential energy. It profoundly reveals the adaptability of the photovoltaic water-lifting characteristics to the water demand pattern of crops, in order to ensure the reliability of the water supply of the solar sprinkler irrigation system. The main research conclusions are as follows:
(1) The flow variation law of a specific water pump under the combined effect of photovoltaic output power and outlet back pressure was clarified. A dynamic flow calculation model was established, and a quantitative calculation method for photovoltaic power and pump outlet back pressure was proposed. The calculation deviation of the model was less than 9.24%, providing support for the precise prediction of the system’s lift flow.
(2) The pressure loss coefficient and pressure drop coefficient are introduced to reveal the variation law of the nozzle working pressure in pulse cycle sprinkler irrigation. A dynamic model of nozzle pressure based on experimental calibration and iterative trial calculation is established. From this, the spray water volume of the nozzle under any pulse jet working condition can be obtained.
(3) Taking the FYR4-350 water pump as the typical research object, the water-lifting performance of the CAES-SPSI system was clarified: the continuous operation time per day could reach 10 h, the hourly water-lifting capacity range was 0.317–1.01 m3/h (normal distribution), and the cumulative daily water-lifting volume reached 6.71 m3, verifying the stable water-lifting capacity of the system.
(4) Field examples of corn show that the CAES-SPSI system ADAPTS to the water requirements of crops through the irrigation mode of “low intensity-long duration”. By extending the operation time to fully utilize solar energy, the total irrigation water volume is kept constant, and the soil moisture content is continuously maintained within the suitable range for crops, highlighting the adaptability of the system’s water-lifting performance to the actual irrigation demands.

Author Contributions

Conceptualization, X.Z.; Data curation, X.Z.; Formal analysis, X.Z., Z.T. and P.W.; Methodology, X.Z.; Writing—original draft, X.Z.; Funding acquisition, M.G.; Project administration, M.G.; Supervision, M.G.; Writing—review and editing, M.G., Z.T., P.W., X.H., Q.Z. (Qianwen Zhang), Q.Z. (Qingyan Zhang) and K.S.G.; Supervision, Q.Z. (Qianwen Zhang); Resources, Q.Z. (Qingyan Zhang). All authors have read and agreed to the published version of the manuscript.

Funding

This work was supported by the Special project of scientific and technological innovation of Xinjiang Research Institute of Arid Area Agriculture (XJHQNY-2025-3), the National Natural Science Foundation of China (52279045) and the National Key Research and Development Program of China (2025YFE0104600).

Data Availability Statement

The original contributions presented in this study are included in the article. Further inquiries can be directed to the corresponding author.

Conflicts of Interest

We declare that we have no financial and personal relationships with other people or organizations that can inappropriately influence our work; there is no professional or other personal interest of any nature or kind in any product, service and/or company that could be construed as influencing the position presented in, or the review of, the manuscript entitled ‘The Water Lifting Performance of a Photovoltaic Sprinkler Irrigation System Regulated by Solar-Coupled Compressed-Air Energy Storage’.

Nomenclature

SymbolUnitMeaning
a the pressure loss coefficient
b the pressure drop coefficient
αin degreesthe solar zenith angle
CθW/m2the diffuse irradiance around the sun on the tilted surface
DHw/m2the diffuse radiation of horizontal solar panels
DθW/mthe diffuse irradiance on the tilted surface2
F the force exerted on the water
FT−0.0037/°Cthe temperature factor
GHw/m2the horizontal surface solar radiation
GstcKW/m2the standard irradiance
GθW/mthe total global irradiance on the tilted surface
i°the angle of incidence of the sun vector with the plane normal
IHw/m2the direct irradiance on the horizontal surface
IθW/m2the direct irradiance on the tilted surface
JθW/m2the ground reflection irradiance on the tilted surface
m, n Fitting coefficient
mi, mi−1gthe initial and final weights of the water vapor tank at the commencement and conclusion of the i-th time unit
nmolthe number of moles of gas
ni the number of spraying cycles in the i-th time period
NOCT°Cthe normal operating temperature of the cell panel
P0Pathe initial pressure of the gas inside the tank
PnPathe air pressure inside the tank at time n
Pmaxkpathe peak pressure in the water-air tank
Pnozzlekpanozzle pressure
PpvWthe output power of the solar array under standard conditions
Ppv,genWthe actual output power of the solar panel
PSkpaWorking pressure of nozzle
PTkpaWorking pressure of the water-air tank
q0m3/sthe average flow rate of the pump in the first interval
qim3/hthe i-th time unit segment
RJ/(mol·K)the molar gas constant
TKthe temperature
t ¯ sthe pumping process into several equal time intervals
t1sthe duration of a pulse spray
Δtsthe duration of the time unit
Tamb°Cthe ambient temperature
Tcell°Cthe operating temperature of the solar cell
tisthe duration of the pulse spraying cycle in that period
Tstc°Cthe standard temperature
V0m3the initial gas volume inside the tank
Vwm3the volume of water ejected from the water tank
Vnm3the air volume inside the tank at time n
Vminm3The minimum volume of air in the tank
WJduring the infinitesimal work process of air expansion, the expansion work exerted by the air on the outside
ρ g/cm3the density of water
ρ 0 0.15the average ground reflection coefficient

References

  1. Pardo, M.; Manzano, J.; Valdes-Abellan, J.; Cobacho, R. Standalone direct pumping photovoltaic system or energy storage in batteries for supplying irrigation networks. Cost analysis. Sci. Total Environ. 2019, 673, 821–830. [Google Scholar] [CrossRef] [Scilit] [PubMed]
  2. Khatib, T.; Saleh, A.; Eid, S.; Salah, M. Rehabilitation of Mauritanian oasis using an optimal photovoltaic based irrigation system. Energy Convers. Manag. 2019, 199, 111984. [Google Scholar] [CrossRef] [Scilit]
  3. Ahmed, H.F.; Helgason, W. Reliability model for designing solar-powered center-pivot irrigation systems. Trans. ASABE 2015, 58, 947–958. [Google Scholar] [CrossRef] [Scilit]
  4. Santra, P. Performance evaluation of solar PV pumping system for providing irrigation through micro-irrigation techniques using surface water resources in hot arid region of India. Agric. Water Manag. 2021, 245, 106554. [Google Scholar] [CrossRef] [Scilit]
  5. Li, D.; Zhu, D.; Ge, M.; Wu, S.; Wang, R.; Wang, B.; Wu, Y.; Yang, Y. Optimal configuration and field experiments for photovoltaic generation system of solar-powered Hose Drawn traveler. Trans. ASABE 2019, 62, 1789–1801. [Google Scholar] [CrossRef] [Scilit]
  6. Rezk, H.; Abdelkareem, M.A.; Ghenai, C. Performance evaluation and optimal design of stand-alone solar PV-battery system for irrigation in isolated regions: A case study in Al Minya (Egypt). Sustain. Energy Technol. Assess. 2019, 36, 100556. [Google Scholar] [CrossRef] [Scilit]
  7. Burney, J.; Woltering, L.; Burke, M.; Naylor, R.; Pasternak, D. Solar-powered drip irrigation enhances food security in the Sudano-Sahel. Proc. Natl. Acad. Sci. USA 2010, 107, 1848–1853. [Google Scholar] [CrossRef] [Scilit]
  8. Yuan, S.Q.; Li, H.; Wang, X.K. Status, problems, trends and suggestions for water-saving irrigation equipment in China. J. Drain. Irrig. Mach. Eng. 2015, 33, 78–92. (In Chinese) [Google Scholar] [CrossRef]
  9. Jan, S.; Andreas, H. Solar Powered Irrigation Systems (SPIS). Technology, Economy, Impacts; GIZ: Bonn, Germany, 2020; pp. 83–85. [Google Scholar]
  10. Ge, M.S.; Wu, P.T.; Zhu, D.L.; Zhang, L. Analysis of kinetic energy distribution of big gun sprinkler applied to continuous moving hose-drawn traveler. Agric. Water Manag. 2018, 201, 118–132. [Google Scholar] [CrossRef] [Scilit]
  11. Robles, O.; Playán, E.; Cavero, J.; Zapata, N. Assessing low-pressure solid-set sprinkler irrigation in maize. Agric. Water Manag. 2017, 191, 37–49. [Google Scholar] [CrossRef] [Scilit]
  12. Chen, R.; Li, H.; Wang, J.; Song, Z. Critical factors influencing soil runoff and erosion in sprinkler irrigation: Water application rate and droplet kinetic energy. Agric. Water Manag. 2023, 283, 108299. [Google Scholar] [CrossRef] [Scilit]
  13. Bazdar, E.; Sameti, M.; Nasiri, F.; Haghighat, F. Compressed air energy storage in integrated energy systems: A review. Renew. Sustain. Energy Rev. 2022, 167, 112701. [Google Scholar] [CrossRef] [Scilit]
  14. Gasanzade, F.; Witte, F.; Tuschy, I.; Bauer, S. Integration of geological compressed air energy storage into future energy supply systems dominated by renewable power sources. Energy Convers. Manag. 2023, 277, 116643. [Google Scholar] [CrossRef] [Scilit]
  15. Zhang, Q.; Ge, M.; Wu, P.; Wei, F.; Xue, S.; Wang, B.; Ge, X. Solar photovoltaic coupled with compressed air energy storage: A novel method for energy saving and high quality sprinkler irrigation. Agric. Water Manag. 2023, 288, 108496. [Google Scholar] [CrossRef] [Scilit]
  16. Zha, J.; Ge, M.; Tang, Z.; Lei, J.; Zhao, H.; Zhang, Y. The incorporation of solar energy and compressed air into the energy supply system enhances the environmentally friendly and efficient operation of drip irrigation systems. Agric. Water Manag. 2024, 302, 109019. [Google Scholar] [CrossRef] [Scilit]
  17. López-Luque, R.; Reca, J.; Martínez, J. Optimal design of a standalone direct pumping photovoltaic system for deficit irrigation of olive orchards. Appl. Energy 2015, 149, 13–23. [Google Scholar] [CrossRef] [Scilit]
  18. Chandel, S.S.; Naik, M.N.; Chandel, R. Review of solar photovoltaic water pumping system technology for irrigation and community drinking water supplies. Renew. Sustain. Energy Rev. 2015, 49, 1084–1099. [Google Scholar] [CrossRef] [Scilit]
  19. Zhang, K.; Song, B.; Zhu, D. The influence of sinusoidal oscillating water flow on sprinkler and impact kinetic energy Intensities of laterally-moving sprinkler irrigation systems. Water 2019, 11, 1325. [Google Scholar] [CrossRef] [Scilit]
  20. Besharat, M.; Dadfar, A.; Viseu, M.T.; Brunone, B.; Ramos, H.M. Transient-flow induced compressed air energy storage (TI-CAES) system towards new energy concept. Water 2020, 12, 601. [Google Scholar] [CrossRef] [Scilit]
  21. Ismail, M.S.; Moghavvemi, M.; Mahlia, T.M.I. Design of an optimized photovoltaic and microturbine hybrid power system for a remote small community: Case study of Palestine. Energy Convers. Manag. 2013, 75, 271–281. [Google Scholar] [CrossRef] [Scilit]
  22. Evans, D.L. Simplified method for predicting photovoltaic array output. Sol. Energy 1981, 27, 555–560. [Google Scholar] [CrossRef] [Scilit]
  23. Nagano, K.; Mochida, T.; Shimakura, K.; Murashita, K.; Takeda, S. Development of thermal-photovoltaic hybrid exterior wallboards incorporating PV cells in and their winter performances. Sol. Energy Mater. Sol. Cells 2003, 77, 265–282. [Google Scholar] [CrossRef] [Scilit]
  24. Skoplaki, E.; Palyvos, J.A. On the temperature dependence of photovoltaic module electrical performance: A review of efficiency/power correlations. Sol. Energy 2009, 83, 614–624. [Google Scholar] [CrossRef] [Scilit]
  25. Diaf, S.; Belhamel, M.; Haddadi, M.; Louche, A. Technical and economic assessment of hybrid photovoltaic/wind system with battery storage in Corsica island. Energy Policy 2008, 36, 743–754. [Google Scholar] [CrossRef] [Scilit]
  26. Stultz, J.W.; Wen, L.C. Thermal performance testing and analysis of photovoltaic modules in natural sunlight. LSA Task Rep. 1977, 5101, 31. [Google Scholar]
  27. Bugler, J.W. The determination of hourly insolation on an inclined plane using a diffuse irradiance model based on hourly measured global horizontal insolation. Sol. Energy 1977, 19, 477–491. [Google Scholar] [CrossRef] [Scilit]
  28. IHVE A Book Guide; The Institution of Heating and Ventilating Engineers: London, UK, 1970.
  29. Hay, J.E. Calculation of monthly mean solar radiation for horizontal and inclined surfaces. Sol. Energy 1979, 23, 301–307. [Google Scholar] [CrossRef] [Scilit]
  30. Liu, B.Y.; Jordan, R.C. The interrelationship and characteristic distribution of direct, diffuse and total solar radiation. Sol. Energy 1960, 4, 1–19. [Google Scholar] [CrossRef] [Scilit]
  31. Zhai, J.; Liu, R.; Liu, J.; Zhao, G.; Huang, L. Radiative forcing over China due to albedo change caused by land cover change during 1990–2010. J. Geogr. Sci. 2014, 24, 789–801. [Google Scholar] [CrossRef] [Scilit]
  32. Kalies, G.; Do, D.D.; Arnrich, S. Momentum work and the energetic foundations of physics. II. The ideal gas law derived via processes. AIP Adv. 2023, 13, 055317. [Google Scholar] [CrossRef] [Scilit]
  33. Vermeiren, I.; Jobling, G.A. Localized Irrigation–Design, Installation, Operation, Evaluation; Food and Agriculture Organization of the United Nations: Rome, Italy, 1980. [Google Scholar]
  34. Cai, M.; Kawashima, K.; Kagawa, T. Power assessment of flowing compressed air. J. Fluids Eng. 2005, 128, 402–405. [Google Scholar] [CrossRef] [Scilit]
  35. Mindú, A.J.; Capece, J.A.; Araújo, R.E.; Oliveira, A.C. Feasibility of utilizing photovoltaics for irrigation purposes in moamba, mozambique. Sustainability 2021, 13, 10998. [Google Scholar] [CrossRef] [Scilit]
  36. Smith, M. CLIMWAT for CROPWAT: A Climatic Database for Irrigation Planning and Management; CABI: Wallingford, UK, 1993. [Google Scholar]
  37. Clarke, D.; Smith, M.; El-Askari, K. CropWat for Windows: User Guide; IHE: Oak Brook, IL, USA, 2001. [Google Scholar]
  38. Smith, M. CROPWAT: A Computer Program for Irrigation Planning and Management (No. 46); Food and Agriculture Organization of the United Nations: Rome, Italy, 1992. [Google Scholar]
  39. Chandel, S.S.; Naik, M.N.; Chandel, R. Review of performance studies of direct coupled photovoltaic water pumping systems and case study. Renew. Sustain. Energy Rev. 2017, 76, 163–175. [Google Scholar] [CrossRef] [Scilit]
  40. Chahartaghi, M.; Hedayatpour Jaloodar, M. Mathematical modeling of direct-coupled photovoltaic solar pump system for small-scale irrigation. Energy Sources Part A Recovery Util. Environ. Eff. 2024, 46, 1080–1101. [Google Scholar] [CrossRef] [Scilit]
  41. Li, N.; Liu, J.; Zhou, N.; Yang, Q.; Liang, J.; Li, J.; Yu, L.; Liu, X.; Zhang, W. Characteristics of rotary sprinkler water distribution under dynamic water pressure. Horticulturae 2022, 8, 804. [Google Scholar] [CrossRef] [Scilit]
  42. Kumar, S.S.; Bibin, C.; Akash, K.; Aravindan, K.; Kishore, M.; Magesh, G. Solar powered water pumping systems for irrigation: A comprehensive review on developments and prospects towards a green energy approach. Mater. Today Proc. 2020, 33, 303–307. [Google Scholar] [CrossRef] [Scilit]
  43. Raza, F.; Tamoor, M.; Miran, S.; Arif, W.; Kiren, T.; Amjad, W.; Hussain, M.I.; Lee, G.H. The socio-economic impact of using Photovoltaic (PV) energy for high-efficiency irrigation systems: A case study. Energies 2022, 15, 1198. [Google Scholar] [CrossRef] [Scilit]
  44. Habib, S.; Liu, H.; Tamoor, M.; Zaka, M.A.; Jia, Y.; Hussien, A.G.; Kamel, S. Technical modelling of solar photovoltaic water pumping system and evaluation of system performance and their socio-economic impact. Heliyon 2023, 9, e16105. [Google Scholar] [CrossRef] [Scilit]
  45. Almeida, R.H. Development and test of solutions to enlarge the power of PV irrigation and application to a 140 kW PV-diesel representative case. Energies 2018, 11, 3538. [Google Scholar] [CrossRef] [Scilit]
  46. Beszédes, B.; Szell, K.; Györök, G. Redundant photo-voltaic power cell in a highly reliable system. Electronics 2021, 10, 1253. [Google Scholar] [CrossRef] [Scilit]
  47. Sheline, C.; Grant, F.; Gelmini, S.; Pratt, S. Designing a predictive optimal water and energy irrigation (POWEIr) controller for solar-powered drip irrigation systems in resource-constrained contexts. Appl. Energy 2025, 377, 124107. [Google Scholar] [CrossRef] [Scilit]
  48. García, A.M.; García, I.F.; Poyato, E.C.; Barrios, P.M.; Díaz, J.R. Coupling irrigation scheduling with solar energy production in a smart irrigation management system. J. Clean. Prod. 2018, 175, 670–682. [Google Scholar] [CrossRef] [Scilit]
  49. Ziane, A.; Necaibia, A.; Sahouane, N.; Dabou, R.; Mostefaoui, M.; Bouraiou, A.; Khelifi, S.; Rouabhia, A.; Blal, M. Photovoltaic output power performance assessment and forecasting: Impact of meteorological variables. Sol. Energy 2021, 220, 745–757. [Google Scholar] [CrossRef] [Scilit]
  50. Sontake, V.C.; Tiwari, A.K.; Kalamkar, V.R. Experimental investigations on the seasonal performance variations of directly coupled solar photovoltaic water pumping system using centrifugal pump. Environ. Dev. Sustain. 2021, 23, 8288–8306. [Google Scholar] [CrossRef] [Scilit]
  51. Fouad, M.M.; Shihata, L.A.; Morgan, E.I. An integrated review of factors influencing the perfomance of photovoltaic panels. Renew. Sustain. Energy Rev. 2017, 80, 1499–1511. [Google Scholar] [CrossRef] [Scilit]
Figure 1. The schematic representation of the pulse irrigation performance testing platform designed for regulating compressed-air energy storage.
Agriculture 16 00154 g001
Figure 2. Verification test apparatus for the Photovoltaic output power calculation model.
Agriculture 16 00154 g002
Figure 3. Device layout.
Agriculture 16 00154 g003
Figure 4. Schematic diagram of solar cycle pulse sprinkler irrigation for irrigation of 1 hectare corn field.
Agriculture 16 00154 g004
Figure 5. The variations in the flow rates of different types of pumps under different input powers and outlet pressure conditions. Note: Red represents the higher flow rate, green represents the lower flow rate.
Agriculture 16 00154 g005
Figure 6. The comparison of the calculated and measured output power of the inclined surface solar panels in the Yangling District.
Agriculture 16 00154 g006
Figure 7. A comparison between the measured and calculated values of the pump outlet pressure.
Agriculture 16 00154 g007
Figure 8. The pressure drop of the air tank and sprinkler nozzle during the pulse spraying stage.
Agriculture 16 00154 g008
Figure 9. The actual output power of a photovoltaic panel with a rated power of 490 W.
Agriculture 16 00154 g009
Figure 10. Changes in the flow rate of the pump during the process of pumping water compressed air at different times of the day (a) and equivalent flow rate at different times of the day (b).
Agriculture 16 00154 g010
Figure 11. The duration of the cyclic pulse period within different time periods in a day and the changes in the amount of water extracted from the photovoltaic system.
Agriculture 16 00154 g011
Figure 12. Comparison of the irrigation schemes and soil moisture changes under different irrigation modes using traditional sprinkler irrigation (A) and solar-powered compressed-air energy storage (B). Note: Available water of SWRmin—the minimum allowable water storage in the planned wet layer of the soil. The irrigation depth shown in the figure is the net irrigation depth after considering the utilization factor of 70% sprinkler irrigation water.
Agriculture 16 00154 g012
Table 1. The calculation formula for the outflow of the pump under different input powers and variations in outlet pressure.
TypeFlow RateR2Scope
5G310-160q = −0.3054 + 0.05198P−0.337Ppv0.48580.99520 W < Ppv < 160 W, P < 0.7 MPa
FYR4-350q = −0.08596 + 0.00884P−0.4399Ppv0.74760.99850 W < Ppv < 350 W, P < 0.7 MPa
YJ300-500q = −1.1725 + 0.4658P−0.16352Ppv0.22590.99380 W < Ppv < 500 W, P < 0.7 MPa
Table 2. Calculation process of pressure drop coefficient.
Pressure Drop CoefficientWater Jet Capacity/LWater Tank Pressure/
MPa
Nozzle Pressure/
MPa
Sprinkler/Water TankPressure Loss CoefficientAnomaly Deviation Rate/%
0.11010.460.2020.1190.5890.678−13.127
0.10410.630.2000.1270.6360.678−6.195
0.10210.680.2000.1300.6520.678−3.835
0.10010.730.1990.1330.6680.678−1.475
0.09810.790.1990.1360.6830.6780.737
0.09610.840.1980.1390.6990.6783.097
0.09410.890.1980.1410.7150.6785.457
0.09210.940.1970.1440.7320.6787.965
0.08611.100.1950.1520.7800.67815.044
Table 3. Irrigation schedule for maize in the Yangling district in a typical dry year.
Irrigation DateNet Irrigation Quota/mmGross Irrigation Quota/mm
5/1628.540.71
7/0638.254.57
7/1639.656.57
8/253.576.43
total159.8228.3
Table 4. The cost composition of solar compressed-air sprinkler irrigation system in a typical sprinkler irrigation area of 1 hectare.
CategorySpecificationUnit PriceQuantityTotal PriceDurable YearsDiscount RateRecovery FactorEquivalent Annual Value
$ $/haa% $/ha/year
Pressure tank100 L42.86 ($/unit)16685.71 2050.0854.86
Solar panel490 W75.71 ($/unit)161211.43 2050.0896.91
Sprinkler nozzle (support included)ZY26.43 ($/unit)48308.57 2050.0824.69
DC diaphragm pump350 W45.71 ($/unit)16731.43 550.23168.23
Pressure switchQPM11-NO2.29 ($/unit)1636.57 550.238.41
Time relayST3PF5.00 ($/unit)1680.00 550.2318.40
Electromagnetic valveDC12V8.57 ($/unit)16137.14 550.2331.54
PE pipeDN400.66 ($/m)10065.71 1050.138.54
PE pipeDN320.40 ($/m)400160.00 1050.1320.80
PE pipeDN250.26 ($/m)480123.43 1050.1316.05
Accessories 71.43 1050.139.29
Total 3611.43 457.72
Note: The cost of electrical wiring is not listed separately. It accounts for approximately 2–3% of the total equipment cost and can be adjusted according to the actual layout on site.
Disclaimer/Publisher’s Note: The statements, opinions and data contained in all publications are solely those of the individual author(s) and contributor(s) and not of MDPI and/or the editor(s). MDPI and/or the editor(s) disclaim responsibility for any injury to people or property resulting from any ideas, methods, instructions or products referred to in the content.