Article

Scenario-Based Energy Demand Analysis of a 100 hp-Class Agricultural Tractor Using Field-Measured Workloads

1
Eco-Friendly Hydrogen Electric Tractor & Agricultural Machinery Institute, Chungnam National University, Daejeon 34134, Republic of Korea
2
Vehicle & Mobility Systems Department, Argonne National Laboratory, Lemont, IL 60439, USA
3
Department of Smart Bio-Industrial Mechanical Engineering, Kyungpook National University, Daegu 41566, Republic of Korea
4
Upland Field Machinery Research Center, Kyungpook National University, Daegu 41566, Republic of Korea
5
Department of Smart Agriculture Systems, Chungnam National University, Daejeon 34134, Republic of Korea
6
Department of Smart Agriculture Systems Machinery Engineering, Chungnam National University, Daejeon 34134, Republic of Korea
*
Author to whom correspondence should be addressed.
Agriculture 2026, 16(17), 1870; https://doi.org/10.3390/agriculture16171870 (registering DOI)
Submission received: 18 July 2026 / Revised: 18 August 2026 / Accepted: 27 August 2026 / Published: 29 August 2026
(This article belongs to the Special Issue Design and Evaluation of Powertrain Systems for Agricultural Vehicles)

Abstract

This study investigated the energy characteristics of a 100 hp-class agricultural tractor under representative agricultural operations using field-measured workload data and a scenario-based energy analysis framework. Six representative operations, including moldboard plowing, subsoiling, rotary tillage, baler operation, transport operation, and loader operation, were analyzed to evaluate operation-level energy characteristics under realistic agricultural conditions. The results showed that tractor energy demand varied substantially depending on the workload characteristics of each task. Traction-intensive operations exhibited sustained high-power demand, whereas rotary tillage showed the highest specific energy consumption (SEC) because of continuous power take-off (PTO)-driven operation. Utility-oriented operations generally exhibited lower SEC values than traction- and PTO-intensive operations. Scenario-based analysis further demonstrated that workload composition strongly influenced annual energy use (AEU). The traction-intensive scenario exhibited the highest AEU, whereas the utility-oriented scenario showed the lowest cumulative annual energy demand. Sensitivity analysis revealed that annual operating hours had an approximately proportional influence on AEU across all scenarios. The proposed framework provides a practical basis for evaluating workload-dependent tractor energy characteristics and offers useful insights for future agricultural tractor electrification strategies.

1. Introduction

Agricultural tractors are essential machines in modern farming systems, performing a wide range of operations such as tillage, transport, and material handling [1,2,3]. These operations involve diverse load conditions, resulting in significant variations in energy demand and power distribution [4,5,6]. As energy consumption in the agricultural sector continues to draw increasing attention due to economic and environmental concerns, understanding the energy demand characteristics of agricultural tractors has become an important research topic [7,8,9]. In particular, the ability to accurately characterize how energy is consumed under different operating conditions is critical for improving system efficiency and supporting the development of advanced powertrain technologies [10,11,12]. Among these factors, the characteristics of individual operations play a fundamental role in determining tractor energy demand.
The energy demand of agricultural tractors is inherently dependent on the characteristics of individual operations, as each task involves distinct load mechanisms and power transmission pathways [13,14,15]. For example, traction-based operations such as plowing and subsoiling require high drawbar force and are strongly influenced by soil–tire interaction, leading to significant energy losses associated with slip and soil deformation [16,17,18]. In contrast, power take-off (PTO)-based operations, including rotary tillage and baling, are dominated by continuous power transfer through the PTO system, where energy consumption is primarily governed by implement-driven loads [19]. Utility-based operations, such as transport and loader work, exhibit relatively low or highly transient load conditions, resulting in different energy utilization patterns [20,21]. Due to these differences, both the magnitude and distribution of energy consumption vary substantially across operation types [22]. Therefore, operation-level energy analysis is essential for understanding energy transfer and loss characteristics within tractor systems and provides a foundation for accurate evaluation of overall tractor energy demand [23,24].
Previous studies on agricultural machinery workload analysis have primarily focused on measuring and characterizing operation-specific tractor loads under field conditions. Kim et al. [25] analyzed dynamic drivetrain load characteristics under major agricultural operations, including plowing, rotary tillage, and baling operations, to evaluate operation-dependent load variations and fatigue characteristics. Shao et al. [26] investigated drivetrain load transfer characteristics during plowing operations considering tire–soil interaction and slip behavior, highlighting the influence of field conditions on tractor traction dynamics. Do et al. [27] further analyzed engine load factor characteristics of combine harvesters according to working speed under actual field conditions. In addition, Siddique et al. [28] developed a reliability assessment process for tractor hydraulic pumps using field-measured hydraulic pressure and engine rotational speed data during plow, rotary tillage, baler, and wrapping operations. These studies contributed to improving the understanding of operation-specific workload characteristics and field operational variability of agricultural machinery.
Several studies have further utilized measured workload data and representative duty cycles to evaluate tractor system performance and electrified powertrain configurations. Lombardi et al. [29] proposed an adaptive energy management strategy for fuel-cell-based tractors using representative duty cycles to evaluate powertrain performance and hydrogen consumption characteristics. Wen et al. [30] developed an electric wheel-drive tractor system and analyzed traction efficiency and torque distribution characteristics under agricultural workloads. More recently, Baek et al. [31] and Ahn et al. [32] investigated workload-based electrified tractor powertrain configurations and component sizing methodologies considering agricultural workload characteristics. These studies demonstrated the applicability of workload-informed approaches for evaluating tractor system performance and electrified agricultural machinery.
However, most previous studies have focused on individual agricultural operations or simplified representative duty cycles. Although representative duty cycles are useful for evaluating tractor performance under a predefined operating pattern, they generally do not account for how different combinations of agricultural tasks influence cumulative energy demand over extended operating periods. In practical agricultural environments, tractors operate under combinations of multiple tasks with varying workload compositions depending on farming practices, field conditions, and seasonal requirements. Consequently, tractor energy demand is influenced not only by individual operation characteristics but also by the relative composition of different operations within a workload. Accordingly, limited research has systematically linked field-derived operation-specific energy characteristics with workload composition to evaluate annual tractor energy demand.
To address this limitation, this study develops a scenario-based energy demand analysis framework for agricultural tractors using field-measured workload data. Representative field experiments were conducted across traction-based, PTO-based, and utility-based operations, and a vehicle-level simulation model was developed and validated using the measured data. Unlike conventional duty-cycle-based assessments that evaluate tractor energy characteristics within a predefined operating cycle, the proposed framework integrates operation-specific energy characteristics through structured workload compositions to quantify workload-dependent annual tractor energy demand. This approach extends tractor energy analysis from operation-level evaluation to scenario-based system-level characterization. The main contributions of this study are as follows: (i) establishment of a field dataset covering representative traction-, PTO-, and utility-based agricultural operations of a 100 hp-class tractor; (ii) systematic characterization of operation-specific energy consumption and power distribution across diverse agricultural tasks; and (iii) development of a scenario-based analysis framework to quantify the influence of workload composition on annual tractor energy demand.

2. Materials and Methods

2.1. Instrumented Tractor

The agricultural tractor used in this study is a four-wheel-drive, 100 hp-class agricultural tractor (S07, TYM Co. Ltd., Gongju, Republic of Korea), as illustrated in Table 1. The tractor is powered by a turbocharged and intercooled, four-cylinder diesel engine with a rated power of 78 kW at 2300 rpm and a rated PTO output of 69 kW at the same engine speed. The engine delivers a maximum torque of 430 Nm at 1400 rpm, enabling stable operation under varying load conditions. The tractor is equipped with a multi-range mechanical transmission system with 32 forward and 32 reverse gear stages, allowing flexible operation across a wide range of agricultural tasks. The total vehicle weight is 3985 kg, and standard agricultural tires are mounted on the front and rear axles, providing traction suitable for field operations.
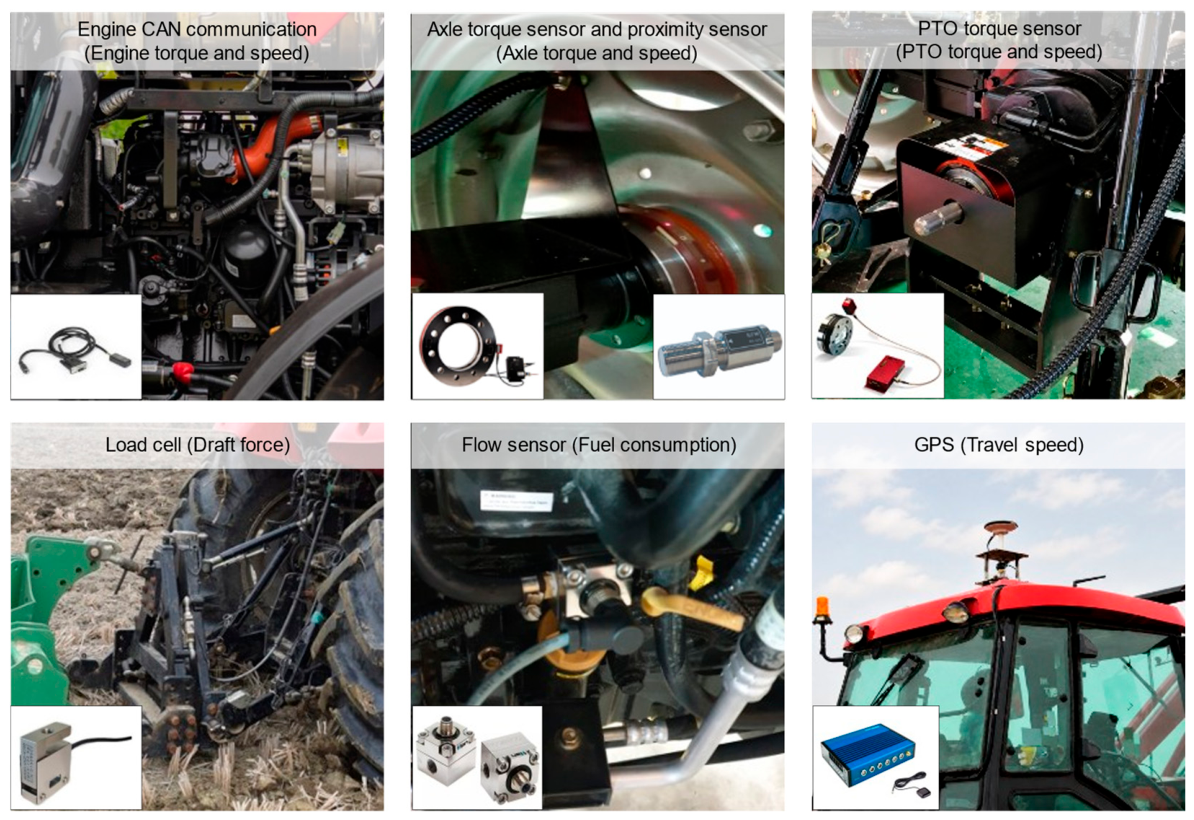
The instrumentation and data acquisition system of the test tractor is shown in Figure 1. The system was designed to capture key operational parameters of the tractor during field experiments, including engine torque and speed, axle torque and rotational speed, PTO torque, draft force, fuel consumption, and vehicle speed. Engine torque and speed were obtained through controller area network (CAN) communication from the engine control unit (ECU). Axle torque was measured using torque sensors mounted on the axle shaft, while rotational speed was acquired using proximity sensors. PTO torque and speed were measured using an inline PTO torque sensor. Draft force was measured using a load cell installed at the implement linkage. Fuel consumption was obtained using a fuel flow sensor installed in the fuel supply line. Vehicle speed was measured using a global positioning system (GPS). The acquired dataset was used to derive power distribution and energy consumption characteristics under representative agricultural operating conditions.
Using the measured variables, power- and force-based performance indicators were derived for each operation. The axle torque was obtained by summing the measured torques from the left and right wheels for both the front and rear axles. Based on the measured torque and rotational speed, the mechanical power of the engine and the wheel axles was calculated using Equation (1). The draft force acting on the tractor was determined from load cell measurements, and the traction power was calculated using Equation (2). To quantify the energy consumption, the calculated power signals were integrated over the effective operating period as expressed in Equation (3). All calculations were applied consistently across all operation datasets to ensure comparability. This framework provides a basis for evaluating power distribution and energy consumption characteristics under different agricultural operating conditions.
P = 2 π T N 60,000
P t = F d V 3.6
E = t 1 t 2 P ( t ) d t
where P is the mechanical power (kW), T is the torque (Nm), and N is the rotational speed (rpm). F d is the draft force (kN), P t is the traction power (kW), and V is the tractor speed (km/h). E is the accumulated energy (kWh), P ( t ) is the instantaneous power (kW), and t 1 and t 2 represent the start and end times of each operation.

2.2. Field Experiment

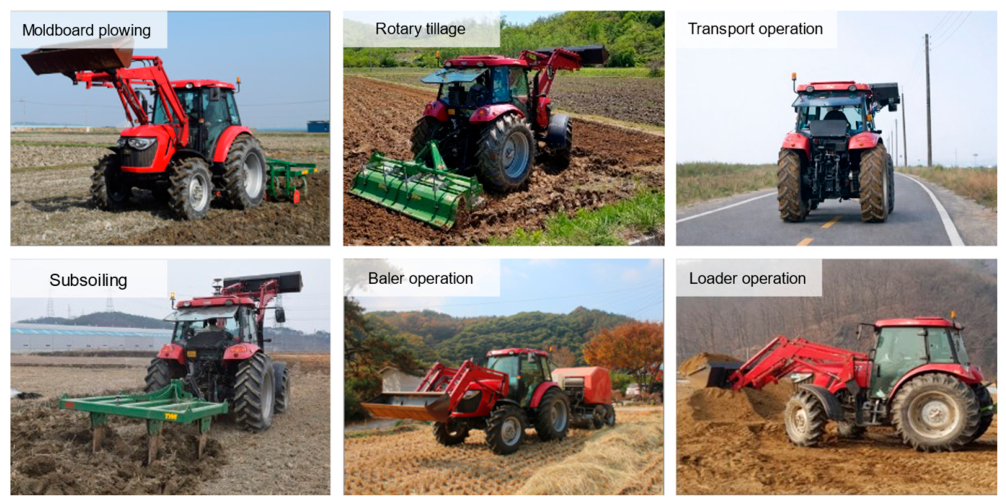
Field experiments were conducted during the 2018 agricultural season using representative agricultural implements selected to reflect typical field operations and their associated load characteristics in agricultural tractor applications. The representative operations considered in this study are illustrated in Figure 2, including moldboard plowing, subsoiling, rotary tillage, baling, transport, and loader operations. These operations cover a wide range of working conditions, including primary tillage, secondary tillage, PTO-driven operations, transport, and material handling. The key specifications of the implements used for each operation are summarized in Table 2. These specifications provide the physical basis for defining the operational load conditions, as they directly influence the traction demand, PTO load, and overall energy consumption of the tractor. The moldboard plow and subsoiler were selected to represent traction-dominant operations, where high drawbar force is required due to soil engagement at different depths. In particular, subsoiling was conducted with a deeper target working depth than moldboard plowing, representing a distinct soil-engaging load condition. The rotavator and baler were included as representative PTO-driven operations, where a significant portion of the power demand is transmitted through the power take-off system. The rotavator primarily reflects soil fragmentation processes, while the baler represents cyclic and fluctuating PTO loads during crop processing. In contrast, transport and loader operations were considered to represent non-tillage conditions with distinct load characteristics. Transport operation is characterized by low traction resistance but higher travel speed, whereas loader operation involves intermittent and variable loads associated with material handling. In addition, the loader was further characterized using its handling-related parameters, including maximum lift height, lift capacity, and bucket volume. The loader used in this study has a maximum lift height of 3600 mm, a lift capacity of 1873 kg, and a bucket capacity of 0.566 m3. These parameters are particularly relevant for representing the intermittent and variable load conditions associated with material handling operations, which differ significantly from both traction-dominant and PTO-driven tasks. By incorporating these representative operations and their corresponding implement specifications, this study captures a broad spectrum of operational load conditions, enabling a comprehensive evaluation of energy consumption characteristics under realistic agricultural workloads.
The characteristics of the field test sites for each agricultural operation are summarized in Table 3, including geographic location and soil properties. Each site was selected to represent typical operating conditions associated with different agricultural tasks. The soil properties, including texture, cone index, and moisture content, were considered as key factors influencing traction performance and load conditions. Although the soil characteristics varied across the test sites, they represent typical soil types commonly found in agricultural regions of Korea, including loamy sand, loam, and silt loam [33]. The measured cone index ranged from approximately 418 to 1393 kPa, while the soil moisture content varied between 20.5% and 43.3%, reflecting a broad range of field conditions.
The operating conditions of the instrumented tractor for each operation are presented in Table 4. All operations were conducted with the engine speed set to 2510 rpm under full-throttle conditions. The operating parameters include travel speed determined by the selected gear stage, PTO speed for PTO-driven operations, and working depth for soil-engaging tasks. For moldboard plowing, subsoiling, and rotary tillage, the target working depths were set to 15–20, 35–40, and 15–20 cm, respectively, using the tractor hitch control unit. These values represent the target working-depth ranges rather than continuously measured depth data, because actual working depth was not independently recorded during field operation. In addition, the field operations were performed following representative working patterns. Tillage and PTO-based operations were conducted using a conventional back-and-forth (C-type) field pattern. The transport operation was performed over a travel distance of approximately 1.2 km, representing typical field-to-field or road transport conditions, while the loader operation was carried out using a short-cycle loading and unloading pattern with a travel distance of approximately 15 m. These parameters define the operational load conditions for each task. By combining the field conditions with the corresponding operating parameters, this study establishes a realistic and operation-specific representation of agricultural workloads for subsequent energy consumption analysis.

2.3. Tractor Modeling and Validation

In this study, a baseline diesel tractor model was developed using Autonomie (Version 2026, Argonne National Laboratory, Lemont, IL, USA) to analyze the energy consumption characteristics of agricultural tractors under representative field operating conditions. The model was configured to represent a 100 hp-class agricultural tractor equipped with a conventional diesel engine and mechanical transmission system. The vehicle system model was constructed to simulate the energy flow from the fuel source to the traction, PTO, and auxiliary hydraulic subsystems during agricultural operations.
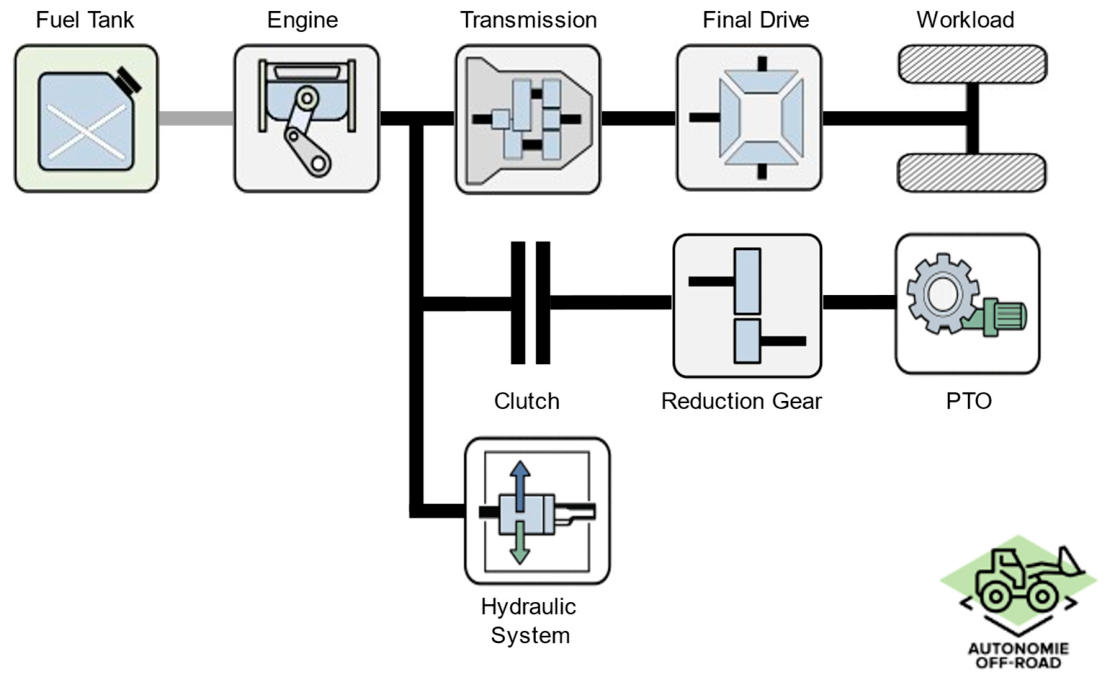
As shown in Figure 3, the developed tractor model consists of the fuel tank, engine, transmission, final drive, PTO driveline, and hydraulic system. The engine output power is transmitted through the mechanical drivetrain to satisfy traction demand at the wheels, while a separate PTO power path was incorporated to represent PTO-driven implement operations. In addition, the hydraulic subsystem was included to account for auxiliary power demand during utility-based operations, such as loader operation. The developed model was designed using a modular vehicle system architecture to enable dynamic simulation of power flow and energy consumption under varying agricultural workloads. Key operating inputs, including vehicle speed, traction load, PTO load, and hydraulic load characteristics, were derived from field-measured data obtained during representative agricultural operations. Based on these inputs, operation-specific driving cycles were constructed for traction-based, PTO-based, and utility-based operations. To improve the realism of the simulation results, drivetrain-related parameters, including transmission efficiency and resistance characteristics, were calibrated using experimental data. The developed baseline tractor model was subsequently used as a reference platform for the validation analysis and scenario-based energy assessment performed in this study.
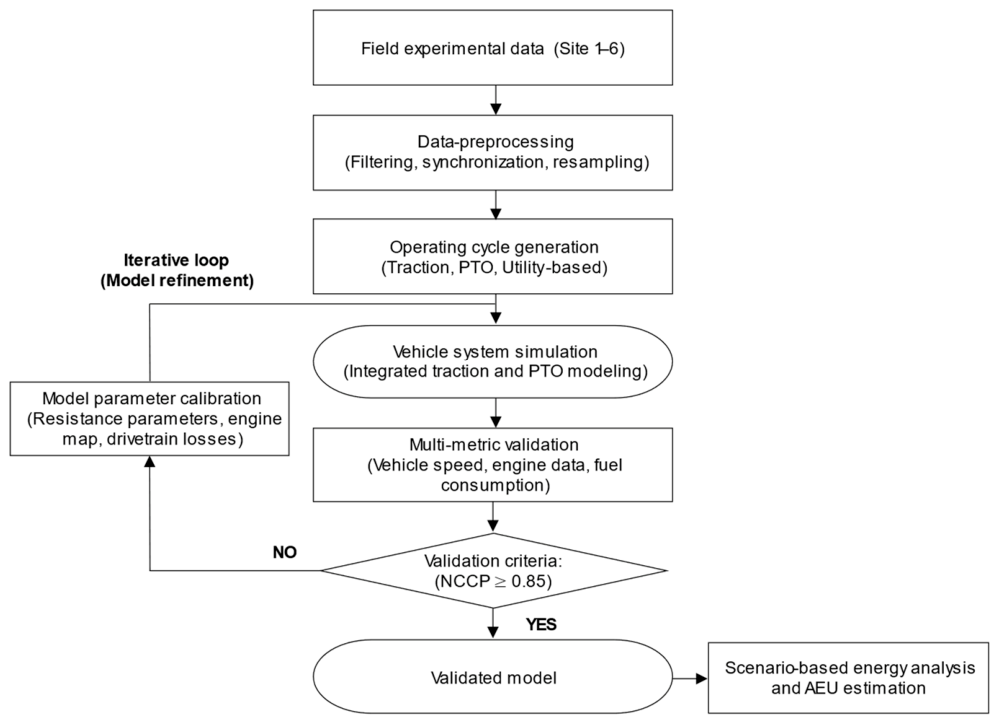
To evaluate the predictive capability of the developed tractor model, a structured validation procedure was implemented, as illustrated in Figure 4. The validation framework integrates field data processing, operating cycle generation, vehicle system simulation, and multi-metric performance evaluation. Field-measured data obtained from representative agricultural operations were processed through filtering, synchronization, and resampling to ensure data consistency. Based on the processed data, representative operating cycles were generated for traction-based, PTO-based, and utility-based operating conditions and subsequently applied to the vehicle system simulation. The agreement between the simulation results and experimental measurements was evaluated using multiple performance metrics, including vehicle speed, engine torque, engine speed, and fuel consumption. Among these metrics, the similarity between the measured and simulated time-domain signals was quantified using the normalized cross-correlation power (NCCP), which reflects both amplitude and phase agreement between two signals. The NCCP is expressed in Equations (4) and (5).
N C C P = max R x y τ max R x x τ , R y y τ
R x y τ = lim T 1 T 0 T x t · y t τ d t
where x t and y t denote the experimental and simulation signals, respectively. τ represents the time lag between the two signals, and R x x ( τ ) and R y y ( τ ) are the autocorrelation functions of x t and y t , respectively.

2.4. Scenario-Based Energy Assessment

To evaluate the impact of workload composition on tractor performance and energy consumption, three representative operating scenarios were defined, as summarized in Table 5. Each scenario was formulated by varying the proportion of traction-based, PTO-based, and utility-based operations while maintaining balanced contributions from the remaining tasks. The workload proportions were not derived directly from national agricultural statistics, farm surveys, or a specific workload database; rather, they were defined as theoretical scenario assumptions to systematically investigate the influence of workload composition on tractor energy demand. In each scenario, one operation category was assigned 60% of the total workload, while the remaining two categories each accounted for 20%, thereby providing a consistent basis for comparing traction-, PTO-, and utility-dominant operating conditions. Actual tractor workload compositions may vary substantially depending on farming practices, crop type, field conditions, and seasonal requirements, as also indicated by long-term real-world tractor mission-profile studies [34]. Scenario A represents a traction-based scenario, in which traction-based operations (moldboard plowing and subsoiling) account for 60% of the total workload. Scenario B corresponds to a PTO-based scenario, where PTO-based operations (rotary tillage and baler operation) comprise 60% of the workload. Scenario C reflects a utility-based scenario, in which utility-based operations (transport operation and loader operation) contribute 60% of the total workload. Each scenario reflects distinct power demand characteristics associated with different agricultural operations. Traction-based operations are dominated by drawbar load, PTO-based operations require continuous power delivery through the PTO system, and utility-based operations involve variable and lower load conditions. This scenario configuration enables systematic evaluation of workload-dependent energy consumption characteristics under diverse agricultural operating conditions.
To quantitatively evaluate the energy demand associated with each workload scenario, a scenario-based energy aggregation method was employed. The specific energy consumption (SEC) for each operation was calculated using Equation (6) based on the total energy consumed during the operation cycle and the corresponding cycle duration. The annual energy use (AEU) was estimated by combining operation-level SEC values with the workload composition of each scenario under an annual operating time (AOT) of 250 h using the scenario fractions defined in Equation (7).
S E C i = E i t i
A E U = i = 1 n S F i S E C i A O T 1000
where S E C i is the specific energy consumption of operation i (kWh/h), E i is the total energy consumed during the operation cycle (kWh), and t i is the duration of the corresponding cycle (h). A E U denotes the annual energy use (MWh/year), S F i represents the scenario fraction of operation i (0–1), A O T is the annual operating time (h/year), and n is the number of representative operations considered in the analysis.

3. Results

3.1. Field Workload Characteristics

Representative workload characteristics for different agricultural operations were analyzed to identify the power distribution patterns and workload characteristics of the tractor under various working conditions. The measured datasets were categorized into traction-based, PTO-based, and utility-based operations according to the dominant power demand.
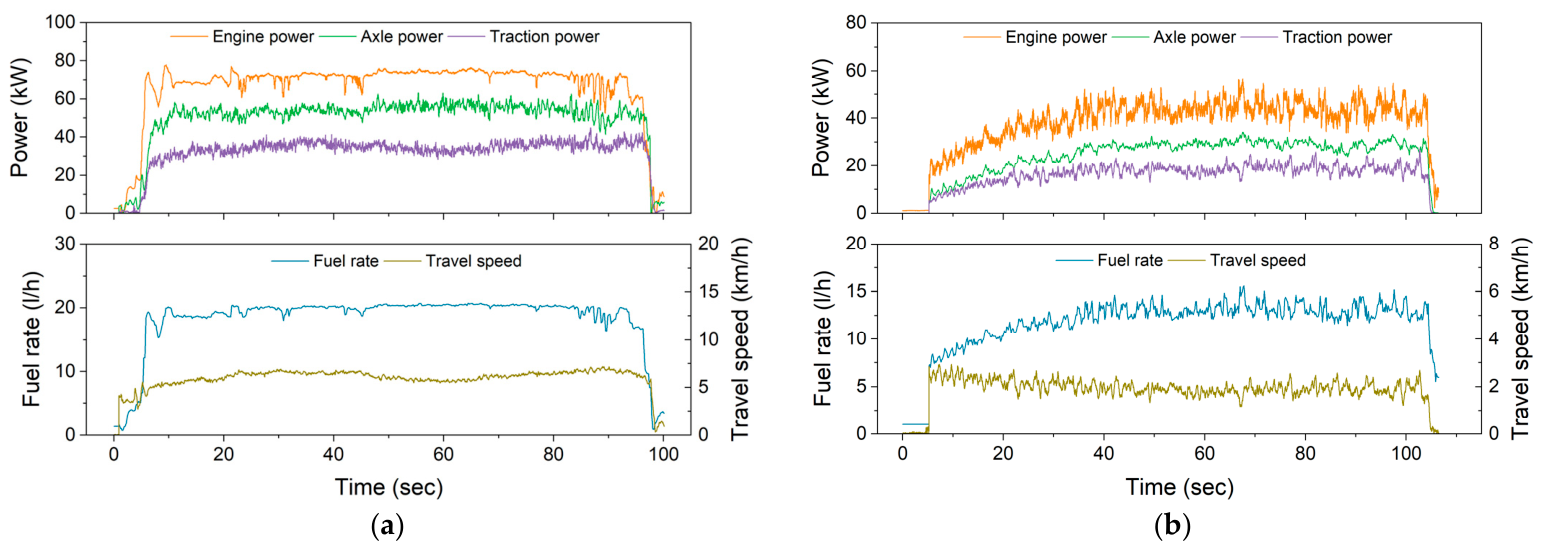
Figure 5 shows the time-series workload characteristics of representative traction-based operations, including moldboard plowing and subsoiling. In these operations, the majority of engine output is transmitted to traction power through the drivetrain, resulting in high axle and traction power levels. As shown in Figure 5a,b, both operations exhibit a rapid increase in power during the initial soil engagement phase, followed by a stable steady-state behavior. The traction power remains consistently lower than the axle power, reflecting tractive losses associated with soil–tire interaction, wheel slip, and vehicle motion resistance. Compared with moldboard plowing, subsoiling exhibited more pronounced temporal fluctuations in the power profiles. However, because the two operations were conducted under different field and operating conditions and the actual working depth was not continuously measured, the observed difference in power variability cannot be attributed to a single factor. The greater fluctuations during subsoiling may reflect the combined effects of the deeper target working depth, site-specific soil resistance, and possible variations in actual working depth. In both operations, the fuel consumption rate follows the overall load trend, while the travel speed remains relatively stable during the main operating period.
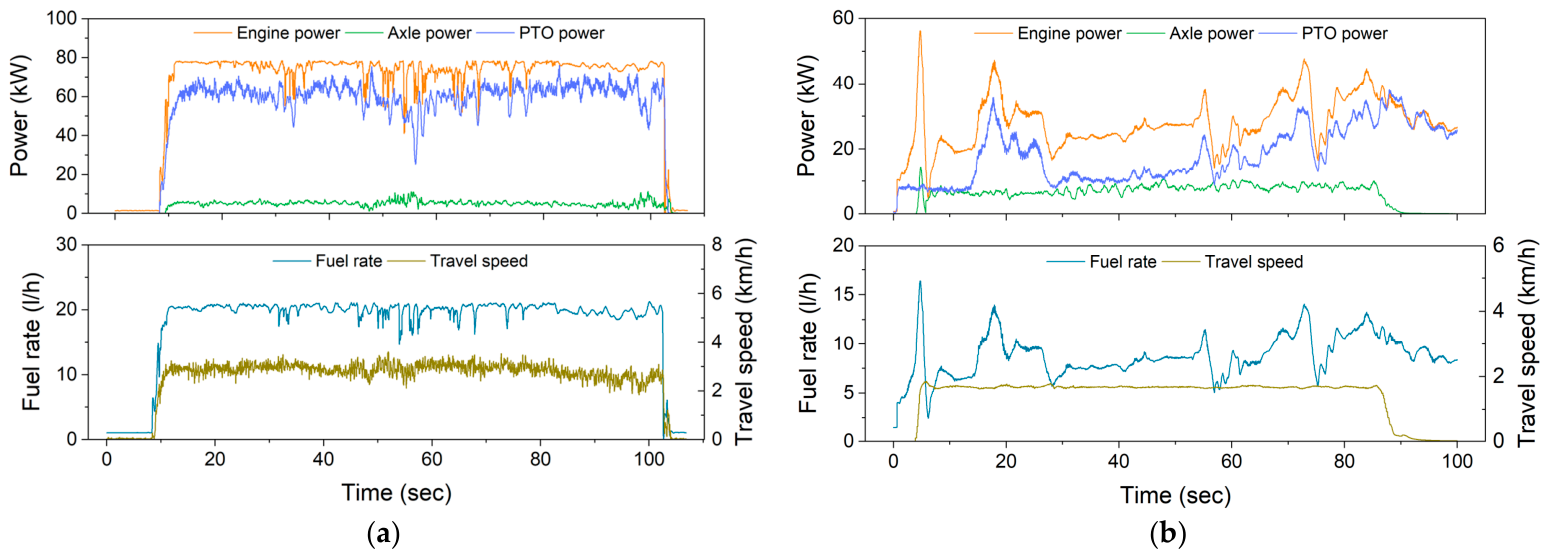
Figure 6 presents the time-series workload characteristics of representative PTO-based operations, including rotary tillage and baler operation. In contrast to traction-based operations, PTO-based operations are characterized by a dominant PTO power demand due to implement-driven loads. As shown in Figure 6a, rotary tillage exhibits a rapid increase in power during the initial engagement phase, followed by stable PTO power levels during steady operation, indicating continuous power transfer to the rotary implement. In contrast, the baler operation in Figure 6b shows highly fluctuating power profiles, reflecting intermittent and cyclic load characteristics associated with crop feeding and bale formation processes. In both operations, the majority of engine power is delivered to the PTO shaft, while axle power remains small due to the lower traction demand. The fuel consumption rate follows the variation in PTO load, whereas the travel speed remains constant during operation. This behavior highlights the fundamental difference between continuous and intermittent PTO load conditions depending on the implement type.
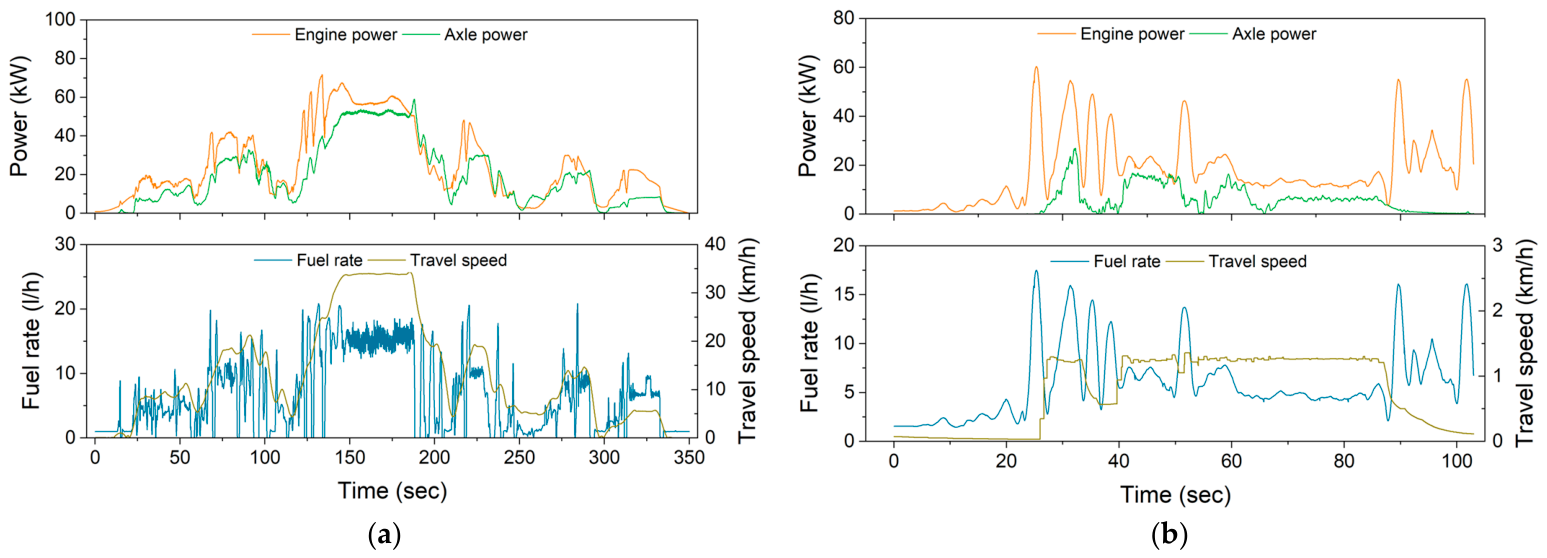
Figure 7 illustrates the time-series workload characteristics of representative utility-based operations, including transport and loader operations. These operations exhibit mixed load conditions with varying power demand depending on the working pattern. As shown in Figure 7a, the transport operation is characterized by smooth variations in engine and axle power, along with stable travel speed over a long travel distance of approximately 1.2 km, reflecting continuous vehicle motion under field or road transport conditions. In contrast, the loader operation in Figure 7b shows highly fluctuating engine and axle power profiles, driven by repeated loading and unloading cycles. This operation was performed using a short-cycle working pattern with a travel distance of approximately 15 m, resulting in frequent changes in motion and load conditions. Accordingly, the fuel consumption rate varies significantly during loader operation, following rapid changes in engine load, whereas it remains stable during transport operation. These results highlight the distinct difference between continuous and highly transient load characteristics in utility-based agricultural operations.
Overall, the analyzed workload datasets exhibited statistically distinct power characteristics depending on the agricultural operation type, as summarized in Table 6. Significant differences among operations were identified using one-way ANOVA followed by Tukey’s HSD test (p < 0.05). Traction-based operations generally exhibited higher engine, axle, and traction power demands than PTO- and utility-based operations, reflecting the substantial draft loads associated with soil-engaging tasks. In contrast, PTO-based operations were characterized by dominant PTO power demand with low axle power contribution, indicating that most of the engine power was transferred directly to the implement. Utility-based operations exhibited comparatively lower overall power demand than traction- and PTO-based operations. Among the investigated operations, moldboard plowing and rotary tillage showed the highest engine power levels, whereas transport and loader operations exhibited the lowest levels. In addition, moldboard plowing exhibited the highest axle and traction power demands, while rotary tillage showed the highest PTO power demand. These results confirm that the magnitude and distribution of power demand strongly depend on the workload characteristics of agricultural tasks, highlighting the importance of operation-specific workload analysis for tractor powertrain evaluation.
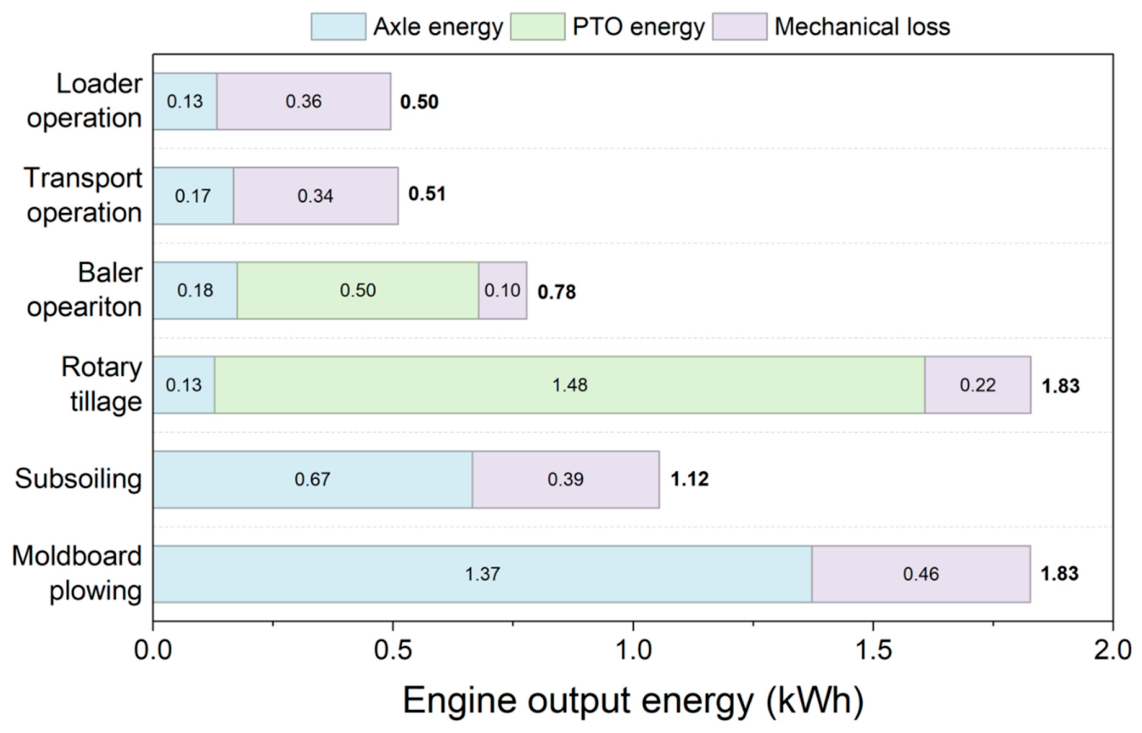
The results reveal that both the magnitude and distribution of engine output energy vary significantly depending on the agricultural operation type, as illustrated in Figure 8. To ensure consistent comparison, all operations were analyzed over a normalized 100 s time window. Moldboard plowing and rotary tillage exhibited the highest total engine output energy, whereas transport and loader operations showed comparatively lower total energy demand. These results indicate that the required energy level and energy utilization pathway strongly depend on the workload characteristics of each agricultural task. Traction-based operations were characterized by dominant axle energy consumption, while PTO-based operations exhibited high PTO energy demand with small axle energy contribution. In contrast, utility-based operations showed low total energy demand but comparatively high mechanical loss proportions. Among the investigated operations, loader operation exhibited the highest relative mechanical loss, whereas rotary tillage showed the largest PTO energy contribution. Overall, the energy distribution patterns varied considerably according to the agricultural operation type. These findings demonstrate that agricultural tractor workloads exhibit substantially different energy utilization characteristics depending on the operation type, highlighting the importance of operation-specific workload analysis for tractor powertrain evaluation and optimization.

3.2. Model Validation Results

Table 7 summarizes the NCCP values between the measured and simulated results under different agricultural operating conditions. Vehicle speed, engine torque, and engine speed showed high similarity across all operations, with most NCCP values exceeding 0.95. Vehicle speed exhibited the highest consistency, with NCCP values ranging from 0.953 to 0.977, indicating that the operating cycles were effectively reproduced within the simulation environment. Engine torque and engine speed also demonstrated strong correlation between the measured and simulated results. The NCCP values for engine torque ranged from 0.914 to 0.974, while those for engine speed ranged from 0.907 to 0.967 depending on the operation type. Lower NCCP values were observed during baler and transport operations, which exhibited wider transient operating variations. Fuel consumption showed acceptable correlation across all operating conditions, with NCCP values ranging from 0.858 to 0.922. Although the fuel consumption correlation was lower than that of the other variables, the results indicate that the developed simulation model reasonably reproduced the energy consumption behavior of the agricultural tractor under various agricultural workloads.
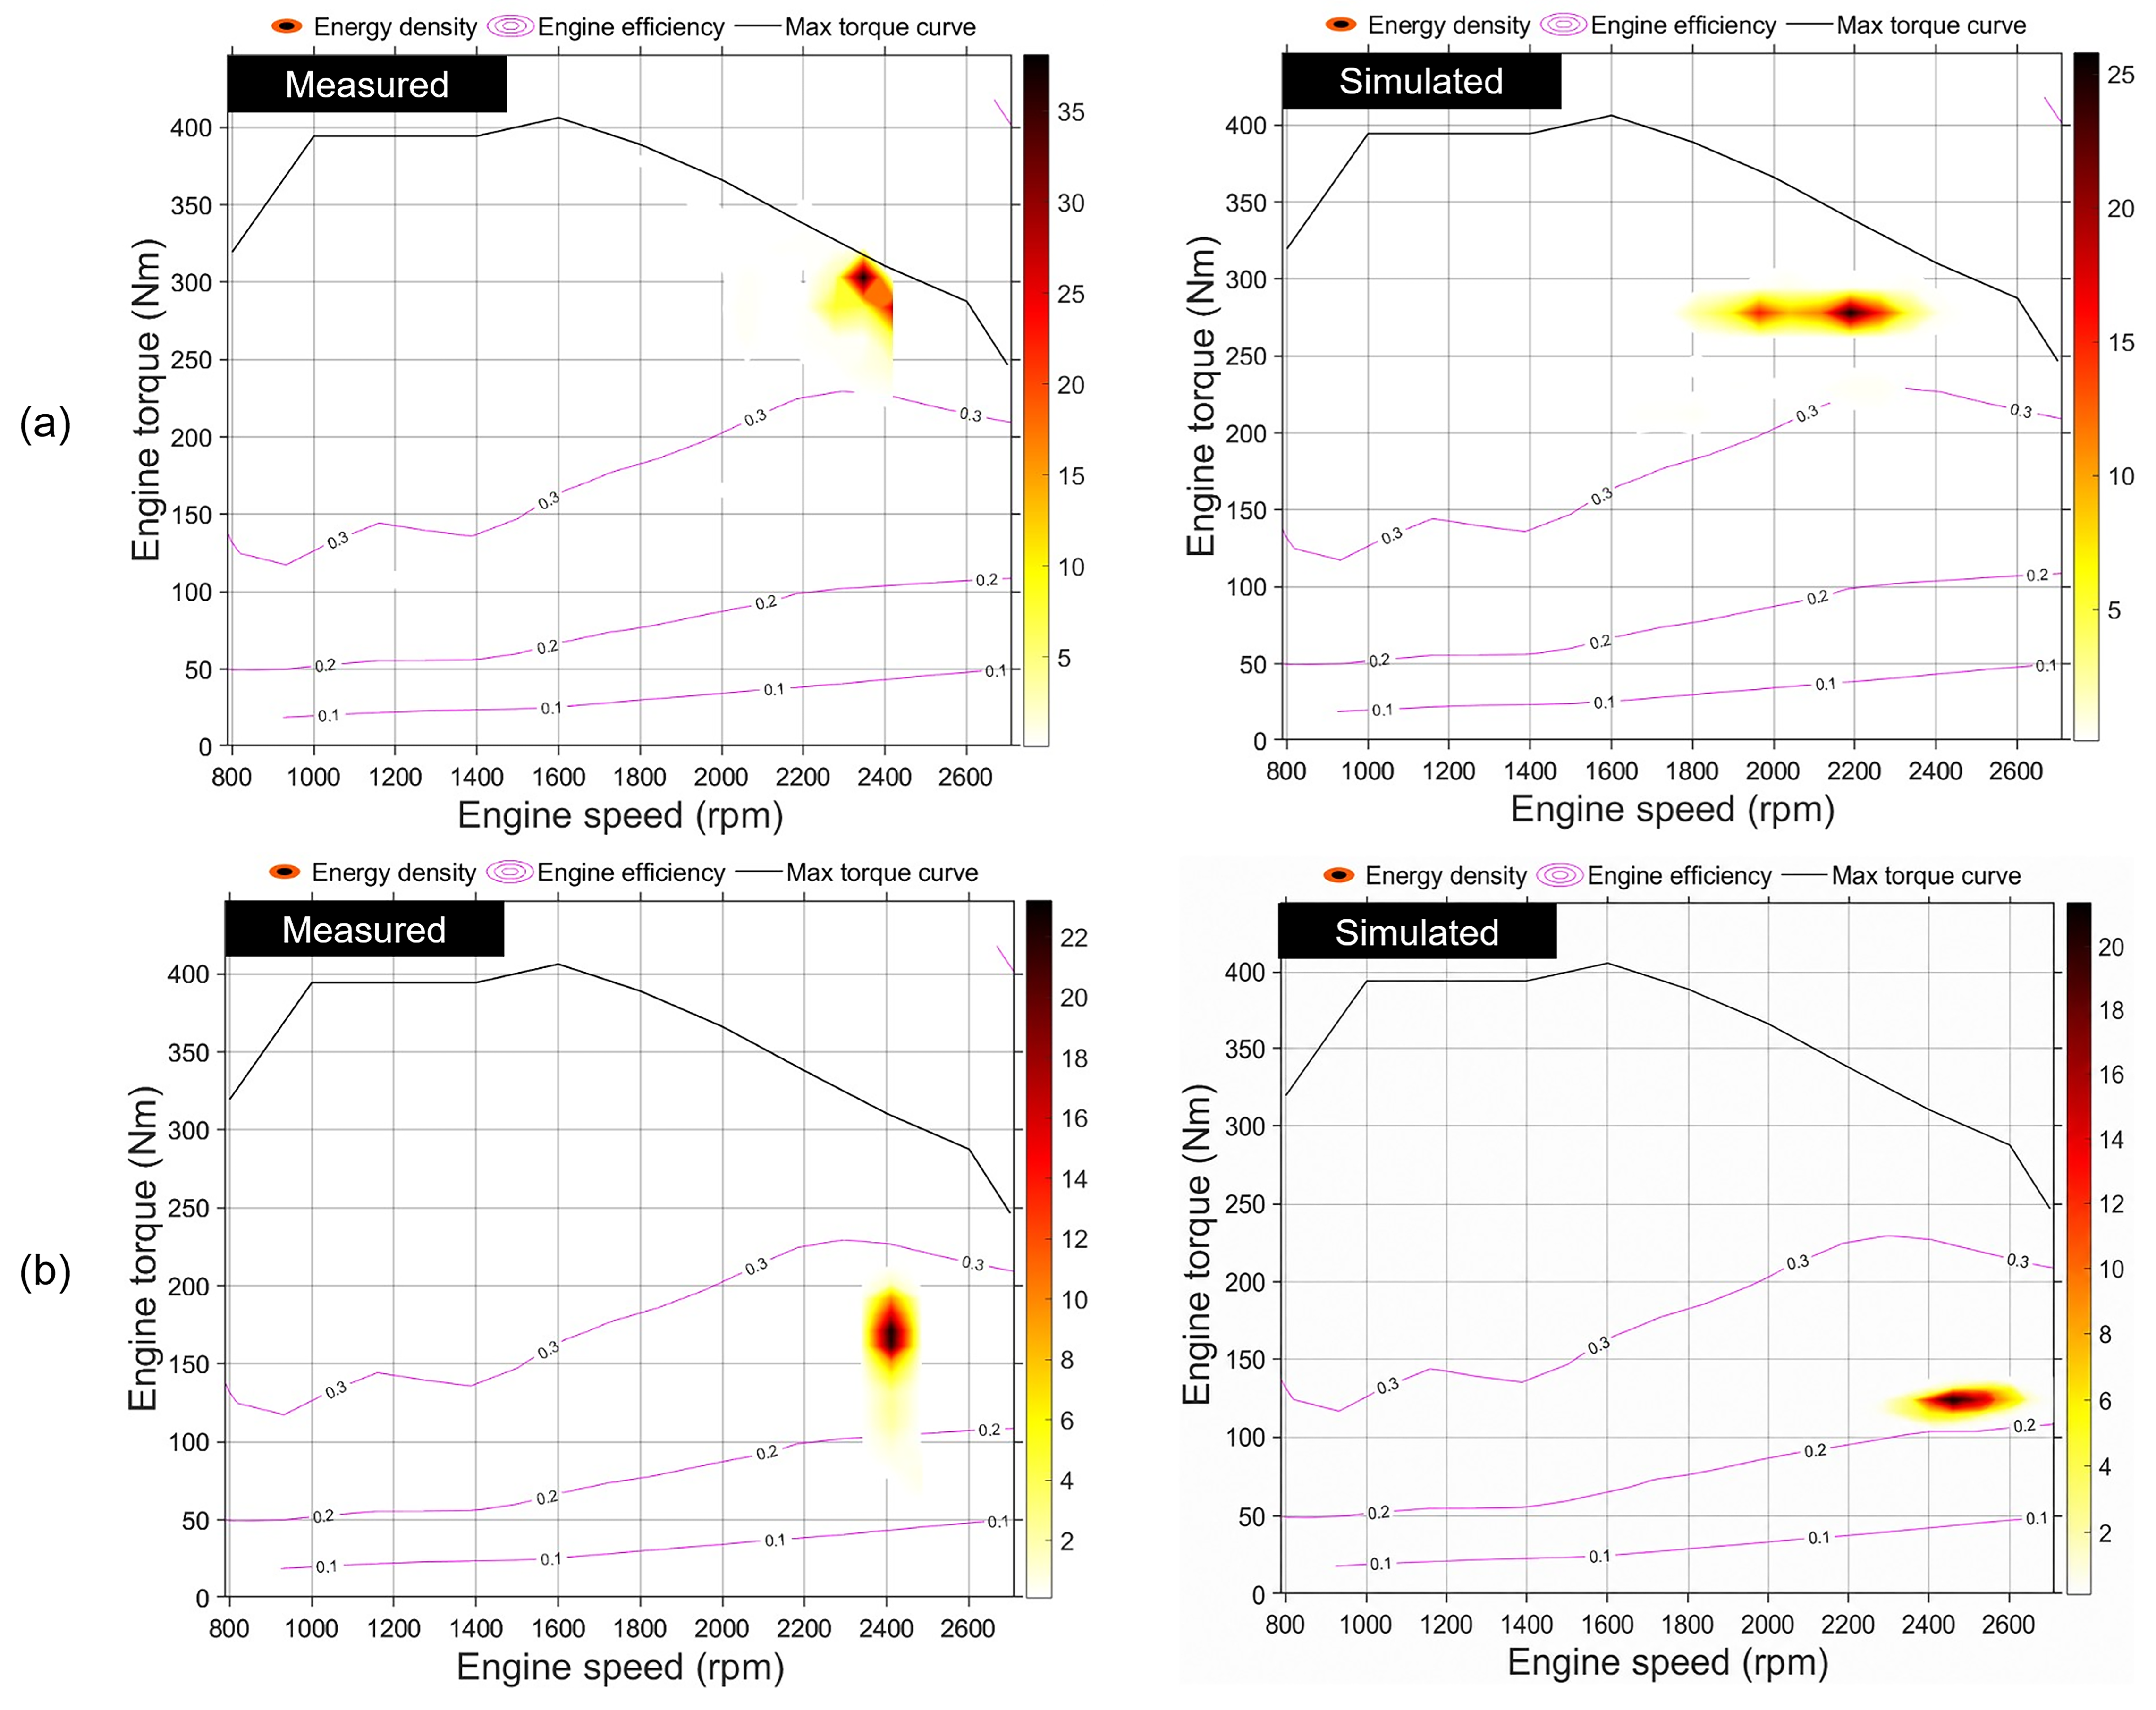
Figure 9 presents the engine operating point energy distributions for the measured and simulated cases under the two traction-based operations. Overall, the simulation results reproduced the dominant operating regions observed in the field measurements, although minor differences in operating spread and concentration were observed. For moldboard plowing, the measured operating points were mainly concentrated in the high-load region around 2280–2420 rpm and 285–310 Nm. The simulated results exhibited a comparable operating tendency, with the dominant energy distribution located near 1920–2280 rpm and 270–285 Nm, indicating that the model effectively represented the high-load traction characteristics of the operation. For subsoiling, the measured operating points were concentrated at approximately 2360–2450 rpm and 150–190 Nm, whereas the simulated results were distributed around 2450–2680 rpm and 118–132 Nm. Although the overall high-speed and moderate-load operating tendency was similarly represented, some differences were observed in the detailed engine speed–torque distributions, with the simulated operating region shifted toward higher engine speeds and lower torque. These differences may be associated with variations between the calibrated model parameters and the actual field operating characteristics under deep tillage conditions. In particular, subsoiling involves variable soil–implement and soil–tire interactions, while actual working depth was not continuously measured and its transient influence on draft resistance could therefore not be explicitly considered. Differences in drivetrain resistance and transmission response between the model and actual field operation may also have contributed to the observed shift in the operating region.
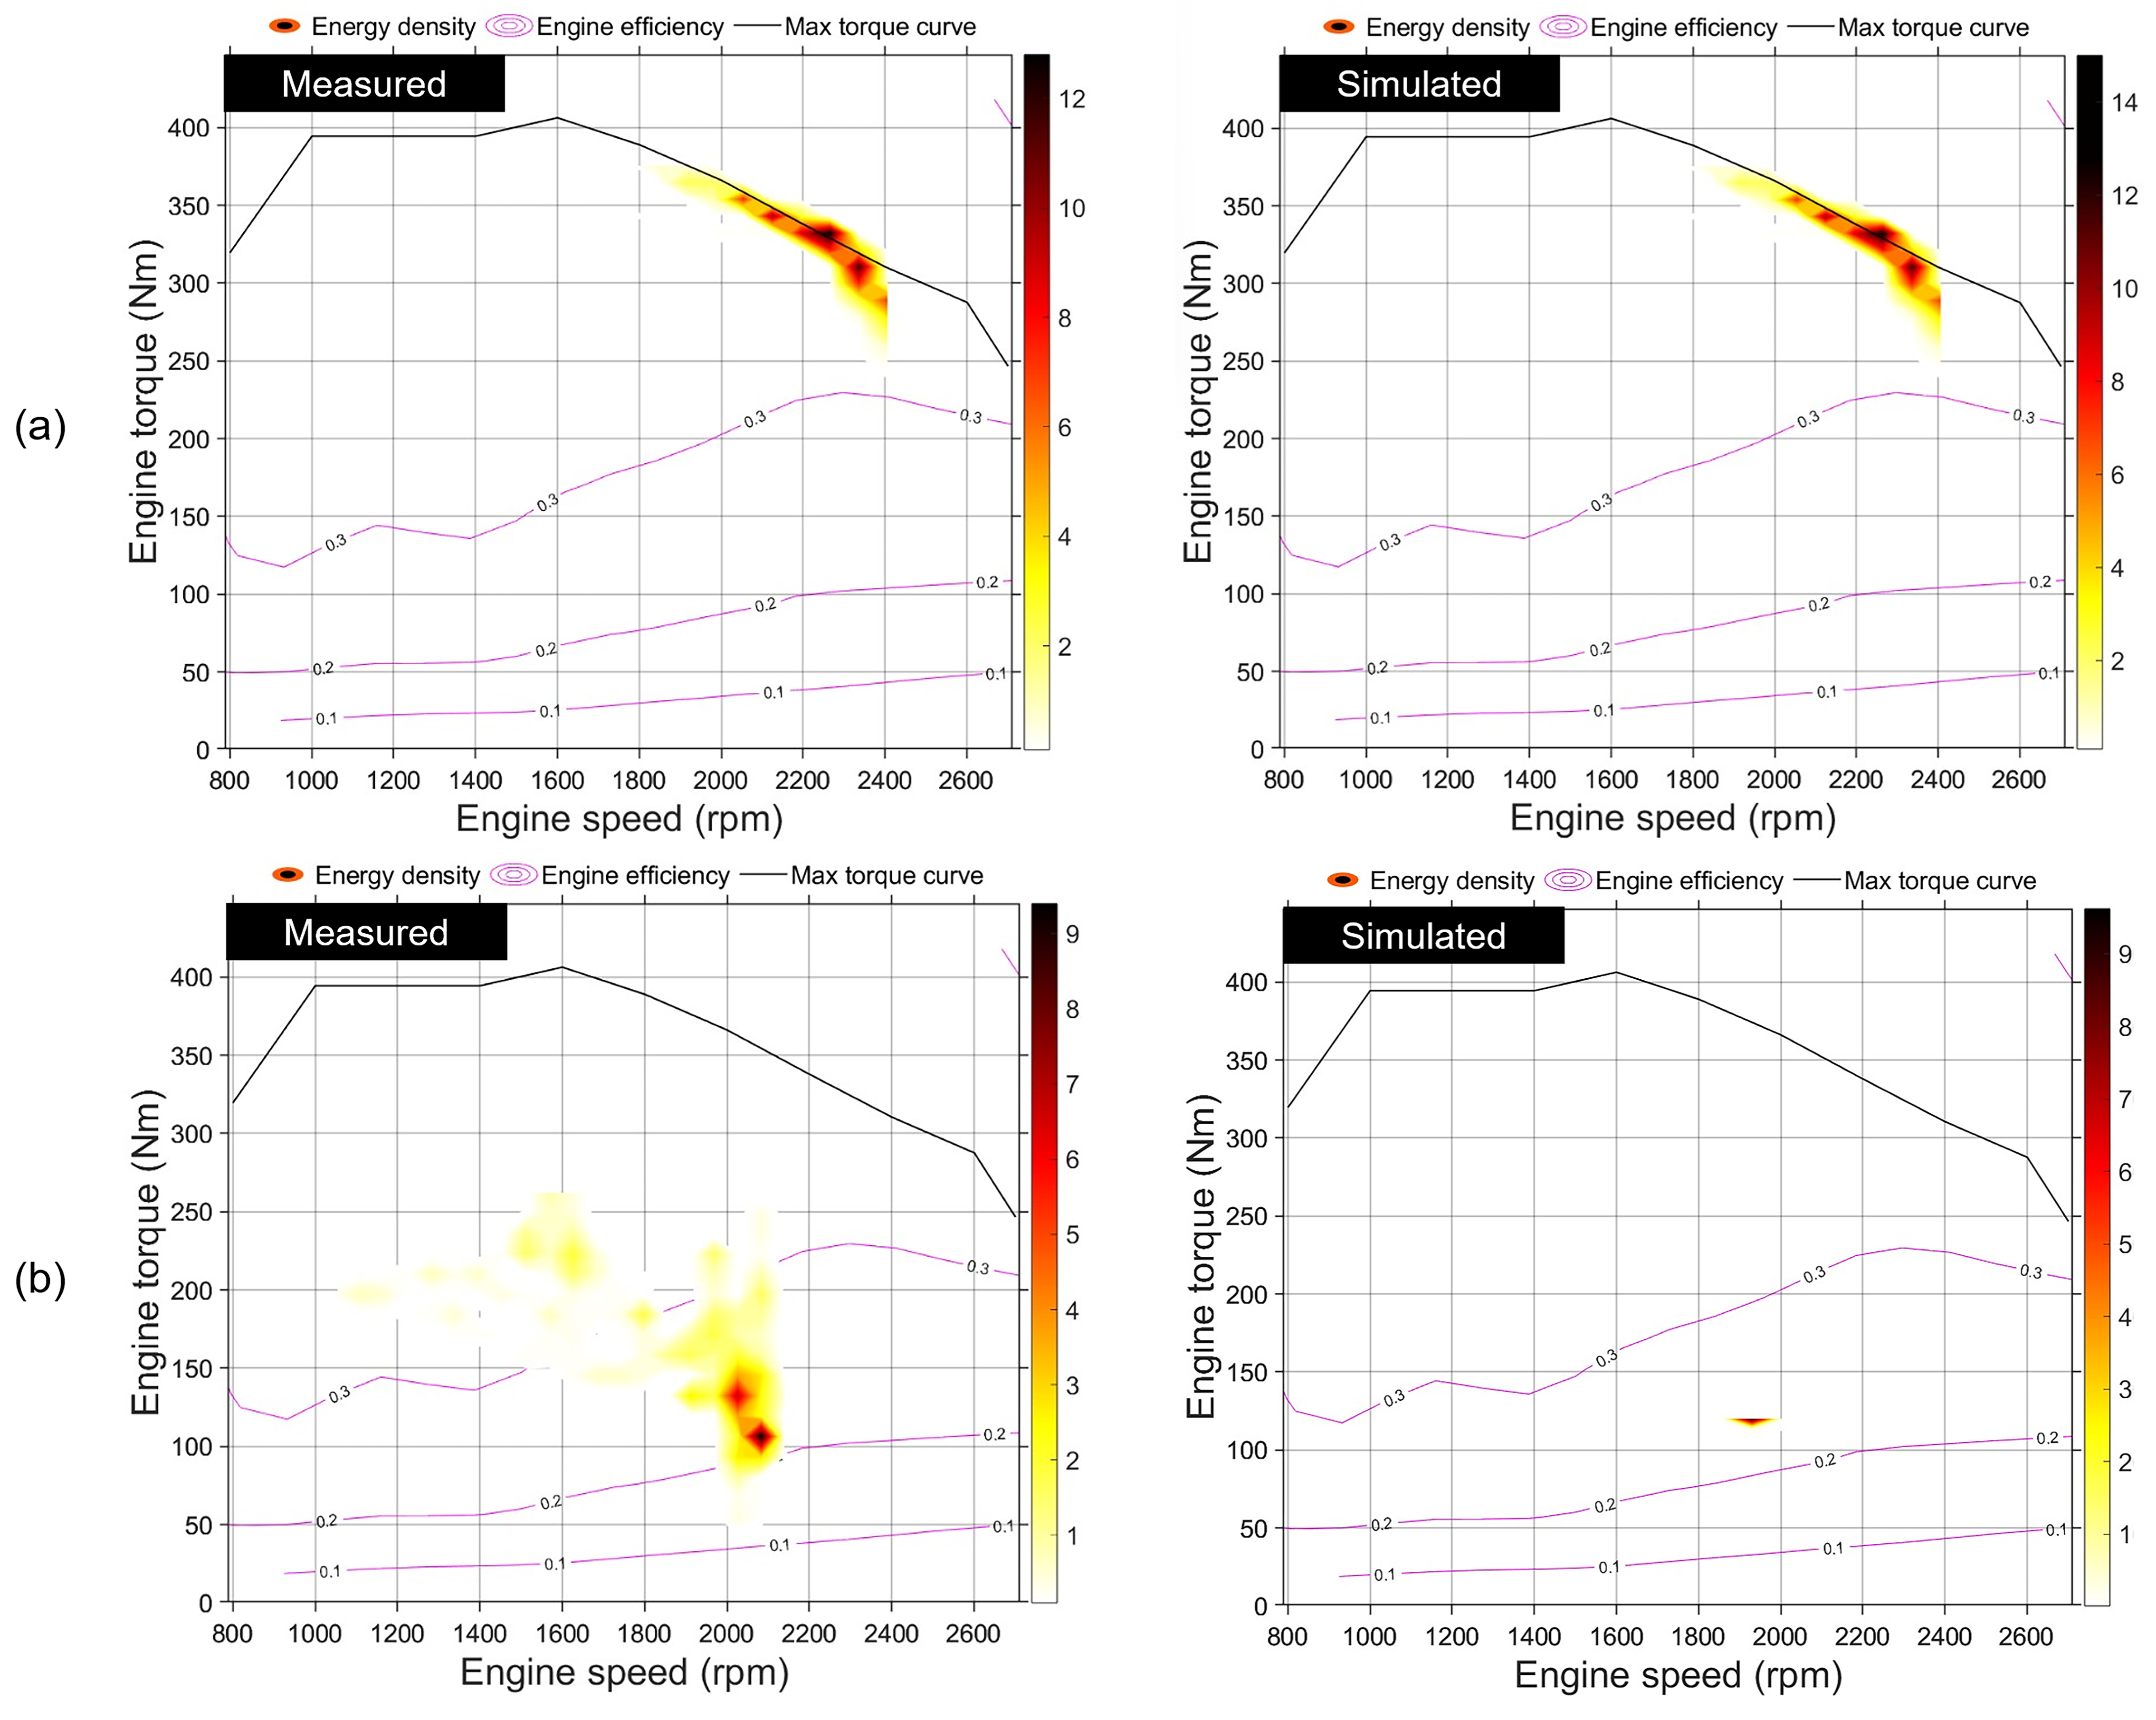
Figure 10 presents the engine operating point energy distributions for the measured and simulated cases under PTO-based operations. Overall, the simulation results reproduced the dominant operating regions observed in the measured data, although the level of agreement varied depending on the workload characteristics. For rotary tillage, the measured operating points were broadly distributed along the high-load region between approximately 1900–2450 rpm and 280–370 Nm. The simulated results exhibited a comparable operating distribution within approximately 2000–2400 rpm and 270–360 Nm, indicating that the model effectively represented the continuous high-load PTO operating characteristics of rotary tillage. For baling, the measured operating points were mainly concentrated around 1950–2100 rpm and 95–140 Nm, with a wider spread across the moderate-load region. In contrast, the simulated results showed a narrower operating distribution near 1900–1980 rpm and 115–125 Nm. Despite the narrower simulated distribution, both the measured and simulated results exhibited comparable load behavior under low-torque PTO operating conditions. These results indicate that the simulation model successfully reproduced the dominant operating characteristics observed during PTO-based operations.
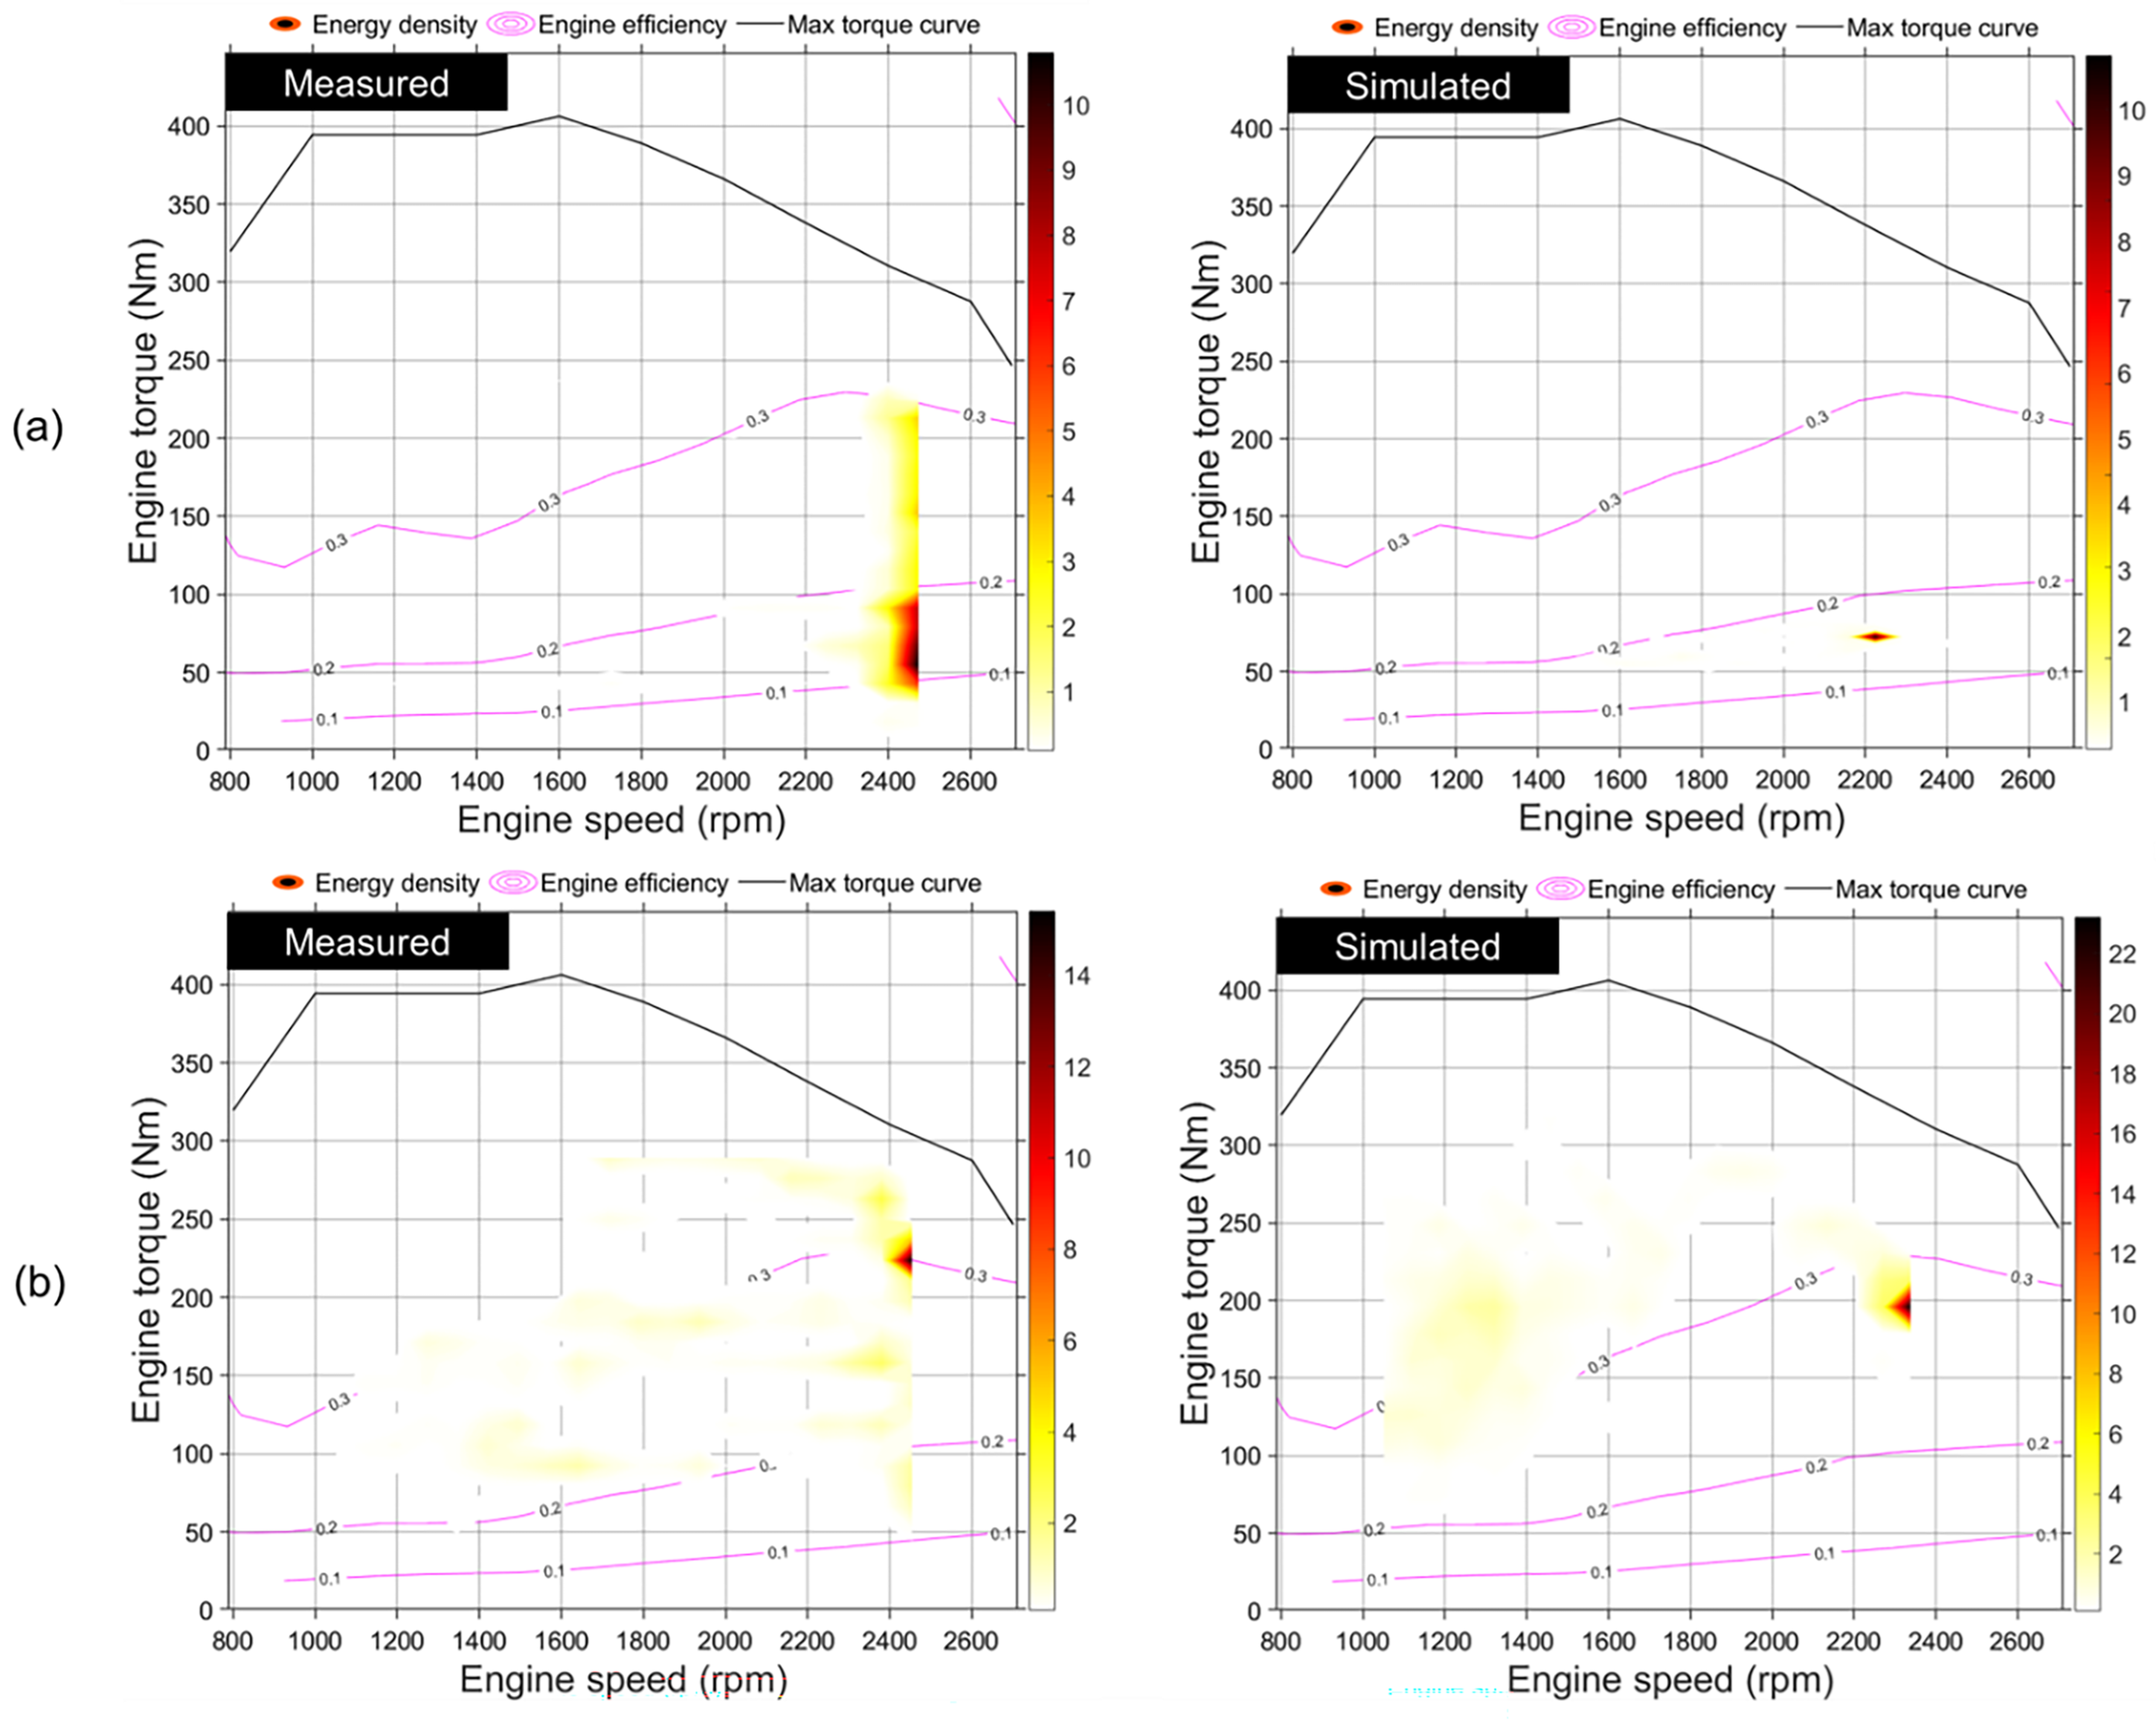
Figure 11 presents the engine operating point energy distributions for the measured and simulated cases under utility-based operations. Overall, the simulation results reproduced the general operating characteristics observed in the measured data, although differences in operating distribution were observed depending on the operation type. For transport, the measured operating points were mainly concentrated around 2450–2550 rpm and 40–100 Nm under high-speed and low-load conditions. The simulated results exhibited a narrower operating distribution near 2200–2300 rpm and 65–80 Nm. Despite the difference in the dominant engine speed range, both the measured and simulated results showed similar low-torque load behavior during transport operation. For loader operation, the measured operating points were broadly distributed across approximately 1200–2550 rpm and 70–280 Nm, indicating highly transient load behavior with wide variations in engine load. The simulated results also exhibited dispersed operating regions within approximately 1000–2350 rpm and 110–250 Nm, with the dominant energy distribution concentrated near 2250–2350 rpm and 185–210 Nm. Although differences in the detailed operating distribution were observed, the simulation model adequately represented the variable operating characteristics and energy utilization behavior of loader work. Across utility-based operations, the simulation results generally reproduced the dominant load behavior and energy utilization characteristics observed in the measured data.
Across all agricultural operations, the engine operating regions and energy utilization patterns varied according to the operational load characteristics. Traction- and PTO-based operations were associated with high engine torque and concentrated operating regions, whereas utility-based operations exhibited lower torque demand and broader operating distributions due to transient load variations. Although discrepancies were observed in the detailed operating distributions, the simulation model successfully reproduced the dominant engine load behavior observed under diverse agricultural workloads.

3.3. Operation-Level Energy Characteristics

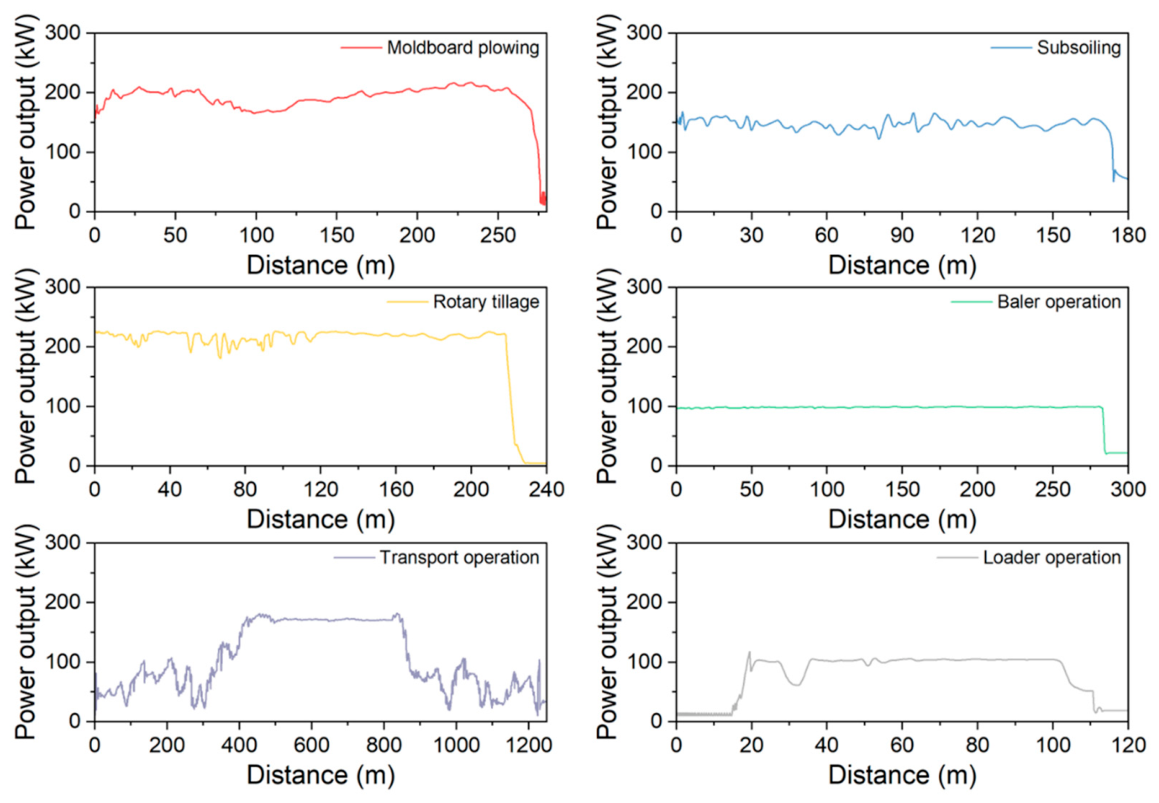
Figure 12 presents the distance-domain power output profiles for each agricultural operation. The field-derived operating cycles were originally processed as time-series data in the simulation model, and the corresponding power output was expressed as a function of cumulative travel distance calculated from vehicle speed over time. Therefore, the profiles represent the variation in instantaneous power output as the tractor progresses through each operation, rather than energy consumption per unit distance. Traction-intensive tillage operations generally required high and continuous power output, whereas utility-oriented tasks exhibited lower and more intermittent load behavior. In addition, transport showed substantial transient fluctuations associated with acceleration, deceleration, and varying road-load conditions during high-speed driving. These results indicate that both the magnitude and distribution of energy demand strongly depend on the workload characteristics of each agricultural task.
Moldboard plowing and rotary tillage exhibited the highest sustained power demand among the investigated tasks. Moldboard plowing maintained high continuous power output due to substantial draft resistance during soil-engaging operation. Rotary tillage exhibited high overall power output because both forward propulsion and PTO-driven rotary action were required simultaneously. However, as indicated by the preceding component-level power analysis, the PTO pathway represented the dominant power demand, whereas traction power was primarily required to maintain tractor forward motion. Therefore, the high-power output during rotary tillage was mainly associated with continuous power delivery to the PTO-driven implement. In contrast, subsoiling showed stable but lower load characteristics compared with moldboard plowing, whereas baling maintained nearly constant moderate power demand throughout the operating distance. Transport and loader work exhibited load characteristics distinct from field tillage operations. Transport showed substantial transient power fluctuations caused by repeated acceleration and varying driving resistance during high-speed travel. Although the average load level was lower than that of rotary tillage, the extended operating distance contributed to high cumulative energy demand. Loader work exhibited intermittent load behavior associated with repeated lifting and maneuvering actions, resulting in comparatively low average power demand among the investigated tasks. Overall, the results demonstrate that both the magnitude and temporal variation in energy demand are strongly influenced by the dominant operational mechanism, including traction load, PTO load, and vehicle maneuvering characteristics.
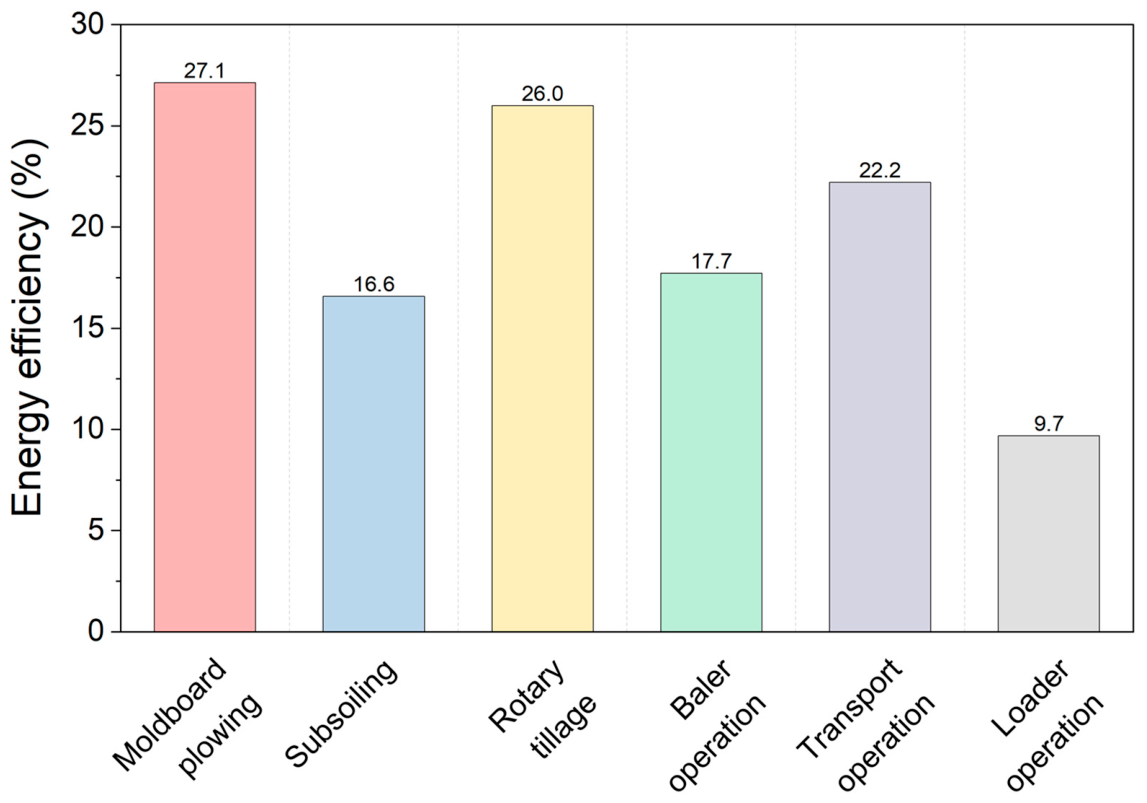
The energy efficiency results, calculated as the ratio between effective mechanical output delivered through the axle and/or PTO pathways and power source output, are presented in Figure 13. The results indicate that energy conversion characteristics varied considerably depending on the dominant load mechanism of each agricultural task. Moldboard plowing and rotary tillage exhibited the highest energy efficiency values of 27.1% and 26.0%, respectively, indicating that a relatively large portion of the power source output was converted into effective mechanical output through the traction and PTO pathways, respectively. In contrast, subsoiling and baler operation showed lower efficiency values of 16.6% and 17.7%, respectively, indicating a lower proportion of power source output converted into effective mechanical output under their operating conditions. Transport operation exhibited moderate energy efficiency of 22.2%, despite substantial transient fluctuations in power demand. This result indicates that a considerable portion of the generated energy was continuously utilized for vehicle propulsion during high-speed travel conditions. Loader operation showed the lowest efficiency value of 9.7% because, under the adopted efficiency definition, a substantial portion of the power demand was associated with intermittent hydraulic and maneuvering loads rather than axle or PTO output. Overall, the results demonstrate that energy efficiency strongly depends on the dominant load mechanism and the relative contribution of traction, PTO, and utility loads during agricultural operation.
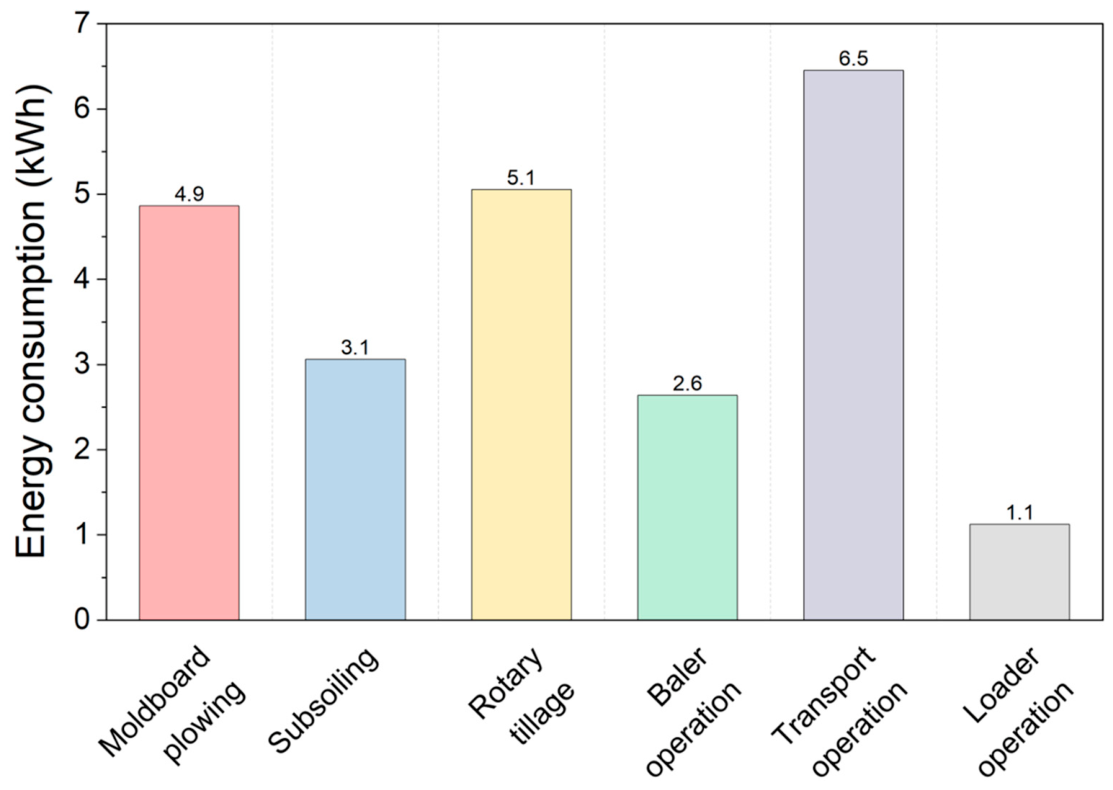
The operation-level energy consumption results are presented in Figure 14. Distinct differences in total energy demand were observed depending on the workload characteristics and operating duration of each agricultural task. Transport operation exhibited the highest total energy consumption of 6.5 kWh among the investigated operations. Although its average power demand was lower than that of rotary tillage and moldboard plowing, the transport operation was characterized by a substantially longer duty cycle and operating distance, resulting in the highest cumulative energy consumption. Rotary tillage and moldboard plowing also showed high energy consumption values of 5.1 and 4.9 kWh, respectively, reflecting their continuously high-power demand during field operation. In contrast, subsoiling and baler operation exhibited comparatively lower energy consumption despite sustained operating loads, with total energy consumption values of 3.1 and 2.6 kWh, respectively. Loader operation showed the lowest energy consumption of 1.1 kWh because of its short operating duration and intermittent load characteristics. Overall, the results indicate that operation-level energy consumption is influenced not only by instantaneous power demand but also by the cumulative effects of duty cycle duration and operating distance during agricultural operation.

3.4. Scenario-Based Energy Demand

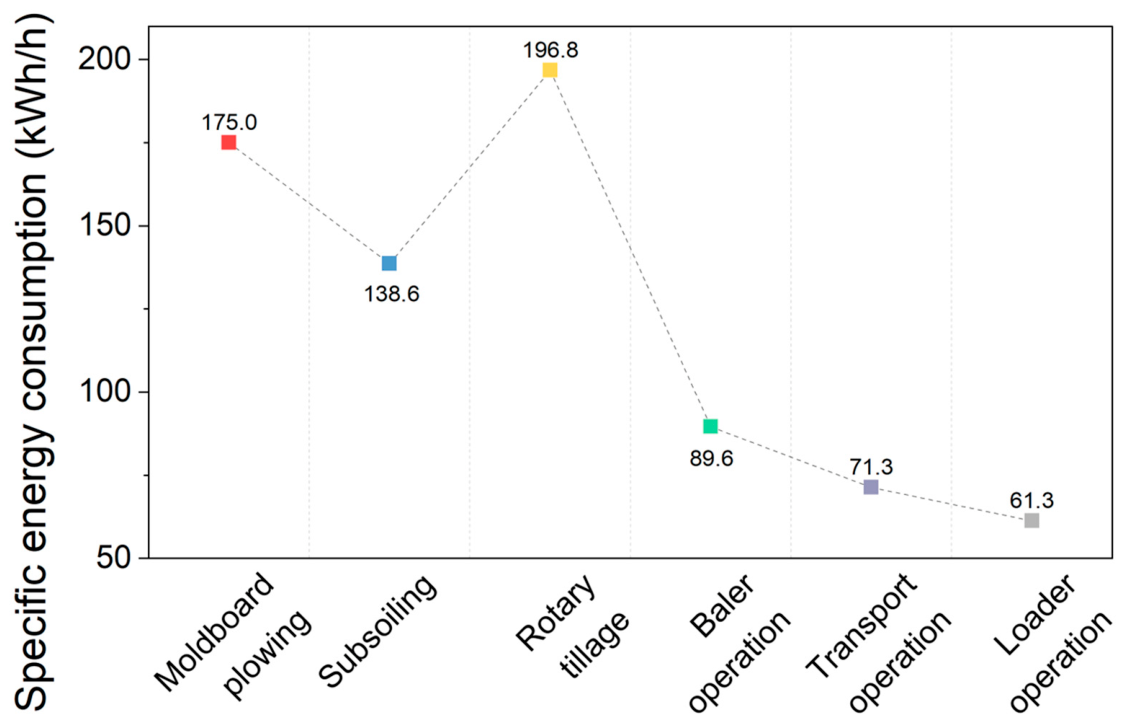
The SEC results for representative agricultural operations are presented in Figure 15. Unlike the total energy consumption results, the SEC values were normalized by operating time, enabling direct comparison of operation-level energy demand characteristics independent of duty cycle duration. Rotary tillage exhibited the highest SEC value of 196.8 kWh/h, primarily because of the continuous PTO-driven rotary load, with additional traction demand required to maintain forward motion. Moldboard plowing and subsoiling also showed high SEC values of 175.0 and 138.6 kWh/h, respectively, reflecting the high traction demand associated with continuous soil-engaging operations. Meanwhile, baler, transport, and loader operations exhibited comparatively lower SEC values of 89.6, 71.3, and 61.3 kWh/h, respectively. In particular, transport operation showed the highest total energy consumption in Figure 14 because of its long duty cycle duration; however, its SEC value was considerably lower than those of traction- and PTO-intensive tillage operations after normalization by operating time. This result indicates that the large cumulative energy demand of transport operation primarily originated from extended operating duration rather than high instantaneous power demand. Loader operation exhibited the lowest SEC value because of its intermittent operating characteristics and comparatively low continuous load requirement. Overall, the SEC results demonstrate that the intrinsic energy demand characteristics of agricultural operations are strongly influenced by the dominant load mechanism and workload characteristics of each operation.
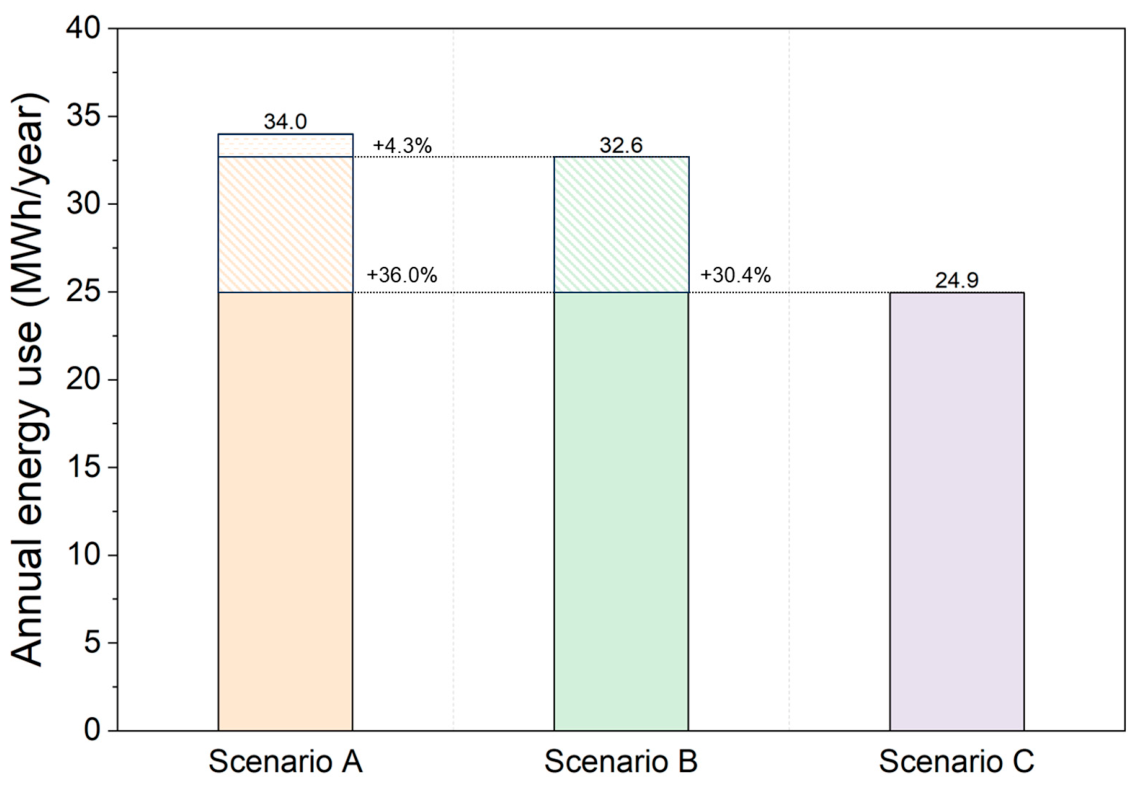
The AEU results under representative agricultural workload scenarios are presented in Figure 16. Scenario A exhibited the highest AEU of 34.0 MWh/year, followed by Scenario B with 32.6 MWh/year, whereas Scenario C showed the lowest AEU of 24.9 MWh/year. The differences among scenarios primarily originated from variations in workload composition. Scenario A showed the highest AEU because traction-intensive operations such as moldboard plowing and subsoiling accounted for a large proportion of the workload. Similarly, Scenario B also exhibited high AEU due to the substantial contribution of PTO-intensive rotary tillage operation, which showed the highest SEC among the investigated operations. By comparison, Scenario C was dominated by transport and loader operations with lower SEC values, resulting in considerably reduced AEU. Compared with Scenario C, the AEU increased by approximately 36.0% and 30.4% under Scenarios A and B, respectively. In addition, Scenario A showed a slightly higher AEU than Scenario B by approximately 4.3%, indicating that traction-intensive workload composition imposed marginally greater overall energy demand than PTO-intensive workload composition under the investigated operating conditions. Overall, the results demonstrate that tractor AEU is strongly influenced by the composition of agricultural operations within the workload scenario. The SEC and AEU results are summarized in Table 8.
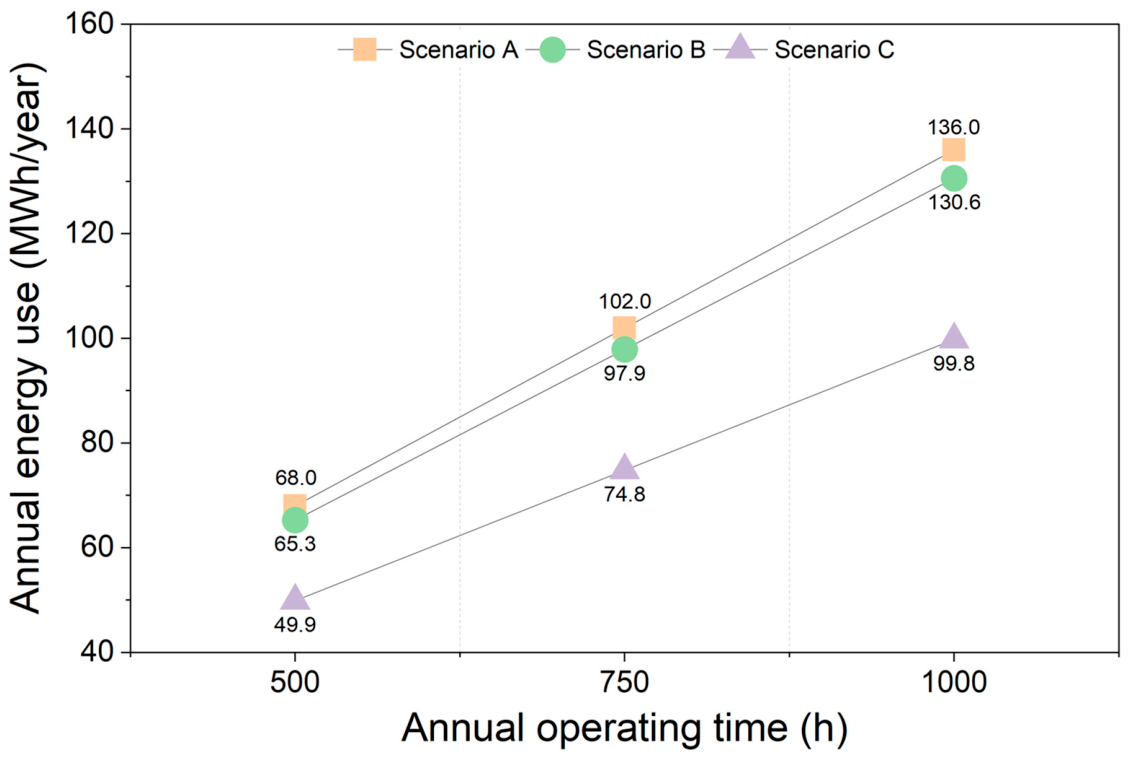
The sensitivity of AEU to the AOT under representative agricultural workload scenarios is presented in Figure 17. As the AOT increased from 500 to 1000 h/year, the AEU of all scenarios increased nearly linearly because the workload composition remained constant while the total operating duration increased. Scenario A consistently showed the highest AEU across all AOT conditions, increasing from 68.0 to 136.0 MWh/year as AOT increased from 500 to 1000 h/year. Scenario B exhibited a similar trend, with AEU increasing from 65.3 to 130.6 MWh/year. Meanwhile, Scenario C showed the lowest AEU, ranging from 49.9 to 99.8 MWh/year over the same AOT range. The relative difference among scenarios remained nearly constant regardless of AOT because the operation-level SEC characteristics directly scaled with operating duration. The results indicate that workload composition has a persistent influence on tractor energy demand even under varying annual utilization conditions. In particular, traction- and PTO-intensive scenarios maintained substantially higher AEU than the utility-intensive scenario throughout the investigated AOT range. These findings suggest that both workload composition and annual utilization should be considered simultaneously when estimating tractor energy demand and evaluating future powertrain requirements under practical agricultural operating conditions.

4. Discussion

The results demonstrate that the energy demand characteristics of agricultural tractors are strongly influenced by workload composition. Although the same tractor platform was evaluated under identical powertrain conditions, substantial differences in SEC and AEU were observed depending on the dominant operation type within each scenario. Unlike conventional road vehicles, for which representative duty cycles are primarily characterized by vehicle speed and traction demand, agricultural tractors perform heterogeneous tasks involving fundamentally different load mechanisms and power-transfer pathways, including traction-, PTO-, and utility-based operations. Therefore, a single representative duty cycle may capture the characteristics of a specific operation but may not adequately represent the overall energy demand arising from combinations of agricultural tasks. Traction-intensive workloads were associated with the highest AEU because operations such as moldboard plowing and subsoiling required sustained high traction power and exhibited high SEC values. PTO-intensive workloads also showed elevated AEU due to the continuous and cyclic PTO-driven power demands associated with rotary tillage and baler operation, respectively. By comparison, utility-oriented workloads exhibited the lowest AEU because transport and loader operations generally required lower SEC values. The sensitivity analysis further demonstrated that AOT had a nearly proportional influence on AEU across all workload scenarios, while the relative differences among scenarios remained generally consistent. These results indicate that operation-specific energy characteristics and their relative composition jointly determine the workload-dependent energy demand of agricultural tractors, whereas annual utilization primarily governs the overall scaling of cumulative annual energy consumption.
The engineering implications of the workload-dependent energy demand characteristics are summarized in Table 9. The results suggest that workload composition should be considered as an important design factor during the sizing, development, and evaluation of future electrified agricultural tractor powertrains. Traction-intensive workloads characterized by sustained high-load operation may require higher continuous traction-power capability and larger usable onboard energy storage, while hybridized powertrain architectures may provide an alternative for maintaining extended high-load operation. PTO-intensive workloads place greater emphasis on continuous power capability because substantial power must be delivered to the implement over prolonged operating periods. Accordingly, the power rating and thermal management of the electric powertrain components become particularly important under PTO-dominant workloads. In contrast, utility-oriented workloads with lower SEC and AEU impose comparatively lower continuous energy requirements and may therefore provide more favorable operating conditions for battery electric tractor applications. These findings indicate that electrified tractor powertrain sizing should consider not only peak power demand but also the magnitude, duration, and composition of operation-specific workloads when determining power capability, onboard energy storage, and thermal management requirements.
The primary contribution of this study is the establishment of a scenario-based framework that integrates field-measured operation-specific energy characteristics with workload composition to quantify annual tractor energy demand. Nevertheless, several limitations should be acknowledged. The analysis was conducted using representative agricultural operations for a single tractor class, and the workload proportions used in the scenarios were defined as structured assumptions for comparative analysis rather than being derived from national agricultural statistics, farm surveys, or long-term telematics data. Therefore, the estimated AEU values should be interpreted as scenario-based results rather than as specific regional or farm-level annual energy inventories, because actual workload compositions may vary depending on farming practices, crop type, field conditions, and seasonal requirements. Furthermore, the present study focused on the energy characteristics of a conventional tractor platform, while direct evaluation and numerical sizing of electrified powertrain components were beyond the scope of this work. Future studies will extend the proposed framework by incorporating empirically derived workload distributions and electrified tractor powertrain models to quantitatively assess workload-dependent energy demand and corresponding powertrain requirements.

5. Conclusions

This study investigated the energy characteristics of a 100 hp-class agricultural tractor under representative agricultural operations using field-measured workload data and a scenario-based energy analysis framework. Six representative operations, including moldboard plowing, subsoiling, rotary tillage, baler operation, transport operation, and loader operation, were analyzed to evaluate operation-level energy characteristics and annual energy demand under different workload compositions. The results showed that tractor energy demand varied substantially depending on the workload characteristics of each agricultural task. Traction-intensive operations exhibited sustained high-power demand and high SEC values, while rotary tillage showed the highest SEC because of continuous PTO power demand. Utility-oriented operations generally exhibited lower SEC values despite long operating durations during transport operation. Scenario-based analysis demonstrated that workload composition strongly affected AEU characteristics. The traction-intensive scenario showed the highest AEU, whereas the utility-oriented scenario exhibited the lowest AEU. Sensitivity analysis further revealed that AOT had an approximately proportional influence on AEU across all scenarios, while the relative differences among scenarios remained generally consistent. The results also highlighted important implications for agricultural tractor electrification. Traction- and PTO-intensive workloads may require larger onboard energy storage systems, hybridized architectures, or enhanced thermal management capability due to sustained high-load operation. In contrast, utility-oriented workloads may provide more favorable operating conditions for battery electric tractor applications. The primary contribution of this study is the development of a scenario-based energy analysis framework integrating field-measured operation-level energy characteristics into representative workload scenarios. Future work will extend the proposed framework to evaluate the energy characteristics of alternative electrified tractor powertrains using the operational datasets and workload scenarios developed in this study.


Author Contributions

Conceptualization, S.-M.B.; methodology, S.-M.B., W.-S.K. and H.-H.J.; software, S.-M.B. and N.K.; validation, S.-M.B. and N.K.; formal analysis, S.-M.B., W.-S.K. and H.-H.J.; investigation, S.-M.B., W.-S.K. and H.-H.J.; resources, S.-M.B. and N.K.; data curation, S.-M.B., W.-S.K. and H.-H.J.; writing—original draft preparation, S.-M.B.; writing—review and editing, S.-M.B. and Y.-J.K.; visualization, S.-M.B.; supervision, Y.-J.K.; project administration, Y.-J.K.; funding acquisition, Y.-J.K. All authors have read and agreed to the published version of the manuscript.

Funding

This work was supported by Korea Institute of Planning and Evaluation for Technology in Food, Agriculture, Forestry (IPET) through Eco-friendly Power Source Application Agricultural Machinery Technology Development Program, funded by Ministry of Agriculture, Food and Rural Affairs (MAFRA) (322047-5).

Data Availability Statement

The raw data supporting the conclusions of this article will be made available by the authors on request.

Acknowledgments

The authors would like to acknowledge the financial support received from Gurpreet Singh (Transportation Technologies Office, U.S. Department of Energy) to conduct this work. The submitted manuscript has been created by the UChicago Argonne, LLC, Operator of Argonne National Laboratory (“Argonne”). Argonne, a U.S. Department of Energy Office of Science laboratory, is operated under Contract No. DE-AC02-06CH11357. The U.S. Government retains for itself, and others acting on its behalf, a paid-up nonexclusive, irrevocable worldwide license in said article to reproduce, prepare derivative works, distribute copies to the public, and perform publicly and display publicly, by or on behalf of the Government.

Conflicts of Interest

The authors declare no conflicts of interest.

References

  1. Saetti, M.; Mattetti, M.; Varani, M.; Lenzini, N.; Molari, G. On the Power Demands of Accessories on an Agricultural Tractor. Biosyst. Eng. 2021, 206, 109–122. [Google Scholar] [CrossRef] [Scilit]
  2. Kim, W.S.; Kim, Y.J.; Kim, Y.S.; Park, S.U.; Lee, K.H.; Hong, D.H.; Choi, C.H. Evaluation of the Fatigue Life of a Tractor’s Transmission Spiral Bevel Gear. J. Terramech. 2021, 94, 13–22. [Google Scholar] [CrossRef] [Scilit]
  3. Gong, S.Y.; Lee, S.E.; Min, Y.S.; Baek, S.M.; Baek, S.Y.; Kim, Y.J.; Kim, W.S. Prediction of Tractor Drawbar Pull under Different Tillage Tools Using Machine Learning and Low-Cost Sensors. Sci. Rep. 2025, 15, 41100. [Google Scholar] [CrossRef] [Scilit] [PubMed]
  4. Kim, N.; Yan, Z.; Vijayagopal, R.; Jung, J.; He, X. Evaluation of Advanced Powertrain Technologies for Large Agricultural Tractors: Insights on Energy Consumption and Life Cycle Environmental Impact. SAE Int. J. Sustain. Transp. Energy Environ. Policy 2025, 6, 221–242. [Google Scholar] [CrossRef] [Scilit]
  5. Kivekäs, K.; Lajunen, A. Energy Efficiency and Carbon Dioxide Emissions of Agricultural Tractors Using Different Powertrains. Energy Rep. 2025, 14, 2755–2767. [Google Scholar] [CrossRef] [Scilit]
  6. Gereziher, E.T.; Cioccolo, E.; Rossi, P.; Monarca, D.; Bacenetti, J. Duty Cycles of Diesel and Electric Narrow Tractors in Viticulture: Battery Sizing, Energy Demand, and Greenhouse Gas Emissions. Energy Convers. Manag. X 2026, 30, 101835. [Google Scholar] [CrossRef] [Scilit]
  7. Yin, B.; Yun, L.; Xie, X.; Wang, J.; Huang, Y. Optimized Fuzzy Control Energy Management Strategy for Hybrid Tractors Considering Working Conditions Adaptation. J. Mech. Sci. Technol. 2025, 39, 3443–3455. [Google Scholar] [CrossRef] [Scilit]
  8. Lajunen, A.; Kivekäs, K.; Freyermuth, V.; Vijayagopal, R.; Kim, N. Simulation-Based Assessment of Energy Consumption of Alternative Powertrains in Agricultural Tractors. World Electr. Veh. J. 2024, 15, 86. [Google Scholar] [CrossRef] [Scilit]
  9. Mattetti, M.; Annesi, G.; Intrevado, F.P.; Alberti, L. Investigating the Efficiency of Hybrid Architectures for Agricultural Tractors Using Real-World Farming Data. Appl. Energy 2025, 377, 124499. [Google Scholar] [CrossRef] [Scilit]
  10. Zhang, S.L.; Wen, C.K.; Ren, W.; Luo, Z.H.; Xie, B.; Zhu, Z.X.; Chen, Z.J. A Joint Control Method Considering Travel Speed and Slip for Reducing Energy Consumption of Rear Wheel Independent Drive Electric Tractor in Ploughing. Energy 2023, 263, 126008. [Google Scholar] [CrossRef] [Scilit]
  11. Siddique, M.A.A.; Jeon, H.H.; Baek, S.Y.; Kim, Y.J. Energy-Saving Performance of Kalman Filtering and Artificial Neural Network Algorithm for Axle Torque and Battery SOC Estimation of Electric Tractor Using AMESim Model. Comput. Electron. Agric. 2026, 249, 111860. [Google Scholar] [CrossRef] [Scilit]
  12. Yu, Q.; He, X.; Chen, Y.; Jiang, Z.; Tan, Y.; Liu, L.; Xie, B.; Wen, C. Multi-Objective Optimization for Energy-Efficient Management of Electric Tractors via Hybrid Energy Storage Systems and Scenario Recognition. Appl. Energy 2025, 391, 125898. [Google Scholar] [CrossRef] [Scilit]
  13. Luo, Z.H.; Xie, B.; Tong, Y.K.; Zhao, Z.H.; Zheng, B.W.; Chen, Z.Y.; Wen, C.K. Energy-Saving Drive Control Strategy for Electric Tractors Based on Terrain Parameter Identification. Appl. Energy 2024, 376, 124230. [Google Scholar] [CrossRef] [Scilit]
  14. Li, L.; Chen, J.; Nie, J.; Gao, Z. Reinforcement Learning Energy Management Control Strategy of Electric Tractor Based on Condition Identification. Int. J. Electr. Power Energy Syst. 2025, 170, 110846. [Google Scholar] [CrossRef] [Scilit]
  15. Wen, C.K.; Zhang, S.L.; Xie, B.; Song, Z.H.; Li, T.H.; Jia, F.; Han, J.G. Design and Verification Innovative Approach of Dual-Motor Power Coupling Drive Systems for Electric Tractors. Energy 2022, 247, 123538. [Google Scholar] [CrossRef] [Scilit]
  16. Kim, Y.S.; Lee, S.D.; Baek, S.M.; Baek, S.Y.; Jeon, H.H.; Lee, J.H.; Abu Ayub Siddique, M.; Kim, Y.J.; Kim, W.S.; Sim, T.; et al. Development of DEM-MBD Coupling Model for Draft Force Prediction of Agricultural Tractor with Plowing Depth. Comput. Electron. Agric. 2022, 202, 107405. [Google Scholar] [CrossRef] [Scilit]
  17. Wang, Q.; Wang, X.; Wang, W.; Song, Y.; Cui, Y. Joint Control Method Based on Speed and Slip Rate Switching in Plowing Operation of Wheeled Electric Tractor Equipped with Sliding Battery Pack. Comput. Electron. Agric. 2023, 215, 108426. [Google Scholar] [CrossRef] [Scilit]
  18. Baek, S.M.; Jeon, H.H.; Kim, W.S.; Kim, Y.S.; Kim, Y.J. Design Load Analysis for Electrification of a 55-kW Agricultural Tractor Based on Workload. Sci. Rep. 2026, 16, 17508. [Google Scholar] [CrossRef] [Scilit] [PubMed]
  19. Hensh, S.; Tewari, V.K.; Upadhyay, G. A Novel Wireless Instrumentation System for Measurement of PTO (Power Take-off) Torque Requirement during Rotary Tillage. Biosyst. Eng. 2021, 212, 241–251. [Google Scholar] [CrossRef] [Scilit]
  20. Wang, L.; Liu, F.; Song, Z.; Ni, Y.; He, Z.; Zhai, Z.; Zhu, Z.; Zhou, Q.; Song, Z.; Li, Z. Advances in Tractor Rollover and Stability Control: Implications for off-Road Driving Safety. Comput. Electron. Agric. 2024, 226, 109483. [Google Scholar] [CrossRef] [Scilit]
  21. Baek, S.Y.; Jeon, H.H.; Kim, W.S.; Kim, Y.S.; Kim, Y.J. Slip Control Model for an Electric Tractor with Four-Wheel Independent Driving E-Axle Systems. Comput. Electron. Agric. 2026, 244, 111452. [Google Scholar] [CrossRef] [Scilit]
  22. Kim, N.; Seo, J.; Vijayagopal, R.; Burnham, A.; Makarczyk, D.; Freyermuth, V. Development of the Power- and Usage-Based Simulator for Evaluating Off-Road Mobile Machinery Energy Consumption. In Proceedings of the WCX SAE World Congress Experience, Detroit, MI, USA, 8 April 2025; SAE Technical Papers; pp. 1–11. [Google Scholar] [CrossRef] [Scilit]
  23. Varlese, C.; Ferrara, A.; Hametner, C.; Hofmann, P. Experimental Validation of a Predictive Energy Management Strategy for Agricultural Fuel Cell Electric Tractors. Int. J. Hydrogen Energy 2024, 77, 1–14. [Google Scholar] [CrossRef] [Scilit]
  24. Perez Estevez, M.A.; Melendez Frigola, J.; Armengol Llobet, J.; Alberti, L.; Renzi, M. Optimal Design of a Series Hybrid Powertrain for an Agricultural Tractor. Energy Convers. Manag. X 2024, 24, 100789. [Google Scholar] [CrossRef] [Scilit]
  25. Kim, W.S.; Kim, Y.J.; Baek, S.M.; Moon, S.P.; Lee, N.G.; Kim, Y.S.; Park, S.U.; Choi, Y.; Kim, Y.K.; Choi, I.S.; et al. Fatigue Life Simulation of Tractor Spiral Bevel Gear According to Major Agricultural Operations. Appl. Sci. 2020, 10, 8898. [Google Scholar] [CrossRef] [Scilit]
  26. Shao, X.; Yang, Z.; Mowafy, S.; Zheng, B.; Song, Z.; Luo, Z.; Guo, W. Load Characteristics Analysis of Tractor Drivetrain under Field Plowing Operation Considering Tire-Soil Interaction. Soil Tillage Res. 2023, 227, 105620. [Google Scholar] [CrossRef] [Scilit]
  27. Do, Y.W.; Baek, S.M.; Baek, S.Y.; Jeon, H.H.; Kim, Y.S.; Kim, Y.J.; Kim, W.S. Determining Exhaust Emissions (CO, NOx, PM) for a Combine Harvester Based on Measured Engine Load and Emission Factors Using PEMS during Actual Field Operation. Comput. Electron. Agric. 2025, 231, 110026. [Google Scholar] [CrossRef] [Scilit]
  28. Siddique, M.A.A.; Kim, Y.J.; Baek, S.M.; Baek, S.Y.; Han, T.H.; Kim, W.S.; Kim, Y.S.; Lim, R.G.; Choi, Y. Development of the Reliability Assessment Process of the Hydraulic Pump for a 78 kW Tractor during Major Agricultural Operations. Agriculture 2022, 12, 1609. [Google Scholar] [CrossRef] [Scilit]
  29. Lombardi, S.; Di Ilio, G.; Tribioli, L.; Jannelli, E. Optimal Design of an Adaptive Energy Management Strategy for a Fuel Cell Tractor Operating in Ports. Appl. Energy 2023, 352, 121917. [Google Scholar] [CrossRef] [Scilit]
  30. Wen, C.K.; Ren, W.; Zhu, Q.Z.; Zhao, C.J.; Luo, Z.H.; Zhang, S.L.; Xie, B.; Meng, Z.J. Reducing Operation Emissions and Improving Work Efficiency Using a Pure Electric Wheel Drive Tractor. Engineering 2024, 37, 230–245. [Google Scholar] [CrossRef] [Scilit]
  31. Baek, S.M.; Jeon, H.H.; Kim, W.S.; Kim, Y.S.; Kim, Y.J. Design and Analysis of a Power Transmission System for 55 kW Electric Tractor Using Agricultural Workload Data. Sci. Rep. 2025, 15, 28028. [Google Scholar] [CrossRef] [Scilit] [PubMed]
  32. Ahn, D.V.; Kim, J.T.; Kim, K.; Han, G.H.; Cho, S.J.; Kim, W.; Park, Y.J. Determination of Design Requirements and Characteristic Analysis of Powertrain Configurations for Electric Tractors Based on Actual Agricultural Workload. Sci. Rep. 2026, 16, 14381. [Google Scholar] [CrossRef] [Scilit] [PubMed]
  33. Kim, W.S.; Kim, Y.J.; Park, S.U.; Kim, Y.S. Influence of Soil Moisture Content on the Traction Performance of a 78-kW Agricultural Tractor during Plow Tillage. Soil Tillage Res. 2020, 207, 104851. [Google Scholar] [CrossRef] [Scilit]
  34. Colendi, L.; Tentarelli, M.; Varani, M.; Mattetti, M. CANBUS to Drawbar Load Estimation: Mapping Real-World Tractor Loads for Mission Profiling. Smart Agric. Technol. 2026, 13, 101777. [Google Scholar] [CrossRef] [Scilit]
Figure 1. Instrumentation and data acquisition system of the test tractor including engine CAN communication, axle torque and speed measurement, PTO torque sensor, load cell for draft force, fuel flow sensor, and GPS.
Agriculture 16 01870 g001
Figure 2. Representative agricultural operations considered in this study: moldboard plowing, subsoiling, rotary tillage, baling, transport, and loader operation.
Agriculture 16 01870 g002
Figure 3. Baseline diesel tractor model used in vehicle system simulation.
Agriculture 16 01870 g003
Figure 4. Validation process of the baseline tractor model using multiple performance metrics.
Agriculture 16 01870 g004
Figure 5. Time-series workload characteristics of representative traction-based tractor operations: (a) moldboard plowing and (b) subsoiling.
Agriculture 16 01870 g005
Figure 6. Time-series workload characteristics of representative PTO-based tractor operations: (a) rotary tillage and (b) baler operation.
Agriculture 16 01870 g006
Figure 7. Time-series workload characteristics of representative utility-based tractor operations: (a) transport operation and (b) loader operation.
Agriculture 16 01870 g007
Figure 8. Comparison of engine output energy distribution across representative agricultural operations.
Agriculture 16 01870 g008
Figure 9. Engine operating point energy distribution on the speed–torque map for measured and simulated cases under traction-based operations: (a) moldboard plowing and (b) subsoiling.
Agriculture 16 01870 g009
Figure 10. Engine operating point energy distribution on the speed–torque map for measured and simulated cases under PTO-based operations: (a) rotary tillage and (b) baler operation.
Agriculture 16 01870 g010
Figure 11. Engine operating point energy distribution on the speed–torque map for measured and simulated cases under utility-based operations: (a) transport operation and (b) loader operation.
Agriculture 16 01870 g011
Figure 12. Comparison of distance-domain power output profiles for representative agricultural operations.
Agriculture 16 01870 g012
Figure 13. Comparison of energy efficiency for representative agricultural operations.
Agriculture 16 01870 g013
Figure 14. Comparison of energy consumption for representative agricultural operations.
Agriculture 16 01870 g014
Figure 15. Variation in specific energy consumption under representative agricultural operations.
Agriculture 16 01870 g015
Figure 16. Annual energy use under representative agricultural workload scenarios.
Agriculture 16 01870 g016
Figure 17. Sensitivity of annual energy use to annual operating time under representative agricultural workload scenarios.
Agriculture 16 01870 g017
Table 1. Technical specifications of the 100 hp-class diesel engine tractor.
ItemSpecification
Overall dimensions
(L × W × H)
4225 ×   2140   × 2830 mm
Mass3985 kg
Diesel engineRated power: 78 kW at 2300 rpm
Maximum torque: 430 Nm at 1400 rpm
Transmission4-speed transmission with 4 ranges and High/Low stages (32F/32R)
Table 2. Technical specifications of representative agricultural implements used for different operations including moldboard plow, subsoiler, rotavator, baler, and loader.
ItemMoldboardSubsoilerRotavatorBalerLoader
ModelWJSP-8
(WOONGJIN)
WHDP500
(WECAN
GLOBAL)
E260
(CELLI)
TAB5310
(TYM)
TX105SL
(TYM)
Overall dimensions
(L × W × H, mm)
2800 ×   2150   × 12501800 ×   2095   × 13802765 ×   2570   × 7804000 ×   2900   × 2520-
Mass (kg)7908709503100894
Working width (mm)28002095230029002200
Number of ridges (Blades)8554--
Table 3. Characteristics of field test sites including geographic location, operation type, and soil properties for each operation.
ItemSite 1Site 2Site 3Site 4Site 5Site 6
LocationSeosanDangjinBuanGongjuDangjinGongju
OperationMoldboard plowingSubsoilingRotary
tillage
Baler
operation
Transport
operation
Loader
operation
Soil texture
(Sand:silt:clay, %)
Loamy sand
(79:14:7)
Silt loam
(24:56:20)
Loamy sand
(85:13:2)
Loam
(45:36:19)
-Loam
(32:50:18)
Cone index (kPa)5005244181275-1393
Soil moisture content (%)41.333.843.322.6-20.5
Table 4. Field experiment conditions of the instrumented tractor for each agricultural operation.
ItemMoldboard PlowingSubsoilingRotary
Tillage
Baler
Operation
Transport
Operation
Loader
Operation
Engine speed (rpm)251025102510251025102510
Travel speed (km/h)7.09
(M3 Low)
2.38
(L3 Low)
2.83
(L3 High)
3.78
(M1 Low)
37.09
(H4 High)
1.27
(L1 Low)
PTO speed (rpm)--540
(1st stage)
540
(1st stage)
--
Working depth (cm)15–2035–4015–20---
Table 5. Definition of operating scenarios based on the workload composition of representative traction-, PTO-, and utility-based tractor operations.
ScenarioWorkload Composition (%)
Traction-BasedPTO-BasedUtility-Based
Moldboard PlowingSubsoilingRotary
Tillage
Baler
Operation
Transport OperationLoader
Operation
A303010101010
B101030301010
C101010103030
Table 6. Summary of power characteristics for representative agricultural operations.
ItemMoldboard PlowingSubsoilingRotary
Tillage
Baler
Operation
Transport OperationLoader
Operation
Engine power
(kW)
65.8 ± 17.5 a38.0 ± 11.6 b66.2 ± 24.3 a28.0 ± 7.9 c18.4 ± 12.1 d17.8 ± 13.5 e
Axle power
(kW)
49.4 ± 4.7 a24.0 ± 2.9 b4.6 ± 2.1 d6.3 ± 3.0 c6.2 ± 3.3 c4.8 ± 5.4 d
Traction power
(kW)
31.8 ± 1.1 a15.8 ± 0.6 b----
PTO power
(kW)
--53.3 ± 22.7 a18.1 ± 8.5 b--
Note: Values are expressed as mean ± standard deviation. Different superscript letters within the same row indicate significant differences (p < 0.05) based on Tukey’s HSD test.
Table 7. NCCP values comparing experimental data and simulation results under different operating conditions.
ItemNCCP
Moldboard PlowingSubsoilingRotary
Tillage
Baler
Operation
Transport
Operation
Loader
Operation
Engine torque0.9700.9620.9580.9140.9310.974
Engine speed0.9630.9550.9510.9070.9630.967
Fuel consumption0.8580.8720.8840.8610.8960.922
Vehicle speed0.9770.9720.9680.9530.9770.969
Table 8. Summary of specific energy consumption for representative agricultural operations and annual energy use for workload scenarios.
ItemOperation/ScenarioValue
Specific energy consumption
(kWh/h)
Moldboard plowing175.0
Subsoiling138.6
Rotary tillage196.8
Baler operation89.6
Transport operation71.3
Loader operation61.3
Annual energy use
(MWh/year)
Scenario A34.0
Scenario B32.6
Scenario C24.9
Note: Annual energy use values correspond to an annual operating time of 250 h/year.
Table 9. Implications of workload characteristics for tractor electrification strategies.
ScenarioEnergy Demand CharacteristicElectrification Implication
AHigh SEC and AEU associated with sustained traction loadHigher continuous traction-motor/inverter rating and larger usable energy storage or hybridized powertrain may be required
BHigh PTO-driven energy demand with continuous and cyclic load characteristicsHigh continuous power capability and enhanced thermal management of motor, inverter, and battery are important
CLower SEC and AEU under utility-oriented operationComparatively lower energy-storage and continuous-power requirements favor battery-electric applications
Disclaimer/Publisher’s Note: The statements, opinions and data contained in all publications are solely those of the individual author(s) and contributor(s) and not of MDPI and/or the editor(s). MDPI and/or the editor(s) disclaim responsibility for any injury to people or property resulting from any ideas, methods, instructions or products referred to in the content.