Article

Mixed Seeding of Annual Ryegrass–Chinese Milk Vetch Sustains High Aboveground Biomass and Soil Fertility in Southern China

1
College of Life Science and Agri-Forestry, Southwest University of Science and Technology, Mianyang 621010, China
2
College of Animal Science, Guizhou University, Guiyang 550025, China
3
Sichuan Academe of Grassland Sciences, Chengdu 611731, China
*
Authors to whom correspondence should be addressed.
These authors contributed equally to this work.
Agriculture 2026, 16(15), 1677; https://doi.org/10.3390/agriculture16151677
Submission received: 30 June 2026 / Revised: 30 July 2026 / Accepted: 31 July 2026 / Published: 4 August 2026
(This article belongs to the Topic Soil Health and Nutrient Management for Crop Productivity)

Abstract

Winter fallow fields are widely distributed in southern China, where legume–grass mixtures are considered a useful approach for improving land-use efficiency and forage productivity while maintaining agroecosystem functions. Previous studies on the use of winter fallow fields have generally focused either on monoculture or on crops subjected to a single cut. These studies have primarily assessed aboveground productivity, whereas soil bacterial community responses have received comparatively little attention. Consequently, limited information is available on how different seeding combinations and cutting times affect aboveground biomass and soil bacterial community structure in mixed-cropping systems. A fixed-site field experiment involving annual ryegrass (Lolium multiflorum L.) and Chinese milk vetch (Astragalus sinicus L.) was conducted on yellow clay soil. Five annual ryegrass-Chinese milk vetch seeding combinations (100:0, 75:25, 50:50, 25:75, and 0:100) were established as proportions of their respective monoculture seeding rates. The same plots were maintained for five consecutive winter growing seasons, from autumn 2021 to spring 2026. Plant and soil samples were collected only during the final growing season (2025–2026), at four cutting times in January, March, April, and May. These samples were used to assess the effects of seeding combination and cutting time on forage productivity, root traits, soil fertility, and soil bacterial community structure. Among all groups, the 75% annual ryegrass + 25% Chinese milk vetch group (R75M25) exhibited the best overall performance, with cumulative yields after four cuttings of 17,274.21 kg·ha−1 dry matter, 2717.02 kg·ha−1 crude protein, and 12,220.46 kg·ha−1 digestible dry matter. In addition, the R75M25 group maintained relatively high contents of alkali-hydrolyzable nitrogen, available phosphorus, and available potassium in soil. The top three phyla of soil samples were Proteobacteria, Actinobacteria, and Acidobacteria, with a total relative abundance of >60%. Among these, Proteobacteria showed the greatest relative abundance in monoculture, whereas the seeding combination had a reduced proportion of it. In addition, its relative abundance rose steadily with cutting time. At the genus level, RB41, Gemmatimonas, and Sphingomonas dominated the soil bacterial community. The seeding combinations did not alter soil bacterial alpha diversity. Cutting times significantly reduced the phylogenetic diversity index and drove the temporal differentiation of taxa such as Actinobacteria and Bacteroidetes. The inclusion of an appropriate proportion of Chinese milk vetch improved forage nutritional value while maintaining high biomass accumulation in southern China, with the R75M25 group showing the best overall performance in winter fallow fields.

1. Introduction

Southern China has extensive areas of winter-fallow cropland. Its mild, humid winters and springs and long frost-free period provide favorable conditions for cultivating cool-season forage crops. However, due to traditional cropping systems, many winter fallow fields remain underutilized after the harvest of rice or other main-season crops, leaving the land idle for a relatively long period during winter and spring. This has resulted in low land-use efficiency and degradation of the ecological functions of cultivated land [1]. Meanwhile, this region is characterized by a high population density and strong demand for livestock products, whereas the supply of high-quality forage remains insufficient, making forage shortages particularly severe during winter and spring [2]. Therefore, developing forage production systems in winter fallow fields that combine high productivity, superior forage quality, and soil fertility improvement is of great significance for increasing cropping intensity and regional forage security, as well as promoting the efficient utilization of farmland resources and sustainable agricultural development in southern China.
Legume–grass mixtures are an important cultivation strategy for increasing forage yield, improving nutritional quality, and maintaining soil fertility [3], and they are widely used in artificial grasslands and forage production systems worldwide. Various mixed sowing systems have been established, including ryegrass–clover, oat–common vetch, and alfalfa–grass mixtures [4,5,6]. These legume–grass mixture systems enhance the land equivalent ratio and overall system productivity through niche differentiation, complementary resource utilization, and biological nitrogen fixation, while reducing reliance on chemical nitrogen fertilizer inputs [7]. However, the benefits of legume–grass mixtures do not necessarily increase with a higher legume proportion, as mixture performance is strongly constrained by environmental conditions, interspecific competition, biological nitrogen fixation feedbacks, and management practices [8]. These factors collectively modulate the competition–complementarity dynamics and ultimately shape yield formation, forage quality, and belowground ecological processes. Therefore, the key issue in establishing legume–grass mixtures is not simply to increase the proportion of legumes, but to coordinate the yield advantage of grasses with the quality improvement and soil-fertility functions of legumes through appropriate seeding combinations and cutting management, thereby achieving a balance among high productivity, yield stability, and superior forage quality.
Annual ryegrass (Lolium multiflorum L.) is an annual cool-season grass widely cultivated in winter fallow fields of southern China. It is characterized by rapid growth, strong tillering ability, and excellent regrowth capacity after cutting, providing a stable biomass foundation for mixed communities [9]. Chinese milk vetch (Astragalus sinicus L.) is the most widely used leguminous green manure crop in southern China and plays important roles in biological nitrogen fixation, soil fertility improvement, and soil ecological function enhancement. Owing to their complementary characteristics in growth habits, nutrient utilization, and ecological functions, these two species represent a potentially advantageous combination for integrating forage production with soil fertility improvement in winter fallow fields of southern China [10,11]. Previous studies have demonstrated that annual ryegrass and Chinese milk vetch, as winter cover crops or green manure materials, can influence biomass accumulation, nitrogen cycling, soil properties, and microbial community structure in winter fallow fields [12,13,14]. However, most of these studies have been limited to short-term experiments lasting one or two years and have focused on monoculture cover crops, residue incorporation processes, or responses of subsequent crops [15]. Such studies mainly capture responses during the initial establishment phase and may not represent the integrated plant–soil–microbial interactions that emerge after multiple years of continuous management. In contrast, an endpoint assessment of a mixed-sowing system after five consecutive years of establishment can determine whether its effects on community productivity, root–soil interactions, and potential bacterial-community-mediated processes remain detectable under longer-term conditions. Such an assessment can also reflect the cumulative effects of repeated plant growth and management.
In addition, cutting is a key factor affecting forage production performance and root growth dynamics [16]. Different cutting times not only influence forage yield, crude protein content, and digestibility but may also regulate soil nutrient availability and microbial community structure by altering plant regrowth capacity, root growth patterns, and organic matter inputs [17]. Following cutting, plants adjust their physiological metabolism and reallocate resources, thereby significantly accelerating the growth of the remaining tissues. Under this compensatory growth response, photosynthates are preferentially allocated to the roots, resulting in a significant increase in root exudation and consequently stimulating the proliferation of soil microorganisms [18]. Therefore, understanding the effects of seeding combinations and cutting times on the plant–root–soil–microbe continuum is essential for elucidating the mechanisms underlying productivity maintenance and ecological function formation in winter fallow field legume–grass mixture systems.
Based on these considerations, this study was conducted in a five-year-established annual ryegrass–Chinese milk vetch mixed grassland system with five seeding combinations and multiple cutting times. The objectives were to evaluate the effects of seeding combinations and cutting times on forage yield and quality, root traits, soil nutrient status, and soil bacterial community structure. We hypothesized that: (1) the inclusion of Chinese milk vetch at an appropriate proportion would enhance forage yield and quality through complementary resource utilization; (2) improvements in aboveground productivity would be accompanied by enhanced root development and improved soil nutrient status; and (3) seeding combination and cutting time would jointly determine aboveground forage yield, whereas cutting time can influence soil bacterial diversity.

2. Materials and Methods

2.1. Experimental Site

This study was conducted at the experimental base of the Institute of Forage Science, Southwest University of Science and Technology, Mianyang, Sichuan Province, China (104.705097° E, 31.534976° N; 509 m a.s.l.). The experimental site has a subtropical humid monsoon climate, with a mean annual temperature of 15 °C, annual precipitation of 1100 mm, annual sunshine duration of 1033.8 h, and an average frost-free period of 300 days. The soil at the experimental site is yellow clay, with a pH (H2O) of 6.74, soil organic matter (SOM) content of 32.2 g·kg−1, alkali-hydrolyzable nitrogen (AN) content of 185 mg·kg−1, available phosphorus (AP) content of 41.8 mg·kg−1, and available potassium (AK) content of 127.3 mg·kg−1. A long-term fixed-site field experiment on annual ryegrass–Chinese milk vetch mixed sowing was established in autumn 2021 and continued until spring 2026, covering five consecutive growing seasons. Each autumn, the plots were plowed to a depth of 20 cm and finely harrowed to prepare a uniform seedbed. Compound fertilizer was applied and incorporated into the soil at sowing, after which the plots were resown according to the predetermined seeding combinations. Nitrogen fertilizer was applied as a topdressing following each of the first three cuts, and weed control was performed manually throughout the growing season. Except for the seeding combinations, all plots received identical field management. All sampling and measurement reported in this study were conducted during the fifth growing season, from January to May 2026.

2.2. Experimental Design

This study adopted a randomized block design. The grass species annual ryegrass and the legume species Chinese milk vetch were mixed at different proportions, with five groups: 100% annual ryegrass (R100), 75% annual ryegrass + 25% Chinese milk vetch (R75M25), 50% annual ryegrass + 50% Chinese milk vetch (R50M50), 25% annual ryegrass + 75% Chinese milk vetch (R25M75), and 100% Chinese milk vetch (M100). Each group had three replicates, and each plot covered an area of 15 m2 (3 m × 5 m).
The monoculture seeding rate of annual ryegrass was 22.5 kg·ha−1 and that of Chinese milk vetch was 30 kg·ha−1. In each seeding combination, the seeding rate of a given species was the product of its proportion in that combination and its monoculture seeding rate. All groups were sown each autumn uniformly and managed using the same field management practices to ensure comparability among groups. Data were collected during the fifth growing season. In the last year following establishment, all plots were cut on the same four dates: 4 January, 14 March, 21 April, and 19 May, for a total of four cutting times, which were recorded as C1 (1st cut), C2 (2nd cut), C3 (3rd cut), and C4 (4th cut), respectively.

2.3. Aboveground and Belowground Biomass Sampling and Analysis

A 1 m × 1 m quadrat was randomly selected in each plot for aboveground biomass determination. During sampling, forage plants were cut 5 cm above the ground surface, and their fresh weight was recorded. Subsequently, approximately 1 kg of a mixed fresh sample was randomly collected from each quadrat and transported to the laboratory. The samples were first heated at 105 °C for 30 min for enzyme inactivation and then dried at 65 °C to constant weight to determine dry matter (DM) content. Dry matter yield (DMY) was then calculated from the dry matter content and the total fresh weight of the quadrat. Crude protein (CP) content was determined using the Kjeldahl method, and crude protein yield (CPY) was calculated as the product of DMY and CP content [19]. In vitro dry matter digestibility (IVDMD) was determined using an ANKOM Daisy II incubator (ANKOM Technology, Macedon, NY, USA) at 39 °C for 48 h [20], and digestible dry matter yield (DDMY) was calculated as the product of DMY and IVDMD.
To avoid compromising forage regrowth and cumulative yield, and to allow group differences in root biomass and morphology to be fully expressed, root sampling was conducted only at the final cutting. In each plot, root samples were collected from the 0–20 cm soil layer using a root auger (φ = 8 cm) according to a five-point sampling method, and roots from the five sampling points were mixed to form one composite sample. The collected roots were placed in nylon mesh bags and soaked in water for 30 min. They were then rinsed thoroughly with distilled water to remove impurities and extraneous roots. After surface water was removed using absorbent paper, root length (RL), root surface area (RSA), average root diameter (ARD), root volume (RV), and root tip number (RTN) were measured using an EPSON Expression 10000XL root scanner (Seiko Epson Corporation, Suwa, Nagano, Japan). After scanning, the root samples were placed in an oven at 105 °C and dried to a constant weight to determine root dry weight (RDW).

2.4. Soil Sampling and Analysis

Because soil fertility indicators are unlikely to change appreciably within a single cutting interval, soil samples for these indicators were collected only after the final cutting. In contrast, soil samples for bacterial community analysis were collected after each cutting to characterize the temporal responses of the bacterial community to successive cutting events. After each cutting, soil samples were collected from the 0–20 cm soil layer adjacent to the plant clumps in each plot using a soil auger and a five-point sampling method. The five soil cores collected from each plot were combined to form one composite sample. Visible roots, stones, and plant residues were removed, and the composite sample was thoroughly homogenized. A portion of each composite sample was stored at −80 °C for DNA extraction and bacterial community analysis. For the samples collected after the final cutting, the remaining portion was air-dried and passed through a 1 mm sieve before the determination of soil chemical properties.
Soil pH was measured using a glass electrode. Soil alkali-hydrolyzable nitrogen (AN) was determined using the alkaline hydrolysis diffusion method [21]. Soil organic matter (SOM), available potassium (AK), and available phosphorus (AP) contents were determined according to the methods described by Kong et al. [22].

2.5. Soil DNA Extraction and PCR Amplification

Total DNA was extracted from fresh soil samples using the HiPure Soil DNA Kit (Magen, Guangzhou, China), according to the manufacturer’s protocol. DNA concentration and purity were assessed by 1% agarose gel electrophoresis. DNA sample quality was evaluated based on the electrophoresis results. The DNA concentration was then diluted to 1 ng μL−1 with sterile water and used as the template for subsequent PCR amplification.
The primers 515F (5′-CCTACGGGAGGCAGCAG-3′) and 806R (5′-GGACTACHVGGGTWTCTAAT-3′) were used to amplify the V4 hypervariable region of the bacterial 16S rRNA gene. All PCR reactions were performed using Phusion® High-Fidelity PCR Master Mix (New England Biolabs, Ipswich, MA, USA), and the reaction volume was adjusted to 20 μL with distilled water.
The PCR amplification program was as follows: initial denaturation at 95 °C for 2 min; followed by 30 cycles of denaturation at 95 °C for 30 s, annealing at 56 °C for 30 s, and extension at 72 °C for 30 s; with a final extension at 72 °C for 5 min and storage at 10 °C. After PCR amplification, equal volumes of PCR products and 1 × loading buffer containing SYBR Green were mixed and detected by 2% agarose gel electrophoresis.

2.6. Library Preparation and Sequencing

Sequencing libraries were constructed using the TruSeq® DNA PCR-Free Sample Preparation Kit (Illumina, Inc., San Diego, CA, USA). After quantification using Qubit and quantitative PCR (qPCR), qualified libraries were subjected to PE250 paired-end sequencing on the Illumina HiSeq 2500 platform. After removing barcode and primer sequences, paired-end reads were merged using FLASH (V1.2.7) and quality-filtered using QIIME (V1.9.1). Tags were truncated at the first low-quality base when three consecutive bases had quality scores ≤ 19, and tags whose retained high-quality sequence was shorter than 75% of the original tag length were discarded. Chimeric sequences were identified and removed using the UCHIME algorithm against the Gold database.
Operational taxonomic units (OTUs) were clustered at 97% sequence similarity using UPARSE (V7.0.1001). Representative OTU sequences were taxonomically annotated using the Mothur method against the SILVA SSU rRNA database, with a minimum confidence threshold of 0.80. Multiple sequence alignment was performed using MUSCLE (V3.8.31). The OTU table was rarefied to the sequencing depth of the sample with the fewest effective sequences, and subsequent alpha- and beta-diversity analyses were conducted using the rarefied dataset.

2.7. Comprehensive Analysis Based on Radar Chart Area

Cumulative dry matter yield (TDMY), cumulative crude protein yield (TCPY), cumulative digestible dry matter yield (TDDMY), SOM, AN, AP, and AK were selected as comprehensive evaluation indicators. All selected indicators were positive indicators, with higher values indicating better performance. These indicators were normalized using Equation (1), and the radar chart area was then calculated using Equation (2).
x i = x i min x i max x i min x i
S = 1 2 i = 1 n r i r i + 1 sin 2 π n
where x i represents the measured value of the indicator; max x i and min x i represent the maximum and minimum values of this indicator across all groups, respectively; n represents the total number of indicators; x i (equivalent to r i in the area formula) is the normalized value of the i -th indicator, calculated by min–max normalization as shown above; π   =   3.14 and 1 / 2 is the coefficient used for calculating the radar chart area.

2.8. Statistical Analysis

Raw data were organized in Microsoft Excel 2019 and analyzed using IBM SPSS Statistics 26.0. For forage yield and nutritional quality indicators measured at different cutting times, two-way analysis of variance (two-way ANOVA) was used to test the effects of seeding combination, cutting time, and their interaction. For one-time sampling indicators, including root traits, soil chemical properties, bacterial alpha diversity indices, and the relative abundances of major bacterial taxa, one-way analysis of variance was used to compare differences among seeding combinations. Group means were compared using Tukey’s honestly significant difference (HSD) test at p < 0.05. Figures were generated using Origin 2021.

3. Results

3.1. Effects of Seeding Combination and Cutting Time on Forage Yield, Quality, and Root Morphology

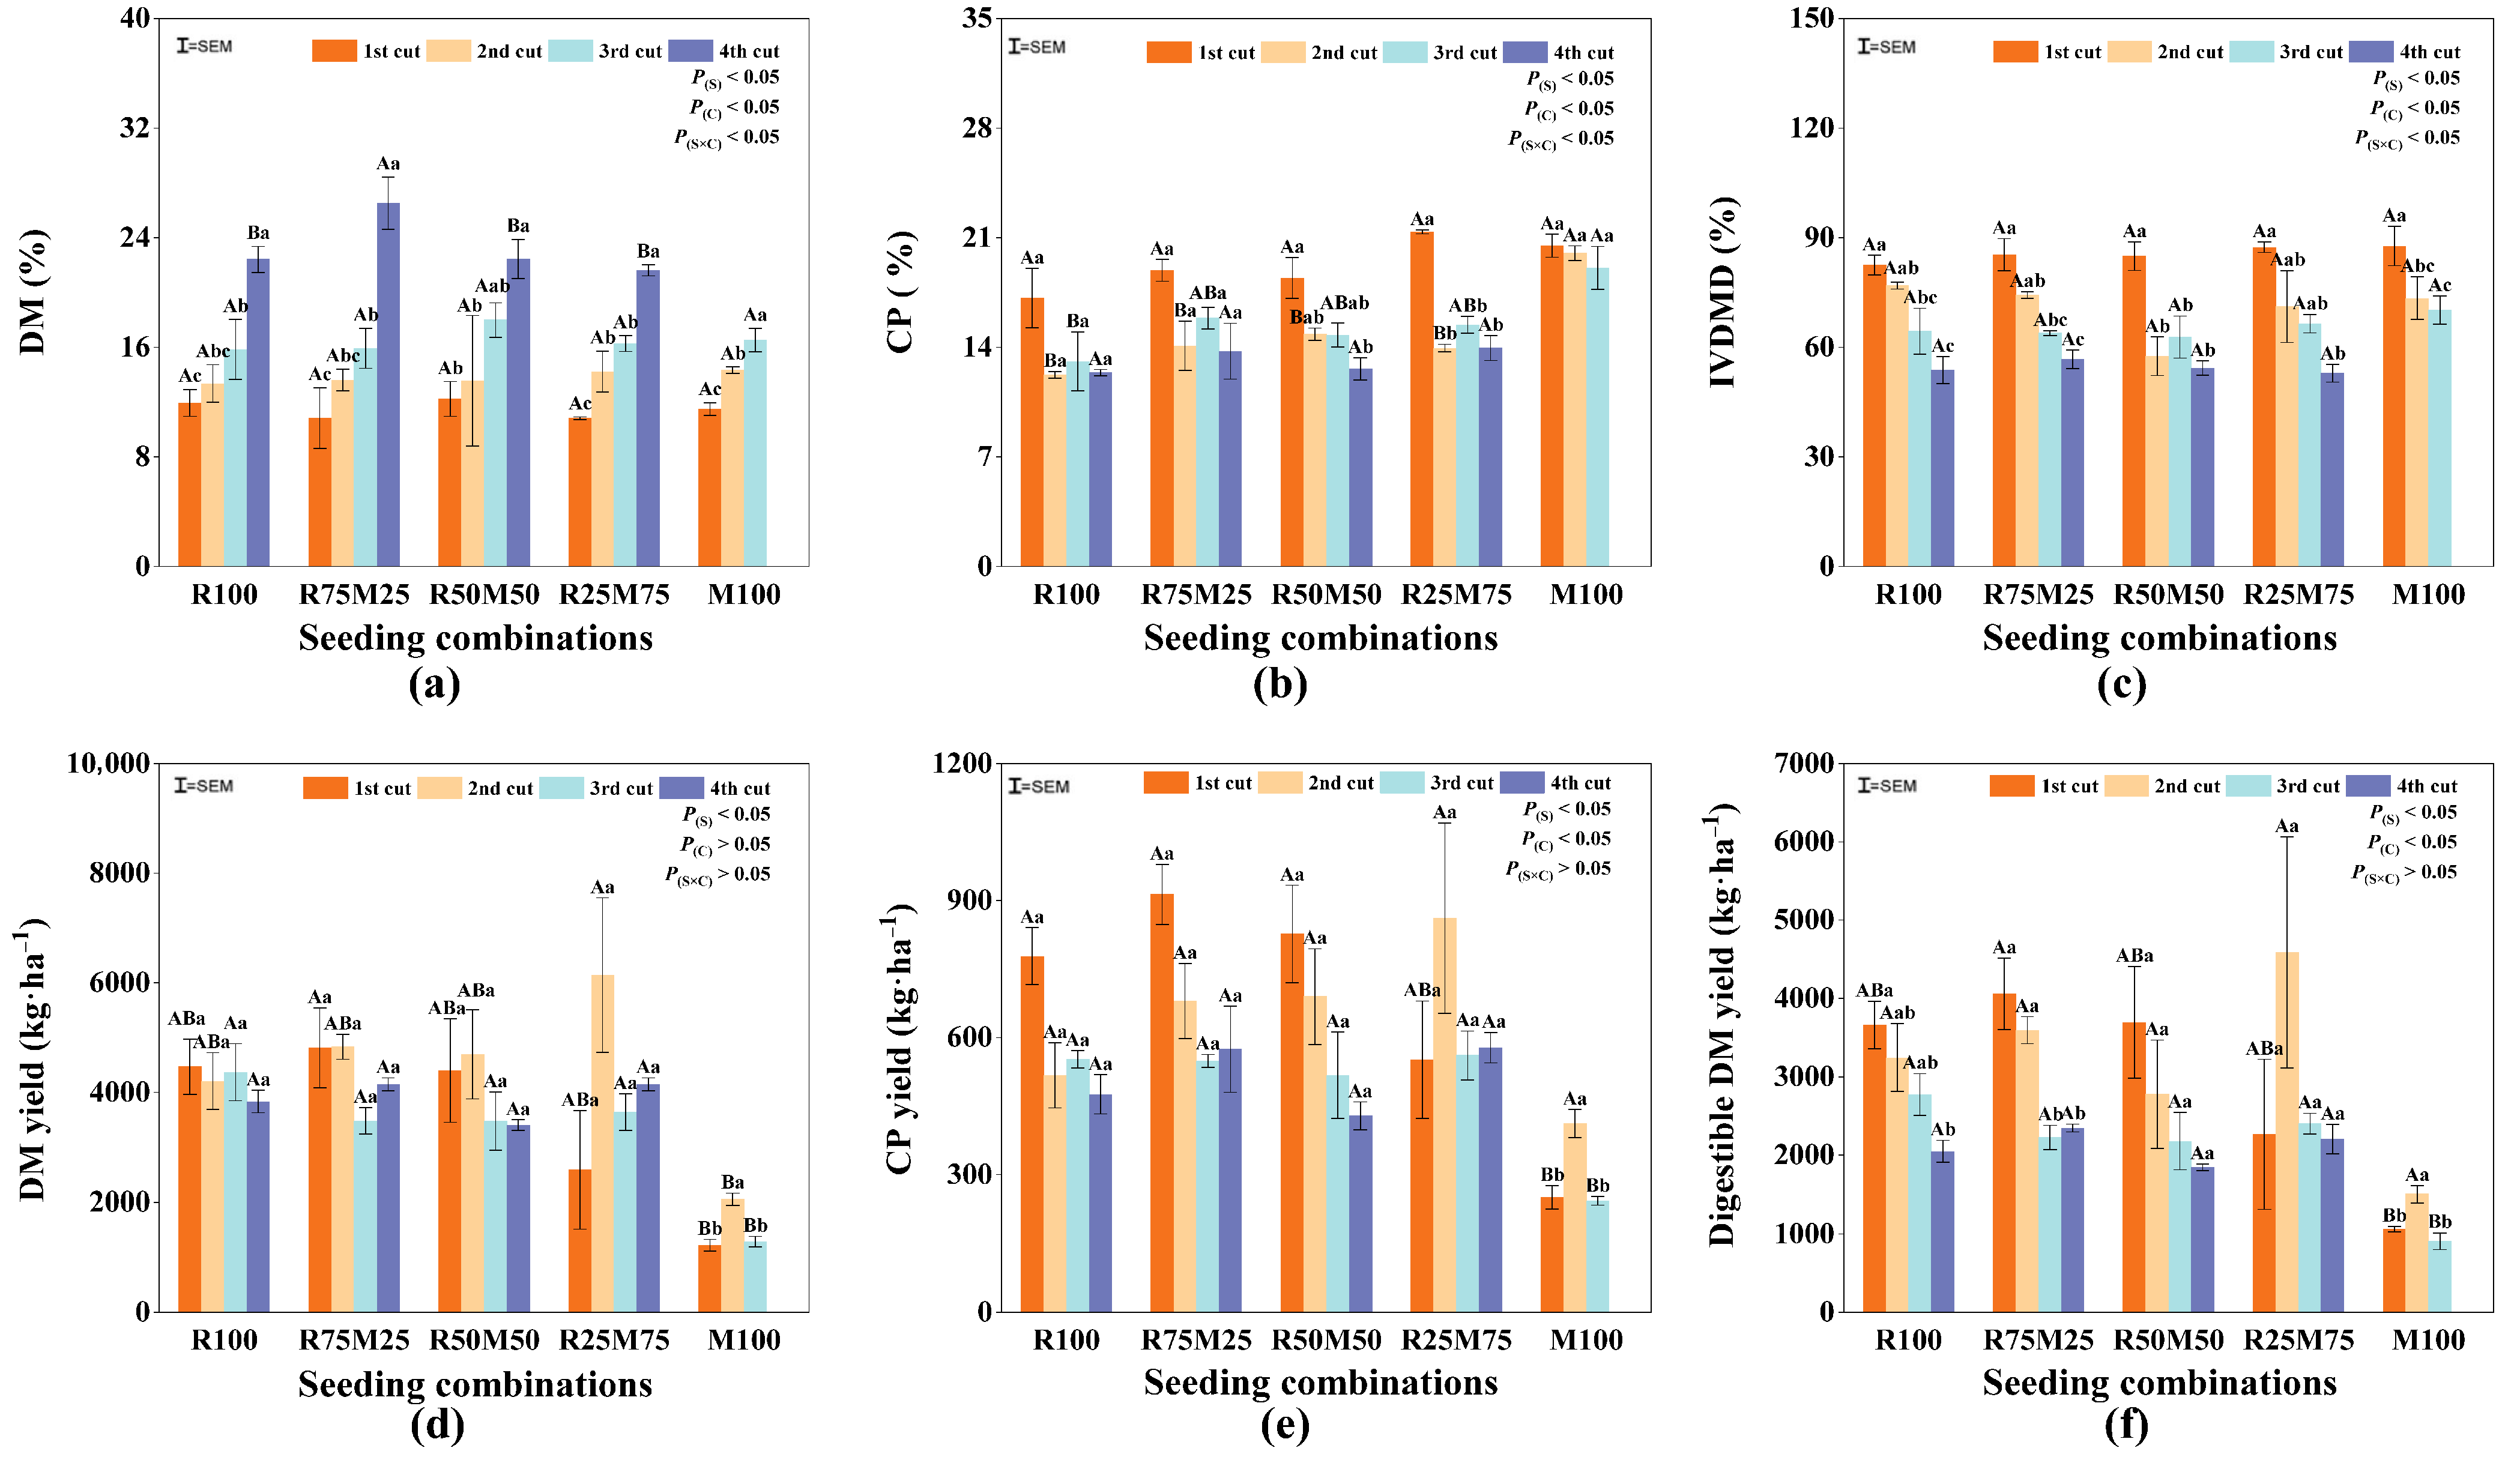
Seeding combination and cutting time influenced forage quality. Across seeding combinations, DM content increased significantly, and IVDMD decreased significantly as cutting times increased (p < 0.05) (Figure 1a,c). At the fourth cut, R75M25 exhibited significantly higher DM content than the other mixed seeding combinations (p < 0.05) (Figure 1a). At the second and third cuts, M100 exhibited significantly higher CP content than R100 (p < 0.05) (Figure 1b). Seeding combination, cutting time, and their interaction significantly affected forage DM content, CP content, and IVDMD (p < 0.05).
Seeding combination and cutting time also affected forage yield. Across seeding combinations, M100 exhibited significantly lower DM yield than all other seeding combinations (Figure 1d). The two-way ANOVA showed that seeding combination and cutting time significantly affected CP yield, DM yield, and digestible DM yield (p < 0.05), whereas their interaction had no significant effect on these yield traits (p > 0.05) (Figure 1d–f). Although not all differences reached statistical significance, R75M25 consistently showed the highest numerical values for DM yield, CP yield, and digestible DM yield, with cumulative yields of 17,274.21, 2717.02, and 12,220.46 kg·ha−1, respectively. Across different cutting times, yields from the first and second cuts were higher than those from the third and fourth cuts (Figure 1d–f).
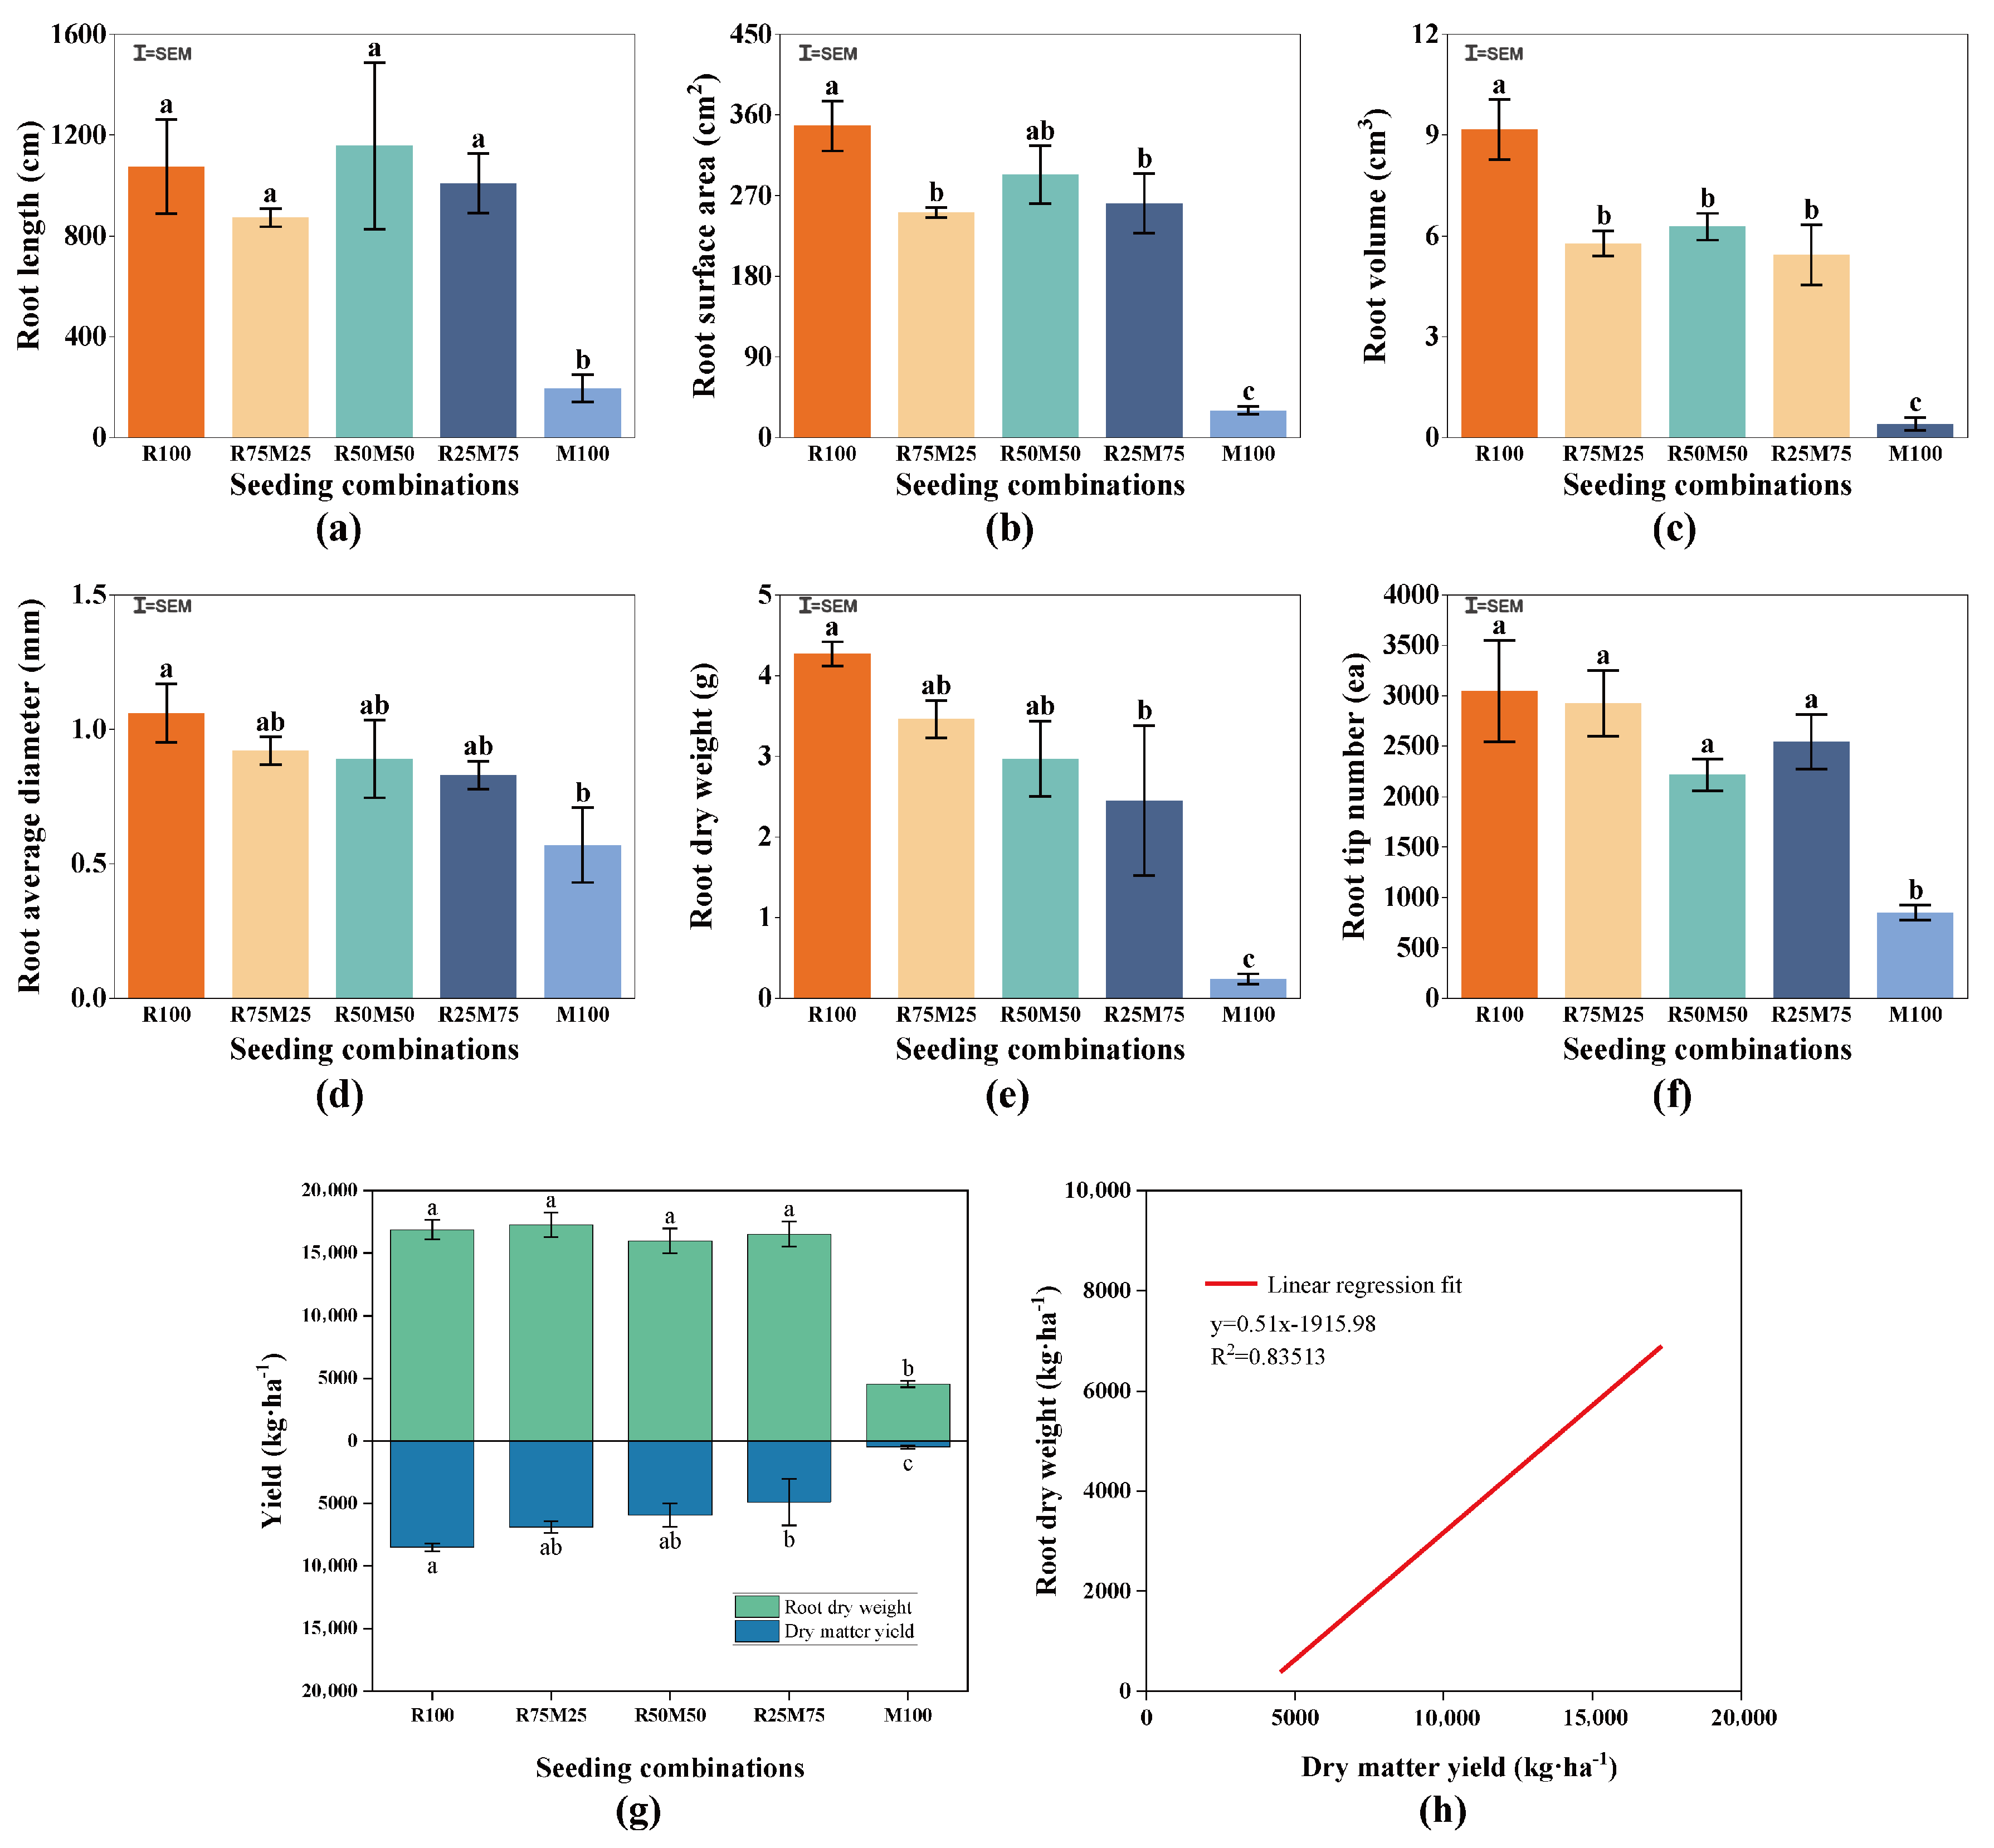
Differences in aboveground production performance were closely associated with belowground root development. Across seeding combinations, root length, root surface area, root volume, and root tip number generally followed a trend of initial decline, subsequent increase, and final decline as the proportion of Chinese milk vetch increased (Figure 2a–c,f). Root average diameter and root dry weight declined with increasing Chinese milk vetch proportion (Figure 2d,e). Across seeding combinations, both dry matter yield and root dry weight generally decreased as the proportion of Chinese milk vetch increased (Figure 2g). This concurrent downward trend was corroborated by a strong positive linear relationship between the two variables (R2 = 0.8513, Figure 2h).

3.2. Effects of Seeding Combination on Soil Fertility

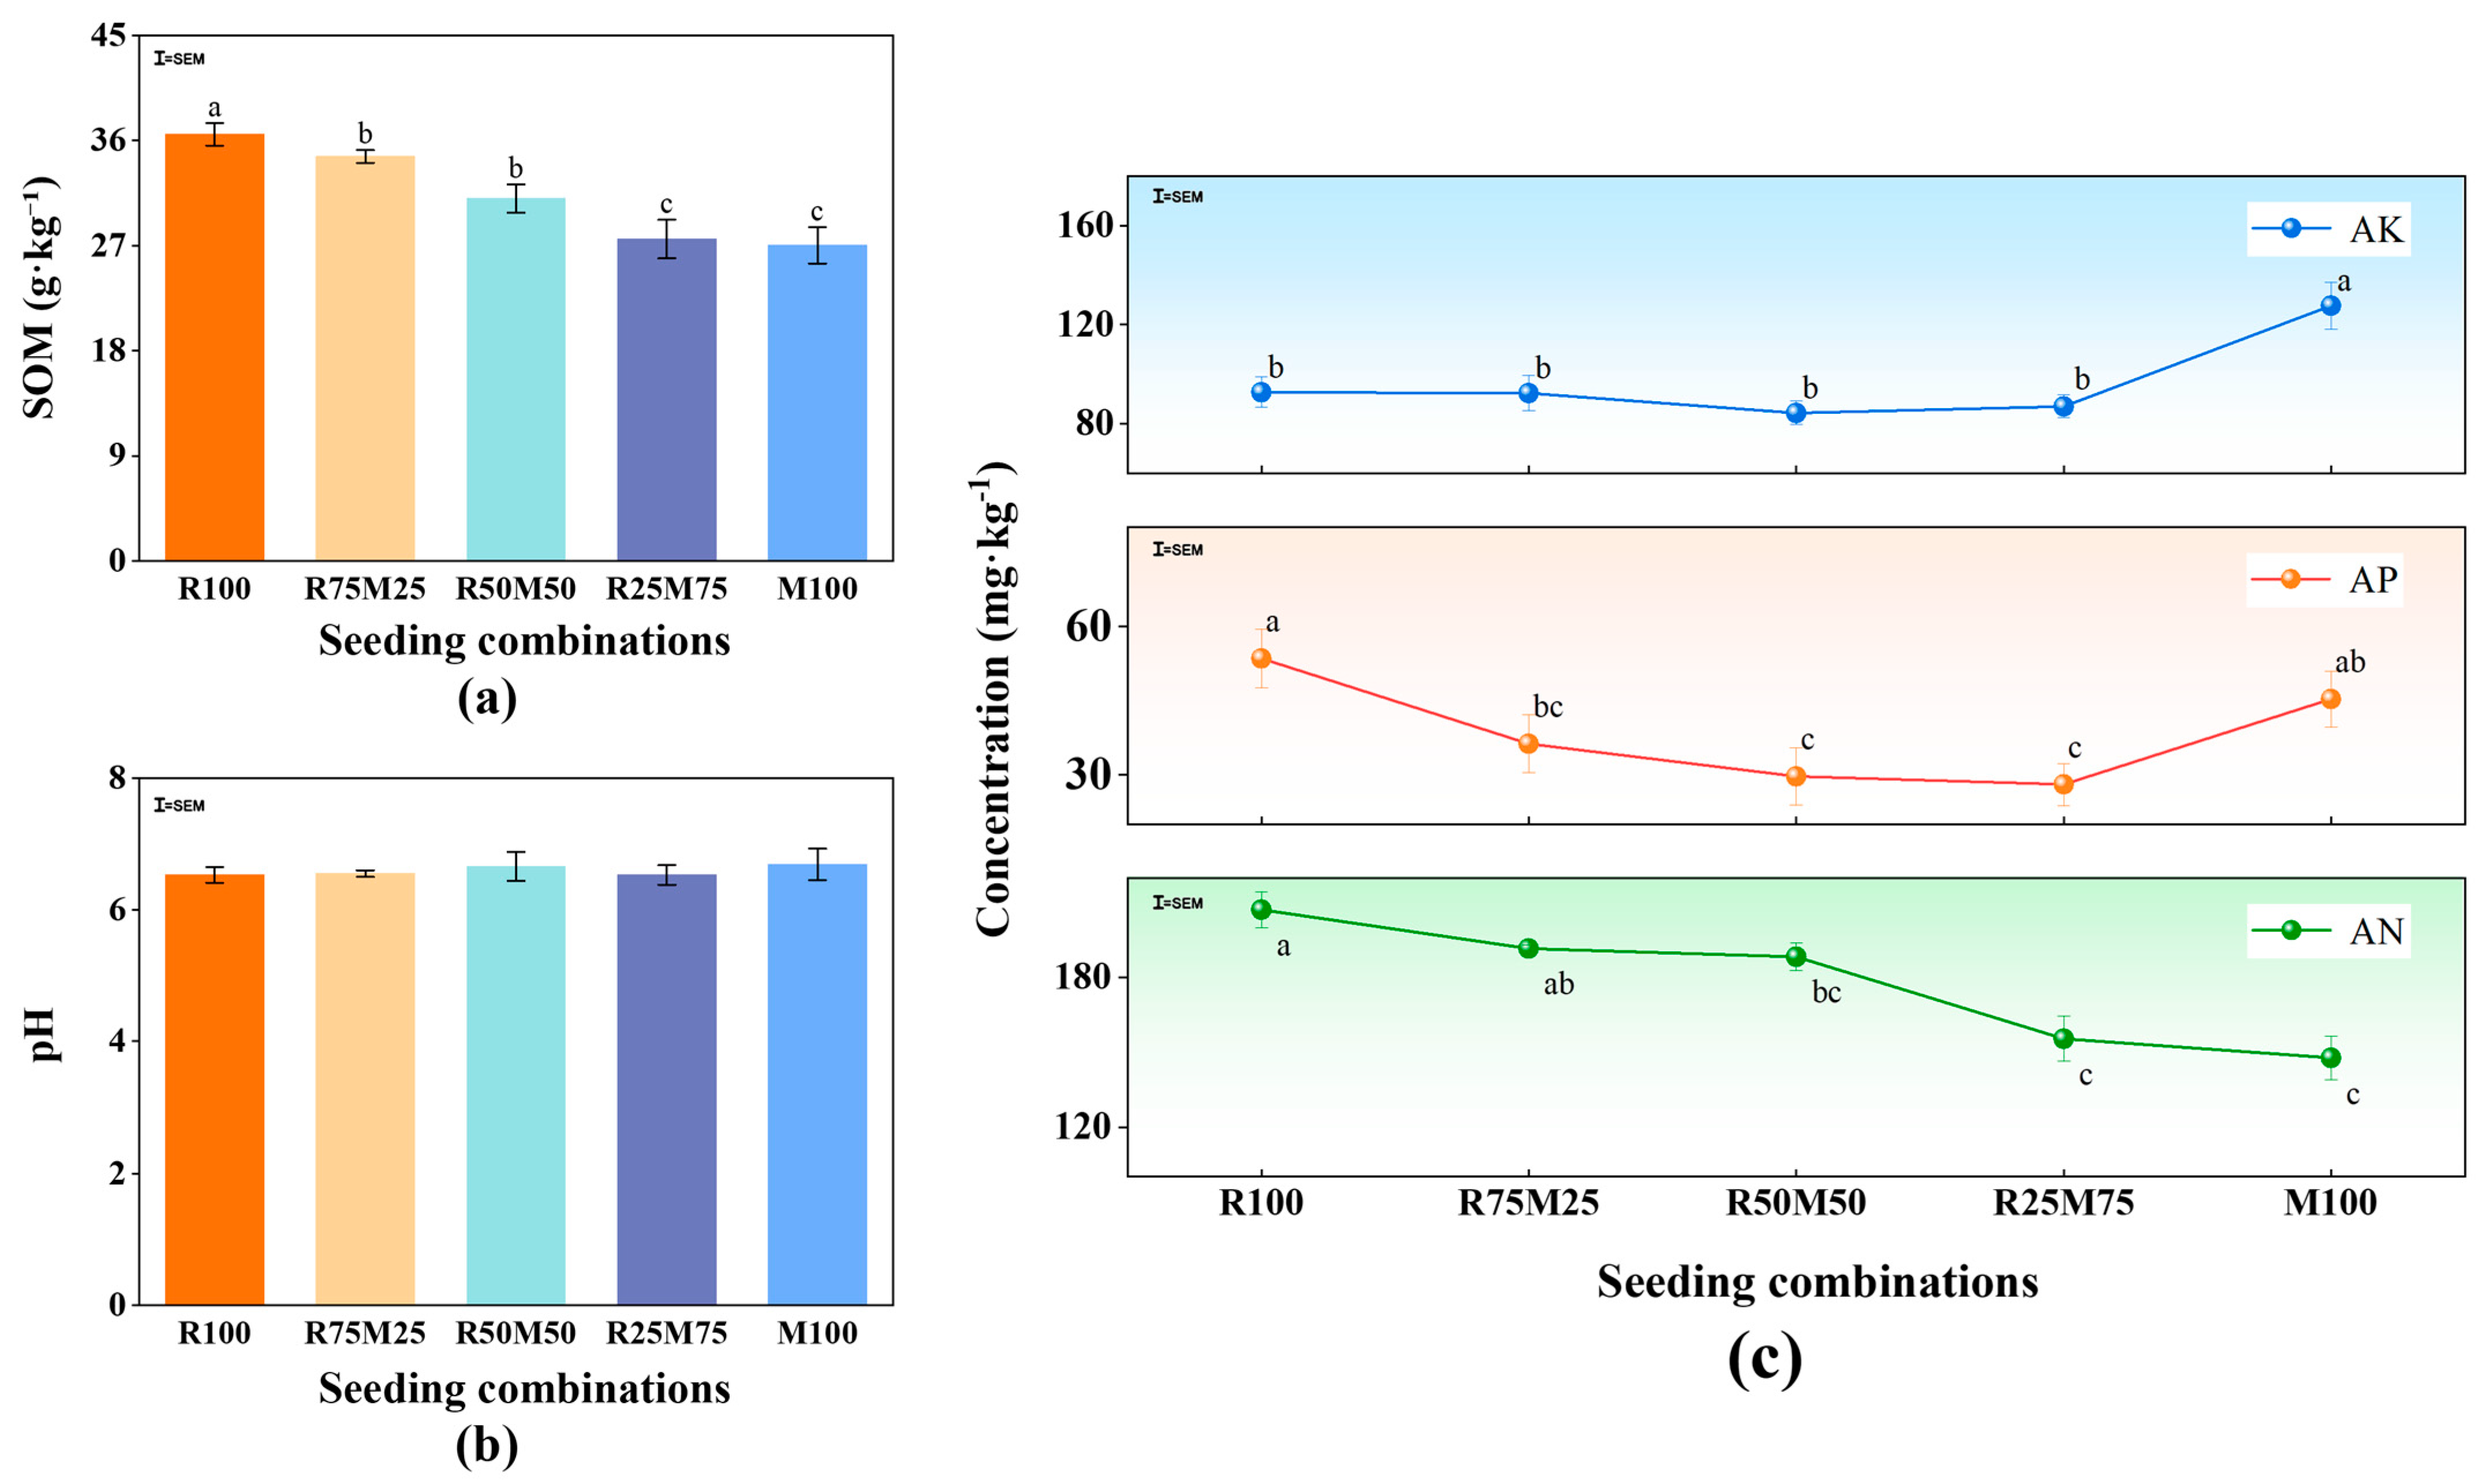
Seeding combination affected soil nutrient contents, but the response patterns varied among different nutrient indicators. Across seeding combinations, SOM content generally decreased with the increasing proportion of Chinese milk vetch, with differences observed among groups. R100 exhibited the highest SOM content, significantly exceeding the other groups (p < 0.05) (Figure 3a). M100 exhibited the highest AK content, significantly exceeding all other seeding combinations (p < 0.05). Although these differences did not all reach statistical significance, R75M25 generally showed higher numerical values of AK, AP, and AN than R50M50 and R25M75, reaching 92.33, 36.30, and 191.67 mg·kg−1, respectively (Figure 3c).

3.3. Soil Bacterial Community Composition

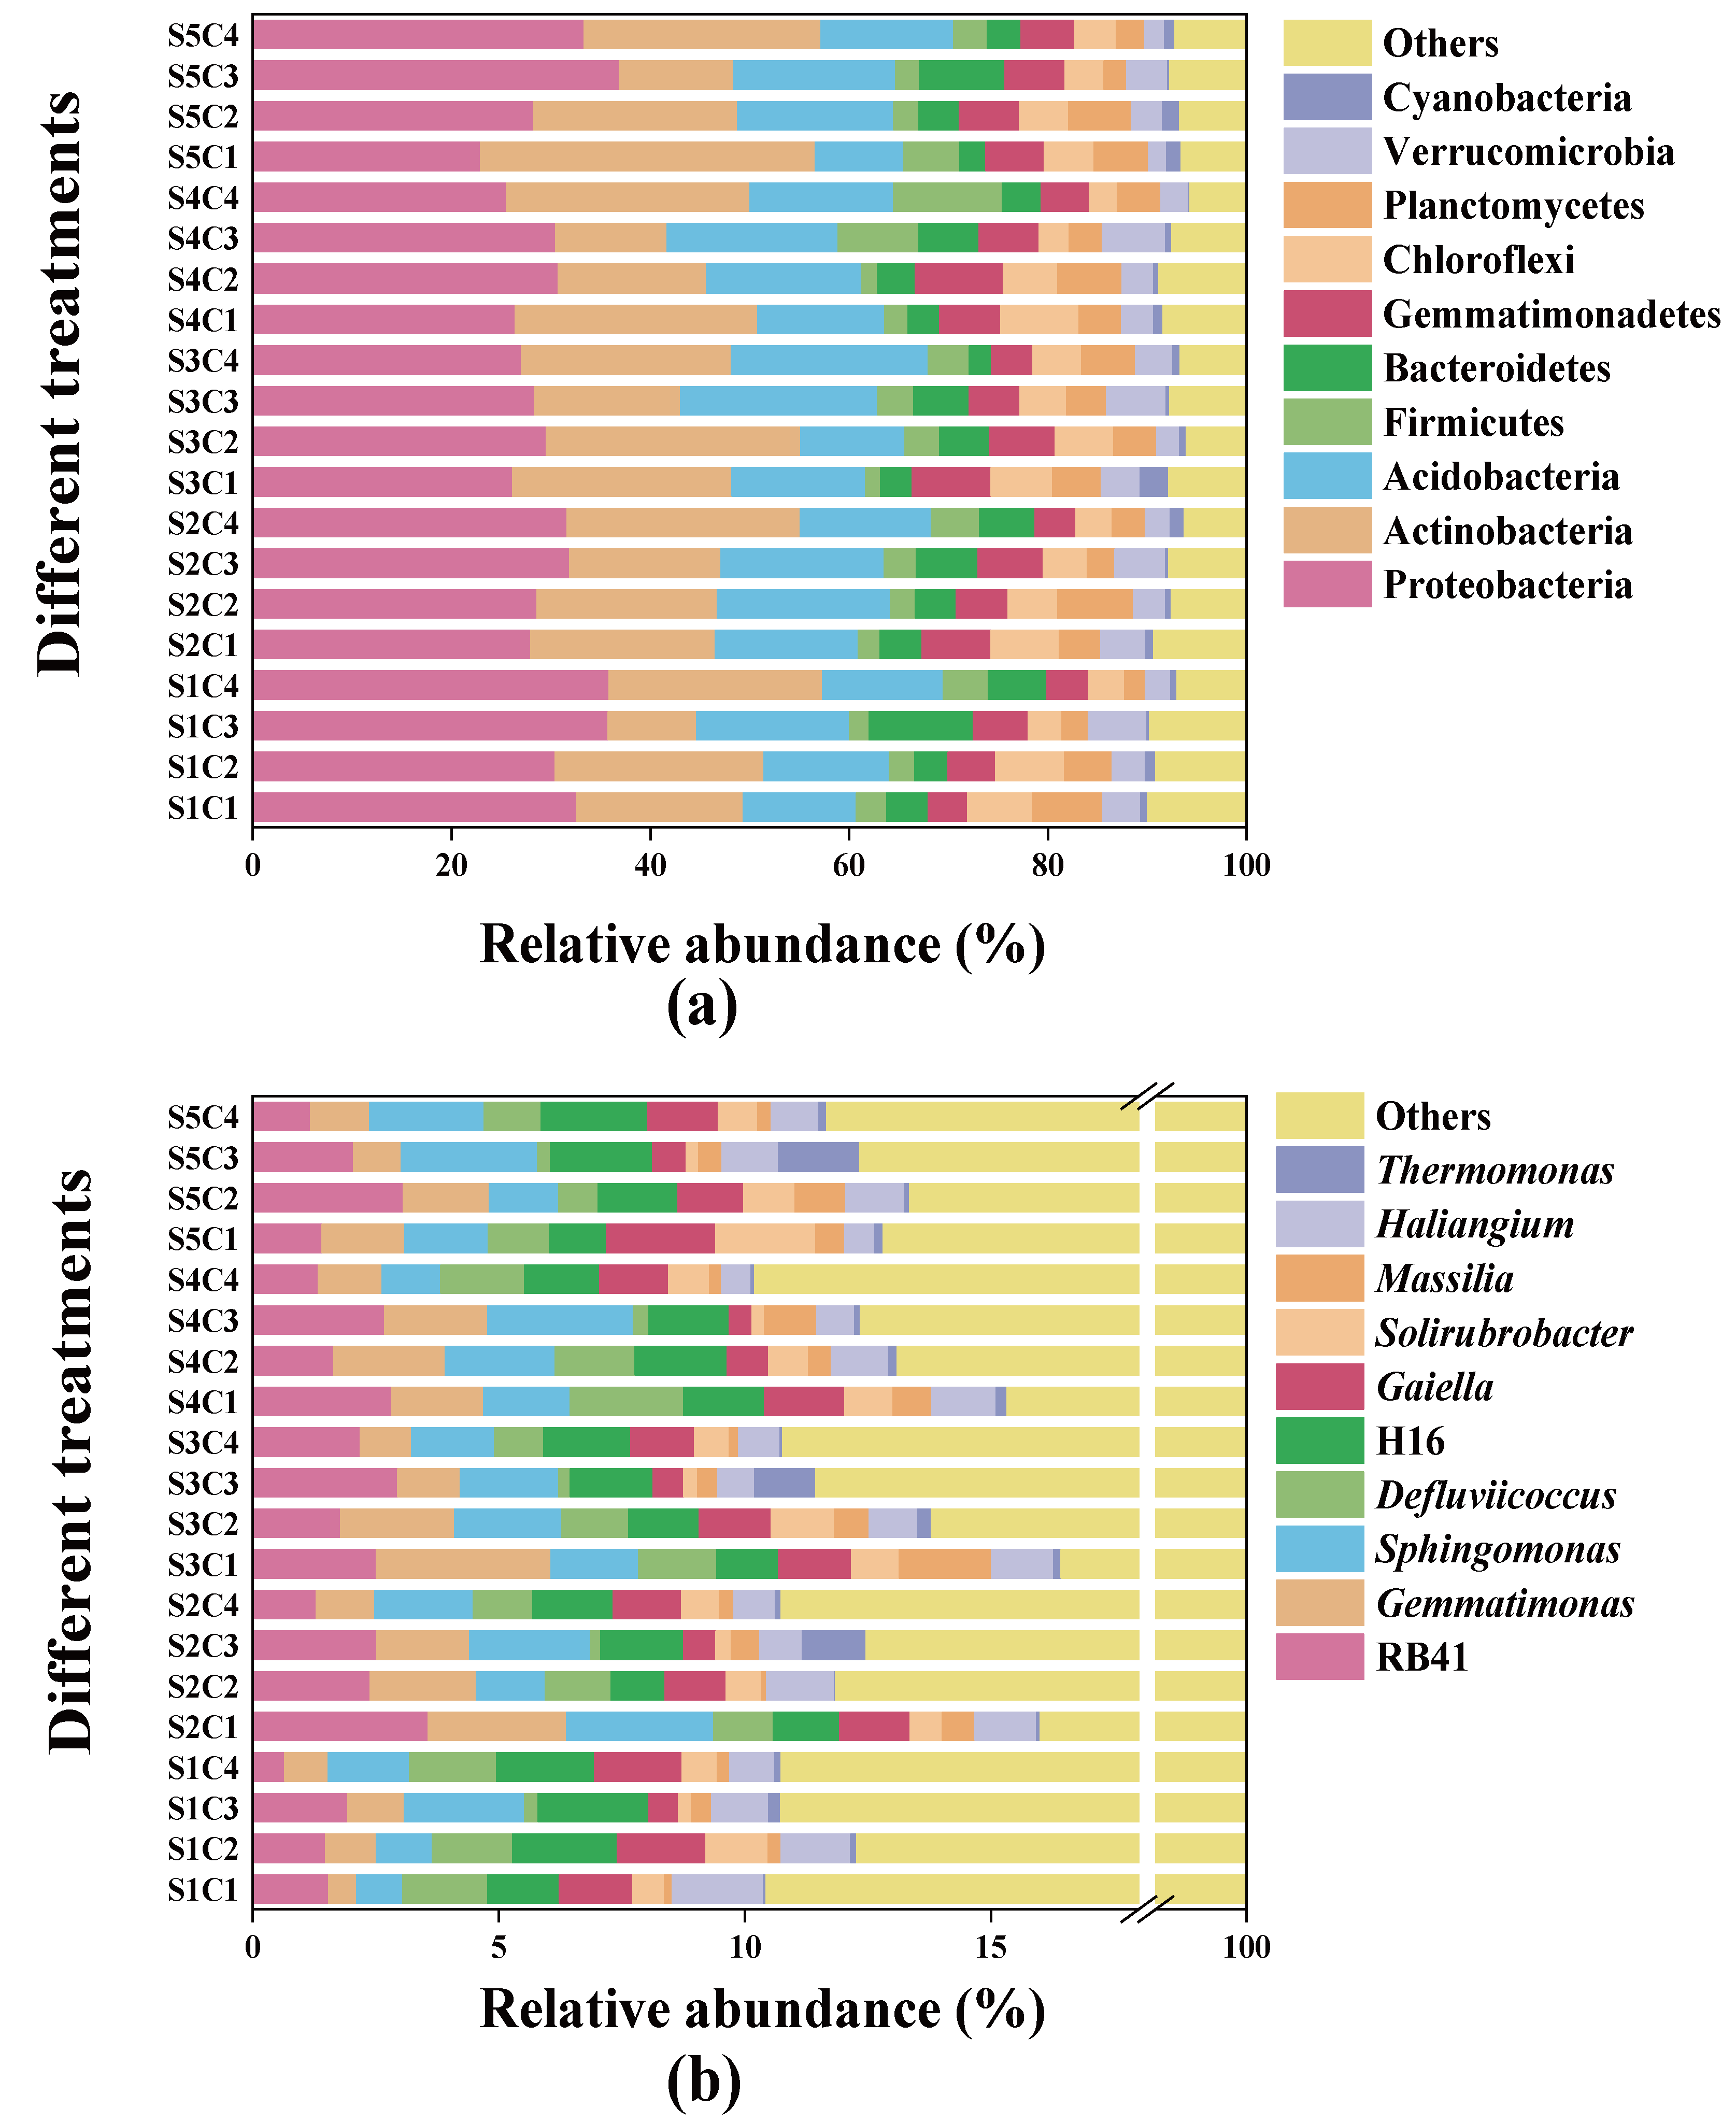
The composition and relative abundance of soil bacterial communities differed among treatments (Figure 4). Across different seeding combinations and cutting times, the dominant groups at the phylum level were Proteobacteria, Actinobacteria, Acidobacteria, Firmicutes, Bacteroidetes, Gemmatimonadetes, Chloroflexi, Planctomycetes, Verrucomicrobia, and Cyanobacteria, with a combined relative abundance of >90% (Figure 4a). Notably, Proteobacteria—the most abundant phylum—showed a marked decrease in relative abundance under seeding combination compared with monoculture, whereas its abundance progressively increased with cutting time. At the genus level, the dominant genera included RB41, Gemmatimonas, Sphingomonas, Defluviicoccus, H16, Gaiella, Solirubrobacter, Massilia, Haliangium, and Thermomonas. Among them, RB41, Gemmatimonas, and Sphingomonas showed relatively higher abundance in most groups, together accounting for more than 3% of the total relative abundance (Figure 4b).

3.4. Alpha Diversity Characteristics of Soil Bacterial Communities

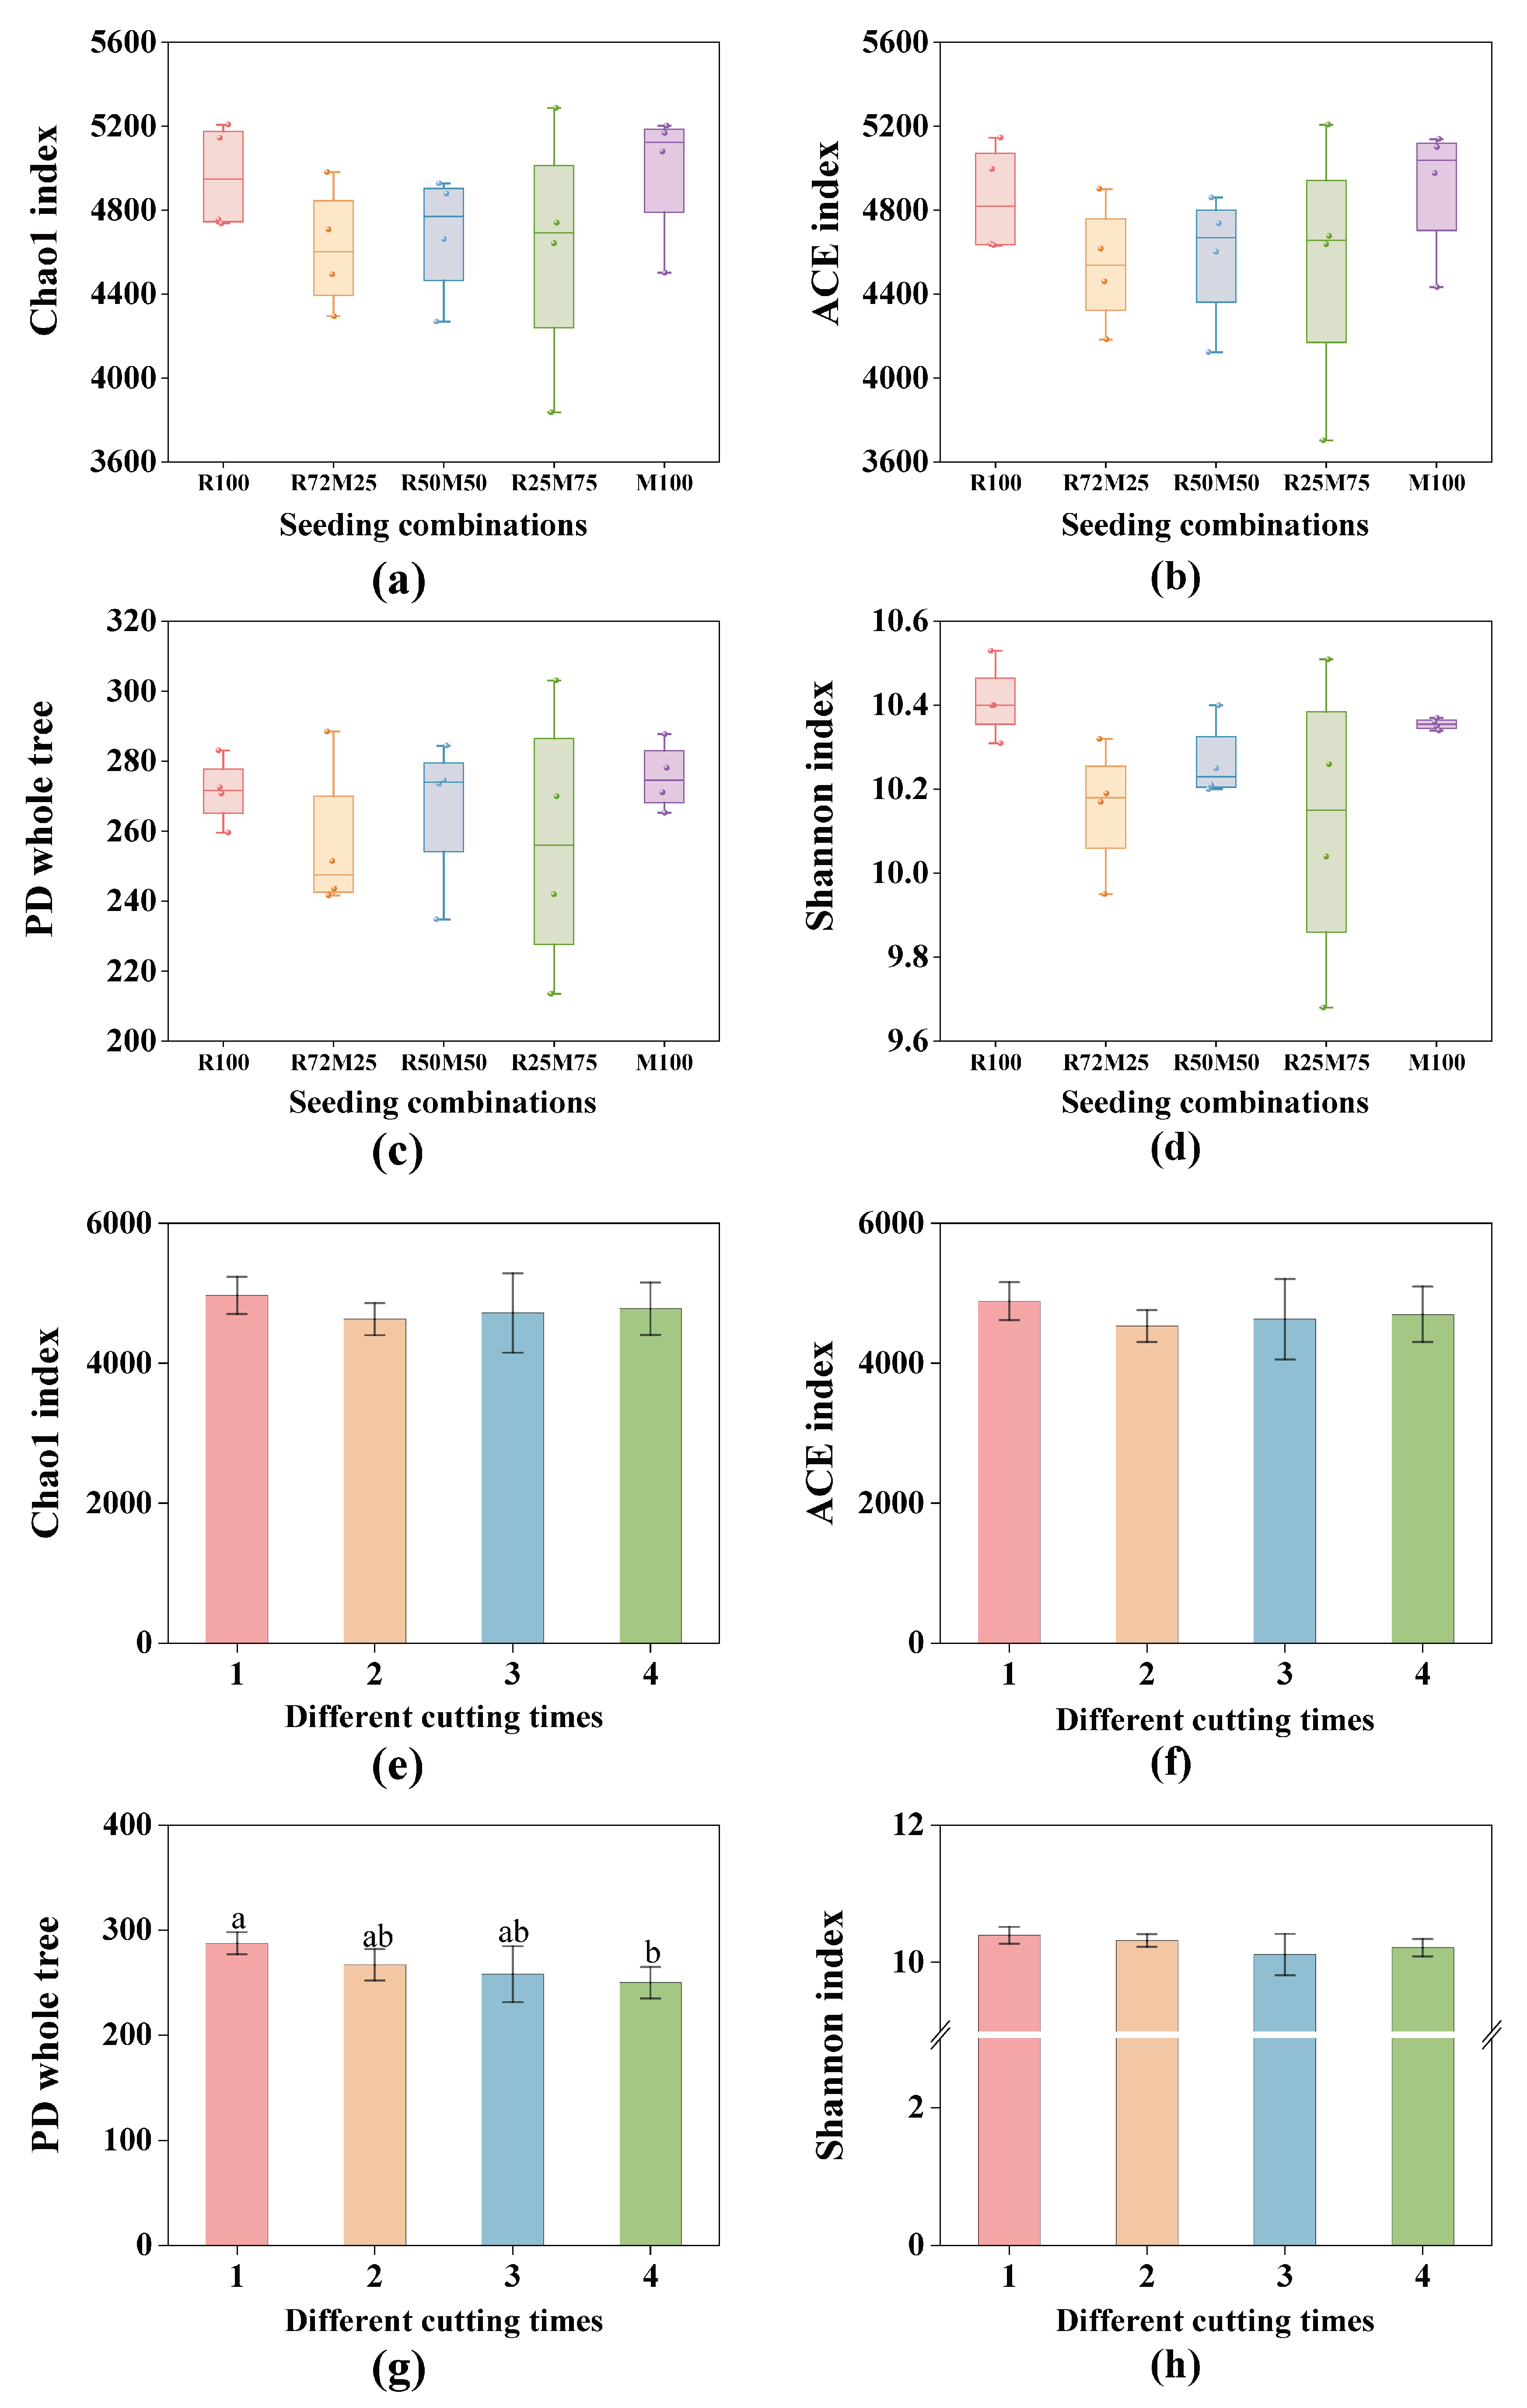
Under different seeding combinations, the Chao1, ACE, phylogenetic diversity, and Shannon indices of soil bacterial communities showed no significant differences (Figure 5a–d), indicating that the seeding combinations had limited effects on soil bacterial richness and diversity.
In contrast, cutting time significantly affected some alpha diversity indices. The Shannon, Chao1, and ACE indices showed no significant changes among cutting times, whereas the phylogenetic diversity index in the first cut was significantly higher at the first cut than at the third and fourth cuts (p < 0.05).

3.5. LEfSe Analysis Among Different Cutting Times

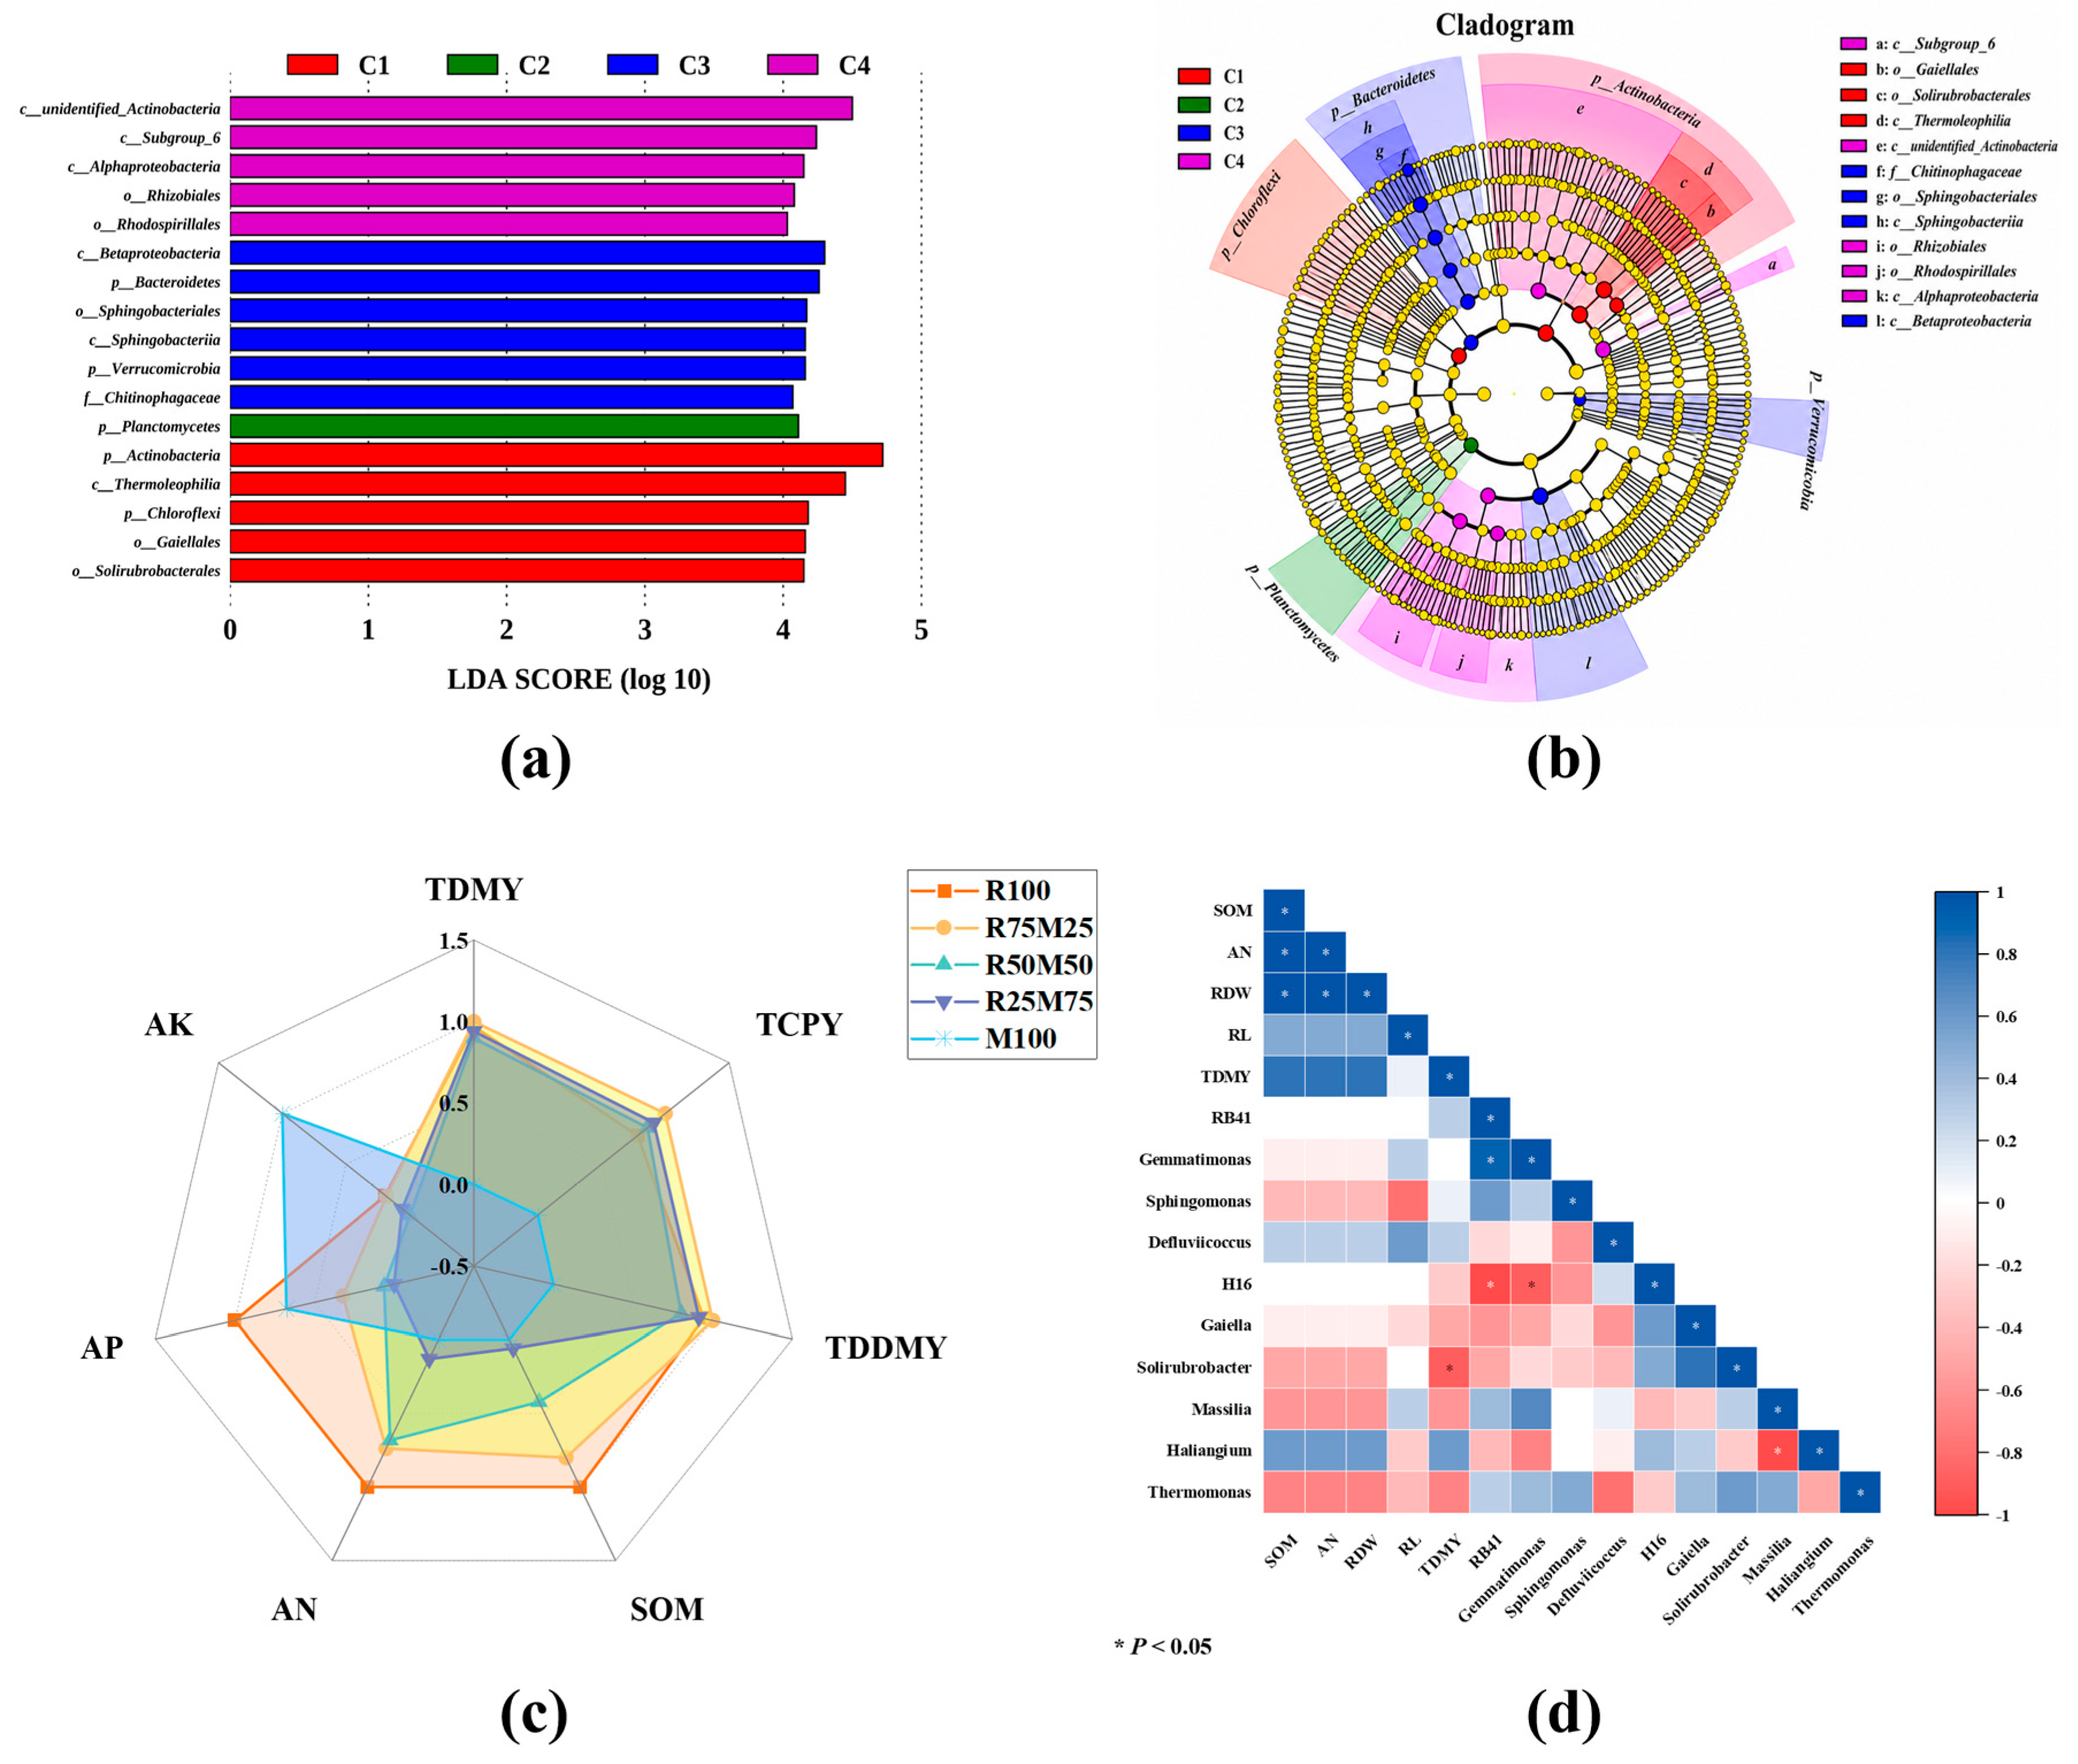
LEfSe analysis identified characteristic bacterial biomarkers at different cutting times (Figure 6a). C1 was significantly enriched with taxa associated with organic matter degradation, such as Chloroflexi and Lysobacterales. C3 was enriched with taxa related to nitrogen transformation, including Betaproteobacteria and Chitinophagaceae. C4 was enriched with nitrogen-cycling-related taxa, such as Rhizobiales and Rhodospirillales.
The cladogram further illustrated the phylogenetic distribution of the discriminative taxa, indicating that biomarkers enriched in different treatments were mainly clustered within specific phylogenetic lineages and spanned multiple taxonomic levels from the phylum to the genus level (Figure 6b). Overall, cutting time drove the enrichment and turnover of specific bacterial taxa.

3.6. Comprehensive Evaluation and Association Analysis of Forage Quality, Soil Fertility, and Bacterial Communities Under Different Seeding Combinations

Different legume–grass seeding combinations showed clear differences in forage production and soil nutrient status (Figure 6c). Among the mixed sowing groups, the comprehensive evaluation based on cumulative dry matter yield, cumulative crude protein yield, cumulative digestible dry matter yield, and major soil nutrient indicators showed that the R75M25 group had the largest radar chart area, indicating superior overall performance in forage yield, forage quality, and soil nutrient supply. In contrast, R25M75 showed relatively weak overall soil nutrient status.
The correlation heatmap revealed strong synergistic relationships among soil fertility, soil bacterial genera, root morphological traits, and forage productivity (Figure 6d). SOM, AN, and root traits such as RL and RDW were generally positively correlated with TDMY, TCPY, and TDDMY. Different dominant bacterial genera showed distinct correlation patterns with soil fertility, root traits, and productivity indicators. Among them, RB41 showed a strong positive correlation with TDMY.

4. Discussion

Previous studies have shown that legume–grass mixtures can enhance community productivity and forage quality [23,24]. In the present study, R75M25 (75% annual ryegrass + 25% Chinese milk vetch) outperformed the other seeding combinations in cumulative dry matter yield, cumulative crude protein yield, and cumulative digestible dry matter yield. This result indicates that an appropriate seeding proportion is essential for balancing forage productivity and nutritional quality. Annual ryegrass grows rapidly and has a strong regrowth capacity after cutting [25]. In contrast, Chinese milk vetch can improve nitrogen-use efficiency through biological nitrogen fixation [26]. Functional complementarity between the two species can alleviate the limitations of monoculture and improve the overall use efficiency of light, water, and nutrients [27]. However, the yield and quality benefits of legume–grass mixtures are proportion-dependent and exhibit a threshold response [28]. At high proportions, the nitrogen-fixing and quality-enhancing benefits of Chinese milk vetch may not compensate for yield losses caused by the reduced biomass contribution of annual ryegrass. A high proportion of Chinese milk vetch may also suppress the growth and tillering of annual ryegrass, thereby reducing overall community biomass accumulation. Thus, including 25% Chinese milk vetch retained the yield and regrowth advantages of annual ryegrass while providing the quality-enhancing benefits of the legume. This balance explains why R75M25 achieved the best overall production performance.
Cutting time regulated forage performance by altering plant developmental stage and community composition, with significant effects on yield formation and nutritional quality. The first two cuts contributed the majority of the total dry matter yield, while later cuts were lower in both yield and quality. With successive cuts, advancing maturity, lignification, and fiber accumulation increased dry matter content but reduced crude protein content and in vitro dry matter digestibility. Repeated cutting also exerted species-specific selection on the two forage species [29]. The cutting-tolerant annual ryegrass maintained its growth, whereas the regrowth capacity of Chinese milk vetch gradually declined. This difference allowed the grass component to become increasingly dominant, thereby altering the nutritional composition of the forage mixture. Therefore, optimizing cutting frequency and timing is essential for balancing cumulative forage yield and nutritional quality.
Root traits under the seeding combinations were generally intermediate between those under the two monocultures because interspecific competition restricted excessive root proliferation by individual forage species, whereas niche complementarity optimized the stratified use of belowground space and nutrient resources [30,31]. Although R75M25 did not exhibit the most favorable root morphological traits, it had relatively high soil alkali-hydrolyzable nitrogen (AN), available phosphorus (AP), and available potassium (AK) contents, indicating that its performance depended on root nutrient-acquisition efficiency and coordinated aboveground–belowground biomass allocation rather than unlimited root expansion [32]. Previous studies have shown that grass–legume mixtures can improve soil nutrient supply through biological nitrogen fixation by legumes, root exudate inputs, and litter decomposition, particularly by increasing soil nitrogen availability and promoting soil organic matter accumulation [33]. Our results generally support this view, although the effects of seeding combinations on soil fertility differed markedly. The contents of SOM and AN tended to decrease with increasing Chinese milk vetch proportion. This pattern may have resulted primarily from insufficient biomass inputs and restricted nutrient cycling in communities containing a high proportion of Chinese milk vetch. In contrast, annual ryegrass has an extensive root system and persistent regrowth capacity throughout its life cycle, enabling continuous inputs of root residues and root exudates into the soil and thereby promoting soil organic matter accumulation and mineral nutrient mobilization [34]. Therefore, improvements in root morphology and soil fertility in grass–legume mixtures are jointly regulated by multiple processes [35].
To further elucidate the potential mechanisms underlying changes in soil fertility and the maintenance of ecosystem functioning in the seeding combination system, we analyzed the composition and response patterns of the soil bacterial community. In the long-term seeding combination system, Proteobacteria, Actinobacteria, and Acidobacteria remained dominant across different seeding combinations and cutting times, and seeding combination had no significant effects on any of the Chao1, ACE, Shannon, or phylogenetic diversity indices. These findings indicate that the different treatments did not markedly alter overall bacterial richness and diversity, and that consistent soil conditions and management practices over the long term may have maintained a relatively conserved community framework through environmental filtering [36]. Long-term root inputs and residue turnover may create microhabitats with varying levels of resource availability, allowing these bacterial phyla to coexist over time through niche differentiation [37,38]. However, stable overall diversity does not indicate an absence of community responses. In this study, the relative abundance of RB41 was significantly and positively correlated with forage dry matter yield. On the one hand, greater aboveground productivity is generally accompanied by greater root biomass and increased inputs of root exudates and root residues, thereby providing carbon sources and suitable microhabitats for RB41. On the other hand, RB41 may participate in soil organic carbon transformation and nutrient mobilization, thereby facilitating nutrient turnover and plant growth.
Overall, the comprehensive advantage of R75M25 suggests that appropriate seeding proportions and cutting times may sustain system functioning by coordinating aboveground production with belowground resource use [39,40]. However, 16S rRNA gene sequencing characterizes only bacterial community composition and diversity. It cannot directly resolve microbial functions or establish causal relationships between bacterial taxa and forage production. Moreover, this study was conducted at a single site, and root and soil samples were collected at specific growth stages. These constraints may limit the generalizability of our findings across different climatic and soil conditions. Fungi, root exudates, and microbial functional genes were also not examined. Future studies should integrate long-term field monitoring with metagenomic sequencing, functional gene analysis, and root-zone metabolite profiling. Such approaches could further clarify the mechanisms linking legume–grass interactions, soil nutrient cycling, and microbial functions.

5. Conclusions

This study evaluated the effects of seeding combinations and cutting times on forage yield, root morphology, soil fertility, and bacterial communities in annual ryegrass–Chinese milk vetch mixtures. Among the seeding combinations, R75M25 achieved the best balance between cumulative yield across four cutting times and nutritional quality. Forage harvested at the first and second cuts contributed most of the cumulative dry matter yield, whereas crude protein content and digestibility gradually declined across successive cutting times. Therefore, the first cutting time is preferable when nutritional quality is prioritized, while the first two cuts constitute the principal yield-production period. The seeding combinations were also associated with increased relative abundances of RB41 and Gemmatimonas, which may contribute to soil carbon turnover and nutrient mobilization, although their specific functions require direct validation. Therefore, for forage production in winter fallow fields in southern China, we recommend the R75M25 seeding combination, prioritizing the first cut to obtain high-quality forage while retaining the second cut to maximize cumulative yield.

Author Contributions

Conceptualization, P.L., S.B., L.Z. and W.G.; methodology, M.H., T.W., L.Z. and W.G.; software, M.H. and H.Y.; validation, X.L., M.S., C.W. and J.L.; formal analysis, M.H., H.Y., T.W. and X.L.; investigation, M.H., T.W. and H.Y.; resources, S.B., P.L., L.Z. and W.G.; data curation, M.H., T.W. and X.L.; writing—original draft preparation, M.H. and H.Y.; writing—review and editing, M.S., J.L., P.L. and W.G.; visualization, M.H. and H.Y.; supervision, S.B., L.Z. and W.G.; project administration, L.Z. and W.G.; funding acquisition, L.Z. and W.G. All authors have read and agreed to the published version of the manuscript.

Funding

This research was financially supported by the Ph.D. foundation (No. 24zx7108) of Southwest University of Science and Technology.

Institutional Review Board Statement

Not applicable.

Data Availability Statement

The raw data supporting the conclusions of this article will be made available by the authors, without undue reservation.

Conflicts of Interest

The authors declare no conflicts of interest.

Abbreviations

The following abbreviations are used in this manuscript:
16S rRNA16S ribosomal RNA
AKAvailable potassium
ANAlkali-hydrolyzable nitrogen
ANOVAAnalysis of variance
APAvailable phosphorus
ARDAverage root diameter
C1The first cutting time
C2The second cutting time
C3The third cutting time
C4The fourth cutting time
CPCrude protein
CPYCrude protein yield
DDMYDigestible dry matter yield
DMDry matter content
DMYDry matter yield
DNADeoxyribonucleic acid
IVDMDIn vitro dry matter digestibility
LEfSeLinear discriminant analysis effect size
MChinese milk vetch
M100100% Chinese milk vetch
OTUOperational taxonomic unit
PCRPolymerase chain reaction
Rannual ryegrass
R100100% annual ryegrass
R25M7525% annual ryegrass + 75% Chinese milk vetch
R50M5050% annual ryegrass + 50% Chinese milk vetch
R75M2575% annual ryegrass + 25% Chinese milk vetch
RDWRoot dry weight
RLRoot length
RSARoot surface area
RTNRoot tip number
RVRoot volume
SEMStandard error of the mean
SOMSoil organic matter
TCPYCumulative crude protein yield
TDDMYCumulative digestible dry matter yield
TDMYCumulative dry matter yield

References

  1. Zhou, G.; Li, G.; Liang, H.; Liu, R.; Ma, Z.; Gao, S.; Chang, D.; Liu, J.; Chadwick, D.R.; Jones, D.L.; et al. Green manure coupled with straw returning increases soil organic carbon via decreased priming effect and enhanced microbial carbon pump. Glob. Change Biol. 2025, 31, e70232. [Google Scholar] [CrossRef] [PubMed]
  2. Liu, H.; Struik, P.C.; Zhang, Y.; Jing, J.; Stomph, T.J. Species combination determines whether forage mixtures gain in dry matter yield or crude protein concentration: A meta-analysis. Agron. Sustain. Dev. 2025, 45, 39. [Google Scholar] [CrossRef]
  3. Sturludóttir, E.; Brophy, C.; Belanger, G.; Gustavsson, A.M.; Jørgensen, M.; Lunnan, T.; Helgadóttir, Á. Benefits of mixing grasses and legumes for herbage yield and nutritive value in Northern Europe and Canada. Grass Forage Sci. 2014, 69, 229–240. [Google Scholar]
  4. Kramberger, B.; Gselman, A.; Kristl, J.; Lešnik, M.; Šuštar, V.; Muršec, M.; Podvršnik, M. Winter cover crop: The effects of grass–clover mixture proportion and biomass management on maize and the apparent residual N in the soil. Eur. J. Agron. 2014, 55, 63–71. [Google Scholar] [CrossRef]
  5. Fang, J.; Zhao, B.; Guan, H.; Yan, D.; Lei, Y.; Hu, X.; Zhou, Q.; Chen, Y.; Wang, H. Effect of Intercropping Oat (Avena sativa) and Common Vetch (Vicia sativa) on Yield and Nutritional Composition of Hay. Agriculture 2026, 16, 838. [Google Scholar] [CrossRef]
  6. Wu, X.; Zhang, J.; Zhang, J.; Lu, Y.; Ye, T.; Yang, H. Long-Term Production Performance and Stability of Alfalfa/Grass Mixtures in the Longdong Loess Plateau of China: Subjected to Various Species Combinations and Seeding Ratios. Agriculture 2025, 15, 1884. [Google Scholar] [CrossRef]
  7. Suter, M.; Connolly, J.; Finn, J.A.; Loges, R.; Kirwan, L.; Sebastià, M.T.; Lüscher, A. Nitrogen yield advantage from grass–legume mixtures is robust over a wide range of legume proportions and environmental conditions. Glob. Change Biol. 2015, 21, 2424–2438. [Google Scholar] [CrossRef] [PubMed]
  8. Cai, G.; Su, X.; Li, Y.; Wang, X. Comparisons between diversified multicropping systems in terms of crop productivity, economic benefits and carbon footprint in the Pearl River Delta region of South China. Farming Syst. 2023, 1, 100051. [Google Scholar] [CrossRef]
  9. Zhu, Y.; Zheng, W.; Monaco, T.; Li, S.S. Effects of Aboveground Community Structure and Belowground Root Morphological Characteristics on Nitrogen Use Efficiency of Mixed-Perennial Legume-Grass Pastures. Rangel. Ecol. Manag. 2022, 83, 59–68. [Google Scholar] [CrossRef]
  10. Xu, L.; Tang, G.; Wu, D.; Zhang, J. Yield and nutrient composition of forage crops and their effects on soil characteristics of winter fallow paddy in South China. Front. Plant Sci. 2024, 14, 1292114. [Google Scholar] [CrossRef] [PubMed]
  11. Zhao, W.; Yin, Y.; Song, J.; Li, S. Mixed sowing improves plant and soil bacterial community restoration in the degraded alpine meadow. Plant Soil 2024, 499, 379–392. [Google Scholar] [CrossRef]
  12. Zhu, B.; Yi, L.; Hu, Y.; Zeng, Z.; Lin, C.; Tang, H.; Yang, G.; Xiao, X. Nitrogen release from incorporated 15N-labelled Chinese milk vetch (Astragalus sinicus L.) residue and its dynamics in a double rice cropping system. Plant Soil 2014, 374, 331–344. [Google Scholar]
  13. Zhu, B.; Yi, L.; Guo, L.; Chen, G.; Hu, Y.; Tang, H.; Xiao, C.; Xiao, X.; Yang, G.; Acharya, S.N.; et al. Performance of two winter cover crops and their impacts on soil properties and two subsequent rice crops in Dongting Lake Plain, Hunan, China. Soil Tillage Res. 2012, 124, 95–101. [Google Scholar] [CrossRef]
  14. Bo, Z.H.U.; Zhang, K. Winter cover crops alter methanotrophs community structure in a double-rice paddy soil. J. Integr. Agric. 2016, 15, 553–565. [Google Scholar] [CrossRef]
  15. Tahir, M.; Li, C.; Zeng, T.; Xin, Y.; Chen, C.; Javed, H.H.; Yang, W.; Yan, Y. Mixture Composition Influenced the Biomass Yield and Nutritional Quality of Legume–Grass Pastures. Agronomy 2022, 12, 1449. [Google Scholar] [CrossRef]
  16. Vásquez, H.V.; Valqui, L.; Bobadilla, L.G.; Meseth, E.; Trigoso, M.J.; Zagaceta, L.H.; Valqui-Valqui, L.; Saravia-Navarro, D.; Barboza, E.; Maicelo, J.L. Agronomic and Nutritional Evaluation of INIA 910—Kumymarca Ryegrass (Lolium multiflorum Lam.): An Alternative for Sustainable Forage Production in Department of Amazonas (NW Peru). Agronomy 2025, 15, 100. [Google Scholar] [CrossRef]
  17. Vallejos-Cacho, R.; Vallejos-Fernández, L.A.; Alvarez-García, W.Y.; Tapia-Acosta, E.A.; Saldanha-Odriozola, S.; Quilcate-Pairazaman, C.E. Sustainability of Lolium multiflorum L. ‘cajamarquino Ecotype’, Associated with Trifolium repens L., at Three Cutting Frequencies in the Northern Highlands of Peru. Sustainability 2024, 16, 6927. [Google Scholar] [CrossRef]
  18. Zheng, J.; Wang, Q.; Li, S.; Zhang, B.; Zhang, F.; Zhao, T.; Qiao, J.; Zhao, M. Mowing effects on soil bacterial community assembly processes in a semiarid grassland. Plant Soil 2023, 493, 309–324. [Google Scholar] [CrossRef]
  19. Demircan, M.; Kizil Aydemir, E.S.; Kaçan, K. Forage Yield, Quality, and Weed Suppression in Narbon Vetch (Vicia narbonensis L.) and Italian Ryegrass (Lolium multiflorum L.) Mixtures Under Organic Management. Agronomy 2025, 15, 1796. [Google Scholar] [CrossRef]
  20. Tassone, S.; Fortina, R.; Peiretti, P.G. In vitro techniques using the Daisy II incubator for the assessment of digestibility: A review. Animals 2020, 10, 775. [Google Scholar] [CrossRef] [PubMed]
  21. Lu, X.; Ji, S.; Hou, C.; Qu, H.; Li, P.; Shen, Y. Impact of root C and N reserves on shoot regrowth of defoliated alfalfa cultivars differing in fall dormancy. Grassl. Sci. 2018, 64, 83–90. [Google Scholar] [CrossRef]
  22. Kong, X.; Zhang, F.; Wei, Q.; Xu, Y.; Hui, J. Influence of land use change on soil nutrients in an intensive agricultural region of North China. Soil Tillage Res. 2006, 88, 85–94. [Google Scholar] [CrossRef]
  23. Li, P.; Zhang, Y.; Gou, W.; Cheng, Q.; Bai, S.; Cai, Y. Silage fermentation and bacterial community of bur clover, annual ryegrass and their mixtures prepared with microbial inoculant and chemical additive. Anim. Feed Sci. Technol. 2019, 247, 285–293. [Google Scholar] [CrossRef]
  24. Huang, T.; Döring, T.F.; Zhao, X.; Weiner, J.; Dang, P.; Zhang, M.; Zhang, M.M.; Siddique, K.H.M.; Schmid, B.; Qin, X. Cultivar mixtures increase crop yields and temporal yield stability globally. A meta–analysis. Agron. Sustain. Dev. 2024, 44, 28. [Google Scholar] [CrossRef]
  25. Carrasco-Chilón, W.; Cervantes-Peralta, M.; Mendoza, L.; Muñoz-Vílchez, Y.; Quilcate, C.; Nuñez-Melgar, D.C.; Vásquez, H.; Alvarez-García, W.Y. Morphological differentiation, yield, and cutting time of Lolium multiflorum L. under acid soil conditions in highlands. Plants 2024, 13, 2331. [Google Scholar] [CrossRef] [PubMed]
  26. Liu, Y.; Guo, Z.; Shi, H. Rhizobium symbiosis leads to increased drought tolerance in Chinese milk vetch (Astragalus sinicus L.). Agronomy 2022, 12, 725. [Google Scholar] [CrossRef]
  27. Ma, J.; Yin, B.; Gao, T.; He, K.; Huang, X.; Jiang, T.; Zhen, W. Legume–non-legume cover crop mixtures enhance soil nutrient availability and physical properties: A meta-analysis across Chinese agroecosystems. Agronomy 2025, 15, 1756. [Google Scholar] [CrossRef]
  28. Xi, N.; De Long, J.R.D.; Davison, J.; Kardol, P.; Forero, L.E.; Zobel, M.; Semchenko, M. Plant–soil microbial interactions as modulators of species coexistence and productivity. Trends Ecol. Evol. 2025, 40, 673–686. [Google Scholar] [CrossRef] [PubMed]
  29. Chen, L.; Taogetao, B.; Hugjiltu, M. Effects of mowing regimes on above-and belowground biota in semi-arid grassland of northern China. J. Environ. Manag. 2021, 277, 111441. [Google Scholar] [CrossRef] [PubMed]
  30. Luo, F.; Liu, W.; Mi, W.; Ma, X.; Liu, K.; Ju, Z.; Li, W. Legume–grass mixtures increase forage yield by improving soil quality in different ecological regions of the Qinghai–Tibet Plateau. Front. Plant Sci. 2023, 14, 1280771. [Google Scholar] [CrossRef] [PubMed]
  31. Hernandez, P.; Picon-Cochard, C. Presence of Trifolium repens promotes complementarity of water use and N facilitation in diverse grass mixtures. Front. Plant Sci. 2016, 7, 538. [Google Scholar] [CrossRef] [PubMed]
  32. Meza, K.; Vanek, S.J.; Sueldo, Y.; Olivera, E.; Ccanto, R.; Scurrah, M.; Fonte, S.J. Grass–Legume Mixtures Show Potential to Increase Above- and Belowground Biomass Production for Andean Forage-Based Fallows. Agronomy 2022, 12, 142. [Google Scholar] [CrossRef]
  33. Bi, Y.; Yang, G.; Wei, Y.; Wilson, G.W.; Wei, B.; He, Y.; Yu, H.; Liu, N.; Zhang, Y. Low legume–grass seeding ratio combined with phosphorus fertilization promotes forage yield and soil quality in managed grasslands. Agron. Sustain. Dev. 2024, 44, 36. [Google Scholar] [CrossRef]
  34. Helgadóttir, Á.; Suter, M.; Gylfadóttir, T.Ó.; Kristjánsdóttir, T.A.; Lüscher, A. Grass–legume mixtures sustain strong yield advantage over monocultures under cool maritime growing conditions over a period of 5 years. Ann. Bot. 2018, 122, 337–348. [Google Scholar] [CrossRef] [PubMed]
  35. Choi, M.; Choi, N.; Lee, J.; Lee, S.; Kim, Y.; Na, C. Effects of Italian Ryegrass (Lolium multiflorum) Cultivation for Green Manure and Forage on Subsequent Above- and Below-Ground Growth and Yield of Soybean (Glycine max). Agriculture 2023, 13, 2038. [Google Scholar] [CrossRef]
  36. Feng, T.X.; Li, F.; Xiang, X.M.; Lin, W.S.; Wei, X.J.; Zhang, L.; De, K.J. Nitrogen and phosphorus fertilisers optimise root morphology and soil nutrients in mixed annual grass and bean sown grassland in alpine regions. PLoS ONE 2025, 20, e0321308. [Google Scholar] [CrossRef]
  37. Bao, Y.; Dolfing, J.; Guo, Z.; Chen, R.; Wu, M.; Li, Z.; Lin, X.; Feng, Y. Important ecophysiological roles of non-dominant Actinobacteria in plant residue decomposition, especially in less fertile soils. Microbiome 2021, 9, 84. [Google Scholar] [CrossRef] [PubMed]
  38. Yan, H.; Jin, X.; Zhou, X.; Gu, S.; Wu, X.; Li, P.; Shi, D.; Liu, H.; Lu, G.; Deng, Y. Long-term cultivation of grass–legume mixtures changed the assembly process of the microbial community and increased microbial community stability. ISME Commun. 2025, 5, ycae157. [Google Scholar] [CrossRef] [PubMed]
  39. Pan, Y.; Wang, W.; Yu, X.; Xiao, S.; Yan, T.; Lu, M.; Yang, W. The effects of different biodiversity-based cropping systems on ryegrass (Lolium multiflorum Lam.) biomass, nitrogen, carbon accumulation and soil nutrients. Agric. Ecosyst. Environ. 2026, 396, 110018. [Google Scholar] [CrossRef]
  40. Xie, Y.; Liu, W.; Li, P.; Bai, S.; Li, D.; Zhang, L.; Sun, H.; Zheng, Y.; Cheng, Q.; Gou, W.; et al. Soil bacterial community structure at different plant maturity stages in an annual grass–legume production system. Front. Sustain. Food Syst. 2023, 7, 1145488. [Google Scholar] [CrossRef]
Figure 1. Effects of seeding combination, cutting time, and their interaction on dry matter content (a), crude protein content (b), and in vitro dry matter digestibility (c); effects of seeding combination, cutting time, and their interaction on cumulative dry matter yield (d), cumulative crude protein yield (e), and cumulative digestible dry matter yield (f). The 1st cut, 2nd cut, 3rd cut and 4th cut represent the first, second, third, and fourth cutting times, respectively. Different uppercase letters indicate significant differences among seeding combinations for the same cutting time (p < 0.05). Different lowercase letters indicate significant differences among cutting times within the same seeding combination (p < 0.05). P(S), P(C), and P(S × C) represent the significance levels of seed combination, cutting time, and their interaction, respectively. Error bars represent the standard error of the mean (SEM). Plants in the Chinese milk vetch monoculture died before the 4th cut.
Agriculture 16 01677 g001
Figure 2. Root characteristics under different seeding combinations: root length (a), root surface area (b), root volume (c), average root diameter (d), root dry weight (e), root tip number (f), biomass relationship between root dry weight and aboveground dry matter yield (g), and linear regression between root dry weight and aboveground dry matter yield (h). Different lowercase letters indicate significant differences among seeding combinations (p < 0.05). Error bars represent the standard error of the mean (SEM).
Agriculture 16 01677 g002
Figure 3. Soil nutrient characteristics under different seeding combinations: soil organic matter (a), pH (b), and available potassium, available phosphorus, and alkali-hydrolyzable nitrogen (c). Different lowercase letters indicate significant differences among seeding combinations (p < 0.05), whereas the absence of letters indicates no significant difference. Error bars represent the standard error of the mean (SEM).
Agriculture 16 01677 g003
Figure 4. Relative abundances of soil bacterial communities at the phylum (a) and genus (b) levels under different seeding combinations and cutting times. C1, C2, C3, and C4 represent the 1st cut, 2nd cut, 3rd cut, and 4th cut, respectively, whereas S1, S2, S3, S4, and S5 represent R100, R75M25, R50M50, R25M75, and M100, respectively.
Agriculture 16 01677 g004
Figure 5. Alpha diversity indices of soil bacterial communities. Chao1 index (a), ACE index (b), phylogenetic diversity index (c), and Shannon index (d) under different seeding combinations; Chao1 index (e), ACE index (f), phylogenetic diversity index (g), and Shannon index (h) under different cutting times. Different lowercase letters indicate significant differences (p < 0.05), whereas the absence of letters indicates no significant difference. Error bars represent the standard error of the mean (SEM).
Agriculture 16 01677 g005
Figure 6. LEfSe analysis of differential bacterial taxa, radar-based comprehensive evaluation, and Spearman correlation analysis. Differential bacterial taxa identified by LEfSe analysis (a); cladogram showing the phylogenetic distribution of bacterial taxa significantly enriched at different cutting times (b); radar chart area for the comprehensive evaluation of different seeding combinations based on cumulative dry matter yield (TDMY), cumulative crude protein yield (TCPY), cumulative digestible dry matter yield (TDDMY), soil organic matter (SOM), alkali-hydrolyzable nitrogen (AN), available phosphorus (AP), and available potassium (AK) (c); Spearman correlation heatmap showing the relationships among soil properties, root traits, forage productivity, and dominant bacterial genera (d). Red and blue indicate positive and negative correlations, respectively, and color intensity reflects the strength of the correlation. Asterisks indicate significant correlations (p < 0.05).
Agriculture 16 01677 g006
Disclaimer/Publisher’s Note: The statements, opinions and data contained in all publications are solely those of the individual author(s) and contributor(s) and not of MDPI and/or the editor(s). MDPI and/or the editor(s) disclaim responsibility for any injury to people or property resulting from any ideas, methods, instructions or products referred to in the content.