Article

Sustainability Profiles of Peruvian Dairy Cattle Producers Using National Survey Data: A Frame-Aware MESMIS-Informed Assessment, 2021–2024

by
Leonardo Napoleon Mendoza Zumaeta
1,2,
Carlos Aldea
2,
Edwar Anaguari Palomino
1,
Jose Otoya-Barrenechea
1,
Ligia García
2,
Jonathan Campos
2 and
Pablo Rituay
3,*
1
Proyecto Mejoramiento del Sistema de Información Estadística Agraria y del Servicio de Información Agraria para el Desarrollo Rural del Perú (PIADER), Unidad Ejecutora de Gestión de Proyectos Sectoriales (UEGPS), Ministerio de Desarrollo Agrario y Riego del Peru, Lima 15047, Peru
2
Centro de Investigación Economía Circular y Prospectiva de Agronegocios, Instituto de Investigación en Negocios Agropecuarios, Facultad de Ingeniería Zootecnista, Biotecnología, Agronegocios y Ciencia de Datos, Universidad Nacional Toribio Rodríguez de Mendoza de Amazonas, Chachapoyas 01001, Peru
3
Escuela de Posgrado, Programa Doctoral en Ciencias para el Desarrollo Sustentable, Facultad de Ingeniería Zootecnista, Biotecnología, Agronegocios y Ciencia de Datos, Universidad Nacional Toribio Rodríguez de Mendoza de Amazonas, Chachapoyas 01001, Peru
*
Author to whom correspondence should be addressed.
Agriculture 2026, 16(15), 1648; https://doi.org/10.3390/agriculture16151648
Submission received: 20 May 2026 / Revised: 7 July 2026 / Accepted: 8 July 2026 / Published: 31 July 2026
(This article belongs to the Section Agricultural Economics, Policies and Rural Management)

Abstract

National dairy sustainability monitoring requires indicators that are scientifically defensible, policy-relevant, and feasible to construct from recurrent agricultural surveys. The aim of this study was to construct, interpret, and evaluate a national, survey-weighted, frame-aware, MESMIS-informed monitoring profile for Peruvian dairy cattle producers using ENA 2021–2024 microdata. The Peruvian National Agricultural Survey (Encuesta Nacional Agropecuaria, ENA) was explicitly treated as a source of proxy-based sustainability monitoring rather than as a complete farm sustainability assessment. Using survey design variables and harmonized items on livestock, markets, producer capacity, and resource management, the analysis constructed survey-weighted formative profiles for nationally monitored dairy cattle producer units. The analytical sample comprised 42,331 agricultural producer units selected based on complete interview status, reported livestock activity, and harmonized evidence of dairy cattle activity. Because ENA documentation indicates a sampling-frame transition in 2023, the 2021–2022 and 2023–2024 rounds were treated as separate sampling-frame regimes. Indicators were scaled to 0–1 formative profiles, with explicit checks for missingness, indicator availability, exclusion of derivative outputs, exclusion of producer age, minimum-availability thresholds, and sampling-regime-specific scaling. The median indicator availability was 12 of 14 economic and productive indicators, five of five social access and capacity indicators, and eight of eight environmental and resource-management indicators. Survey-weighted descriptive estimates and adjusted within-regime contrasts showed that the strongest signal was a lower social access and capacity profile in 2022 than in 2021, mainly associated with lower agricultural information use, livestock training, and technical assistance. Within the 2023–2024 sampling-frame regime, the main adjusted profiles were statistically stable. The results show that ENA can support a reproducible national monitoring baseline, provided that the resulting profiles are interpreted as proxy-based formative summaries constrained by survey coverage rather than as direct environmental performance scores, causal trends, or complete sustainability measures.

1. Introduction

Assessing the sustainability of dairy systems requires a systems perspective because farm performance emerges from interactions among herd resources, milk production, market participation, access to extension services, producer organization, pasture management, and environmental conditions. In Peru, dairy cattle production includes smallholder, mixed crop–livestock, and more market-oriented systems that differ substantially in land availability, herd size, productivity, input use, access to services, and resource-management practices [1,2,3,4,5]. This heterogeneity creates a need for nationally comparable evidence that extends beyond production indicators and captures multiple dimensions relevant to the sustainability of dairy farming systems.
Generating such evidence at the national level remains methodologically challenging. Detailed farm sustainability assessments generally require primary information on economic performance, labor conditions, household well-being, soil and water management, greenhouse gas emissions, biodiversity, animal welfare, and institutional participation. These data are rarely consistently available across recurrent national agricultural surveys. The central problem is therefore how official survey microdata can be used for multidimensional sustainability monitoring without being interpreted as a complete farm-level sustainability assessment.
Several frameworks provide complementary approaches to agricultural sustainability assessment. Life Cycle Assessment (LCA) quantifies environmental impacts associated with products and production processes across defined life cycle boundaries, but it requires detailed inventory data and does not, by itself, provide comprehensive coverage of social, institutional, and producer-capacity dimensions. The Sustainability Assessment of Food and Agriculture Systems (SAFA) framework offers broad coverage of environmental integrity, economic resilience, social well-being, and governance, but its full implementation requires information that is not routinely collected in general agricultural surveys. The IDEA method (Indicateurs de Durabilité des Exploitations Agricoles) provides an integrated farm-level diagnostic through economic, agroecological, and socio-territorial indicators, although it also depends on detailed holding-level information and context-specific assessment procedures [6,7,8,9,10].
The Framework for the Evaluation of Natural Resource Management Systems Incorporating Sustainability Indicators (MESMIS) offers a flexible and context-sensitive alternative. MESMIS links system characteristics and critical points to attributes such as productivity, stability, reliability, resilience, adaptability, equity, and self-reliance, and organizes assessment as an iterative cycle of system characterization, indicator selection, measurement, integration, and feedback [11,12,13,14]. Its main strengths are its multidimensional perspective, adaptability to different agricultural systems, and explicit connection between indicators and system-level sustainability attributes. However, conventional MESMIS applications are generally participatory, locally grounded, and based on detailed primary information. Consequently, applying MESMIS to secondary national survey data requires a transparent adaptation rather than a claim that the complete participatory protocol has been implemented.
In this study, MESMIS is therefore used as an organizing framework for defining sustainability-relevant domains, linking indicators to conceptual attributes, identifying data limitations, and structuring interpretation and feedback. The resulting measures are treated as proxy-based formative profiles rather than direct measurements of comprehensive farm sustainability. Indicator definitions, source variables, units, favorable direction, denominator restrictions, missingness, normalization, and aggregation rules must consequently be made explicit. Domains that are not adequately observed in the survey—including direct greenhouse gas emissions, nutrient balances, soil quality, water-use efficiency, biodiversity, animal welfare, labor conditions, access to health services, and broader dimensions of human capital—are acknowledged as measurement gaps rather than estimated through unsupported assumptions.
This distinction is also important for the statistical construction of profiles. Reflective measurement models and internal-consistency statistics are appropriate when observed variables are interchangeable manifestations of a common latent construct. Sustainability indicators are often formative because they represent complementary system characteristics that may contribute independently to a broader profile and therefore need not be strongly correlated [15,16]. In the present study, productive and market indicators, social access and producer-capacity indicators, and environmental and resource-management indicators are interpreted as complementary components. High internal consistency is therefore neither assumed nor used as the principal criterion of measurement quality; transparency, coverage, sensitivity, and substantive interpretability are emphasized instead.
The Peruvian National Agricultural Survey (Encuesta Nacional Agropecuaria, ENA) is an official, recurrent survey that provides nationally representative information on agricultural production units, livestock activities, market participation, producer characteristics, technical assistance, training, organization, and selected resource-management practices [17,18,19,20,21]. Its repeated cross-sectional design makes it useful for national monitoring, but does not allow changes within the same farms to be identified over time. In addition, official ENA and Ministry of Agricultural Development and Irrigation (MIDAGRI) documentation, together with survey design diagnostics, indicate a relevant transition in the sampling frame in 2023. The 2021–2022 and 2023–2024 rounds are therefore treated as separate sampling-frame regimes, and comparisons across the 2022–2023 boundary are not interpreted as substantive temporal change [22,23,24,25,26,27].
The 2021–2024 period was selected because these survey rounds provide the harmonized dairy cattle modules, source variables, and survey design information required to construct the complete set of indicators used in this study. Extending the series to earlier years would require an additional audit of questionnaire content, variable definitions, module routing, sampling frames, and harmonization rules. The four-year period is therefore suitable for establishing a reproducible monitoring baseline and for examining comparisons within the identified sampling-frame regimes, but it is not sufficient for inferring long-term structural trends or sustainability transitions.
Previous MESMIS applications in Latin America have predominantly focused on farms, communities, production systems, or regional case studies using detailed and frequent participatory information. National applications based on recurrent, probability-based agricultural survey microdata remain limited. This study addresses that methodological gap by operationalizing a frame-aware, MESMIS-informed monitoring protocol for Peruvian dairy cattle producers while explicitly distinguishing proxy indicators from comprehensive sustainability measures and formative profiles from reflective scales.
Accordingly, the objective of this study was to construct, interpret, and evaluate a national, survey-weighted, frame-aware, MESMIS-informed monitoring profile for Peruvian dairy cattle producers using ENA 2021–2024 microdata. Specifically, the analysis aimed to: (i) characterize the study population and document comparable temporal patterns within the 2021–2022 and 2023–2024 sampling-frame regimes; (ii) identify the individual indicators underlying the economic, social access and capacity, and environmental and resource-management profiles; and (iii) assess the robustness of the findings to survey weighting, missing-data requirements, indicator availability, indicator inclusion, and scaling choices.

2. Materials and Methods

2.1. Data Source, Analytical Unit, and Study Population

This study used microdata from the 2021, 2022, 2023, and 2024 rounds of the Peruvian National Agricultural Survey (Encuesta Nacional Agropecuaria, ENA). ENA is an official, repeated cross-sectional survey designed to generate agricultural sector statistics and provide evidence for monitoring agricultural policies and programs [22,23,26]. The survey does not follow the same agricultural production units over time; therefore, annual observations represent independent cross-sections rather than longitudinal farm trajectories. The public-use ENA files used in this study do not provide a stable longitudinal farm identifier that would allow the same agricultural producer unit to be linked across survey years. Therefore, the analytical sample should be interpreted as annual producer-unit observations from independent cross-sections, not as a panel of unique dairy farms followed over time.
The analytical unit was the agricultural producer unit. The target population for this study comprised surveyed agricultural production units with a valid, completed interview, reported livestock activity, and harmonized evidence of dairy cattle activity, operationally defined as the presence of at least one cow in milk. This criterion was applied consistently across the four survey rounds. The eligibility sequence and its correspondence with the harmonized ENA variables are documented in Table A1.
The final analytical sample comprised 42,331 agricultural producer units: 8247 in 2021, 7819 in 2022, 11,789 in 2023, and 14,476 in 2024. Inclusion in the analytical sample did not require complete milk-volume records because production, allocation, and derivative-output variables were affected by questionnaire routing, structural non-applicability, and item nonresponse. Milk-volume information was available for 4863 units in 2021, 4442 in 2022, 6888 in 2023, and 8540 in 2024.
The analysis used harmonized information from ENA modules covering livestock production, milk allocation and commercialization, agricultural producer and household characteristics, technical assistance, livestock training, agricultural information use, producer organization, pasture management, irrigation and resource management, forest area, and crop or livestock residue management. Each constructed indicator is linked to its original ENA question, source variable, harmonized variable, unit of measurement, denominator, construction rule, year of availability, and missing-data condition in Appendix A Table A1, Table A2 and Table A8.
Because the study used anonymized public-use secondary microdata and did not involve direct interaction with producers, no new primary data were collected. Table 1 summarizes the analytical sample and milk-volume availability by year.

2.2. Study System, Analytical Boundaries, and MESMIS-Informed Adaptation

The study system was defined as the nationally monitored population of Peruvian agricultural producer units that reported dairy cattle activity in ENA 2021–2024. The analytical boundary was the agricultural producer unit and the productive, market, producer-capacity, organizational, pasture management, and resource-management characteristics observed in the survey.
The spatial scope was national, and the temporal scope comprised the four annual ENA cross-sections from 2021 to 2024. The inferential scope was limited to survey-weighted national monitoring and within-sampling-frame comparisons. The study did not define a product life cycle boundary or estimate environmental footprints, greenhouse gas emissions, profitability, household welfare, or causal intervention effects.
MESMIS was used as an organizing framework rather than as a claim that the full participatory MESMIS protocol had been implemented. Its six-step cycle was adapted to the possibilities and limitations of secondary national survey data. System characterization and critical-point identification were informed by the dairy-system literature, ENA questionnaire coverage, and observed management constraints rather than by participatory workshops with producers.
The critical points represented in the monitoring framework were: (i) productive capacity and milk-use diversification; (ii) market participation and household milk allocation; (iii) access to technical assistance, training, agricultural information, and producer organization; and (iv) pasture and resource-management practices. The sampling-frame transition in 2023 was treated separately as a survey design constraint rather than as a sustainability critical point of the dairy production system. Table 2 summarizes the operational adaptation of the six-step MESMIS cycle to ENA microdata.

2.3. Sampling-Frame Regimes

The four survey rounds were divided into two analytical sampling-frame regimes: 2021–2022 and 2023–2024. The ENA 2023 technical documentation reports coordination with the Ministry of Agricultural Development and Irrigation (MIDAGRI) in the preparation of the master area sampling frame and states that the sampling frame used for sample selection was provided in March 2023 [22,24,26].
The distinction between the two regimes was also supported by survey design and coverage diagnostics, including the annual analytical sample size, weighted population totals, the number of primary sampling units, the number of strata, regional coverage, and milk-volume availability. These diagnostics are reported in Table A7, while the annual survey design specifications are summarized in Appendix A Table A7.
Survey-weighted descriptive profiles were estimated separately for each year. Inferential contrasts were restricted to comparisons within the same sampling-frame regime: 2021 versus 2022 and 2023 versus 2024. Differences across the 2022–2023 boundary were interpreted as potentially affected by changes in frame composition and survey coverage and were therefore not treated as evidence of substantive sustainability change. The four survey rounds were not modeled as a single continuous temporal trend.

2.4. Indicator Definition, Classification, and Direction

The analytical pipeline distinguished five levels of information:
  • ENA source question and original variable: The questionnaire item and variable contained in the annual public-use microdata;
  • Harmonized variable: The cross-year variable created after reconciling coding, labels, questionnaire routing, and year-specific availability;
  • Constructed indicator: The producer-level measure derived from one or more harmonized variables;
  • Standardized indicator score: The indicator transformed to a common 0–1 scale, with higher values representing the prespecified favorable direction;
  • Formative profile: The arithmetic combination of available standardized indicators within a monitoring domain.
Variable harmonization was conducted before indicator construction. First, the annual ENA questionnaires, data dictionaries, variable labels, and coding schemes for 2021, 2022, 2023, and 2024 were reviewed. Second, equivalent source questions and variables were identified across survey rounds. Third, year-specific differences in coding, response categories, labels, units, questionnaire routing, and module availability were reconciled. Fourth, harmonized variables were constructed using common denominators, reference periods, and missing-data rules. Fifth, each harmonized variable was checked for year availability, structural non-applicability, item nonresponse, and consistency with the intended indicator definition. The full traceability from ENA source questions and original variables to harmonized variables, constructed indicators, units, denominators, construction rules, and missing-data conditions is reported in Appendix A Table A1, Table A2 and Table A8.
Indicators were selected when they met four criteria: conceptual relevance to a MESMIS sustainability attribute; reproducible construction from harmonized ENA variables; an interpretable favorable direction; and sufficient data availability within at least one sampling-frame regime. Indicators were organized into three monitoring profiles: economic and productive conditions, social access and capacity, and environmental and resource management. The profile names describe the domains observed in ENA and should not be interpreted as complete measurements of economic, social, or environmental sustainability. ENA provides limited or no direct information on farm profitability, production costs, labor conditions, access to health services, multidimensional human capital, greenhouse gas emissions, nutrient balances, soil quality, water-use efficiency, biodiversity, animal welfare, energy use, or transport-related environmental impacts.
Production and milk-allocation variables were interpreted as indicators of productive capacity, market participation, household use, or adaptability rather than as sufficient measures of sustainability. Resource-related indicators were interpreted as management and land-use proxies rather than as direct measures of environmental performance. Producer age was included only as an imperfect proxy for accumulated production experience and was examined through an exclusion sensitivity analysis. Table 3 summarizes the selected indicators, monitoring profiles, MESMIS attributes, and favorable directions used for profile construction.

2.5. Missing Data and Formative Profile Construction

Missingness was evaluated before profile construction [28]. The analysis distinguished among item nonresponse, structural missingness caused by questionnaire routing, and non-applicability to the producer unit. Indicators were calculated only for their conceptually relevant denominators, and structurally inapplicable responses were not automatically recoded as zero.
Milk-volume variables were available for 58.97% of the analytical sample in 2021, 56.81% in 2022, 58.43% in 2023, and 58.99% in 2024. The median number of available indicators per producer unit was 12 of 14 economic and productive indicators, 5 of 5 social access and capacity indicators, and 8 of 8 environmental and resource-management indicators. Indicator-level missingness by year is reported in Table A2, and domain-level availability is reported in Table A4.
A complete-case analysis requiring all 27 indicators to be observed simultaneously was not feasible because some optional and derived variables, particularly derivative output, exhibited extensive structural missingness. No single-value imputation was used to replace missing indicators. Instead, primary profiles were calculated from the available indicators within each domain, and the robustness of this decision was evaluated using explicit minimum-availability thresholds.
To place indicators on a common scale and reduce the influence of extreme observations, valid indicator values were bounded at the pooled 1st and 99th percentiles. Let x i k denote the observed value of indicator k for producer unit i , and let L k and U k denote the pooled 1st and 99th percentile bounds, respectively. The bounded value x i k b was defined as:
x i k b = min max x i k , L k , U k
For indicators for which higher observed values represented more favorable conditions, the positive-direction standardized score s i k ( + )   was calculated as:
s i k ( + ) = x i k b L k U k L k
For reverse-direction indicators, where lower observed values represented more favorable conditions, the reverse-direction standardized score s i k ( ) was calculated as:
s i k ( ) = 1 x i k b L k U k L k
The final directed standardized score s i k   was assigned as s i k ( + ) for higher-is-better indicators and as s i k ( )   for lower-is-better indicators. Scores were calculated only when U k > L k .   When U k L k , the corresponding score was treated as missing because the indicator had no valid variation within the scaling reference. Accordingly, valid standardized scores ranged from 0 to 1, with higher values indicating more favorable conditions in the prespecified direction. Binary indicators retained their 0–1 interpretation whenever their lower and upper bounds were 0 and 1.
Let K i j denote the set of non-missing directed standardized indicators available for producer unit i in monitoring profile j , and let m i j = K i j . The formative profile D i j was calculated as the arithmetic mean of the available standardized indicator scores:
D i j = 1 m i j K s
Equal indicator weights were used as a transparent baseline because no nationally validated stakeholder-derived weights were available [15]. Equal weighting does not imply that all indicators are substantively equivalent; rather, it avoids imposing unsupported differential weights. The overall profile was calculated as the arithmetic mean of the available domain profiles and was treated as a secondary, compensatory summary. Interpretation emphasized domain-level and indicator-level results.
Because the profiles were formative, measurement quality was evaluated using conceptual transparency, indicator traceability, data coverage, sensitivity, and interpretability rather than solely on internal-consistency coefficients.
Sensitivity analyses assessed the effects of: (i) requiring at least 50% or 70% indicator availability within each profile; (ii) excluding derivative output; (iii) excluding producer age; (iv) excluding the social access and capacity profile from the overall summary; and (v) using sampling-regime-specific rather than pooled 1st–99th percentile scaling. All sensitivity estimates and confidence intervals were generated using the ENA survey design. Table A5 reports the estimates, and Appendix A Table A5 explains the rationale and interpretation of each sensitivity scenario.

2.6. Survey-Weighted Estimation

Survey-weighted means and 95% confidence intervals were estimated using Stata/MP 16 and the survey design information available for each ENA round [29,30]. The survey settings incorporated the annual expansion factor as the probability weight, along with the corresponding strata and primary sampling unit identifiers. Singleton strata were handled using Stata’s singleunit (scaled) adjustment. Variance estimates were design-based.
Descriptive estimates were produced separately for each survey year. Annual estimates were retained for visual and descriptive monitoring, but statistical contrasts were limited to years belonging to the same sampling-frame regime.
Within-regime adjusted contrasts were estimated using survey-weighted linear regression models. Separate models compared 2022 with 2021 and 2024 with 2023. Models included herd stock, land area, producer education, and regional fixed effects as adjustment variables. Variables that formed part of the outcome profile, including technical assistance and milk-commercialization indicators, were not included as covariates because doing so would condition on components of the outcome.
Regression coefficients were interpreted as adjusted descriptive differences between annual cross-sections within the same sampling-frame regime. They were not interpreted as causal year effects or as evidence of changes within the same agricultural producer units.
Python 3.11 (pandas, matplotlib, and seaborn) was used to harmonize variables, construct indicators, format exported statistical outputs and generate figures from the survey-weighted estimates. Statistical estimates, standard errors, confidence intervals, and sensitivity analyses were generated using the declared ENA survey design in Stata/MP 16.

3. Results

3.1. Frame-Aware Formative Profiles

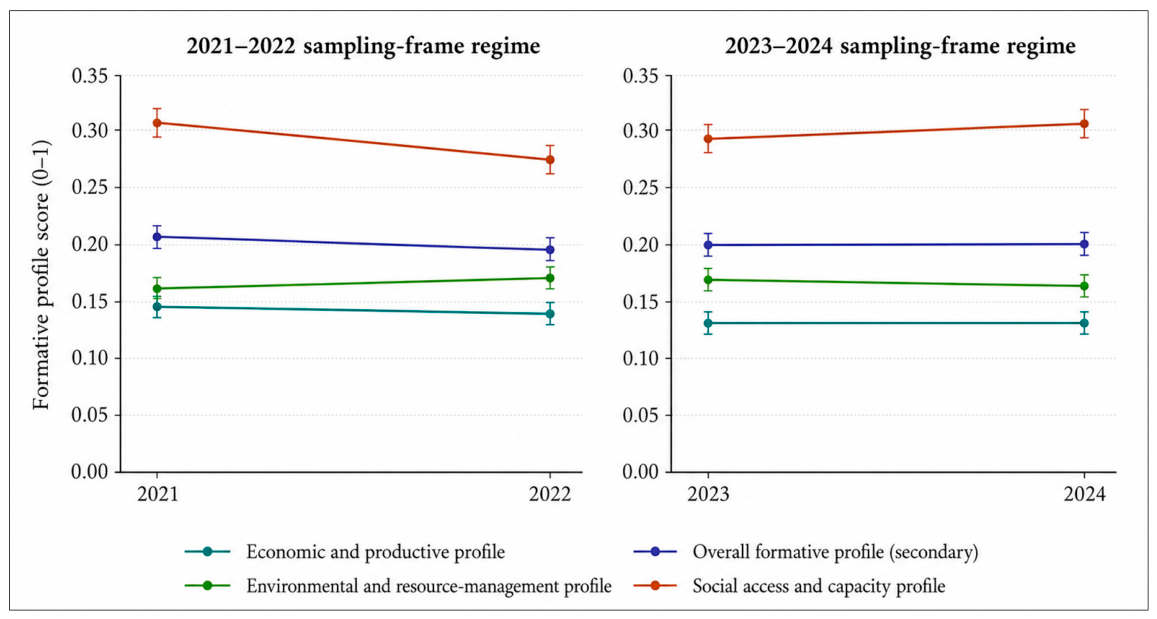
Table 4 and Figure 1 presents the survey-weighted formative profiles for each ENA round. Comparisons were restricted to annual cross-sections within the same sampling-frame regime: 2021 versus 2022 and 2023 versus 2024. Differences across the sampling-frame boundary were not interpreted as substantive temporal change.
The economic and productive profile showed limited variation within both sampling-frame regimes. It was estimated at 0.144 [0.139, 0.149] in 2021 and 0.141 [0.136, 0.147] in 2022. The corresponding estimates were 0.134 [0.124, 0.144] in 2023 and 0.136 [0.129, 0.142] in 2024.
The largest within-regime difference occurred in the social access and capacity profile, which was lower in 2022 (0.274 [0.267, 0.280]) than in 2021 (0.306 [0.300, 0.311]). Within the 2023–2024 regime, the estimates were similar: 0.296 [0.286, 0.306] in 2023 and 0.302 [0.295, 0.309] in 2024.
The environmental and resource-management profile was slightly higher in 2022 than in 2021 and slightly lower in 2024 than in 2023. The secondary overall profile was 0.204 [0.201, 0.207] in 2021 and 0.194 [0.191, 0.198] in 2022, whereas the 2023 and 2024 estimates were nearly identical. When the social access and capacity profile was excluded, the overall estimates for 2021 and 2022 were similar, indicating that the difference in the secondary overall profile was primarily associated with the social access and capacity components.

3.2. Selected Indicators in Original Units

3.2.1. Economic and Productive Indicators

Panel A of Table 5 presents selected economic and productive indicators in their original units. Estimated milk production ranged from 2300.117 kg in 2023 to 3285.457 kg in 2022. The confidence interval for 2022 was comparatively wide, indicating greater uncertainty around the corresponding population estimate. Milk production per cow showed less annual variation, ranging from 785.739 kg/head in 2023 to 846.865 kg/head in 2022, while the estimated share of milk sold ranged from 0.322 in 2024 to 0.366 in 2022.
Milk production showed greater annual variation than milk production per cow. The lowest estimated milk production occurred in 2023, followed by a higher estimate in 2024. This pattern should be interpreted cautiously because the ENA rounds are independent annual cross-sections and because milk-volume indicators were calculated only for observations with valid information for the corresponding denominators. Therefore, annual differences may reflect a combination of sample composition, herd structure, reporting conditions, denominator availability, or contextual factors not directly observed in the survey.
These estimates should not be interpreted as changes within the same agricultural producer units or as evidence of causal effects. The available ENA data do not allow the observed variation in milk production to be attributed directly to specific programs, funding levels, technology adoption, feeding strategies, animal-health interventions, climatic conditions, or market changes. Accordingly, milk-production indicators are interpreted as descriptive monitoring signals and should be read together with service-access, training, organizational, and resource-management indicators.

3.2.2. Environmental and Resource-Management Indicators

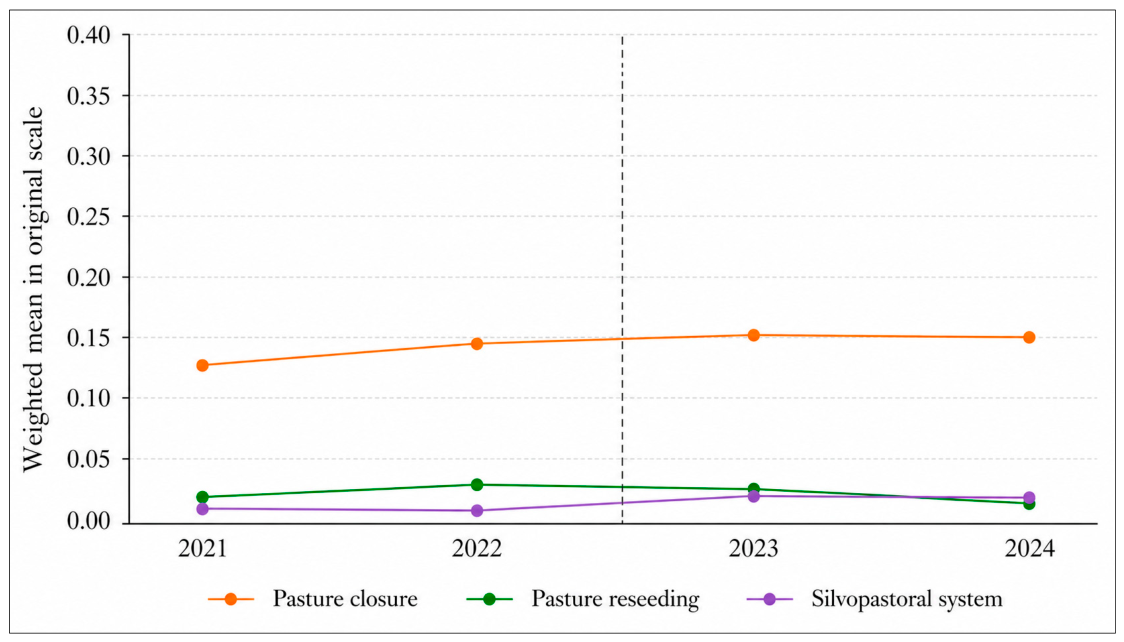
Panel B of Table 5 and Figure 2 reports selected pasture and resource-management practices. Pasture closure was reported by between 12.9% and 15.2% of the monitored producer population. Pasture reseeding was less common, with estimated proportions ranging from 1.7% to 2.9%. Reported adoption of silvopastoral systems ranged from 1.0% to 2.2%.
The differences in prevalence across these practices show that they represent distinct management components rather than interchangeable manifestations of a single environmental construct. They should therefore be interpreted individually and as components of a formative environmental and resource-management profile, rather than as direct measurements of environmental performance.

3.3. Social Access and Capacity Components

Table 6 decomposes the social access and capacity profile into its component indicators. This decomposition is important because the profile is a formative monitoring summary rather than a validated psychometric scale.
Within the 2021–2022 sampling-frame regime, agricultural information use was lower in 2022, at 0.728 [0.716, 0.740], than in 2021, at 0.824 [0.814, 0.834]. Livestock training was estimated at 0.122 [0.113, 0.130] in 2021 and 0.076 [0.069, 0.084] in 2022. Technical assistance was also lower in 2022, at 0.037 [0.032, 0.042], than in 2021, at 0.062 [0.055, 0.068].
The producer experience proxy and organization participation intensity showed comparatively limited differences between 2021 and 2022. Consequently, the social access and capacity profile was lower in 2022 than in 2021.
Within the 2023–2024 regime, the social access and capacity profile estimates were similar. Agricultural information use remained comparatively high, whereas technical assistance and livestock training remained low. Organization participation intensity was higher in 2024 than in 2023, although the absolute level remained limited.
These indicators describe service access, information use, an accumulated-experience proxy, and organizational participation, as captured by ENA. They should not be interpreted as a complete assessment of social sustainability.

3.4. Within-Regime Regression Contrasts

Table 7 presents adjusted contrasts between annual cross-sections within each sampling-frame regime. The coefficients represent the adjusted difference for the later year minus the earlier year.
Within the 2021–2022 regime, the social access and capacity profile was lower in 2022 than in 2021, with an adjusted difference of −0.032 [−0.040, −0.024] (p < 0.001). The economic and productive profile was not statistically distinguishable between the two years. The environmental and resource-management profile showed a small positive adjusted difference of 0.006 [0.000, 0.011] (p = 0.038).
The secondary overall profile was lower in 2022 than in 2021, with an adjusted difference of −0.010 [−0.015, −0.006] (p < 0.001). However, when the social access and capacity profile was excluded, the adjusted difference was close to zero and was not statistically distinguishable from zero (coefficient = 0.001, p = 0.779). This indicates that the adjusted difference in the secondary overall profile was primarily associated with the social access and capacity components.
Within the 2023–2024 sampling-frame regime, none of the economic and productive, social access and capacity, environmental and resource-management, or secondary overall profile contrasts was statistically distinguishable from zero.
These coefficients represent adjusted descriptive differences between independent annual cross-sections. They should not be interpreted as causal year effects or as changes within the same agricultural producer units.

3.5. Sensitivity Analyses

The sensitivity analyses did not change the principal interpretation of the results. Applying minimum indicator-availability thresholds of 50% and 70%, excluding derivative output, excluding producer age, and using sampling-regime-specific scaling changed the absolute levels of some formative profiles but did not reverse the direction of the principal within-regime findings.
For example, the secondary overall profile for 2022 was 0.194 [0.191, 0.198] under the primary specification and 0.177 [0.173, 0.181] when producer age was excluded. Despite this change in the absolute profile value, the lower social access and capacity profile in 2022 remained evident.
Excluding the social access and capacity profile eliminated the adjusted difference in the secondary overall profile between 2021 and 2022. The overall profile excluding social access and capacity was estimated at 0.153 [0.150, 0.157] in 2021 and 0.155 [0.151, 0.158] in 2022, and the corresponding adjusted contrast was not statistically distinguishable from zero.
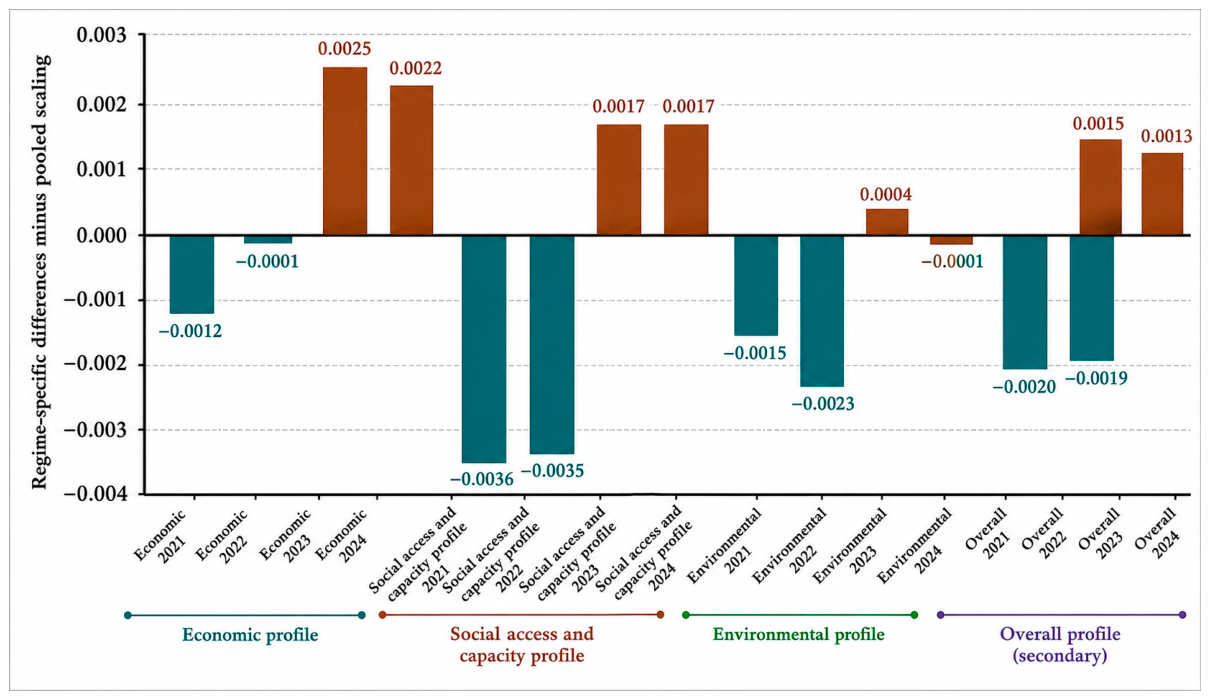
Regime-specific 1st–99th percentile scaling produced only limited differences in mean profile estimates compared with pooled scaling. Complete-case scoring across all 27 formative indicators was not feasible because no survey year contained complete information for every indicator, primarily because of structural missingness in optional and derived milk-production and allocation variables.
Complete sensitivity estimates are reported in Appendix A Table A5, and the comparison between pooled and sampling-regime-specific scaling is presented in Appendix A Figure A1. Collectively, these analyses indicate that the most consistent within-regime difference concerned social access and capacity between 2021 and 2022, whereas the main profiles in the 2023–2024 regime showed no statistically detectable adjusted differences.

4. Discussion

4.1. Main Findings and Contribution of the National-Scale Approach

This study shows that ENA microdata can support national monitoring of sustainability-relevant conditions among Peruvian dairy cattle producers when the analytical population, indicator construction, missingness, survey design, and sampling-frame discontinuities are handled explicitly. The resulting profiles should be interpreted as proxy-based formative monitoring summaries, not as causal trends, complete farm sustainability assessments, or longitudinal changes within the same producer units.
The separation between the 2021–2022 and 2023–2024 sampling-frame regimes is central to this interpretation. Treating the four ENA rounds as a single continuous trend would risk attributing survey-frame differences to substantive sustainability change. By restricting adjusted contrasts to comparisons within the same regime, the analysis provides a more defensible basis for monitoring annual differences while preserving the survey’s national representativeness.
The strongest within-regime result was a lower social access and capacity profile in 2022 than in 2021. This difference was mainly associated with lower observed levels of agricultural information use, livestock training, and technical assistance. This should not be interpreted as a validated decline in social sustainability because ENA does not directly measure labor conditions, access to health services, household vulnerability, or broader human capital. Rather, it indicates a reduction in the specific access and capacity conditions that the survey captured.
Even with this limitation, the signal is agriculturally meaningful. Access to technical assistance, training, information, and producer organizations can influence producers’ ability to improve feeding, animal health, pasture management, milk quality, and market participation. The disappearance of the adjusted difference in the secondary overall profile when the social access and capacity profile was excluded further indicates that the apparent 2021–2022 reduction in the overall profile was mainly driven by the observed social access and capacity components.
Within the 2023–2024 sampling-frame regime, none of the main adjusted profiles showed statistically significant differences. This finding indicates short-term stability in the monitored indicators, but it does not imply that dairy systems were structurally sustainable or that relevant changes did not occur. Stability may reflect true year-to-year similarity, limited sensitivity of the available ENA variables, or both. Therefore, the low absolute levels of several management indicators remain more important for interpretation than the absence of short-run adjusted differences.
This national-scale contribution complements farm-level and regional sustainability studies in Peru and Latin America. Local assessments can provide deeper biophysical, agroecological, economic, and participatory information, but they usually do not offer recurrent nationally representative estimates [19,20,21]. In contrast, the ENA-based approach sacrifices local detail in exchange for national coverage, repeated measurement, explicit survey weighting, and the ability to monitor comparable domains over time. This difference in scale is the study’s main methodological contribution.

4.2. Agricultural Systems and Management Implications

The indicator-level results point to concrete domains for dairy-sector monitoring and policy action. In 2024, technical assistance reached only 0.023 [0.014, 0.033], livestock training reached 0.075 [0.061, 0.090], pasture reseeding reached 0.017 [0.006, 0.028], and reported use of silvopastoral systems reached 0.021 [0.006, 0.036]. Although these values depend on ENA definitions and coverage, their low levels suggest that extension services, specialized training, pasture renewal, and tree–pasture integration remain weakly diffused among the monitored producer population [31,32].
These findings indicate that dairy-sector development should not be evaluated solely by production indicators. Productive capacity can be constrained by limited access to advice, inadequate training coverage, low organizational participation, and limited adoption of resource-management practices. Policy efforts aimed at increasing milk production should therefore be accompanied by sustained investment in technical assistance, livestock training, animal-health support, pasture management, and producer organizations [33].
The low prevalence of pasture reseeding and silvopastoral systems is relevant to environmental and resource-management planning. These practices may contribute to forage availability, soil cover, microclimate regulation, and more diversified land management. However, ENA does not directly measure soil quality, nutrient balances, carbon storage, water-use efficiency, biodiversity, or greenhouse gas emissions. Therefore, the results should be interpreted as evidence of limited adoption of selected management practices, not as direct evidence of environmental performance.
The findings also suggest a cautious entry point for circular-economy monitoring in dairy systems. Circularity in livestock production should not be framed only around downstream waste valorization or processing. It also depends on farm-level practices such as pasture renewal, forage conservation, manure management, crop–livestock integration, and tree–pasture systems. The current ENA variables do not measure material flows, manure destinations, nutrient recycling, or energy use, but they identify domains where future survey modules could improve monitoring of circular resource use.
For policy monitoring, ENA should preserve stable indicator definitions, document changes in sampling frames and questionnaire routing, and publish coverage and missingness diagnostics together with headline estimates. Future modules could strengthen measurement of manure management, rotational grazing, forage conservation, soil cover practices, crop–livestock residue use, milk quality, animal health and welfare, water and energy use, farm costs and revenues, and producer labor conditions. These additions would help move from proxy-based monitoring toward more complete sustainability and circular-economy assessment.
The observed variation in milk production cannot be attributed directly to specific programs, funding levels, technology adoption, feeding strategies, animal-health interventions, or climatic conditions because these mechanisms are not measured with sufficient detail in the current ENA analytical structure. This limitation is important for sustainability monitoring. Higher dairy production is not necessarily more sustainable unless it is achieved while maintaining or improving the natural resource base. Future ENA modules could therefore include more detailed information on feeding systems, forage availability, breed composition, animal health, veterinary access, reproductive management, program participation, technology adoption, input use, climate shocks, milk quality, farm-gate prices, production costs, and manure or residue management. These additions would allow future analyses to explain whether changes in milk production are associated with improved productive efficiency, better advisory support, or greater pressure on natural resources.

4.3. Measurement Implications

The profiles developed in this study were specified as formative because their components represent distinct and complementary characteristics of dairy systems. Technical assistance, training, agricultural information use, producer organization, milk commercialization, productive capacity, and pasture management are not interchangeable expressions of a single latent construct. Each indicator describes a different condition that may contribute to the broader monitoring profile.
For this reason, internal-consistency statistics should not be used as the primary criterion for validating the profiles. Low correlations or low alpha values do not prove that a profile is formative, but they are consistent with the conceptual expectation that the indicators capture complementary dimensions. The validity of the profiles depends instead on conceptual relevance, transparent construction, indicator traceability, sufficient coverage, clear directionality, sensitivity analysis, and interpretability.
This choice of measurement limits the claims that can be made. The study does not measure a single latent construct called “sustainability.” It constructs three monitoring profiles: economic and productive conditions, social access and capacity, and environmental and resource management. The secondary overall profile is useful as a summary, but it is compensatory and may conceal differences among domains. Therefore, interpretation should prioritize domain-level and indicator-level results over the overall score.
The sensitivity analyses support this interpretation. Excluding producer age reduced dependence on a conceptually ambiguous experience proxy. Excluding derivative output addressed missingness in production-allocation variables. Minimum-availability thresholds and regime-specific scaling were used to test whether the results depended on partial observations or on the main scaling reference. Across these checks, the main interpretation remained stable: the biggest within-regime difference concerned social access and capacity between 2021 and 2022, while the 2023–2024 profiles remained comparatively stable.

4.4. Limitations

The findings should be interpreted within the scope of the ENA data. The survey was not designed as a comprehensive sustainability assessment; therefore, the profiles constructed in this study should be read as sustainability-relevant proxies rather than complete measures of economic viability, social well-being, environmental integrity, governance, resilience, or circularity. Important domains such as greenhouse gas emissions, input intensity, manure management, nutrient balances, soil conditions, water conservation, biodiversity, animal welfare, profitability, milk quality, labor conditions, access to health services, and broader human capital were either absent or only partially observed.
Temporal interpretation is also limited by repeated cross-sectional design and the 2023 sampling-frame transition. ENA does not follow the same producer units over time, so annual estimates describe independent samples rather than within-farm changes. The separation of the 2021–2022 and 2023–2024 sampling-frame regimes reduces the risk of overinterpreting frame-related differences, but it does not create a continuous four-year trend. The 2021–2024 window is also too short to identify long-term structural trajectories or persistent sustainability transitions.
Additional caution is required because several milk-production, milk-allocation, and derivative-output variables presented missingness or structural non-applicability, and because equal-weight aggregation assumes compensation among indicators in the absence of nationally validated stakeholder-derived weights. Some indicators, including production volume, milk production per hectare, forest area, natural pasture area, household milk allocation, and producer age, may reflect resource endowments, farm size, market access, demographic structure, or production objectives rather than management quality alone. These limitations do not invalidate the monitoring protocol, but they define its appropriate use: a national baseline, a transparent synthesis of ENA-available information, and an agenda for improving future agricultural survey modules rather than a replacement for detailed farm assessments, participatory MESMIS applications, LCA, SAFA, IDEA, or other comprehensive sustainability frameworks.

5. Conclusions

National agricultural survey data can support monitoring of sustainability-relevant profiles in Peruvian dairy cattle systems when the analytical population, missingness, indicator direction, aggregation rules, and sampling-frame regimes are explicitly accounted for. This study provides a frame-aware, MESMIS-informed monitoring protocol using ENA 2021–2024 microdata and shows that repeated official surveys can generate a reproducible national baseline when their limits are treated as part of the evidence rather than ignored.
The empirical results indicate that the most relevant within-regime signal was located in the social access and capacity profile. The lower 2022 profile relative to 2021 was mainly associated with lower observed levels of agricultural information use, livestock training, and technical assistance. Within the 2023–2024 sampling-frame regime, the main adjusted profiles remained comparatively stable. These findings should not be interpreted as causal trends or as changes within the same farms, but as survey-weighted monitoring evidence from independent annual cross-sections.
The indicator-level results also point to concrete constraints for dairy-sector monitoring and policy design. Low coverage of technical assistance and livestock training suggests limited diffusion of advisory and capacity-building services, while low adoption of pasture reseeding and silvopastoral systems indicates that selected resource-management practices remain weakly extended among the monitored producer population. These patterns are relevant for productivity, resilience, and future circular-resource monitoring, although ENA does not directly measure environmental performance, nutrient flows, greenhouse gas emissions, or farm-level circularity.
For policy and survey design, the study offers three practical implications. First, ENA-based dairy monitoring should report sampling-frame regimes and avoid interpreting cross-frame differences as substantive year-to-year change. Second, sustainability reporting should combine formative profiles with raw indicators, as aggregate scores can mask specific management and service-access gaps. Third, future ENA modules should strengthen variables related to manure management, soil cover conditions, rotational grazing, forage conservation, crop–livestock residue use, water and energy use, milk quality, animal welfare, farm costs, and producer labor conditions.
The study, therefore, contributes a cautious but usable national monitoring baseline for Peruvian dairy systems. Its value lies in transparently organizing the available ENA information, identifying policy-relevant gaps, and defining the conditions under which recurrent agricultural surveys can inform sustainability monitoring. The proposed profiles should not be used as definitive sustainability rankings of farms, but as a reproducible tool for national monitoring, prioritization, and future survey improvement.

Author Contributions

Conceptualization, L.N.M.Z., C.A., J.C. and P.R.; methodology, L.N.M.Z., C.A., J.C. and P.R.; software, L.G.; validation, P.R.; formal analysis, L.N.M.Z.; investigation, L.N.M.Z. and L.G.; data curation, L.G.; writing—original draft preparation, L.N.M.Z.; writing—review and editing, C.A., E.A.P., J.O.-B., L.G., J.C. and P.R.; visualization, L.N.M.Z.; supervision, C.A., E.A.P., J.O.-B. and J.C.; project administration, E.A.P., J.O.-B. and J.C.; funding acquisition, E.A.P. and J.O.-B. All authors have read and agreed to the published version of the manuscript.

Funding

This research was funded by the Programa de Mejoramiento del Sistema de Información Estadística Agraria y del Servicio de Información Agraria para el Desarrollo Rural del Perú (PIADER), Unidad Ejecutora de Gestión de Proyectos Sectoriales (UEGPS), Ministerio de Desarrollo Agrario y Riego del Perú, within the framework of the Concurso de Investigaciones sobre Resultados de la Encuesta Nacional Agropecuaria (ENA), grant number OS-2674-2025. The APC was funded by the Vicerrectorado de Investigación of the Universidad Nacional Toribio Rodríguez de Mendoza de Amazonas.

Institutional Review Board Statement

Not applicable. This study used anonymized secondary microdata from the Encuesta Nacional Agropecuaria (ENA). The authors did not collect primary data from human participants or animals, and the analysis did not involve any intervention, interaction, or identifiable personal information.

Data Availability Statement

The original data presented in the study are openly available in Peru’s official statistical data systems and the Plataforma Nacional de Datos Abiertos at https://proyectos.inei.gob.pe/microdatos/ and https://www.datosabiertos.gob.pe/ (both accessed on 3 June 2026). The harmonized processing scripts and derived tables generated for this study are organized in the project repository and will be made available upon publication.

Conflicts of Interest

The authors declare no conflicts of interest.

Appendix A

This section embeds the appendix tables and visual support files generated by the reproducible pipeline for reviewer inspection.
Table A1. Eligibility traceability for the ENA dairy cattle analytical sample.
CriterionReader-Facing CriterionInterpretationYearsRetained NNotes
Agricultural producer unit in ENA frameENA producer frameAgricultural producer units covered by the annual ENA survey frame.2021–202442,331Full annual frame counts are reported in the sample-flow outputs.
Complete interview and valid agricultural producer recordComplete interview and valid producer recordProducer record classified as valid and complete interview.2021–202442,331Applied before livestock and dairy cattle filtering in the reproducible Stata pipeline.
Livestock activityReported livestock activityProducer reports livestock activity in harmonized ENA modules.2021–202442,331Intermediate counts are retained in sample-flow tables.
Dairy cattle activity/cows in milkReported dairy cattle activity/cows in milk greater than zeroHarmonized dairy cattle eligibility variable used as the producer-level inclusion rule for dairy cattle activity/cows in milk.2021–202442,331This eligibility rule does not require complete milk-volume allocation records; missingness is reported separately.
Table A2. Indicator missingness by year.
IndicatorReader-Facing IndicatorYearNNon-MissingMissingMissing Percent
Total milk productionTotal milk production202182474863338441.03
Total milk productionTotal milk production202278194442337743.19
Total milk productionTotal milk production202311,7896888490141.57
Total milk productionTotal milk production202414,4768540593641.01
Milk soldMilk sold202182474863338441.03
Milk soldMilk sold202278194442337743.19
Milk soldMilk sold202311,7896888490141.57
Milk soldMilk sold202414,4768540593641.01
Share of milk soldShare of milk sold202182474863338441.03
Share of milk soldShare of milk sold202278194442337743.19
Share of milk soldShare of milk sold202311,7896888490141.57
Share of milk soldShare of milk sold202414,4768540593641.01
Milk for household consumptionMilk for household consumption202182474863338441.03
Milk for household consumptionMilk for household consumption202278194442337743.19
Milk for household consumptionMilk for household consumption202311,7896888490141.57
Milk for household consumptionMilk for household consumption202414,4768540593641.01
Share for self-consumptionShare for self-consumption202182474863338441.03
Share for self-consumptionShare for self-consumption202278194442337743.19
Share for self-consumptionShare for self-consumption202311,7896888490141.57
Share for self-consumptionShare for self-consumption202414,4768540593641.01
Milk for derivativesMilk for derivatives202182474863338441.03
Milk for derivativesMilk for derivatives202278194442337743.19
Milk for derivativesMilk for derivatives202311,7896888490141.57
Milk for derivativesMilk for derivatives202414,4768540593641.01
Share processed into derivativesShare processed into derivatives202182474863338441.03
Share processed into derivativesShare processed into derivatives202278194442337743.19
Share processed into derivativesShare processed into derivatives202311,7896888490141.57
Share processed into derivativesShare processed into derivatives202414,4768540593641.01
Cows in milkCows in milk202182474863338441.03
Cows in milkCows in milk202278194442337743.19
Cows in milkCows in milk202311,7896888490141.57
Cows in milkCows in milk202414,4768540593641.01
Milk per cowMilk per cow202182474863338441.03
Milk per cowMilk per cow202278194442337743.19
Milk per cowMilk per cow202311,7896888490141.57
Milk per cowMilk per cow202414,4768540593641.01
Low bovine mortalityBovine mortality20218247824700.0
Low bovine mortalityBovine mortality20227819781900.0
Low bovine mortalityBovine mortality202311,78911,78900.0
Low bovine mortalityBovine mortality202414,47614,47600.0
Herd replacementHerd replacement2021824779173304.0
Herd replacementHerd replacement2022781974623574.57
Herd replacementHerd replacement202311,78911,4823072.6
Herd replacementHerd replacement202414,47614,1053712.56
Milk-use diversificationMilk-use diversification202182474863338441.03
Milk-use diversificationMilk-use diversification202278194442337743.19
Milk-use diversificationMilk-use diversification202311,7896888490141.57
Milk-use diversificationMilk-use diversification202414,4768540593641.01
Certified semen or embryosCertified semen use20218247824700.0
Certified semen or embryosCertified semen use20227819781900.0
Certified semen or embryosCertified semen use202311,78911,78900.0
Certified semen or embryosCertified semen use202414,47614,47600.0
Derivative outputDerivative-output quantity202182473040520763.14
Derivative outputDerivative-output quantity202278192454536568.61
Derivative outputDerivative-output quantity202311,7894343744663.16
Derivative outputDerivative-output quantity202414,4765577889961.47
Livestock trainingLivestock training20218247824700.0
Livestock trainingLivestock training20227819781900.0
Livestock trainingLivestock training202311,78911,78900.0
Livestock trainingLivestock training202414,47614,47600.0
Technical assistanceTechnical assistance20218247824700.0
Technical assistanceTechnical assistance20227819781900.0
Technical assistanceTechnical assistance202311,78911,78900.0
Technical assistanceTechnical assistance202414,47614,47600.0
Agricultural information useAgricultural information use20218247824700.0
Agricultural information useAgricultural information use20227819781900.0
Agricultural information useAgricultural information use202311,78911,78900.0
Agricultural information useAgricultural information use202414,47614,47600.0
Producer experience proxyProducer experience proxy20218247824700.0
Producer experience proxyProducer experience proxy20227819781900.0
Producer experience proxyProducer experience proxy202311,78911,78900.0
Producer experience proxyProducer experience proxy202414,47614,47600.0
Organization participation intensityOrganization participation intensity20218247824700.0
Organization participation intensityOrganization participation intensity20227819781900.0
Organization participation intensityOrganization participation intensity202311,78911,78900.0
Organization participation intensityOrganization participation intensity202414,47614,47600.0
Milk per hectareMilk per hectare202182474847340041.23
Milk per hectareMilk per hectare202278194412340743.57
Milk per hectareMilk per hectare202311,7896882490741.62
Milk per hectareMilk per hectare202414,4768534594241.05
Managed natural pasture areaManaged pasture area202182478213340.41
Managed natural pasture areaManaged pasture area202278197770490.63
Managed natural pasture areaManaged pasture area202311,78911,779100.08
Managed natural pasture areaManaged pasture area202414,47614,46790.06
Pasture closurePasture closure20218247824700.0
Pasture closurePasture closure20227819781900.0
Pasture closurePasture closure202311,78911,78900.0
Pasture closurePasture closure202414,47614,47600.0
Pasture reseedingPasture reseeding20218247824700.0
Pasture reseedingPasture reseeding20227819781900.0
Pasture reseedingPasture reseeding202311,78911,78900.0
Pasture reseedingPasture reseeding202414,47614,47600.0
Forage within natural pastureNatural-pasture forage use20218247824700.0
Forage within natural pastureNatural-pasture forage use20227819781900.0
Forage within natural pastureNatural-pasture forage use202311,78911,78900.0
Forage within natural pastureNatural-pasture forage use202414,47614,47600.0
Silvopastoral systemSilvopastoral system20218247824700.0
Silvopastoral systemSilvopastoral system20227819781900.0
Silvopastoral systemSilvopastoral system202311,78911,78900.0
Silvopastoral systemSilvopastoral system202414,47614,47600.0
Low unmanaged natural pasture areaUnmanaged pasture area202182478213340.41
Low unmanaged natural pasture areaUnmanaged pasture area202278197770490.63
Low unmanaged natural pasture areaUnmanaged pasture area202311,78911,779100.08
Low unmanaged natural pasture areaUnmanaged pasture area202414,47614,46790.06
Forest areaForest area202182478213340.41
Forest areaForest area202278197770490.63
Forest areaForest area202311,78911,779100.08
Forest areaForest area202414,47614,46790.06
Table A3. Regime-specific scaling sensitivity.
OutcomeYearFrame RegimeMean PooledMean Regime-SpecificMean Difference
Economic formative profile20212021–20220.14396760486921520.1427660978096264−0.0012015070595887
Economic formative profile20222021–20220.14147189912751750.1414149224321889−5.6976695328642135
Economic formative profile20232023–20240.13415882409698850.13664123200374570.0024824079067571
Economic formative profile20242023–20240.13569895992465690.13794699554096690.0022480356163099
Social access and capacity profile20212021–20220.30567792300338010.3021124862737859−0.0035654367295941
Social access and capacity profile20222021–20220.27375036469055290.2701925527765673−0.0035578119139855
Social access and capacity profile20232023–20240.29645468439002960.29820411002321190.0017494256331822
Social access and capacity profile20242023–20240.30195743739353440.30368486853113410.0017274311375997
Environmental formative profile20212021–20220.162613901298580.1611542981726486−0.0014596031259314
Environmental formative profile20222021–20220.16808313581807520.1657992966944488−0.0022838391236263
Environmental formative profile20232023–20240.16987875667008440.1703123192096570.0004335625395726
Environmental formative profile20242023–20240.16390746476151760.1637800684276081−0.0001273963339095
Overall formative profile (secondary)20212021–20220.20408647639039180.2020109607520203−0.0020755156383714
Overall formative profile (secondary)20222021–20220.19443513321204860.192468923967735−0.0019662092443136
Overall formative profile (secondary)20232023–20240.20016408838570080.20171922041220490.001555132026504
Overall formative profile (secondary)20242023–20240.2005212873599030.2018039774999030.00128269014
Overall profile excluding social (sensitivity)20212021–20220.15329075308389760.1519601979911375−0.0013305550927601
Overall profile excluding social (sensitivity)20222021–20220.15477751747279640.1536071095633189−0.0011704079094775
Overall profile excluding social (sensitivity)20232023–20240.15201879038353640.15347677560670140.0014579852231649
Overall profile excluding social (sensitivity)20242023–20240.14980321234308720.15086353198428750.0010603196412002
Table A4. Milk-volume missingness and indicator availability.
YearFrame RegimeNMilk-Volume Non-Missing NMilk-Volume Non-Missing PercentMedian Economic Indicators AvailableMedian Social Indicators AvailableMedian Environmental Indicators Available
20212021–20228247486358.9712.05.08.0
20222021–20227819444256.8112.05.08.0
20232023–202411,789688858.4312.05.08.0
20242023–202414,476854058.9912.05.08.0
Table A5. Survey design threshold, no-derivative, and no-age sensitivity.
Sensitivity OutcomeYearFrame RegimeEstimateN
Main overall formative profile20212021–20220.204 [0.201, 0.207]8247
Main overall formative profile20222021–20220.194 [0.191, 0.198]7819
Main overall formative profile20232023–20240.200 [0.194, 0.206]11,789
Main overall formative profile20242023–20240.201 [0.197, 0.204]14,476
Overall profile, >=50% indicators per dimension20212021–20220.224 [0.221, 0.227]8247
Overall profile, >=50% indicators per dimension20222021–20220.213 [0.210, 0.217]7819
Overall profile, >=50% indicators per dimension20232023–20240.224 [0.218, 0.229]11,789
Overall profile, >=50% indicators per dimension20242023–20240.225 [0.221, 0.229]14,476
Overall profile, >=70% indicators per dimension20212021–20220.224 [0.221, 0.227]8247
Overall profile, >=70% indicators per dimension20222021–20220.214 [0.210, 0.217]7819
Overall profile, >=70% indicators per dimension20232023–20240.224 [0.218, 0.229]11,789
Overall profile, >=70% indicators per dimension20242023–20240.225 [0.221, 0.229]14,476
Overall profile excluding derivative output20212021–20220.206 [0.203, 0.209]8247
Overall profile excluding derivative output20222021–20220.196 [0.192, 0.199]7819
Overall profile excluding derivative output20232023–20240.201 [0.195, 0.207]11,789
Overall profile excluding derivative output20242023–20240.202 [0.198, 0.206]14,476
Economic profile excluding derivative output20212021–20220.150 [0.145, 0.155]8247
Economic profile excluding derivative output20222021–20220.145 [0.139, 0.150]7819
Economic profile excluding derivative output20232023–20240.138 [0.127, 0.148]11,789
Economic profile excluding derivative output20242023–20240.140 [0.133, 0.147]14,476
Overall profile excluding producer age20212021–20220.189 [0.186, 0.193]8247
Overall profile excluding producer age20222021–20220.177 [0.173, 0.181]7819
Overall profile excluding producer age20232023–20240.187 [0.181, 0.193]11,789
Overall profile excluding producer age20242023–20240.186 [0.182, 0.190]14,476
Overall profile excluding social profile20212021–20220.153 [0.150, 0.157]8247
Overall profile excluding social profile20222021–20220.155 [0.151, 0.158]7819
Overall profile excluding social profile20232023–20240.152 [0.146, 0.158]11,789
Overall profile excluding social profile20242023–20240.150 [0.145, 0.154]14,476
Table A6. Complete-case feasibility.
YearFrame RegimeComplete-Case N Across all Formative IndicatorsInterpretation
20212021–20220Full complete-case scoring is not feasible because some optional/derived indicators have extensive structural missingness.
20222021–20220Full complete-case scoring is not feasible because some optional/derived indicators have extensive structural missingness.
20232023–20240Full complete-case scoring is not feasible because some optional/derived indicators have extensive structural missingness.
20242023–20240Full complete-case scoring is not feasible because some optional/derived indicators have extensive structural missingness.
Table A7. Design and coverage diagnostics by year.
YearSampling-Frame RegimeUnweighted NWeighted TotalPSUsStrata VariableStrata CountRegions/DepartmentsMilk-Volume Non-Missing NMilk-Volume Non-Missing Weighted Percent
20212021–20228247810,914.151616dominio724486359.78
20222021–20227819731,597.321554dominio724444258.95
20232023–202411,789715,335.874710estrato349324688856.81
20242023–202414,476826,466.045839estrato345625854056.49
Table A8. Indicator-direction justification.
IndicatorReader-Facing IndicatorFavorable DirectionJustification/Caveat
Total milk productionTotal milk productionHigherInterpreted as productive capacity and scale; not sufficient evidence of sustainability on its own.
Milk soldMilk soldHigherInterpreted as market participation; household consumption and processing are reported separately.
Share of milk soldShare of milk soldHigherDirection follows the intended monitoring interpretation in the MESMIS-informed profile.
Milk for household consumptionMilk for household consumptionHigherInterpreted as household food-use capacity/equity proxy; direction is debatable and should be read cautiously.
Share for self-consumptionShare for self-consumptionHigherInterpreted as household food-use capacity/equity proxy; high values may also indicate weak market integration.
Milk for derivativesMilk for derivativesHigherDirection follows the intended monitoring interpretation in the MESMIS-informed profile.
Share processed into derivativesShare processed into derivativesHigherDirection follows the intended monitoring interpretation in the MESMIS-informed profile.
Cows in milkCows in milkHigherDirection follows the intended monitoring interpretation in the MESMIS-informed profile.
Milk per cowMilk per cowHigherDirection follows the intended monitoring interpretation in the MESMIS-informed profile.
Low bovine mortalityBovine mortalityLowerDirection follows the intended monitoring interpretation in the MESMIS-informed profile.
Herd replacementHerd replacementHigherInterpreted as herd renewal/reliability proxy; exact meaning depends on ENA harmonization.
Milk-use diversificationMilk-use diversificationHigherDirection follows the intended monitoring interpretation in the MESMIS-informed profile.
Certified semen or embryosCertified semen useHigherDirection follows the intended monitoring interpretation in the MESMIS-informed profile.
Derivative outputDerivative-output quantityHigherDirection follows the intended monitoring interpretation in the MESMIS-informed profile.
Livestock trainingLivestock trainingHigherDirection follows the intended monitoring interpretation in the MESMIS-informed profile.
Technical assistanceTechnical assistanceHigherDirection follows the intended monitoring interpretation in the MESMIS-informed profile.
Agricultural information useAgricultural information useHigherDirection follows the intended monitoring interpretation in the MESMIS-informed profile.
Producer experience proxyProducer experience proxyHigherProducer age is an experience proxy; a no-age sensitivity is reported.
Organization participation intensityOrganization participation intensityHigherDirection follows the intended monitoring interpretation in the MESMIS-informed profile.
Milk per hectareMilk per hectareHigherDirection follows the intended monitoring interpretation in the MESMIS-informed profile.
Managed natural pasture areaManaged pasture areaHigherArea-based pasture indicator; reflects availability/management but not pasture condition.
Pasture closurePasture closureHigherDirection follows the intended monitoring interpretation in the MESMIS-informed profile.
Pasture reseedingPasture reseedingHigherDirection follows the intended monitoring interpretation in the MESMIS-informed profile.
Forage within natural pastureNatural-pasture forage useHigherDirection follows the intended monitoring interpretation in the MESMIS-informed profile.
Silvopastoral systemSilvopastoral systemHigherDirection follows the intended monitoring interpretation in the MESMIS-informed profile.
Low unmanaged natural pasture areaUnmanaged pasture areaLowerReverse-scored because unmanaged pasture area is treated as less favorable management.
Forest areaForest areaHigherForest area is a resource-endowment/conservation proxy; it is not direct evidence of forest management quality.
Figure A1. Regime-specific p1–p99 scaling sensitivity.
Agriculture 16 01648 g0a1

References

  1. FAO. Sustainability Assessment of Food and Agriculture Systems (SAFA): Guidelines; Food and Agriculture Organization of the United Nations: Rome, Italy, 2014. [Google Scholar]
  2. Schader, C.; Grenz, J.; Meier, M.S.; Stolze, M. Scope and precision of sustainability assessment approaches to food systems. Ecol. Soc. 2014, 19, 42. [Google Scholar] [CrossRef]
  3. Lebacq, T.; Baret, P.V.; Stilmant, D. Sustainability indicators for livestock farming. A review. Agron. Sustain. Dev. 2013, 33, 311–327. [Google Scholar]
  4. Von Keyserlingk, M.A.G.; Martin, N.P.; Kebreab, E.; Knowlton, K.F.; Grant, R.J.; Stephenson, M.; Sniffen, C.J.; Harner, J.P.; Wright, A.D.; Smith, S.I. Sustainability of the US dairy industry. J. Dairy Sci. 2013, 96, 5405–5425. [Google Scholar] [CrossRef] [PubMed]
  5. FAO; IDF. Guide to Good Dairy Farming Practice; Food and Agriculture Organization of the United Nations and International Dairy Federation: Rome, Italy, 2011. [Google Scholar]
  6. Masera, O.; Astier, M.; Lopez-Ridaura, S. Sustentabilidad y Manejo de Recursos Naturales: El Marco de Evaluacion MESMIS; Mundi-Prensa: Mexico City, Mexico, 1999. [Google Scholar]
  7. Lopez-Ridaura, S.; Masera, O.; Astier, M. Evaluating the sustainability of complex socio-environmental systems. The MESMIS framework. Ecol. Indic. 2002, 2, 135–148. [Google Scholar] [CrossRef]
  8. Binder, C.R.; Feola, G.; Steinberger, J.K. Considering the normative, systemic and procedural dimensions in indicator-based sustainability assessments in agriculture. Environ. Impact Assess. Rev. 2010, 30, 71–81. [Google Scholar] [CrossRef]
  9. de Olde, E.M.; Oudshoorn, F.W.; Sorensen, C.A.G.; Bokkers, E.A.M.; de Boer, I.J.M. Assessing sustainability at farm-level: Lessons learned from a comparison of tools in practice. Ecol. Indic. 2016, 66, 391–404. [Google Scholar] [CrossRef]
  10. ISO 14040:2006; Environmental Management-Life Cycle Assessment-Principles and Framework. International Organization for Standardization (ISO): Geneva, Switzerland, 2006.
  11. FAO. Environmental Performance of Large Ruminant Supply Chains: Guidelines for Assessment; Livestock Environmental Assessment and Performance Partnership; FAO: Rome, Italy, 2016. [Google Scholar]
  12. Zahm, F.; Viaux, P.; Vilain, L.; Girardin, P.; Mouchet, C. Assessing farm sustainability with the IDEA method—From the concept of agriculture sustainability to case studies on farms. Sustain. Dev. 2008, 16, 271–281. [Google Scholar] [CrossRef]
  13. Chopin, P.; Mubaya, C.P.; Descheemaeker, K.; Oborn, I.; Bergkvist, G. Avenues for improving farming sustainability assessment with upgraded tools, sustainability framing and indicators. A review. Agron. Sustain. Dev. 2021, 41, 19. [Google Scholar] [CrossRef]
  14. Speelman, E.N.; Lopez-Ridaura, S.; Colomer, N.A.; Astier, M.; Masera, O.R. Ten years of sustainability evaluation using the MESMIS framework: Lessons learned from its application in 28 Latin American case studies. Int. J. Sustain. Dev. World Ecol. 2007, 14, 345–361. [Google Scholar] [CrossRef]
  15. OECD; Joint Research Centre-European Commission. Handbook on Constructing Composite Indicators: Methodology and User Guide; OECD Publishing: Paris, France, 2008. [Google Scholar]
  16. Diamantopoulos, A.; Winklhofer, H.M. Index construction with formative indicators: An alternative to scale development. J. Mark. Res. 2001, 38, 269–277. [Google Scholar] [CrossRef]
  17. Bartl, K.; Mayer, A.C.; Gomez, C.A.; Munoz, E.; Hess, H.D.; Holmann, F. Economic evaluation of current and alternative dual-purpose cattle systems for smallholder farms in the central Peruvian highlands. Agric. Syst. 2009, 101, 152–161. [Google Scholar] [CrossRef]
  18. Bartl, K.; Gomez, C.A.; Nemecek, T. Life cycle assessment of milk produced in two smallholder dairy systems in the highlands and the coast of Peru. J. Clean. Prod. 2011, 19, 1494–1505. [Google Scholar] [CrossRef]
  19. Van-Heurck, M.; Alegre, J.; Solis, R.; Del Castillo, D.; Perez, L.; Lavelle, P.; Quintero, M. Measuring sustainability of smallholder livestock farming in Yurimaguas, Peruvian Amazon. Food Energy Secur. 2020, 9, e242. [Google Scholar] [CrossRef]
  20. Pizarro, D.M.; Erickson, M.G.; Gomez-Bravo, C.A.; Picasso, V.D.; Lucantoni, D.; Mottet, A.; Wattiaux, M.A. Agroecological performance of smallholder dairy cattle systems in the Peruvian Amazon. Agric. Syst. 2025, 223, 104199. [Google Scholar] [CrossRef]
  21. Ore, L.; Romero, G.; Souza de Abreu, M.H.; Velarde-Guillen, J.; Arango, J.; Ku-Vera, J.C.; Gomez, C. Use of CLEANED to assess the productive, environmental, and economic impact of dairy farms in the Peruvian Amazon. Animals 2024, 14, 3224. [Google Scholar] [CrossRef] [PubMed]
  22. Instituto Nacional de Estadistica e Informatica (INEI). Encuesta Nacional Agropecuaria 2023: Ficha Tecnica. Available online: https://proyectos.inei.gob.pe/iinei/srienaho/Descarga/DocumentosMetodologicos/2023-62/02_FICHA_TECNICA_ENA_2023.pdf (accessed on 6 May 2026).
  23. Instituto Nacional de Estadistica e Informatica (INEI). INEI Con el Apoyo del Midagri Ejecuta la Encuesta Nacional Agropecuaria (ENA). 2023. Available online: https://m.inei.gob.pe/prensa/noticias/inei-con-el-apoyo-del-midagri-ejecuta-la-encuesta-nacional-agropecuaria-ena-2023-14425/ (accessed on 6 May 2026).
  24. Ministerio de Desarrollo Agrario y Riego (MIDAGRI). Marco Maestro Muestral. Available online: https://ena.midagri.gob.pe/index.php/sobre/marco-maestro-muestral (accessed on 6 May 2026).
  25. Plataforma Nacional de Datos Abiertos. Encuesta Nacional Agropecuaria ENA 2023—Instituto Nacional de Estadistica e Informatica. Available online: https://www.datosabiertos.gob.pe/dataset/encuesta-nacional-agropecuaria-ena-2023-instituto-nacional-de-estad%C3%ADstica-e-inform%C3%A1tica-6 (accessed on 6 May 2026).
  26. Instituto Nacional de Estadistica e Informatica (INEI). Encuesta Nacional Agropecuaria 2024: Ficha Tecnica. Available online: https://proyectos.inei.gob.pe/iinei/srienaho/Descarga/DocumentosMetodologicos/2024-62/03_FICHA_TECNICA_ENA_2024.pdf (accessed on 16 June 2026).
  27. FAO. SDG Indicator 2.4.1: Proportion of Agricultural Area Under Productive and Sustainable Agriculture. Available online: https://www.fao.org/sustainable-development-goals-data-portal/data/indicators/Indicator2.4.1-proportion-of-agricultural-area-under-productive-and-sustainable-agriculture/en (accessed on 16 June 2026).
  28. Little, R.J.A.; Rubin, D.B. Statistical Analysis with Missing Data, 3rd ed.; Wiley: Hoboken, NJ, USA, 2019. [Google Scholar]
  29. Lohr, S.L. Sampling: Design and Analysis, 2nd ed.; CRC Press: Boca Raton, FL, USA, 2019. [Google Scholar]
  30. Heeringa, S.G.; West, B.T.; Berglund, P.A. Applied Survey Data Analysis, 2nd ed.; CRC Press: Boca Raton, FL, USA, 2017. [Google Scholar]
  31. Calle, Z.; Murgueitio, E.; Chará, J. Integrating forestry, sustainable cattle-ranching and landscape restoration. Unasylva 2012, 63, 31–40. [Google Scholar]
  32. Murgueitio, E.; Chará, J.; Barahona, R.; Cuartas, C.; Naranjo, J. Intensive silvopastoral systems: Sustainable cattle ranching and ecosystem services in neotropical areas. Trop. Subtrop. Agroecosyst. 2014, 17, 501–507. [Google Scholar]
  33. Swanson, B.E.; Rajalahti, R. Strengthening Agricultural Extension and Advisory Systems: Procedures for Assessing, Transforming, and Evaluating Extension Systems; World Bank: Washington, DC, USA, 2010. [Google Scholar]
Figure 1. Survey-weighted formative profiles of Peruvian dairy cattle producers by sampling-frame regime. The panels distinguish the 2021–2022 and 2023–2024 sampling-frame regimes. The separation between 2022 and 2023 represents a sampling-frame boundary rather than a substantive temporal contrast. Values are formative scores on a 0–1 scale and should not be interpreted as causal year effects.
Agriculture 16 01648 g001
Figure 2. Selected environmental and resource-management indicators in original units. Points and lines represent survey-weighted proportions. The vertical separation marks the 2022–2023 sampling-frame boundary. Annual values describe independent cross-sections and should not be interpreted as causal effects.
Agriculture 16 01648 g002
Table 1. Analytical sample and milk-volume availability by year.
YearSampling-Frame RegimeFinal Analytical Sample, NMilk-Volume Information Available, NAvailability, %
20212021–20228247486358.97
20222021–20227819444256.81
20232023–202411,789688858.43
20242023–202414,476854058.99
Total 42,33124,73358.43
Note: Milk-volume availability refers to non-missing information for the harmonized milk-production and allocation variables. The analytical sample was defined by dairy cattle activity rather than by complete milk-volume records.
Table 2. Operational adaptation of the MESMIS cycle to ENA microdata.
MESMIS StepApplication in this StudyConstraint or Methodological Decision
1. Characterize the systemPeruvian agricultural producer units reporting dairy cattle activity in ENA 2021–2024; the analytical unit is the agricultural producer unit.ENA is a repeated cross-section; estimates describe national producer profiles rather than changes within the same farms.
2. Identify critical pointsProductive capacity, milk allocation and market participation, access to services and information, producer organization, and pasture/resource management.Critical points were identified analytically from the literature, questionnaire coverage, and observed constraints rather than through a participatory MESMIS workshop.
3. Select indicatorsENA variables were retained when they were conceptually linked to a MESMIS attribute, directionally interpretable, reproducible across years, and sufficiently available.Domains not adequately observed in ENA were identified as measurement gaps and were not estimated under unsupported assumptions.
4. Measure indicatorsOriginal questions and source variables were harmonized across years; units, denominators, favorable directions, missingness rules, and scoring procedures were defined explicitly.Question-level and variable-level traceability is provided in the Appendix A.
5. Integrate resultsIndicator scores were aggregated into equal-weight formative profiles for economic and productive conditions, social access and capacity, and environmental and resource management.The profiles are formative summaries, not reflective latent scales. The overall profile is secondary and compensatory.
6. Conclusions and feedbackResults were used to identify monitored constraints, interpretation limits, policy-relevant signals, and priorities for improving future ENA modules.Recommendations are proportional to the observational and proxy-based nature of the data and are not interpreted as causal intervention effects.
Table 3. MESMIS-informed indicator framework.
IndicatorTypeMonitoring
Profile
MESMIS
Attribute
Favorable Direction
Total milk productionContinuousEconomic and productiveProductivityHigher
Milk soldContinuousProductivityHigher
Share of milk soldContinuousSelf-relianceHigher
Milk for household consumptionContinuousEquityHigher
Share for self-consumptionContinuousEquityHigher
Milk for derivativesContinuousAdaptabilityHigher
Share processed into derivativesContinuousAdaptabilityHigher
Cows in milkContinuous/countProductivityHigher
Milk per cowContinuousProductivityHigher
Bovine mortalityContinuous/countStabilityLower
Herd replacementContinuousReliabilityHigher
Milk-use diversificationContinuous/countAdaptabilityHigher
Certified semen or embryosBinaryAdaptabilityHigher
Derivative outputContinuousAdaptabilityHigher
Livestock trainingBinarySocial access and capacityAdaptabilityHigher
Technical assistanceBinaryAdaptabilityHigher
Agricultural information useBinaryAdaptabilityHigher
Producer experience proxyContinuousReliabilityHigher
Organization participation intensityContinuous/countSelf-relianceHigher
Milk per hectareContinuousEnvironmental and resource managementProductivityHigher
Managed natural pasture areaContinuousStabilityHigher
Pasture closureBinaryResilienceHigher
Pasture reseedingBinaryResilienceHigher
Forage within natural pastureBinaryResilienceHigher
Silvopastoral systemBinaryResilienceHigher
Unmanaged natural pasture areaContinuousResilienceLower
Forest areaContinuousResilienceHigher
Note: “Favorable direction” indicates the direction adopted for profile construction and does not imply that an indicator is independently sufficient to establish sustainability. Exact questionnaire codes, original variables, harmonized variables, units, denominators, construction rules, year availability, missingness conditions, and conceptual justifications are provided in Appendix A Table A1, Table A2 and Table A8.
Table 4. Frame-aware formative profiles by year.
Monitoring Profile2021202220232024
Economic and productive profile0.144
[0.139, 0.149]
0.141
[0.136, 0.147]
0.134
[0.124, 0.144]
0.136
[0.129, 0.142]
Social access and capacity profile0.306
[0.300, 0.311]
0.274
[0.267, 0.280]
0.296
[0.286, 0.306]
0.302
[0.295, 0.309]
Environmental and resource-management profile0.163
[0.159, 0.167]
0.168
[0.164, 0.172]
0.170
[0.163, 0.177]
0.164
[0.159, 0.169]
Overall formative profile
(secondary)
0.204
[0.201, 0.207]
0.194
[0.191, 0.198]
0.200
[0.194, 0.206]
0.201
[0.197, 0.204]
Overall profile excluding social access and capacity (sensitivity)0.153
[0.150, 0.157]
0.155
[0.151, 0.158]
0.152
[0.146, 0.158]
0.150
[0.145, 0.154]
Note: Values are survey-weighted formative scores on a 0–1 scale. Values in brackets are 95% design-based confidence intervals. Higher values indicate more favorable conditions according to the prespecified indicator directions reported in Table 3. Comparisons across the 2022–2023 sampling-frame boundary should not be interpreted as substantive temporal change.
Table 5. Selected economic, productive, and environmental/resource-management indicators in original units.
Panel A. Economic and productive indicators
IndicatorUnit/scale2021202220232024
Milk
production
kg2846.373
[2403.791, 3288.955]
3285.457
[2151.648, 4419.267]
2300.117
[1976.329, 2623.905]
2890.370
[2465.276, 3315.464]
Milk
production per cow
kg/head817.281
[768.115, 866.446]
846.865
[793.771, 899.959]
785.739
[724.592, 846.887]
836.726
[782.673, 890.779]
Share of milk sold0–10.325
[0.291, 0.360]
0.366
[0.328, 0.404]
0.360
[0.311, 0.409]
0.322
[0.288, 0.356]
Panel B. Environmental and resource-management indicators
IndicatorUnit/scale2021202220232024
Pasture closure0/10.129
[0.113, 0.146]
0.145
[0.125, 0.165]
0.152
[0.118, 0.187]
0.151
[0.128, 0.173]
Pasture reseeding0/10.019
[0.015, 0.024]
0.029
[0.021, 0.036]
0.026
[0.013, 0.040]
0.017
[0.006, 0.028]
Silvopastoral system0/10.011
[0.008, 0.014]
0.010
[0.007, 0.013]
0.022
[0.006, 0.039]
0.021
[0.006, 0.036]
Note: Values are survey-weighted means or proportions. Values in brackets are 95% design-based confidence intervals. Milk-volume indicators were calculated only for observations with valid information for their relevant denominators. Exact definitions, reference periods, denominators, and ENA source variables are reported in Appendix A Table A1 and Table A2.
Table 6. Social access and capacity components by year.
Outcome2021202220232024
Livestock training0.122
[0.113, 0.130]
0.076
[0.069, 0.084]
0.076
[0.063, 0.090]
0.075
[0.052, 0.098]
Technical assistance0.062
[0.055, 0.068]
0.037
[0.032, 0.042]
0.025
[0.017, 0.033]
0.023
[0.010, 0.037]
Agricultural information use0.824
[0.814, 0.834]
0.728
[0.716, 0.740]
0.889
[0.873, 0.906]
0.880
[0.851, 0.908]
Producer experience proxy0.481
[0.475, 0.487]
0.485
[0.479, 0.492]
0.455
[0.442, 0.467]
0.473
[0.453, 0.493]
Organization participation intensity0.041
[0.036, 0.045]
0.042
[0.038, 0.046]
0.037
[0.030, 0.045]
0.059
[0.043, 0.074]
Social access and capacity profile0.306
[0.300, 0.311]
0.274
[0.267, 0.280]
0.296
[0.286, 0.306]
0.302
[0.295, 0.309]
Note: Livestock training, technical assistance, and agricultural information use are reported as survey-weighted proportions. Producer experience and organization participation intensity are reported as standardized 0–1 component scores. The social access and capacity profile is the formative mean of its available components. Values in brackets are 95% design-based confidence intervals.
Table 7. Survey-weighted adjusted contrasts within-sampling-frame regimes.
Monitoring ProfileContrastAdjusted Difference
[95% CI]
p-ValueN
Economic and productive profile2022 vs. 2021−0.004
[−0.011, 0.002]
0.19616,066
Economic and productive profile2024 vs. 20230.007
[−0.005, 0.019]
0.23426,261
Social access and capacity profile2022 vs. 2021−0.032
[−0.040, −0.024]
<0.00116,066
Social access and capacity profile2024 vs. 20230.004
[−0.009, 0.017]
0.52526,261
Environmental and resource-management profile2022 vs. 20210.006
[0.000, 0.011]
0.03816,066
Environmental and resource-management profile2024 vs. 2023−0.003
[−0.012, 0.006]
0.49426,261
Overall formative profile
(secondary)
2022 vs. 2021−0.010
[−0.015, −0.006]
<0.00116,066
Overall formative profile
(secondary)
2024 vs. 20230.003
[−0.004, 0.010]
0.45826,261
Overall profile excluding social access and capacity (sensitivity)2022 vs. 20210.001
[−0.004, 0.005]
0.77916,066
Overall profile excluding social access and capacity (sensitivity)2024 vs. 20230.002
[−0.006, 0.010]
0.59926,261
Note: Coefficients represent the adjusted difference for the later year minus the earlier year within each sampling-frame regime. Models were adjusted for herd stock, land area, producer education, and region. Values in brackets are 95% design-based confidence intervals. Analytical N includes observations with complete information for the outcome and adjustment variables. The 2023–2024 analytical N is four observations lower than the corresponding descriptive sample because of missing information in at least one adjustment variable. Coefficients and confidence limits are rounded to three decimals; therefore, a confidence limit displayed as 0.000 may be slightly greater than zero in the unrounded statistical output. Estimates are descriptive and should not be interpreted causally.
Disclaimer/Publisher’s Note: The statements, opinions and data contained in all publications are solely those of the individual author(s) and contributor(s) and not of MDPI and/or the editor(s). MDPI and/or the editor(s) disclaim responsibility for any injury to people or property resulting from any ideas, methods, instructions or products referred to in the content.