1. Introduction
Protected greenhouses can effectively reduce the adverse effects of external environmental fluctuations on crop growth, yield, and quality by regulating key factors such as temperature, humidity, light, irrigation, and fertilization. With the development of protected agriculture toward digitalization, precision management, and intelligent control, greenhouse management based on multi-sensor perception and intelligent decision-making has become an important direction in protected cultivation [
1]. Blueberry is a shallow-rooted berry crop that is sensitive to changes in the root-zone water and nutrient environment, and its water and nutrient requirements vary considerably across growth stages. The timeliness and precision of water and nutrient supply directly affect plant physiological status, fruit yield, and fruit quality [
2]. Previous studies have shown that substrate composition significantly affects blueberry plant growth, physiological responses, and fruit development [
3]. In addition, digital irrigation tools have shown promising potential for water saving and efficiency improvement in berry crop production [
4]. Therefore, developing greenhouse fertigation strategies that can be dynamically adjusted according to blueberry growth status has potential application value for subsequent resource-use optimization, improved fertigation management, and fruit-quality maintenance.
In recent years, greenhouse fertigation technology has gradually shifted from traditional scheduled and fixed-amount supply toward precision regulation based on real-time monitoring and intelligent decision-making [
5,
6]. The development of drip fertigation, multi-sensor management systems, and smart irrigation methods has provided an engineering basis for greenhouse environmental regulation and fertigation management [
7,
8]. Meanwhile, greenhouse control studies based on fuzzy control, model predictive control, and data-driven methods have continued to develop, providing new technical approaches for the precision management of different crops [
9,
10,
11]. However, most existing systems still mainly rely on fixed thresholds of environmental or substrate parameters for control, and their control logic remains essentially parameter-driven [
5,
12]. For blueberry, a crop with distinct growth-stage differences and high sensitivity to the root-zone environment, long-term use of uniform thresholds or fixed fertigation recipes may lead to mismatches between supply and plant developmental requirements, thereby affecting plant growth, fruit yield, and quality [
2,
3]. Therefore, incorporating crop growth-stage information into the fertigation control process is a key issue for improving the stage-specific management of greenhouse blueberry fertigation.
Crop growth-stage information serves as an important link between crop status perception and precision regulation. Blueberry growth and development have a relatively clear basis for stage division, and stages such as bud development, flowering, fruit development, and ripening can be standardized using the BBCH scale [
13]. Compared with relying solely on environmental and substrate parameters, visual information can more directly characterize canopy morphology, leaf status, and fruit developmental features; therefore, it has particular advantages in growth-stage recognition. In recent years, deep learning and computer vision technologies have gradually expanded from general object detection to crop phenology classification and growth-stage determination. Related studies have shown that vision-based stage recognition has considerable application potential in crop precision management [
14,
15]. Meanwhile, studies on deep learning-based image segmentation and visual perception have shown that complex backgrounds, ambiguous object boundaries, variations in annotation quality, limited sample sizes, and real-time deployment requirements remain key factors constraining the reliable application of visual models in engineering scenarios [
16]. At the same time, the development of edge computing enables visual models to be deployed and inferred close to the data source, reducing network dependence while improving recognition timeliness. This provides technical conditions for online crop status perception in greenhouse scenarios [
16,
17]. However, in practical applications, recognition results based on a single visual source remain susceptible to illumination variation, local occlusion, background interference, and indistinct transitional-stage features, which may cause fluctuations in stage determination. By contrast, environmental and substrate sensor data, such as temperature, humidity, light intensity, soil temperature and moisture, EC, and pH, can provide auxiliary characterization of crop growth from the perspectives of the environment and root-zone status. Therefore, combining visual recognition results with sensor data for growth-stage determination and parameter calling can help improve the stability of growth-stage labels and their applicability in the control process. Therefore, before the vision-based recognition results are used for PLC parameter invocation, sensor status verification, anomaly detection, and temporal consistency constraints are introduced to improve the stability and usability of the growth stage labels during control operation.
From the perspective of intelligent greenhouse management, research is gradually shifting from single-factor environmental monitoring or localized automated control toward system-level integration jointly enabled by multi-source information and edge computing. Studies on data-driven modeling for complex industrial processes have shown that, under conditions characterized by strong noise, high dimensionality, time-varying behavior, and multi-sensor correlations, a single data source or model is often insufficient to adequately represent the system state. Feature extraction, uncertainty handling, and multi-source information modeling are therefore required to improve model interpretability and engineering applicability [
18,
19]. Within this context, the reliable incorporation of crop status information into control decisions and its subsequent use in stage-specific irrigation and fertigation parameter adjustment remain important challenges in intelligent control for protected agriculture. Meanwhile, the integration of edge-intelligent control and machine vision with industrial control systems can support real-time decision-making in both agricultural and industrial applications [
20]. However, research on fertigation management methods that link blueberry growth stage identification with PLC-based control remains limited in greenhouse blueberry production. In particular, a clearly defined implementation pathway is still lacking for integrating sensor information with vision-based recognition to perform sensor status verification and control safety validation, using the finalized growth stage label to invoke the corresponding stage-specific parameters in the PLC, and simultaneously ensuring system real-time performance, stability, and operational safety.
Based on the above considerations, this study developed a vision-based blueberry growth-stage determination and PLC-based fertigation parameter invocation system for greenhouse blueberry cultivation. The focus of this study was not to propose a new object-detection algorithm, nor to evaluate the long-term agronomic effects of fertigation control on blueberry yield, quality, or water–fertilizer use efficiency. Instead, the objective was to verify whether blueberry growth-stage labels could be stably output by an edge vision terminal, converted through STM32-based encoding, and then introduced into the PLC control layer for stage-specific target parameter invocation and actuation-device response. The specific objectives were as follows:
To construct major growth-stage labels based on images of greenhouse blueberry plants;
To establish the correspondence among the major blueberry growth stages, BBCH codes, morphological determination criteria, and PLC-based parameter invocation targets;
To conduct image-level stage classification evaluation and compare the performance of different lightweight YOLO classification models in blueberry growth-stage recognition;
To construct a small greenhouse prototype system consisting of a K210 vision module, an STM32 encoding unit, a PLC controller, an HMI interface, and fertigation actuation devices;
To verify the operational performance of growth-stage recognition results after STM32-based encoding and PLC input, as well as their participation in stage-specific parameter invocation and device control.
2. Materials and Methods
2.1. System Framework and Experimental Platform
This study focused on the engineering implementation process by which blueberry growth-stage recognition results were introduced into the PLC control link. The work mainly consisted of three components: image dataset construction, visual model evaluation, and prototype-platform linkage verification. First, image acquisition, sample screening, stage-label construction, and image-level recognition dataset establishment were conducted based on greenhouse blueberry plants. Subsequently, an independent test set was used to evaluate the stage-recognition performance of different lightweight YOLO classification models. Finally, a small greenhouse prototype platform was used to verify the feasibility of introducing stage labels into the PLC after STM32-based encoding and using them for fertigation target-parameter invocation and actuator linkage control. Experimental platform construction, system debugging, image data acquisition, sensor data collection, visual model evaluation, and system operation testing were conducted from July 2024 to June 2025.
Image acquisition was carried out in the intelligent greenhouse blueberry cultivation environment of Yunnan Agricultural University. The target plants were potted greenhouse blueberries of the F6 cultivar. Image acquisition covered four major growth stages, namely the budding stage, flowering and fruit-setting stage, fruit expansion stage, and ripening stage. During image collection, conditions including natural light, greenhouse supplementary lighting, local shading, and different shooting angles were covered as much as possible. The image backgrounds mainly included blueberry plants, cultivation substrate, pots, drip irrigation pipelines, greenhouse support structures, and local equipment backgrounds. In the actual acquisition process, some samples contained leaf occlusion, fruit-cluster overlap, branch crossing, and background interference. These samples were retained in the dataset after screening to improve the adaptability of the model to complex greenhouse backgrounds.
The blueberry cultivation substrate was coconut coir:peat:perlite = 2:1:1. Previous studies have shown that substrate components such as peat, coconut coir, and perlite can affect the root-zone physicochemical environment, plant growth, and mineral nutrient uptake of highbush blueberry; therefore, substrate composition is an important condition that should be specified in potted blueberry and protected cultivation studies [
19]. Drip irrigation was used as the main irrigation method. A fertigation mixing and delivery unit was installed in the prototype system to simulate irrigation and fertilizer-solution delivery processes at different growth stages. Because this study did not conduct a long-term cultivation control experiment under real production greenhouse conditions, no agronomic treatment replicates were established. The repeated tests described in this study refer mainly to multiple system-level debugging tests involving growth-stage label input, PLC reading, target-parameter calling, and device response.
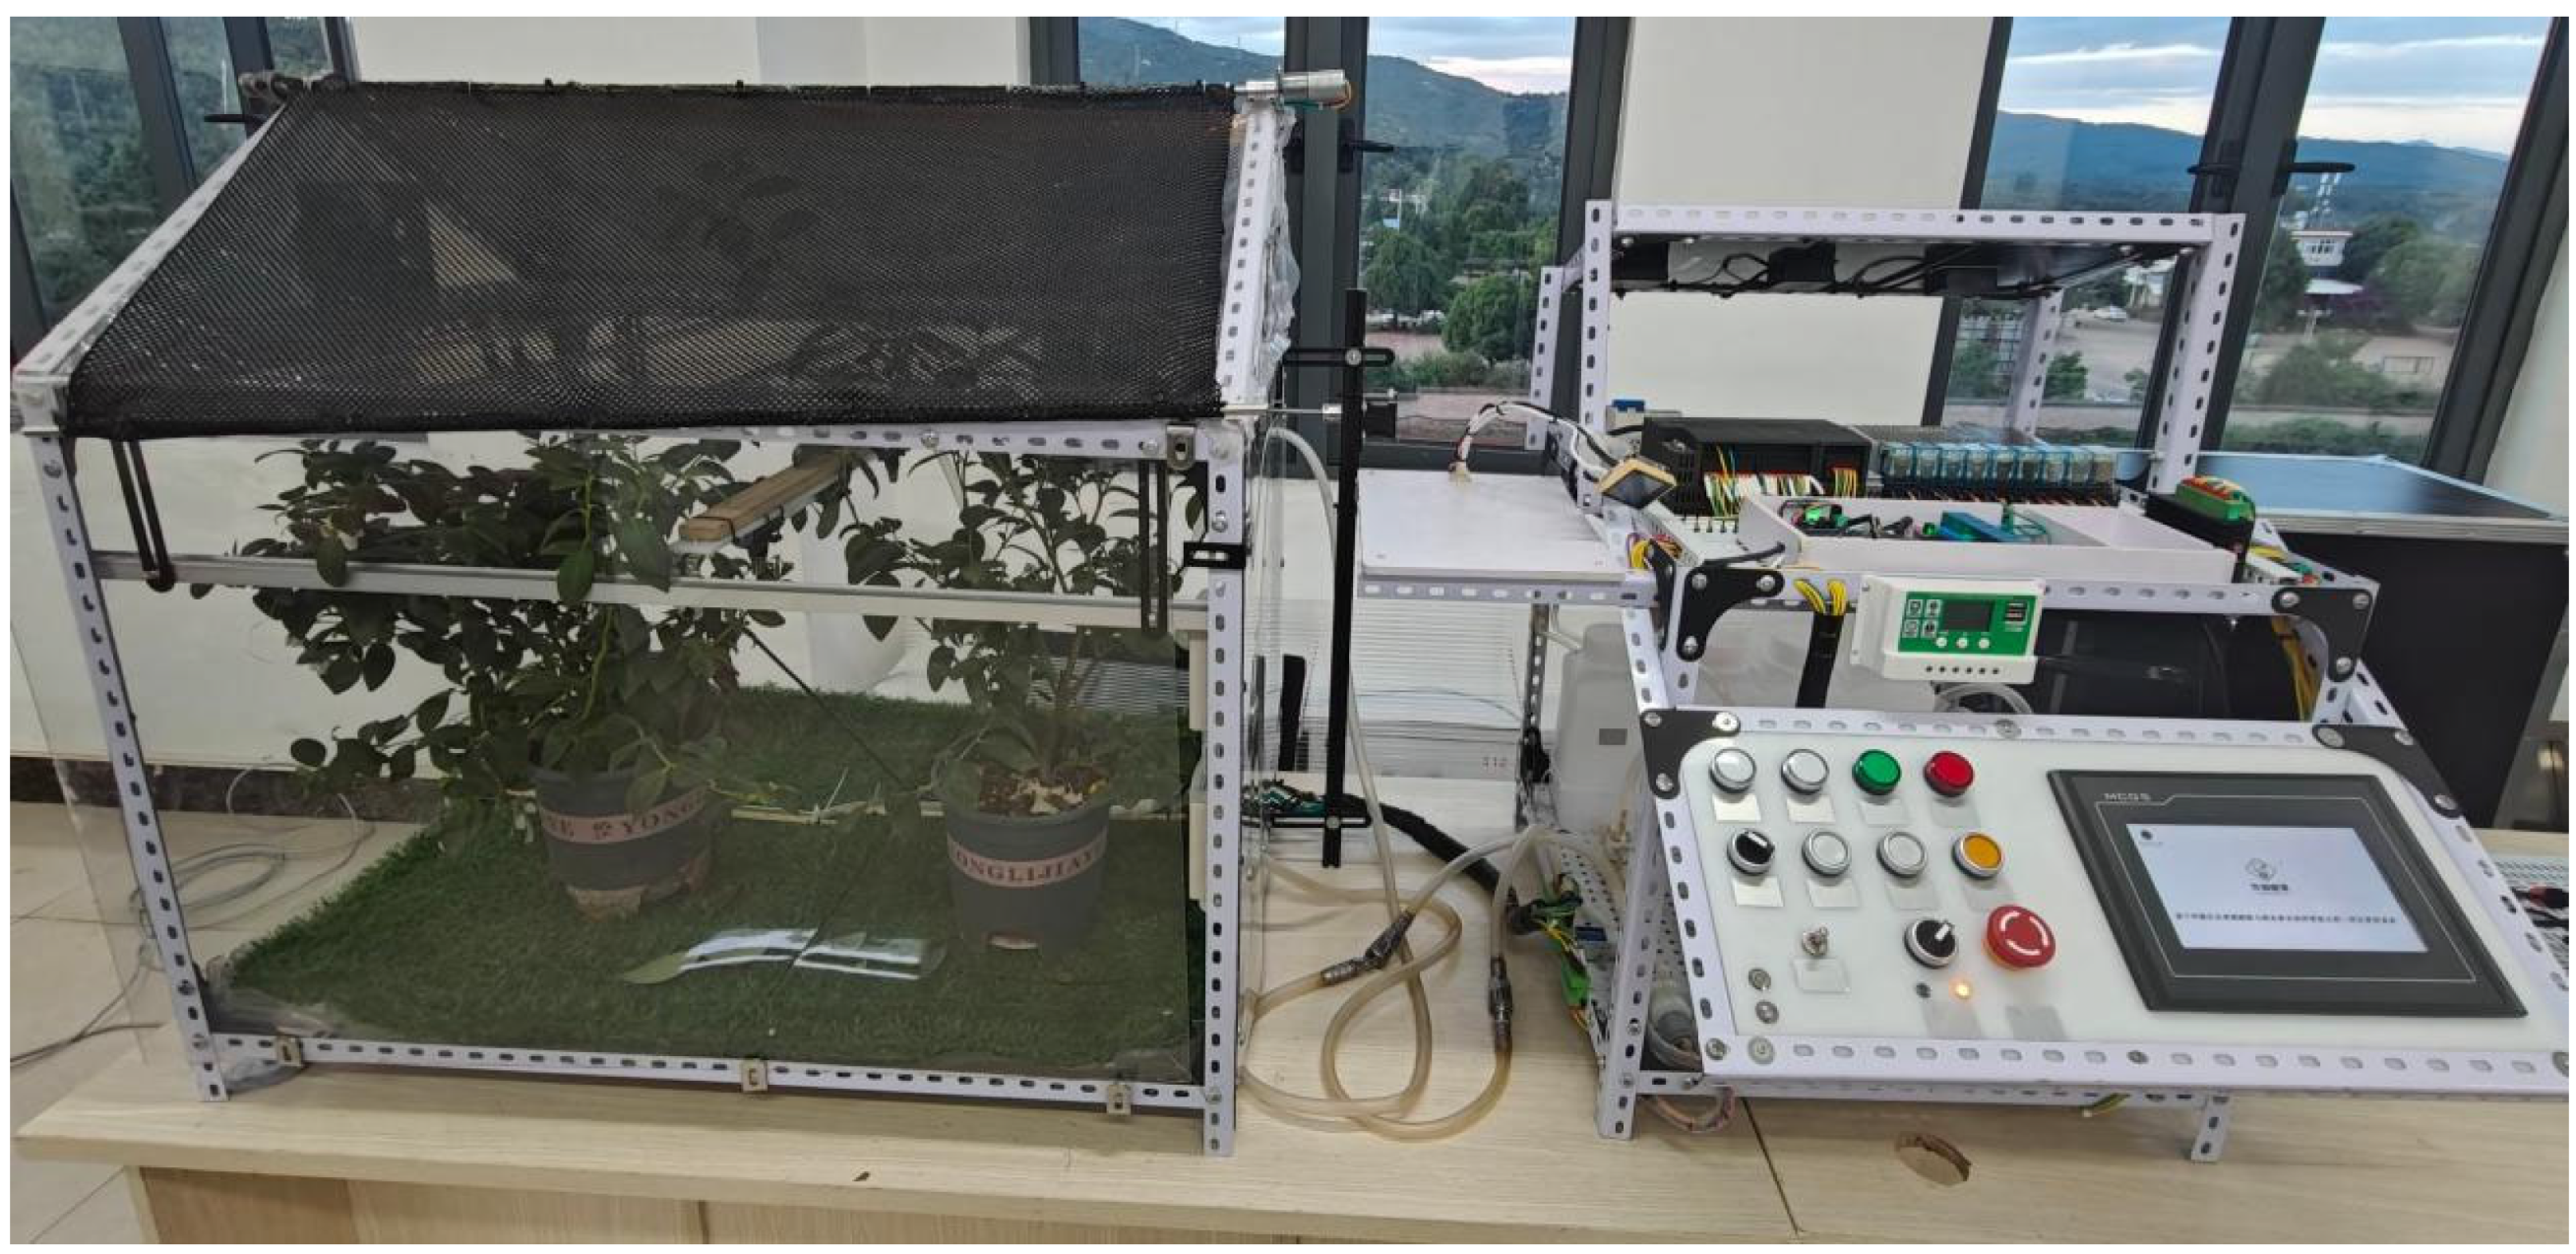
System implementation and operation testing were conducted on the small greenhouse prototype platform. The platform consisted of a simulated greenhouse unit, a fertigation mixing and delivery unit, a control cabinet, a PLC controller, an STM32 encoding unit, an HMI interface, and actuation devices. It was mainly used to test whether the blueberry growth-stage labels output by the vision terminal could be converted by the STM32 unit, read by the PLC, and further used to complete stage-specific parameter calling and device response.
This part of the test was used only to determine whether information transfer among the hardware modules, PLC parameter calling, and device actions could be completed normally. It cannot replace long-term closed-loop agronomic experiments under real blueberry cultivation conditions. Therefore, the system connectivity test was not interpreted as evidence of improvements in water–fertilizer use efficiency, yield, fruit quality, or plant physiological responses.
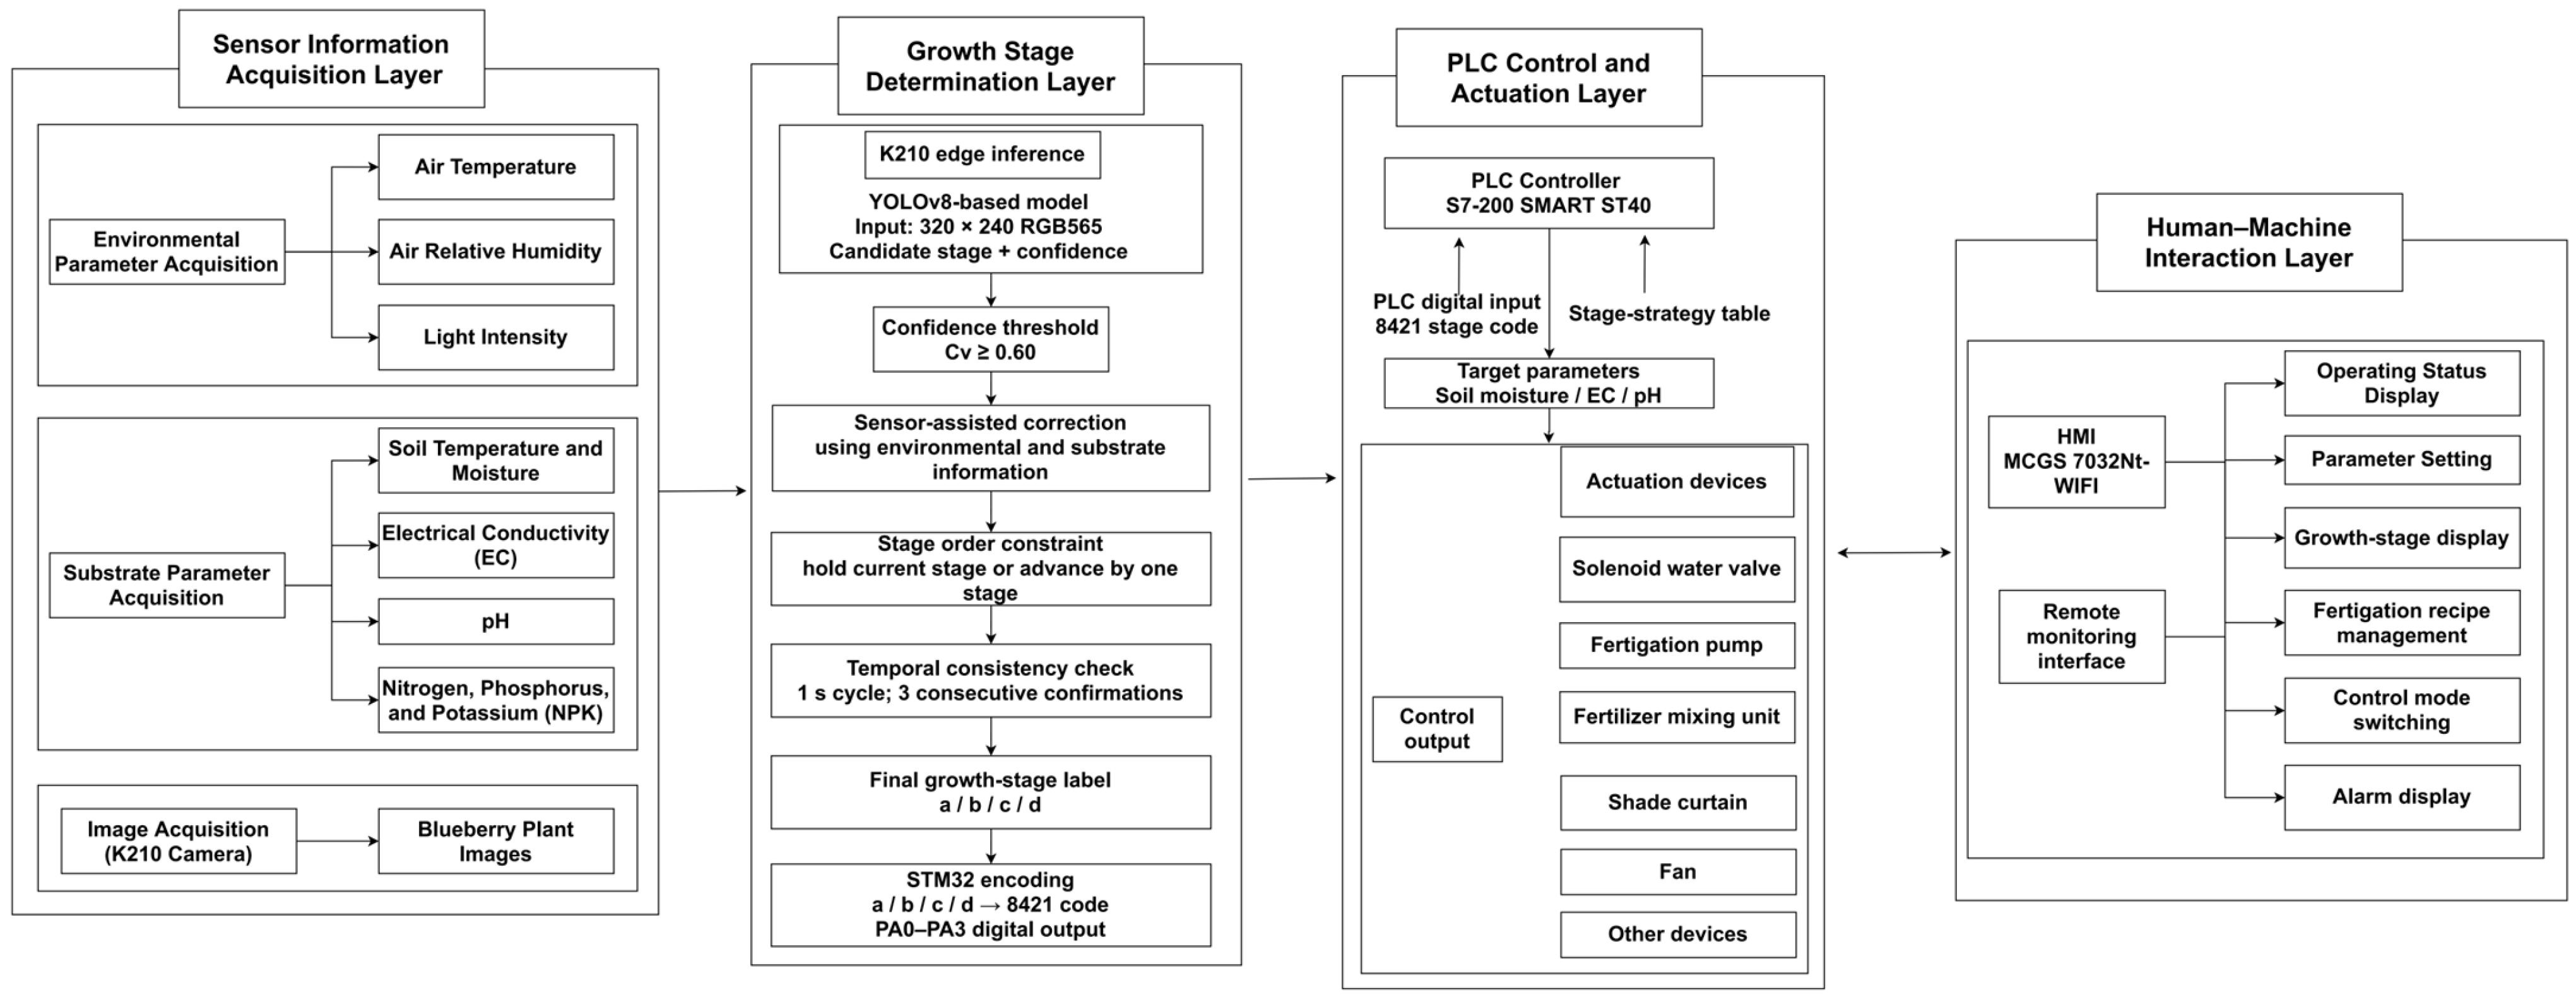
The system mainly consisted of four layers: the sensor information acquisition layer, the growth-stage determination layer, the PLC control and actuation layer, and the human–machine interaction layer. The overall architecture is shown in
Figure 1.
The sensor information acquisition layer was used to obtain greenhouse environmental parameters, substrate parameters, and blueberry image information. The growth-stage determination layer was centered on the K210 vision module, which performed preliminary stage determination of blueberry images. The final growth-stage label was then obtained by integrating sensor status, stage-order constraints, and temporal consistency rules. The PLC control and actuation layer called the corresponding fertigation target parameters according to the growth-stage label and drove the irrigation, fertilization, supplementary lighting, ventilation, and shading devices. The human–machine interaction layer was used for stage display, parameter setting, alarm notification, and control-mode switching.
Figure 1 mainly illustrates the internal information-transfer relationship of the system. Blueberry images were acquired and recognized by the K210 vision module, and the stage result was converted by the STM32 unit into a discrete coded signal readable by the PLC. Environmental and substrate sensor data were used, on the one hand, for PLC operation monitoring and, on the other hand, for sensor status verification and control safety assessment of the growth stage labels. After reading the stage code and sensor data, the PLC called the target parameters according to the predefined stage-strategy table and fed the control results back to the HMI interface for display.
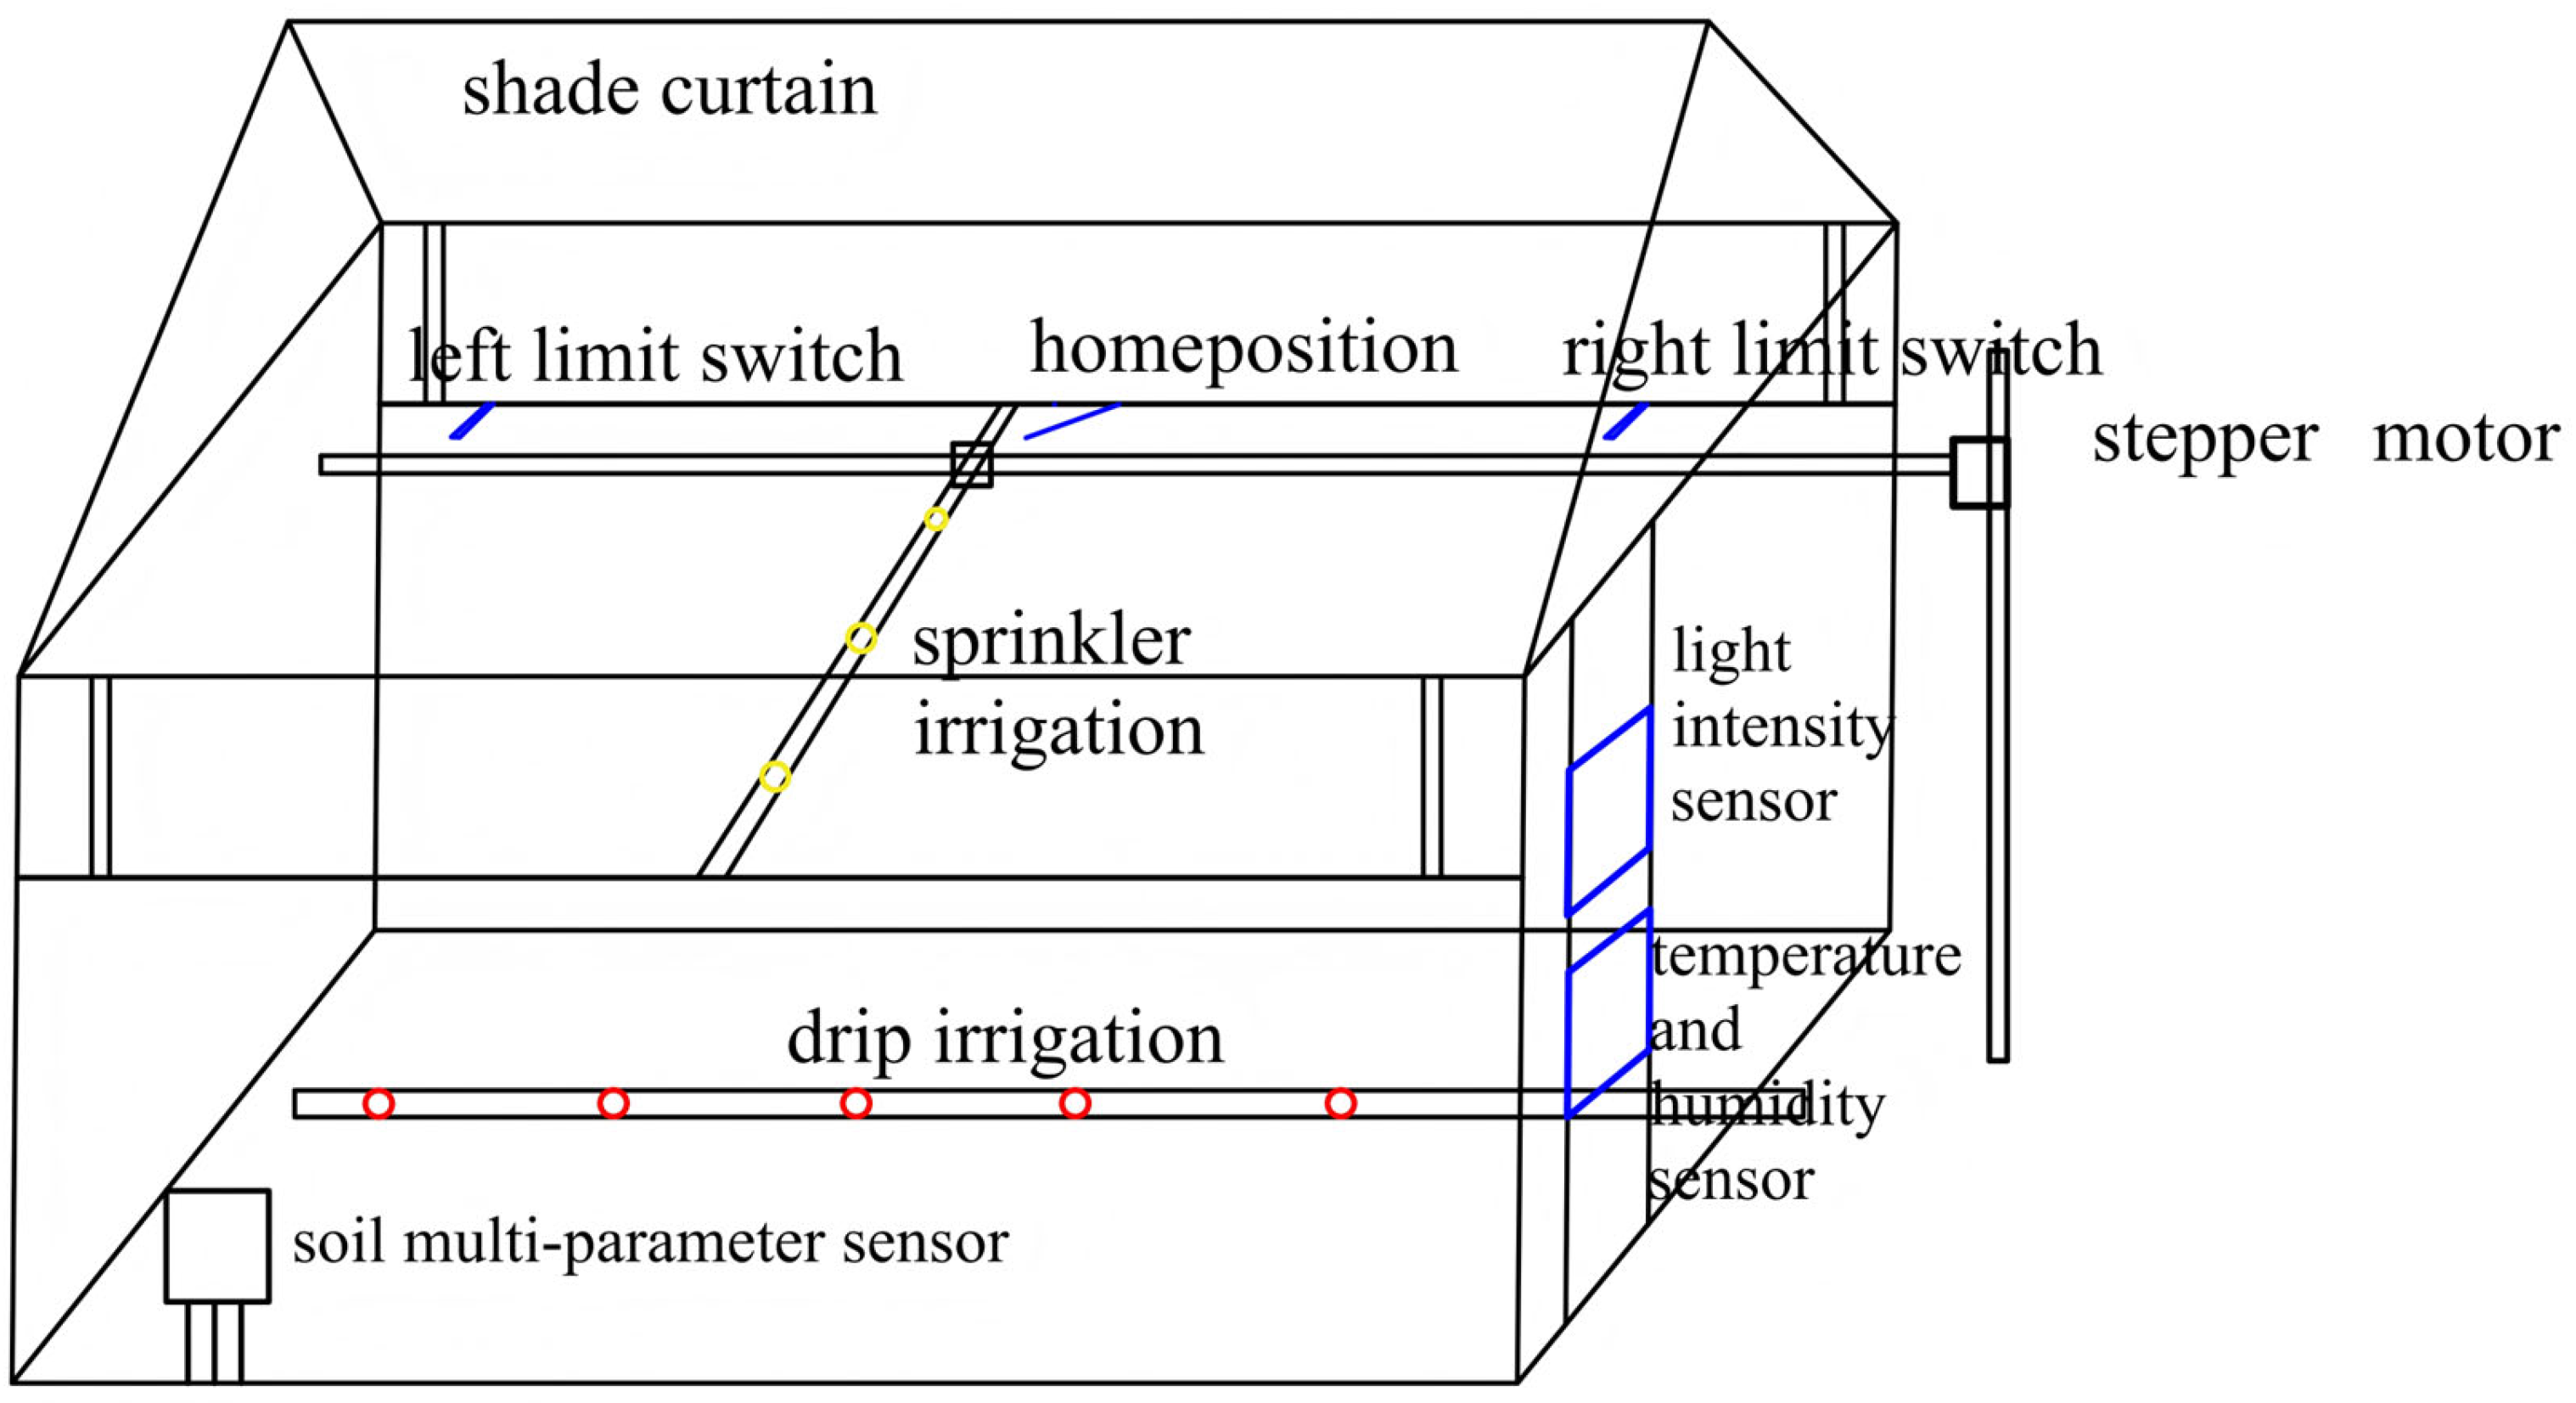
The experimental platform consisted of a greenhouse experimental unit, a fertigation mixing and delivery unit, a control cabinet, and a human–machine interaction unit.
The layout of the greenhouse experimental unit is shown in
Figure 2. The unit was equipped with a temperature and humidity sensor, a light-intensity sensor, a soil multi-parameter sensor, supplementary lighting lamps, a shade curtain, inlet and outlet ventilation fans, a drip irrigation device, and a sprinkler irrigation device.
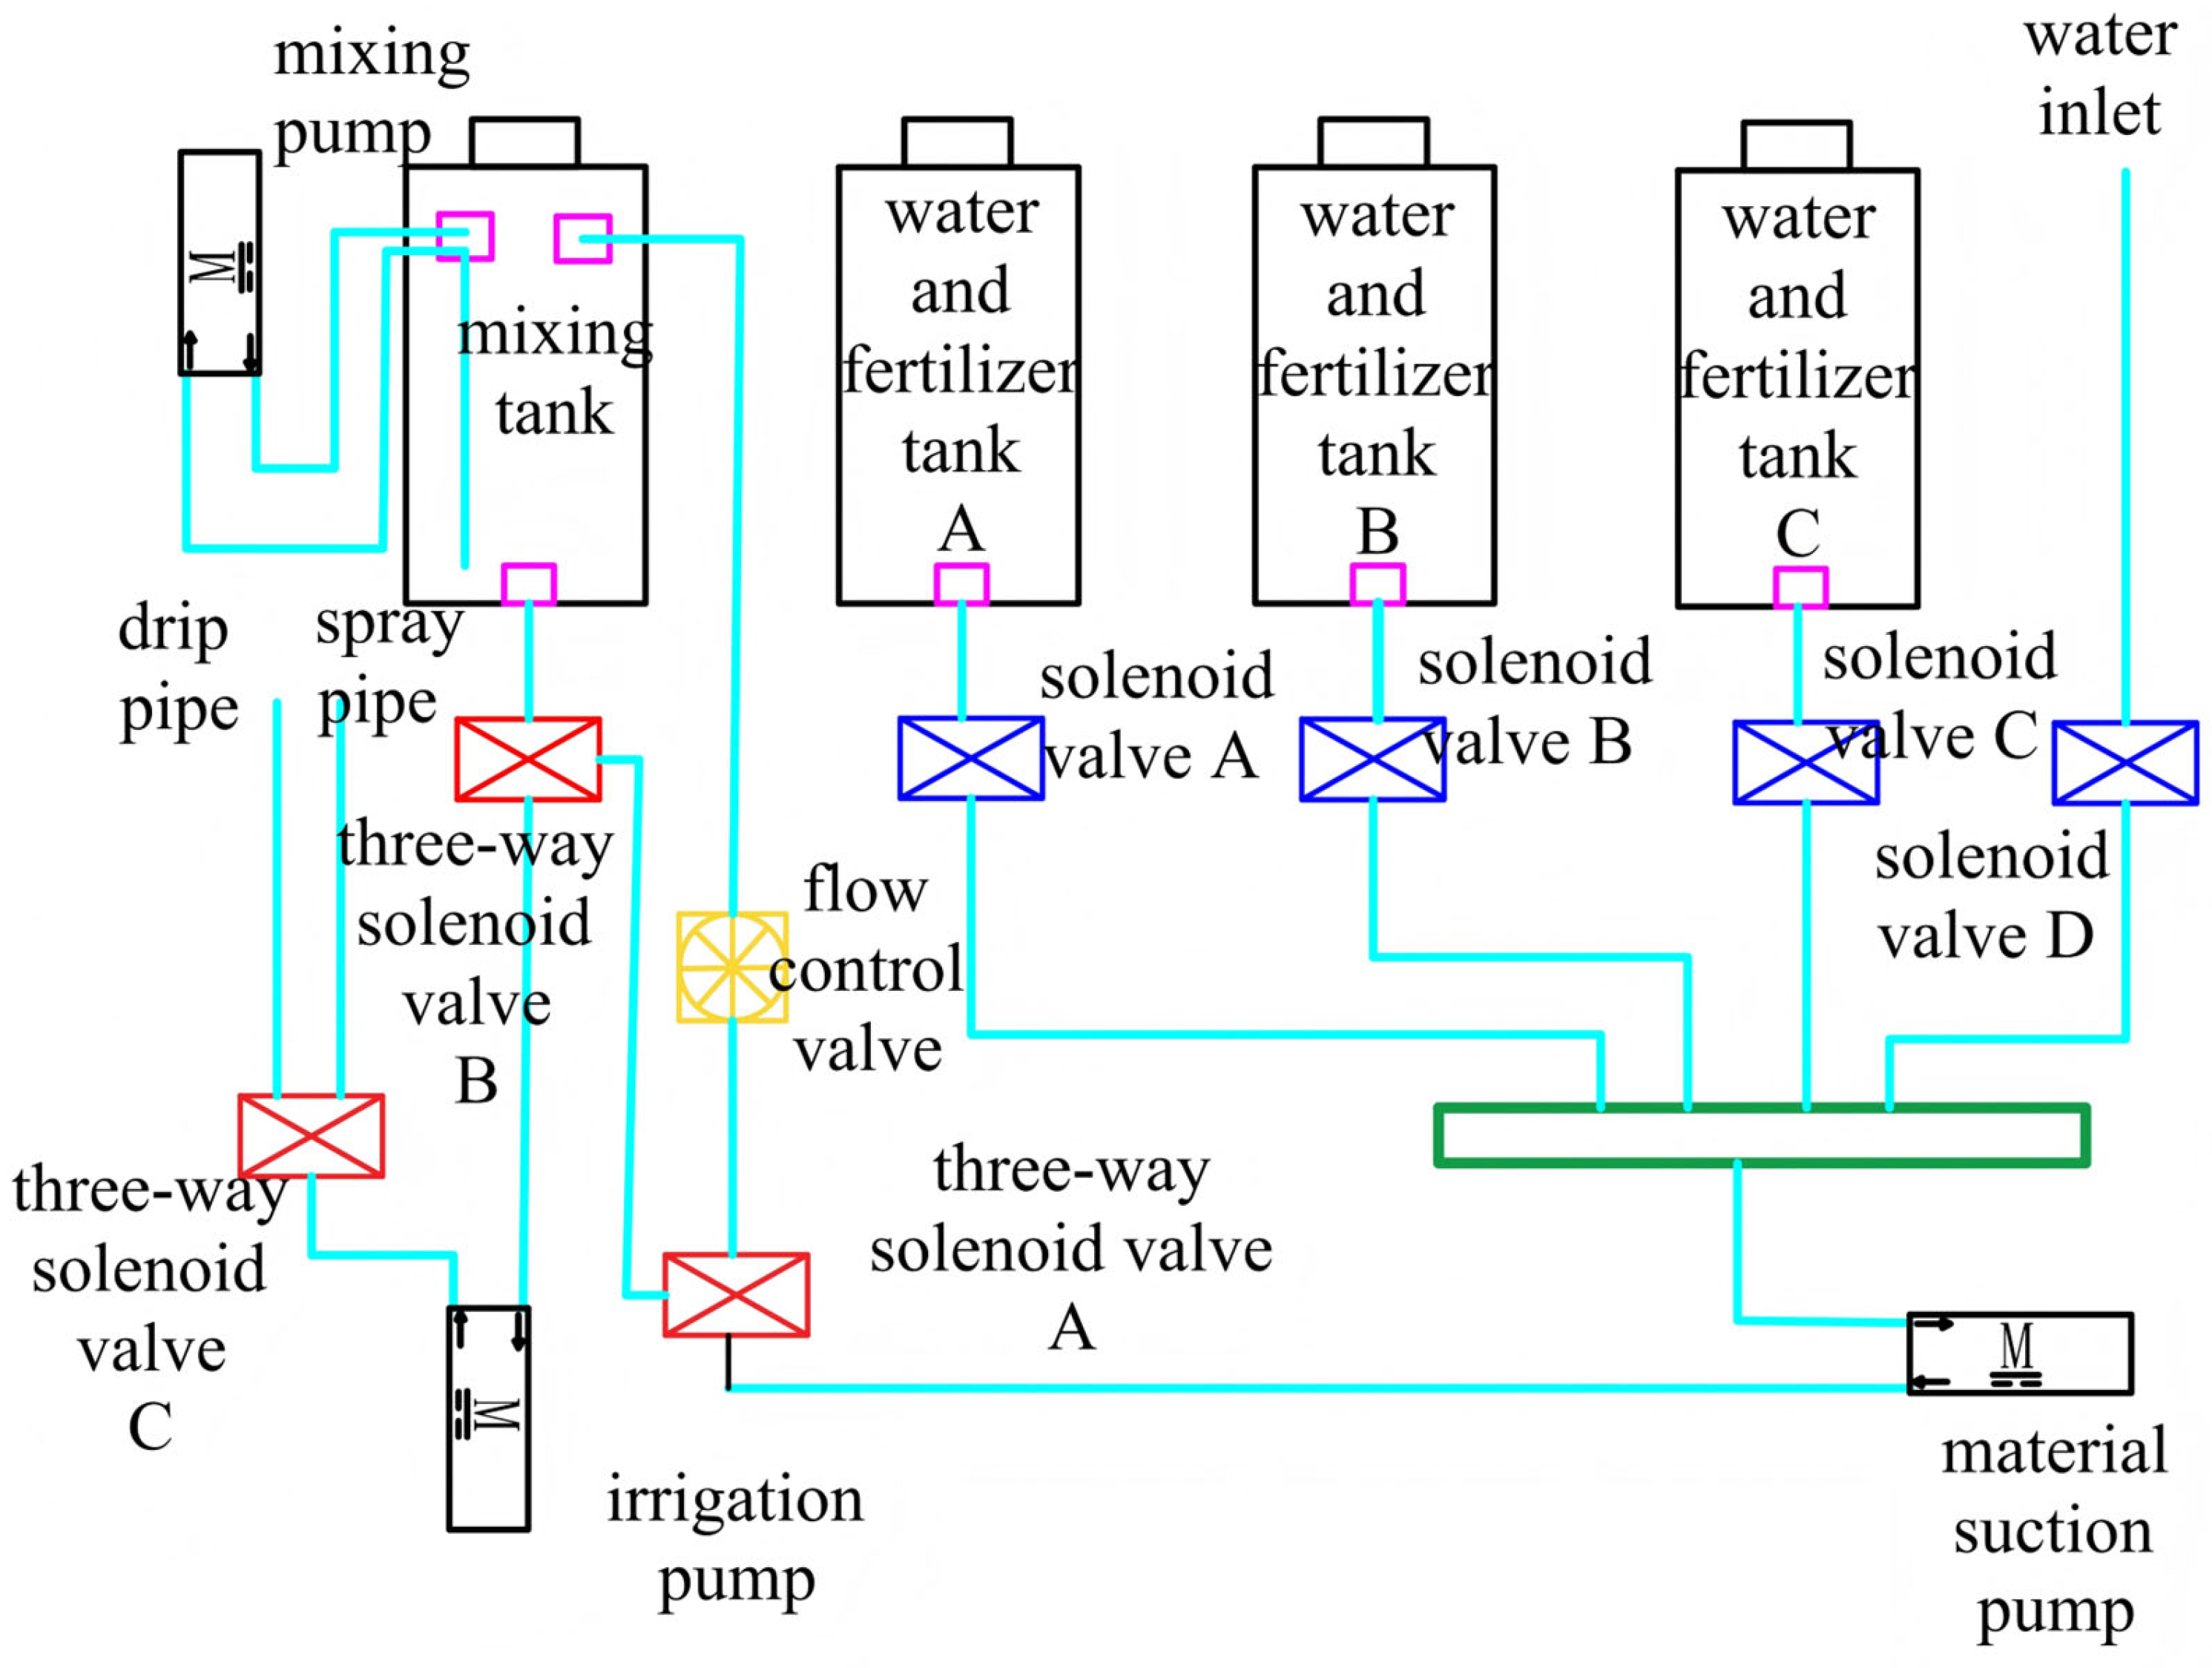
The layout of the fertigation mixing and delivery unit is shown in
Figure 3. It consisted of components such as a clean-water inlet, fertilizer solution tanks, a fertilizer-mixing pump, a mixing tank, solenoid valves, a flowmeter, and water pumps.
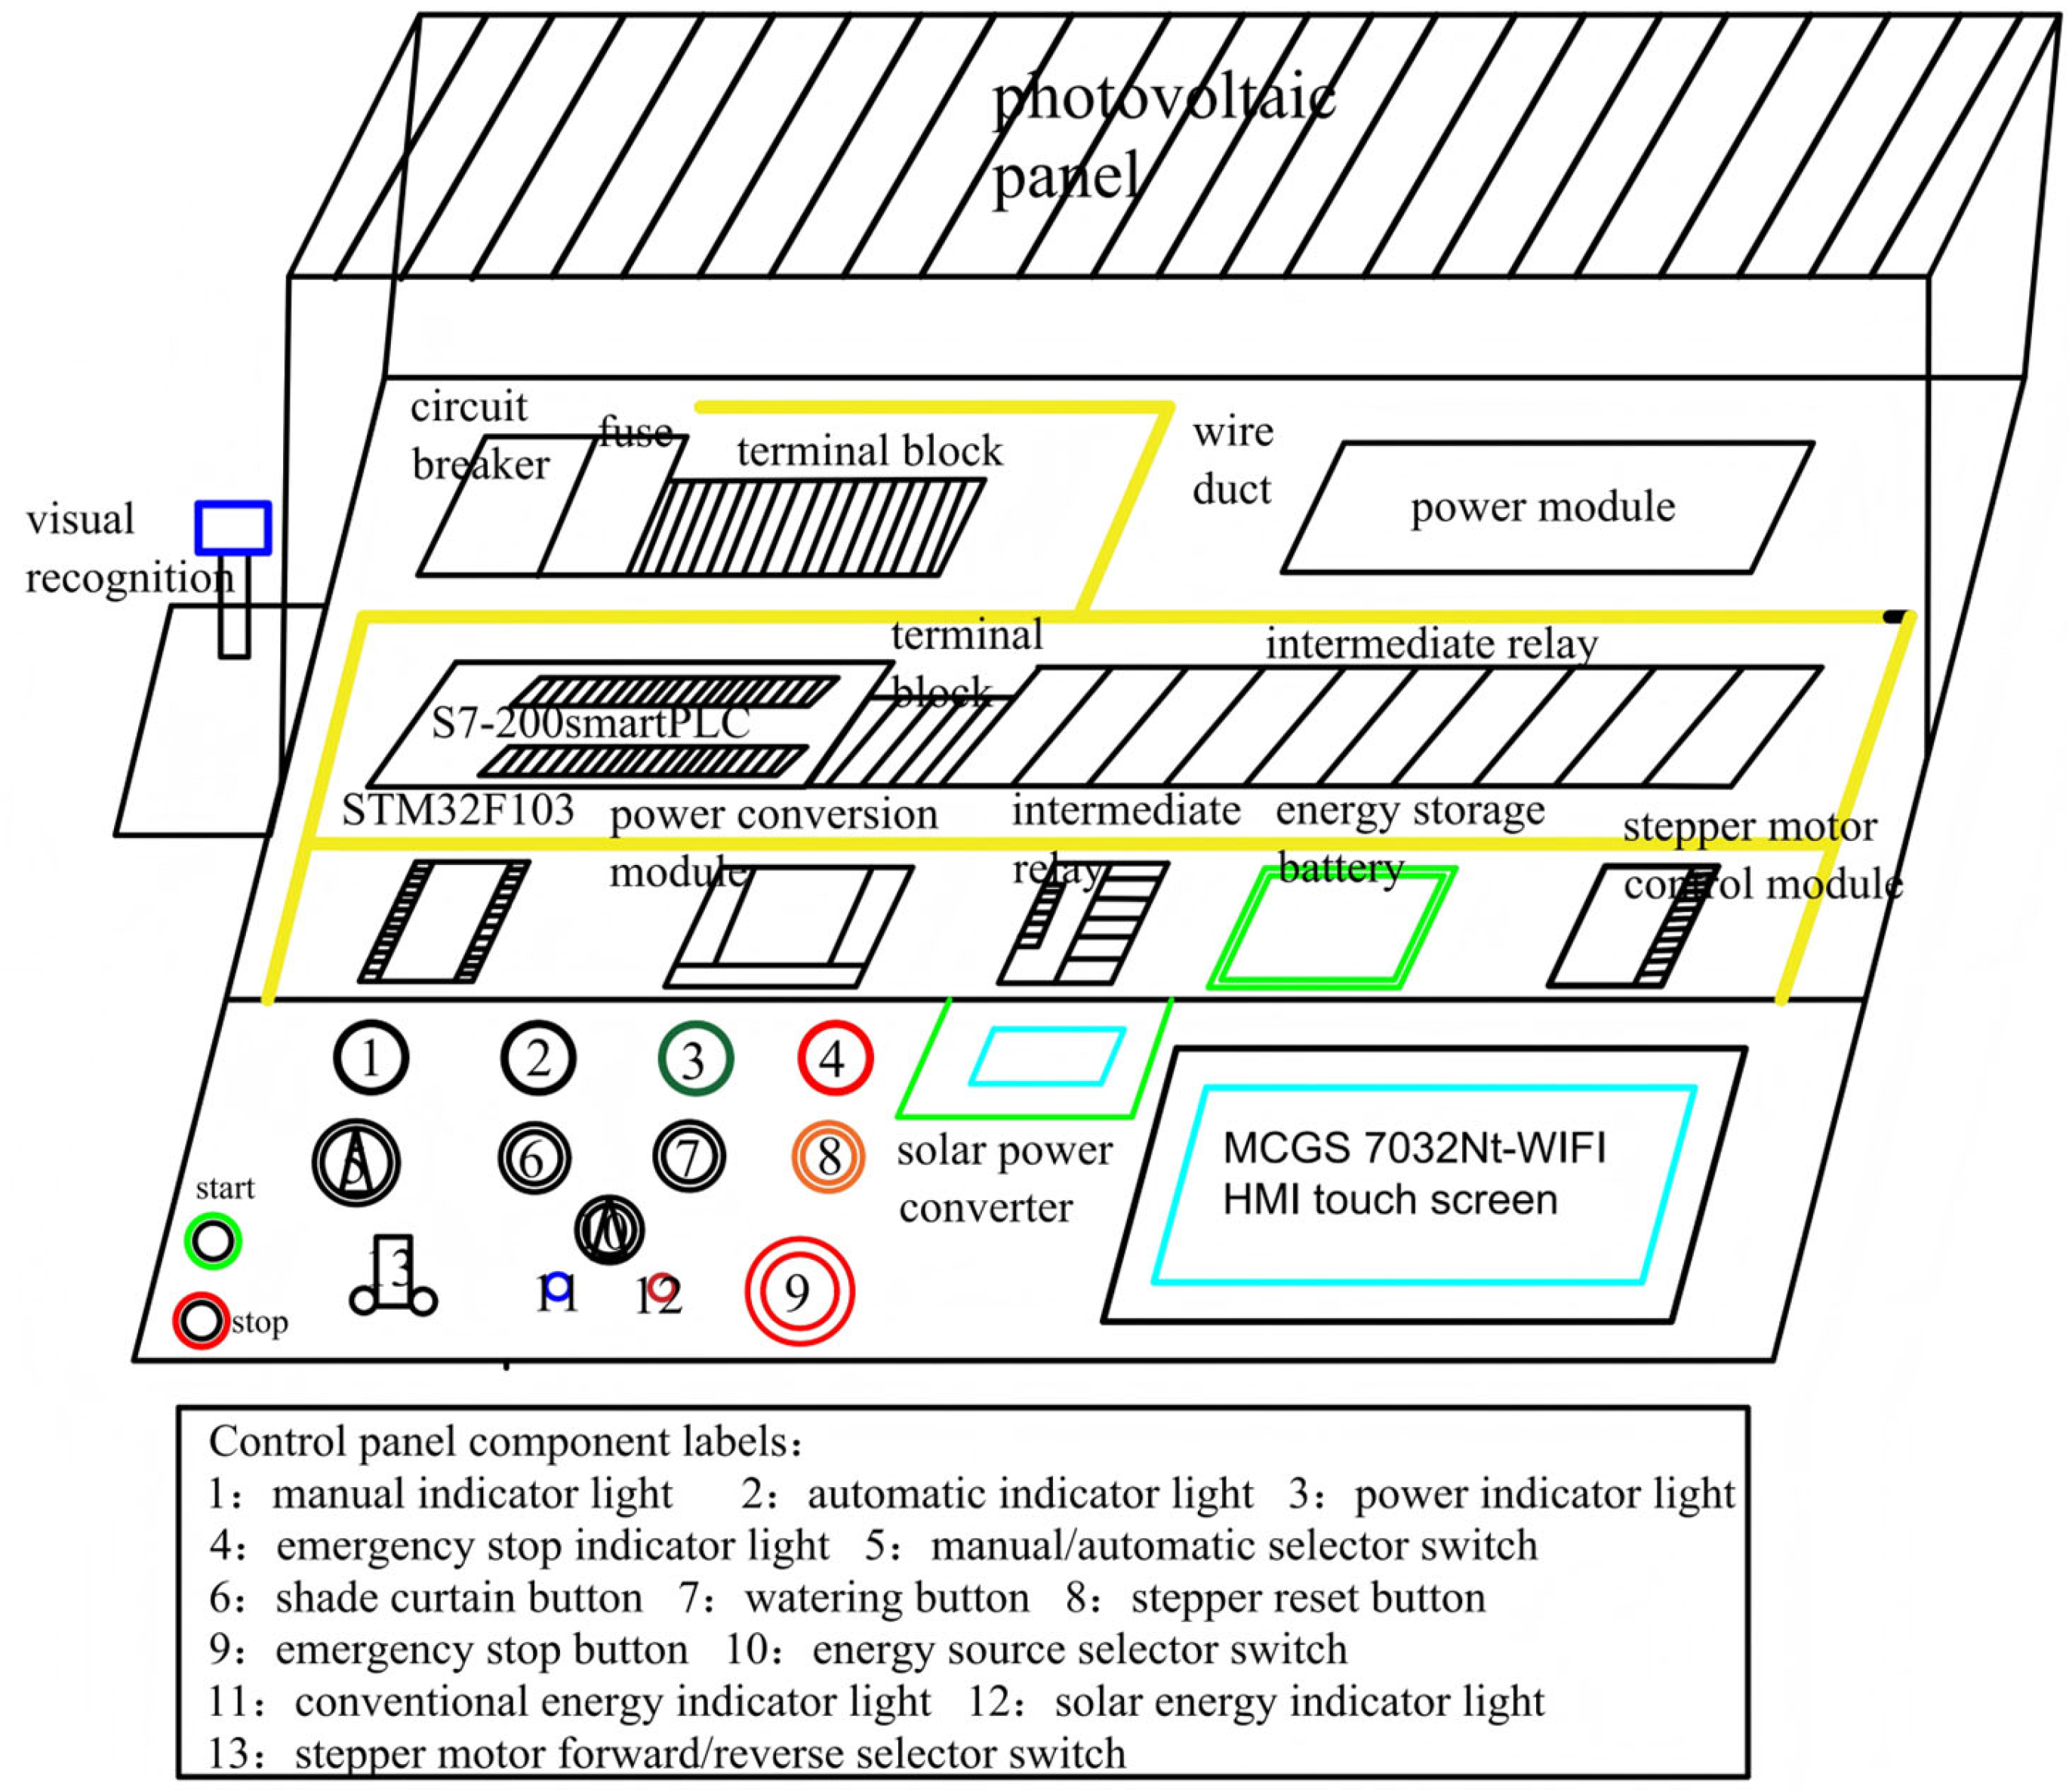
The layout of the control cabinet is shown in
Figure 4. It integrated the PLC, STM32 unit, relay modules, power supply module, stepper motor control module, and HMI touch screen, and was used for recognition-result input, logic operation, status display, and execution control.
2.2. System Workflow
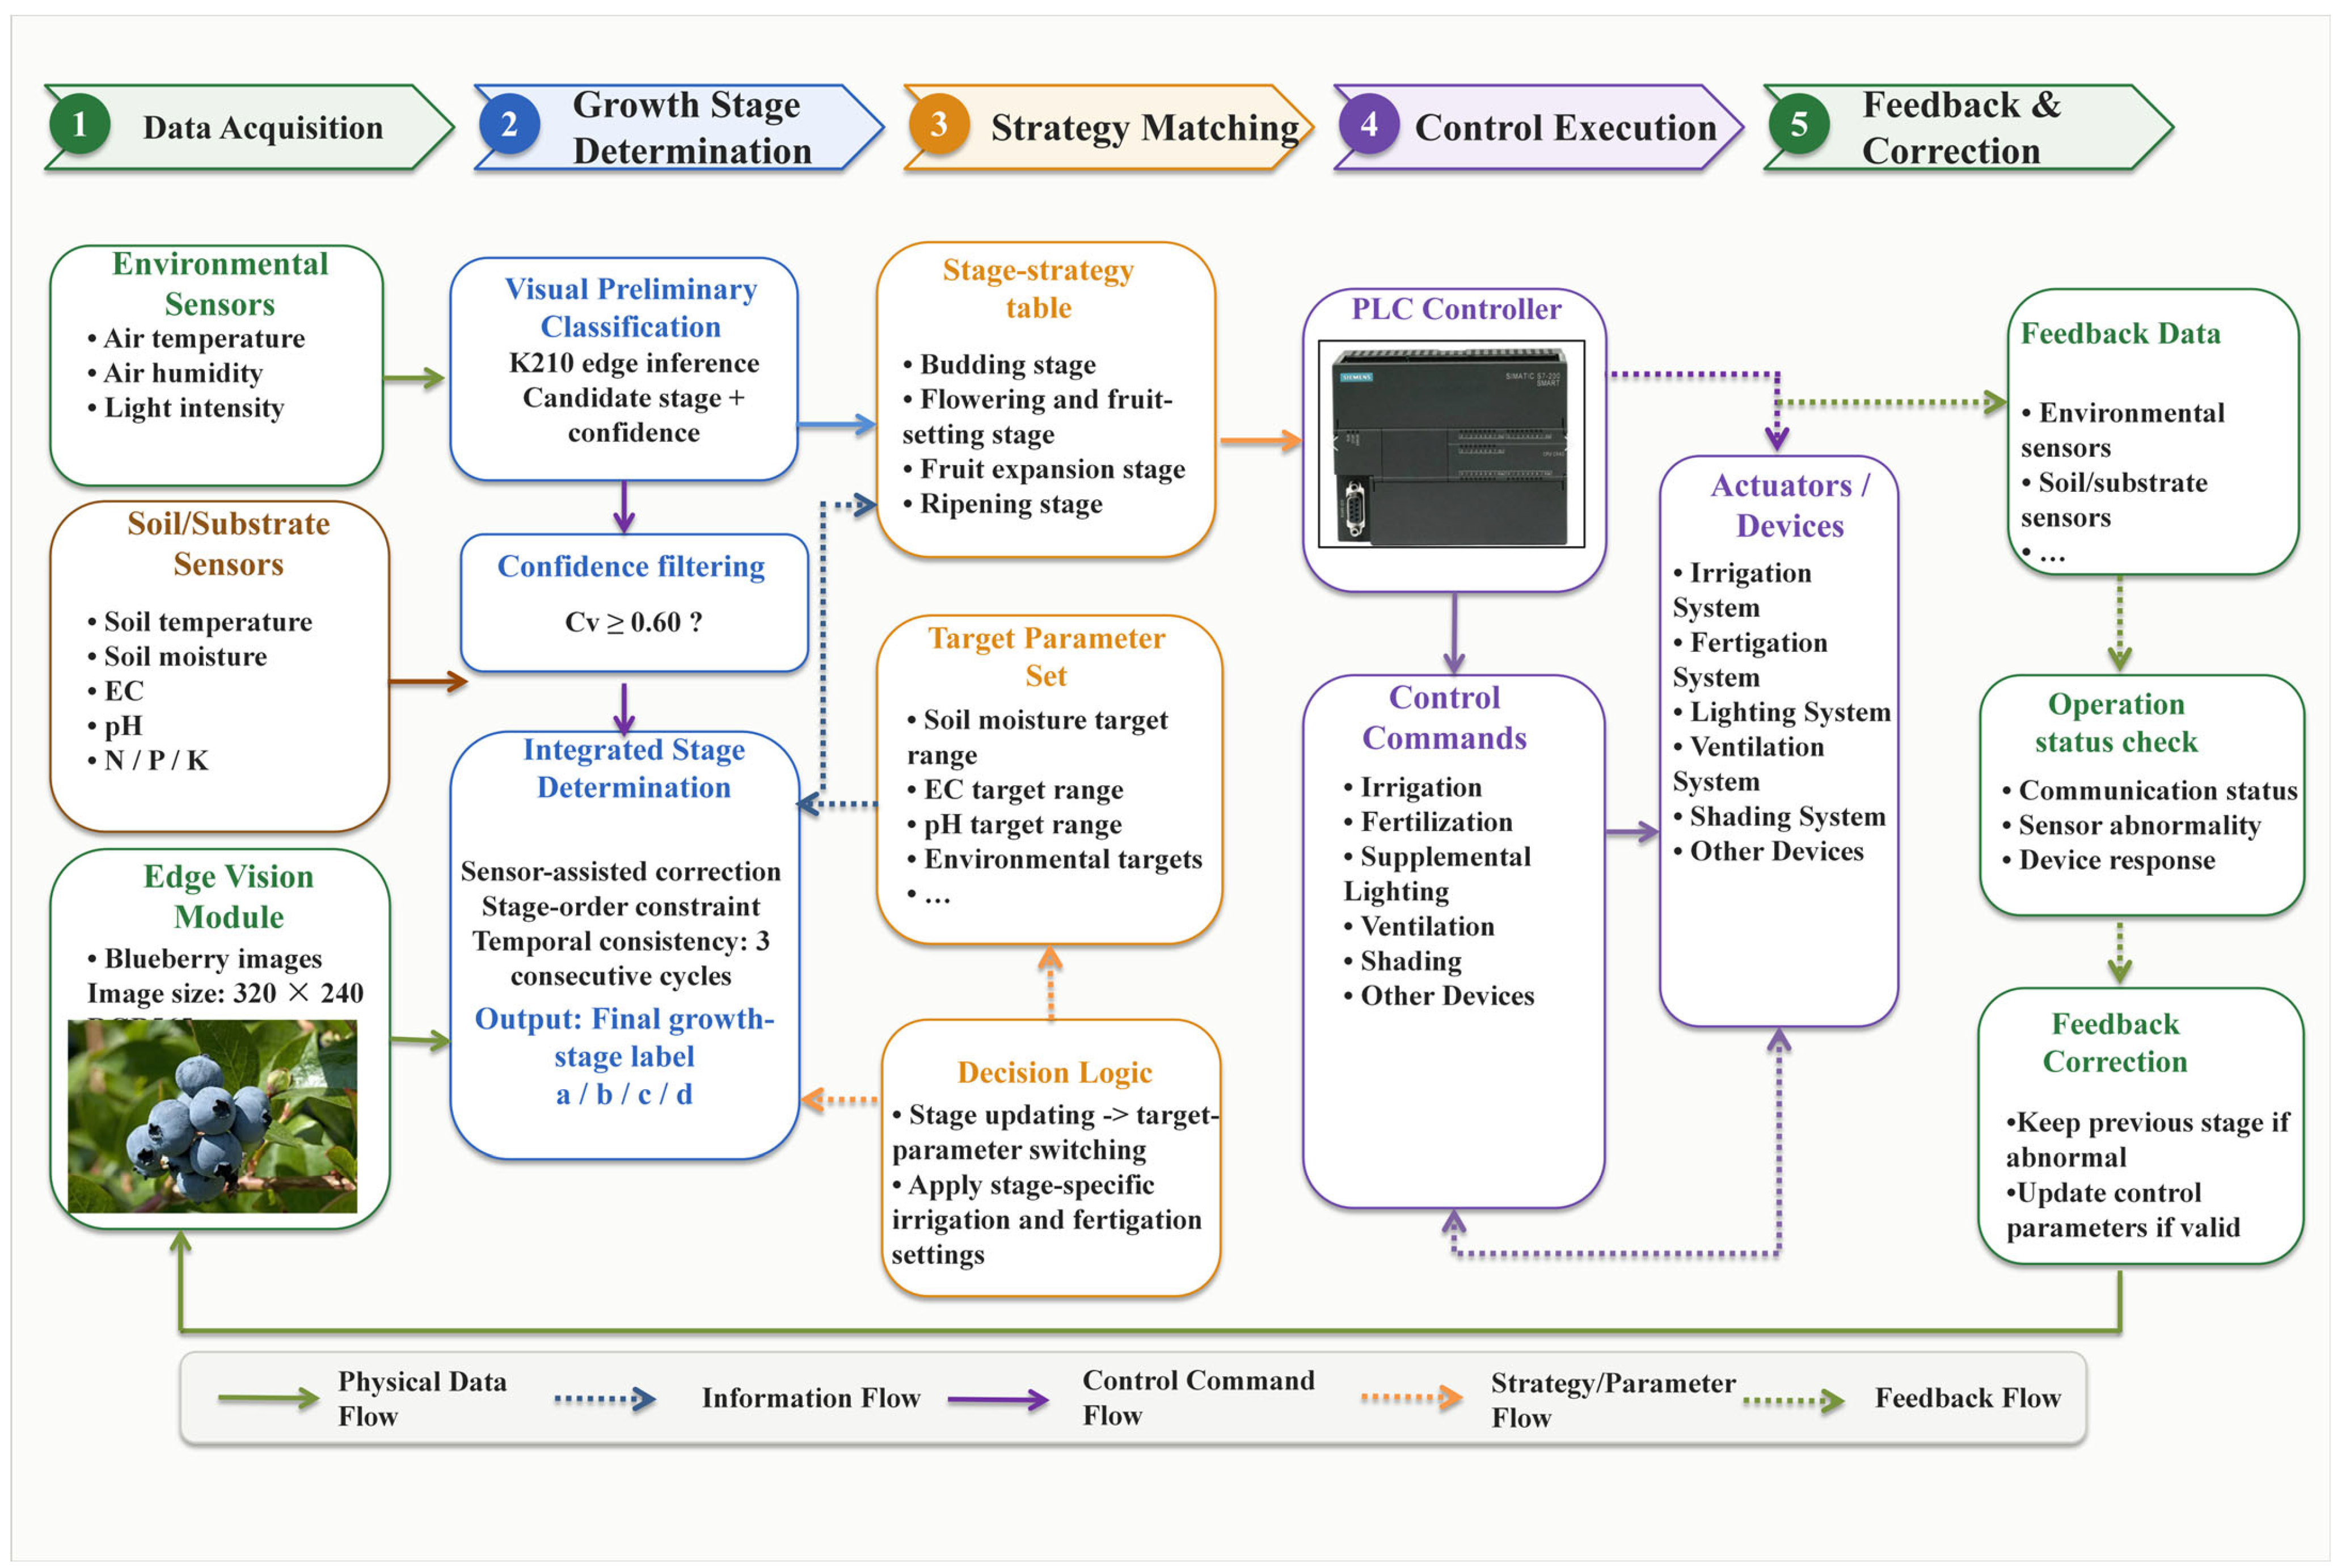
The system operation mainly included five steps: data acquisition, growth-stage determination, strategy matching, control execution, and feedback correction. The workflow is shown in
Figure 5. First, the environmental and substrate sensors collected information including air temperature and humidity, light intensity, soil temperature and moisture, EC, pH, and N/P/K. Meanwhile, the K210 vision module acquired blueberry plant images and output the candidate growth stage and its confidence value.
Figure 5 illustrates the workflow of blueberry growth-stage label determination, temporal consistency correction, and PLC parameter calling. The system first acquired environmental, substrate, and image information, and the K210 vision module output the candidate stage label and confidence value. After confidence-threshold filtering, sensor status verification, stage-order constraint checking, and temporal consistency verification over three consecutive cycles, the final growth-stage label was converted by the STM32 unit into an 8421 code and transmitted to the PLC. The PLC then called the corresponding target ranges of soil moisture, EC, and pH according to the stage-strategy table and drove the irrigation, fertilization, supplementary lighting, ventilation, and shading devices to respond accordingly.
Before the candidate stage label entered the control system, it was processed through confidence filtering, sensor status verification, stage-order constraints, and temporal consistency checking. In this study, the confidence threshold for visual recognition was set to 0.60, and the growth-stage label output period was set to 1 s. The final growth-stage label was updated only when the same candidate stage satisfied both the confidence threshold and the stage-order constraint for three consecutive determination cycles. When low-confidence recognition, stage regression, cross-stage jumping, or sensor abnormality occurred, the system retained the previous valid stage label.
The final growth-stage label was transmitted from the K210 module to the STM32 unit through a UART serial interface. The STM32 unit converted the stage character into a discrete 8421-coded signal and sent it to the PLC digital input terminals through the GPIOA PA0–PA3 pins. After reading the stage status, the PLC called the corresponding target ranges of soil moisture, EC, and pH according to the stage-strategy table and output control commands for irrigation, fertilization, supplementary lighting, ventilation, and shading based on real-time sensor data. After execution, sensor data and HMI status display were used for subsequent operation monitoring and abnormality judgment.
2.3. Blueberry Growth-Stage Division and Correspondence with BBCH Codes
Blueberry growth and development are continuous processes, whereas the PLC control system requires discrete stage labels as the basis for parameter calling. Therefore, this study did not adopt all detailed substages of the complete BBCH system. Instead, based on the BBCH phenological description of highbush blueberry, the developmental processes closely related to greenhouse fertigation parameter calling were grouped into four control-oriented stages: the budding stage, flowering and fruit-setting stage, fruit expansion stage, and ripening stage. This classification represents a coarse-grained stage grouping for control applications. Its purpose was to provide stable and recognizable stage labels for PLC-based target parameter calling at different stages, rather than to replace a complete field phenological survey.
The BBCH system for highbush blueberry provides coded descriptions of bud development, inflorescence development, flowering, fruit development, and fruit ripening. By considering the visually observable morphological features of greenhouse blueberry and the requirements of fertigation parameter calling, this study established an approximate correspondence between the four recognition stages and BBCH codes, as shown in
Table 1. Because phenological progress can be affected by blueberry cultivar, greenhouse environment, pruning practice, and cultivation season, the BBCH code ranges listed in
Table 1 were used for stage-label grouping and PLC parameter calling, rather than as the sole criterion for detailed phenological investigation.
2.4. Fertigation Parameter Invocation Targets for Different Blueberry Growth Stages
In this study, fertigation mainly refers to the coordinated management of water supply and fertilizer-solution delivery through the irrigation pipeline. The PLC did not directly evaluate the agronomic effects of fertigation. Instead, it called the corresponding target ranges of soil moisture, EC, and pH according to the blueberry growth-stage labels and drove the irrigation, fertilization, and related environmental control devices to respond accordingly.
Blueberry plants have different requirements for root-zone moisture, nutrient supply, and environmental conditions at different growth stages. Long-term use of uniform thresholds or fixed recipes may cause mismatches between supply and plant developmental requirements across stages. Therefore, based on blueberry phenological development, stage-specific phenotypic characteristics, relevant cultivation literature, greenhouse management experience, and preliminary system operation, this study established a stage-specific fertigation target-parameter table for PLC parameter invocation. Previous studies have shown that highbush blueberry is sensitive to the acidic root-zone environment, fertilizer-solution pH, EC, and drip fertigation management. Appropriate water and nutrient supply, together with pH regulation, is therefore an important component of blueberry protected cultivation management [
20,
21,
22,
23].
The parameters listed in
Table 2 are the working target ranges used for PLC-based stage-specific parameter invocation in the proposed system, rather than optimal fertigation parameters obtained from long-term optimization experiments. Their determination mainly integrated the acid substrate requirement of blueberry, differences in water and nutrient demands among phenological stages, existing cultivation studies, greenhouse management experience, and preliminary system operation. This study only verified whether the growth stage labels could be input into the PLC to complete target parameter invocation and actuator response; therefore, no conclusion is drawn regarding the agronomic optimality of these parameters. When a new growth stage label is output by the system, the PLC invokes the corresponding target parameter set for that stage and uses it as the reference basis for subsequent irrigation, fertilization, and environmental regulation.
2.5. Key Hardware and Multi-Source Sensing Configuration
The controller used in this study was a Siemens S7-200 SMART PLC (Siemens AG, Munich, Germany), model ST40 DC/DC/DC, with 24 digital input points and 16 digital output points. The expansion components included an EM DT08 module and an SB CM01 communication expansion board. PLC program development was performed using STEP 7-MicroWIN SMART software (v2.8). The edge visual recognition hardware consisted of a K210 vision camera (Canaan Inc., Beijing, China), and the K210-side program was developed using CanMV (v2.9.2). The intermediate control unit adopted an STM32F103C8T6 (STMicroelectronics, Geneva, Switzerland) microcontroller, and the STM32 program was developed using Keil uVision5 (v5.60).
The environmental monitoring unit mainly included an air temperature and humidity sensor and a light intensity sensor. The temperature and humidity sensor (Jinan Zhaotaisheng Electronic Technology Co., Ltd., Jinan, China) had a temperature measurement range of −30–70 °C and a humidity measurement range of 0–100% RH, with measurement accuracies of ±0.2 °C and ±3% RH, respectively. Its supply voltage was 5–24 V DC, and the communication interface was RS485. The light intensity sensor (Weihai JXCT Electronic Technology Co., Ltd., Weihai, China) had a supply voltage of 12–24 V DC, a measurement range of 0–65,535 Lux, a measurement error of no more than ±5%, and an RS485 communication interface. The substrate monitoring unit used a soil multi-parameter sensor (Hangzhou Vemsee Technology Co., Ltd., Hangzhou, China) to collect soil moisture, soil temperature, electrical conductivity, pH, and nitrogen, phosphorus, and potassium contents. The sensor had an IP68 protection rating, a moisture measurement range of 0–100%, a temperature measurement range of −40 to 80 °C, an electrical conductivity measurement range of 0–10,000 μS/cm, and a pH measurement accuracy of ±0.3. RS485 communication was used for data transmission.
The execution layer was equipped with electromagnetic valves, water pumps, a fertilizer-mixing tank, a stirring tank, drip irrigation pipelines, and a sprinkler irrigation device. Material suction, stirring, and irrigation were driven by three 12 V DC water pumps. The Hall-effect water flow sensor was model USN-HS06PS (Shandong Xinzhun Electronic Technology Co., Ltd., Jinan, China), with an operating voltage of 5–24 V DC and a measurement range of 0.1–1.5 L/min. The sprinkler irrigation device was driven by a stepper motor, the shading curtain was driven by a DC geared motor, and the ventilation unit used DC fans.
The human–machine interaction component used a Kunlun Tongtai MCGS 7032Nt-WIFI touch screen (Beijing Kunlun Tongtai Automation Technology Co., Ltd., Beijing, China). HMI configuration and script logic development were performed using McgsSetPro software (McgsPro 3.3.2). The interface was mainly used for operating status display, control mode switching, parameter configuration, growth-stage strategy setting, formulation management, and viewing operation alarm information.
2.6. Visual Recognition-Based Blueberry Growth Stage Determination Method
2.6.1. Image Acquisition and Dataset Construction
To address the lack of crop growth-stage information input in conventional greenhouse control systems, a blueberry growth-stage determination module was developed in this study. This module was deployed in the edge vision unit and was designed to output stage labels based mainly on visible features of blueberry plants at different developmental stages, including buds, inflorescences, young fruits, fruit clusters, mature fruits, and canopy morphology. Environmental and substrate sensor information was also incorporated for control safety verification, anomaly detection, and temporal consistency processing of the growth stage labels, thereby improving the usability of stage labels before their entry into the PLC control process.
Greenhouse blueberry plants were used as the image acquisition objects in this study. Image acquisition covered four major growth stages: the budding stage, flowering and fruit-setting stage, fruit expansion stage, and ripening stage. To improve the adaptability of the dataset to practical greenhouse conditions, images were collected under different conditions as far as possible, including natural light, greenhouse supplemental lighting, local shading, and different shooting angles. The image backgrounds mainly included blueberry plants, cultivation substrate, pots, drip irrigation pipelines, greenhouse support structures, and local equipment. During image acquisition, some samples contained leaf occlusion, overlapping fruit clusters, crossed branches, and background interference. These samples were retained in the dataset after screening to enhance the adaptability of the model to complex greenhouse backgrounds.
After image screening, duplicate removal, preprocessing, and data augmentation, an image-level recognition dataset for blueberry growth-stage classification was constructed. A total of 947 raw images were collected at the preliminary stage. After manual pre-screening, 129 images with severe blur, overexposure, underexposure, missing targets, non-target growth stages, or ambiguous stage characteristics were removed, and 818 normally decodable images were retained for data organization. Subsequently, 22 completely duplicated images were removed using an image-content-based duplicate checking procedure, resulting in 796 independent raw images.
During data organization, raw images were first used as the basic unit for dataset splitting. The dataset was divided into training, validation, and test sets at an approximate ratio of 8:1:1, including 635 raw training images, 77 validation images, and 84 independent test images. To avoid data leakage, data augmentation was applied only to the training set, while the validation and test sets were not augmented. The same raw image and its augmented samples were not assigned to different data subsets. After training-set augmentation, 2054 valid images were obtained, including 1893 training images, 77 validation images, and 84 independent test images. By growth stage, the dataset contained 590 images for the budding stage, 488 images for the flowering and fruit-setting stage, 464 images for the fruit expansion stage, and 512 images for the ripening stage.
The eligible images were manually annotated according to the growth stage criteria listed in
Table 1. During annotation, visible organs or tissues that best represented the current developmental stage were preferentially used as the basis for stage assignment, including buds and newly emerged shoots for the budding stage; flower buds, open flowers, and young fruit for the flowering and fruit-setting stage; green berries and enlarging fruit clusters for the fruit expansion stage; and colored berries and mature fruit clusters for the ripening stage. Because this study adopted an image-level growth stage classification approach rather than berry-level object detection or instance segmentation, each image was assigned a single dominant growth stage label.
For images containing green, transitional, and mature berries simultaneously, the image-level label was determined according to the dominant visible phenological characteristics and the prevailing developmental status of the principal fruit clusters across the entire image. Specifically, images were labeled as the fruit expansion stage when enlarging green berries and fruit clusters without obvious coloration predominated. Images were labeled as the ripening stage when colored or mature berries accounted for a relatively high proportion and characteristic maturity features, such as surface bloom and blue-purple or dark-blue coloration, were clearly visible. Images in which green, transitional, and mature berries occurred in similar proportions without a clearly dominant stage, or in which reliable stage determination was hindered by severe blurring, absence of the target, strong reflections, overexposure, or extensive occlusion, were treated as ambiguous samples and excluded from the training, validation, and test sets.
This annotation strategy ensured that the model learned the dominant growth stage at the whole-image level rather than performing object-wise classification of individual berries. To reduce the influence of illumination variability on recognition performance, brightness adjustment, contrast adjustment, and local illumination perturbation were included during image preprocessing and augmentation, thereby enabling the training set to cover conditions involving natural light, supplemental greenhouse lighting, and localized shading.
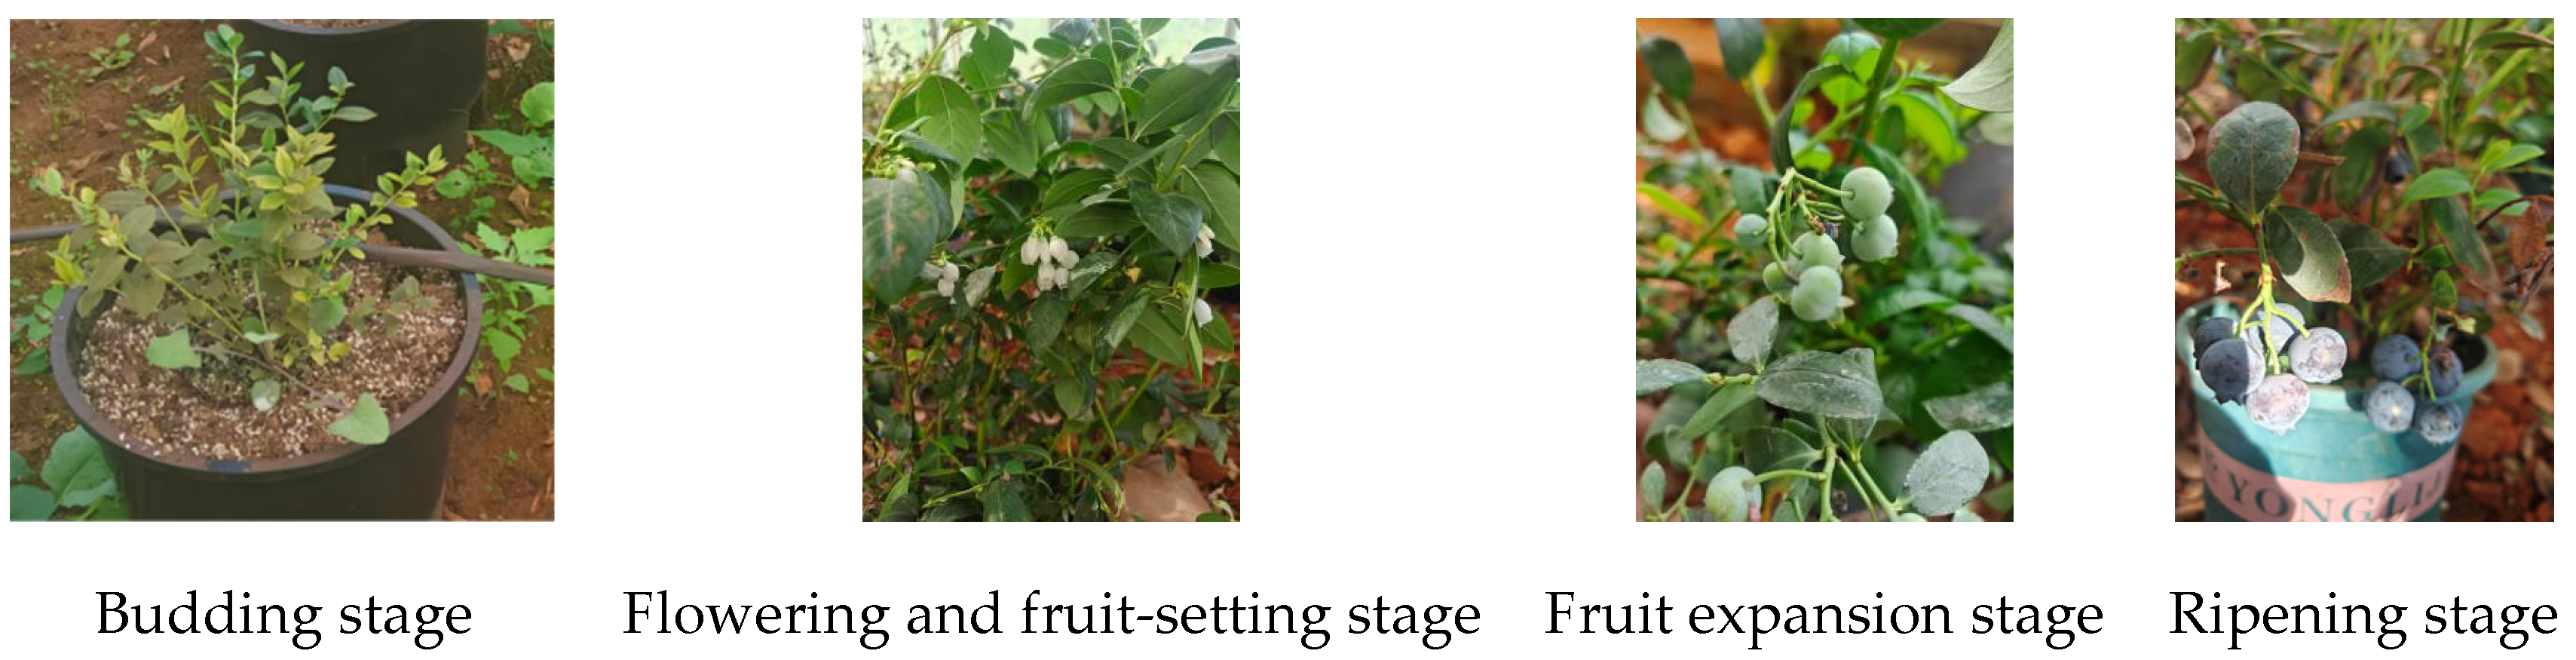
Figure 6 shows representative images of the four major growth stages of greenhouse blueberry plants, namely the budding stage, flowering and fruit-setting stage, fruit expansion stage, and ripening stage. These images were collected from real greenhouse blueberry plants and are used to illustrate the main visible morphological features on which the growth stage labels in this study were constructed.
2.6.2. Edge Vision Model Deployment
In terms of model implementation, the visual recognition algorithm adopted a lightweight YOLO-type image-level stage recognition model. Considering that the PLC control layer actually used the final growth-stage label rather than object localization results, the output of the edge vision module was defined as the image-level stage category label and its corresponding confidence score. The K210-side program was developed in the CanMV environment, and the model file was converted for edge deployment. The input image size was 320 × 240 pixels, and the pixel format was RGB565. The model outputs the candidate stage category label and its confidence score at the edge terminal. The recognition result was displayed on the LCD interface and transmitted to the STM32 intermediate processing unit through serial communication. The K210 platform integrates a KPU neural network acceleration unit, which is suitable for low-power edge vision inference under resource-constrained conditions. Therefore, it can provide the hardware basis for local output of growth-stage recognition results in the greenhouse prototype system.
The YOLOv5n-cls, YOLOv8n-cls, and YOLO11n-cls models used in this study are image classification branches of the YOLO framework rather than object detection models. Conventional YOLO-based object detectors typically output bounding-box coordinates, object classes, and detection confidence scores. In contrast, the YOLO-cls models employed here do not generate bounding-box coordinates or perform berry-level localization or counting. Instead, they extract global visual features from the entire input image and use a classification head to output class confidence scores for the different blueberry growth stages. The class with the highest confidence score is selected as the candidate growth stage label. Because the PLC control layer requires a discretized final growth stage label rather than bounding-box locations, object counts, or the spatial distribution of individual berries, image-level growth stage classification is more consistent with the requirements of stage-specific parameter invocation and integration into the control pipeline.
In the control program, although the K210 camera could continuously acquire images and display recognition results on the LCD interface, the PLC control layer did not directly use continuous video frames as control inputs. Instead, the control link adopted a 1 s stage-label output period. That is, after the K210 recognized the target category, it transmitted the corresponding stage character to the STM32 once every 1 s. This setting was mainly used to ensure a stable control period when stage labels were input into the PLC and to prevent high-frequency image fluctuations from directly causing frequent switching of PLC parameters.
At the edge deployment level, the traceable key deployment parameters in this study included an input image size of 320 × 240 pixels, an RGB565 pixel format, a K210-executable kmodel file, a recognition confidence threshold of 0.60, a stage-label output period of 1 s, and a serial communication baud rate of 9600 bps between the K210 and STM32. The kmodel format was used to adapt the model to the KPU inference environment of the K210, enabling online recognition and category-label output at the edge terminal.
The models used for image-level stage classification evaluation were trained using a unified data split and training configuration. The evaluated models included YOLOv5n-cls, YOLOv8n-cls, YOLO11n-cls, and Tiny-YOLO-cls. The input image size was 224 × 224 pixels, the number of training epochs was 30, the batch size was 16, the optimizer was AdamW, the initial learning rate was 0.00125, the weight decay coefficient was 0.0005, and the loss function was cross-entropy classification loss. Data augmentation was applied only to the training set, whereas no augmentation was applied to the validation set or the independent test set.
The model evaluation metrics included Accuracy, Precision, Recall, F1-score, class accuracy, and Macro AP. Let
,
, and
denote the numbers of true positives, false positives, and false negatives, respectively, for the i-th growth stage class. The Precision, Recall, and F1-score for this class were calculated as follows:
Accuracy was defined as the proportion of correctly classified images in the independent test set. Class accuracy was defined as the proportion of images correctly classified within each true growth stage class. Macro Precision, Macro Recall, and Macro F1-score were calculated as the arithmetic means of the Precision, Recall, and F1-score values, respectively, across the four growth stage classes, and were used to characterize the overall class-level classification performance of the model. Average precision (AP) was calculated from the class confidence scores using a one-vs.-rest classification scheme, and Macro AP was obtained by averaging the AP values across the four growth stage classes. In this study, Macro AP refers to the macro-averaged precision derived from class confidence scores in an image-level classification task using a one-vs.-rest strategy. Therefore, it differs from mAP@0.5 and mAP@0.5:0.95 used in object detection in terms of both its definition and evaluation target.
During K210-side system linkage debugging, this study mainly verified whether the model file could be loaded and executed at the edge terminal, whether stage labels could be stably output, and whether the recognition results could drive PLC-based parameter invocation after STM32-based encoding. Since the focus of this study was the verification of parameter invocation and actuator linkage after stage recognition results entered the PLC control link, K210-side resource occupation and energy-consumption tests were not included as major evaluation objectives. Therefore, this study reports only the model scale, stage-label output period, and end-to-end system response time, without further quantifying K210-side deployment performance indicators such as KPU memory usage, CPU/KPU utilization, real-time power consumption, and frame-by-frame FPS. Future studies should synchronously record the model quantization method, inference frame rate, memory usage, power consumption, and long-term operational stability during edge deployment, so as to more comprehensively evaluate the real-time deployability of the model on the K210 platform.
2.6.3. Sensor-Status Verification and Temporal Consistency Determination
To improve the usability of visual recognition results in the PLC control process, a confidence threshold, stage progression constraint, sensor status verification, and temporal consistency determination were applied to the preliminary visual recognition results. In each determination cycle, the visual recognition module outputs a candidate stage label and its corresponding confidence score. According to the model deployment parameters on the K210 side, the confidence threshold for visual recognition was set to 0.60. When the recognition confidence was lower than 0.60, the system did not update the stage label but retained the previous valid stage label.
Blueberry growth stages show a unidirectional progression pattern. To facilitate the description of stage progression and PLC-based parameter invocation logic, the four growth stages were defined as four sequential states at the control logic level. State 1 corresponded to the budding stage, State 2 to the flowering and fruit-setting stage, State 3 to the fruit expansion stage, and State 4 to the ripening stage. It should be noted that these state numbers were used only for describing stage sequence determination and PLC-based parameter invocation logic. In the actual serial communication between the K210 and STM32, the stage labels were not directly transmitted as the numbers 1, 2, 3, and 4, but as characters.
Specifically, after the K210 recognized different growth stages, it transmitted the corresponding character through serial communication. The character “a” represented the budding stage, “b” represented the flowering and fruit-setting stage, “c” represented the fruit expansion stage, and “d” represented the ripening stage. After receiving these characters, the STM32 converted them into the corresponding stage states and output high- and low-level signals through the PA0–PA3 pins of GPIOA in the form of 8421-coded discrete signals. These signals were finally input into the PLC digital input terminals through relays. The PLC identified the current stage according to the input discrete coded signals and invoked the corresponding stage-specific fertigation target parameters.
Stage updating was allowed only when the current stage remained unchanged or progressed to the next stage. Backward stage transition or cross-stage jumping was not permitted. The stage sequence determination was described using the stage state numbers, and the rule was as follows:
When the stage difference was 0, the current candidate stage was consistent with the previous valid stage, and the system maintained the current stage state.
When the stage difference was 1, the current candidate stage advanced by one stage relative to the previous valid stage, which was consistent with the normal growth progression of blueberry and could enter the continuous confirmation process.
When the stage difference was less than 0, the recognition result indicated a backward stage transition, such as a change from the fruit expansion stage back to the flowering and fruit-setting stage. This result was regarded as abnormal, and the PLC did not perform stage updating.
When the stage difference was greater than 1, the recognition result indicated a cross-stage jump, such as a direct transition from the budding stage to the fruit expansion stage or ripening stage. This result was also regarded as abnormal, and the PLC did not perform stage updating.
To avoid the influence of single-frame misclassification on the control strategy, continuous temporal consistency determination was adopted in this study. The system determination cycle was set to 1 s, and the number of consecutive confirmations was set to three. In other words, the system was allowed to update the final stage label only when the same candidate stage was recognized in three consecutive determination cycles, the recognition confidence in each cycle was not lower than 0.60, and the stage transition conformed to the normal progression sequence.
The final growth stage label was updated according to three criteria: the vision-based recognition result, the growth stage progression constraint, and sensor status verification. The detailed procedure of the stage label updating strategy is presented in Algorithm 1.
| Algorithm 1. Temporal consistency updating rule for stage labels. |
Input: Current candidate stage label, current candidate stage confidence, previous valid stage label, consecutive occurrence count of the same candidate stage, and sensor status.
Output: Final stage label.
Step 1: Determine the visual recognition confidence.
If the confidence of the current candidate stage is lower than 0.60, the final stage label remains the previous valid stage label, and no stage update is performed.
Step 2: Determine the sensor status.
If the sensor data exceed the valid measurement range, communication is interrupted, sudden data fluctuation occurs, or the sensor data are seriously inconsistent with the current control target, the final stage label remains the previous valid stage label, and an alarm status is displayed on the HMI interface.
Step 3: Determine the stage progression sequence.
The current candidate stage label is converted into the corresponding stage state number, and the stage difference is calculated as follows:
Stage difference = current candidate stage state number − previous valid stage state number.
If the stage difference is less than 0, it is determined as a backward stage transition, and the stage label is not updated.
If the stage difference is greater than 1, it is determined as a cross-stage jump, and the stage label is not updated.
If the stage difference is 0 or 1, the process proceeds to the next step.
Step 4: Determine the consecutive occurrence count.
If the consecutive occurrence count of the same candidate stage is greater than or equal to 3, the final stage label is updated.
If the consecutive occurrence count of the same candidate stage is less than 3, the previous valid stage label is retained.
Step 5: Output the final stage label.
When the update conditions in Steps 1 to 4 are all satisfied, the final stage label is set as the current candidate stage label. Otherwise, the final stage label remains the previous valid stage label. |
2.7. PLC Control Logic and Human–Machine Interaction Implementation
The PLC served as the core control unit for system implementation and was mainly responsible for sensor data reception, stage-label reading, logical operation, target-parameter invocation, control command output, and operating status management. The PLC received real-time data from the environmental and substrate sensors, as well as growth-stage labels transmitted from the edge vision terminal after STM32-based encoding. According to the predefined stage-strategy table and control rules, the PLC determined whether the current environmental and rhizosphere conditions deviated from the target ranges and then output corresponding control commands for irrigation, fertilizer delivery, supplemental lighting, ventilation, and shading.
To improve the describability and reproducibility of the control logic, the stage-label updating process and PLC-based parameter invocation process were described as a stage-state-driven rule-based control procedure. Let
denote the final growth-stage label in the k-th control cycle. Its value set is defined as follows:
where 1, 2, 3, and 4 represent the budding stage, flowering and fruit-setting stage, fruit expansion stage, and ripening stage, respectively. Let
denote the candidate stage output by the visual module,
denote the corresponding confidence score,
denote the previous valid stage,
denote the number of consecutive occurrences of the same candidate stage, and
denote the sensor-status variable. When the sensor data are within the valid measurement range and the communication status is normal,
. When the sensor data exceed the valid measurement range, communication is interrupted, or abnormal abrupt changes occur,
. The stage-label updating rule is expressed as follows:
In this rule, indicates that the recognition result of the candidate stage satisfies the confidence threshold. indicates that the stage transition conforms to the normal developmental progression of blueberry, meaning that the system allows the stage to remain unchanged or advance to the next stage, but does not allow backward transition or cross-stage jumping. indicates that the same candidate stage has appeared in three consecutive determination cycles, and indicates that the sensor status is normal. Only when all the above conditions are simultaneously satisfied does the system update the final growth-stage label; otherwise, the previous valid stage label is retained. This rule can reduce the influence of single-frame misclassification, low-confidence recognition, abnormal stage transitions, and sensor anomalies on PLC-based parameter invocation.
After reading the final growth-stage label, the PLC invokes the corresponding fertigation target-parameter set according to the stage-strategy table. Let the target-parameter invocation function corresponding to stage
be defined as follows:
where
and
denote the lower and upper target limits of soil moisture under stage
, respectively;
and
denote the lower and upper target limits of electrical conductivity, respectively; and
and
denote the lower and upper target limits of pH, respectively. In each control cycle, the PLC reads the real-time soil moisture
, electrical conductivity
, and pH value
, and determines the states of the irrigation and fertilization actuators according to the stage-specific target ranges.
The state of the irrigation actuator,
, can be expressed as follows:
where
indicates that irrigation is activated, and
indicates that irrigation is stopped. When soil moisture is lower than the target lower limit for the current stage, the PLC activates the irrigation device. When soil moisture is higher than the target upper limit, the PLC stops the irrigation device. When soil moisture remains within the target range, the irrigation state from the previous control cycle is maintained to avoid frequent actuator switching.
When
:
where
indicates that fertilizer-solution delivery or fertilization is allowed, and
indicates that fertilizer-solution delivery or fertilization is stopped. When EC is lower than the target lower limit for the current stage and pH remains within the allowable range, the PLC allows fertilization or fertilizer-solution delivery. When EC is higher than the target upper limit or pH exceeds the specified range, the PLC stops fertilization or fertilizer-solution delivery. When EC remains within the target range, the actuator state from the previous control cycle is maintained.
Supplemental lighting, shading, and ventilation devices were controlled through upper- and lower-limit linkage logic based on light intensity, temperature, and humidity conditions. When light intensity was lower than the lower limit set for the current stage, the PLC activated the supplemental lighting device. When light intensity exceeded the upper limit, the PLC activated the shading device. When temperature or humidity exceeded the safety threshold, the PLC activated the ventilation device. The above control logic belongs to a stage-label-driven rule-based control method. Its purpose is to enable the PLC to invoke different working target ranges according to different growth stages and to determine actuator start–stop states based on real-time sensor data. The control logic described in this study was used to verify whether stage recognition results could be incorporated into the PLC parameter invocation link, and it does not represent a fertigation parameter optimization model, predictive control model, or long-term agronomic regulation model.
Serial communication was adopted between the K210 and the STM32. USART1 of the STM32 was used to receive the stage characters sent by the K210. Specifically, the TX pin PA9 of the STM32 was connected to the RX pin of the K210, and the RX pin PA10 of the STM32 was connected to the TX pin of the K210, with a common ground connection between the two modules. The serial communication baud rate was 9600 bps, with 8 data bits, 1 stop bit, and no parity. After the K210 recognized the target category, it transmitted the corresponding character once every 1 s. The character “a” represented the budding stage, “b” represented the flowering and fruit-setting stage, “c” represented the fruit expansion stage, and “d” represented the ripening stage. After receiving the stage character, the STM32 converted it into the corresponding stage state according to the predefined mapping relationship and output high- and low-level signals through the PA0–PA3 pins of GPIOA in the form of 8421-coded discrete signals. The output signals were connected to the PLC digital input terminals after relay isolation. The PLC then invoked the corresponding stage-specific fertigation target parameters according to the input state.
The HMI module used an MCGS 7032Nt-WIFI touch screen to implement system status display, control-mode switching, parameter configuration, stage-specific strategy setting, recipe management, and operating alarm information display. The HMI interface included a startup interface, status monitoring interface, automatic parameter interface, recipe management interface, and Internet of Things interface. These interfaces enabled environmental parameter display, crop growth-stage display, manual/automatic control switching, and remote access. The coordination between the HMI and PLC allowed the system to support both automatic operation and manual intervention.
2.8. System Validation Design and Evaluation Scope
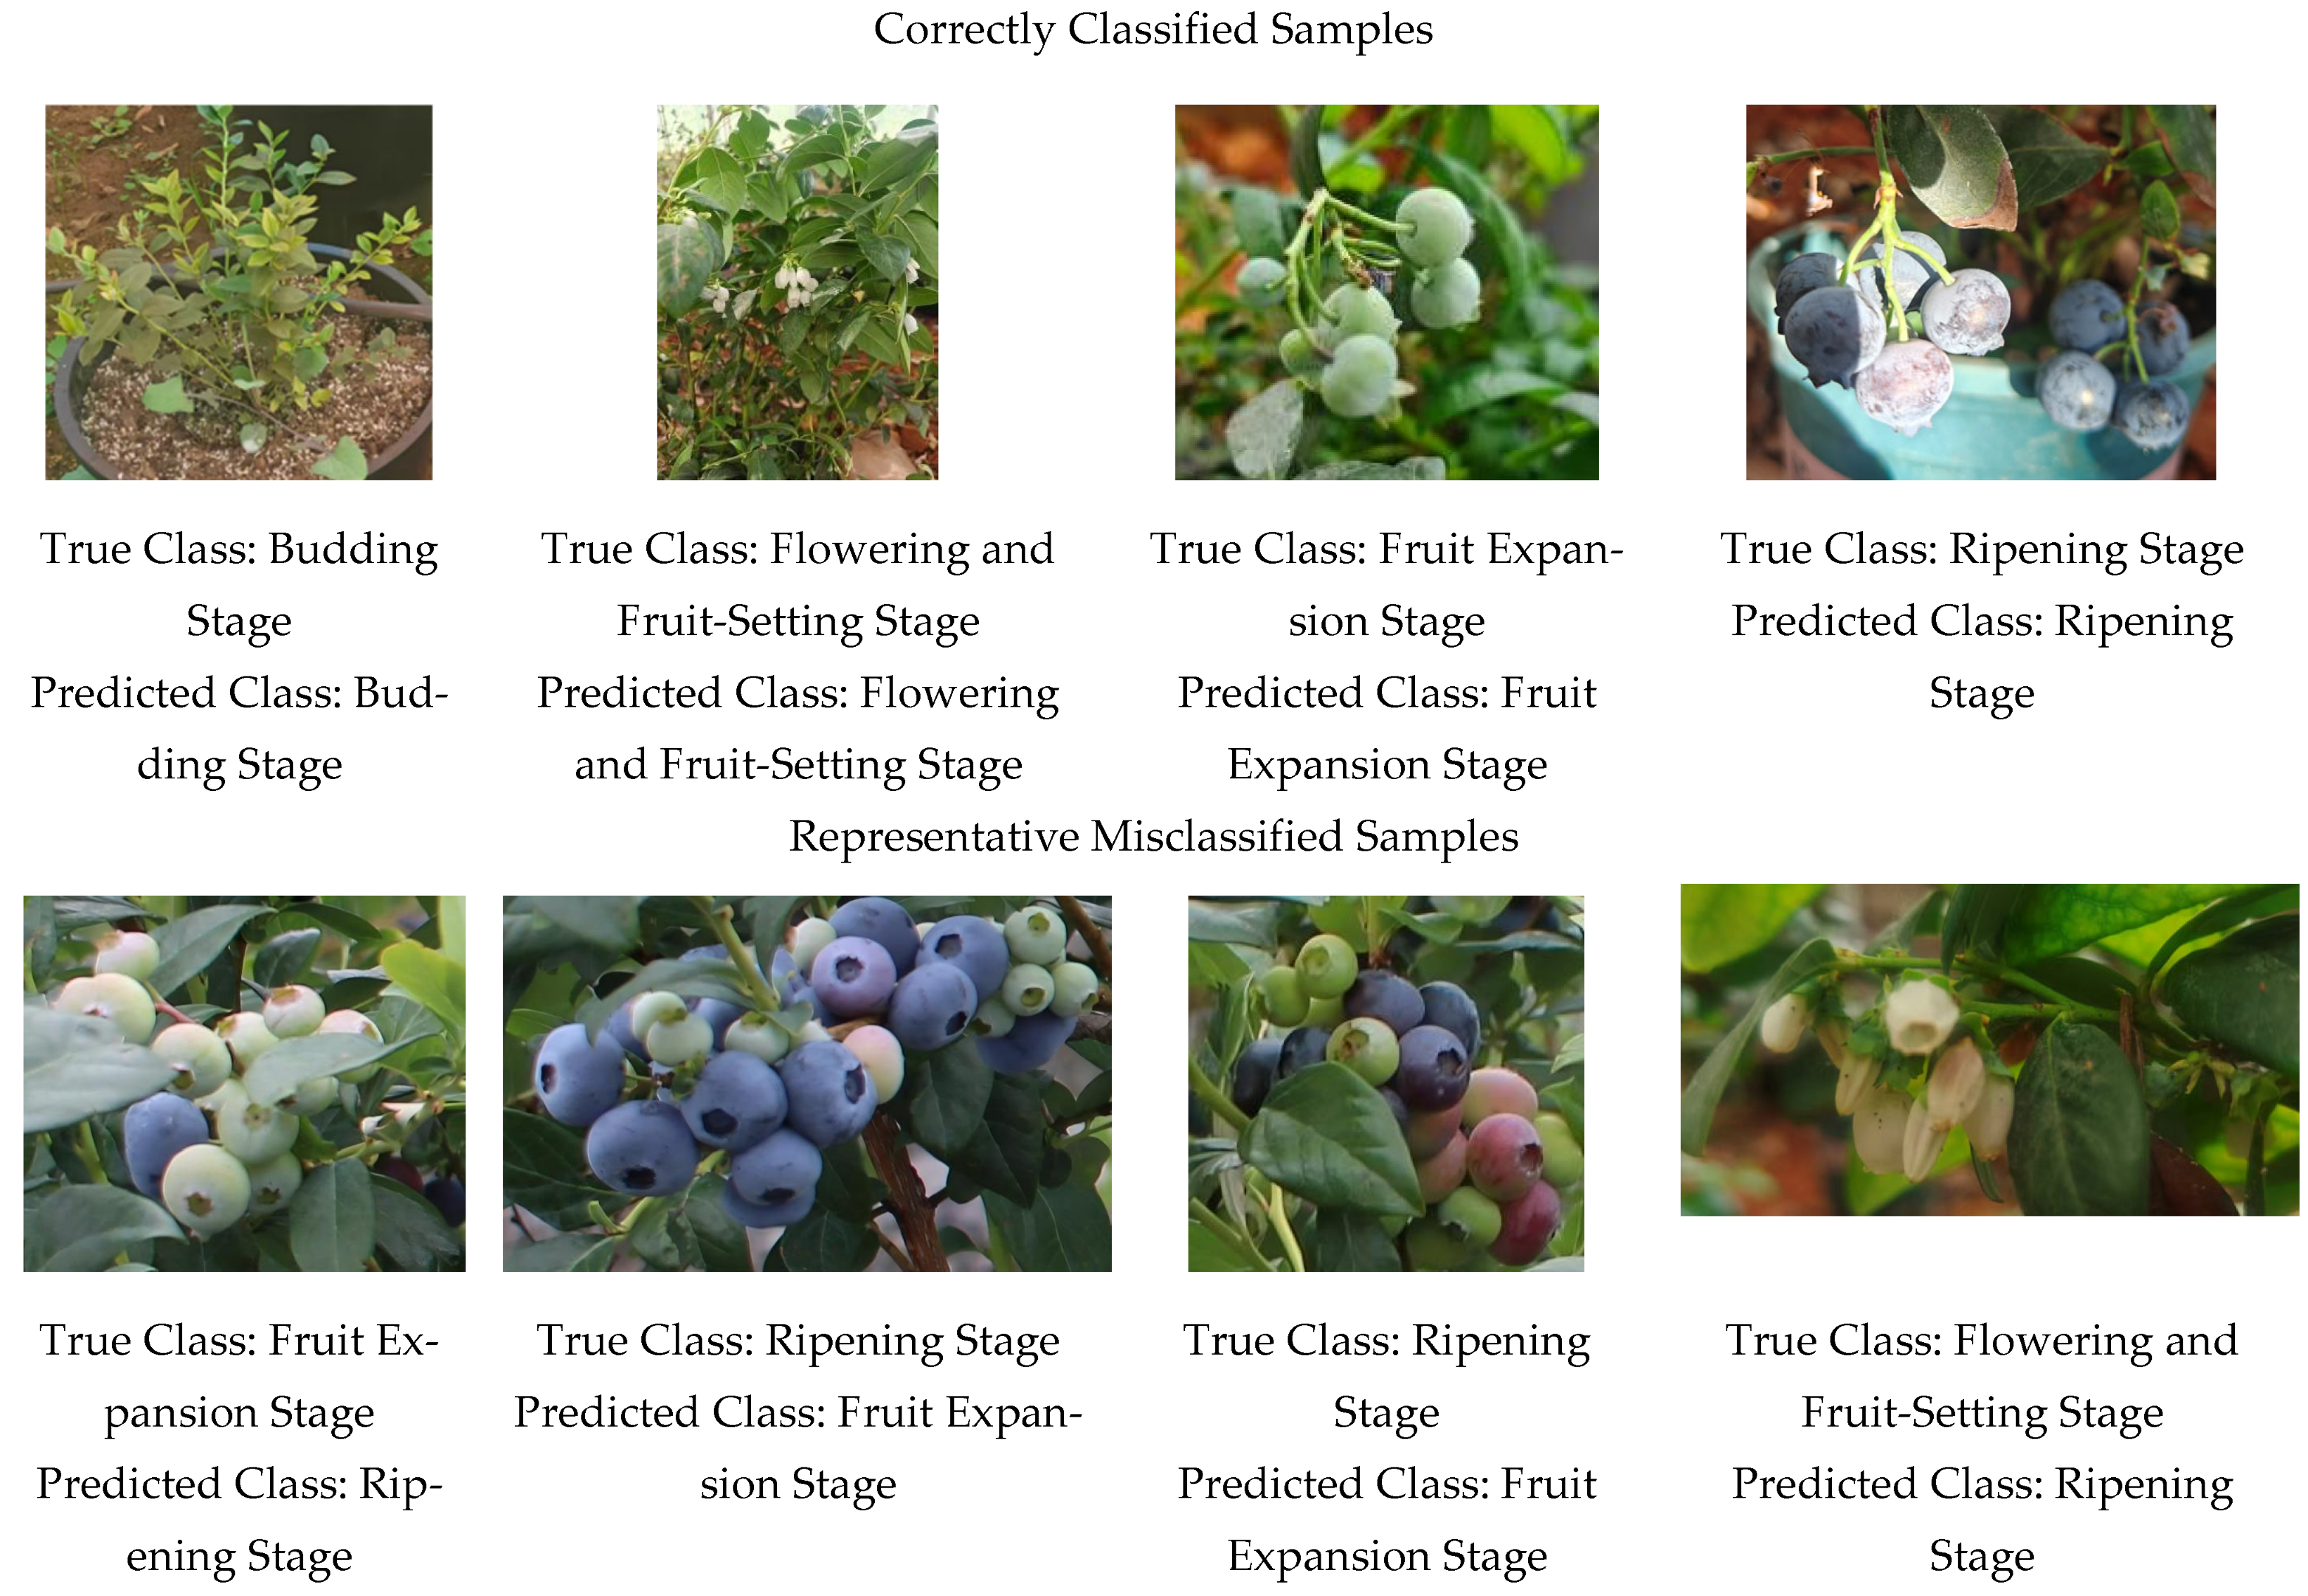
To verify the engineering feasibility of the constructed system in greenhouse blueberry production, this study conducted image-level stage classification evaluation, stage-label output tests, communication-link tests, and system linkage operation tests. The image-level stage classification evaluation was used to quantitatively analyze the ability of the visual module to recognize the major growth stages of blueberry and to compare the performance differences among different lightweight classification models. The stage-label output test was used to verify whether the edge vision module could output labels for different blueberry growth stages. The communication-link test was used to verify whether the stage labels could be transmitted through the K210 serial interface, converted by the STM32 unit, and read by the PLC digital input terminals. The system linkage operation test was used to verify whether the PLC could invoke the corresponding target parameters according to the stage labels and drive the coordinated operation of actuators, including irrigation, fertilizer delivery, supplemental lighting, ventilation, and shading. To visually demonstrate the growth stage classification performance of the vision model, correctly classified samples and representative misclassified samples from the independent test set were selected for comparison in the Results section. These examples were used to illustrate the model’s recognition performance for images representing typical and transitional growth stages.
The evaluation in this study consisted of two main parts. For the visual module, an independent test set was used to calculate Accuracy, Precision, Recall, F1-score, class accuracy, and Macro AP. YOLOv5n-cls, YOLOv8n-cls, YOLO11n-cls, and Tiny-YOLO-cls were compared to improve the transparency of visual module performance evaluation and model selection. For the system linkage process, the evaluation focused on edge-terminal stage-label output status, K210–STM32 serial communication status, STM32 encoding output status, PLC input reading status, HMI display status, stage-specific target parameter invocation status, and actuator response status. These tests were used to determine whether the constructed prototype system had the capability for continuous operation and engineering-level integration.
The visual module evaluation in this study was positioned as an image-level growth-stage classification task, with the evaluation focused on the stage-label determination result of the whole image. Macro AP was calculated in a one-vs-rest manner based on class confidence scores and differs from mAP@0.5 or mAP@0.5:0.95 used in object detection tasks. Because this study focused on verifying the parameter invocation and actuator response process after stage labels entered the PLC control link, object-level detection performance, real-time power consumption of the K210 terminal, KPU resource occupation, and long-term edge-terminal operational reliability were not included as primary evaluation objectives. These indicators will be further examined in subsequent practical deployment studies [
24,
25].
This study did not conduct a complete closed-loop cultivation experiment under real production greenhouse conditions, nor did it include different fertigation treatments, different control modes, or agronomic replications. Therefore, this study did not evaluate agronomic indicators such as water and fertilizer use efficiency, fertilizer application amount, plant physiological responses, fruit yield, fruit diameter, soluble solids content, or fruit quality. The results of this study are only used to demonstrate that the constructed prototype system could complete stage-label input, PLC reading, target-parameter invocation, and actuator response, and should not be extended to indicate that the agronomic effects of fertigation control have been experimentally validated.
The system validation conducted in this study was limited to engineering integration and functional linkage testing on a small-scale greenhouse prototype platform. The evaluation focused primarily on whether the growth stage labels could be incorporated into the PLC control pipeline and used to complete parameter invocation and actuator response. This validation should not be regarded as equivalent to commercial deployment under production-scale greenhouse conditions, nor does it demonstrate the long-term robustness of the system across different greenhouse environments, blueberry cultivars, or full-season crop management scenarios.
4. Discussion
This study focused on the application of blueberry growth-stage recognition results in a PLC-based control system and constructed a small greenhouse prototype platform consisting of an edge vision module, an STM32 encoding unit, a PLC controller, and fertigation actuators. The test results showed that the stage labels output by the edge vision terminal could be converted by the STM32 unit into discrete signals readable by the PLC and used for invoking the corresponding stage-specific target parameters. Unlike studies that only evaluate offline image recognition performance, this study placed greater emphasis on whether recognition results could be introduced into an on-site control system and converted into specific parameter invocation and device-control actions within the PLC.
The visual recognition module is the front-end basis for introducing stage labels into the PLC control link. This study conducted an image-level classification evaluation of blueberry growth stages and compared lightweight classification models, including YOLOv5n-cls, YOLOv8n-cls, YOLO11n-cls, and Tiny-YOLO-cls, under a unified data split and training configuration. The results showed that YOLO11n-cls achieved the highest Accuracy and Macro F1-score on the independent test set, whereas YOLOv8n-cls showed a favorable balance among model scale, Macro AP, and recognition performance. These results indicate that the visual module can convert the major blueberry growth stages into image-level category labels. However, a trade-off remains among recognition accuracy, model size, and engineering deployment complexity. In practical edge deployment, model selection should consider not only classification accuracy on the test set but also model size, edge-side inference speed, resource occupation, power consumption, and system linkage stability.
The class-wise recognition results showed that the model recognized the budding stage and the flowering and fruit-setting stage relatively stably, whereas misclassification was more prominent between the fruit expansion stage and the ripening stage. This phenomenon is closely related to the morphological continuity of blueberry fruit development. During the transition from green fruit expansion to coloration and ripening, green berries, transitional berries, and mature berries often coexist within the same fruit cluster, making the boundary of image-level stage labels less distinct. Previous studies on crop phenology classification have also indicated that the similarity of transitional-stage samples and ambiguous decision boundaries are common factors affecting model stability [
14]. Therefore, for crops such as blueberry with strong developmental continuity in fruit morphology, subsequent dataset construction should not only increase the number of typical-stage samples but also focus on adding transitional samples from the late fruit expansion stage, early coloration stage, and early ripening stage. More refined phenological labels, temporal information, or multi-source sensor information should also be incorporated to improve the stability of stage determination.
In recent years, research on intelligent greenhouse management has gradually shifted from local automation and single-point sensing toward system-level integration driven by multi-source perception, intelligent decision-making, and coordinated execution control [
26]. In this process, the development of autonomous intelligent greenhouse systems has emphasized the integration of the Internet of Things, artificial intelligence, and execution terminals to improve the timeliness and precision of environmental regulation and crop management [
27]. Xinyan Chen et al. demonstrated that combining data-driven models with control strategies in greenhouse environmental control and supplemental lighting decision-making could improve regulation accuracy and reduce resource input [
28]. However, most existing studies still focus on individual links such as environmental regulation, irrigation prediction, or crop-status recognition, whereas insufficient attention has been paid to how crop stage determination results enter the control chain. The main focus of this study was to establish an information interface between visual recognition results and the PLC control program, so that growth-stage recognition results are no longer limited to monitoring and display but can serve as input conditions for PLC-based parameter switching. This process provides a prototype system basis for future closed-loop fertigation experiments in real greenhouse blueberry cultivation. However, this study did not demonstrate that the stage-label-driven approach could improve water and fertilizer use efficiency, plant physiological status, fruit yield, or fruit quality. The results mainly support the usability of the system at the levels of system integration and parameter invocation and should not be directly extrapolated to fertigation control effects or crop growth effects.
The vision-based recognition result was not used as the sole basis for PLC stage-specific parameter invocation. Instead, environmental and substrate sensor information was incorporated for sensor status verification, anomaly detection, and control safety constraints. This design has clear methodological significance. Kuan et al. systematically reviewed machine learning and computer vision in precision agriculture and pointed out that their applications are expanding rapidly, but complex backgrounds, occlusion, illumination variation, and sample heterogeneity remain key factors affecting model stability [
29]. In crop phenology classification studies, similarity among transitional-stage samples and ambiguity in decision boundaries are common problems [
14]. To address these issues, multimodal phenotyping platforms and multi-source data collaborative analysis have been regarded as important approaches for improving the robustness of crop-status determination [
30]. In addition, studies on sensing and monitoring in controlled cultivation scenarios have shown that environmental and rhizosphere parameters can provide necessary contextual information for interpreting crop status [
31]. Accordingly, this study adopted a vision-led growth stage determination strategy constrained by sensor status verification. In essence, environmental consistency constraints were imposed on the stage labels while maintaining the deployability of the system. This approach better reflects the practical requirements of control applications, because the control system requires growth stage labels that are stable, suitable for parameter invocation, and temporally consistent, rather than merely high offline classification accuracy on a test set.
From the perspective of system implementation, the results of this study showed that edge visual recognition results could be integrated into the PLC control program and used for subsequent parameter invocation. In the industrial field, real-time integration of machine vision and PLC-based control has been shown to support deterministic communication and stable execution [
32]. For greenhouse systems, the continuity of actuator control depends not only on the determination algorithm itself but also on whether a stable information transmission and control execution relationship can be established among sensors, communication interfaces, controllers, and actuators. Meanwhile, Karimzadeh et al. further pointed out in a nutrient-solution system that sensor reliability and fault diagnosis capability are also important for precision regulation [
33]. These findings suggest that future greenhouse control systems should not focus only on recognition accuracy but should also strengthen systematic evaluation of the reliability of sensing and communication links.
From the perspective of control logic, after introducing growth-stage labels, the system could invoke target parameter sets corresponding to different growth stages at the PLC level. Compared with a fixed-threshold control mode, this approach differs in that crop developmental stage information is added to the control input, enabling the parameter invocation logic to switch according to stage-label changes. This study further formalized the stage updating process and PLC-based parameter invocation process as a stage-state-driven rule-based control model and clarified the relationships among stage labels, target parameter sets, and actuator states through upper- and lower-limit control functions. This formal expression improves the reproducibility and interpretability of the control logic and clarifies the role of visual recognition results in the industrial control link. This idea is consistent with the direction of adjusting parameters according to crop growth status in precision greenhouse irrigation research [
34]. In addition, Yuanyi Niu et al. reported that considering growth-stage differences in greenhouse supplemental lighting regulation could significantly improve the rationality of target-value setting [
35,
36,
37]. Nevertheless, stage labels serve as an additional information source for PLC-based parameter invocation and do not by themselves demonstrate higher water and fertilizer use efficiency or improved agronomic effects. Because this study did not conduct long-term comparative experiments among different control modes and did not measure water and fertilizer consumption, crop physiological responses, fruit yield, or fruit quality indicators, the logical difference cannot be directly interpreted as an improvement in resource-use efficiency or agronomic performance. Its actual agronomic value still needs to be further verified under real greenhouse blueberry cultivation conditions through full-growth-cycle, multi-treatment, and replicated experiments.
Because the current study was positioned as prototype system construction and engineering feasibility validation, several limitations remain. First, this study conducted an image-level classification evaluation of blueberry growth stages based on an independent test set and reported Accuracy, Precision, Recall, F1-score, Macro AP, and confusion matrix results. However, the test set size was still limited, and the samples were mainly obtained from a single greenhouse scenario and specific cultivation conditions. Future studies should further expand blueberry image datasets across multiple seasons, cultivars, illumination conditions, and occlusion backgrounds to improve model generalization. Second, the evaluation in this study was an image-level stage classification evaluation, with the emphasis placed on the determination of the stage label for the whole image rather than object-level detection performance. Therefore, object detection metrics such as mAP@0.5, mAP@0.5:0.95, localization error, and multi-object occlusion detection ability should be further evaluated under an object detection framework in future work. Third, although this study established the correspondence between blueberry growth stages and PLC-based fertigation parameter invocation targets, the listed soil moisture, EC, and pH ranges were working target ranges for system operation. They were determined mainly based on the literature, the acidic substrate adaptability of blueberry, greenhouse management experience, and preliminary system operation, rather than being optimal parameters obtained through multi-level optimization experiments or sensitivity analysis. Finally, system linkage validation was completed on a small greenhouse prototype platform, which can demonstrate the technical feasibility of the control link and parameter invocation logic but cannot replace long-term cultivation validation in a real production greenhouse. This study did not measure agronomic indicators such as water and fertilizer use efficiency, fertilizer application amount, plant physiological indicators, fruit yield, fruit diameter, soluble solids content, or fruit quality. Therefore, no quantitative conclusions can be drawn regarding water-saving and fertilizer-saving effects, yield improvement, or fruit quality enhancement. Future research should conduct multi-season, multi-treatment, and replicated closed-loop cultivation experiments in real greenhouse blueberry cultivation scenarios and combine full-growth-cycle observation data to systematically evaluate the actual effects of stage-label-driven fertigation control on resource-use efficiency, plant growth, and fruit quality formation.
The principal technical contribution of this study lies in the engineering integration of image-level blueberry growth stage recognition with a PLC-based control pipeline. The developed system enables growth stage labels to be generated by the edge vision module, converted by the STM32 into coded signals readable by the PLC, and subsequently used for stage-specific target parameter invocation and actuator control. The proposed method adopts a growth stage label-driven rule-based control strategy to verify the feasibility of incorporating crop developmental information into an industrial control system, rather than introducing a new deep learning architecture, an optimized fertigation decision model, or an advanced control algorithm. Accordingly, the current results support the engineering feasibility of system integration, parameter invocation, and coordinated actuator operation, but do not demonstrate superior agronomic performance relative to fixed-threshold control, model predictive control, or other optimization-based control methods. Future studies should conduct long-term comparative experiments under actual greenhouse blueberry cultivation conditions and evaluate different control strategies using water and fertilizer consumption, plant physiological responses, yield, and fruit quality as performance indicators.
In addition, the visual model comparison in this study was primarily limited to lightweight YOLO-based image classification variants and did not include systematic comparisons with classification networks such as EfficientNet, MobileNet, Vision Transformer, ConvNeXt, and ResNet. Therefore, the results only characterize the relative performance of the evaluated lightweight YOLO classification models on the current dataset and should not be interpreted as representing the optimal performance achievable by all lightweight image classification networks. Furthermore, only model size, growth stage label output interval, and end-to-end system response time were recorded on the K210 platform. CPU/KPU utilization, memory footprint, per-frame inference speed, power consumption, and long-term operational stability were not comprehensively evaluated. Consequently, edge-side computational efficiency, potential energy-efficiency advantages, and long-term deployment stability require further assessment under practical deployment conditions.
5. Conclusions
This study constructed a small-scale prototype system for greenhouse blueberry growth-stage recognition and PLC-based fertigation parameter invocation. The system consisted of an edge vision module, an STM32 encoding unit, a PLC controller, an HMI interface, and fertigation actuation devices. The system could acquire greenhouse environmental parameters, substrate parameters, and blueberry image information, output blueberry growth-stage labels through the edge vision module, and convert the stage labels into 8421-coded discrete signals readable by the PLC through the STM32 unit. After reading the stage codes, the PLC could invoke the corresponding target parameters for soil moisture, EC, pH, and fertigation management at each stage, and drive the irrigation, fertilizer delivery, supplemental lighting, ventilation, and shading devices.
The image-level classification evaluation results showed that different lightweight YOLO classification models exhibited different performance levels in recognizing the major growth stages of blueberry. Among them, YOLO11n-cls achieved the highest Accuracy and Macro F1-score on the independent test set, reaching 85.71% and 84.81%, respectively. YOLOv8n-cls achieved an Accuracy, Macro F1-score, and Macro AP of 80.95%, 81.10%, and 91.25%, respectively, showing a favorable balance among recognition performance, model scale, and engineering deployment complexity. The confusion matrix results showed that misclassifications mainly occurred between the fruit expansion stage and the ripening stage, indicating that the transitional period of blueberry fruit development remains a key focus for subsequent dataset expansion and model optimization.
The system test results showed that data transmission, encoding conversion, PLC reading, HMI display, parameter invocation, and actuator response among the K210, STM32, and PLC could all be completed normally. The edge-terminal determination and output time was 500–1000 ms, and the remote-control response delay was 0.3–1.0 s. No obvious communication interruption, command loss, or abnormal shutdown occurred during system operation. These results indicate that blueberry growth-stage recognition results can be used as input conditions for PLC-based parameter invocation and device-control testing on a small-scale prototype platform.
The scope of validation in this study was primarily limited to prototype-level feasibility testing of visual growth stage recognition, STM32-based encoding conversion, PLC parameter invocation, and coordinated actuator operation. Because neither a complete closed-loop cultivation experiment under production-scale greenhouse conditions nor a long-term comparative blueberry cultivation trial was conducted, no quantitative conclusions are drawn regarding improvements in water and fertilizer use efficiency, reductions in fertilizer application, increases in yield, or enhancements in fruit quality. Future research should expand the blueberry image dataset to include multiple seasons, cultivars, and greenhouse environments; supplement the evaluation of K210-side resource utilization, inference speed, power consumption, and long-term operational stability; and conduct full-growth-cycle, multi-treatment, and replicated closed-loop cultivation experiments under actual production-scale greenhouse conditions. Only after obtaining agronomic indicators such as water and fertilizer consumption, plant physiological responses, fruit yield, berry size, soluble solids content, and fruit quality can the actual effects of growth stage label-driven fertigation control on blueberry growth and resource-use efficiency be comprehensively evaluated.




 ,
,