Article

UAV Multispectral Estimation of Citrus Leaf Nitrogen Content by Integrating Object-Based Canopy Extraction and PSO-Optimized Machine Learning
1
School of Water Conservancy, North China University of Water Resources and Electric Power, Zhengzhou 450046, China
2
College of Hydraulic & Environmental Engineering, China Three Gorges University, Yichang 443002, China
*
Author to whom correspondence should be addressed.
Agriculture 2026, 16(15), 1570; https://doi.org/10.3390/agriculture16151570
Submission received: 1 June 2026 / Revised: 17 July 2026 / Accepted: 17 July 2026 / Published: 23 July 2026
(This article belongs to the Topic AI in Optical Spectroscopy Analysis)

Abstract

Leaf nitrogen content (LNC) is an important physiological indicator for evaluating citrus nutritional status, photosynthetic capacity, and fertilization demand. However, conventional LNC determination mainly relies on field sampling and laboratory chemical analysis, which are destructive, time-consuming, labor-intensive, and limited in spatial continuity, making them unsuitable for large-scale real-time nitrogen monitoring in complex orchard environments. To achieve rapid and non-destructive estimation of citrus LNC, this study developed a UAV multispectral inversion framework integrating object-based canopy extraction and machine learning models. Field experiments were conducted in a citrus orchard in western Hubei Province, China. Multi-temporal UAV multispectral images were collected from April to October 2025, and ground measurements of citrus LNC were collected simultaneously. First, minimum distance classification (MDC), maximum likelihood classification (MLC), and object-based image analysis (OBIA) were used for land-cover classification of citrus orchard images, and their canopy extraction performance under complex orchard backgrounds was compared. Subsequently, multiple vegetation indices were calculated from the extracted citrus canopy spectra, and sensitive spectral features were selected through correlation analysis. Finally, seven models, including simple linear regression, quadratic regression, partial least squares regression (PLS), back propagation neural network (BP), extreme learning machine (ELM), particle swarm optimization-extreme learning machine (PSO-ELM), and particle swarm optimization-back propagation neural network (PSO-BP), were constructed to systematically evaluate the inversion performance of citrus LNC across the entire growth period. The results showed that: (1) OBIA achieved higher classification accuracy and temporal stability in citrus orchard land-cover classification, with overall accuracy ranging from 68.86% to 85.65% and Kappa coefficients ranging from 0.56 to 0.72, outperforming MDC and MLC. This indicates that OBIA can effectively reduce the interference of bare soil, grass, shadows, and other non-target objects on canopy spectral extraction. (2) The correlations between vegetation indices and LNC varied markedly among different growth stages, suggesting that the spectral response of citrus LNC has strong phenological dependence and that a single vegetation index is insufficient to stably characterize LNC variation across the whole growth period. (3) At the whole-growth-period scale, multi-index fusion models outperformed single-index models, among which EVI, TVI, and MTVI showed relatively strong cross-stage sensitivity. (4) Optimized machine learning models generally outperformed traditional regression models and unoptimized machine learning models. Among them, PSO-BP achieved the best performance, with a validation R2 of 0.68 and an RMSE of 1.54 g kg−1, representing an increase in R2 of 23.64% compared with the PLS model and 25.93% over the baseline BP model in terms of R2. Overall, this study demonstrates that OBIA-based canopy spectral quality improvement combined with PSO-optimized machine learning can effectively improve the stability and reliability of UAV multispectral estimation of citrus LNC under complex orchard backgrounds. The proposed framework provides technical support for citrus nitrogen diagnosis, precision fertilization, and intelligent orchard management.

1. Introduction

Citrus is an important fruit crop with extensive cultivation area, high consumption, and active international trade, and contributes significantly to agricultural production, regional economic development, and modern agricultural system development [1,2]. In China, citrus production is mainly distributed in the hilly and mountainous regions of southern China. However, limited irrigation conditions, frequent seasonal droughts, and imbalanced nutrient supply have constrained citrus tree vigor, fruit development, and the stability of yield and quality [3,4]. Crop physiological and biochemical parameters are important indicators for characterizing plant growth status and its temporal dynamics, and they are also core targets in agricultural remote sensing monitoring [5]. Real-time monitoring of crop physicochemical parameters can effectively identify water and nitrogen deficiencies as well as growth stress information, thereby providing a basis for precision agricultural management [6]. Leaf nitrogen content (LNC), as a key physiological indicator reflecting crop nitrogen nutritional status, photosynthetic capacity, and tree growth condition, is closely associated with crop growth, development, and yield formation [7,8]. Conventional LNC determination mainly relies on field sampling and laboratory chemical analysis. Although these methods provide high measurement accuracy, they are destructive, labor-intensive, time-consuming, and difficult to apply to large-scale continuous monitoring, making them insufficient for the requirements of precision orchard management [9]. In recent years, unmanned aerial vehicle (UAV) remote sensing has become an important tool for rapid crop growth parameter retrieval and nutritional status diagnosis owing to its high spatial resolution, flexible observation capability, and non-destructive monitoring advantages [10,11]. Meanwhile, integrating multi-source remote sensing data with machine learning methods to construct crop physiological parameter retrieval models can further improve feature extraction from high-dimensional spectral data and enhance modeling accuracy, providing a new technical pathway for rapid nitrogen monitoring in orchards [12].
With the development of agricultural production toward intelligent and precision agriculture, UAV remote sensing has been widely applied in fruit tree growth monitoring, nutrient diagnosis, pest and disease detection, yield estimation, and variable-rate fertilization decision-making [13,14]. Compared with satellite remote sensing and conventional aerial platforms, UAV platforms have the advantages of relatively low cost, high mobility, reduced susceptibility to cloud and atmospheric interference, and the ability to acquire multi-temporal high-resolution observations, thereby better meeting the requirements of fine-scale orchard monitoring [15]. In practical applications, deriving vegetation indices from UAV multispectral imagery is a commonly used approach for retrieving physiological parameters such as crop nitrogen status, chlorophyll content, and biomass. Previous studies have shown that vegetation indices can enhance the relationship between physiological parameters and specific spectral bands, while reducing the influence of external factors such as soil background, illumination conditions, and viewing geometry on spectral information [16,17]. At present, researchers have used UAV multispectral imagery and machine learning algorithms to estimate nitrogen or chlorophyll content in fruit trees such as grapevine, citrus, and pear, demonstrating the potential of UAV remote sensing for fruit tree nutrient monitoring [18]. Nevertheless, existing studies still face several challenges. For example, reported coefficients of determination (R2) for UAV multispectral-based LNC estimation in fruit trees generally range from approximately 0.60 to 0.85 depending on crop species, growth stage, and spectral features, while model performance often declines under heterogeneous orchard backgrounds due to canopy-background spectral mixing [19,20]. In addition, most existing studies focus on optimizing spectral features or machine learning algorithms individually, whereas relatively few have systematically integrated canopy extraction, spectral feature optimization, and model construction into a unified workflow, leading to challenges such as complex data processing procedures, limited model generalization ability, and reduced accuracy of canopy spectral extraction under heterogeneous orchard backgrounds.
In high-resolution UAV imagery, the accuracy of land-cover classification and canopy extraction directly affects subsequent spectral feature extraction and retrieval of physiological parameters. Traditional remote sensing image classification methods, such as Minimum Distance Classification, Mahalanobis Distance Classification, and Maximum Likelihood Classification, mainly rely on pixel-level spectral information for discrimination [21]. However, UAV imagery generally has high spatial resolution, where a single land-cover object is usually represented by multiple pixels, and intra-class spectral variability and spatial structural complexity are enhanced. This may lead to “spectral variability within the same class” and “spectral similarity between different classes” phenomena, resulting in spectral confusion, object occlusion, shadow effects, and salt-and-pepper noise [22]. Previous studies have shown that object-based methods can comprehensively utilize spectral, shape, texture, and spatial structural features, and generally achieve higher classification accuracy and better classification stability than traditional pixel-based methods [23,24,25]. The essence of UAV remote sensing image extraction lies in selecting appropriate classification methods to identify and classify image pixels or target objects [26]. Therefore, in the preprocessing of UAV remote sensing imagery for citrus orchards, improving land-cover classification accuracy, effectively removing non-target background information, and optimizing canopy spectral information quality are key prerequisites for accurate inversion of citrus LNC.
Multispectral remote sensing inversion of LNC has been widely conducted in annual crops such as rice, wheat, maize, and potato, and has gradually developed toward quantitative and refined monitoring [27]. Studies have shown that the sensitive vegetation indices corresponding to crop LNC differ among growth stages, and multi-index modeling generally improves estimation accuracy and robustness [28]. Compared with annual crops, perennial woody fruit trees such as citrus have more complex canopy structures, multiple layers of branches and leaves, greater individual tree variability, and continuous nitrogen transport and redistribution among roots, trunks, branches, leaves, and fruits. As a result, the relationship between citrus LNC and canopy reflectance is more susceptible to phenological stage, tree structure, and orchard background conditions [29,30,31]. At present, studies on remote sensing inversion of citrus leaf nitrogen are still mainly focused on the detached leaf, single-leaf, or single-growth-stage canopy scale, while research on multi-temporal citrus canopy spectral extraction and LNC inversion under complex orchard backgrounds remains relatively limited [32,33]. Compared with previous studies that mainly focus on vegetation index optimization or machine learning model improvement, relatively few studies have explicitly considered the impact of canopy extraction quality on subsequent LNC inversion under heterogeneous orchard environments. To address this limitation, this study integrates canopy extraction, spectral feature construction, and machine learning modeling into a unified UAV multispectral inversion framework for citrus LNC estimation. This framework enables a systematic evaluation of how canopy spectral quality improvement influences inversion performance across different growth stages. In addition, unlike most existing studies conducted at single growth stages or limited temporal scales, this study performs multi-temporal analysis across the whole citrus growth period, providing a more comprehensive understanding of phenological effects on spectral–nitrogen relationships. This is particularly important in complex orchard environments where bare soil, grass, plastic mulch film, shadows, and field facilities can introduce significant spectral contamination, thereby affecting the reliability of canopy-based nitrogen inversion.
Based on these considerations, this study uses UAV multispectral imagery of a citrus orchard and measured LNC data to investigate canopy spectral extraction and LNC inversion under complex orchard backgrounds. First, minimum distance classification, maximum likelihood classification, and object-based image analysis are applied to classify UAV imagery of the citrus orchard, and the applicability of different classification methods for identifying citrus canopies, bare soil, grass, and other land-cover types is compared. Second, citrus canopy multispectral information is extracted based on the classification results with relatively higher accuracy, and multiple vegetation indices are calculated to analyze the relationships between vegetation indices and LNC across different growth stages. Finally, univariate regression, partial least squares regression, and machine learning inversion models are constructed and compared to evaluate the application potential of UAV multispectral data based on object-based canopy extraction for citrus LNC inversion.
This study aims to establish a UAV multispectral monitoring workflow for complex orchard backgrounds, including land-cover classification, canopy extraction, spectral feature selection, and LNC inversion, and to clarify the role of object-based image analysis in improving citrus canopy spectral information quality and LNC inversion stability. The results are expected to provide technical support for rapid nitrogen nutritional diagnosis, precision fertilization, and intelligent orchard management in citrus orchards, and to provide a reference for UAV remote sensing inversion of physiological parameters in perennial fruit trees under complex background conditions.

2. Materials and Methods

2.1. Overview of the Study Area

The experiment was conducted in 2025 at the Smart Irrigation Experimental Station of China Three Gorges University, located in Xiling District, Yichang City, Hubei Province, China (30°41′ N, 110°20′ E; altitude: 343 m). The study area is characterized by a mid-latitude subtropical continental monsoon climate. The groundwater table in the experimental area is deeper than 25 m; therefore, its influence on soil water movement and crop physiological responses at the surface is assumed to be negligible. To ensure consistency in experimental management, all cultivation practices, including pest and disease control, pruning, and other orchard management measures, were kept consistent with routine orchard management, except for the irrigation treatments.
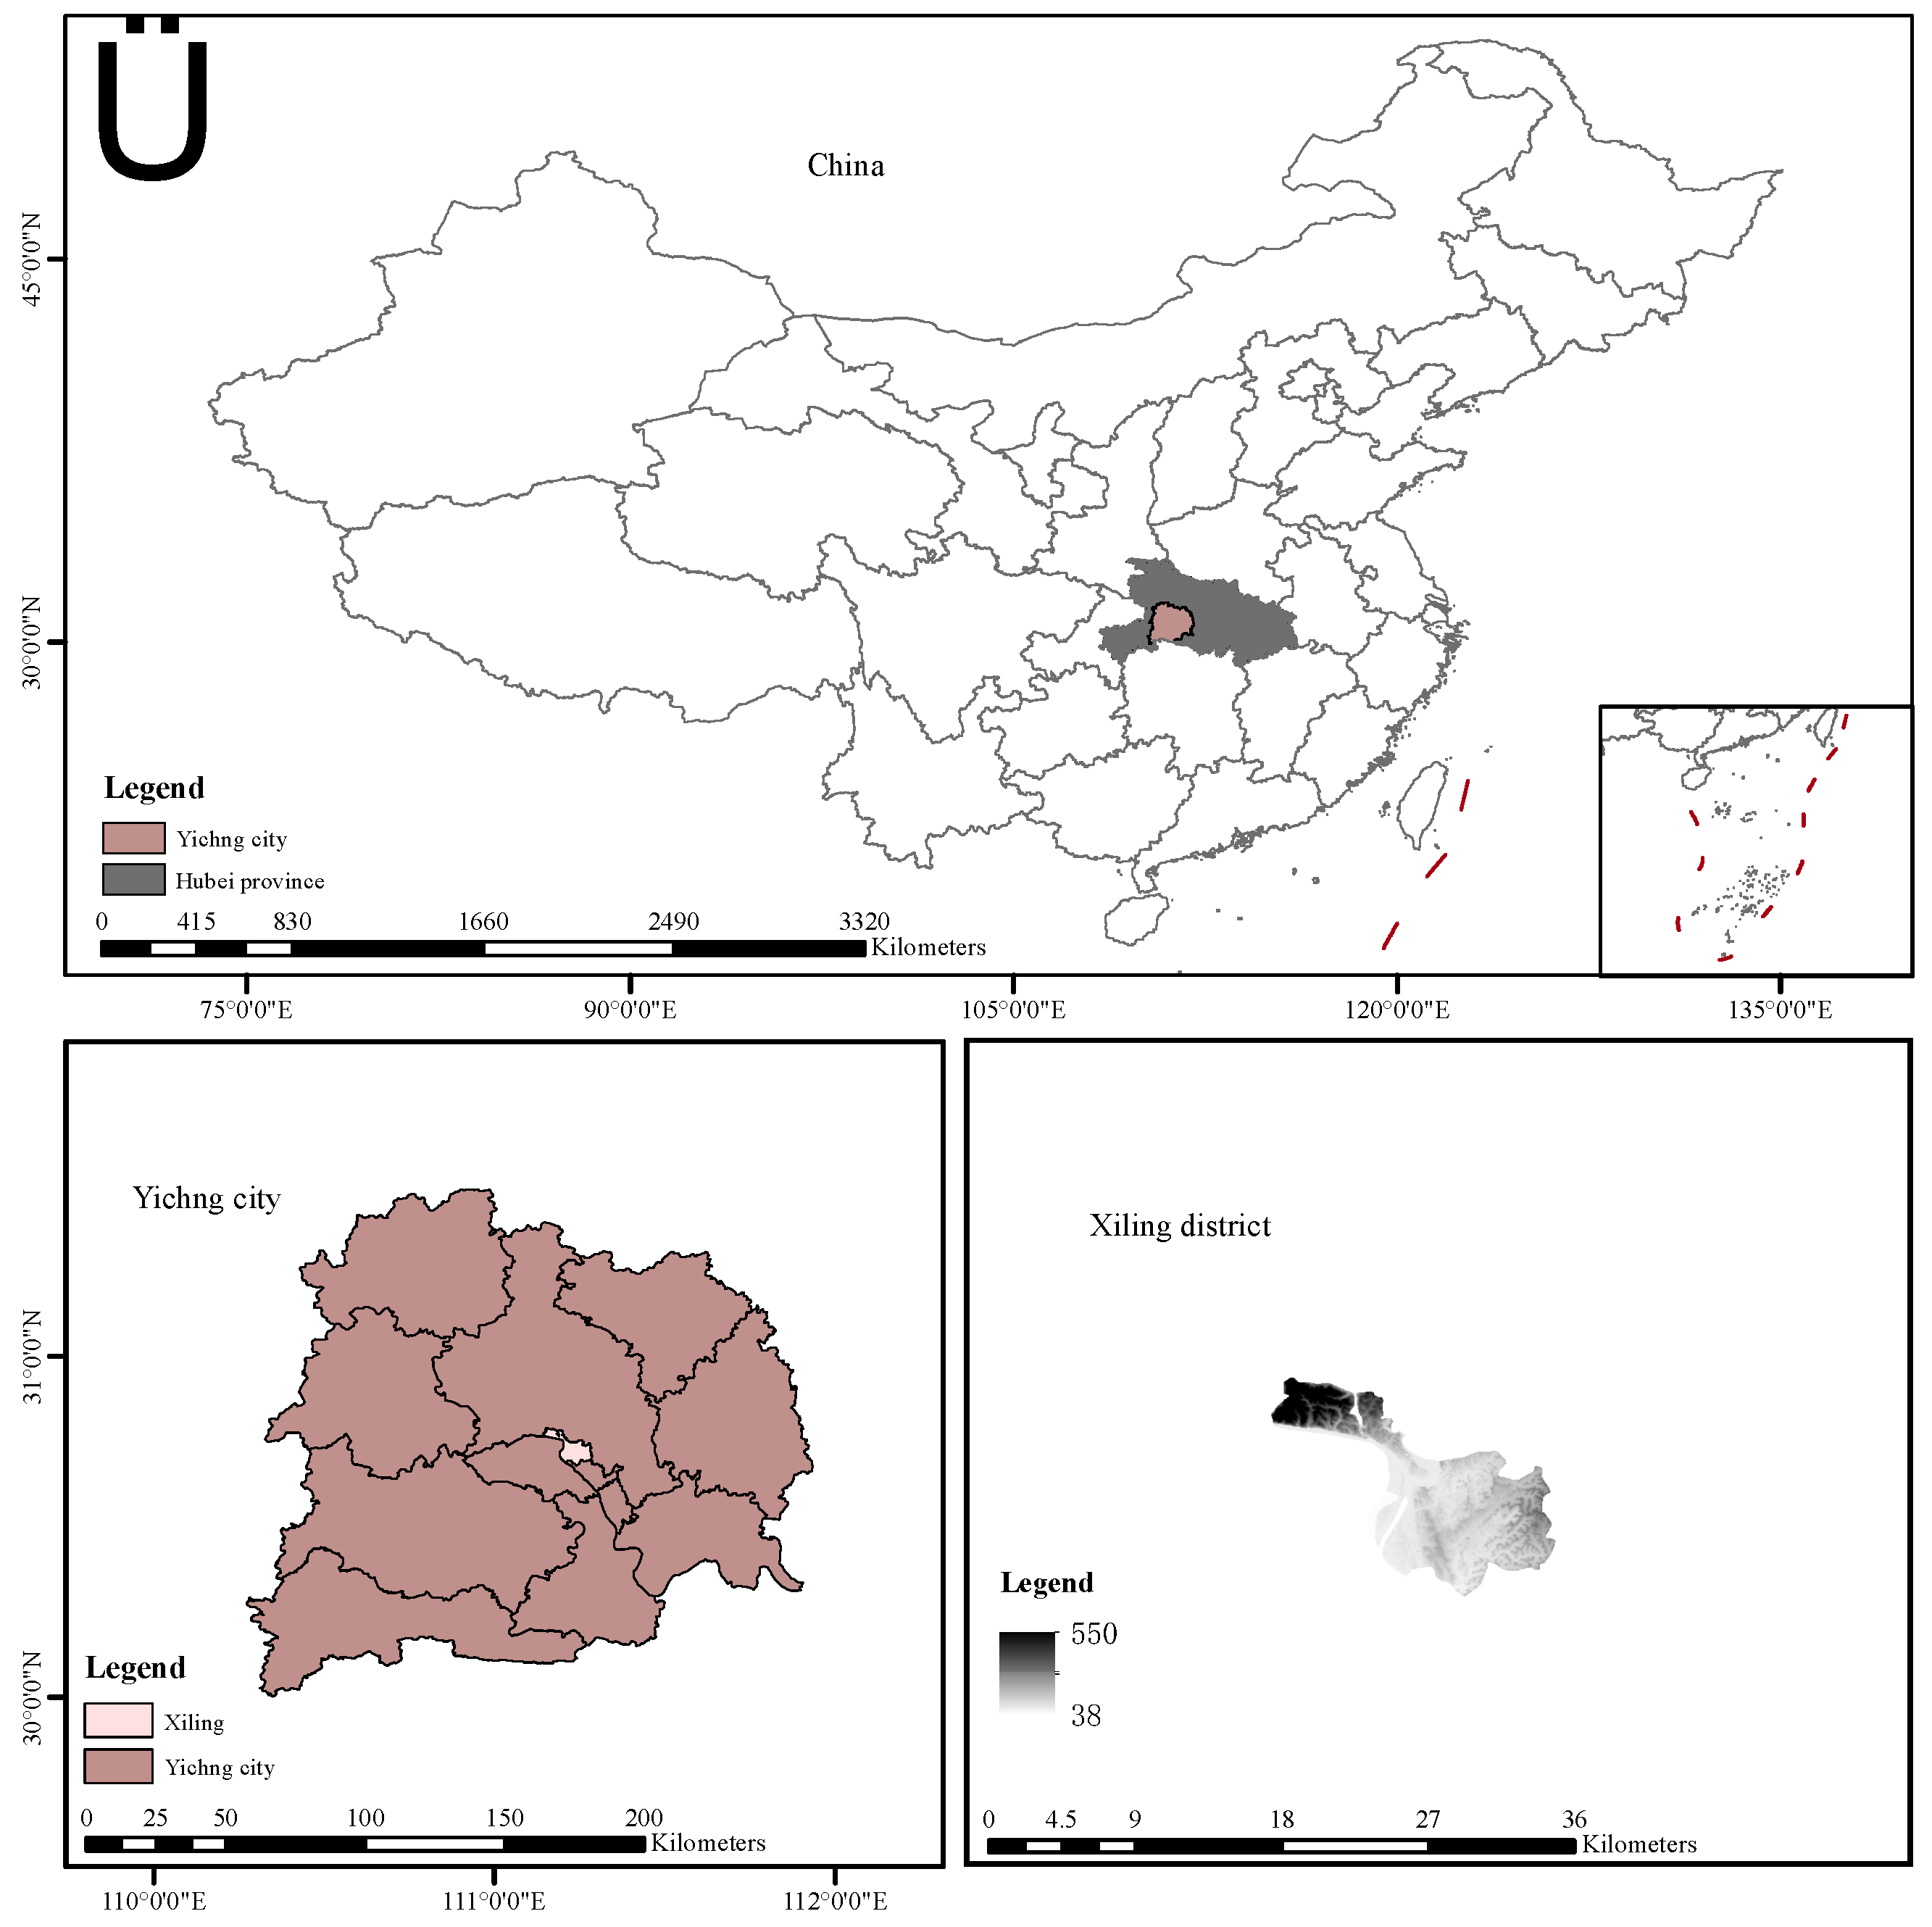
The experimental site is located in a typical subtropical monsoon climate zone, with a multi-year mean air temperature of 17.53 °C and an annual mean relative humidity of 74.49%. The orchard soil is classified as brown soil. The occupied area per citrus tree was 12 m2. The basic soil physical properties and fertility characteristics were as follows: soil bulk density was 1.48 g cm−3; field capacity was 25.7% on a mass water content basis; available N, P, and K contents were 1.32, 1.84, and 14.54 g kg−1, respectively; soil organic matter content was 15.6 g kg−1; and soil pH was 5.6. The plant material was 13-year-old Yichang mandarin trees (Citrus reticulata Blanco), planted at a spacing of 4 m × 3 m, with relatively uniform growth conditions. The geographical location of the study area is shown in Figure 1.

2.2. Experiment Design and Ground Data Collection

Four irrigation treatments were established in this experiment, including full irrigation (W1: 80–90% of field capacity), mild water deficit (W2: 70–80%), moderate water deficit (W3: 60–70%), and severe water deficit (W4: 50–60%), to represent different soil water conditions affecting citrus growth. In addition, two nitrogen application levels were established, including a low nitrogen treatment (N1: 150 kg ha−1) and a high nitrogen treatment (N2: 300 kg ha−1) [34,35]. The experimental design combining irrigation and nitrogen treatments is presented in Table 1. Urea (46% N), monopotassium phosphate (52% P2O5 and 34% K2O), and potassium sulfate (50% K2O) were used as fertilizer sources. Based on previous studies and local high-yield orchard management practices, phosphorus fertilizer was applied once as a basal fertilizer before bud emergence. Nitrogen fertilizer was applied in four splits, accounting for 50% as basal fertilizer, 15% during the budding and flowering stage, 15% during the young fruit stage, and 20% during the fruit expansion stage. Potassium fertilizer was applied in two splits, with 33.4% as basal fertilizer and the remaining 66.6% during the fruit expansion stage. Each irrigation–nitrogen treatment combination was replicated three times to ensure the representativeness and statistical reliability of the experimental data. Irrigation was applied using a surface drip irrigation system. Drippers were installed 0.4 m away from the tree trunk in the east, south, west, and north directions, respectively. The discharge rate of each dripper was 2 L h−1, and the operating pressure of the system was maintained at 0.1 MPa. Irrigation volume was precisely controlled using a water meter. Except for the irrigation and nitrogen treatments, all other cultivation practices, including pest and disease control, pruning, and routine orchard management, were carried out according to local standard orchard management practices to ensure consistency and reproducibility of the experimental conditions.
To ensure data independence and avoid potential data leakage, a tree-level sampling strategy was adopted in this study. A total of 27 citrus trees were initially selected, and 18 trees were randomly chosen for model development. For each selected tree, three replicate measurements were collected to ensure sampling robustness. Among these replicates, two were used for model calibration and validation, while the remaining replicate was reserved exclusively for independent checking and was not involved in any stage of model training or performance evaluation. This strategy ensured that samples from the same tree were not simultaneously included in both training and validation sets, thereby maintaining strict independence between datasets. During each sampling campaign, mature leaves were systematically collected from the outer canopy in the east, west, south, and north directions. A total of 12 leaves were collected from each tree to ensure sample representativeness. Ground measurements were conducted from 8 April to 27 October 2025, at intervals of 17–20 days. All measurements were carried out under clear-sky natural illumination conditions between 10:00 and 12:00 local time. Each ground sampling campaign was conducted synchronously with UAV multispectral image acquisition to ensure spatial and temporal matching between ground observations and remote sensing data. After outlier removal, a total of 216 valid ground-based LNC observations were obtained throughout the experimental period. Leaf samples collected for laboratory analysis were first washed sequentially with tap water and distilled water to remove surface contaminants. The samples were then enzyme deactivated at 105 °C for 30 min and subsequently oven-dried at 80 °C until constant weight was achieved. The dried leaf samples were ground and passed through a 0.45 mm sieve to obtain uniform powder samples for chemical analysis. Leaf nitrogen content (LNC) was determined using the Kjeldahl digestion method, and quantified using a Smartchem 450 automated discrete analyzer (AMS Alliance, Rome, Italy).

2.3. UAV Multispectral Data Acquisition and Processing

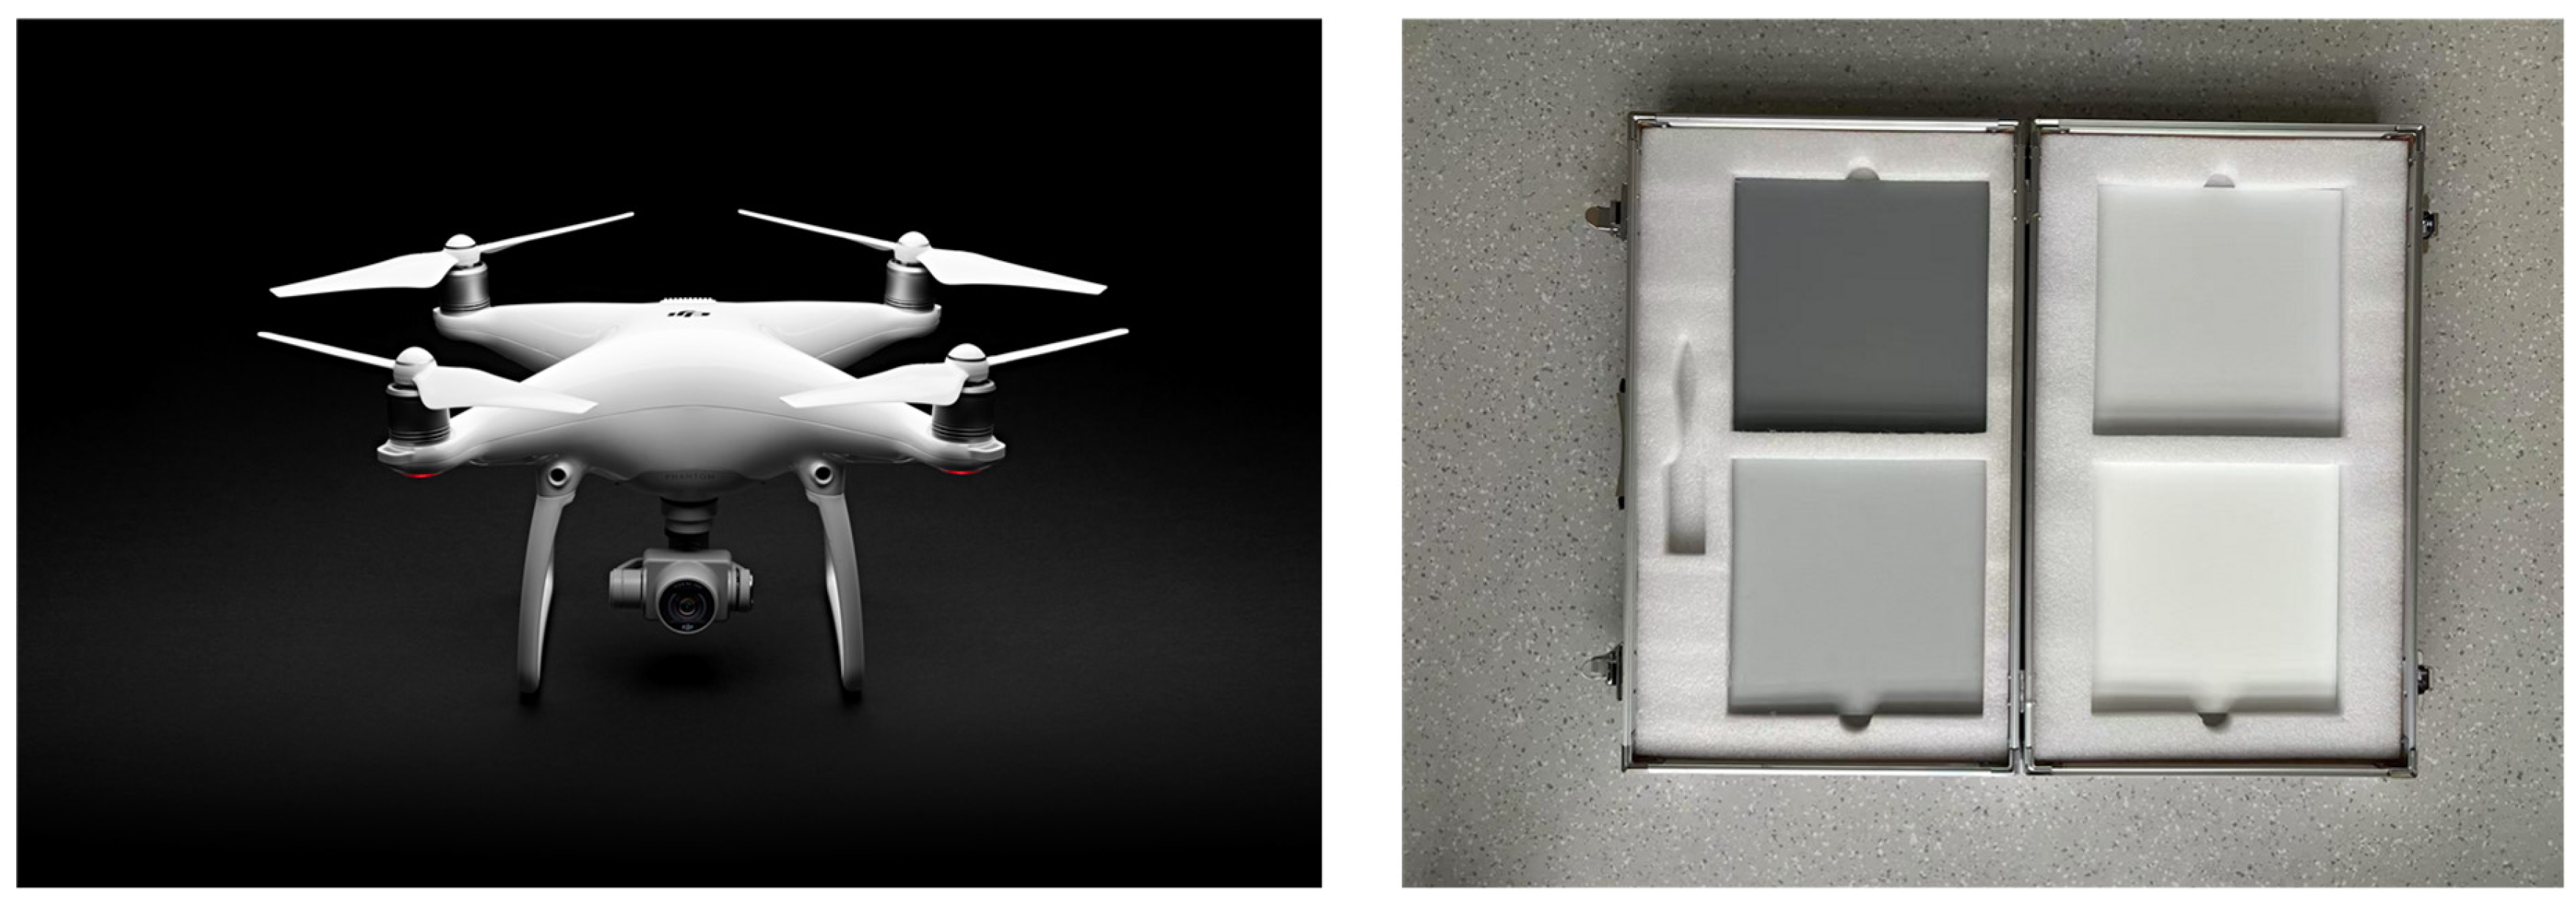
Spectral data were acquired using a DJI Phantom 4 Multispectral (P4M) UAV (SZ DJI Technology Co., Ltd., Shenzhen, China). The multispectral imaging system mounted on the UAV consists of one RGB sensor and five monochrome narrowband sensors, with detailed parameters listed in Table 2. To ensure the quality of spectral data, several pre-flight tests were conducted before formal image acquisition to optimize the flight parameter settings. The final flight scheme was determined as follows: both forward and side overlaps were set to 80%, the flight altitude was 29 m, corresponding to a ground sampling distance of 1.6 cm, and the flight mode combined waypoint navigation with nadir image acquisition along the main flight route. The main UAV flight parameters are shown in Table 3.
Radiometric calibration was performed using a MAPIR Spectral Reflectance Calibration Panel (MAPIR, Inc., San Diego, CA, USA), which consists of four diffuse reflectance panels with different known reflectance values (Figure 2). Before acquiring multispectral images of the citrus orchard, the calibration panel was horizontally placed on a flat ground surface. The UAV was then manually controlled to fly to a vertical height approximately seven times the panel dimension, where calibration panel images were collected.
Under favorable illumination and stable environmental conditions, calibration panel images were first acquired before each flight for subsequent radiometric correction. To reduce background interference and improve the accuracy of spectral measurements, supplementary images were collected using a handheld multispectral camera aimed vertically at the canopy samples under controlled environmental conditions, ensuring that the extracted reflectance data could accurately represent the spectral characteristics of the leaf surface. Image stitching, distortion correction, and radiometric calibration were performed using DJI Terra software V4.3.0, while extraction of the five spectral bands was conducted using ENVI 5.3.

2.4. Vegetation Index Selection

Crop spectral responses are jointly influenced by species, cultivar characteristics, and growth stages. Differences in physiological and biochemical properties among crop species or among phenological stages within the same crop can lead to marked variations in spectral reflectance across the electromagnetic spectrum. In particular, dynamic changes in physiological and structural parameters such as leaf nitrogen content, chlorophyll content, and canopy structure directly affect the absorption and reflection of radiation in specific spectral regions, including the visible, red-edge, and near-infrared bands, thereby altering the shape and intensity of canopy spectral reflectance curves [36]. Therefore, constructing sensitive spectral indicators based on multispectral reflectance characteristics is an important basis for remote sensing inversion of crop physiological parameters.
The vegetation index (VI) is a spectral indicator constructed by mathematically combining reflectance data from different bands acquired by multispectral or hyperspectral remote sensing sensors. It can enhance vegetation signals, reduce interference from external factors such as soil background and illumination conditions, and, characterize vegetation growth status and physiological traits. Appropriate band combinations are facilitate the extraction of key biophysical information related to crop growth, nutritional status, biomass accumulation, and stress responses, thereby providing quantitative support for agricultural monitoring, crop classification, and physiological parameter inversion. Considering the close relationships among leaf nitrogen content, chlorophyll synthesis, photosynthesis, and canopy spectral response, the vegetation indices selected in this study cover spectral regions closely associated with vegetation nutritional status, including the visible, red-edge, and near-infrared bands, to enhance the sensitivity of the models to variations in citrus leaf nitrogen content. Based on previous studies [37,38,39], several vegetation indices closely related to crop nitrogen nutrition and canopy spectral response were selected for subsequent analysis. The names of the indices and their corresponding band combinations are listed in Table 4.

2.5. Land-Cover Classification of Citrus Orchard Remote Sensing Images

Because different land-cover types may exhibit spectral similarity in the visible and multispectral bands, and because citrus canopies are spatially discontinuous, directly extracting canopy spectral information from original images may be affected by non-target background objects. This may further influence subsequent vegetation index calculation and the accuracy of leaf nitrogen content inversion. Therefore, land-cover classification was first conducted on citrus orchard remote sensing images, and citrus canopy regions were then extracted for subsequent spectral feature analysis.
Based on visual interpretation of the true-color orthophotos of the citrus orchard, training samples for different land-cover types were established using the Regions of Interest (ROI) function in ENVI software. According to the actual land-cover characteristics of the study area, the image objects were classified into four categories: citrus canopy, grass, bare soil, and other objects. The “other objects” category mainly included ground cloth, roads, field data acquisition equipment, and other non-vegetation or non-target objects. To ensure the representativeness of training samples, ROI samples were uniformly selected from different land-cover distribution areas, with approximately 30 ROIs established for each class. The class attributes of the samples were determined through manual visual interpretation.
To compare the applicability of different classification methods under complex orchard backgrounds, minimum distance classification (MDC), maximum likelihood classification (MLC), and object-based image analysis (OBIA) were applied to classify UAV images of the citrus orchard. MDC is a supervised classification method based on the distance between the spectral mean vectors of different classes. It calculates the distance between each pixel to be classified and the mean vector of each training class, and assigns the pixel to the class with the minimum distance [40]. This method is simple in principle and computationally efficient, but it is sensitive to intra-class spectral variability and land-cover mixing. MLC is based on the mean vectors and covariance matrices of training samples for each class. It assumes that the spectral features of each class follow a normal distribution and performs classification according to the maximum posterior probability criterion. Compared with MDC, MLC can account for the spectral variance and covariance characteristics within each class and therefore has relatively stronger discriminative ability. However, its results still mainly rely on pixel-level spectral information and are susceptible to shadows, mixed pixels, and background heterogeneity in high-resolution imagery [41].
The OBIA method first segments remote sensing images based on spectral similarity and spatial adjacency, merging adjacent pixels with similar characteristics into image objects with practical land-cover significance. Then, using objects as the basic classification units, OBIA integrates spectral, shape, texture, and spatial structure features for classification [42]. Compared with traditional pixel-based classification methods, OBIA can reduce salt-and-pepper noise and the effects of mixed pixels in high-resolution UAV imagery to some extent, making it more suitable for orchard scenes with irregular canopy boundaries and complex background objects. To ensure reproducibility and consistency of OBIA classification, the segmentation and merging processes were implemented in ENVI software using a fixed parameter configuration across all image acquisition dates. Specifically, multiresolution segmentation was performed with a scale parameter of 80, shape weight of 0.2, and compactness of 0.7. These parameters were selected based on iterative visual assessment and were consistent with commonly reported parameter ranges in previous object-based image analysis studies for UAV-based orchard mapping [43,44,45].
After classification, confusion matrices were constructed based on manually interpreted samples. Producer’s accuracy (PA), user’s accuracy (UA), overall accuracy (OA), and the Kappa coefficient were used to evaluate the land-cover identification performance of different classification methods. Therefore, the method with higher classification accuracy and temporal stability was selected to extract citrus canopy regions, which were then used as masks for multispectral band reflectance extraction and vegetation index calculation. This procedure effectively reduced the interference of bare soil, grass, shadows, and other non-target objects on citrus canopy spectral information, thereby providing reliable canopy spectral data for subsequent leaf nitrogen content inversion model construction.

2.6. Construction of Machine Learning Models

The accuracy of model inversion is largely affected by the modeling method and its ability to characterize relationships among variables. To improve the inversion accuracy of citrus leaf nitrogen content (LNC) and compare the applicability of different algorithms in multispectral parameter inversion, seven models were selected in this study, including simple linear regression, quadratic regression, partial least squares regression (PLS), back propagation neural network (BP), extreme learning machine (ELM), particle swarm optimization-extreme learning machine (PSO-ELM), and particle swarm optimization-back propagation neural network (PSO-BP). These models were used to construct citrus LNC inversion models.
During model construction, the whole-growth-period sample dataset was randomly divided into a training set and an independent validation set at a ratio of 70% and 30%, respectively. The training set was exclusively used for model development, including parameter optimization and internal performance evaluation, whereas the validation set was only used for the final accuracy assessment. To optimize model parameters and reduce the risk of overfitting, a five-fold cross-validation strategy was implemented within the training set for all seven models. Specifically, 70% of the samples were used for model training and parameter optimization, while the remaining 30% were used for model validation and accuracy evaluation. This data partitioning strategy provided sufficient sample information for model training and, through the use of an independent validation set, helped reduce random fluctuations in model evaluation metrics, thereby improving the stability and reliability of model performance assessment.
To examine the consistency of sample distributions between the training and validation sets, the Kolmogorov–Smirnov test (K–S test) was further applied to the two datasets. The results showed that the p-values under all model data partitioning conditions were greater than 0.05 (α = 0.05), indicating that the null hypothesis that the training and validation sets were drawn from the same population distribution was not rejected. This suggests that there was no statistically significant difference between the training and validation sets. Therefore, the data partitioning in this study had good representativeness and could, to some extent, avoid model training and accuracy evaluation biases caused by sample distribution shifts. The selection of the seven models follows a hierarchical modeling strategy to ensure comprehensive comparison across different levels of model complexity. Specifically, linear regression and quadratic regression were included as baseline statistical models to represent simple linear and second-order nonlinear relationships between vegetation indices and LNC. Partial least squares regression (PLS) was introduced as a multivariate linear method capable of handling collinearity among spectral features. Back propagation neural network (BPNN) and extreme learning machine (ELM) were selected as representative nonlinear machine learning models with strong universal approximation capability. Furthermore, particle swarm optimization (PSO) was integrated with BP and ELM (PSO-BP and PSO-ELM) to evaluate whether global optimization of model parameters could further improve inversion stability and accuracy under complex orchard conditions. Therefore, these models collectively form a progressive framework ranging from simple statistical regression to advanced optimized nonlinear learning models, enabling a systematic evaluation of model performance for citrus LNC inversion.
(1)
Simple Linear Regression
Simple linear regression (SLR) is a classical statistical modeling method used to characterize the linear relationship between a single independent variable and a dependent variable. Its basic principle is to establish a first-order functional relationship between the dependent and independent variables based on given sample data, and to estimate model parameters using ordinary least squares (OLS). This method generally minimizes the residual sum of squares as the optimization objective, thereby reducing the overall deviation between predicted and observed values and obtaining the regression coefficient and intercept.
The SLR model has a simple structure and clear parameter interpretation, allowing the direction and magnitude of the linear effect of the independent variable on the dependent variable to be intuitively reflected. Therefore, it is commonly used for linear relationship analysis, trend fitting, and basic prediction. However, because this model assumes a linear relationship between the independent and dependent variables, its fitting ability and prediction accuracy may be limited when the studied object exhibits obvious nonlinear variation characteristics.
(2)
Quadratic Regression
Quadratic regression (QR) is a nonlinear regression model developed by introducing the quadratic term of the independent variable into the simple linear regression framework. It is mainly used to describe curved or nonlinear response relationships between a single independent variable and a dependent variable. By simultaneously incorporating the linear and quadratic terms of the independent variable, this model can characterize acceleration, deceleration, or turning-point trends in the response of the dependent variable as the independent variable changes.
Parameter estimation for QR is generally performed using the least squares method, in which the constant term, linear coefficient, and quadratic coefficient are determined by minimizing the residual sum of squares between the observed and fitted values. Compared with simple linear regression, quadratic regression retains a relatively simple model structure and interpretable parameters while enhancing the ability to describe nonlinear relationships. Therefore, it is suitable for fitting and predicting data with single-peak, single-valley, or marginal-effect variation characteristics. However, because the model includes only a quadratic term, its ability to represent complex high-dimensional nonlinear relationships remains limited.
(3)
Partial Least Squares Regression
Partial least squares regression (PLS) is a multivariate linear modeling method widely used in chemometrics. As an extension of multiple linear regression (MLR), PLS can effectively handle datasets with high-dimensional input variables, multicollinearity, and noise interference, making it suitable for modeling tasks in complex systems where strong correlations exist among variables [46]. As a dimensionality-reduction regression method, PLS extracts latent variables that maximize the covariance between predictor variables and the response variable. This process effectively alleviates problems associated with high dimensionality, multicollinearity, and noise, thereby improving the interpretability and predictive performance of the model.
(4)
Back Propagation Neural Network
The back propagation neural network (BPNN) is a multilayer feedforward neural network trained using an error back propagation algorithm. It generally consists of an input layer, one or more hidden layers, and an output layer. Its core training mechanism includes two processes: forward propagation of signals and backward propagation of errors. During forward propagation, input variables are mapped layer by layer through neurons and activation functions to generate the model output. During backward propagation, the model calculates the error between predicted and observed values and adjusts the network weights and bias parameters layer by layer using gradient descent or its improved algorithms, thereby continuously reducing the loss function value and improving model fitting accuracy.
Compared with traditional regression models, BPNN does not require a predefined functional form between variables. It can effectively approximate complex nonlinear relationships through the nonlinear mapping capability of hidden neurons, and therefore has strong applicability in multivariate nonlinear regression, pattern recognition, classification prediction, and complex system modeling. In this study, the number of hidden neurons was set to 12 based on empirical testing and model performance comparison. However, the training process of BPNN usually requires repeated iterative optimization, resulting in relatively high computational cost. In addition, its performance is easily affected by factors such as network architecture, learning rate, initial weights, and sample size. Therefore, in practical applications, model parameters should be reasonably configured according to data characteristics to improve model stability and generalization ability.
(5)
Extreme Learning Machine
Extreme learning machine (ELM) is an efficient learning algorithm designed for training single hidden layer feedforward neural networks (SLFNs). In this study, the number of hidden layer nodes was set to 50 based on repeated experiments and previous literature recommendations for remote sensing regression tasks. Its training mechanism differs substantially from that of conventional SLFN models. During the training process, ELM does not iteratively optimize the input-layer parameters. Instead, the input weights and hidden-layer biases are randomly initialized, and the output weights are then analytically determined by minimizing a regularized loss function composed of the training error term and the norm of the output weights, based on the Moore–Penrose (MP) generalized inverse theory [47,48].
The main advantage of ELM lies in its ability to substantially improve training efficiency by avoiding the time-consuming gradient-based back propagation process used in traditional neural networks, while retaining the nonlinear modeling capability and universal approximation performance of SLFNs [49]. Since ELM does not require iterative optimization of hidden-layer parameters, it can rapidly determine output weights after random initialization of hidden-layer parameters. Therefore, ELM exhibits strong computational efficiency and generalization capability in high-dimensional nonlinear regression and classification tasks, and has been widely applied in regression.
(6)
Particle Swarm Optimization
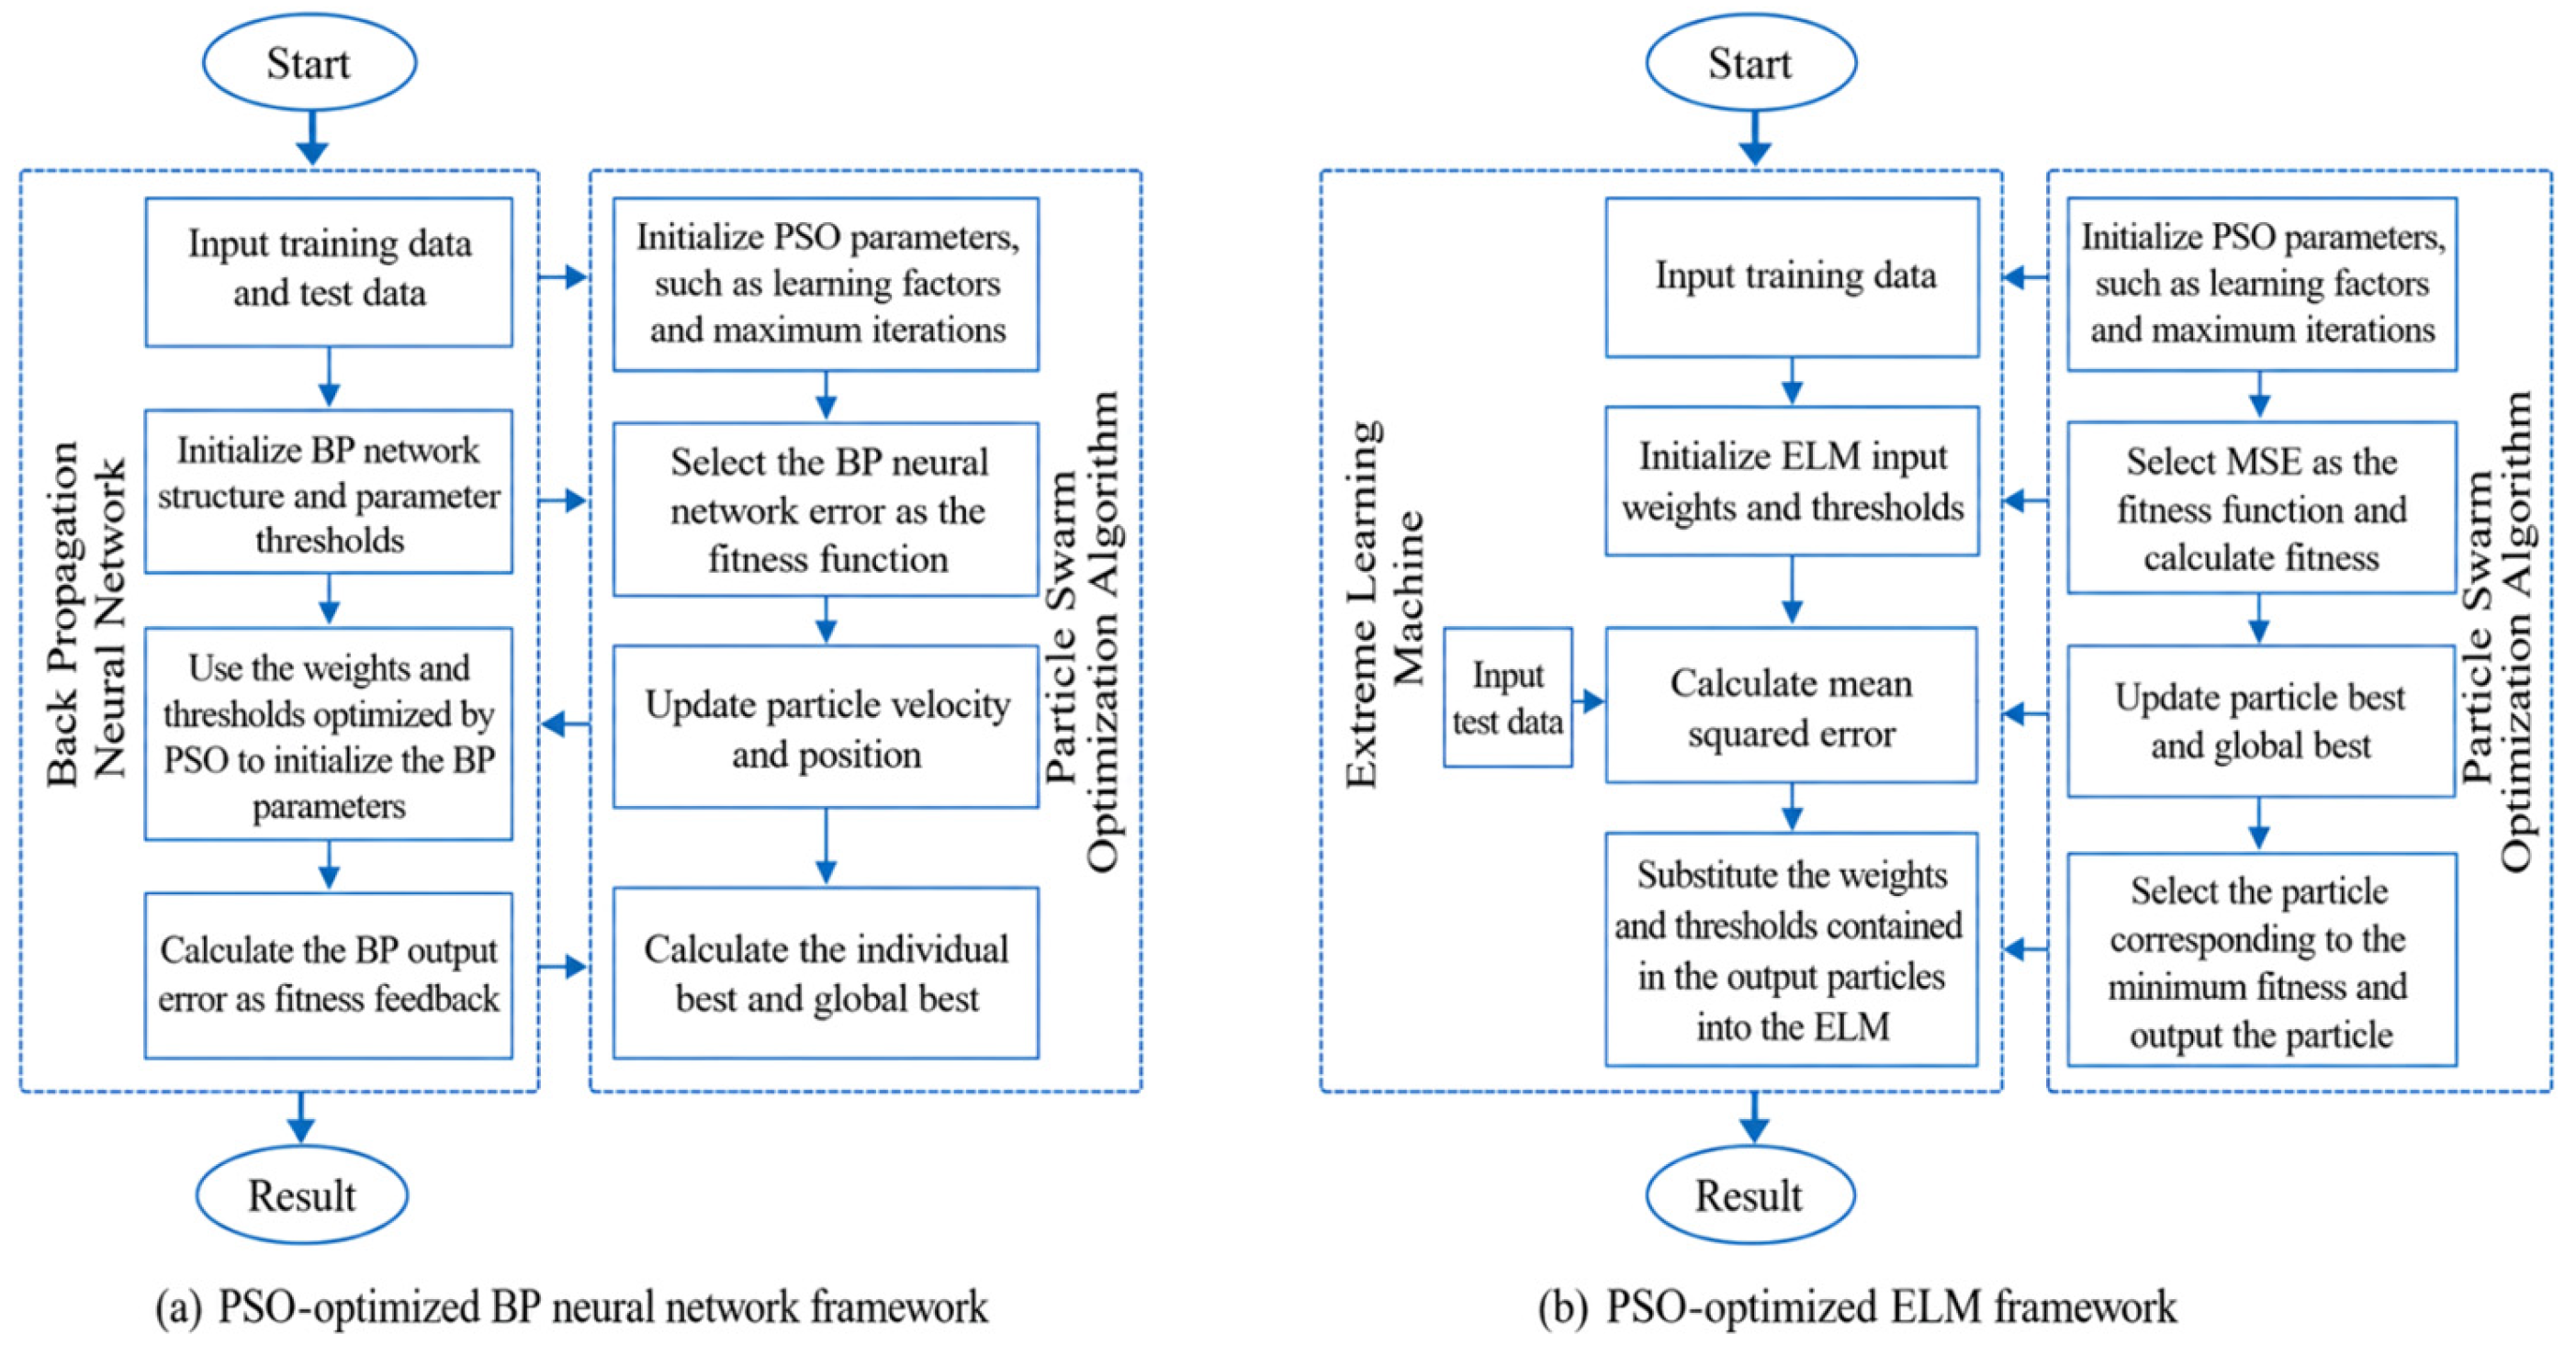
The core idea of ELM is to randomly initialize the input-layer weights and hidden-layer biases, and then analytically determine the output-layer weights by minimizing the training error. Although this non-iterative training mechanism greatly improves model training efficiency, the random initialization of input-layer weights and hidden-layer biases may introduce uncertainty into model prediction. To alleviate this problem and enhance model predictive performance, particle swarm optimization (PSO) was introduced in this study to globally optimize the initial parameters of ELM.
PSO is a swarm-intelligence-based global optimization algorithm inspired by the foraging behavior of bird flocks. In this study, the PSO population size was set to 30, and the maximum number of iterations was set to 150. The inertia weight and acceleration coefficients were set to commonly used values (w = 0.729, c1 = 1.49445, c2 = 1.49445) to balance global exploration and local exploitation. By dynamically updating each particle according to its individual historical best position and the global best position of the population, PSO guides the search process to achieve a balance between global exploration and local exploitation [50]. This method has the advantages of fast convergence, simple implementation, and strong robustness, and has been widely applied in complex nonlinear system modeling.
In this study, PSO was applied to optimize the input-layer weight matrix and hidden-layer biases of the ELM model, aiming to overcome the uncertainty caused by random parameter initialization and thereby improve the stability and generalization ability of the model in nonlinear inversion tasks. The overall structure and optimization workflow of the model are shown in Figure 3.

2.7. Evaluation Indicators

The accuracy of the LNC inversion models based on vegetation indices extracted from UAV multispectral remote sensing was evaluated using the coefficient of determination (R2), root mean square error (RMSE). The specific expressions are as follows:
R 2 = 1 i = 1 n ( X i Y i ) 2 i = 1 n ( X i X ¯ ) 2
R M S E = 1 n i = 1 n ( Y i X i ) 2
In the equations, X i denotes the observed value, Y i denotes the predicted value, and X ¯ represents the mean of the actual values. A higher coefficient of determination (R2, closer to 1), along with lower values of root mean square error (RMSE) closer to 100%, indicate more stable model performance, better fitting accuracy, and stronger predictive capability.

2.8. Data Analysis and Software

Data processing, statistical analysis, and visualization were conducted using multiple software platforms. Microsoft Excel 2019 (Microsoft Corporation, Redmond, WA, USA) was used for preliminary data organization and descriptive statistics. Statistical analyses, including analysis of variance (ANOVA), were performed using SPSS 20 (IBM Corporation, Armonk, NY, USA). Origin 2023 (OriginLab Corporation, Northampton, MA, USA) was employed for correlation analysis and graphical visualization. MATLAB R2018b (The MathWorks, Inc., Natick, MA, USA) was used for model development, nonlinear regression, image processing, and three-dimensional visualization. Geographic data processing and map production were conducted using ArcGIS 10.6 (Esri, Redlands, CA, USA).

3. Results

3.1. Spectral Feature Extraction of Citrus Leaves and Their Responses to Water and Nitrogen Regulation

These spectral variations under different water and nitrogen treatments are closely related to LNC, as nitrogen availability regulates chlorophyll concentration and leaf biochemical composition, which in turn affects canopy reflectance, particularly in the red and red-edge regions. Therefore, analyzing spectral response differences under water–nitrogen regulation provides a physiological basis for subsequent LNC inversion modeling.
(1)
Acquisition of Citrus Canopy Spectral Information
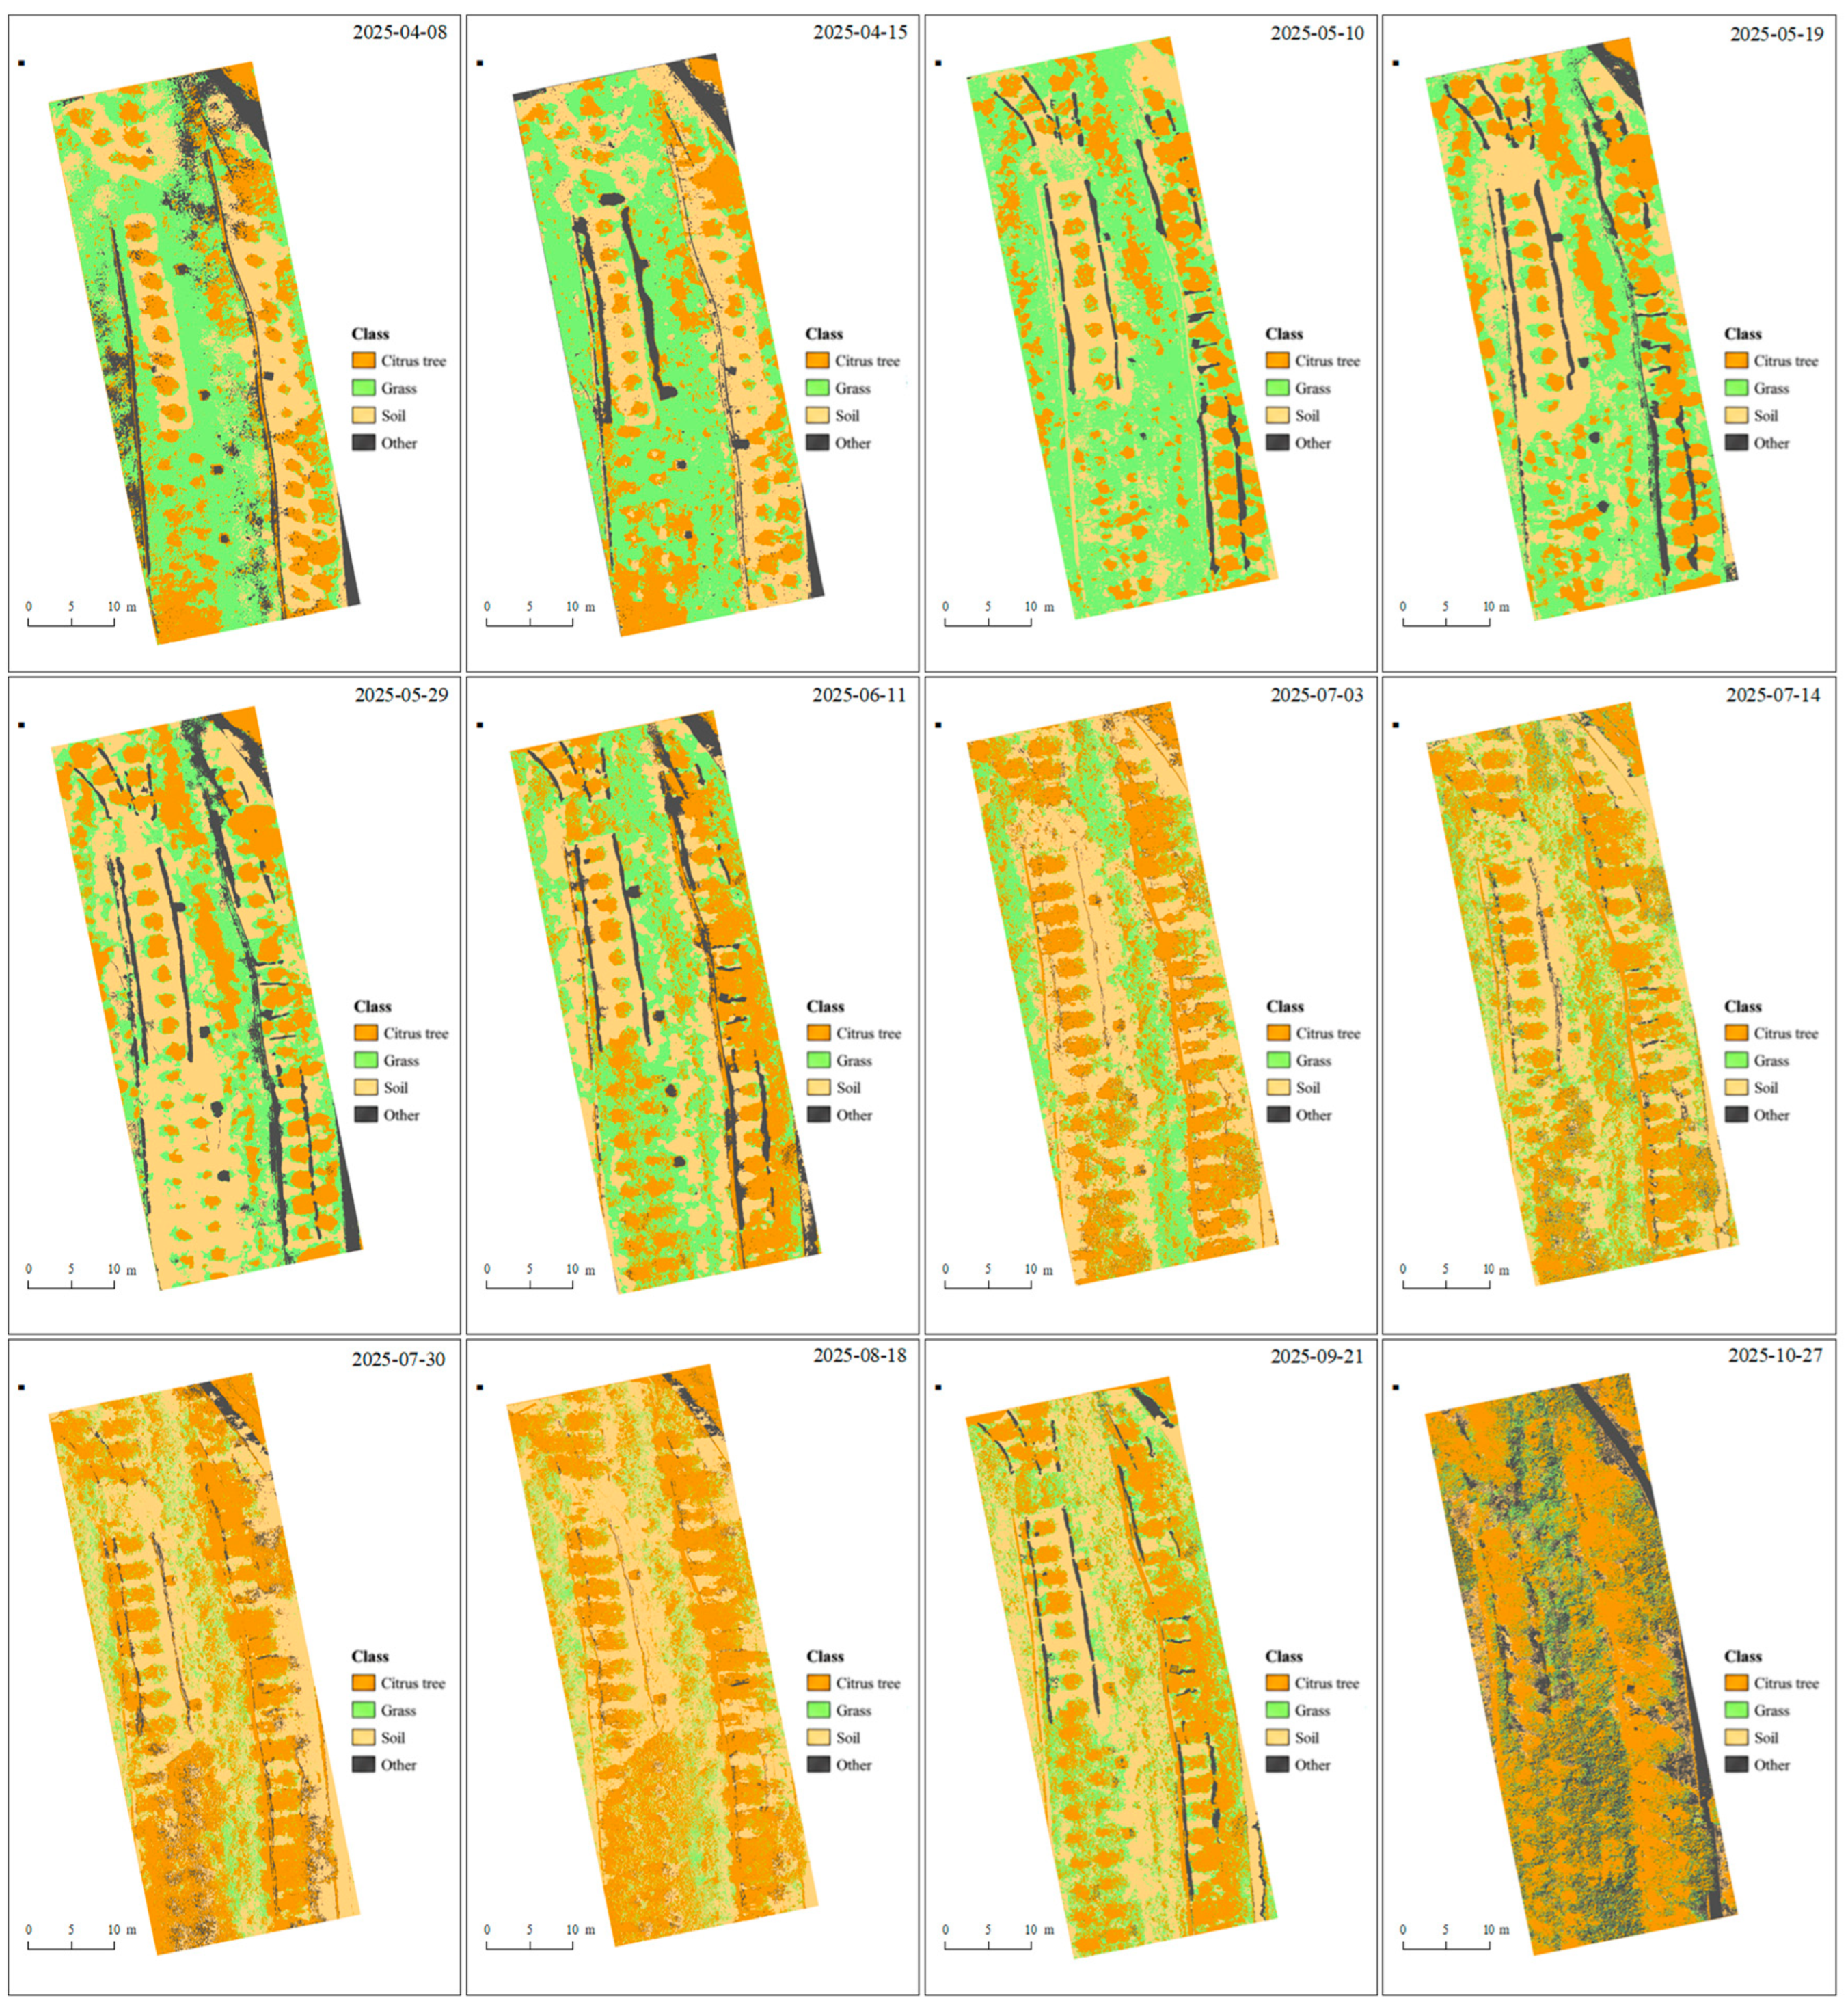
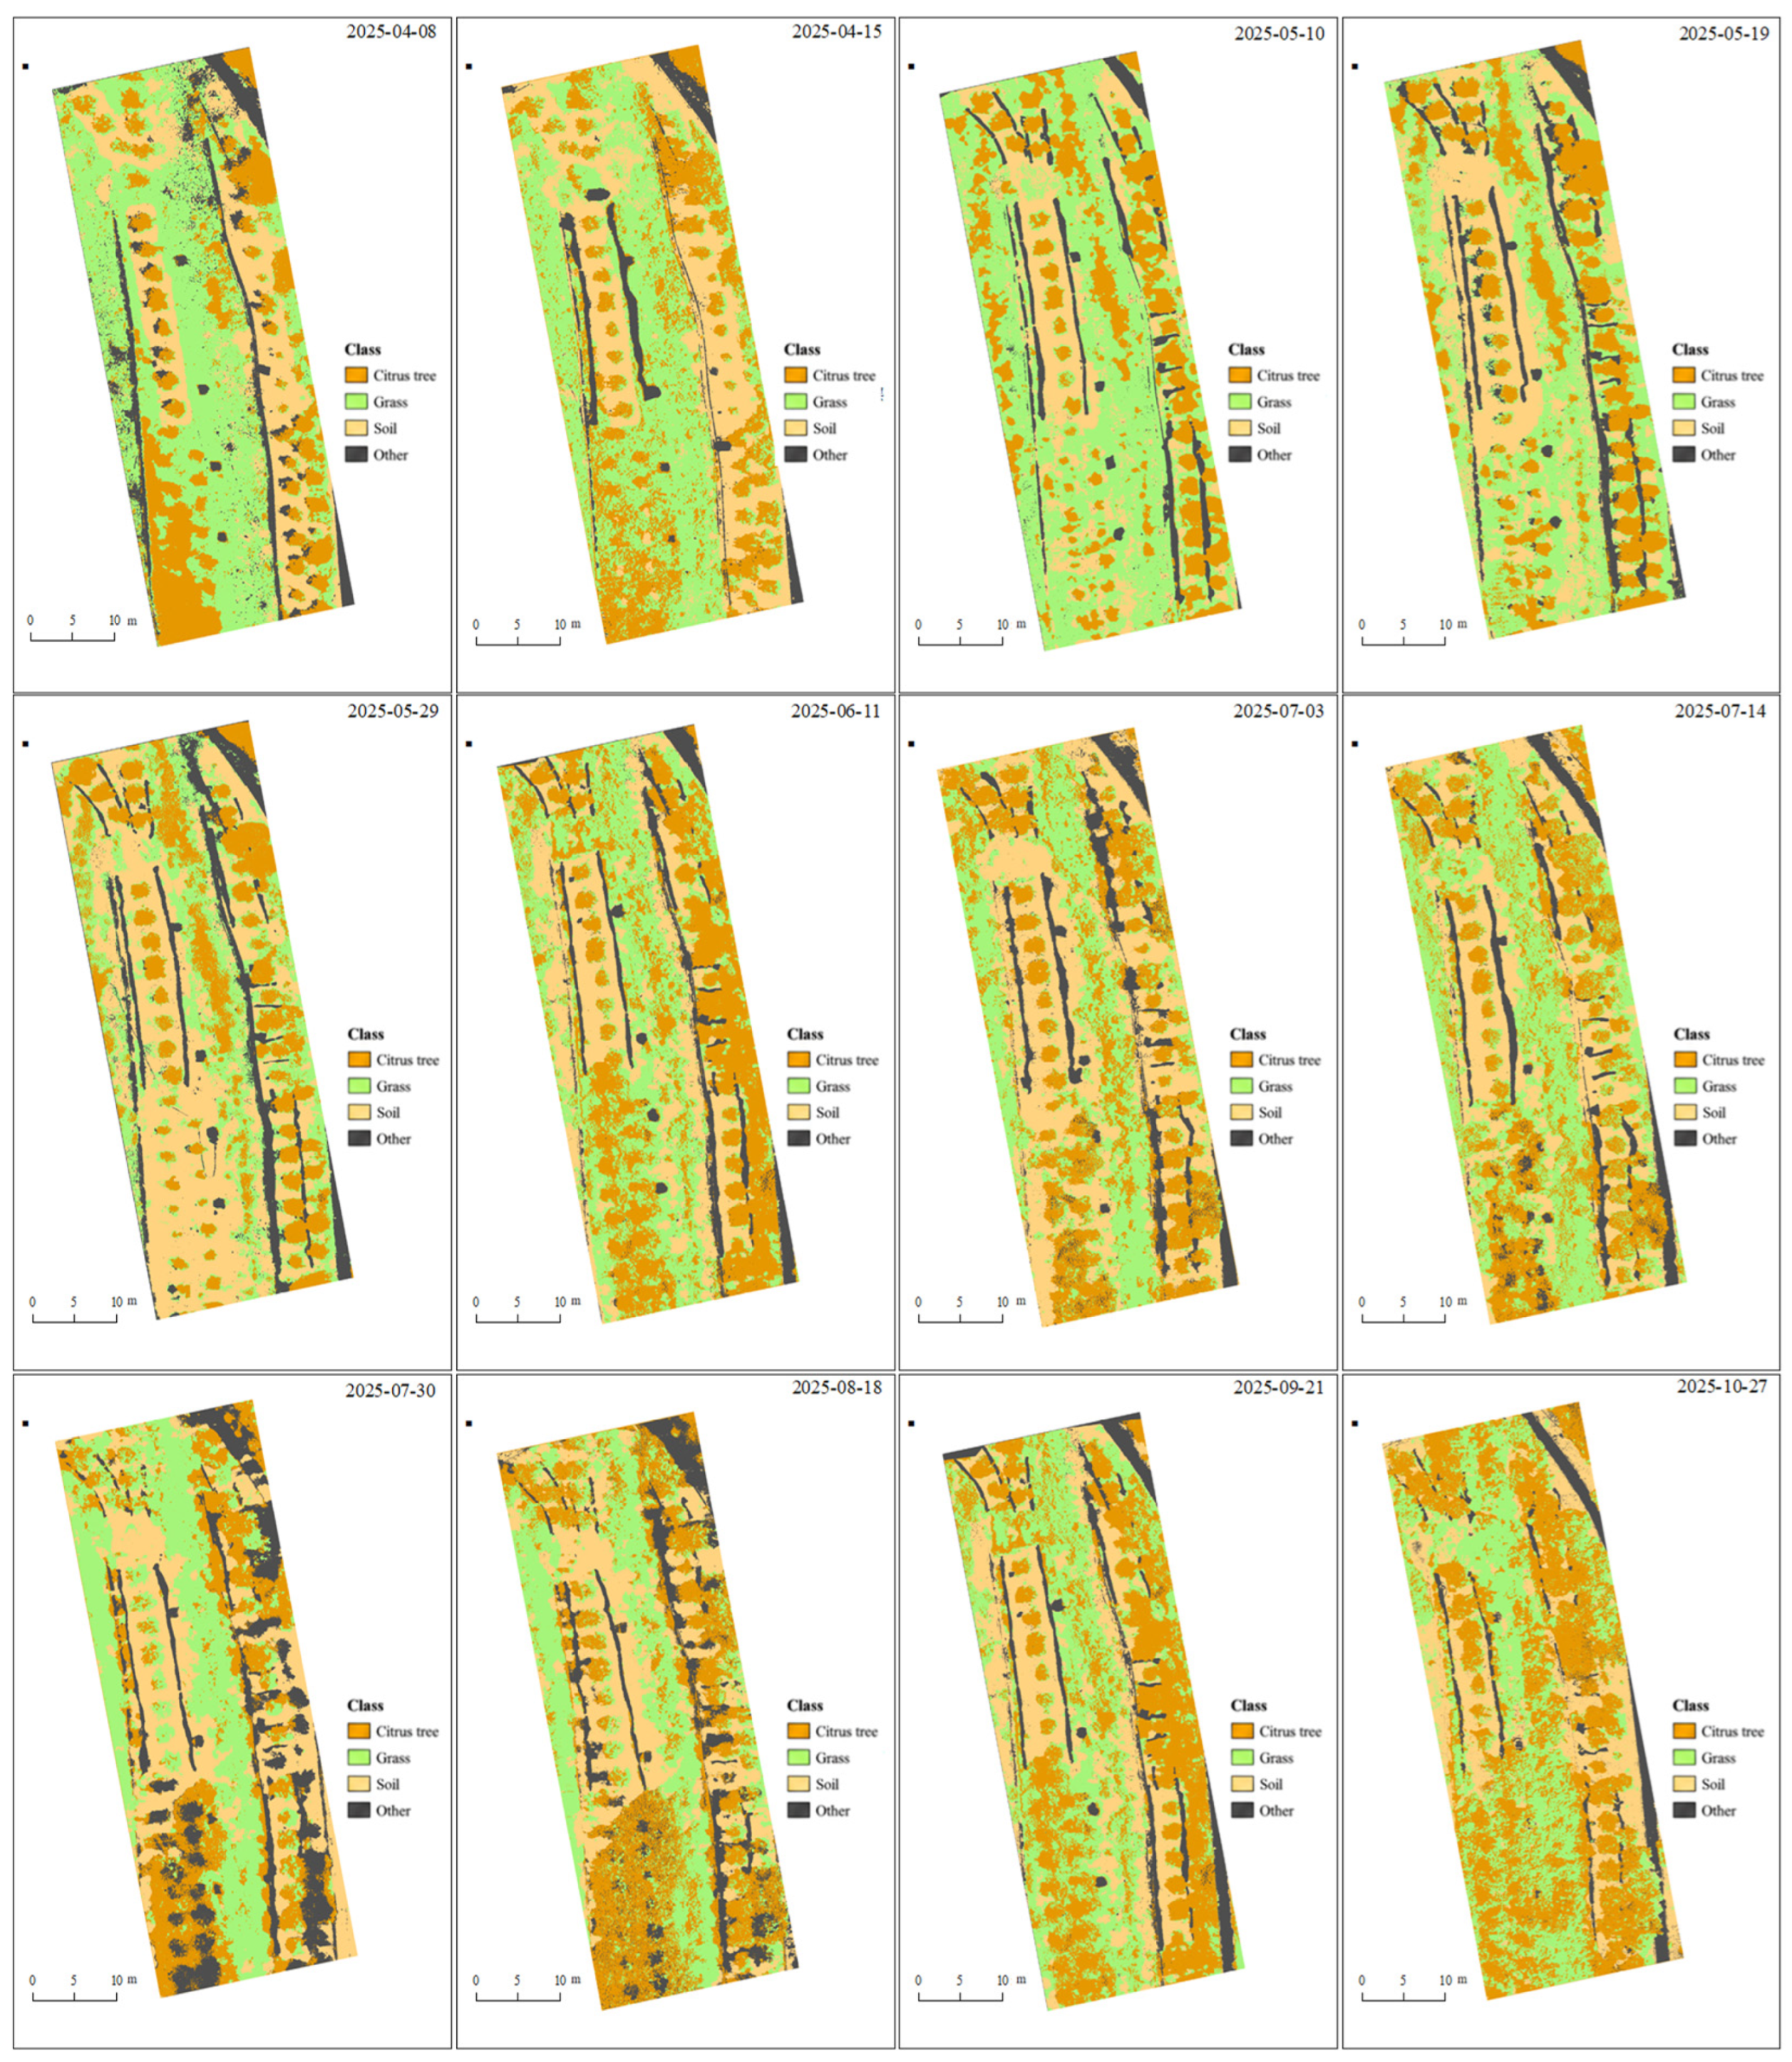
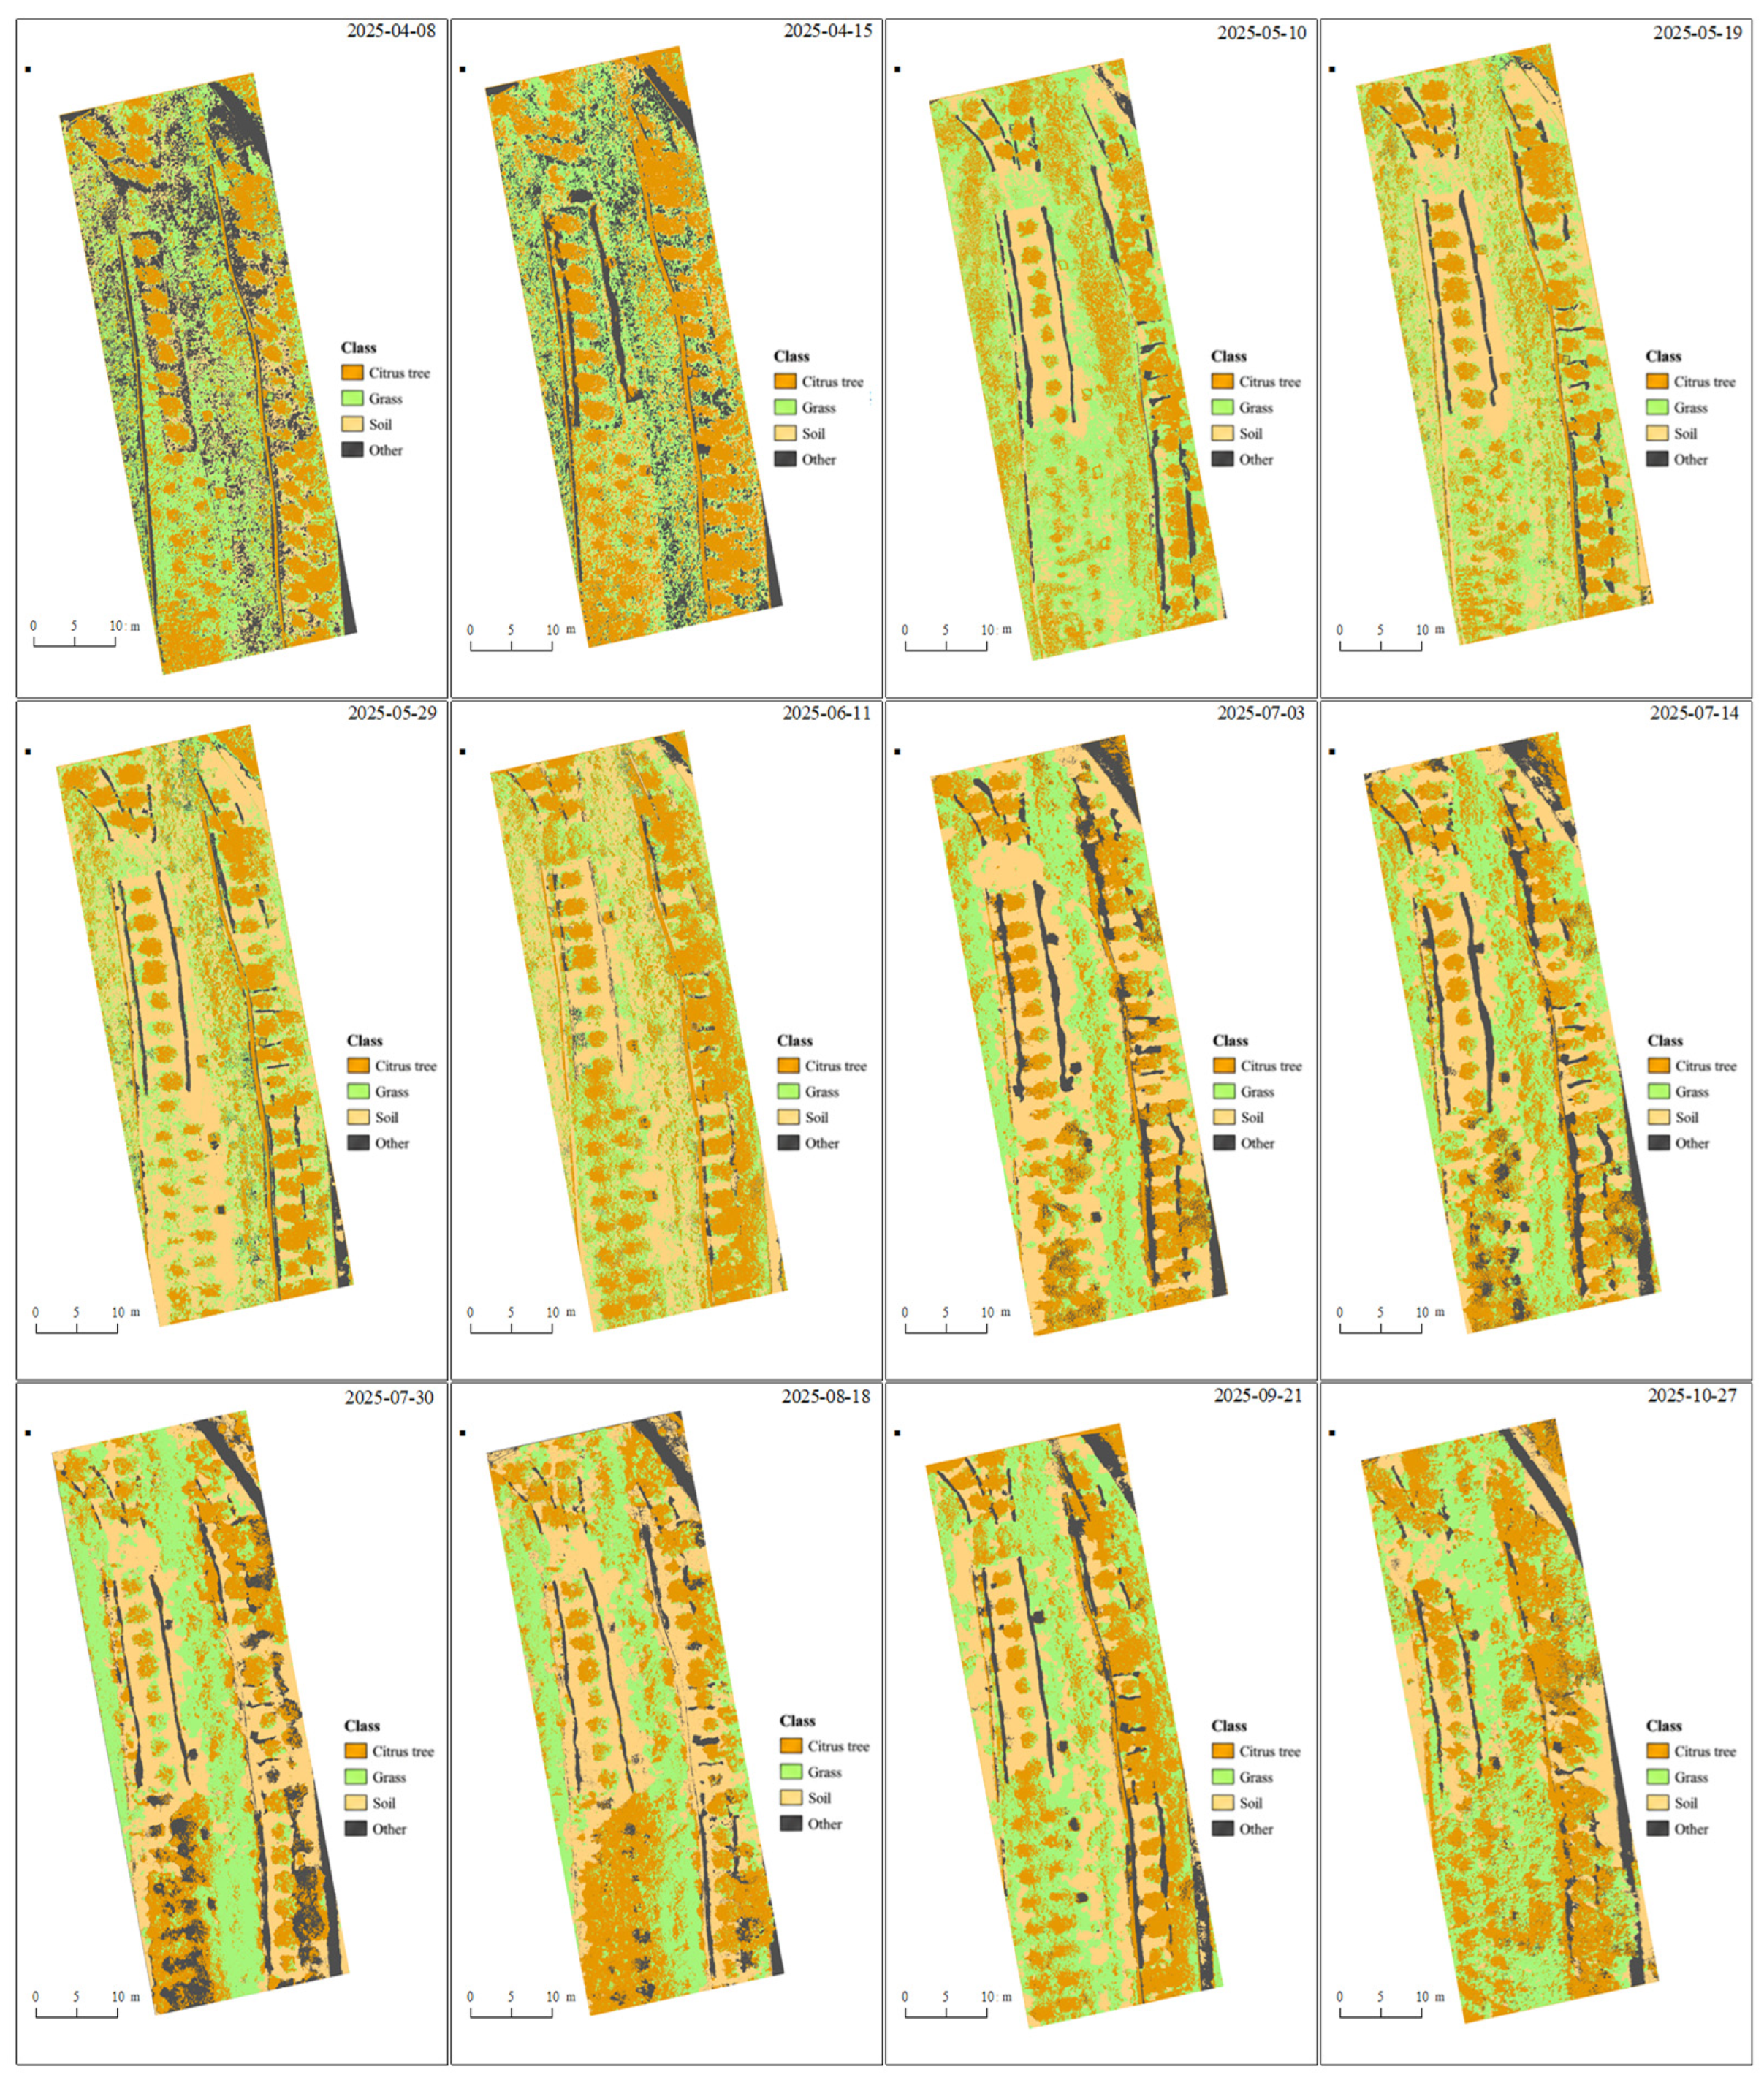
Based on the true-color remote sensing images acquired from the citrus orchard and the established land-cover classification system, regions of interest (ROIs) for citrus canopy, grass, bare soil, and other land-cover types were selected as training samples. Minimum distance classification (MDC) (Figure 4), maximum likelihood classification (MLC) (Figure 5), and object-based image analysis (OBIA) (Figure 6) were then applied to classify the citrus orchard remote sensing images.
The classification results of the three methods showed that MDC and MLC achieved relatively lower classification accuracy, with more evident misclassification. In the classification results on April 8 and April 15, citrus canopy identification was susceptible to interference from grass, resulting in misclassification in some areas. In addition, during the late fruit color-break and sugar-accumulation stage from late September to late October, MDC was more sensitive to changes in bare soil distribution, and its classification results were strongly affected by the bare soil background. In contrast, OBIA showed stronger capability in citrus canopy identification for orchard remote sensing imagery. It effectively reduced the interference of noise on canopy spectral features, and its classification results exhibited higher overall stability, with relatively less influence from other land-cover types and external factors.
The land-cover classification results obtained from the three classification methods based on remote sensing images were used to construct corresponding confusion matrices. The classification accuracy of each method at different image acquisition dates was quantitatively evaluated. By comprehensively analyzing overall accuracy, user’s accuracy, producer’s accuracy, and the Kappa coefficient, the applicability and accuracy of the three classification methods for land-cover classification of citrus orchard remote sensing images at different stages were assessed. The evaluation results are presented in Table 5 and Table 6.
The three classification methods achieved relatively high classification accuracy for bare soil and grass, whereas their classification performance for citrus canopy and other land-cover categories differed to some extent. For the bare soil category, MLC and OBIA maintained relatively high PA and UA values in most periods, reaching over 80% in some cases. This indicates that these two methods had strong discrimination ability for bare soil in citrus orchard remote sensing images and produced relatively stable classification results. In contrast, the PA and UA of MDC for bare soil fluctuated considerably, with relatively low accuracy in some periods, suggesting that this method was more susceptible to interference from other land-cover types.
For the grass category, the UA values of the three methods were generally higher than the PA values, grass was less frequently misclassified as other land-cover types, although some other objects were still incorrectly identified as grass. OBIA showed higher PA and UA values than MDC and MLC in most periods. The PA of MDC for grass was mostly below 50%, reflecting relatively low classification accuracy, while the accuracy of MLC was intermediate between MDC and OBIA. For citrus canopy identification, differences among the classification methods were more pronounced. OBIA maintained relatively high UA and PA values in most periods, especially during the middle and later growth stages of citrus, when its UA was mostly higher than 80%. MLC ranked second, with PA and UA for citrus canopy reaching 70–85% in some periods, although its stability was slightly lower than that of OBIA. Compared with OBIA, MDC generally showed lower UA values for the citrus canopy category, with values below 50% in some periods.
The PA and UA values of each classification method for different land-cover categories fluctuated to some extent with citrus growth and changes in surface cover conditions. OBIA showed relatively small variations in classification accuracy across different periods and was less affected by temporal changes. In contrast, the classification accuracy of MDC and MLC changed more markedly with citrus phenological development, particularly during the rapid vegetation growth stage and the fruit color-break and sugar-accumulation stage, when classification stability declined.
The OA and Kappa coefficients of the three classification methods showed a generally consistent ranking, with OBIA outperforming MLC, and MLC generally outperforming MDC. The OA of MDC ranged from 40.83% to 71.61% across different periods, while its Kappa coefficient ranged from 0.22 to 0.57. The OA of MLC was markedly higher than that of MDC, ranging from 52.60% to 73.75%, with Kappa coefficients between 0.31 and 0.60. Compared with MDC and MLC, OBIA achieved the highest classification accuracy in all periods, with OA ranging from 68.86% to 85.65% and Kappa coefficients ranging from 0.56 to 0.72.
Overall, the three classification methods showed certain feasibility for identifying bare soil and grass in citrus orchards, but clear differences were observed in the accuracy of citrus canopy recognition. Their overall performance followed the order OBIA > MLC > MDC. OBIA achieved high and stable classification accuracy across different periods.
As citrus growth and development progressed, the classification accuracy of different methods exhibited distinct temporal variations. The OA values of MDC and MLC fluctuated considerably over time and reached relatively high levels during the young fruit stage of citrus, from mid- to late May, followed by a gradual decline from summer to the fruit color-break and sugar-accumulation stage. The OA of MDC decreased markedly from late July to mid-August, indicating that its classification results were strongly affected by changes in vegetation cover and increasing surface complexity. In contrast, the decline in OA for MLC during the same period was less pronounced, suggesting greater stability than MDC, although certain temporal fluctuations remained.
By comparison, the OA of OBIA varied only slightly across different growth stages and remained at a relatively high level overall, indicating strong temporal stability. Even during the vigorous citrus growth stage and the later period when surface heterogeneity increased, OBIA maintained satisfactory classification accuracy. This suggests that OBIA has greater adaptability to land-cover segmentation and citrus canopy extraction in orchard scenes.
Overall, in multi-temporal remote sensing images of citrus orchards, OBIA outperformed MDC and MLC in terms of overall accuracy and classification consistency. Moreover, its classification results were more stable over time, making it more suitable for fine-scale citrus canopy segmentation and multi-temporal monitoring.
(2)
Response Characteristics of Crop Canopy Spectral Reflectance under Water and Nitrogen Treatments
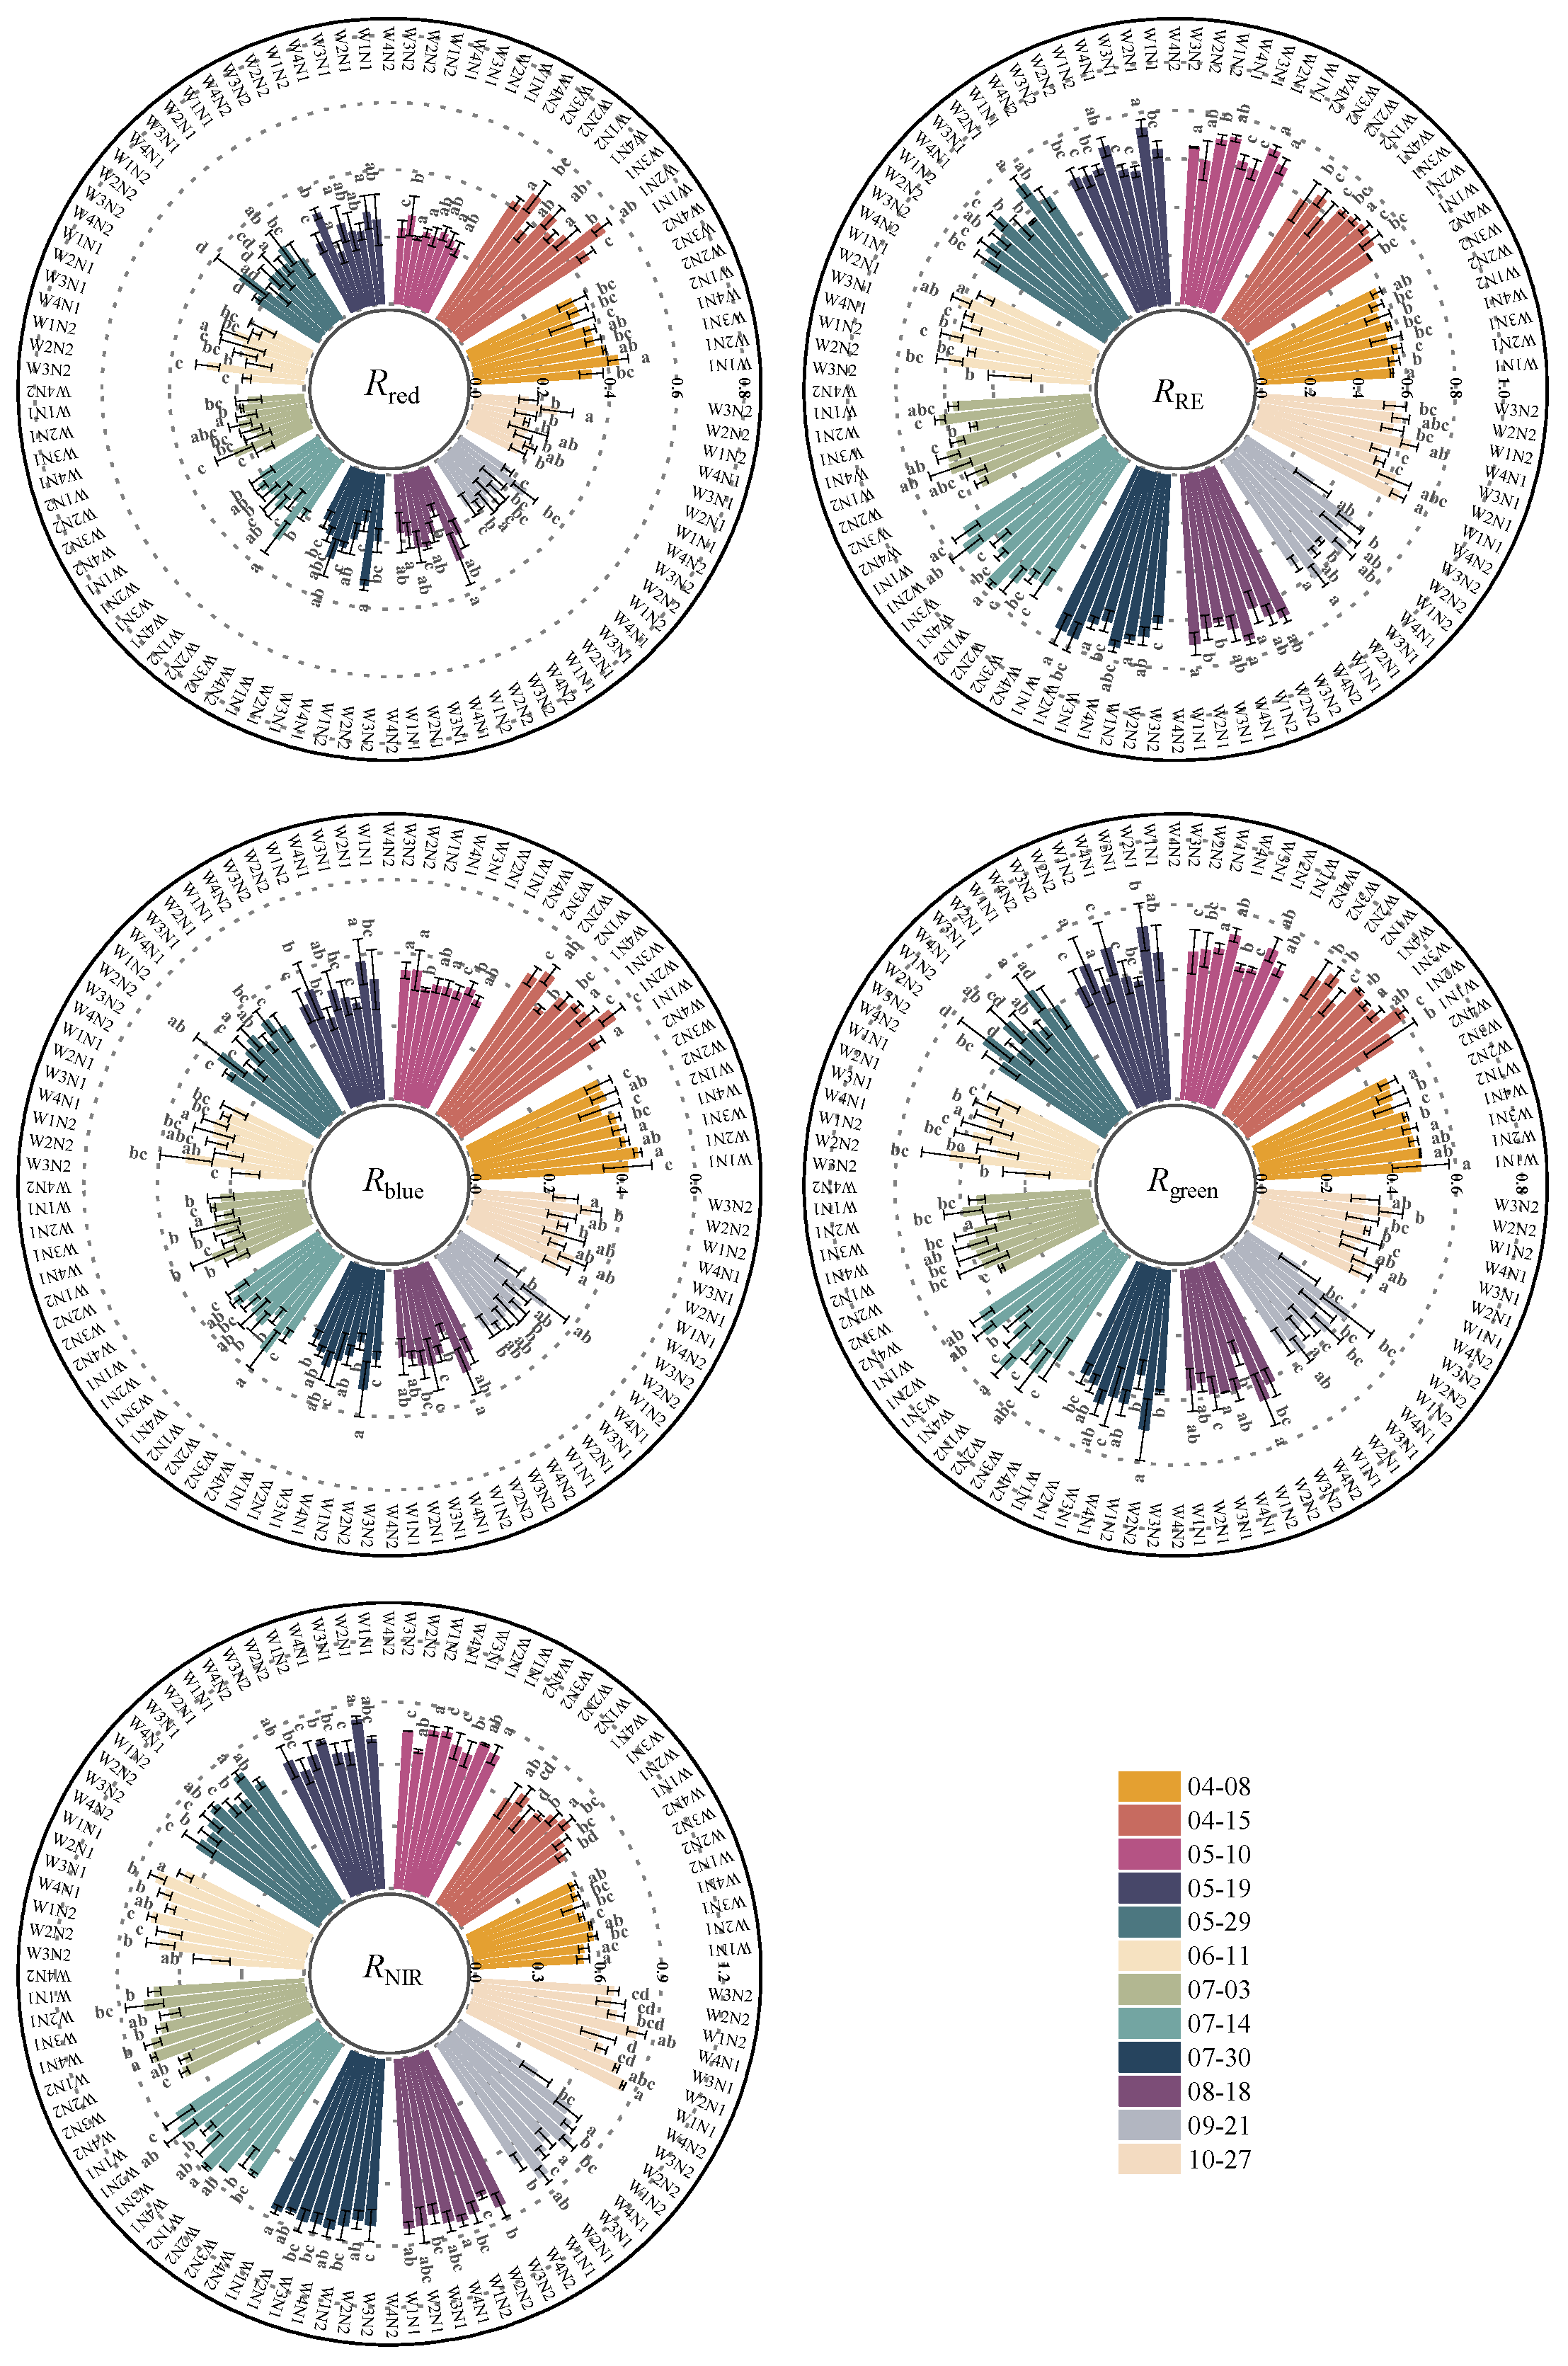
Based on the vector data and the selected optimal land-cover classification results, citrus canopy spectral information under different treatment conditions was extracted using ENVI software. To ensure the representativeness and reliability of the extracted spectral features, three vector samples were selected for each treatment to obtain the corresponding citrus canopy spectral data. Based on the extracted spectral information, the effects of water and nitrogen application levels on citrus canopy spectral characteristics were further analyzed, as shown in Figure 7.
As citrus growth progressed, the reflectance of different spectral bands exhibited distinct temporal variation patterns. Among them, Rred, Rblue, and Rgreen showed relatively consistent trends, generally increasing first and then decreasing. These bands reached relatively high values during the budburst and flowering stage from mid- to late April, and their reflectance was markedly higher than that observed at other growth stages. Changes in leaf structure and physiological activity during this period made the visible bands more sensitive to phenological differences. In addition, RNIR showed relatively moderate variation, with reflectance gradually increasing as the growth period progressed, reflecting the progressive development of canopy structure. RRE fluctuated only slightly throughout the whole growth period, with no pronounced differences among stages, indicating a relatively stable spectral response.
To further interpret the physiological relevance to LNC inversion, differences in band reflectance under different irrigation and nitrogen treatments were analyzed, highlighting the influence of treatment conditions on spectral characteristics. Rred showed higher reflectance under W2N1 and W3N2 treatments, whereas the lowest value was observed under W2N2, indicating that this band was relatively sensitive to changes in water–nitrogen combinations. RRE exhibited generally higher reflectance under W2N1, but relatively lower values under W3N1 and W4N1, showing certain treatment-dependent differentiation. Similar patterns were observed for Rblue, with high values mainly concentrated under W2N1 and W3N2, while lower reflectance values mostly occurred under W4N2. The response pattern of Rgreen was generally consistent with those of the above bands, with higher reflectance under W2N1 and W3N2 and lower values commonly observed under W2N2. In addition, RNIR showed higher reflectance under W2N1 and W1N2, whereas its reflectance under W3N2 and W4N2 was distinctly lower than that under the other treatments, further indicating the effects of different water and nitrogen configurations on citrus canopy structural characteristics.

3.2. Inversion of Citrus Leaf Nitrogen Content Based on UAV Multispectral Remote Sensing

(1)
Correlation Analysis
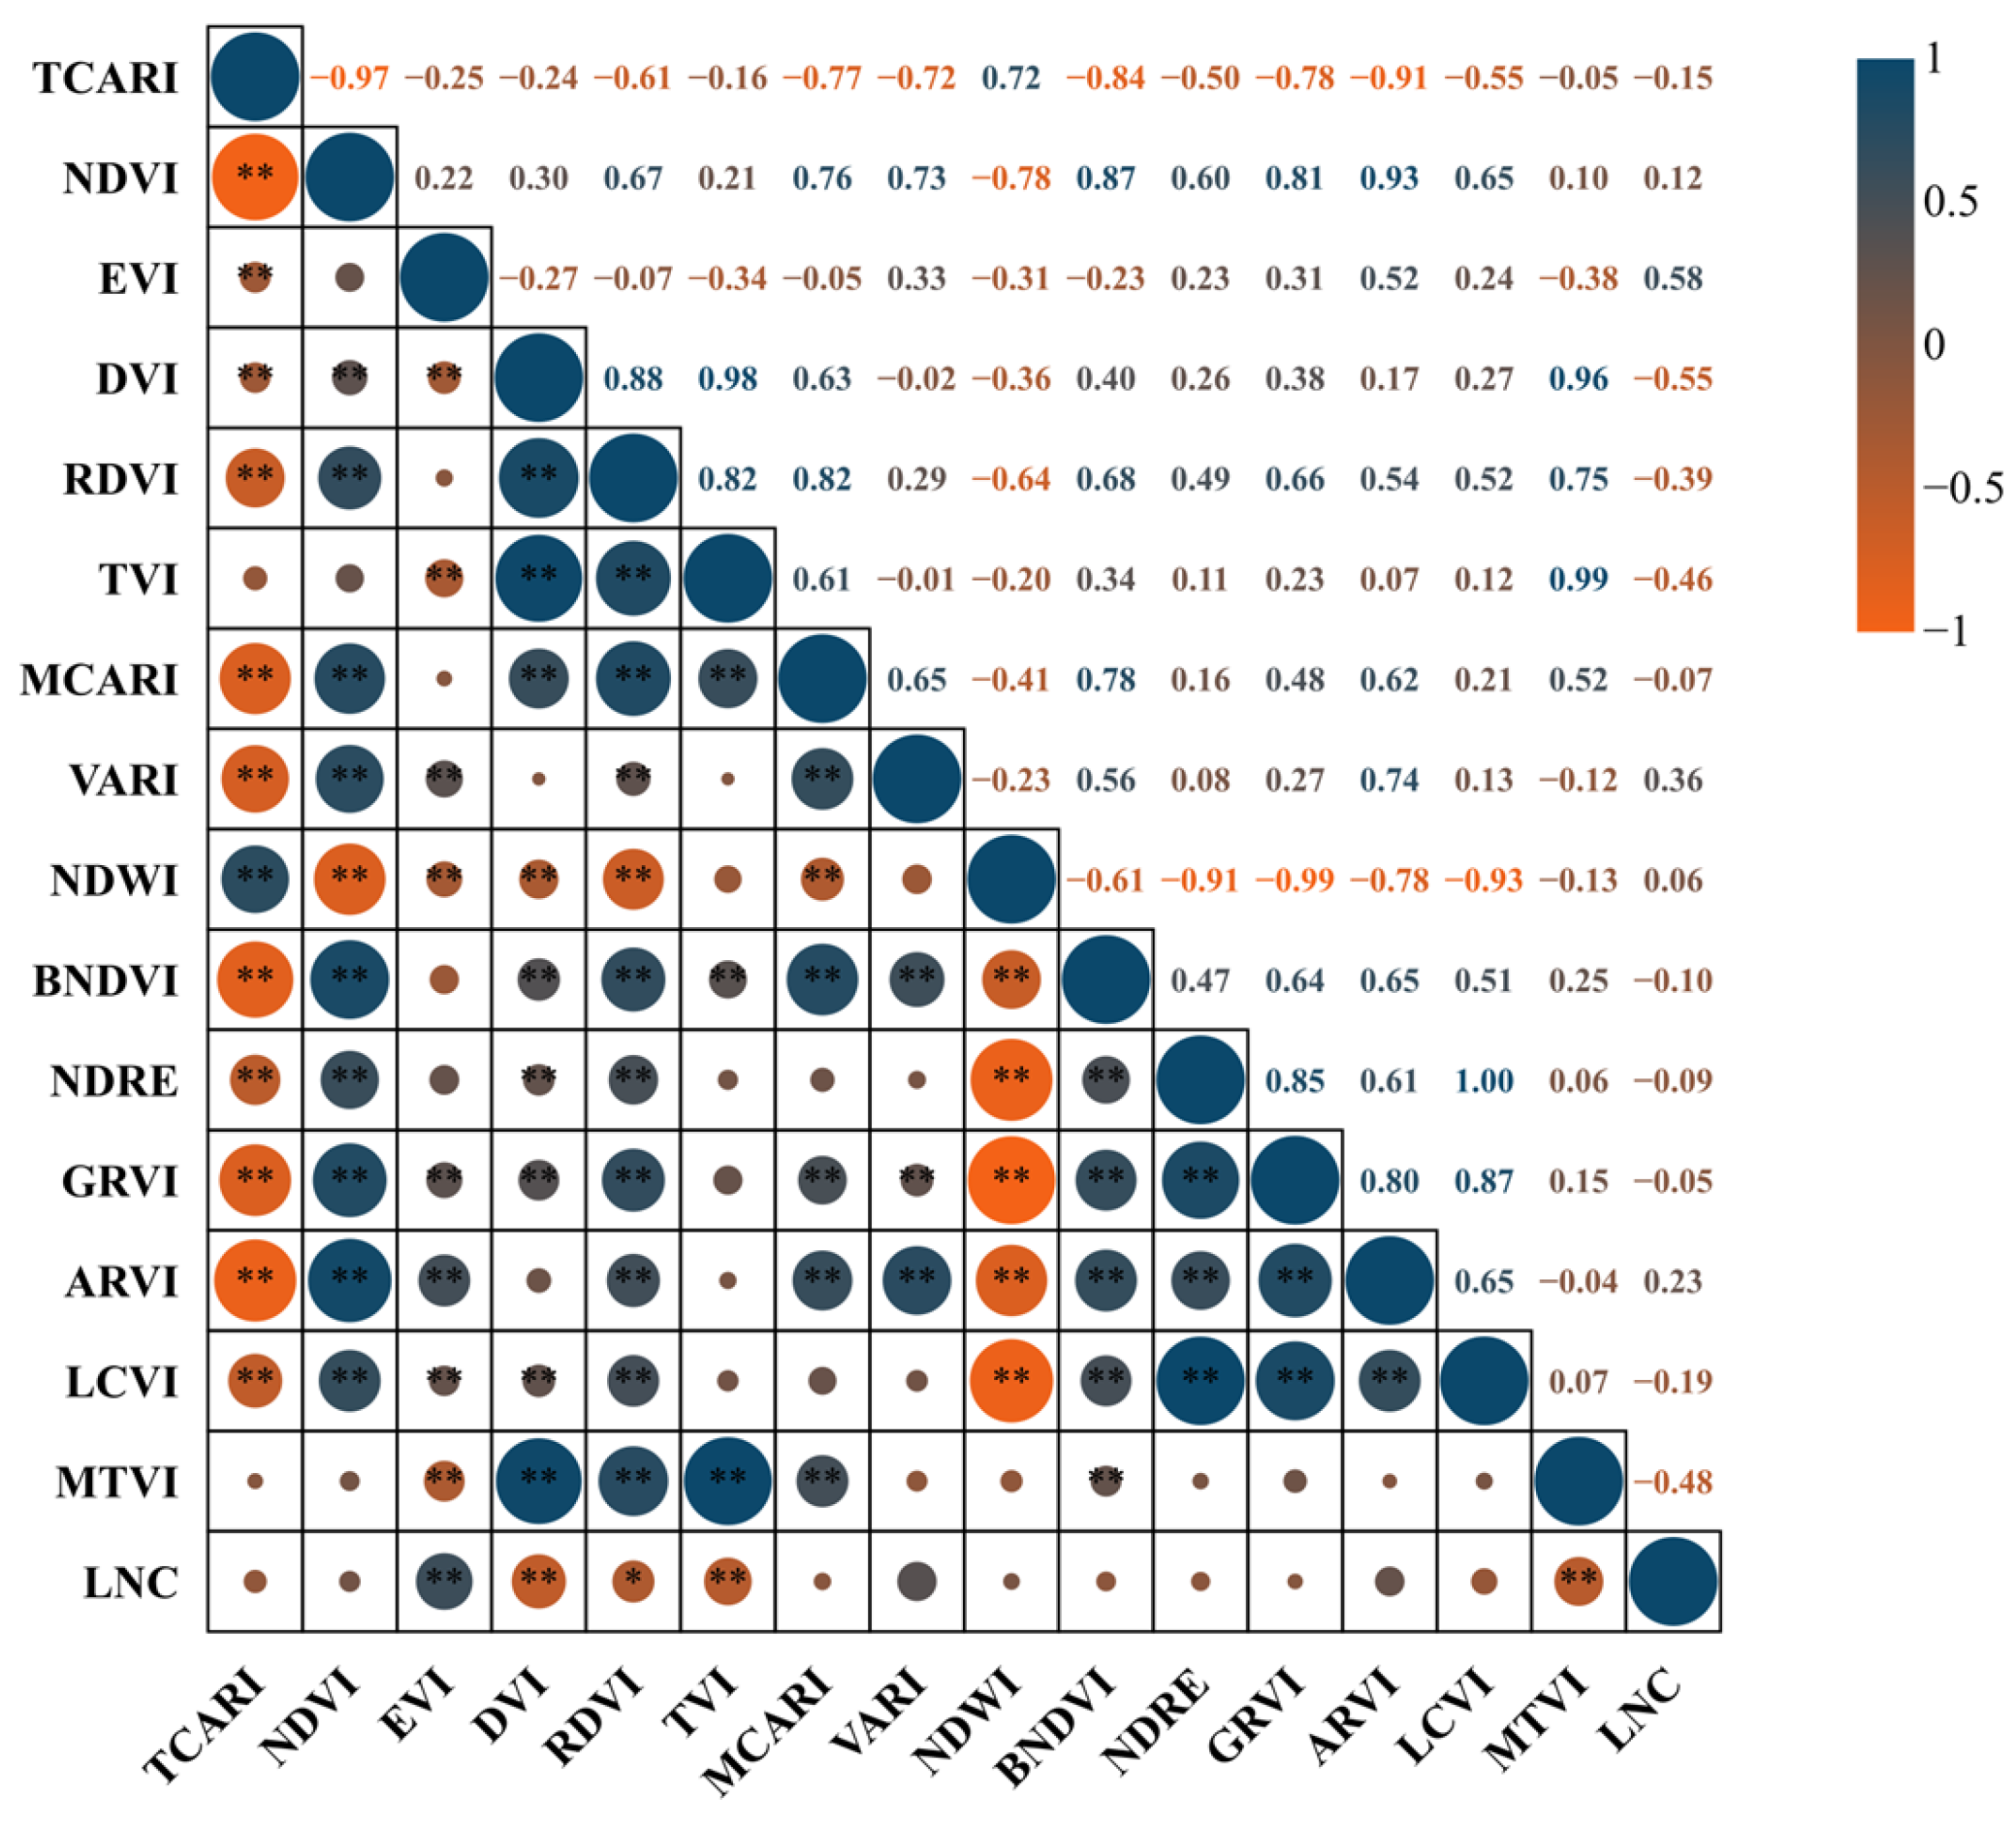
Correlation analysis based on the whole-growth-period dataset showed that several vegetation indices were significantly correlated with LNC. EVI exhibited a significant positive correlation with LNC, whereas DVI, RDVI, TVI, and MTVI showed negative correlations. Across the whole growth period, EVI had the highest correlation coefficient with LNC, while GRVI showed a relatively weak correlation. The response characteristics of vegetation indices to LNC varied markedly among different datasets and index formulation, indicating that different vegetation indices differed in their sensitivity to leaf nitrogen status.
(2)
Linear Regression Models
The enhanced vegetation index (EVI), which showed the strongest correlation with LNC across the whole growth period, was used as the independent variable in both a simple linear regression model and a quadratic regression model for LNC estimation (Figure 8). The model expressions are shown in Equations (3) and (4). During model construction, the sample dataset was randomly divided into a training set and a test set at a ratio of 70% and 30%, respectively. To ensure the scientific validity and balance of the data partitioning, the Kolmogorov–Smirnov (K–S) test was performed on the training and test datasets before model training to evaluate the consistency of their distribution characteristics. The results showed that the p-values of all tests were greater than 0.05 (α = 0.05), indicating that the null hypothesis that “the training and test sets followed the same population distribution” could not be rejected. This suggests that there was no statistically significant difference between the two datasets, and that the data partition was representative and could effectively reduce the influence of sample distribution shift on model evaluation.
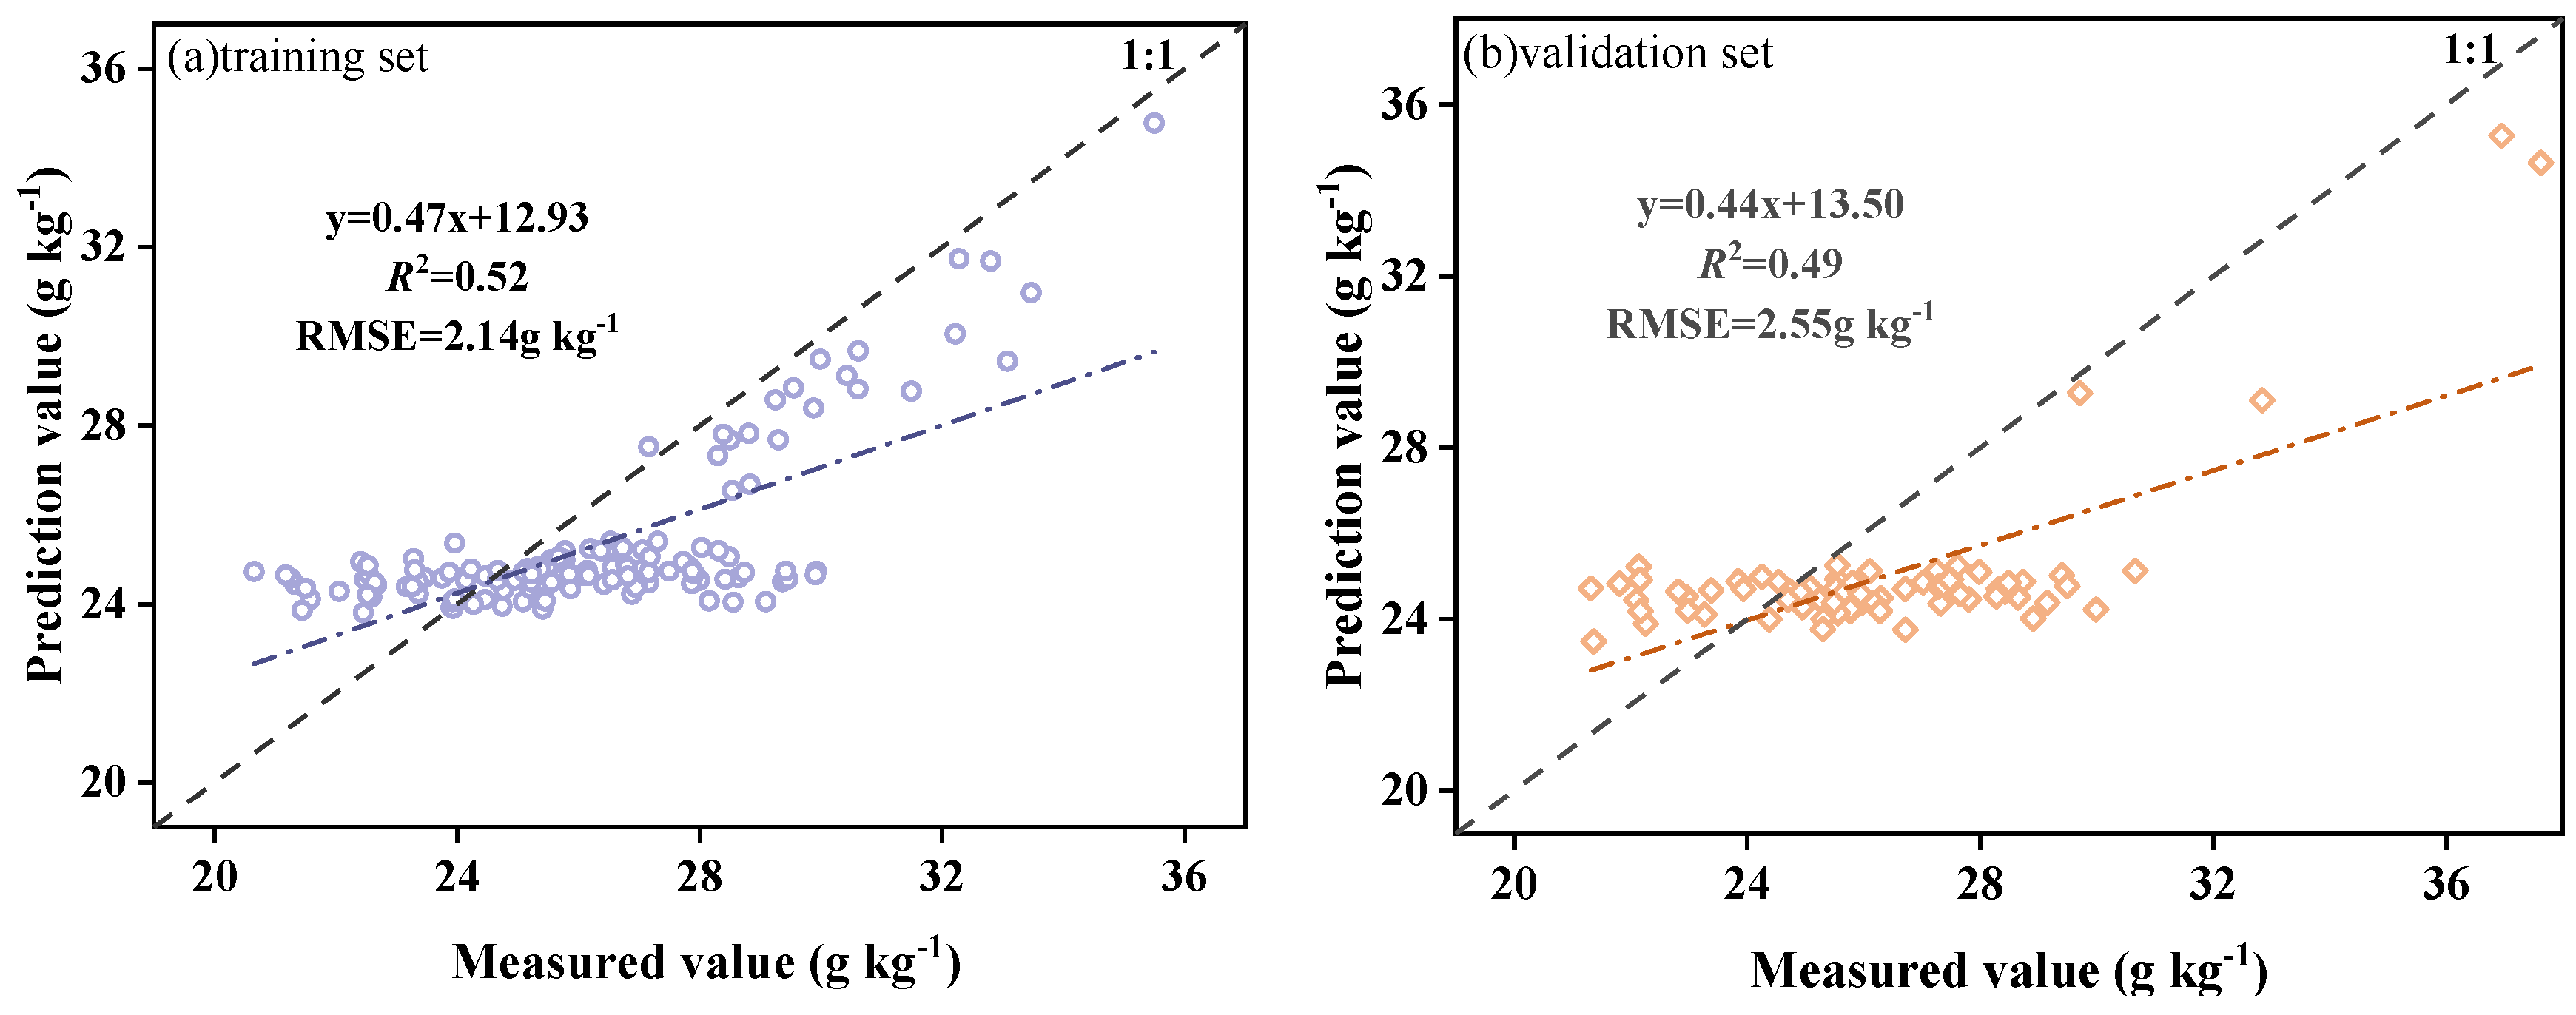
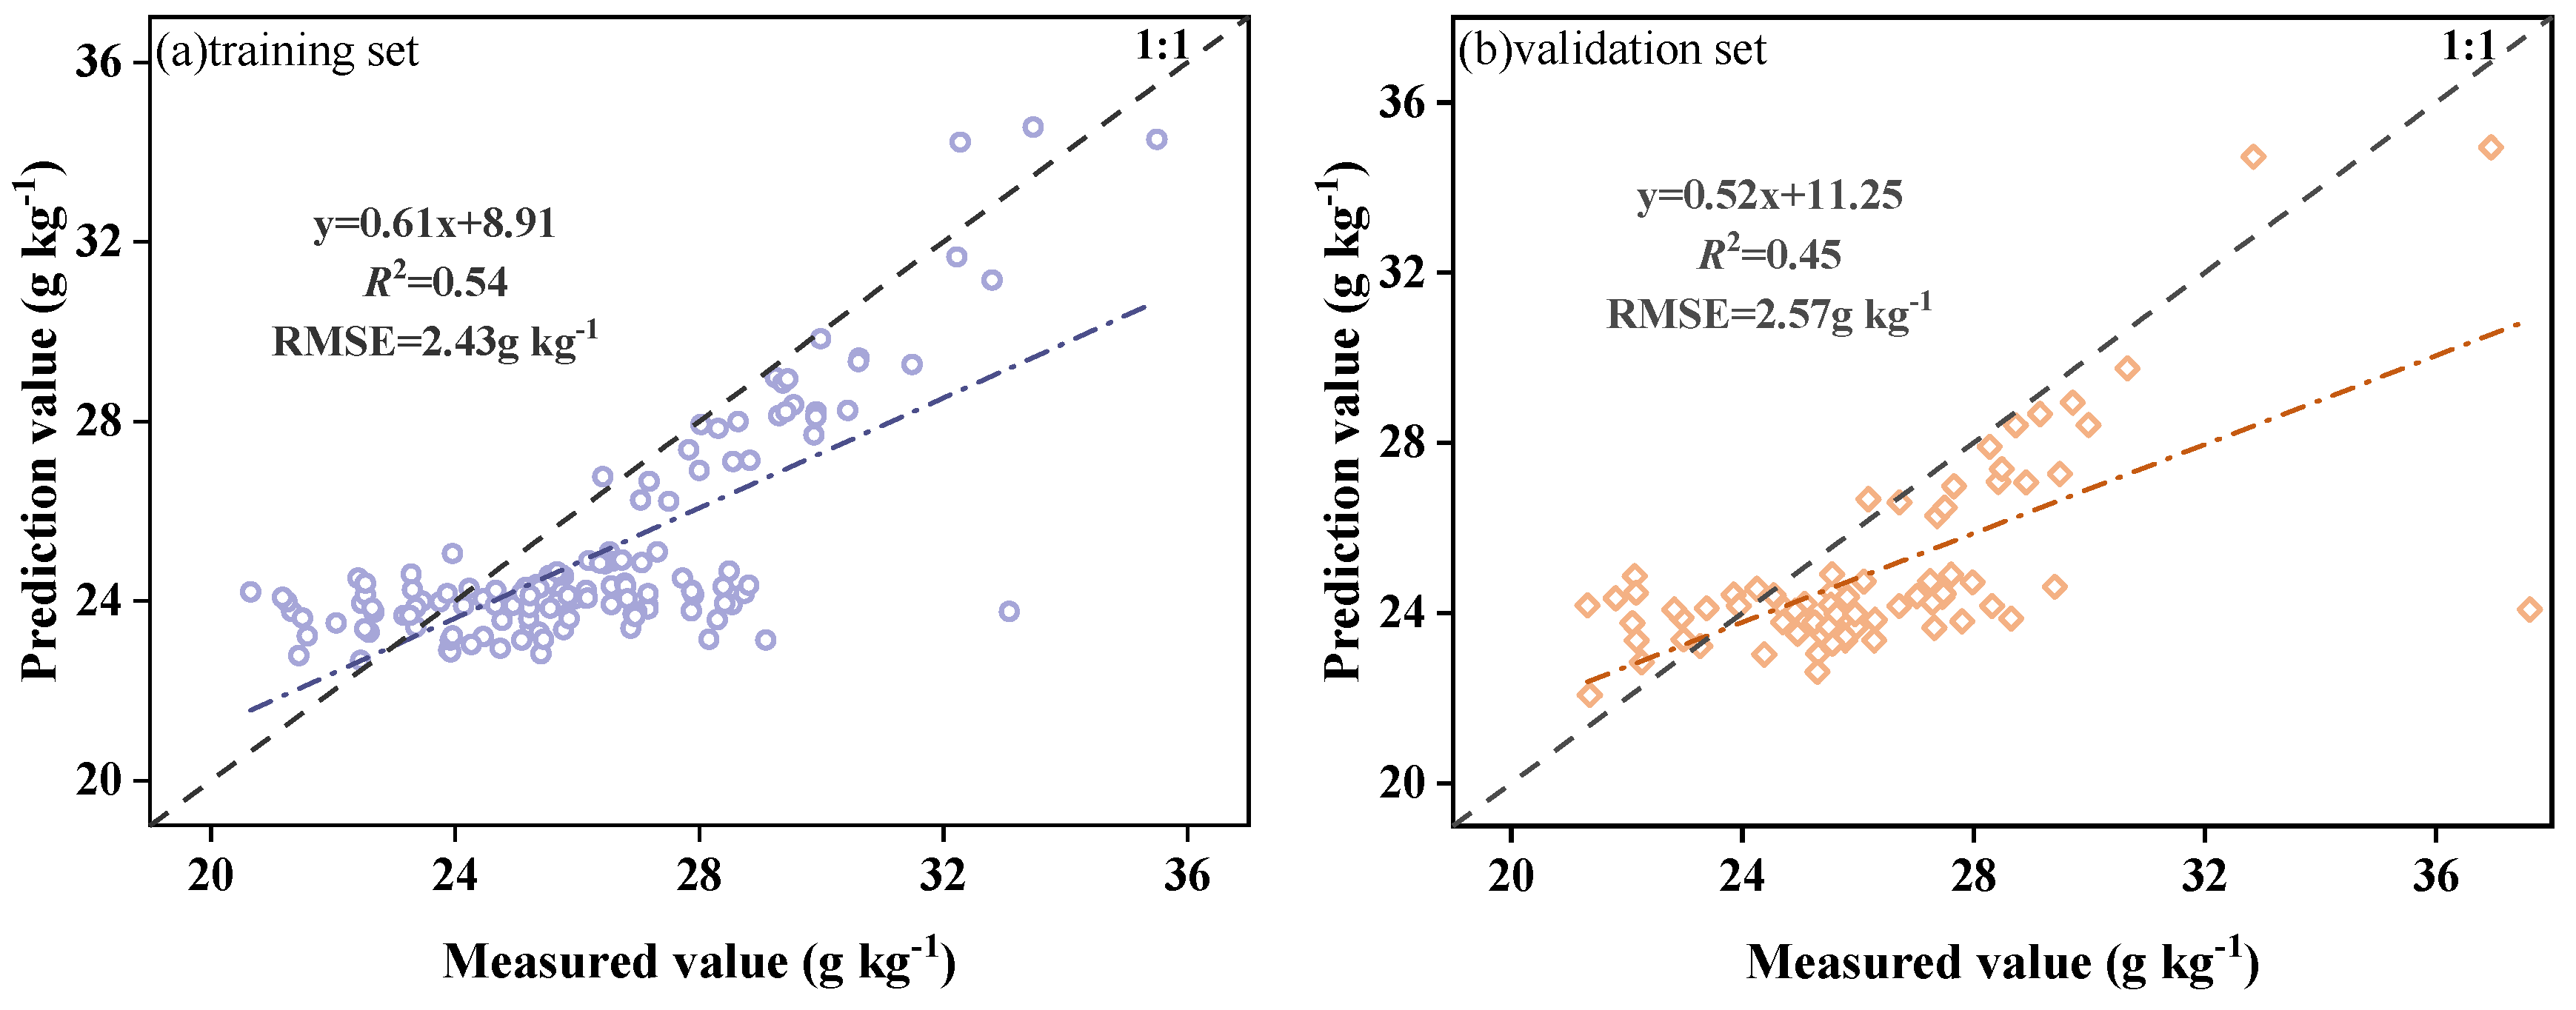
The model simulation and validation results showed that the simple linear regression model achieved an R2 of 0.52 and an RMSE of 2.14 g kg−1 for the training set, and an R2 of 0.49 and an RMSE of 2.55 g kg−1 for the test set (Figure 9). In comparison, the quadratic regression model improved the training-set R2 to 0.54, but its RMSE increased to 2.43 g kg−1. Moreover, its performance on the test set declined, with an R2 of 0.45 and an RMSE of 2.57 g kg−1 (Figure 10). These results indicate that although the quadratic model exhibited slightly stronger nonlinear fitting ability during training, its generalization performance and prediction stability for unseen samples were inferior to those of the structurally simpler linear model, suggesting a certain risk of overfitting.
L N C = 11.94 + 1.14 E V I
L N C = 17.36 3.78 E V I + 1.09 E V I 2
EVI represents the enhanced vegetation index, and LNC represents leaf nitrogen content.
Based on the correlation analysis between vegetation indices and LNC, the enhanced vegetation index (EVI), transformed vegetation index (TVI), and modified triangular vegetation index (MTVI), which showed relatively high correlations with LNC, were selected as independent variables to construct a multi-index inversion model. The model form is shown in Equation (5). These three vegetation indices are derived from combinations of two to three spectral bands, thereby incorporating multi-band spectral sensitivity information while only moderately increasing the feature dimensionality. This helps achieve a balance between information representation ability and model complexity [51].
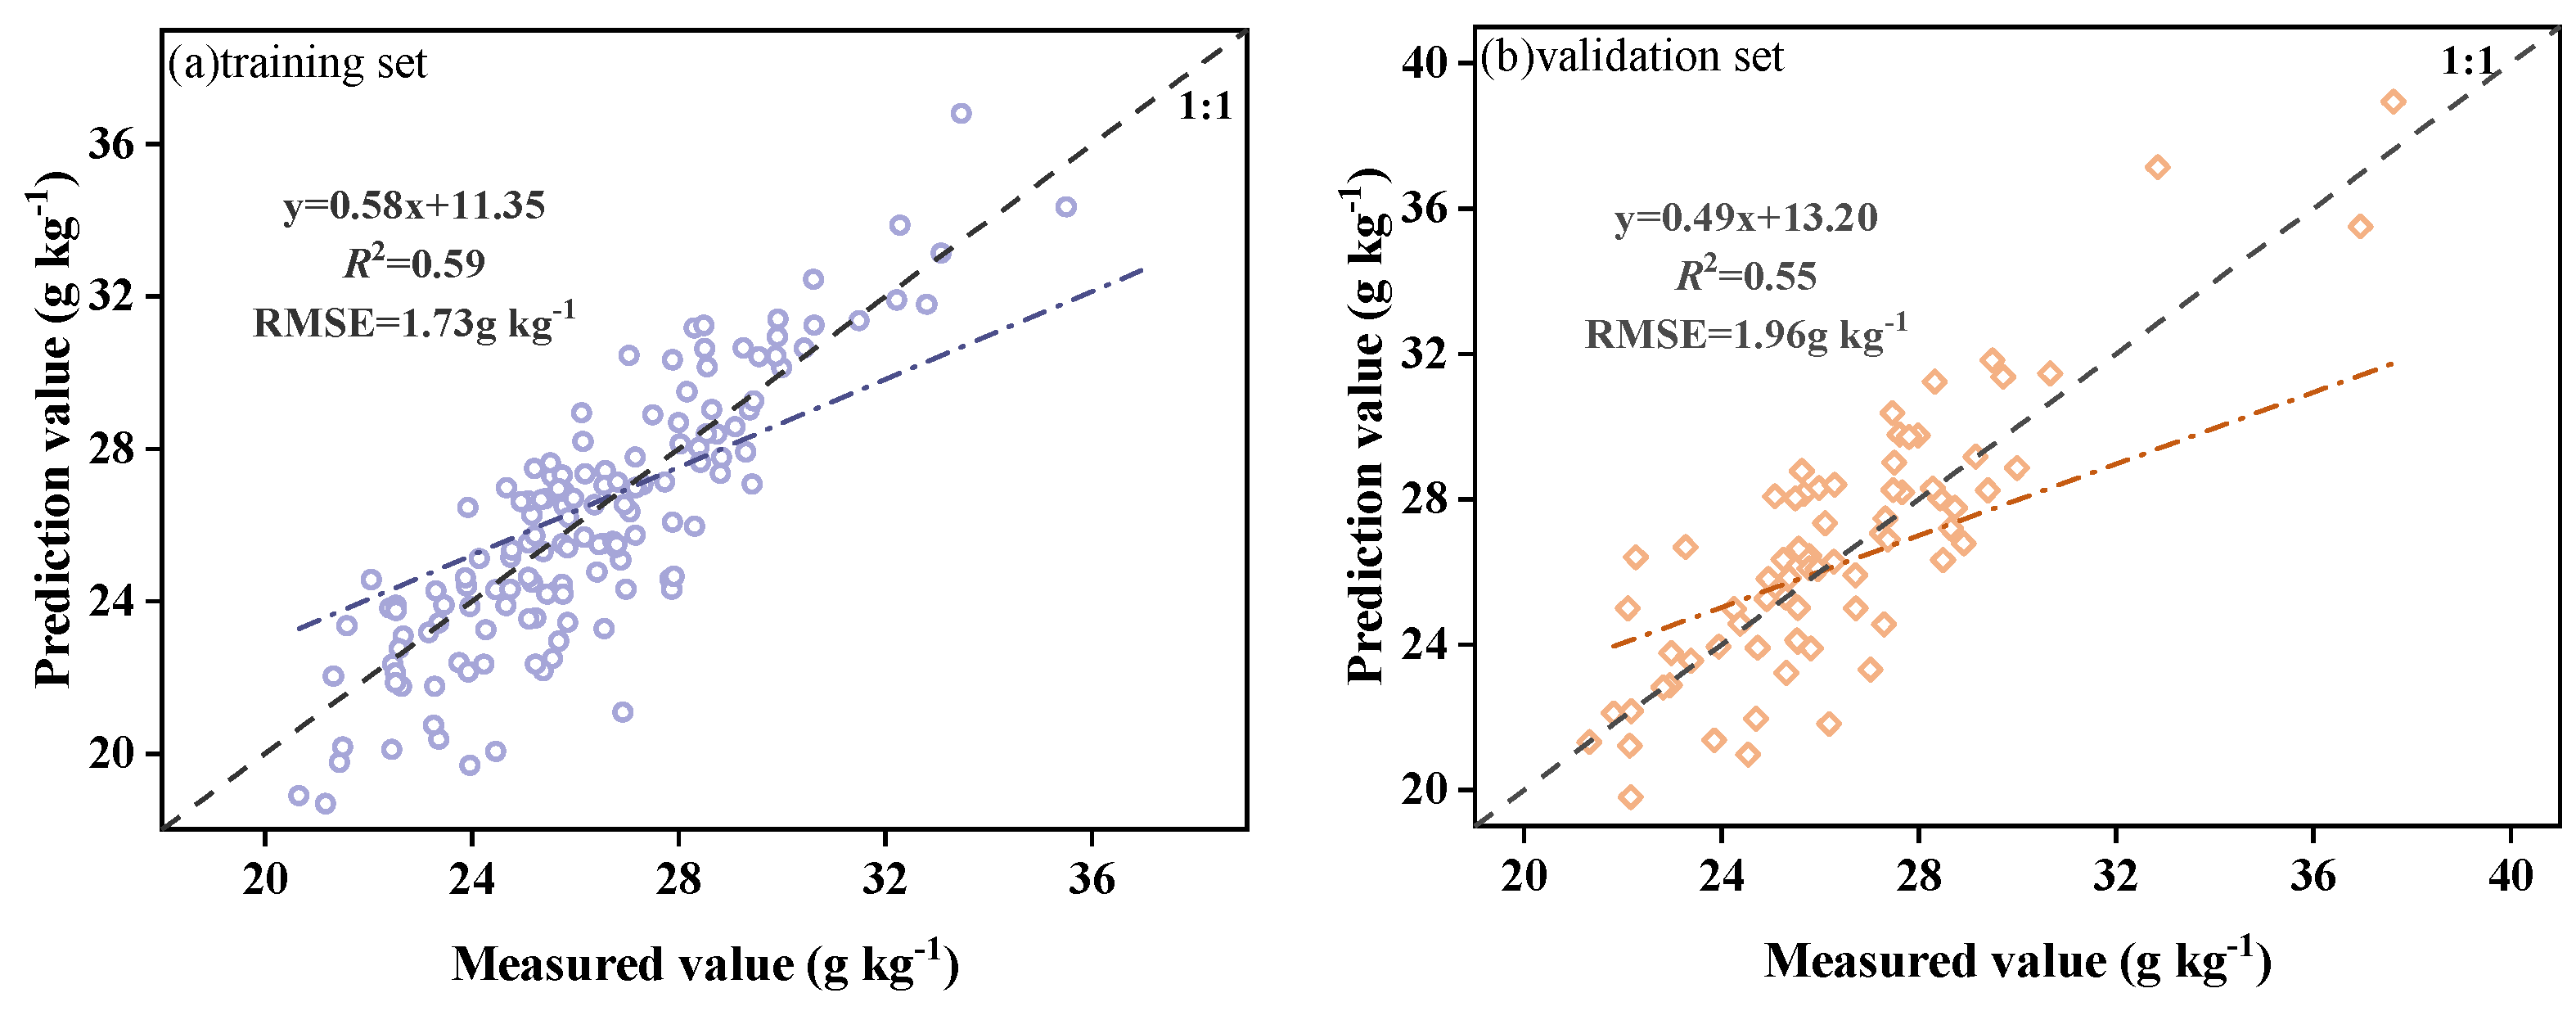
The simulation and validation results showed that the multi-index partial least squares regression model achieved an R2 of 0.59 and an RMSE of 1.73 g kg−1 for the training set, and an R2 of 0.55 and an RMSE of 1.96 g kg−1 for the test set (Figure 11). Overall, its performance was superior to that of the inversion model constructed using a single vegetation index, indicating better stability and predictive capability.
L N C = 26.09 + 0.99 E V I 0.12 T V I 0.16 M T V I
EVI represents the enhanced vegetation index; TVI represents the transformed vegetation index; MTVI represents the modified triangular vegetation index; and LNC represents leaf nitrogen content.
(3)
Nonlinear Regression Models
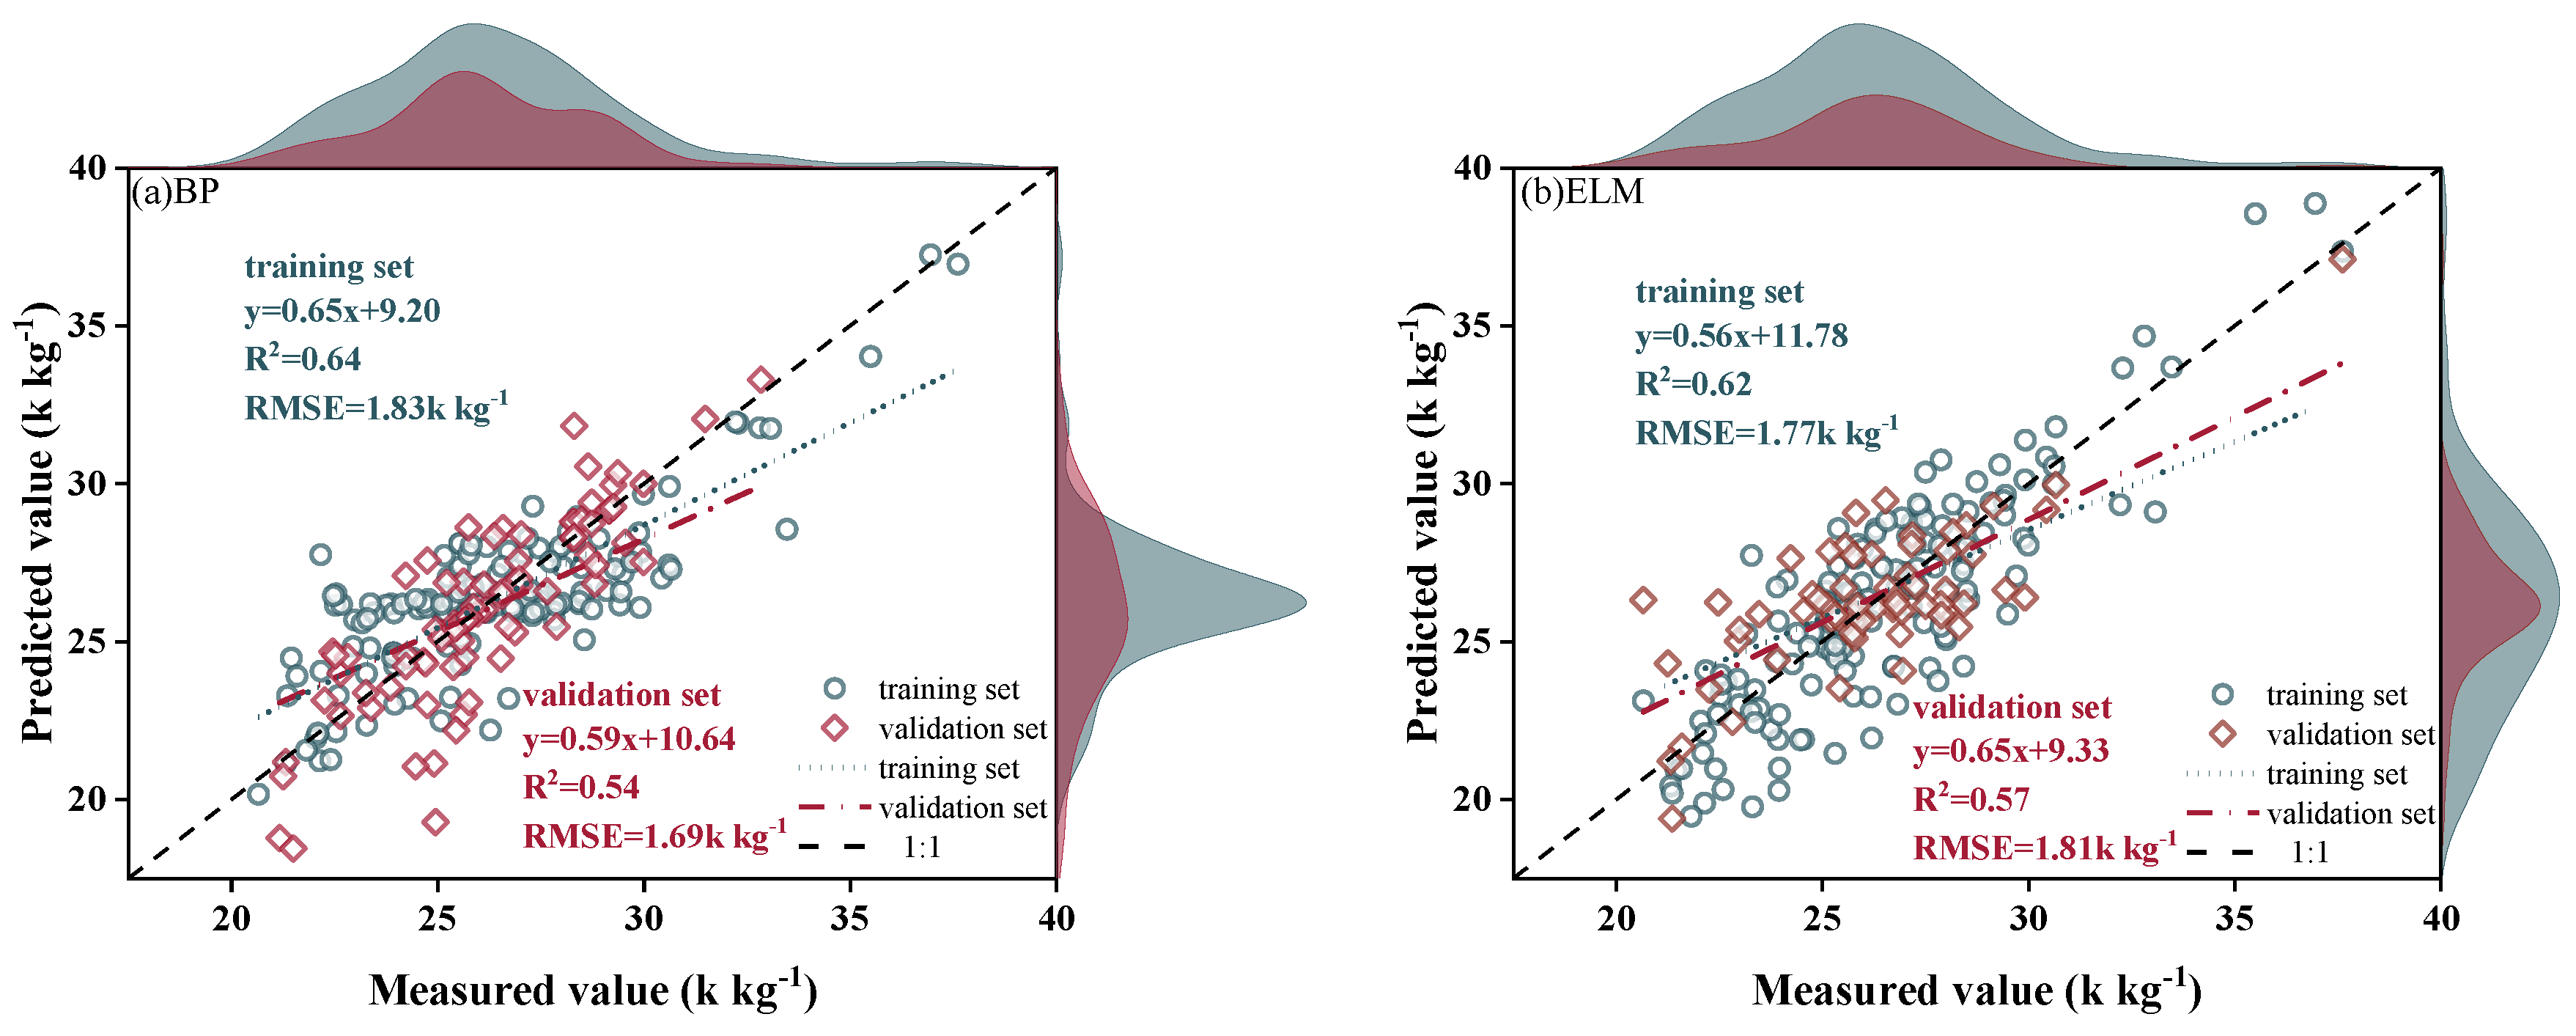
The inversion performance of different modeling methods was compared. Both the conventional BP neural network and ELM models effectively estimated LNC across the whole growth period. For the BP model, the training set achieved an R2 of 0.64 and an RMSE of 1.83 g kg−1, while the test set achieved an R2 of 0.54 and an RMSE of 1.69 g kg−1 (Figure 12a). For the ELM model, the training set achieved an R2 of 0.62 and an RMSE of 1.77 g kg−1, and the test set also achieved an R2 of 0.57 and an RMSE of 1.81 g kg−1 (Figure 12b). These results indicate that, without hyperparameter optimization, the fitting ability of the two models for training samples was relatively limited, and their improvement in inversion accuracy for independent samples was small, suggesting that their generalization performance remained constrained to some extent.
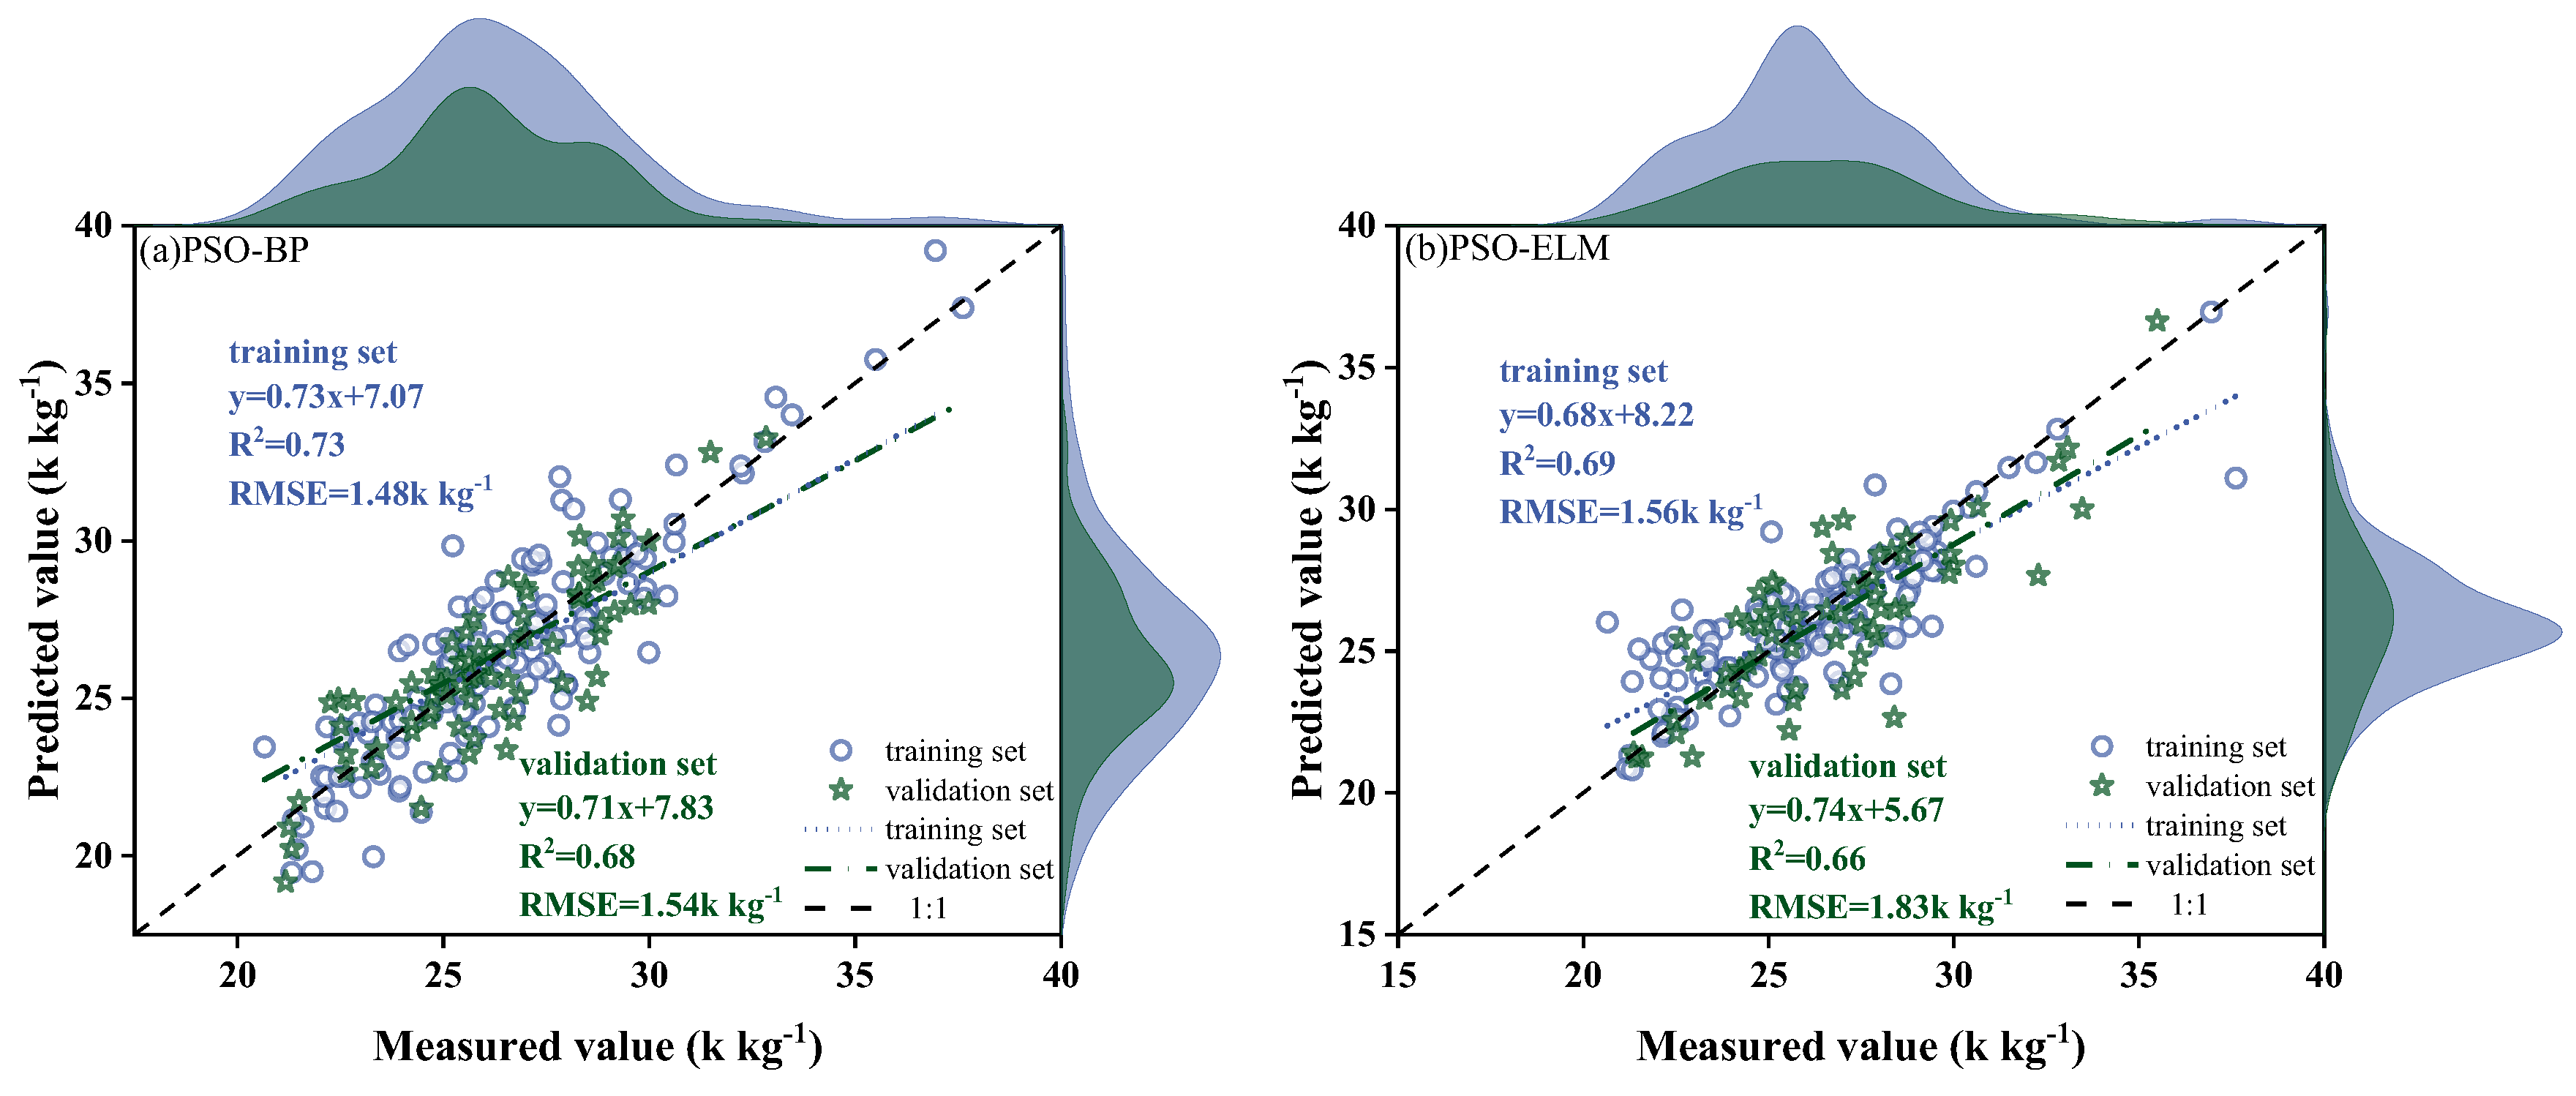
After introducing the PSO algorithm for global optimization of model weights and biases, the inversion accuracy of both PSO-BP and PSO-ELM models improved markedly. For the PSO-BP model, the training-set R2 increased to 0.73 and the RMSE decreased to 1.48 g kg−1, while the test-set R2 reached 0.68, representing a 25.93% improvement over the baseline BP model (Figure 13a). Meanwhile, the test-set RMSE decreased from 1.69 to 1.54 g kg−1, corresponding to a reduction of 8.88%, indicating strong nonlinear fitting ability and favorable generalization performance. The PSO-ELM model also showed stable improvement in accuracy, with a training-set R2 of 0.69 and an RMSE of 1.56 g kg−1, and a test-set R2 of 0.66, representing a 22.22% improvement over the baseline ELM model (Figure 13b). Its RMSE decreased to 1.66 g kg−1, with a reduction of 1.78%.
Compared with the baseline models, the PSO optimization strategy narrowed the generalization gap between the training and test sets, indicating that the optimized models achieved a more reasonable balance between model complexity control and generalization ability.
In summary, the PSO-BP model slightly outperformed the PSO-ELM model in terms of inversion accuracy, whereas PSO-ELM showed certain advantages in model simplicity and computational efficiency. The introduction of the particle swarm optimization algorithm significantly improved the stability and reliability of vegetation-index-based LNC inversion models under multi-temporal remote sensing data conditions, providing solid technical support for precise nitrogen monitoring and water–nitrogen regulation decision-making in citrus orchards.
(4)
Performance Comparison of Nonlinear Regression Inversion Models
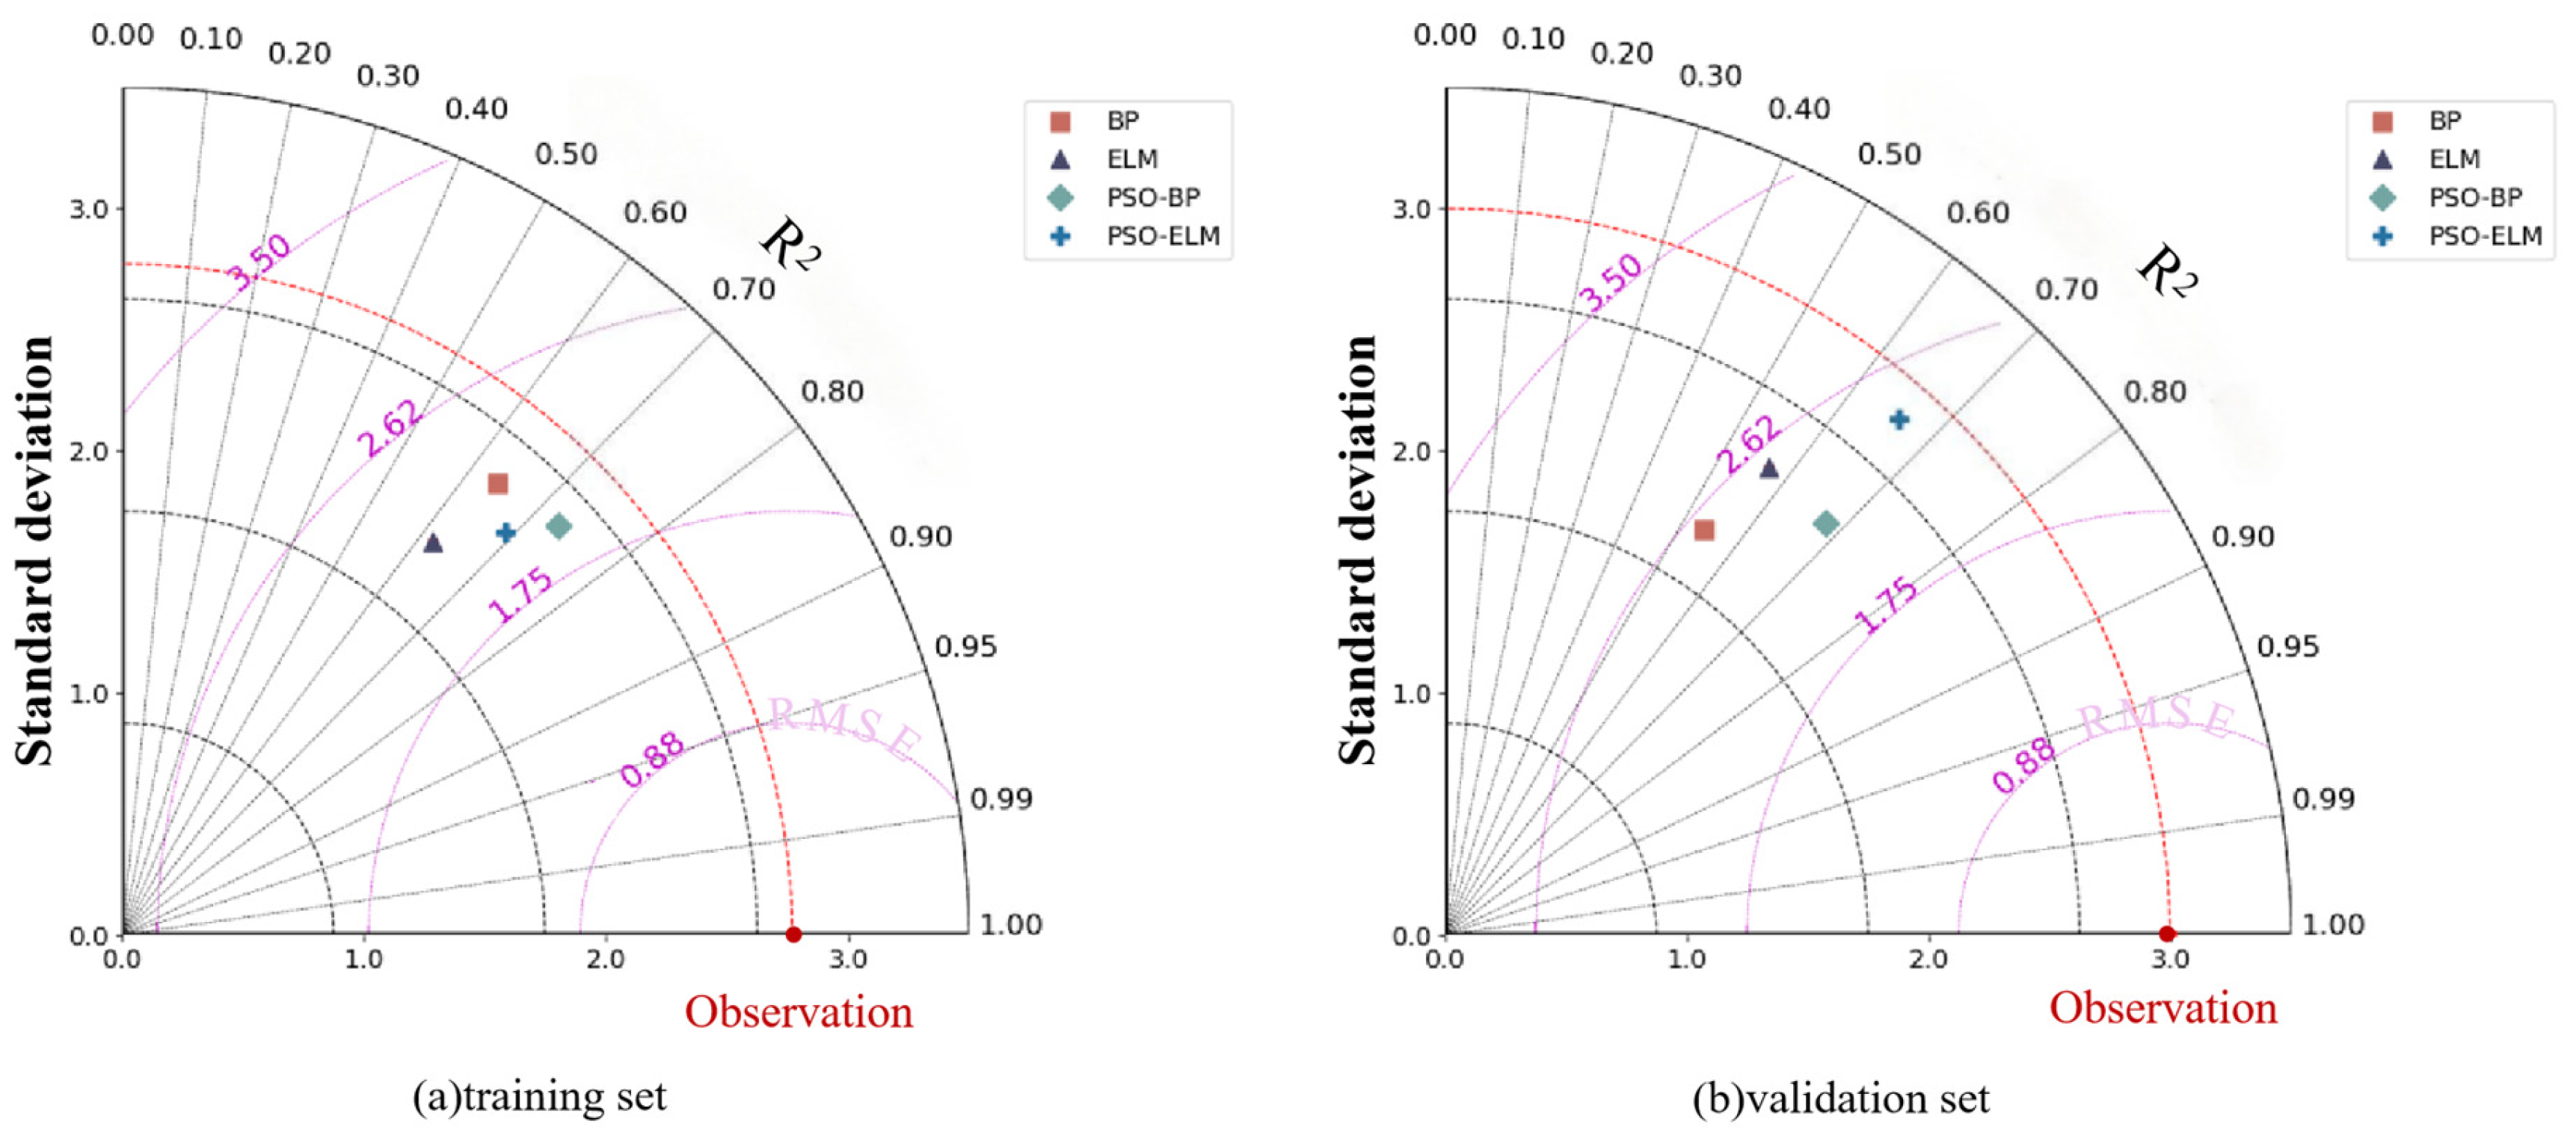
To comprehensively evaluate the statistical consistency and overall performance of different machine learning models in LNC inversion, a Taylor diagram was used to compare the simulation results of each model (Figure 14). By simultaneously displaying the standard deviation (SD), R2, and RMSE between model predictions and observations within the same coordinate system, the Taylor diagram provides an intuitive assessment of a model’s ability to reproduce observed variability and its overall fitting performance.
Taylor diagrams were constructed separately for the training and test sets to avoid statistical bias caused by mixing different sample datasets. The observed values were used as the reference point, with their standard deviation representing the actual variability of the corresponding dataset, the correlation coefficient set to 1, and RMSE equal to 0. The position of each model point was determined based on the prediction results and the corresponding observed values. The SD, R2, and RMSE values used in the Taylor diagram were calculated based on the final prediction results of each model on the complete training or test set, thereby ensuring comparability among different models.
At the training-set scale, the PSO-BP and PSO-ELM models showed standard deviation values closer to those of the observations. Among them, the PSO-BP model exhibited the highest correlation and the lowest RMSE, indicating better model fit. In contrast, the conventional BP and ELM models showed larger deviations in both standard deviation and correlation. For the test set, the distances between model points and the observational reference point varied among models. PSO-BP and PSO-ELM still maintained relatively high correlations and low RMSE values, indicating favorable generalization ability, whereas the unoptimized models showed relatively weaker statistical consistency.
The Taylor diagram results further confirmed the effectiveness of the PSO strategy in improving model stability and generalization performance. They also demonstrated that PSO-BP achieved the best overall performance for LNC inversion across the whole growth period. This analysis provides an intuitive and reliable statistical basis for the comparative evaluation of different model performances.

4. Discussion

This study focused on canopy spectral extraction and leaf nitrogen content (LNC) inversion in citrus orchards under complex background conditions. The applicability of minimum distance classification (MDC), maximum likelihood classification (MLC), and object-based image analysis (OBIA) for land-cover classification of multi-temporal UAV remote sensing images of citrus orchards was systematically compared. Furthermore, the relationships between vegetation indices and LNC, as well as the inversion performance of different modeling methods across the whole growth period, were analyzed. The results showed that citrus orchards have complex land-cover compositions and discontinuous canopy distributions, and the selection of land-cover classification methods directly affects the quality of canopy spectral information extraction, thereby influencing subsequent vegetation index calculation and the stability of LNC inversion models.
From the land-cover classification results, all three methods showed certain ability to identify background objects such as bare soil and grass, indicating that some non-woody land-cover types in citrus orchards have spectral differences from tree canopies that can be captured by remote sensing images. However, during the identification of citrus canopies and vegetation-related land-cover types such as grass, the PA and UA values of MDC and MLC were relatively low, with more evident misclassification. This result is consistent with previous studies, which reported that in complex agricultural landscapes such as orchards, different vegetation types are prone to the phenomena of “different objects with similar spectra” or “the same object with different spectra”, thereby reducing the accuracy of supervised classification based on pixel-level spectral information [52]. MDC and MLC mainly rely on pixel-level spectral features for classification. When citrus canopies are sparse, canopy boundaries are irregular, or surface cover is complex, background information such as grass, bare soil, and shadows can be mixed with canopy spectra, thereby amplifying classification errors.
In contrast, OBIA showed better classification performance in citrus canopy identification, and its PA, UA, OA, and Kappa coefficients were higher than those of MDC and MLC in most periods. OBIA does not rely on individual pixels as classification units; instead, it segments images into homogeneous objects and integrates spectral, shape, texture, and spatial features for classification. Therefore, OBIA can reduce the influence of mixed pixels and salt-and-pepper noise at the object scale [53]. For citrus orchards with complex canopy morphology, fragmented background objects, and strong spatial heterogeneity, OBIA can better maintain the spatial integrity of canopy objects, thereby improving the accuracy and stability of canopy extraction. Further analysis from the temporal perspective showed that the classification accuracy of MDC and MLC fluctuated markedly with citrus growth and development. In particular, during the middle and late growth stages and the fruit color-break and sugar-accumulation stage, OA and Kappa coefficients decreased to varying degrees. In contrast, OBIA showed relatively small variations in classification accuracy across different periods, indicating stronger temporal stability. This stability is attributed to object-based segmentation, which maintains spatial homogeneity across growth stages [54].
Canopy spectral quality directly influences vegetation index calculation and the reliability of LNC inversion models. In this study, the reflectance of different spectral bands showed differentiated responses to growth stage changes and water–nitrogen treatments. Among them, reflectance in the visible bands was mainly affected by leaf pigment content and apparent canopy color changes, whereas reflectance in the near-infrared band reflected leaf internal structure and canopy spatial structure to a greater extent [55]. As citrus growth progressed, the canopy gradually became denser, leaf area index increased, and near-infrared reflectance was enhanced. In contrast, reflectance in the visible bands was jointly affected by changes in chlorophyll content, leaf overlapping, and canopy shading effects, resulting in more complex variation patterns. Because leaf nitrogen is an important basis for chlorophyll synthesis and photosynthetic metabolism, nitrogen application levels can alter canopy spectral responses by affecting leaf nitrogen accumulation and chlorophyll formation. Previous studies have shown that leaf nitrogen content is closely related to reflectance in the visible and red-edge bands, and that appropriate nitrogen application is conducive to increasing chlorophyll content and enhancing spectral sensitivity [56]. Therefore, calculating vegetation indices based on citrus canopy spectra extracted by OBIA can help reduce interference from non-target background information and more accurately characterize changes in leaf nitrogen status.
The statistical analysis of the dataset showed that citrus LNC varied among different growth stages in terms of mean value, standard deviation, and coefficient of variation, while the overall degree of variation remained moderate. This moderate dispersion not only reflects the actual effects of water–nitrogen regulation and growth progression on leaf nutritional status, but also provides the necessary numerical differentiation for remote sensing inversion models. Previous studies have pointed out that either excessively small or excessively large sample variation may reduce the sensitivity of spectral variables to target parameters, thereby affecting model stability and generalization ability [57]. Therefore, the LNC dataset used in this study has good statistical rationality and representativeness, providing a data basis for constructing whole-growth-period inversion models. Furthermore, the LNC distribution characteristics and stage-specific validation results of the PSO-ELM model are summarized in Supplementary Table S1. The higher stage-specific R2 values (0.83–0.91) compared with the whole-growth-period validation were mainly attributed to the relatively homogeneous physiological conditions within individual phenological stages. However, R2 and RMSE reflect different aspects of model performance, and RMSE is affected by the distribution range of measured LNC values. Therefore, higher R2 within specific growth stages does not necessarily correspond to lower RMSE values.
Correlation analysis showed that the relationship between LNC and vegetation indices had significant temporal dependence. The vegetation index with the highest correlation differed among growth stages, indicating that a single vegetation index is insufficient to stably characterize citrus LNC across the whole growth period. Changes in leaf nitrogen content affect chlorophyll synthesis, red-light absorption characteristics, and red-edge position, thereby altering the shape of canopy reflectance spectra. As a result, vegetation indices constructed from different band combinations showed differentiated responses to LNC. This pattern is associated with variations in pigment content, canopy structure, and background effects during crop growth. In the early growth stage, citrus canopy coverage was relatively low, and background information such as soil and inter-row grass contributed substantially to canopy spectra, which interfered with the correlations between some vegetation indices and LNC. As growth progressed, the canopy gradually closed, background effects weakened, and canopy reflectance signals were increasingly dominated by leaf physiological status and canopy structure, resulting in changes in the relationships between vegetation indices and LNC.
The simple linear and quadratic regression models established for different growth stages were both able to quantitatively estimate LNC, but their accuracy varied markedly among stages. The quadratic regression model showed slightly higher fitting accuracy than the simple linear regression model in some periods, indicating that the relationship between vegetation indices and LNC may not be purely linear, but may also be influenced by factors such as leaf internal structure, nitrogen allocation, and canopy background variation, thus exhibiting certain nonlinear characteristics. However, simply increasing the model order provided limited improvement in inversion accuracy. This is attributed to increasing model complexity does not introduce new spectral information, and adjusting the functional form alone is insufficient to substantially enhance the representation of physiological processes. This is consistent with the view reported in previous studies that increased model complexity does not necessarily lead to improved generalization ability [58].
At the whole-growth-period scale, vegetation indices such as EVI, TVI, and MTVI showed relatively strong sensitivity and were suitable as feature variables for cross-stage LNC modeling. Linear and nonlinear models constructed using these vegetation indices were able to achieve continuous inversion of citrus LNC to a certain extent. However, traditional linear models still showed limited adaptability under complex growth backgrounds and nonlinear spectral response conditions. After introducing machine learning methods such as BP neural network and ELM, the ability of the models to characterize nonlinear relationships was enhanced. This likely due to machine learning methods can comprehensively utilize multi-dimensional vegetation index information and capture the nonlinear coupling relationships among leaf nitrogen status, canopy structure, and background information. Nevertheless, unoptimized models still showed certain accuracy differences between the training and validation sets, indicating that model performance may be affected by initial parameter settings, sample partitioning, and network structure. After introducing the particle swarm optimization algorithm for global parameter search, PSO-BP and PSO-ELM models both showed certain advantages in fitting accuracy and generalization ability. This indicates that PSO optimization can improve the global optimality of model parameter combinations and reduce the effects of local optima and random initialization on model performance.
To further evaluate the performance of the proposed framework, the obtained results were compared with previous nitrogen estimation studies in citrus and other perennial fruit crops. Previous studies have demonstrated that spectral-based approaches have considerable potential for non-destructive nitrogen monitoring in citrus. For example, a citrus canopy nitrogen estimation study based on the two-band vegetation index (TBVI) achieved an R2 of 0.6071, indicating the feasibility of using spectral information for citrus nitrogen diagnosis, although the prediction capability of individual vegetation indices remains limited [59]. Another study using hyperspectral information combined with the CEEMDAN–SR algorithm further improved the estimation of citrus leaf nitrogen content, demonstrating that advanced spectral feature extraction methods can enhance nitrogen prediction performance [60]. However, hyperspectral approaches generally rely on high-dimensional spectral information and may have limitations in large-scale orchard applications due to data acquisition and processing complexity. Compared with previous studies, UAV multispectral-based machine learning methods have shown improved applicability for orchard-scale nitrogen monitoring. Zhao et al. [61] estimated apple canopy leaf nitrogen content using UAV multispectral imagery and machine learning models, reporting validation R2 values ranging from 0.670 to 0.797 across different growth stages. In the present study, the optimized PSO-BP model achieved a validation R2 of 0.68 with an RMSE of 1.54 g kg−1 for whole-growth-period citrus LNC estimation, which falls within the performance range reported for perennial fruit crops. The slightly different performance among studies may be attributed to variations in crop species, canopy architecture, phenological stages, sampling strategies, and feature extraction methods. Unlike approaches directly using pixel-level spectral information or single vegetation indices, the proposed framework integrates OBIA-based canopy extraction before spectral modeling, thereby reducing contamination from soil, shadows, and inter-row vegetation. Therefore, the major contribution of this study is not only the improvement of prediction accuracy but also the enhancement of spectral feature reliability and model stability under heterogeneous orchard conditions.
In summary, OBIA showed clear advantages in land-cover classification and canopy information extraction from citrus orchard remote sensing images. It maintained relatively high and stable classification accuracy across different growth stages, thereby providing a more reliable canopy spectral data basis for subsequent LNC remote sensing inversion. Meanwhile, multi-temporal correlation analysis indicated that the spectral response of citrus LNC had obvious growth-stage dependence, and a single vegetation index was insufficient for stable monitoring across the whole growth period. The UAV multispectral inversion workflow constructed by integrating object-based canopy extraction, multi-vegetation-index feature selection, and optimized machine learning models can improve the accuracy and stability of citrus LNC estimation in complex orchard scenarios to a certain extent, and can provide methodological support for orchard nitrogen diagnosis, precision fertilization, and intelligent orchard management.

5. Conclusions

This study proposes a UAV multispectral inversion framework for estimating citrus leaf nitrogen content (LNC) under complex orchard backgrounds by integrating object-based canopy extraction and machine learning models. The main points are as follows:
  • Background interference from soil, shadows, and non-canopy vegetation is identified as a key limiting factor in UAV-based spectral inversion. Object-based image analysis (OBIA), by integrating spectral, spatial, and textural features, significantly improves the purity of canopy spectral information purity compared with pixel-based classification methods, thereby providing more reliable input data for subsequent modeling.
  • Citrus LNC exhibits strong phenological dependency in its spectral response. The relationships between vegetation indices and LNC vary across growth stages, indicating that no single vegetation index can consistently characterize nitrogen status throughout the whole growing period. Temporal variability therefore represents a fundamental challenge in multi-stage nutrient monitoring.
  • Nonlinear modeling approaches outperform traditional linear and single-variable regression models in capturing the complex relationship between canopy spectral features and LNC. In particular, optimization algorithms improve model robustness by optimizing parameter settings and reducing sensitivity to initial conditions, leading to improved generalization across growth stages.
Compared with previous UAV-based nitrogen estimation studies in citrus and other orchard systems, the proposed framework achieved comparable prediction performance while providing improved robustness under heterogeneous orchard backgrounds. Differences in accuracy may be related to orchard structure, temporal sampling frequency, and feature extraction strategies. Unlike methods that directly use pixel-based spectral information or single-stage vegetation indices, this study incorporates object-based canopy extraction prior to spectral modeling, reducing mixed-pixel effects and background contamination. This improves the physical consistency of input features and enhances model stability across phenological stages rather than only improving peak accuracy.
Overall, the proposed framework combining object-based canopy extraction, multi-index feature representation, and optimized machine learning models improves the stability and robustness of UAV-based citrus nitrogen estimation in heterogeneous orchard environments. This approach enhances the reliability of spectral inversion and supports precision nitrogen management.
The proposed framework shows potential for precision nitrogen management in orchard systems; however, its current predictive performance suggests that it is more suitable for relative nitrogen status assessment than direct fertilization recommendation. Model transferability may be limited by site-specific canopy structure, management practices, and seasonal variability, indicating the need for recalibration when applied to different orchards or climatic conditions.
Future work should focus on multi-year and multi-location validation and the integration of structural and environmental variables to further enhance model transferability and physiological interpretability.

Supplementary Materials

The following supporting information can be downloaded at: https://www.mdpi.com/article/10.3390/agriculture16151570/s1, Table S1: Statistical characteristics of LNC samples and stage-specific validation performance of the PSO-ELM model.

Author Contributions

Methodology, H.G.; software, Y.Z.; validation, Y.F.; writing—original draft preparation, W.Z.; funding acquisition, S.W. All authors have read and agreed to the published version of the manuscript.

Funding

This research was funded by the Key Scientific Research Project of Higher Education Institutions in Henan Province (grant Nos. 25A570004, 26A570003); the Natural Science Foundation of Henan Province (grant No. 262300421363); and the Natural Science Foundation of Hubei Province (grant No. 2025AFB103).

Data Availability Statement

The original contributions presented in the study are included in the article; further inquiries can be directed to the corresponding author.

Conflicts of Interest

The authors declare no conflicts of interest.

References

  1. Zheng, Z.; Zhang, Y.; Sun, L.; Wang, X. Detecting small targets from citrus leaf disease images using improved YOLOv5. Trans. Chin. Soc. Agric. Eng. 2025, 41, 203–211. [Google Scholar]
  2. Li, C.; Fu, X.; Fu, H.; Song, J.; Li, G. Real-time detecting and counting of citrus fruits in hilly and mountainous areas using UAV imagery. Trans. Chin. Soc. Agric. Eng. 2025, 41, 153–161. [Google Scholar]
  3. Yu, K.; Zhong, M.; Zhu, W.; Rashid, A.; Han, R.; Virk, M.-S.; Duan, K.; Zhao, Y.; Ren, X. Advances in computer vision and spectroscopy techniques for non-destructive quality assessment of citrus fruits: A comprehensive review. Foods 2025, 14, 386. [Google Scholar] [CrossRef] [PubMed]
  4. Zhao, Z.; Du, S.; Wang, D.; Wang, Y.; Fu, Z. AI-identified peptides boost jasmonate-mediated natural resistance against citrus Huanglongbing. Sci. Bull. 2025, 70, 3708–3710. [Google Scholar]
  5. Tang, Q.; Li, K.; Zhou, Y.; Wang, X. Identification of gannan citrus planting area based on Sentinel-2 and temporal Sentinel-1 SAR features. Trans. Chin. Soc. Agric. Mach. 2024, 55, 193–202. [Google Scholar]
  6. Yue, J.; Leng, M.; Tian, Q.; Guo, W.; Liu, Y.; Feng, H.; Qiao, H. Estimation of leaf physical and chemical parameters based on hyperspectral remote sensing and deep learning technologies. Spectrosc. Spectr. Anal. 2024, 44, 2873–2883. [Google Scholar]
  7. Féret, J.-B.; Le Maire, G.; Jay, S.; Berveiller, D.; Bendoula, R.; Hmimina, G.; Cheraiet, A.; Oliveira, J.C.; Ponzoni, F.J.; Solanki, T.; et al. Estimating leaf mass per area and equivalent water thickness based on leaf optical properties: Potential and limitations of physical modeling and machine learning. Remote Sens. Environ. 2019, 231, 110959. [Google Scholar] [CrossRef]
  8. Zhang, W.; Zhu, S.; Qin, W.; Sun, A.; Li, H.; Hao, K.; Zhong, Y. Optimizing irrigation and nitrogen management enhances yield, resource efficiency, and fruit quality in global citrus systems: A meta-analysis. Agric. Water Manag. 2026, 331, 110450. [Google Scholar] [CrossRef]
  9. Luo, X.; Xie, T.; Dong, S. Estimation of citrus canopy chlorophyll based on UAV multispectral images. Trans. Chin. Soc. Agric. Mach. 2023, 54, 198–205. [Google Scholar]
  10. Zha, H.; Miao, Y.; Wang, T.; Li, Y.; Zhang, J.; Sun, W.; Feng, Z.; Kusnierek, K. Improving unmanned aerial vehicle remote sensing-based rice nitrogen nutrition index prediction with machine learning. Remote Sens. 2020, 12, 215. [Google Scholar] [CrossRef]
  11. Noguera, M.; Aquino, A.; Ponce, J.M.; Cordeiro, A.; Silvestre, J.; Rocío, A.C.; da Encarnação Marcelo, M.; Jordão, P.; Andújar, J.M. Nutritional status assessment of olive crops by means of the analysis and modelling of multispectral images taken with UAVs. Biosyst. Eng. 2021, 211, 1–18. [Google Scholar] [CrossRef]
  12. Shao, G.; Han, W.; Zhou, B.; Wang, Y.; Lin, G. Estimation of aboveground biomass of maize based on multisource remote sensing and meteorological parameters. Trans. Chin. Soc. Agric. Mach. 2025, 56, 436–449. [Google Scholar]
  13. Wu, Y.; Luo, M.; Qin, Y.; Huang, E.; Wu, B.; Ban, Z. A machine learning inversion model for aboveground biomass of forests based on feature-algorithm collaborative optimization using multi-source remote sensing data. J. Northeast. For. Univ. 2026, 54, 116–127. [Google Scholar]
  14. Mashori, A.S.; Li, F.; Aman, M.; Zhang, W.; Jia, S.; Ali, A.; Jabeen, N.; Hao, W.; Yan, Y. Remote sensing through UAVs for precision agriculture: Applications, technical foundations, current barriers, and future opportunities. Smart Agric. Technol. 2026, 14, 102074. [Google Scholar] [CrossRef]
  15. Berger, K.; Verrelst, J.; Féret, J.-B.; Wang, Z.; Wocher, M.; Strathmann, M.; Danner, M.; Mauser, W.; Hank, T. Crop nitrogen monitoring: Recent progress and principal developments in the context of imaging spectroscopy missions. Remote Sens. Environ. 2020, 242, 111758. [Google Scholar] [CrossRef] [PubMed]
  16. Yan, K.; Gao, S.; Yan, G.; Ma, X.; Chen, X.; Zhu, P.; Li, J.; Gao, S.; Gastellu-Etchegorry, J.-P.; Myneni, R.B.; et al. A global systematic review of the remote sensing vegetation indices. Int. J. Appl. Earth Obs. Geoinf. 2025, 139, 104560. [Google Scholar] [CrossRef]
  17. Wang, B.; Yan, Y.; Zhao, J.; Kaousar, R.; Lan, Y. Status and prospect of the application of UAV remote sensing technology in smart orchard management. Crop Prot. 2025, 195, 107240. [Google Scholar] [CrossRef]
  18. Li, M.; Zhu, X.; Bai, X.; Peng, Y.; Tian, Z.; Jiang, Y. Remote sensing inversion of nitrogen content in apple canopy based on shadow removal in UAV multispectral remote sensing images. Sci. Agric. Sin. 2021, 54, 2084–2094. [Google Scholar]
  19. Liu, Q.; Wang, M.; Cui, N.; Zheng, S.; Wu, Z.; Jiang, S.; Wang, Z.; Gong, D.; Zhao, L.; Xing, L.; et al. Cross-regional estimation of leaf chlorophyll and soil moisture content in drip-irrigated citrus orchards using UAV data and transfer learning. Agric. Water Manag. 2026, 328, 110317. [Google Scholar] [CrossRef]
  20. Li, Y.; Du, C.; Zhang, T.; Ge, Y.; Liu, W.; Yuan, S.; Liu, X. Estimation of citrus leaves’ nitrogen content by multispectral unmanned aerial vehicle remote sensing based on semi-supervised twin neural network regression. J. Appl. Remote Sens. 2024, 18, 034506. [Google Scholar] [CrossRef]
  21. Li, J. Application development and enlightenment of agricultural remote sensing technology. Agric. Technol. Equip. 2024, 7, 63–66. [Google Scholar] [CrossRef]
  22. Sun, X.; Wang, H.; Han, Q.; Sun, K.; Li, Y.; Wang, J.; Pei, Z. Methods for estimating the aboveground biomass of Salix psammophila shrublands using UAV remote sensing data. J. Northeast. For. Univ. 2025, 53, 74–81. [Google Scholar]
  23. Zhu, H.; Luo, C.; Guan, H.; Zhang, X.; Yang, J.; Song, M.; Liu, H. Object-oriented extraction of maize fallen area based on multi-source satellite remote sensing images. Remote Sens. Technol. Appl. 2022, 37, 599–607. [Google Scholar]
  24. Ishida, T.; Kurihara, J.; Viray, F.A.; Namuco, S.B.; Paringit, E.C.; Perez, G.J.; Takahashi, Y.; Marciano, J.J. A novel approach for vegetation classification using UAV-based hyperspectral imaging. Comput. Electron. Agric. 2018, 144, 80–85. [Google Scholar] [CrossRef]
  25. Yuan, X.; Kong, R.; Xing, S.; Zhang, G.; Wang, D. Machine learning depth inversion based on different optimization methods and SHAP analysis. Bull. Surv. Mapp. 2025, 41, 16–20. [Google Scholar]
  26. Zhao, J.; Cao, T.; Lan, Y.; Pan, F.; Wen, Y.; Yang, D.; Lu, L. Extraction of maize field ridge centerline based on FCN with UAV remote sensing images. Trans. Chin. Soc. Agric. Eng. 2021, 37, 72–80. [Google Scholar]
  27. Zhang, X.; Zhang, Y.; Xia, C.; Zhang, X.; Li, Y.; Li, X. Estimation of leaf nitrogen content in maize based on UAV hyperspectral image. Remote Sens. Technol. Appl. 2024, 39, 927–939. [Google Scholar]
  28. Sun, F.; Lai, N.; Geng, Q.; Li, Y.; Lv, C.; Xin, H.; Li, N.; Chen, S. Estimation of nitrogen concentration in winter wheat leaves based on hyperspectral images of UAV. Arid Zone Res. 2024, 41, 1069–1078. [Google Scholar]
  29. Lucas, C.; Sudip, K.; Yiannis, A.; Ute, A. Determining leaf nutrient concentrations in citrus trees using UAV imagery and machine learning. Precis. Agric. 2022, 23, 854–875. [Google Scholar]
  30. Fu, Y.; Yang, G.; Pu, R.; Li, Z.; Li, H.; Xu, X.; Song, X.; Yang, X.; Zhao, C. An overview of crop nitrogen status assessment using hyperspectral remote sensing: Current status and perspectives. Eur. J. Agron. 2021, 124, 126241. [Google Scholar] [CrossRef]
  31. Xi, R.; Gu, Y.; Zhang, X.; Ren, Z. Nitrogen monitoring and inversion algorithms of fruit trees based on spectral remote sensing: A deep review. Front. Plant Sci. 2024, 15, 1489151. [Google Scholar] [CrossRef] [PubMed]
  32. Li, Y.; Wu, T.; Ge, Y.; Xi, S.; Zhang, T.; Zhang, W. Semi-supervised cooperative regression model for small sample estimation of citrus leaf nitrogen content with UAV images. Int. J. Remote Sens. 2023, 44, 7237–7262. [Google Scholar] [CrossRef]
  33. Wang, X.; Zhang, J.; Meng, P.; Yang, H.; Sun, S. Estimation of nitrogen content in walnut canopy based on UAV remote sensing image. Trans. Chin. Soc. Agric. Mach. 2021, 52, 178–187. [Google Scholar]
  34. Luo, Y.; Wu, X.; Zhao, X.; Xu, L.; Liu, X.; Xiao, H.; Liao, B.; Hu, R. Minimizing nitrate output from soil organic nitrogen mineralization in citrus orchard catchments through green manure mulching. J. Hydrol. 2025, 646, 132369. [Google Scholar] [CrossRef]
  35. Luo, Y.; Xiong, H.; Zhao, H.; Hu, B.; Yan, C.; Yao, T.; Tang, X.; Zhao, J.; Zhang, Y.; Shi, X.; et al. Accumulated temperature rather than nitrogen fertilization is the main factor determining growth of young citrus trees in the field. Sci. Hortic. 2024, 323, 112511. [Google Scholar] [CrossRef]
  36. Tian, Y.; Jiang, Y.; Zeng, M.; Hui, J.; Jiang, Q. Inversion of cotton leaf area index under Verticillium wilt stress from UAV multispectral images: Deep learning-based vs. classical-based algorithms. Ind. Crops Prod. 2025, 233, 121345. [Google Scholar] [CrossRef]
  37. Wu, T.; Li, Y.; Ge, Y.; Xi, X.; Ren, M.; Yuan, X.; Zhuang, C. Estimation of nitrogen contents in citrus leaves using stacking ensemble learning. Trans. Chin. Soc. Agric. Eng. 2021, 37, 163–171. [Google Scholar]
  38. Hao, K.; Zhang, W.; Zhong, Y.; Sun, A.; Zhu, S.; Zhang, Y.; Wang, Y.; Li, H. Synergistic inversion of citrus leaf water content and chlorophyll content based on PSO-ELM and optimized sensitive vegetation indices. Trans. Chin. Soc. Agric. Mach. 2025, 56, 470–478+511. [Google Scholar]
  39. Cui, B.; Zhao, Q.; Huang, W.; Song, X.; Ye, H.; Zhou, X. Leaf chlorophyll content retrieval of wheat by simulated RapidEye, Sentinel-2 and EnMAP data. J. Integr. Agric. 2019, 18, 1230–1245. [Google Scholar] [CrossRef]
  40. Maxwell, A.E.; Warner, T.A.; Fang, F. Implementation of machine-learning classification in remote sensing: An applied review. Int. J. Remote Sens. 2018, 39, 2784–2817. [Google Scholar] [CrossRef]
  41. Norris, G.S.; LaRocque, A.; Leblon, B.; Barbeau, M.A.; Hanson, A.R. Comparing pixel- and object-based approaches for classifying multispectral drone imagery of a salt marsh restoration and reference site. Remote Sens. 2024, 16, 1049. [Google Scholar] [CrossRef]
  42. Peng, J.; Nieto, H.; Andersen, M.N.; Kørup, K.; Larsen, R.; Morel, J.; Parsons, D.; Zhou, Z.; Manevski, K. Accurate estimates of land surface energy fluxes and irrigation requirements from UAV-based thermal and multispectral sensors. ISPRS J. Photogramm. Remote Sens. 2023, 198, 238–254. [Google Scholar] [CrossRef]
  43. Han, L.; Wang, Z.; He, M.; He, X. Effects of different ground segmentation methods on the accuracy of UAV-based canopy volume measurements. Front. Plant Sci. 2024, 15, 1393592. [Google Scholar] [CrossRef] [PubMed]
  44. Modica, G.; Messina, G.; De Luca, G.; Fiozzo, V.; Praticò, S. Monitoring the vegetation vigor in heterogeneous citrus and olive orchards: A multiscale object-based approach to extract tree crowns from UAV multispectral imagery. Comput. Electron. Agric. 2020, 175, 105500. [Google Scholar] [CrossRef]
  45. Liang, J.; Sawut, M.; Cui, J.; Hu, X.; Xue, Z.; Zhao, M.; Zhang, X.; Rouzi, A.; Ye, X.; Xilike, A. Object-oriented multi-scale segmentation and multi-feature fusion-based method for identifying typical fruit trees in arid regions using Sentinel-1/2 satellite images. Sci. Rep. 2024, 14, 18230. [Google Scholar] [CrossRef] [PubMed]
  46. Ataide, V.N.; Pradela Filho, L.A.; Guinati, B.G.S.; Moreira, N.S.; Gonçalves, J.D.; Ribeiro, C.M.G.; Grasseschi, D.; Coltro, W.K.T.; Salles, M.O.; Paixão, T.R.L.C. Combining chemometrics and paper-based analytical devices for sensing: An overview. TrAC Trends Anal. Chem. 2023, 164, 117091. [Google Scholar] [CrossRef]
  47. Li, F.; Zhang, Y.; Wang, W.; Huang, L.; Chen, G.; Jia, W. Enhanced multilayer extreme learning machine for imbalanced dataset: Optimized cost regulation and hierarchical parameter adaptation. Inf. Sci. 2025, 719, 122426. [Google Scholar] [CrossRef]
  48. Dharmaratne, P.P.; Salgadoe, A.S.A.; Rathnayake, W.; Weerasinghe, A.D.A.J.K. Estimating rice crop (Oryza sativa L.) parameters during the Yala season in Sri Lanka using UAV multispectral indices. Remote Sens. Appl. Soc. Environ. 2024, 33, 101132. [Google Scholar] [CrossRef]
  49. Bai, H.; Xiao, D.; Tang, J.; Liu, D. Evaluation of wheat yield in North China Plain under extreme climate by coupling crop model with machine learning. Comput. Electron. Agric. 2024, 217, 108651. [Google Scholar] [CrossRef]
  50. Zhang, W.; Zhu, S.; Zhong, Y.; Li, H.; Sun, A.; Zhang, Y.; Zeng, J. UAV remote sensing for integrated monitoring and model optimization of citrus leaf water content and chlorophyll. Agriculture 2025, 15, 2197. [Google Scholar] [CrossRef]
  51. Tsai, C.F.; Sung, Y.T. Ensemble feature selection in high dimension, low sample size datasets: Parallel and serial combination approaches. Knowl.-Based Syst. 2020, 203, 106097. [Google Scholar] [CrossRef]
  52. Zhou, Z.; Li, P. Lithological mapping from multispectral images using spectral-spatial clustering. Acta Sci. Nat. Univ. Pekin. 2025, 61, 525–534. [Google Scholar]
  53. Ma, L.; Yan, Z.; Li, M.; Liu, T.; Tan, L.; Wang, X. Deep learning meets object-based image analysis: Tasks, challenges, strategies, and perspectives. IEEE Geosci. Remote Sens. Mag. 2024, 13, 136–163. [Google Scholar] [CrossRef]
  54. Yang, S.; Li, Y.; Wang, X.; Yang, Z.; Xu, L.; Hong, Z.; Pan, H.; Chen, C. SHW-Stacking: A weighted stacking method for enhancing the accuracy of remote sensing daily precipitation products by capturing precipitation spatial heterogeneity. J. Geo-Inform. Sci. 2025, 27, 1179–1194. [Google Scholar]
  55. Zhao, J.; Wang, G.; Zhang, Y.; Zhao, L.; Chen, N.; Wang, W.; Du, H.; Li, Z. Hyperspectral detection and visualization of pigment content in different positions of tomato leaf at seedling stage. Spectrosc. Spectr. Anal. 2024, 44, 386–391. [Google Scholar]
  56. Fan, J.; Fan, Y.; Ma, Y.; Bian, M.; Feng, H. Monitoring method for winter wheat leaf nitrogen content based on UAV multi-source remote sensing fusion. Trans. Chin. Soc. Agric. Mach. 2026, 57, 314–324. [Google Scholar]
  57. Li, M.; Sun, C. Refinement of LiDAR point clouds using a super voxel based approach. ISPRS J. Photogramm. Remote Sens. 2018, 143, 213–221. [Google Scholar] [CrossRef]
  58. Wang, S.; Han, W.; Huang, X.; Zhang, X.; Wang, L.; Li, J. Trustworthy remote sensing interpretation: Concepts, technologies, and applications. ISPRS J. Photogramm. Remote Sens. 2024, 209, 150–172. [Google Scholar] [CrossRef]
  59. Wang, Q.; Ye, X.; Li, J.; Xiao, Y.; He, Y. Estimation and visualization of nitrogen content in citrus canopy based on two band vegetation index (TBVI). Spectrosc. Spectr. Anal. 2015, 35, 715–718. [Google Scholar]
  60. Gao, C.; Tang, T.; Wu, W.; Luo, Y.; Wu, W.; Yao, B.; Li, J. Hyperspectral prediction model of nitrogen content in citrus leaves based on the CEEMDAN–SR algorithm. Remote Sens. 2023, 15, 5013. [Google Scholar] [CrossRef]
  61. Zhao, X.; Zhao, Z.; Zhao, F.; Liu, J.; Li, Z.; Wang, X.; Gao, Y. An Estimation of the Leaf Nitrogen Content of Apple Tree Canopies Based on Multispectral Unmanned Aerial Vehicle Imagery and Machine Learning Methods. Agronomy 2024, 14, 552. [Google Scholar] [CrossRef]
Figure 1. Study Area Location.
Agriculture 16 01570 g001
Figure 2. Unmanned aerial vehicle and Calibration panel.
Agriculture 16 01570 g002
Figure 3. PSO optimized BP and ELM training flow.
Agriculture 16 01570 g003
Figure 4. Remote sensing classification results of the citrus orchard based on the minimum distance method.
Agriculture 16 01570 g004
Figure 5. Remote sensing classification results of the citrus orchard based on the maximum likelihood method.
Agriculture 16 01570 g005
Figure 6. Remote sensing classification results of the citrus orchard based on object-based classification.
Agriculture 16 01570 g006
Figure 7. Response characteristics of crop canopy spectral reflectance under water and nitrogen regulation. Note: Rred, RRE, Rblue, Rgreen, and RNIR represent the reflectance of the red, red-edge, blue, green, and near-infrared bands, respectively. W1 indicates full irrigation; W2 indicates mild water deficit; W3 indicates moderate water deficit; and W4 indicates severe water deficit. N1 and N2 represent low-nitrogen and high-nitrogen treatments, respectively. Different lowercase letters indicate significant differences among the water and nitrogen treatments (W × N combinations) at the 0.05 significance level.
Agriculture 16 01570 g007
Figure 8. Correlation between vegetation indices and leaf nitrogen content across the whole growth period. Note: * indicates a significant correlation at the 0.05 level (p < 0.05), and ** indicates a highly significant correlation at the 0.01 level (p < 0.01). LNC represents leaf nitrogen content.
Agriculture 16 01570 g008
Figure 9. Univariate linear regression model for leaf nitrogen content.
Agriculture 16 01570 g009
Figure 10. Univariate quadratic regression model for leaf nitrogen content.
Agriculture 16 01570 g010
Figure 11. Partial least squares regression model for leaf nitrogen content.
Agriculture 16 01570 g011
Figure 12. Machine learning inversion model for leaf nitrogen content.
Agriculture 16 01570 g012
Figure 13. PSO-optimized machine learning inversion model for leaf nitrogen content.
Agriculture 16 01570 g013
Figure 14. Performance comparison of machine learning inversion models.
Agriculture 16 01570 g014
Table 1. Statistics of the Citrus Leaf Nitrogen Content Dataset.
DateSamplesMaximum
(g kg−1)
Minimum
(g kg−1)
Average
(g kg−1)
Standard Deviation
(g kg−1)
Variation Coefficient (%)
04-081837.6225.1728.583.5512.42
04-151836.9525.0829.023.3011.38
05-101831.4922.1427.282.529.25
05-191829.9224.1426.711.917.15
05-291830.4322.0526.792.218.24
06-111829.9121.5826.522.178.17
07-031829.4220.6525.292.409.49
07-141826.8021.4424.261.526.28
07-301833.0521.3626.332.9711.28
08-181828.7422.4124.701.957.88
09-211828.8321.8125.802.238.65
10-271827.4821.1723.741.897.94
Table 2. Main Specifications of the DJI P4M.
ParameterParameter Value
Take-off weight1487 g
Diagonal axis distance (without paddles)350 mm
Maximum Flight Altitude6000 m
Maximum Ascent Speed6 m/s (autonomous flight); 5 m/s (manual control)
Maximum Horizontal Flight Speed50 km/h (Positioning Mode); 58 km/h (Attitude Mode)
Imaging SensorSix 1/2.9″ CMOS sensors, including one color sensor for visible imaging and five monochrome sensors for multispectral imaging
ResolutionEffective pixels per sensor: 2.08 million (total pixels: 2.12 million)
Maximum Photo Resolution1600 × 1300 (aspect ratio 4:3.25)
Optical FiltersBlue (B): 450 nm ± 16 nm;
Green (G): 560 nm ± 16 nm;
Red (R): 650 nm ± 16 nm;
Red Edge (RE): 730 nm ± 16 nm;
Near-Infrared (NIR): 840 nm ± 26 nm
Table 3. Primary UAV Flight Parameter Settings.
ParameterValue
Number of Waypoints91
Flight Speed (m/s)2.0
Flight Altitude (m)29
Ground Resolution (cm/pixel)1.6
Forward and Side Overlap (%)80.0
Camera Tilt Angle (°)−90
Main Flight Line Angle (°)11
Table 4. Vegetation spectral indexes and calculation formulas.
Vegetation IndexCalculation Formula
(Transformed Chlorophyll Absorbtion Ratio Index, TCARI) [37] T C A R I = R E R 0.2 × ( R E G )
(Normalized Difference Vegetation Index, NDVI) [37] N D V I = N I R R N I R + R
(Enhanced Vegetation Index, EVI) [37] E V I = 2.5 × ( N I R R ) N I R + 6 × R 7.5 × B + 1
(Difference Vegetation Index, DVI) [37] D V I = N I R R
(Renormalized Difference Vegetation Index, RDVI) [37] R D V I = N I R R N I R + R
(Transformed Vegetation Index, TVI) [37] T V I = N I R R N I R + R
(Modified Chlorophyll Absorption in Reflectance Index, MCARI) [37] M C A R I = 3 × ( R E R 0.2 × ( R E G ) × R E R )
(Visible Atmospherically Resistant Index, VARI) [38] V A R I = G R G + R B
(Normalized Difference Water Index, NDWI) [38] N D W I = G N I R G + N I R
(Normalized Difference Blue Index, BNDVI) [38] B N D V I = 1 ( B / N I R ) 1 + ( B / N I R )
(Normalized Difference Red-Edge Index, NDRE) [38] N D R E = 1 ( R E / N I R ) 1 + ( R E / N I R )
(Green Red Vegetation Index, GRVI) [38] G R V I = ( G / N I R ) ( R / N I R ) ( G / N I R ) + ( R / N I R )
(Atmospherically Resistant
Vegetation Index, ARVI) [38]
A R V I = N I R ( 2 × R B ) N I R + ( 2 × R B )
(Leaf Chlorophyll Vegetation Index, LCVI) [39] L C V I = 1 ( R E / N I R ) 1 + ( R E / N I R )
(Modified Triangular Plantation Index, MTVI) [39] M T V I = 1.5 × ( 1.2 × N I R G 2.5 × R G ) × ( ( 2 × N I R + 1 ) 2 ( 6 × N I R 5 × R ) ) 0.5 )
Table 5. Producer’s accuracy and user’s accuracy of different classification methods.
DateFeature CategoryMDCMLCOBIA
PAUAPAUAPAUA
04-08Citrus tree canopy77.7645.3388.0955.8476.5774.09
Bare soil46.7866.3778.9569.8179.0086.09
Grass45.9282.0169.1791.2985.589.99
Others61.8646.3072.1949.5984.0569.49
04-15Citrus tree canopy67.9943.6470.3851.8679.6186.02
Bare soil43.5971.3167.2885.6170.3584.68
Grass32.7121.6081.8167.0779.7085.38
Others56.3845.9568.3182.6982.7490.44
05-10Citrus tree canopy71.8642.7986.4058.3083.8877.82
Bare soil55.9585.0765.8192.2969.0790.40
Grass83.7747.1987.6049.6986.7478.32
Others59.7595.0577.7986.3879.9493.26
05-19Citrus tree canopy71.9946.3589.0853.1287.3980.40
Bare soil71.0139.1775.6945.3677.3267.33
Grass49.3679.6654.3687.3055.3581.98
Others35.3880.4175.2874.7782.1884.44
05-29Citrus tree canopy74.5950.4986.9356.3386.3583.88
Bare soil66.4854.3284.4162.4983.5164.44
Grass43.8365.5443.6177.6255.0282.47
Others38.2074.6880.0077.5169.8778.28
06-11Citrus tree canopy74.1950.0081.8754.6875.9284.83
Bare soil59.4448.6188.4247.3081.8962.81
Grass35.7279.8245.1388.8747.4987.82
Others59.6267.0863.9292.9274.3078.97
07-03Citrus tree canopy70.9443.1776.6355.3869.9880.77
Bare soil63.3850.7179.0641.5170.5668.76
Grass37.5081.9744.0384.8644.0381.97
Others59.3363.3863.35871.8270.4078.58
07-14Citrus tree canopy65.9250.7667.8049.9960.8385.16
Bare soil64.1342.3086.6040.7580.6667.36
Grass31.9876.9251.4283.7644.7380.64
Others55.3162.4656.8174.7059.3082.77
07-30Citrus tree canopy60.0355.8758.08/51.3467.3880.31
Bare soil57.9843.9590.0649.7679.5165.03
Grass40.4080.6149.6284.7048.1280.01
Others50.3060.0457.2666.1260.2383.23
08-18Citrus tree canopy65.8253.2766.1062.0667.3878.50
Bare soil53.8748.3690.2149.4669.5166.01
Grass39.5983.6441.5287.5450.9585.12
Others53.7150.0750.9158.5759.2181.67
09-21Citrus tree canopy70.4452.4884.7557.681.3086.54
Bare soil56.4848.8380.5763.7186.7447.66
Grass35.0578.3741.2287.2948.3688.70
Others51.2681.1560.8980.2368.5884.04
10-27Citrus tree canopy66.5254.6767.0660.9478.3282.62
Bare soil50.1045.9471.653.5686.1356.99
Grass39.3179.1346.9886.3953.7290.04
Others53.3446.6462.7559.5071.9574.25
Note: MDC refers to the minimum distance classification method, MLC refers to the maximum likelihood classification method, and OBIA refers to the object-based feature extraction classification method. Among the accuracy evaluation metrics, PA represents producer’s accuracy, and UA represents user’s accuracy.
Table 6. Overall accuracy and Kappa coefficient of different classification methods.
MethodsDateOA (%)Kappa
MDC04-0858.770.42
04-1552.420.31
05-1071.610.57
05-1964.700.45
05-2964.300.47
06-1151.550.30
07-0354.280.35
07-1449.620.29
07-3043.560.25
08-1840.830.22
09-2153.090.32
10-2749.190.30
MLC04-0873.750.60
04-1572.620.60
05-1072.210.59
05-1965.550.51
05-2966.730.55
06-1157.250.40
07-0357.930.41
07-1459.080.42
07-3058.140.42
08-1852.600.31
09-2157.520.41
10-2754.740.35
OBIA04-0880.220.67
04-1579.900.65
05-1081.460.68
05-1984.590.70
05-2985.650.72
06-1176.260.64
07-0374.980.65
07-1473.620.62
07-3070.990.57
08-1868.860.56
09-2177.310.64
10-2773.810.60
Note: MDC refers to the minimum distance classification method; MLC refers to the maximum likelihood classification method; and OBIA refers to the object-based feature extraction classification method. Among the accuracy evaluation metrics, OA represents overall accuracy, and Kappa denotes the Kappa coefficient.
Disclaimer/Publisher’s Note: The statements, opinions and data contained in all publications are solely those of the individual author(s) and contributor(s) and not of MDPI and/or the editor(s). MDPI and/or the editor(s) disclaim responsibility for any injury to people or property resulting from any ideas, methods, instructions or products referred to in the content.