1. Introduction
As the core dynamic component of Rotary Tillage machinery, Rotary Tillage blades directly interact with soil during field operations, and their abrasive wear performance dominates tillage efficiency, energy consumption and overall agricultural production costs [
1]. In southern China, IT195 and IT245 series Rotary Tillage blades are widely applied in paddy–dry alternating farmland. Under long-term continuous impact and abrasion from soil quartz particles and gravel (Mohs hardness 7), these commercial blades generally suffer from typical failure including cutting edge blunting, surface fatigue spalling and dimensional attenuation. Severe and progressive wear leads to frequent blade replacement, substantially increasing operational burden and economic costs for farmers [
2]. Different from general industrial cutting tools under single load conditions, Rotary Tillage blades operate with coupled rotational and forward feeding motions in complex and variable soil environments. Zhang et al. [
3] confirmed that the wear evolution of tillage blades is synergistically controlled by material composition, geometric structure and uneven tillage stress distribution. With the rapid development of precision agricultural mechanization, it is imperative to systematically explore the full-cycle wear evolution law, microscopic wear mechanism and critical failure characteristics of mainstream commercial Rotary Tillage blades, so as to provide reliable theoretical support for blade material selection, structural optimization and service life improvement [
4].
In recent years, domestic and foreign scholars have conducted extensive research on the tribological properties of agricultural soil-engaging components, forming a relatively complete theoretical system for tillage tool abrasive wear [
4]. Rani et al. [
1] demonstrated that the wear of tillage tools is mainly three-body abrasive wear induced by hard soil particles, accompanied by secondary fatigue wear and occasional corrosive wear, and micro-cutting and micro-ploughing are the dominant material removal modes. Material hardness and internal microstructure are recognized as the decisive factors determining the anti-abrasion performance of soil-contacting components [
5]. Yao et al. [
6] verified, through field wear tests, that tillage tools present obvious staged wear characteristics: rapid edge passivation and material loss occur in the initial running-in stage, while the wear rate gradually stabilizes in the middle and later service stages. Liu et al. [
7] further confirmed this staged wear rule in bench tests and tool wear compensation research, which provides a fundamental basis for full-cycle wear analysis of Rotary Tillage blades.
In terms of manufacturing materials for commercial Rotary Tillage blades, 65Mn and 60Si2Mn steels are the most widely used raw materials due to their low cost, excellent formability and good heat treatment adaptability. Meng et al. [
8] pointed out that 60Si2Mn spring steel possesses higher tensile strength, matrix hardness and tempering stability compared with traditional 65Mn carbon steel, showing better adaptability to repeated impact and abrasive load in complex tillage environments. Nevertheless, existing relevant studies mainly focus on heat treatment process optimization and single mechanical property testing of these two steels. Zhang [
9] stated that systematic quantitative comparison of wear resistance differences and microscopic failure mechanisms between mass-produced 65Mn and 60Si2Mn commercial blades under southern paddy–dry alternating soil conditions is still insufficient, lacking targeted evaluation of original wear performance of mature commercial blades.
To improve the service performance of tillage components, various surface strengthening technologies have been widely applied in agricultural machinery manufacturing. A series of mature modification methods, including laser cladding, plasma arc surfacing, thermal spraying and carbonitriding, can effectively optimize the matrix microstructure and prepare high-performance alloy coatings, thereby improving the surface hardness and wear resistance of tillage tools. Zhang et al. [
10] and Tian [
11] verified the significant strengthening effect of laser cladding on Rotary Tillage blade surfaces, while Jankauskas et al. [
12], Dong et al. [
13] and Karoonboonyanan et al. [
14] confirmed the applicability of welding surfacing and thermal spraying in wear resistance improvement of soil-engaging components. However, the most current strengthening research focuses on surface modification of failed blades, and few studies carry out comparative evaluations on the inherent wear performance of commercial blades with different base materials.
With the progress of testing and simulation technology, multi-scale characterization and coupled numerical simulation have become important means for soil–tool interaction and wear mechanism research [
15]. Traditional wear evaluation mainly relies on the weighing method and two-dimensional microscopic observation, which can only obtain macroscopic mass loss and local planar morphology, failing to realize quantitative characterization of spatial geometric evolution of key wear areas. Cucinotta et al. [
16] proved that three-dimensional scanning and deviation analysis technology can accurately capture local wear differences of tillage components via Hausdorff distance and surface comparison methods, realizing refined quantitative wear detection. For numerical simulation, the discrete element method (DEM) and finite element method (FEM) have their respective technical advantages in tillage simulation. Tekeste et al. [
17] and Hoormazdi et al. [
18] adopted the DEM to accurately simulate discrete soil particle motion and contact impact behavior, while Cheng et al. [
19] used the FEM to calculate the structural stress and strain distribution of blade components. A single simulation method has obvious limitations: the DEM cannot obtain continuous structural stress of blades, and the pure FEM faces difficulties in soil parameter calibration. Schramm et al. [
20] and Beck and Eberhard [
21] indicated that coupled DEM-FEM technology can realize synchronous calculation of soil particle movement and blade dynamic stress and can reproduce abrasive wear geometric deformation combined with the Archard wear model, which is more suitable for tillage wear mechanism analysis. Even so, most existing coupled simulation research focuses on tillage resistance prediction, rarely combining full-cycle wear test data to reveal the stress concentration and failure mechanism of blade wear hotspots [
19].
Despite the above research progress, prominent research gaps still exist in the wear study of commercial Rotary Tillage blades. Firstly, most conventional laboratory test conditions are oversimplified and cannot reproduce the actual composite working state of Rotary Tillage blades in southern paddy–dry alternating farmland; meanwhile, systematic comparative wear tests targeting mainstream IT195 commercial blades are insufficient and provide practical guidance for blade selection and production optimization [
1,
6]. Secondly, existing wear mechanism research mostly adopts single-factor isolated analysis, failing to establish synergistic correlations among material microstructure, macro-hardness and macroscopic wear morphology. In addition, few studies verify the stress concentration effect of wear hotspots through coupled numerical simulation, resulting in an ambiguous formation mechanism of blade critical failure zones [
4,
15]. Thirdly, traditional detection methods lack 3D quantitative characterization of geometric changes in key areas such as blade bend transition zones, and the spatiotemporal migration laws of wear hotspots throughout the full service cycle have not been clarified, restricting the development of targeted localized strengthening schemes for failure-prone areas.
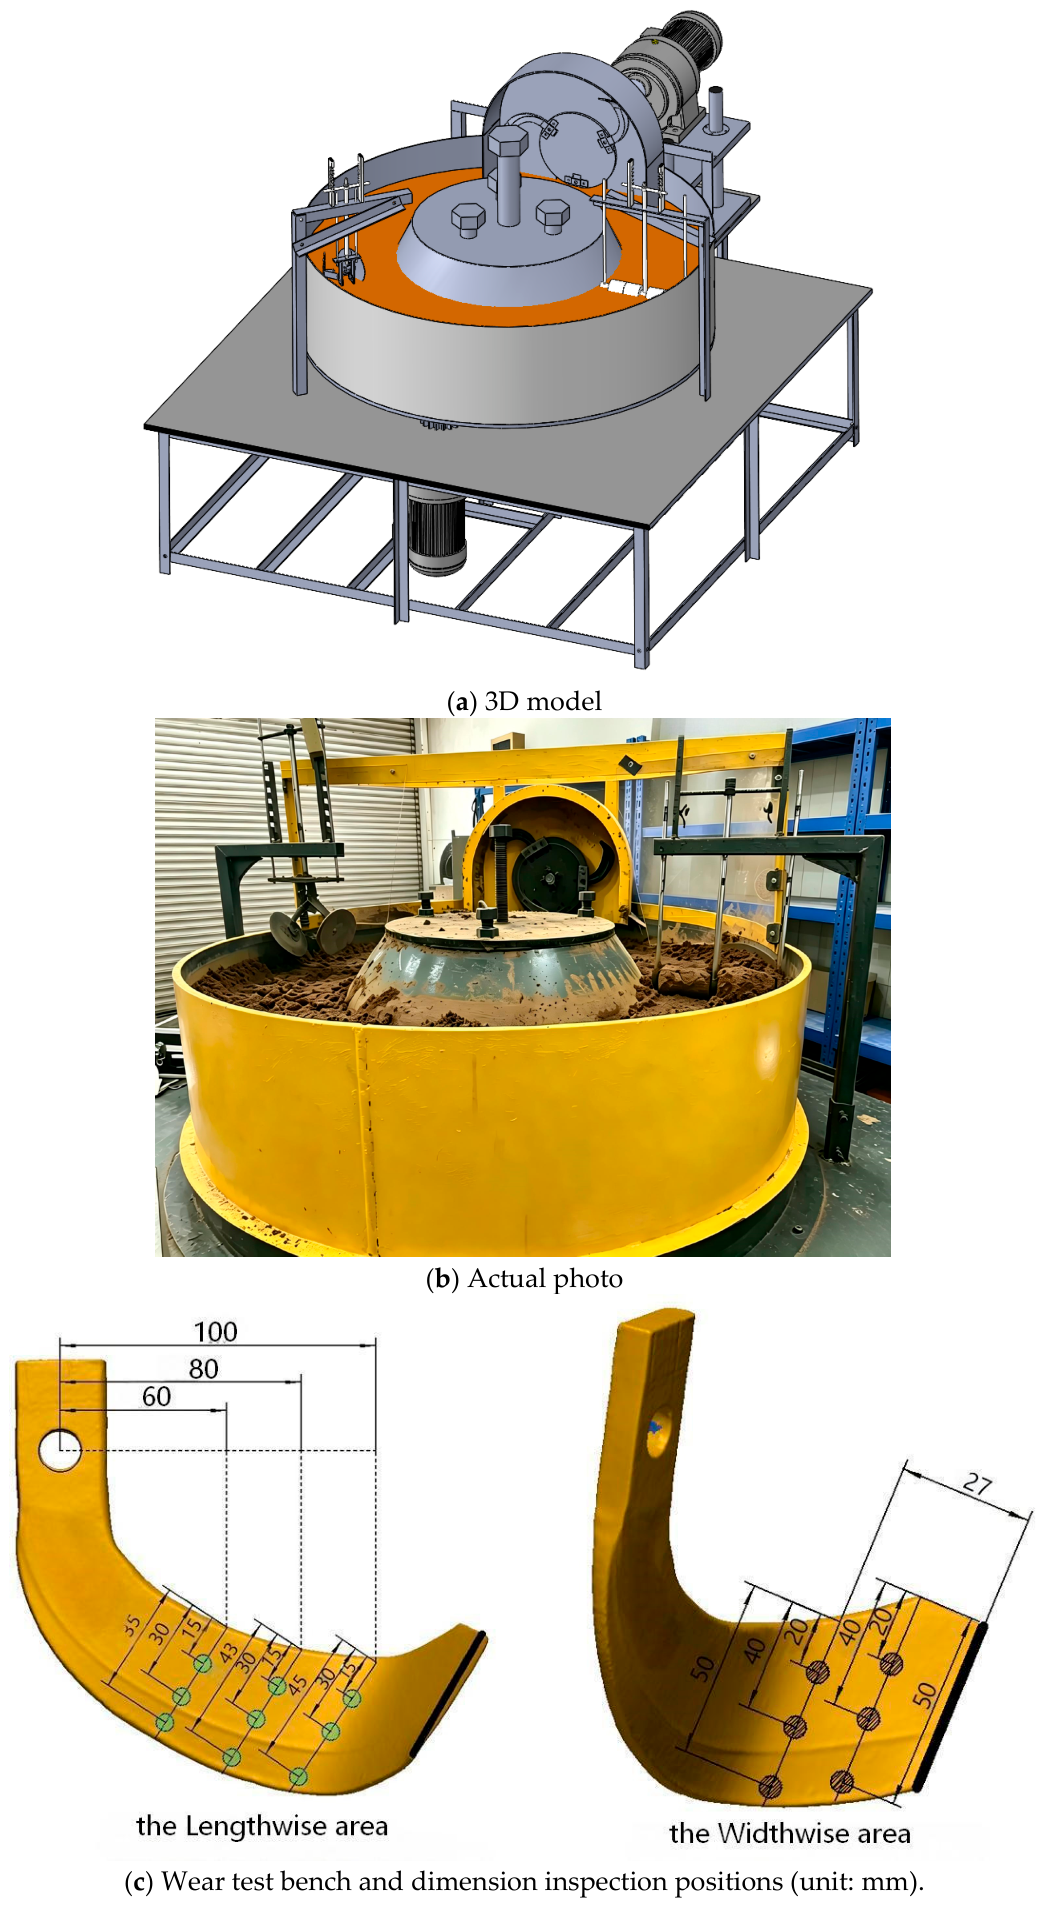
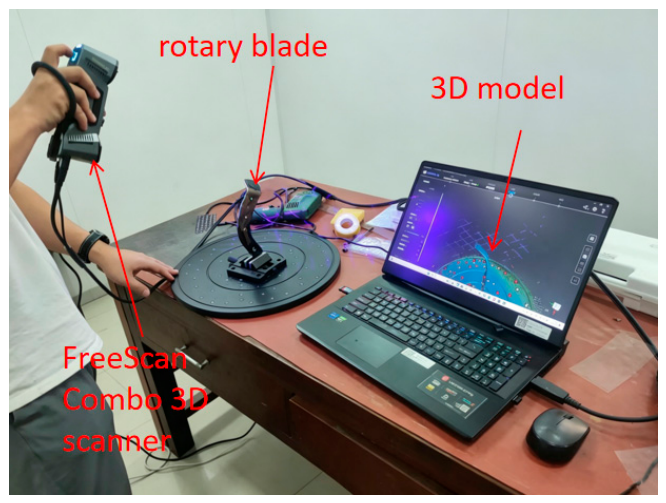
To address these research gaps, this study takes five types of commercial IT195 Rotary Tillage blades (65Mn and 60Si2Mn) as research objects. A self-developed composite rotary soil-bin test rig is adopted to reproduce the rotational and forward composite tillage motion, realizing controllable and repeatable full-cycle wear tests. Combined with metallographic observation, the Vickers hardness test and SEM microscopic characterization, the microstructure and hardness differences of different blades are systematically analyzed. Meanwhile, 3D scanning and reverse modeling technology are used to quantitatively characterize the full-cycle dynamic wear evolution of key blade areas. Furthermore, the coupled DEM-FEM numerical simulation method is innovatively applied to obtain the blade dynamic stress distribution during tillage, and the stress-induced failure mechanism of the bend transition zone is revealed. On this basis, the spatiotemporal migration characteristics of blade wear hotspots are clarified. The research results can enrich the theoretical system of abrasive wear of agricultural Rotary Tillage blades and provide scientific references for blade material selection, structural curvature optimization and localized surface strengthening of key failure areas. The outcomes have important practical engineering significance for reducing agricultural production costs, improving tillage efficiency and promoting the sustainable development of agricultural tillage equipment.
3. Results
3.1. Wear Resistance Comparison of Five Types of Rotary Tillage Blades
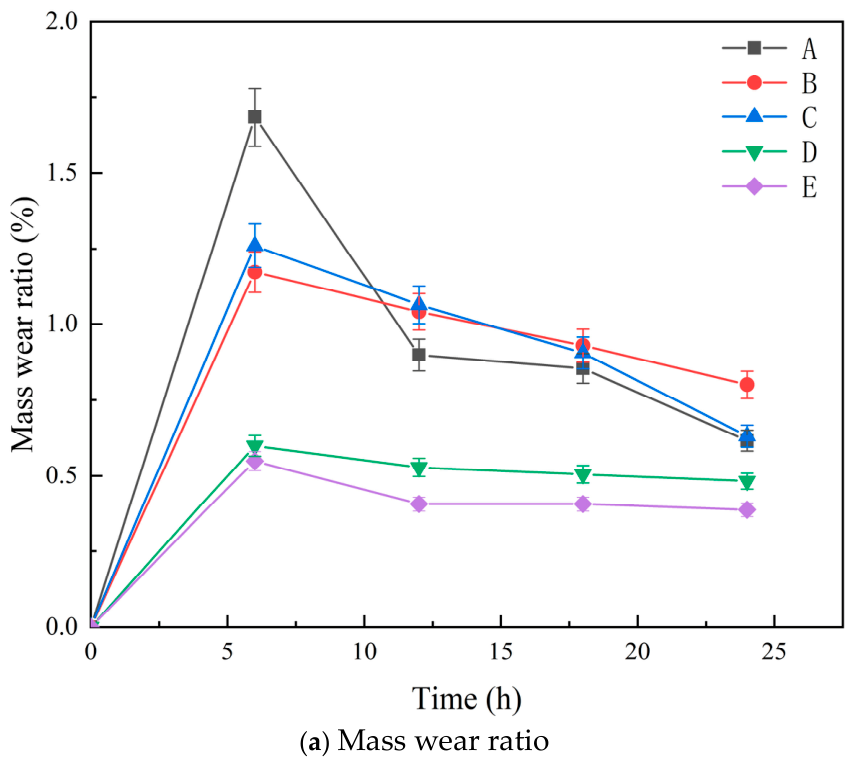
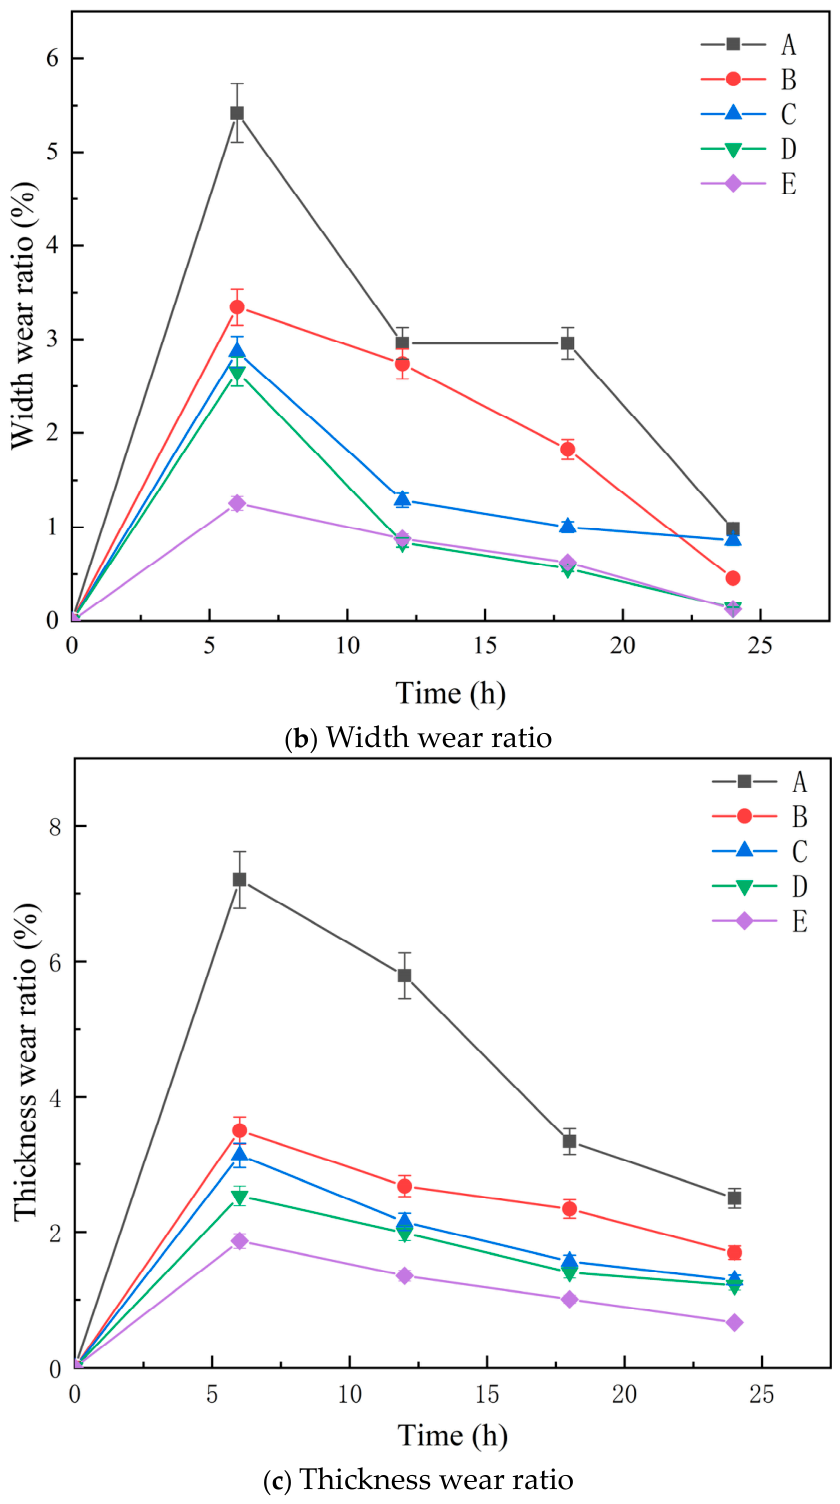
A 24 h cyclic abrasive wear test was conducted to comprehensively evaluate the wear resistance differences among five commercial IT195 Rotary Tillage blades, with continuous monitoring of mass loss and dimensional attenuation. Three indicators, namely mass wear ratio, width wear ratio and thickness wear ratio, were adopted to characterize the overall wear variation of different blade samples, as shown in
Figure 5. All test blades exhibited consistent wear evolution trends under identical tillage and abrasive conditions, and obvious performance differentiation was observed between the 65Mn blade group and the 60Si2Mn blade group.
Statistical analysis based on 24 h cumulative wear ratios was performed to quantify the overall wear resistance differences among blade types. The results showed that blade type exerted extremely significant effects on mass wear ratio, width wear ratio and thickness wear ratio (all
p < 0.001). The results of Duncan’s multiple comparison are presented in
Table 2, where different lowercase letters indicate statistically significant differences among blade types (
p < 0.05).
Among the five blade types, Blade E had the lowest cumulative wear ratios in all three dimensions. Blade A showed the most severe cumulative dimensional wear (width and thickness), while no significant difference was found in the cumulative mass wear ratio among Blades A, B and C (p > 0.05).
For mass wear performance (
Figure 5a), the residual mass of all blades decreased gradually and steadily throughout the test. The final cumulative mass wear ratio ranked from high to low as A (65Mn) > B (65Mn) > C (65Mn) > D (60Si2Mn) > E (60Si2Mn). Blade E (60Si2Mn steel) showed the minimum cumulative mass loss and the most stable temporal variation curve among all samples.
Dimensional wear evolution showed high consistency with mass loss variation across all blade types (
Figure 5b,c). Blade E also maintained the lowest thickness wear ratio and the most stable dimensional change characteristic. All blades experienced a typical two-stage wear evolution: rapid material attenuation occurred in the initial 0–5 h period, and the wear growth rate gradually decreased after 5 h, transitioning into a relatively stable wear state. Throughout the stable wear stage, Blade E consistently maintained better wear resistance than the other four blade samples.
3.2. Characterization of Microhardness, Metallographic Structure and Worn Surface Morphology
Microhardness, metallographic structure and worn surface morphology of the five blades were characterized to analyze the microscopic features corresponding to wear performance.
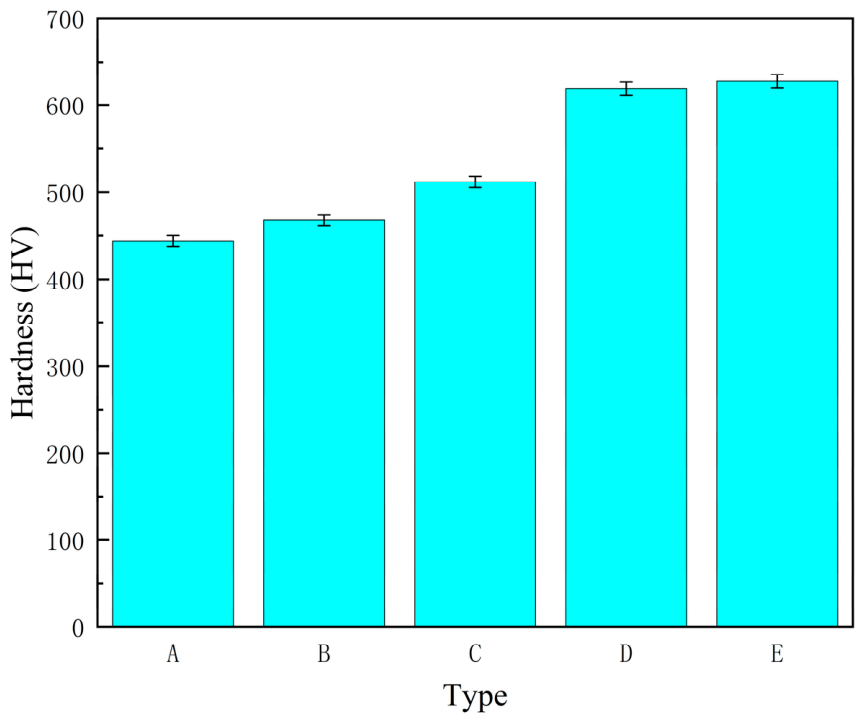
The microhardness test results (
Figure 6) showed a clear performance gradient. Each bar represents the average Vickers hardness of three blades from the same production batch. The vertical lines on top of the bars are error bars indicating the standard deviation of the test results (n = 3). Blade E had the highest hardness of 627.73 HV, followed by Blade D (618.98 HV). Both were significantly harder than the three 65Mn blades (Blade C: 512.31 HV; Blade B: 467.44 HV; Blade A: 443.85 HV).
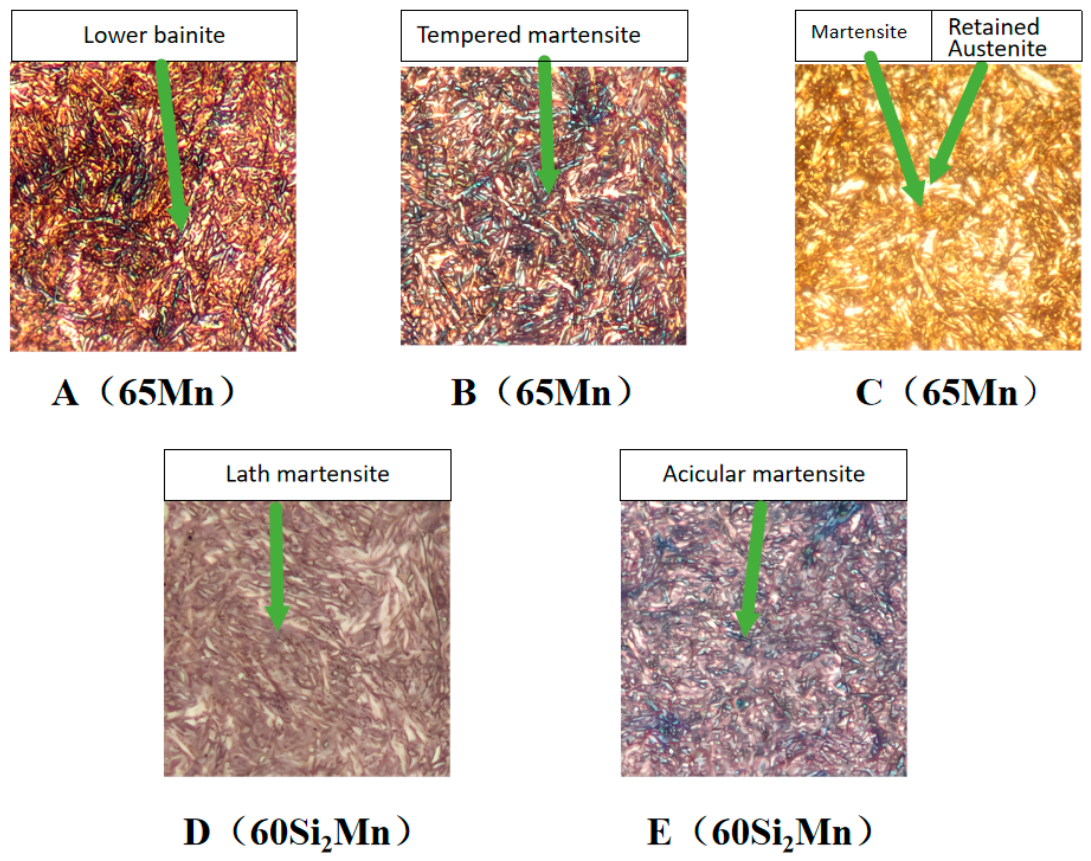
Metallographic observations (
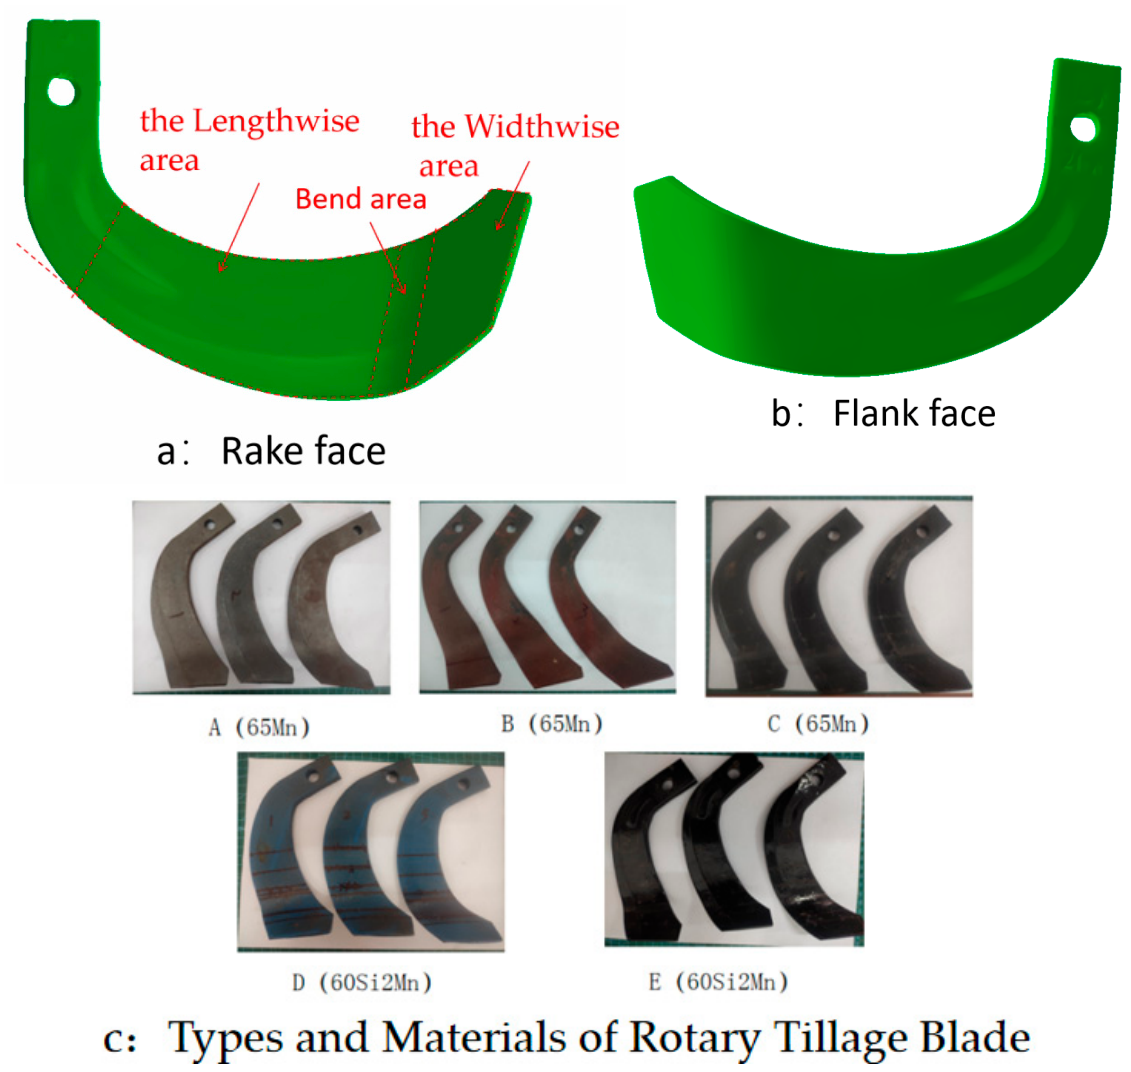
Figure 7) revealed distinct microstructural differences among blades, which were induced by different base materials and heat treatment schedules. The microstructural characteristics of the five blade types show distinct differences corresponding to their respective heat treatment processes. Blade A has a lower bainite matrix with staggered ferrite laths, and fine cementite precipitates are distributed between the laths; its residual temperature quenching process does not achieve complete martensitic transformation. Blade B presents a microstructure dominated by tempered martensite, with tiny spherical carbides uniformly precipitated within the martensite laths, and spontaneous self-tempering occurs after quenching due to the high residual temperature of the workpiece. Blade C forms a mixed phase consisting of martensite and massive retained austenite, with a higher martensite fraction than Blade A and Blade B. Blade D contains lath martensite in its microstructure; the bottom-to-top local heating mode during tempering leads to uneven tempering effect, and partial martensite decomposes into troostite. Blade E exhibits a homogeneous single-phase acicular martensite structure without soft mixed phases, and high carbon supersaturation as well as severe lattice distortion exist within its martensite laths.
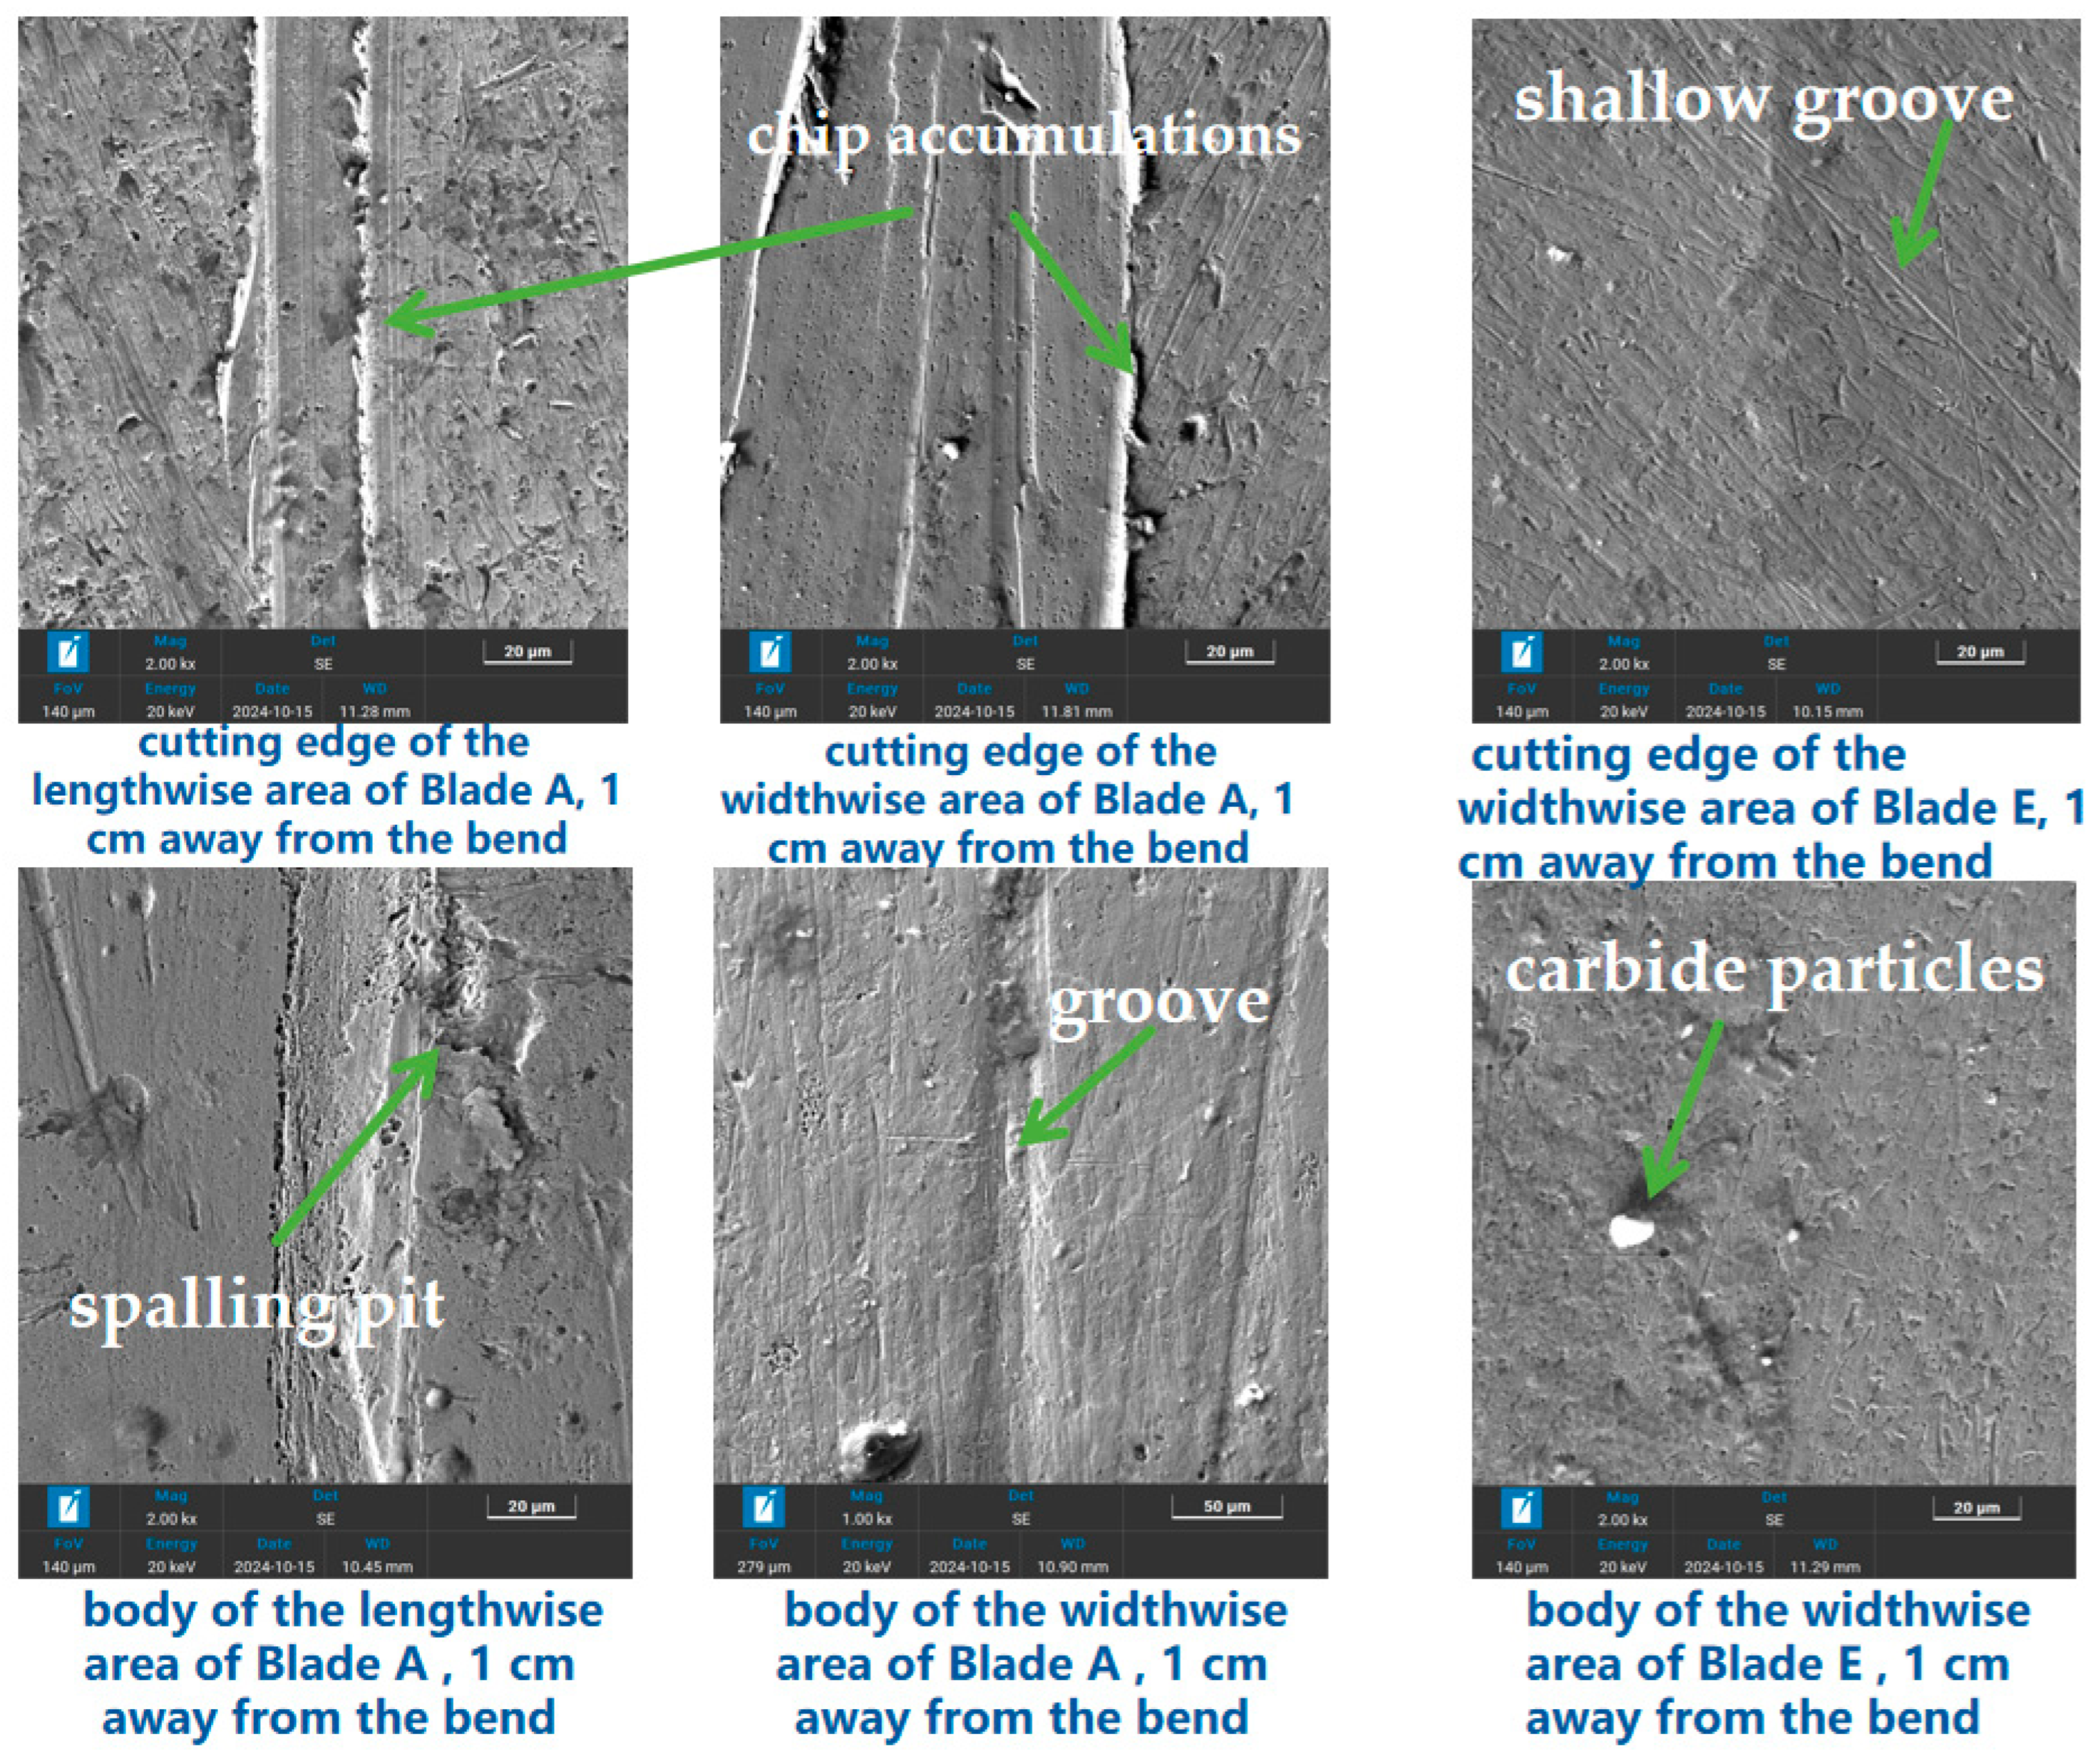
Worn surface morphologies of the blades were observed via scanning electron microscopy (SEM), as presented in
Figure 8.
Blade A (65Mn): The worn edge showed micro-cutting and indentation spalling phenomena. The surface had deep and wide directional grooves (width: 8–12 μm; depth: 2–3 μm), with “wing-like protrusions” (chip accumulations) at groove edges. Irregular spalling pits with a diameter of 10–15 μm were distributed on the surface, and fractured grains were visible inside the pits. The widthwise area was dominated by micro-cutting, micro-plowing and indentation spalling, while the lengthwise area was dominated by micro-plowing.
Blade E (60Si2Mn): The worn edge surface was covered with a large number of uniform shallow grooves with depth < 1 μm, without obvious deep-seated damage. The groove direction was parallel to the sliding direction of the Rotary Tillage blade. White incompletely peeled carbide particles were observed on the surface, with small pits around the particles.
3.3. Wear Process Characterization and Stress Simulation of E-Type Rotary Tillage Blade
The full-cycle wear behavior of the E-type Rotary Tillage blade was comprehensively characterized via multiple experimental approaches, and the stress distribution during tillage operation was further investigated through numerical simulation.
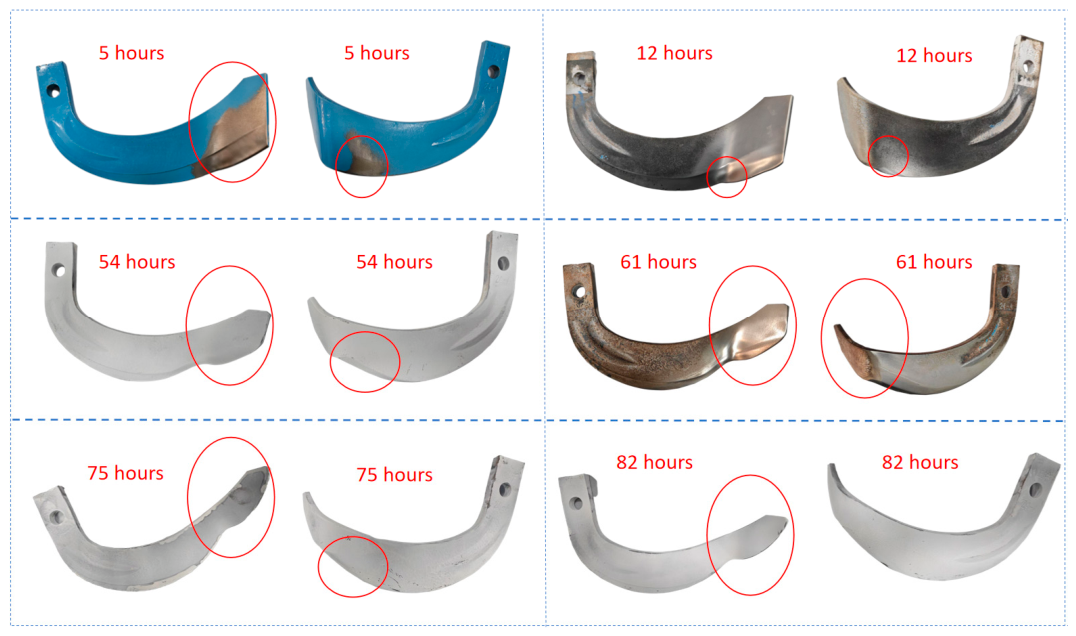
The macroscopic morphological evolution of the blade throughout the wear cycle is shown in
Figure 9. In the initial wear stage (5 h), wear was mainly observed on the rake face of the blade tip and the flank face of the bending section. As wear progressed from 12 h to 82 h, the worn area expanded continuously, and the wear severity in both the widthwise cutting region and side cutting region increased significantly with decreasing distance from the bend transition zone. By the end of the test, a continuous broad wear band had formed in the vicinity of the transition zone.
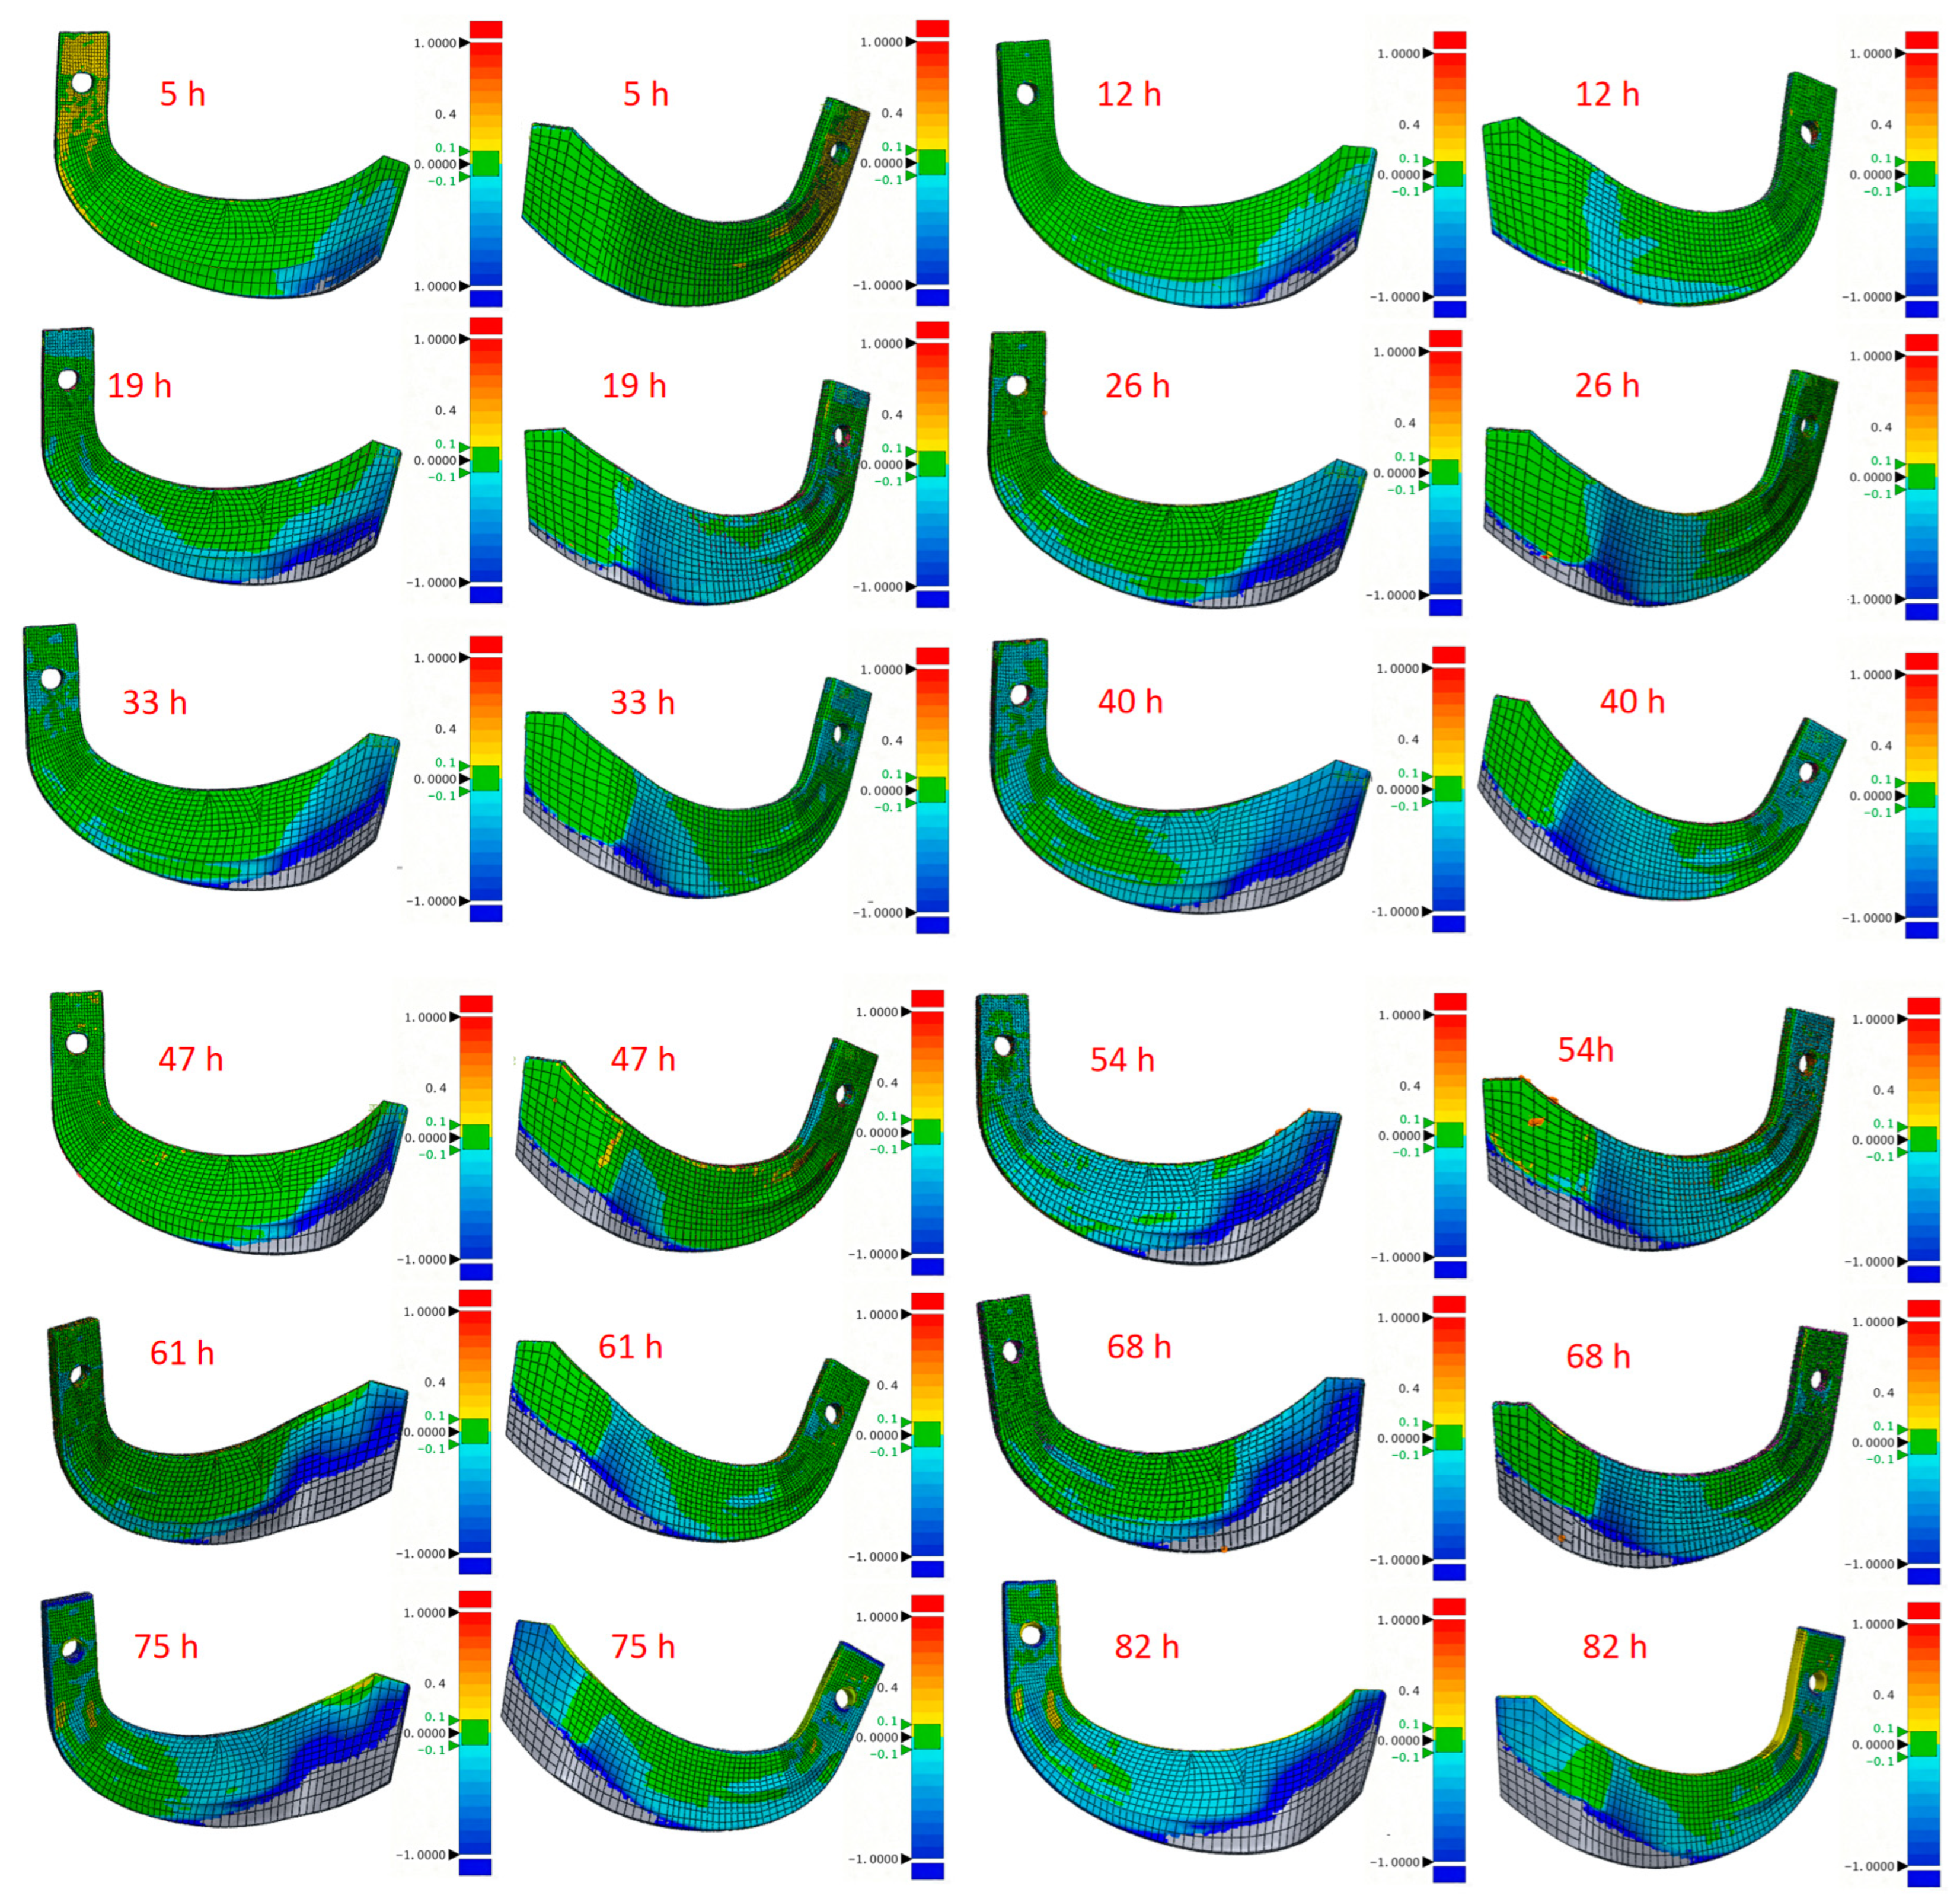
The 3D wear measurement results (
Figure 10) showed that warm colors (red and yellow) representing severe wear were highly concentrated in the bend area and adjacent lengthwise and widthwise areas. Most parts of the blade body far from the bend area remained blue or green (representing slight wear), and silver-white areas were worn-off regions.
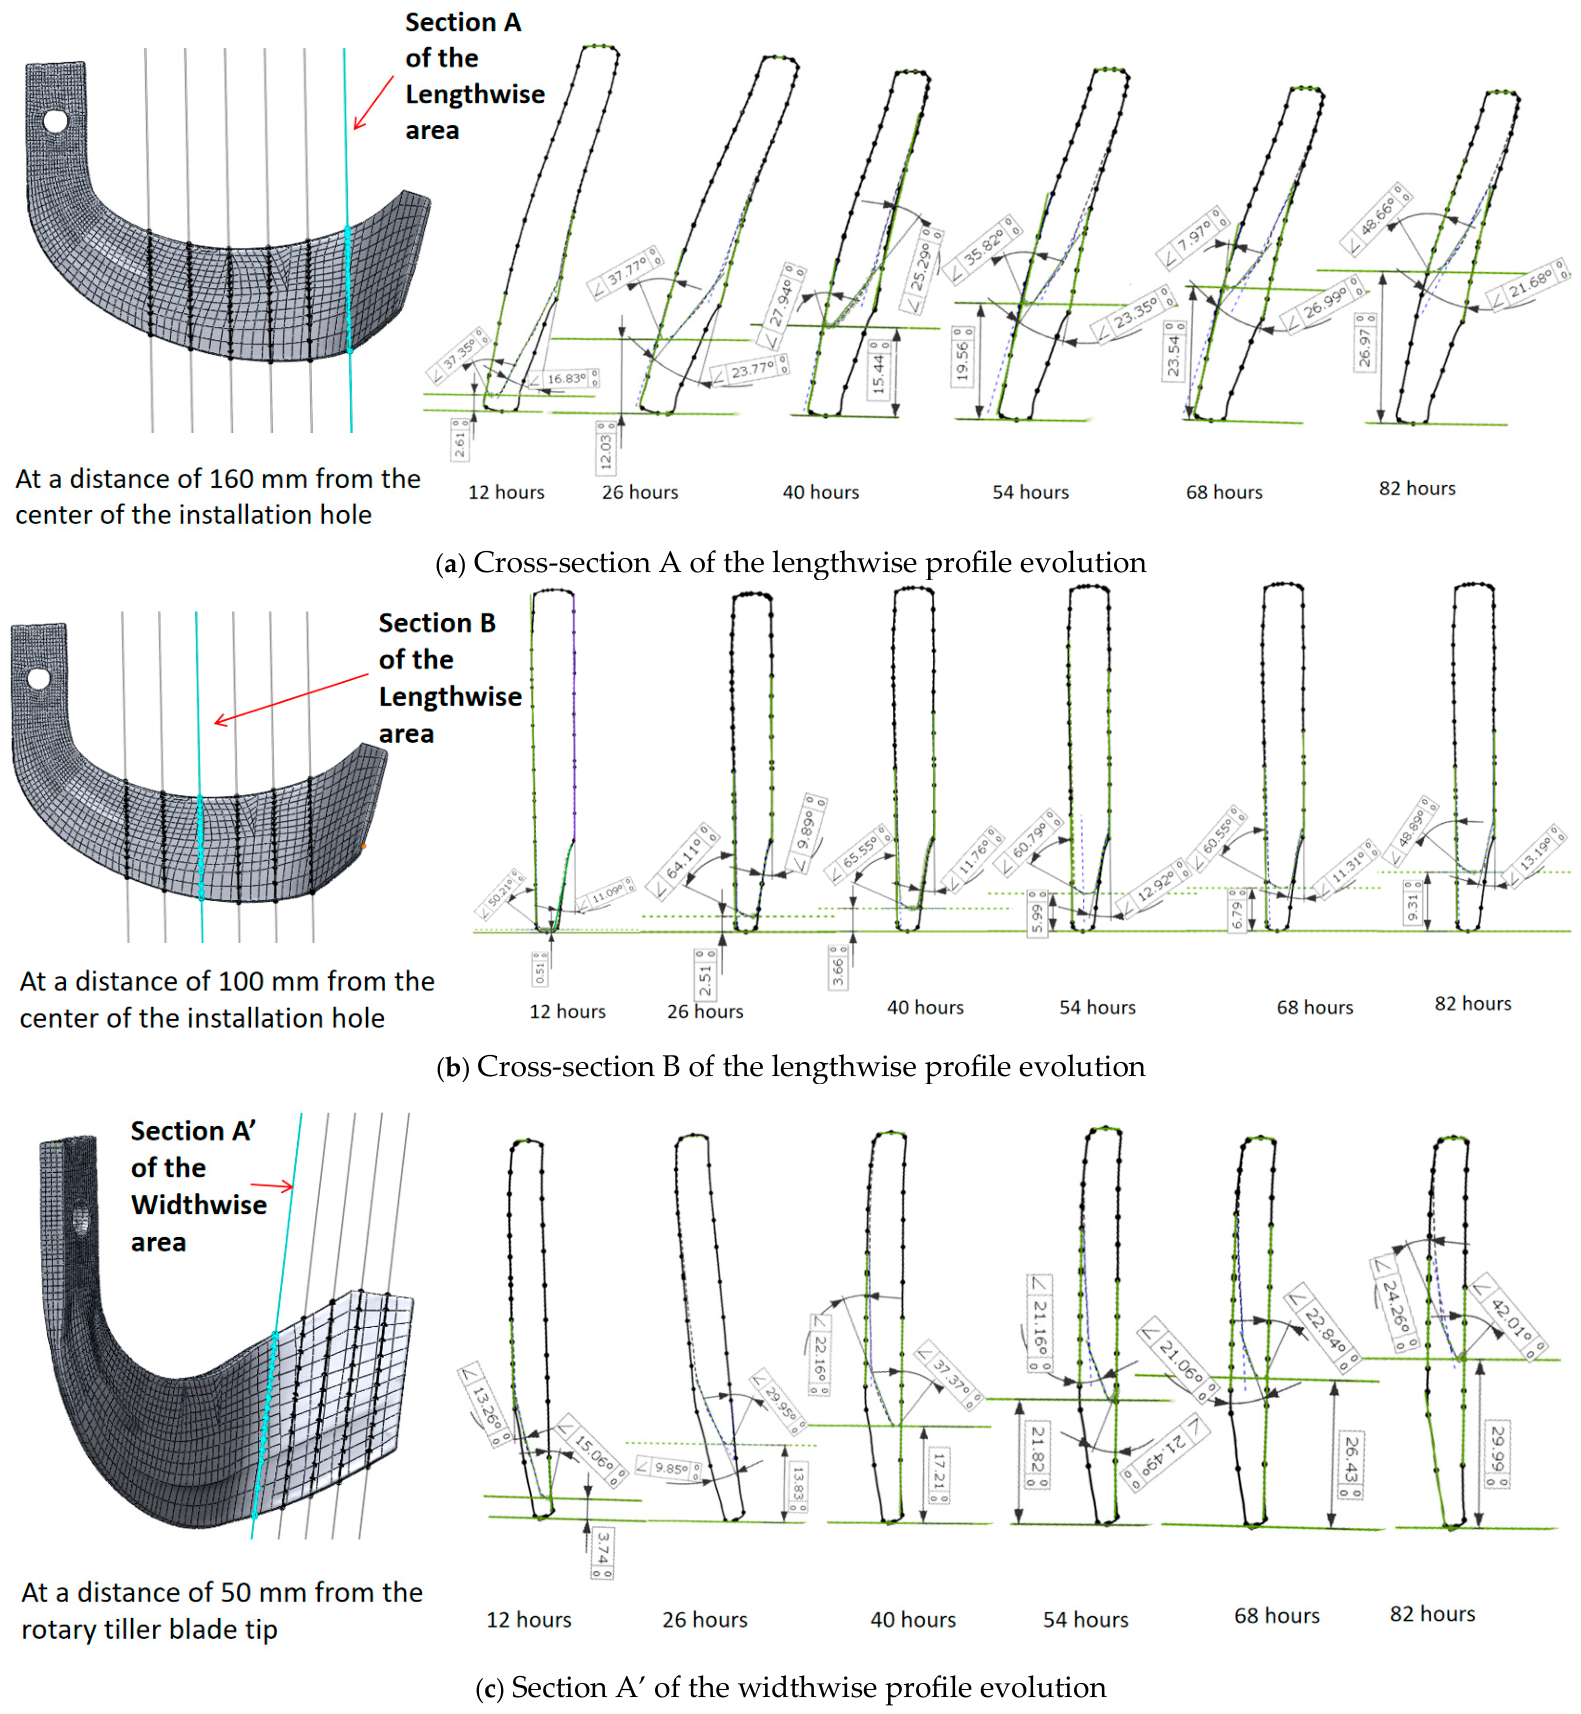
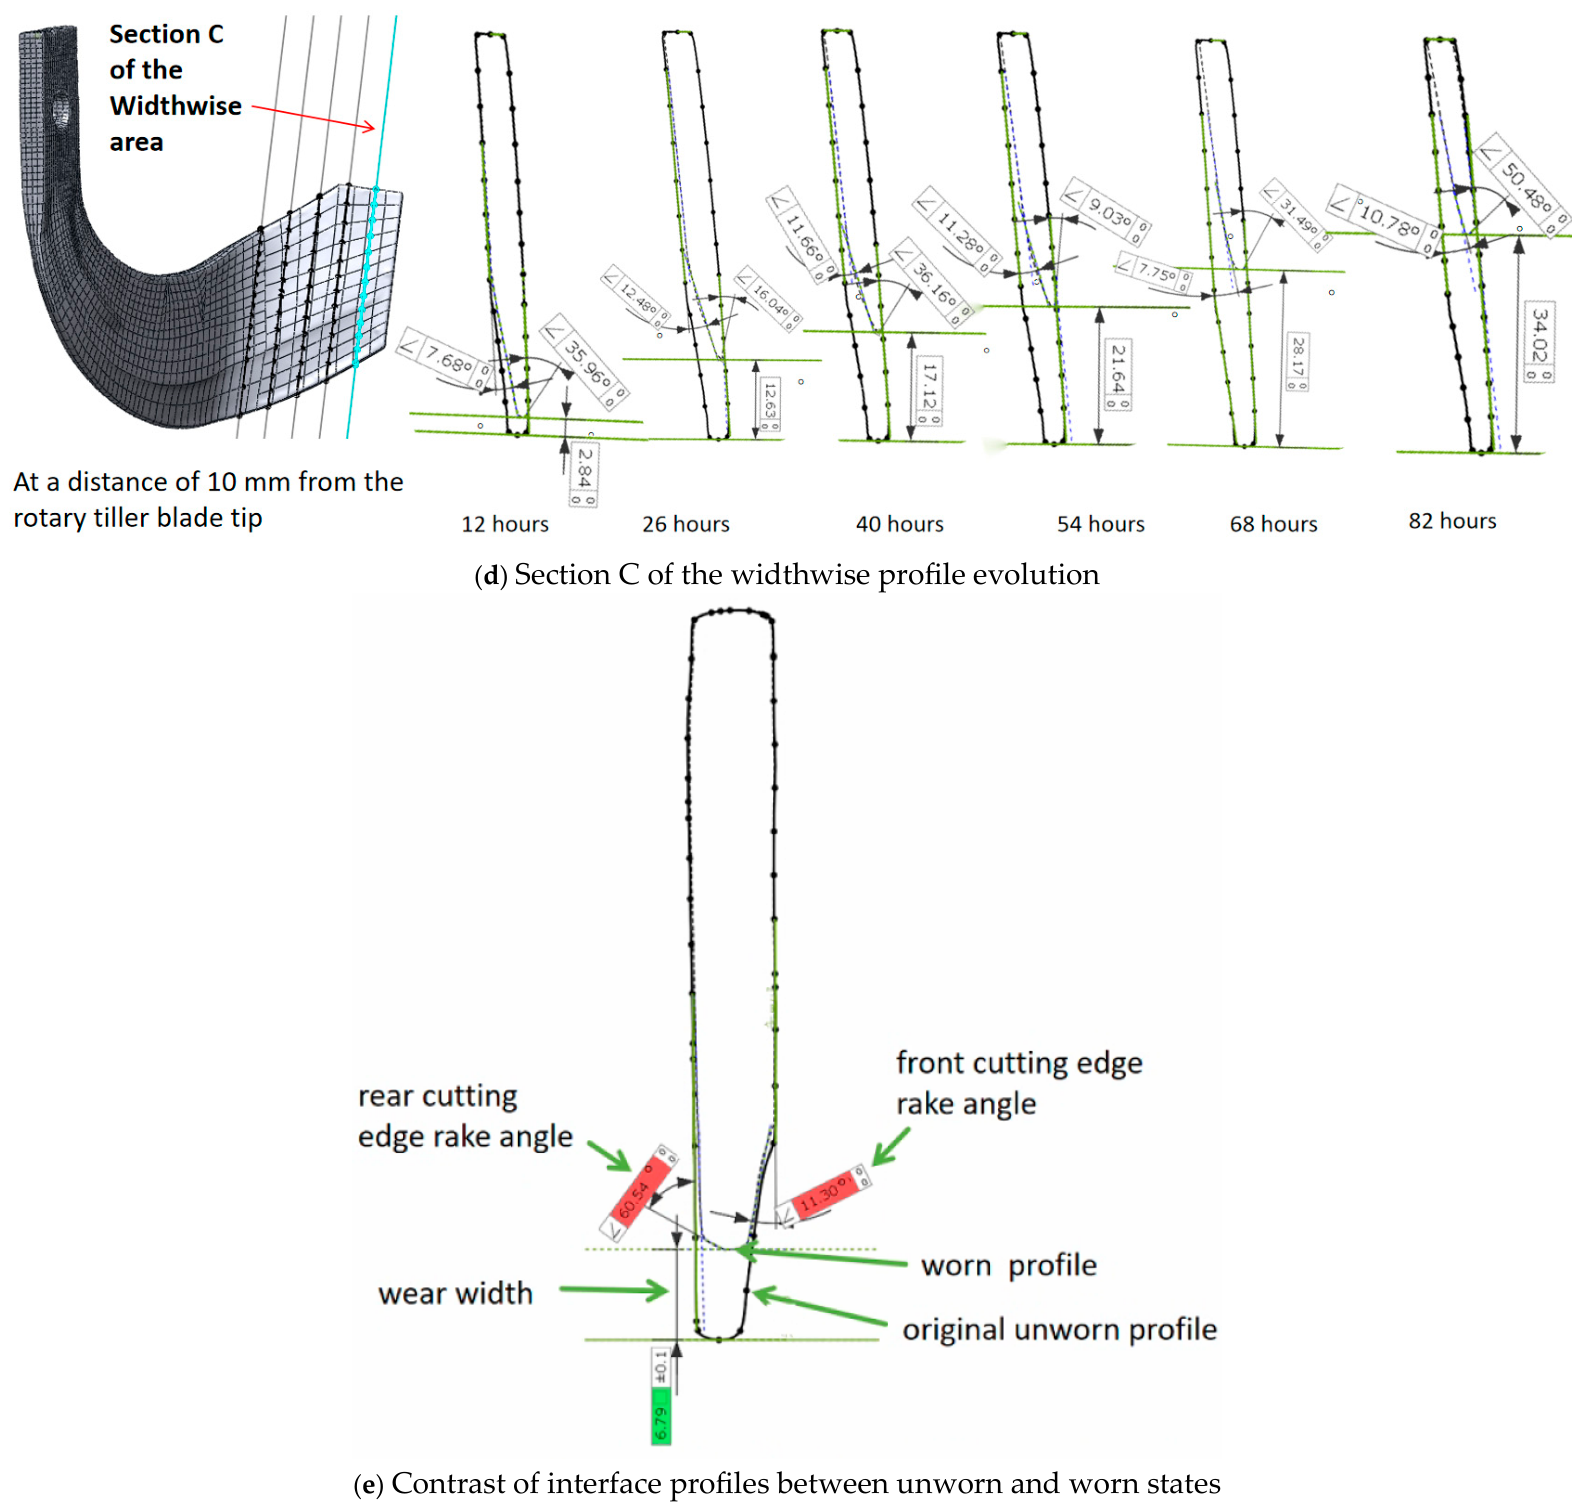
Four characteristic cross-sections (A, B, C, and A’) were preselected to quantify the spatiotemporal evolution of blade wear, with sections A and A’ positioned adjacent to the bend transition zone. The time-dependent profile variations of these sections over the entire wear cycle are presented in
Figure 11. Sections A and B were located in lengthwise (
Figure 11a,b), and sections A’ and C were located in widthwise (
Figure 11c,d). The contrast of interface profiles between unworn and worn states is shown in
Figure 11e.
For both the widthwise area and the lengthwise area, wear at sections A’ and C initiated at the cutting edge and propagated inward toward the blade shank, extending continuously from the rake face to the flank face. The overall wear severity at these two sections was notably greater than that at sections A and B. Specifically, the wear rate of section A’ was slightly higher than that of section C from the initial running-in phase to the stable wear phase, whereas section C exhibited a marginally higher wear rate than section A’ after entering the transitional wear phase. For section B in the lengthwise section, wear developed on both the rake and flank faces nearly synchronously, with marginally more severe material loss observed on the flank face.
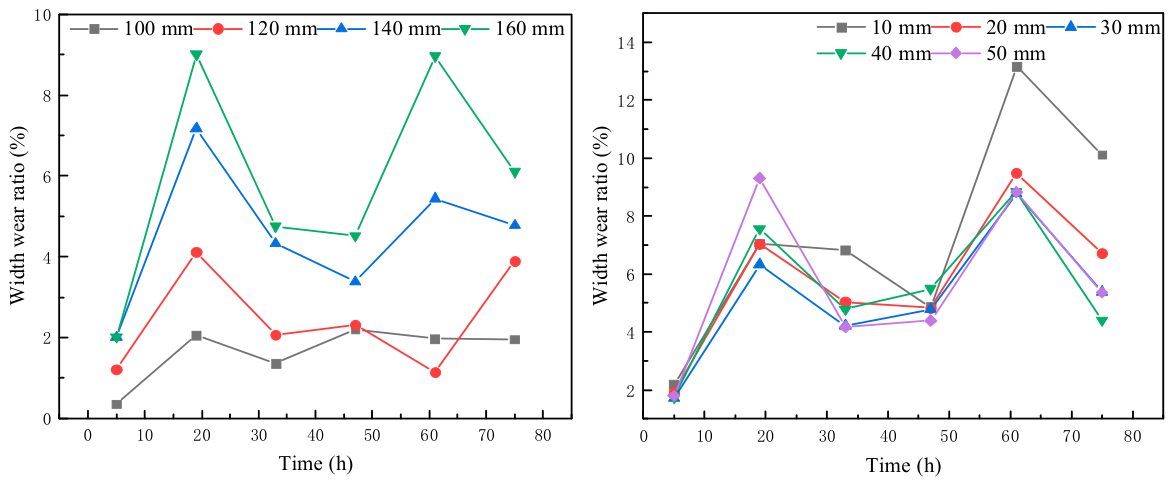
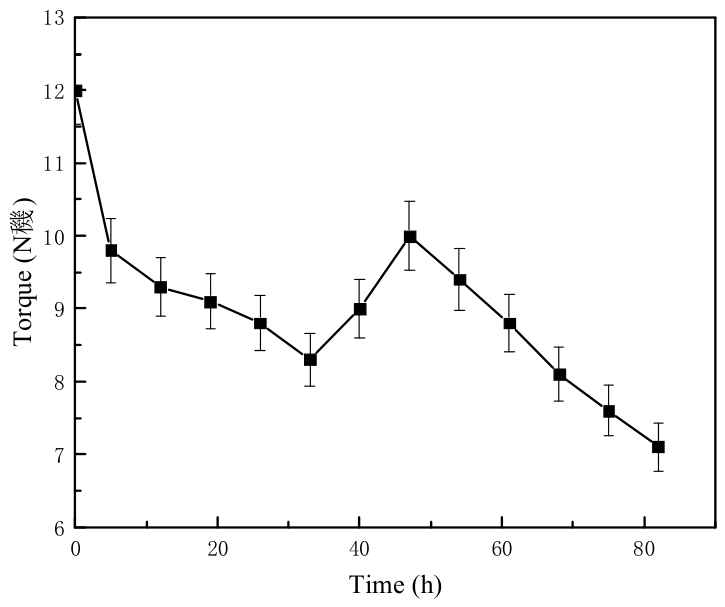
Width wear rates at multiple characteristic positions in the widthwise and lengthwise areas (
Figure 12) and the average working torque (
Figure 13) were measured throughout the test to quantitatively characterize the overall wear evolution and dynamic load change of the blade. In terms of spatial distribution, the wear patterns of the two cutting areas showed significant differences. In the widthwise area, the position 10 mm from the blade tip (farthest from the bend area) maintained the highest wear level throughout the test, with a peak width wear rate of 13.17% at 61 h. Wear severity gradually decreased from the blade tip to the bend area. In the lengthwise area, wear severity increased significantly as the position approached the bend area: the position 160 mm from the mounting hole (adjacent to the bend area) had the highest wear peak of 9.01%, while the position 100 mm from the mounting hole (farthest from the bend area) had the lowest wear level. Overall, the width wear rate of the widthwise area was generally higher than that of the lengthwise area.
The average working torque exhibited an overall fluctuating downward trend throughout the 82 h test. It decreased rapidly from the initial 12.0 N·m to the first valley value of 8.3 N·m at 33 h, then rebounded to the full-cycle peak of 10.0 N·m at 47 h and gradually declined to 7.1 N·m by the end of the test at 82 h. The variation pattern of torque was highly consistent with the evolution trend of the width wear rate. Based on the synchronous changes in width wear rate and working torque, the entire 82 h wear process was subdivided into six distinct stages. Initial wear stage (0–12 h): The width wear rate at all measurement positions increased rapidly, and the average torque dropped sharply from 12.0 N·m to 9.3 N·m. First stable wear stage (12–26 h): The growth rate of the width wear rate slowed down and entered a plateau period, while the torque decreased gradually from 9.3 N·m to 8.8 N·m. First wear transition stage (26–40 h): The width wear rate first decreased and then turned to increase, and the torque dropped to 8.3 N·m at 33 h before rebounding to 9.0 N·m at 40 h. Rapid wear stage (40–54 h): The width wear rate at each position increased significantly, and the torque reached the full-cycle peak of 10.0 N·m at 47 h. Second wear transition stage (54–75 h): The width wear rate gradually decreased from the peak value, and the torque continued to decline slowly from 9.4 N·m to 7.6 N·m. Second stable wear stage (75–82 h): The width wear rate tended to stabilize, and the torque slowly decreased to 7.1 N·m.
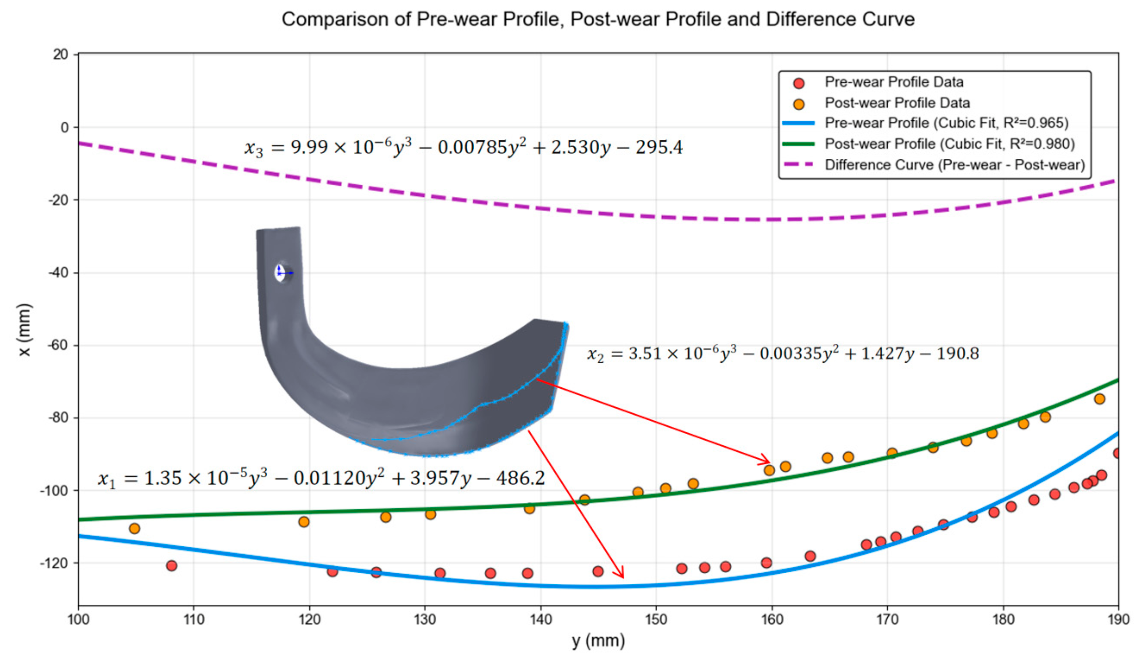
Edge curve fitting results (
Figure 14): A two-dimensional coordinate system was established with the center of the blade mounting hole as the origin. The pre-wear edge curve x
1 had a coefficient of determination of
R2 = 0.965, and the post-wear edge curve x
2 had a coefficient of determination of
R2 = 0.980. The difference curve x
3 (pre-wear minus post-wear) showed an obvious peak at the edge length of about 160 mm, which corresponded to the bend transition zone of the blade.
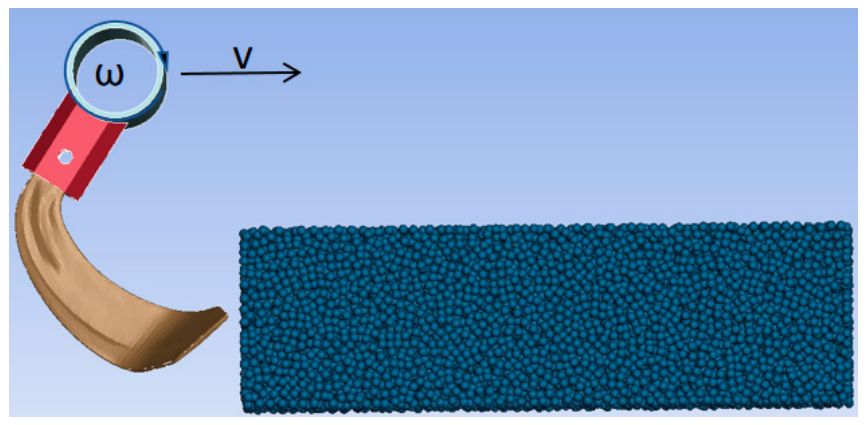
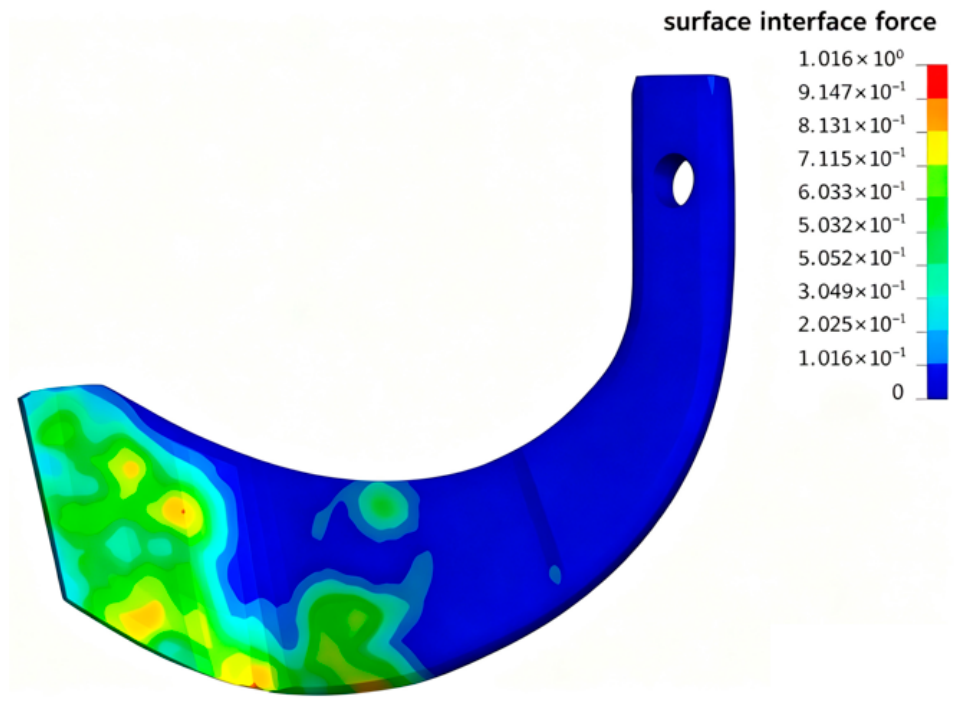
Surface interface force simulation results are shown in
Figure 15. The surface interface force nephogram obtained from LS-DYNA simulation presented extremely uneven force distribution on the blade surface during operation. High-concentration regions of interface force were located at the bend transition zone and adjacent cutting edge, where red and yellow areas occupied a large proportion. The rake face of the tangential cutting region was covered with yellow and green area, while the rest parts were blue and light green, whose interface force was far lower than that of the transition zone.
4. Discussion
This study systematically evaluated the wear performance of five types of commercial IT195 Rotary Tillage blades, revealed the intrinsic mechanism underlying the excellent wear resistance of 60Si2Mn blades and identified the critical failure zone of the optimal E-type blade. The findings provide theoretical and data support for the performance optimization of Rotary Tillage blades.
4.1. Interpretation of Wear Performance Differences Among Different Blades
The wear resistance differences among five commercial IT195 Rotary Tillage blades were compared. The 24 h cyclic abrasive wear test revealed clear group differentiation in wear resistance among the five tested blades: 60Si2Mn blades (D and E) generally outperformed 65Mn blades (A, B and C), with Blade E showing the best comprehensive wear resistance. The high consistency of evaluation results across mass, width and thickness dimensions verifies the reliability of the comparative test.
Notably, Blades A, B and C showed no significant difference in cumulative mass wear ratio but had significantly different dimensional wear ratios. This discrepancy indicates distinct material removal modes among the three 65Mn blades: under similar total mass loss, more severe dimensional attenuation leads to faster cutting edge passivation, which exerts a more direct negative impact on tillage performance. This finding suggests that wear resistance evaluation of Rotary Tillage blades should not rely solely on mass loss but should integrate dimensional attenuation indicators for a more comprehensive assessment.
All five blades followed a typical two-stage wear evolution pattern, which is consistent with the general abrasive wear law of metallic materials. The rapid wear in the initial 0–5 h stage corresponds to the rapid blunting of sharp original edges and the removal of surface asperities under high contact stress. After edge passivation, the contact stress between blade and soil decreases, and the wear process enters a stable stage. Among all samples, Blade E maintained the lowest wear rate throughout the stable wear stage, indicating that its surface microstructure can sustain stable anti-wear performance after running-in, leading to more gradual performance degradation during service.
4.2. Intrinsic Mechanism of Superior Wear Resistance of E-Type 60Si2Mn Blade
The outstanding wear resistance of Blade E arises from the combined effect of high matrix hardness, optimized metallographic structure and stable surface wear morphology.
Microhardness serves as the primary mechanical basis for wear resistance. The hardness of Blade E is 19.6–41.4% higher than that of the three 65Mn blades, which effectively enhances the resistance to abrasive indentation and plastic deformation and directly reduces the material removal rate caused by abrasive cutting. Such hardness differences are essentially determined by material composition and heat treatment-induced microstructures.
The three 65Mn blades all adopt residual temperature quenching, which leads to incomplete phase transformation and introduces soft microstructures (lower bainite, self-tempered martensite and martensite-retained austenite mixture), inherently limiting matrix hardness. For Blade D made of 60Si2Mn steel, graded tempering after quenching generates soft troostite phases and slightly reduces overall hardness. In contrast, the multi-stage heat treatment adopted for Blade E eliminates all soft impurity phases and forms uniform single-phase acicular martensite with high lattice distortion, which delivers the highest microhardness among all test samples.
As pointed out by Ligier et al. [
29], the wear resistance of steel is not only determined by hardness but also related to microstructure uniformity and toughness matching. The addition of silicon and other alloying elements in 60Si2Mn optimizes the matrix structure and improves the tempering stability of martensite, achieving a better balance between hardness and toughness. This enables the blade to better resist the combined action of abrasive wear and fatigue impact in alternating tillage environments, which is another important reason for its better comprehensive wear resistance.
Differences in microstructure further lead to distinct worn surface features and wear mechanisms. For the low-hardness Blade A, sharp quartz grains in soil can easily cut into the surface and form deep, wide directional grooves; chip accumulations and irregular spalling pits develop under repeated extrusion, representing a coupled failure mode of abrasive wear and fatigue wear [
30] with a high material removal rate. For the high-hardness Blade E, only shallow and uniform plough grooves form under abrasive action, accompanied by tiny pits caused by partially detached carbide particles. The dominant mild abrasive wear mechanism results in significantly slower material removal.
4.3. Critical Failure Zone Identification and Engineering Application Implications
In terms of cutting torque, the absolute values measured in the indoor soil bin are lower than the torque levels under actual field conditions. This difference mainly arises from the more uniform soil texture, relatively lower soil compactness, absence of surface crop residues, and intermittent single-blade cutting mode in the soil bin test, which is a common feature of laboratory-controlled soil bin tests. Nevertheless, the single-blade torque values obtained in this study are close to the results reported in similar Rotary Tillage soil bin research [
31], which verifies the reliability of the test system and data acquisition and ensures the credibility of the relative comparison of cutting performance among different blades. Based on the synchronous monitoring of width wear rate and working torque of the E-type blade, the 82 h full-cycle wear process was subdivided into six refined evolutionary stages. Different from the traditional two-stage division of running-in and stable wear, this refined classification accurately characterizes the adaptive and fluctuating wear behaviors of blades in complex paddy–dry alternating soil environments. In essence, the phased change of blade wear rate is the result of the joint action of contact stress redistribution and surface morphology self-adjustment under the Archard wear framework [
32].
Among the six stages, the 40–54 h rapid wear stage is the key turning point of performance degradation: persistent stress concentration and cumulative geometric deformation at the bend transition zone intensify abrasive wear and micro-fatigue spalling, leading to the peak material removal rate and tillage torque. The 75–82 h second stable stage is not a normal service steady state but a morphological equilibrium after severe edge passivation and massive material loss. At this stage, the cutting performance and structural stiffness of the blade have approached the failure threshold, and continuous operation will easily break the balance and induce complete functional failure. The 82 h test cycle fully covers the whole service evolution process from initial running-in, medium-term adaptive adjustment to accelerated wear and final failure, making up for the limitation of traditional two-stage wear theory that fails to distinguish blade failure intervals and providing a theoretical basis for service life evaluation and failure threshold judgment of Rotary Tillage blades.
The wear distribution of the blade presents obvious spatial heterogeneity, which is dominated by the differentiated working modes of distinct cutting regions. The tangential cutting tip operates at the maximum linear velocity and bears intense cyclic soil impact and micro-cutting loads, resulting in the most severe material loss at the distal position. In contrast, wear damage in the lengthwise area is primarily concentrated at the bend transition zone due to geometric mutation-induced local stress concentration. The LS-DYNA simulation results show that the high stress concentration area is highly consistent with the wear concentrated area observed in the test, which verifies the synergistic effect of structural geometry and dynamic stress on blade wear evolution. Cheng et al. [
19] also confirmed via discrete element simulation that the inner side of the bending section and the inner side of the tangential cutting edge bear more than 50% of the total friction resistance within a small area, providing further mechanical explanation for the concentrated wear at the transition zone. Xiong et al. [
33] reported similar overall wear distribution patterns in rotary wear bench tests but observed slightly more severe wear on the side cutting edge than on the normal cutting edge. This discrepancy is mainly attributed to the non-rotating blade configuration and shorter test duration adopted in their study.
Combined with cross-sectional profile analysis, edge wear curve fitting and stress simulation, the bend transition zone (approximately 160 mm from the blade edge) connecting the tangential and lengthwise areas is determined as the critical failure zone of the E-type blade. As reported by Li et al. [
34] the bending transition zone is also a high-incidence area of fracture failure besides severe wear, further confirming that this position is the core critical zone affecting blade service life. From the perspective of numerical simulation methodology, Katinas et al. [
35] and Bedolla et al. [
36] verified the reliability of the DEM and FEM in predicting wear hotspots of soil-engaging components, respectively, through 3D scanning and field test comparisons, which further supports the rationality of the LS-DYNA stress simulation used in this study. The geometric integrity of the transition zone directly determines the actual cutting angle and soil cutting efficiency of the blade. Therefore, the dimensional variation of the transition zone can serve as a quantitative criterion for judging blade wear failure, providing an operable reference for determining optimal blade replacement intervals in agricultural production.
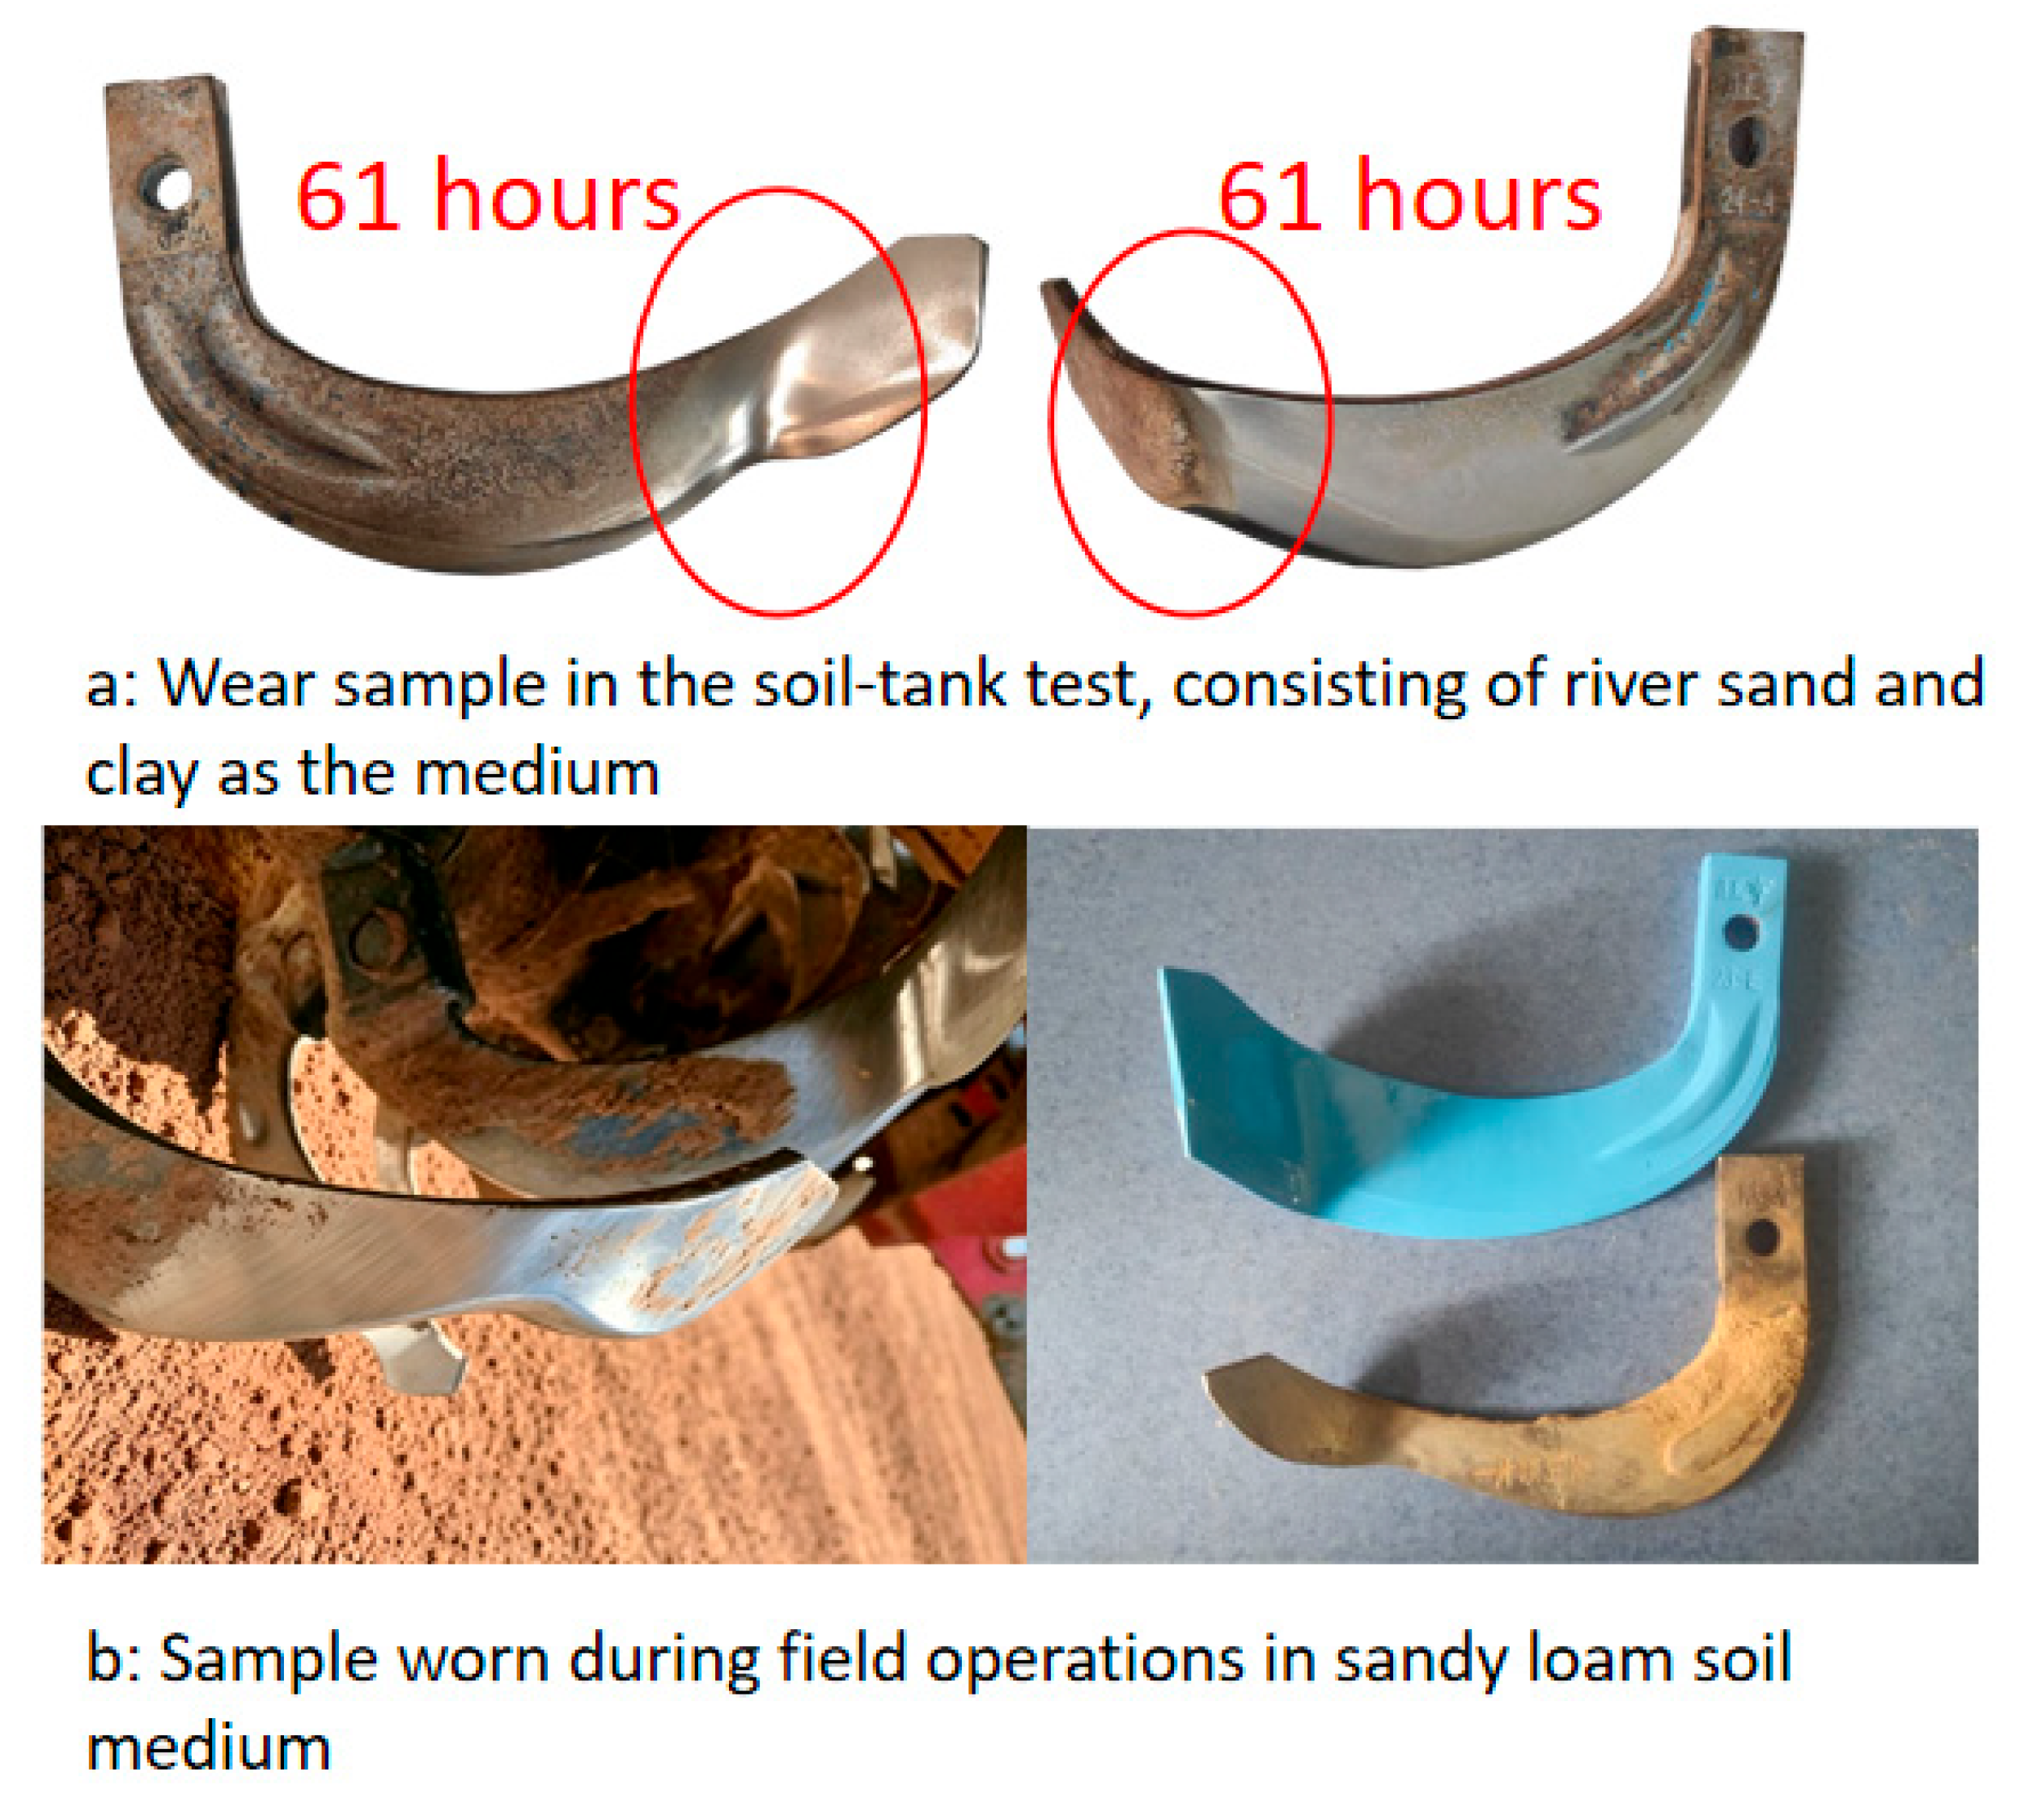
Two soil media were adopted in this study to balance test accuracy and efficiency: field-consistent sandy loam soil was used for the 24 h comparative wear test, and high-abrasiveness river sand-clay mixed soil was used for the 82 h full-cycle test to accelerate wear progression. Pre-experimental verification (
Figure 16) confirmed that blades exhibit consistent wear trends, spatial wear distribution and dominant failure modes in both media, indicating that the wear laws and failure mechanisms obtained from accelerated tests have favorable extrapolation value for actual field conditions.
Based on the above conclusions, three targeted and low-cost improvement strategies are proposed to extend blade service life:
- (1)
Optimizing the arc radius of the bend transition zone to mitigate stress concentration caused by geometric mutation;
- (2)
Implementing local surface strengthening (surfacing, spray melting or laser cladding) on the vulnerable transition zone and cutting edge;
- (3)
Adopting a differential heat treatment process to improve the hardness of the transition zone and cutting edge while maintaining the overall toughness of the blade body.