Article

Root Response to K+-Deprivation in Wheat (Triticum aestivum L.): Coordinated Roles of HAK Transporters, AKT2 and SKOR K+-Channels, and Phytohormone Regulation

by
Yuan Huang
,
Naiyue Hu
,
Xiwen Yang
,
Sumei Zhou
,
Miao Song
,
Jiemei Zhang
,
Xu Chen
,
Xihe Du
and
Dexian He
*
Co-Construction State Key Laboratory of Wheat and Maize Crop Science, College of Agronomy, Henan Agricultural University, Zhengzhou 450046, China
*
Author to whom correspondence should be addressed.
Agriculture 2025, 15(9), 993; https://doi.org/10.3390/agriculture15090993
Submission received: 7 March 2025 / Revised: 1 May 2025 / Accepted: 2 May 2025 / Published: 3 May 2025

Abstract

:
Potassium cation (K+) is essential for wheat (Triticum aestivum L.) growth, but the regulatory mechanisms of root response to K+ deficiency are not well understood. This study examines how varying durations of K+-deprivation affect root K+ transport and homeostasis in two wheat varieties, XN979 and YM68. Field pot experiments over three growing seasons showed that XN979 has significantly higher K uptake and productive efficiency than YM68 at a K fertilizer application rate of 60 kg hm−2. Hydroponic experiments revealed that XN979 has a lower Km (K+ concentrations at which 1/2 of Vmax) and a higher Vmax (maximum rate of K+ uptake) in K+ uptake kinetics, indicating better adaptation to K+-deficient environments. RNA-seq analysis after different durations of K+ deficiency (0, 6, 12, 24, 48 h) showed that genes encoding the Arabidopsis K+ Transporter 1 (AKT1) K+-channel in both varieties were not significantly upregulated. Instead, K+ transport in root primarily depended on high-affinity K+ (HAK) transporters. Genes encoding the Arabidopsis K+ Transporter 2 (AKT2) K+-channel in phloem cells were significantly upregulated under K+-deprivation. KOR1 and KOR2, encoding the Stelar K+ Outward Rectifier (SKOR) K+-channel in xylem cells, were significantly downregulated after 6 h and 12 h of K+-deprivation, respectively. Significant changes in the expression levels of the Calcineurin B-Like protein–CBL-Interacting Protein Kinase (CBL-CIPK) signaling system and phytohormones synthesis-related genes suggest their involvement in the root response to K+-deprivation. These findings clarify the regulation of wheat root responses to K deficiency.

1. Introduction

Wheat (Triticum aestivum L.) ranks as one of the world’s three major food crops, with a global planting area of approximately 240 million hectares and an annual production exceeding 800 million tons [1]. It supplies over 20% of the global population’s caloric and protein requirements. Nevertheless, in the face of escalating global environmental challenges and the rapidly growing population, enhancing wheat productivity while improving fertilizer use efficiency and mitigating soil degradation has emerged as a critical issue requiring immediate attention [2]. Potassium (K) is a critical nutrient that significantly affects wheat yield and plays a vital role in enhancing grain quality. It plays a key role in several physiological processes during plant development, such as protein synthesis, enzyme activity regulation, osmotic regulation, and nutrient transport [3,4,5]. Although K is abundant in field soil, the amount available for plant uptake is limited, with soil concentrations ranging from only 0.1 mmol L−1 to 1.0 mmol L−1 [6]. Recent studies have indicated that agricultural soils in China are developing severe K deficiencies as a direct result of increased grain production and intensive replanting practices, substantially reducing both crop yields and quality [7]. This situation has led to escalating K fertilizer usage in wheat fields to enhance both yield and quality. However, improper application, such as excessive use, can result in inefficient K utilization, significant fertilizer loss, and environmental pollution [8]. Therefore, comprehensive research on K+ uptake characteristics in wheat roots and understanding their regulatory mechanisms under low K+ stress are crucial for optimizing wheat cultivation practices.
K+-channels and K+-transporters are the main pathways for K+ uptake in wheat root [9]. Various K+-channels and transporters have been identified and extensively studied in plants [10,11]. Among them, the Shaker family of K+-channels and the high-affinity K+ (HAK) family of K+ transporters play a crucial role in K+ absorption and transportation in plants. Shaker K+-channels are classified into three major groups based on their selectivity for K+ and voltage sensitivity: inward rectifying (mediate K+ flux from intracellular to extracellular), outward rectifying (mediate K+ flux from extracellular to intracellular), and weakly inward rectifying (mediate K+ flux in both directions). Each group exhibits distinct expression patterns and serves different physiological functions [12]. Notable K+-channels identified in various plant species include the inward K+-channel Arabidopsis K+ Transporter 1 (AKT1), the weakly inward rectifying K+-channel Arabidopsis K+ Transporter 2 (AKT2), and the outward K+-channels Stelar K+ Outward Rectifier (SKOR) and Guard cell Outward-rectifying K+ Channel (GORK) [13,14,15,16,17]. Additionally, the HAK family of K+ transporters actively participates in K+ transport and multiple physiological processes, as they are widely distributed across various tissues and organs of plants [10,18]. Transporters such as HAK1, HAK5, HAK11, HAK13, and HAK23, among others, found in plants like Arabidopsis, rice, and wheat, have been confirmed to participate in root K+ uptake from soil [9,19].
Under K+-deprived conditions, plants sense low K stress through signaling molecules like Ca2+, ROS, and phytohormones [15,20]. In the plant cytoplasm, Ca2+ activates the Calcineurin B-Like protein–CBL-Interacting Protein Kinase (CBL-CIPK) signaling system to regulate K+-channel activity in response to K+-deprivation [20]. It is observed that CBL1/CBL9 interacts with CIPK23 to phosphorylate AKT1 channels on the plasma membrane, facilitating K+ uptake in root cells [21]. Conversely, the CBL4-CIPK6 complex enhances AKT2-mediated K+ transport by promoting AKT2 channel translocation from the endoplasmic reticulum to the plasma membrane through kinase interactions, not phosphorylation [17]. The regulation of HAK transporters by CBL-CIPK complexes under K+-deficiency conditions has been reported, leading to an enhancement of their K+ transport activity through phosphorylation of the complexes and binding with K+-transporters [22,23]. Additionally, K+-deprivation induces an increase in cellular ROS levels, thereby upregulating the expression of HAK transporter genes to enhance the K+ uptake rate of roots [24]. Phytohormones are crucial in plant responses to low K stress. Variations in external K+ concentration can alter the synthesis and accumulation of hormones such as indole-3-acetic acid (IAA), gibberellin (GA), abscisic acid (ABA), and ethylene (ETH), in plant roots, affecting both primary root growth and lateral root formation [25,26,27,28]. The changes in root architecture allow for roots to grow in diverse directions, thereby avoiding low-K zones in soil. Furthermore, they also enhance the absorptive surface area of the root to promote the absorption of K+ from the soil. Regulated by these signaling molecules, plant roots can effectively respond to external K+ concentration changes, enhancing adaptation to abiotic stress.
Plants possess a sophisticated regulatory system in response to external K+-deficiency, encompassing transcriptional, protein, and metabolic levels [9,29]. Previous studies have investigated the impact of K+-deficiency on the growth of wheat aboveground plants and roots [30,31]. However, limited research has been conducted on changes in the K+ uptake rate and mode in wheat roots under K+-deficiency conditions. K+-channels and -transporters are proteins directly involved in K+ uptake and translocation, including from the soil to root cells, between root cells, from the root to aboveground, and between different organelles in the cell. Diverse types of K+-channels and transporters are shown to be involved in multiple physiological activities within plant organs or tissues, including inter-organ K+ transport, the regulation of cell osmotic balance, and guard cell function control [9,32,33]. Nevertheless, the regulatory mechanisms by which external K+ concentration modulates different types of potassium K+-channels remain largely unknown. In this study, we examined variations in the characteristics and modes of K+ uptake by wheat roots under different low-K environments using physio-biochemical, transcriptomic, and electrophysiology analyses. Additionally, we investigated the effects of K+-deficiency conditions on roots’ K+ transportation and cellular K+ homeostasis. The experimental results were validated through a non-invasive micro-test technology system (NMT). Based on these studies, we propose a regulatory mechanism for wheat roots’ response to K+-deprivation.

2. Materials and Methods

2.1. Experimental Design

2.1.1. Plant Materials

Two winter wheat cultivars with distinct genetic backgrounds were used in this study: Xinong 979 (XN979), bred by Northwest A&F University through the cross [(918 × 95 selection) × Yanshi 9], and Yumai 68 (YM68), developed by the Henan Academy of Agricultural Sciences from the cross Yumai 49 × Zhoumai 13. These varieties, widely cultivated in the Huang–Huai–Hai Plains, are characterized as semi-winter and multiple-spike types. Experimental varieties were selected based on a comparison of the aboveground K accumulation (AKA) of four candidate wheat varieties grown in culture solutions with varying K+ concentrations. Specifically, XN979 and YM68 were identified as wheat varieties exhibiting the highest and lowest AKA values, respectively, when subjected to low-K conditions for 14 d and 21 d. The detailed test results are presented in Figure S1.

2.1.2. Field Pot Experiment

To investigate the differences in K utilization efficiency between two experimental varieties in field, field pot experiments were conducted during three successive wheat growing seasons: from 20 October 2017 to 1 June 2018; from 22 October 2018 to 1 June 2019 in Zhongmu County (34.7° N, 114.0° E), Henan Province, China; and from 20 October 2019 to 1 June 2020 in Yuanyang County (35.1° N, 113.9° E), Henan Province, China. The average temperatures at the experimental sites during the three wheat growth stages were 10.88 °C, 10.77 °C, and 11.52 °C, with corresponding total precipitation of 173.28 mm, 120.14 mm, and 154.21 mm. Monthly precipitation and average temperature are shown in Figure S2.
According to the results of Niu et al. [7], this experiment involved three potassium fertilizer levels (K0, 0 kg hm−2 K2O; K1, 60 kg hm−2 K2O; K2, 120 kg hm−2 K2O) and two wheat varieties (XN979 and YM68). Nitrogen and phosphorus fertilizers were applied at rates of 240 kg hm−2 and 120 kg hm−2, respectively. Each treatment included six pots as biological replicates, with three pots for collecting plant and root samples and the other three for grain yield measurements. Pots (28 cm height, 26 cm diameter) were filled with 10 kg of sieved tillage soil, and wheat seeds were sown at a density of 14 plants per pot. The soil type was sandy loam, and the basic available K contents in soil for the three wheat growing seasons were 97.71 mg kg−1, 78.41 mg kg−1, and 70.61 mg kg−1, respectively. Detailed information on basic soil fertilities is provided in Table S1. Post-sowing irrigation was scheduled at 30-day intervals to maintain soil water content within the range of 70–80% of field capacity. The growth situation in the field is shown in Figure S3a.

2.1.3. Hydroponic Culture

To investigate the differences in the K+ uptake efficiency of the roots between two varieties under controlled conditions, hydroponic cultivation was performed in a controlled environment incubator at 20 °C during the day and 18 °C at night, with a 16 h photoperiod and light intensity of 1000 μmol m−2 s−1. Seeds of XN979 and YM68 were initially germinated in Petri dishes before being transferred to germination nets for 6 days in sterile water. Subsequently, uniform seedlings were moved to pots with 15 L of modified Hoagland nutrient solution [34] and replenished every three days. The K+ concentration in nutrient solution was 1.7 mmol L−1. Fifteen days post-transplanting, seedlings showing consistent growth were selected for subsequent experiments, including the measurement of K+ uptake kinetic parameters and net K+ flux, RNA-seq analysis, and qRT-PCR analysis. The growth condition of the hydroponically culture is shown in Figure S3b.

2.2. Measurement of K Uptake and Utilization-Related Indicators in Field Pot Experiment

At maturity, three plants with consistent growth per treatment were selected. The aboveground parts and roots were harvested, dried at 80 °C to a constant weight, and weighed. Each treatment was repeated three times. The samples were then crushed, and K accumulation was measured using the H2SO4-H2O2 digestion method [35]. The grain yield from each pot was also measured, with three replicates per treatment. The K harvest index (KHI), K uptake efficiency (KUE), and K productive efficiency (KPE) were calculated using the following equations:
KHI = grain K accumulation/K accumulation in whole plant
KUE = K accumulation in whole plant/K application rate
KPE = grain yield/K application rate

2.3. Measurement of K+ Uptake Kinetic Parameters

According to the K+ concentration gradient method [36,37], we measured the K+ uptake kinetic parameters for XN979 and YM68. We designed a total of nine K+ concentration levels for K+ absorption solutions: 0.05 mmol L−1, 0.1 mmol L−1, 0.2 mmol L−1, 0.4 mmol L−1, 0.6 mmol L−1, 0.8 mmol L−1, 1.0 mmol L−1, 1.2 mmol L−1, and 1.4 mmol L−1. These solutions were categorized into two types: a normal absorption solution (CK) and an absorption solution with a K+-channel blocker (Tetraethylammonium, TEA, 1 mmol L−1). Five seedlings, cultivated hydroponically for 21 days, were rinsed with saturated CaSO4 solution before being transferred into individual centrifuge tubes (100 mL). Each tube was filled with 80 mL of absorption solution. After 2 h of incubation in the solutions, the K+ concentrations were measured using an atomic absorption spectrophotometer (Hitachi, Japan). Additionally, the dry root weight of five plants in each tube was determined to calculate their K+ uptake rates under varying external K+ concentration conditions. The data on K+ concentrations in the solution and K+ uptake rates were fitted using the Michaelis–Menten equation (M-M equation):
V = Vmax T/(Km + T)
where V represents the K+ uptake rate, Vmax represents the maximum rate of K+ uptake, T denotes the K+ concentrations in solution, and Km denotes the K+ concentrations at which 1/2 of Vmax was achieved.

2.4. RNA Isolation, Library Preparation, and RNA-Seq

After 21 days of hydroponic cultivation, XN979 and YM68 plants were exposed to a nutrient solution containing 0.1 mmol L−1 K+ for durations of 0 h, 6 h, 12 h, 24 h, and 48 h. Root samples were collected at each time point for total RNA extraction and RNA-seq analysis. Each condition included three biological replicates, with the group cultured in low-K nutrient solution for 0 h serving as the control group (CK). RNA extraction, quality assessment, library construction, and sequencing were performed by Gene Denovo Biotechnology Co. (Guangzhou, China). RNA-seq data were used to identify differentially expressed genes (DEGs) according to |log2 (Fold Change)| ≥ 1 and FDR (false discovery rate) value < 0.05. Bioinformatic analysis and weighted gene co-expression network analysis (WGCNA) were conducted using Omicsmart (http://www.omicsmart.com, accessed on 14 March 2023).

2.5. qRT-PCR Analysis

Thirteen genes associated with this study were selected for qRT-PCR analysis. These genes are involved in the synthesis of K+-channels and K+-transporters, the CBL-CIPK signaling pathway, and phytohormone biosynthesis, all of which represent the key areas of focus in this study. qRT-PCR analysis was performed using a Thermal Cycler CFX96 Real-Time System (BIO-RAD, Hercules, CA, USA) and a HiScript II One Step qRT-PCR SYBR Green Kit (Vazyme, Nanjing, China). The procedure included three biological replicates, with β-Actin as the reference gene. The relative expression levels were calculated using the 2−ΔΔCt method [23]. The DNA primers used for qRT-PCR are listed in the Supplementary Data Table S2.

2.6. Net K+ Flux Measurement

Net K+ flux was determined using a non-invasive micro-test technology system (NMT, Younger, Amherst, MA, USA). The principles of NMT and the fabrication and calibration details of K+-selective microelectrode have been described in previous studies [38,39]. The K+-selective microelectrode, with a tip diameter of 4 μm to 5 μm, was infused with K+ liquid ion exchanger. Wheat roots were immersed in both normal testing solution (CK) and TEA testing solution (TEA) for evaluation. The normal testing solution (CK) consisted of two types: K+ concentrations of 0.1 mmol L−1 and 1.0 mmol L−1, with a background solution containing 0.1 mmol L−1 CaCl2·2H2O, 0.1 mmol L−1 MgCl2·6H2O, and 0.1 mmol L−1 NaCl at pH = 6.0. The TEA testing solution included 1.0 mmol L−1 TEA added to normal testing solution. Measurements were taken at a point of 1.0 cm from the root tip within the mature zone.

2.7. Statistical Analysis

Statistical analyses were conducted using Duncan’s multiple range test at p < 0.05 levels, utilizing IBM SPSS Statistics 20.0 (IBM, Armonk, NY, USA). Figures were graphed by Origin 2022 (Origin Lab Corporation, Northampton, MA, USA) and an online platform for digital drawing tools (https://www.omicshare.com/tools/, accessed on 10 May 2023).

3. Results

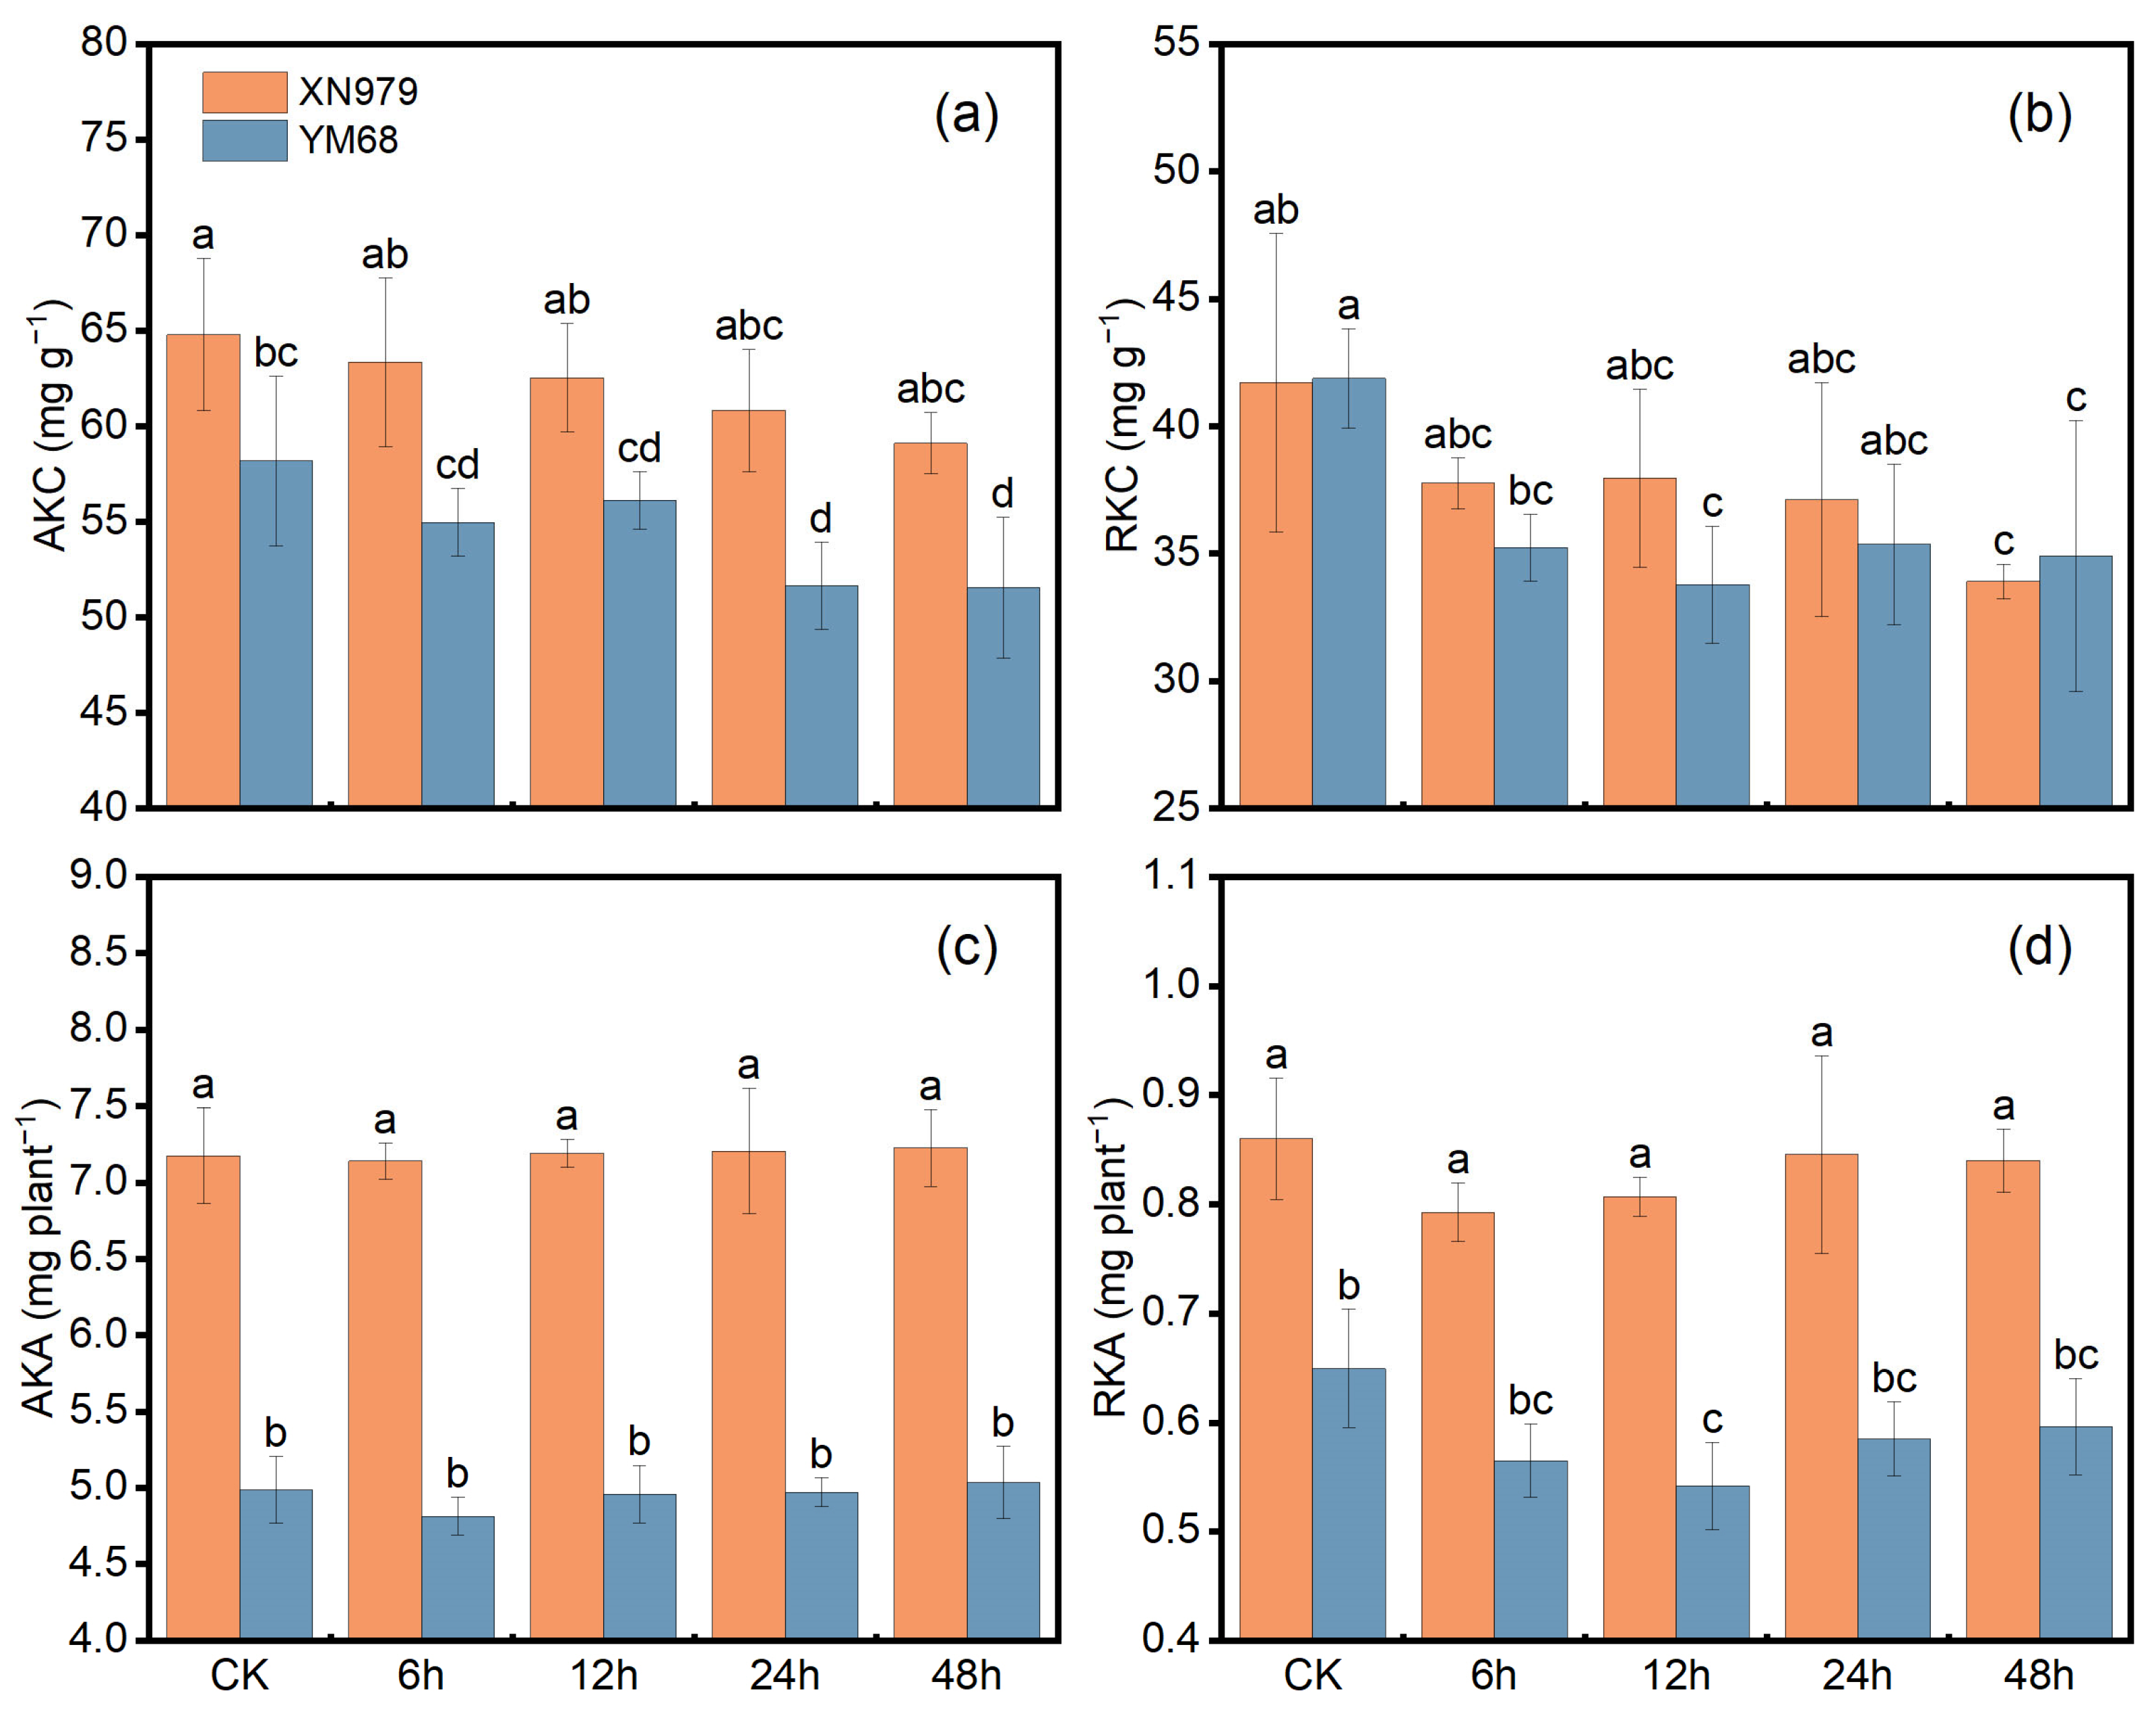
3.1. K Uptake and Utilization-Related Indicators in Field Pot Experiment

Throughout three successive wheat growing seasons, the aboveground K accumulation (AKA) of XN979 in the K1 and K2 treatments was significantly higher than that of YM68 under the K0 treatment (Figure 1a). In the K0 and K1 treatments, the AKA of XN979 increased by 7.57% and 4.74%, respectively, compared to YM68. In the K1 treatment, the root K accumulation (RKA) of XN979 was significantly higher than that of YM68 in both the K0 and K2 treatments (Figure 1b). The grain yields of XN979 and YM68 increased by 7.97% and 5.86%, respectively, in the K1 treatment and by 11.75% and 13.47% in the K2 treatment (Figure 1c). Notably, compared to the K0 treatment, both varieties showed a significant increase in grain yield in the K2 treatment. The KHI values of XN979 were significantly higher than those of YM68 in both the K1 and K2 treatments (Figure 1d) and also higher than the KHI values in the K0 treatment for both varieties. Furthermore, the KUE and KPE values of XN979 were significantly higher in the K1 treatment compared to other treatments (Figure 1e,f).

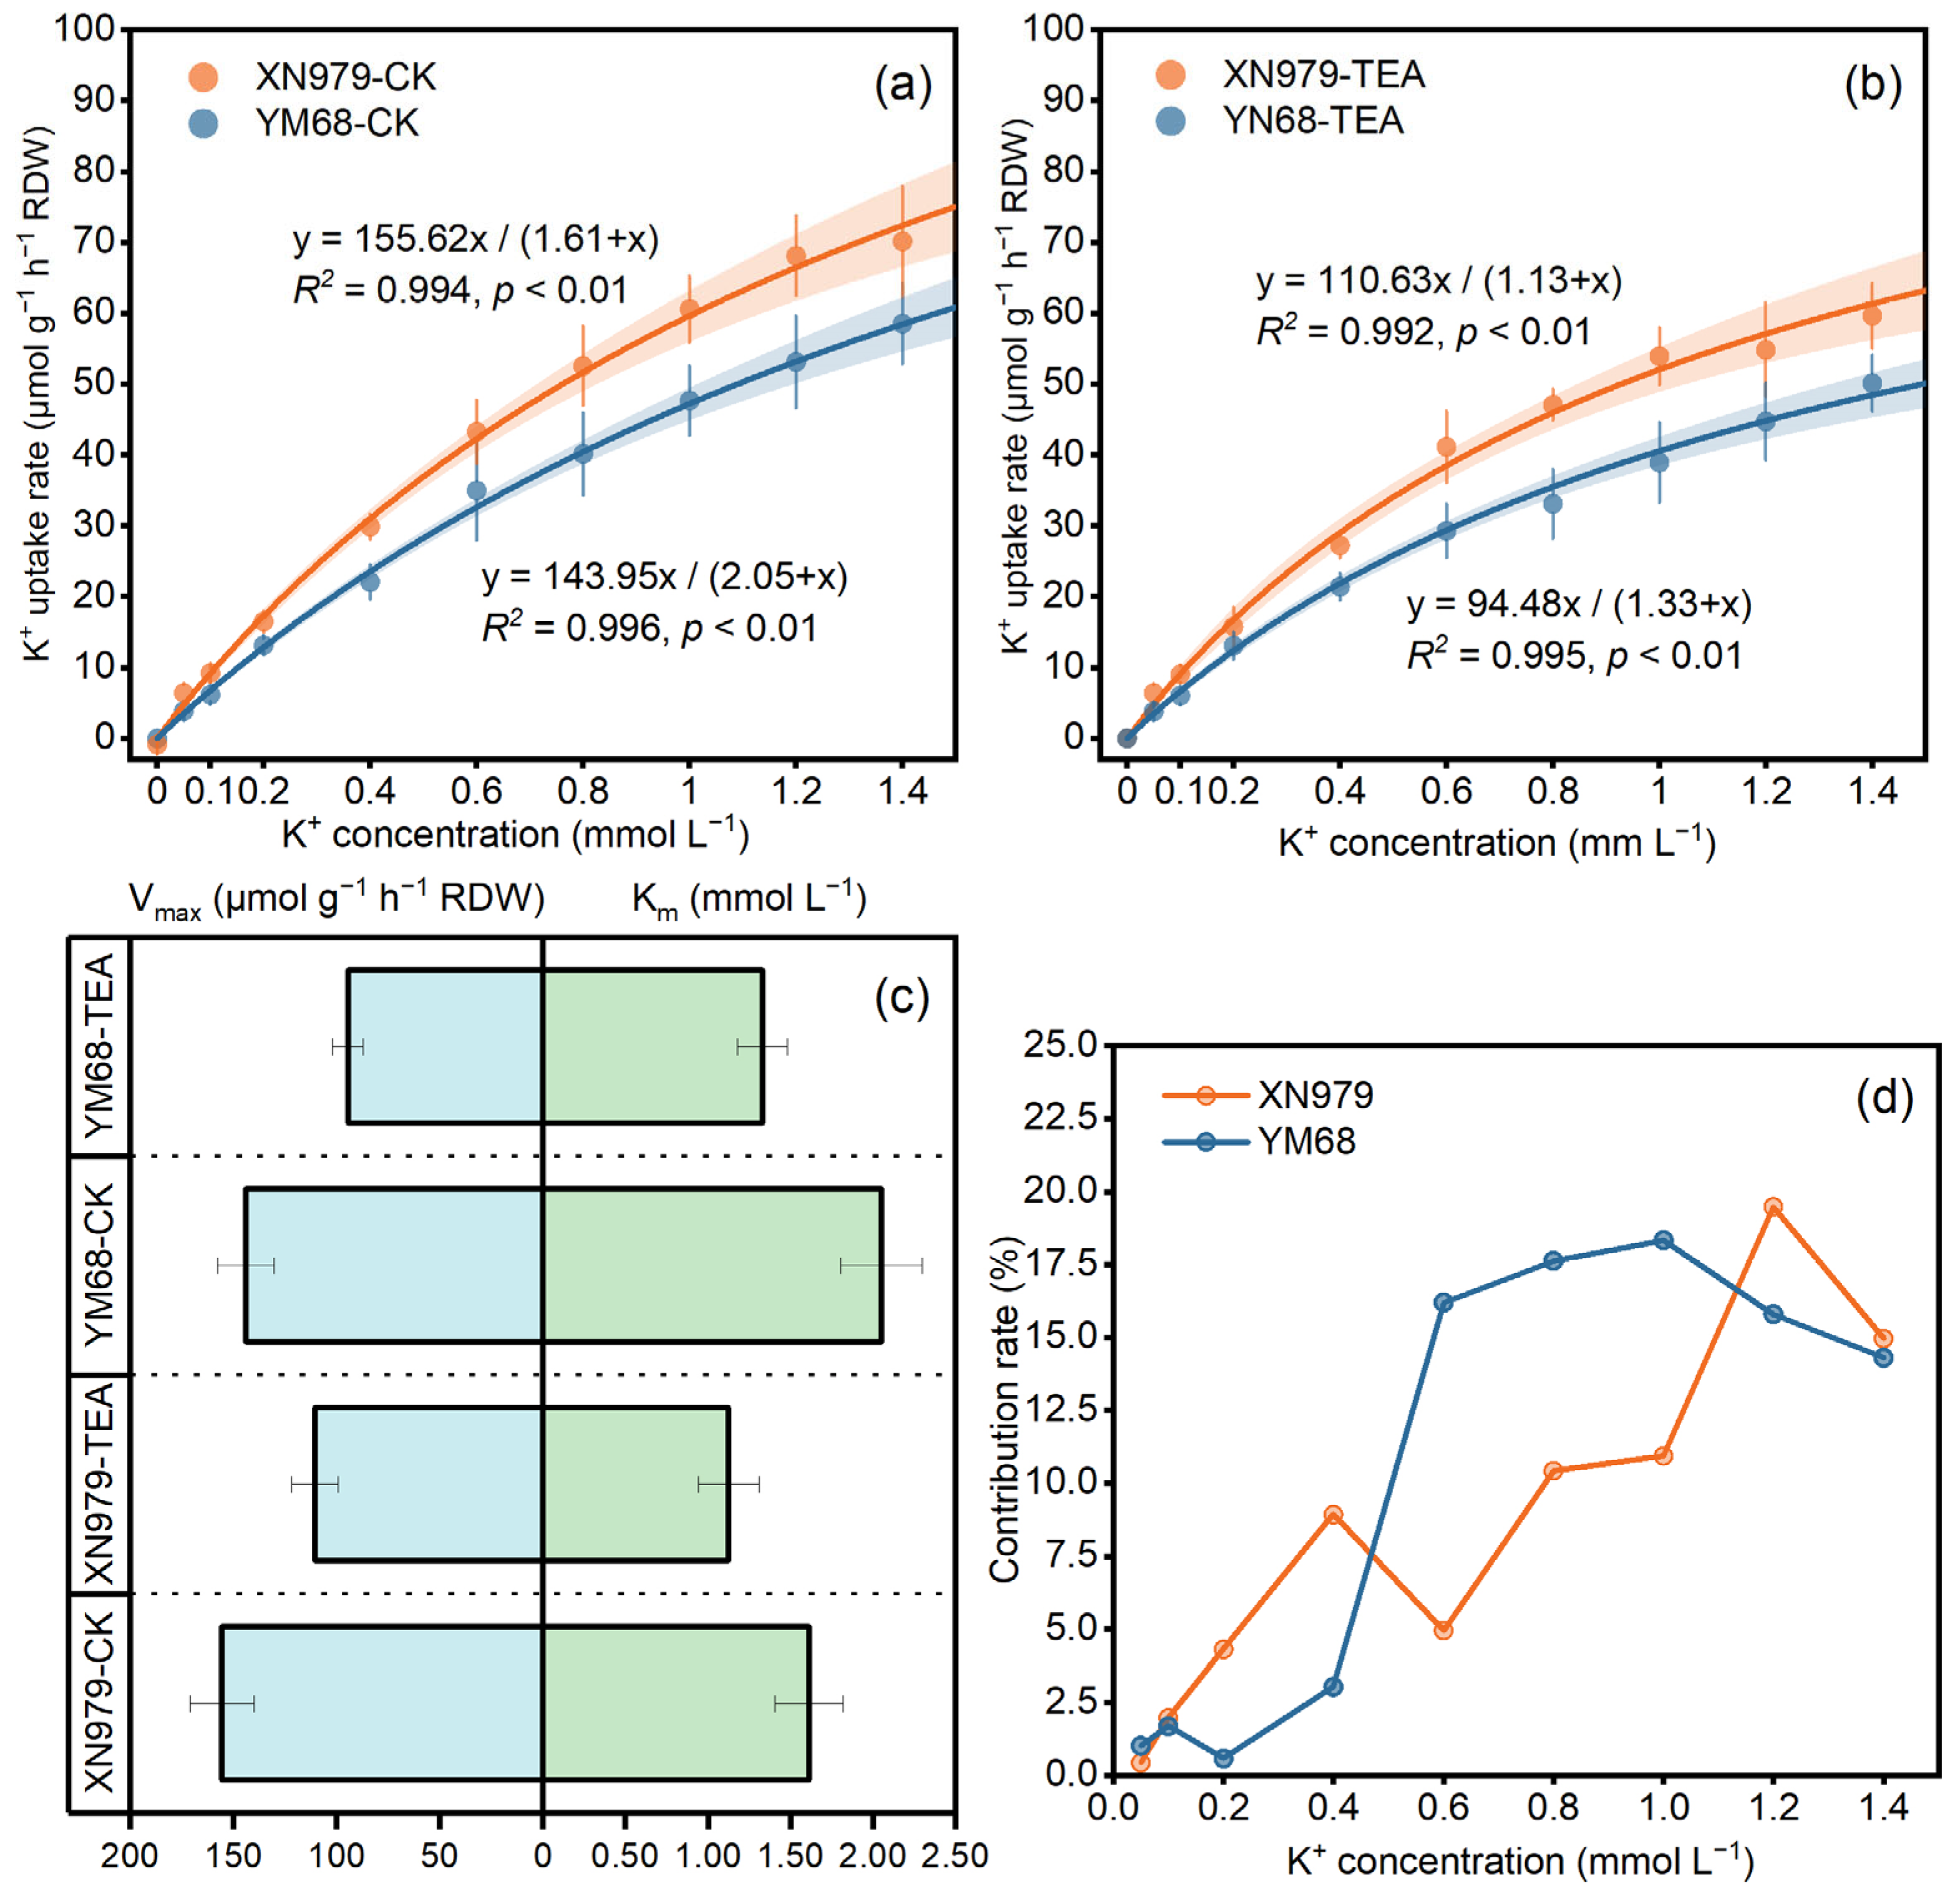
3.2. K+ Uptake Kinetic Parameters

The K+ uptake rates of XN979 and YM68 were measured under CK and TEA conditions in various K+ concentrations (0 mmol L−1 to 1.4 mmol L−1), and data were analyzed using the M-M equation (Figure 2a,b). The K+ uptake rate was higher in XN979 than in YM68 in the K+ concentrations range of 0.8 to 1.2 mmol L−1 under the CK condition (Figure 2a). The Vmax values for XN979 were higher, while the Km values were lower compared to YM68 (Figure 2c). The addition of TEA, a K+-channel blocker, led to a reduction of over 10% in the root K+ uptake rate for both varieties in the K+ concentrations range of 0.8 to 1.4 mmol L−1 (Figure 2b). Under TEA conditions, both Vmax and Km markedly decreased in XN979 and YM68 compared to the CK conditions (Figure 2c). Furthermore, when the external K+ concentration was below 0.4 mmol L−1 or exceeded 1.0 mmol L−1, the contribution of K+-channels to K+ transport in both varieties was less than 5.0% or greater than 10.0%, respectively (Figure 2d). The contribution rates were lower and higher in XN979 than in YM68 in the external K+ concentrations range of 0.6 mmol L−1 to 1.0 mmol L−1 and above 1.0 mmol L−1, respectively.

3.3. Growth Dynamics of the Aboveground Part and Root Under K+-Deprivation

After being cultured in K+-deprived solution for 6, 12, 24, and 48 h, both the aboveground K content (AKC) and root potassium content (RKC) in XN979 and YM68 were significantly lower than those in CK (Figure 3a,b). Notably, the RKC in both varieties showed a dramatic decrease after 48 h of K+-deprivation (Figure 3b). Although there was no significant difference in the AKC between XN979 and YM68 across different durations of K+-deprivation, XN979 consistently had higher AKC values at all five of the measured time points (Figure 3c). Compared to CK, the RKA values of XN979 decreased by 51.11%, 67.52%, and 47.22% after 6, 12, and 48 h of K+-deprivation, respectively (Figure 3d). In contrast, the RKA values of YM68 decreased by 37.88%, 25.78%, 37.07%, and 18.24% at various durations of K+-deprivation, respectively, reaching significance at 12 h. Furthermore, the SPAD values of the first developed leaves in both XN979 and YM68 significantly decreased after 12 h, 24 h, and 48 h of K+-deprivation compared to CK (Figure S4c). Compared to CK, some root morphological characters exhibited an increase in both varieties after 24 h and 48 h of K+-deprivation, including total root length (TRL), average root diameter (ARD), and total root volume (TRV) (Figure S4d,f,g). Furthermore, a significant increase in total root tips (TRT) was observed in both varieties after 48 h of K+-deprivation (Figure S4h).

3.4. RNA Sequence Analysis Under K+-Deprivation

The RNA-seq of 30 cDNA libraries yielded 270.81 Gb of clean data, with a Q30 percentage ranging from 93.06% to 94.41% (Table S3). The total mapped data as a proportion of total clean data varied between 90.69% and 94.37%. In XN979, compared with CK, 3112, 1734, 2131, and 2081 DEGs were upregulated, and 2764, 2147, 2281, and 1411 DEGs were downregulated after 6 h, 12 h, 24 h, and 48 h of K+-deprivation, respectively (Figure S5a). In YM68, compared with CK, 2047, 1103, 779, and 1140 DEGs were upregulated, and 2738, 2421, 841, and 438 DEGs were downregulated at the same time points. In four comparison groups of XN979 and YM68, 10,373 and 7137 DEGs with significantly altered expression levels (|log2 (Fold Change)| ≥ 1) were identified, respectively (Figure S5b,c). After 6 h, 12 h, 24 h, and 48 h of K+-deprivation, the number of DEGs with significantly upregulated expression in XN979 was higher than that in YM68 (Figure S6). For DEGs with significantly downregulated expression, the number in XN979 exceeded that in YM68 only after 6 h, 24 h, and 48 h of K+-deprivation (Figure S7).

3.5. Gene Ontology (GO) Term Enrichment Analysis

The top 20 significantly enriched GO terms for each comparison group are presented in Figures S8 and S9. In XN979, the “single-organism process” was the most significantly enriched term in CK vs. 6 h and CK vs. 24 h comparisons, while “gas transport” and “inorganic anion transport” were the most significantly enriched terms in CK vs. 12 h and CK vs. 48 h comparisons, respectively (Figure S8). In YM68, “gas transport”, “sulfur compound metabolic process”, and “amino acid salvage” were the most significantly enriched terms in comparison with CK at 6, 12, 24, and 48 h, respectively (Figure S9). Additionally, GO terms related to ion binding, cation binding, metal ion binding, and metal ion homeostasis were enriched in those comparison groups for both XN979 and YM68.

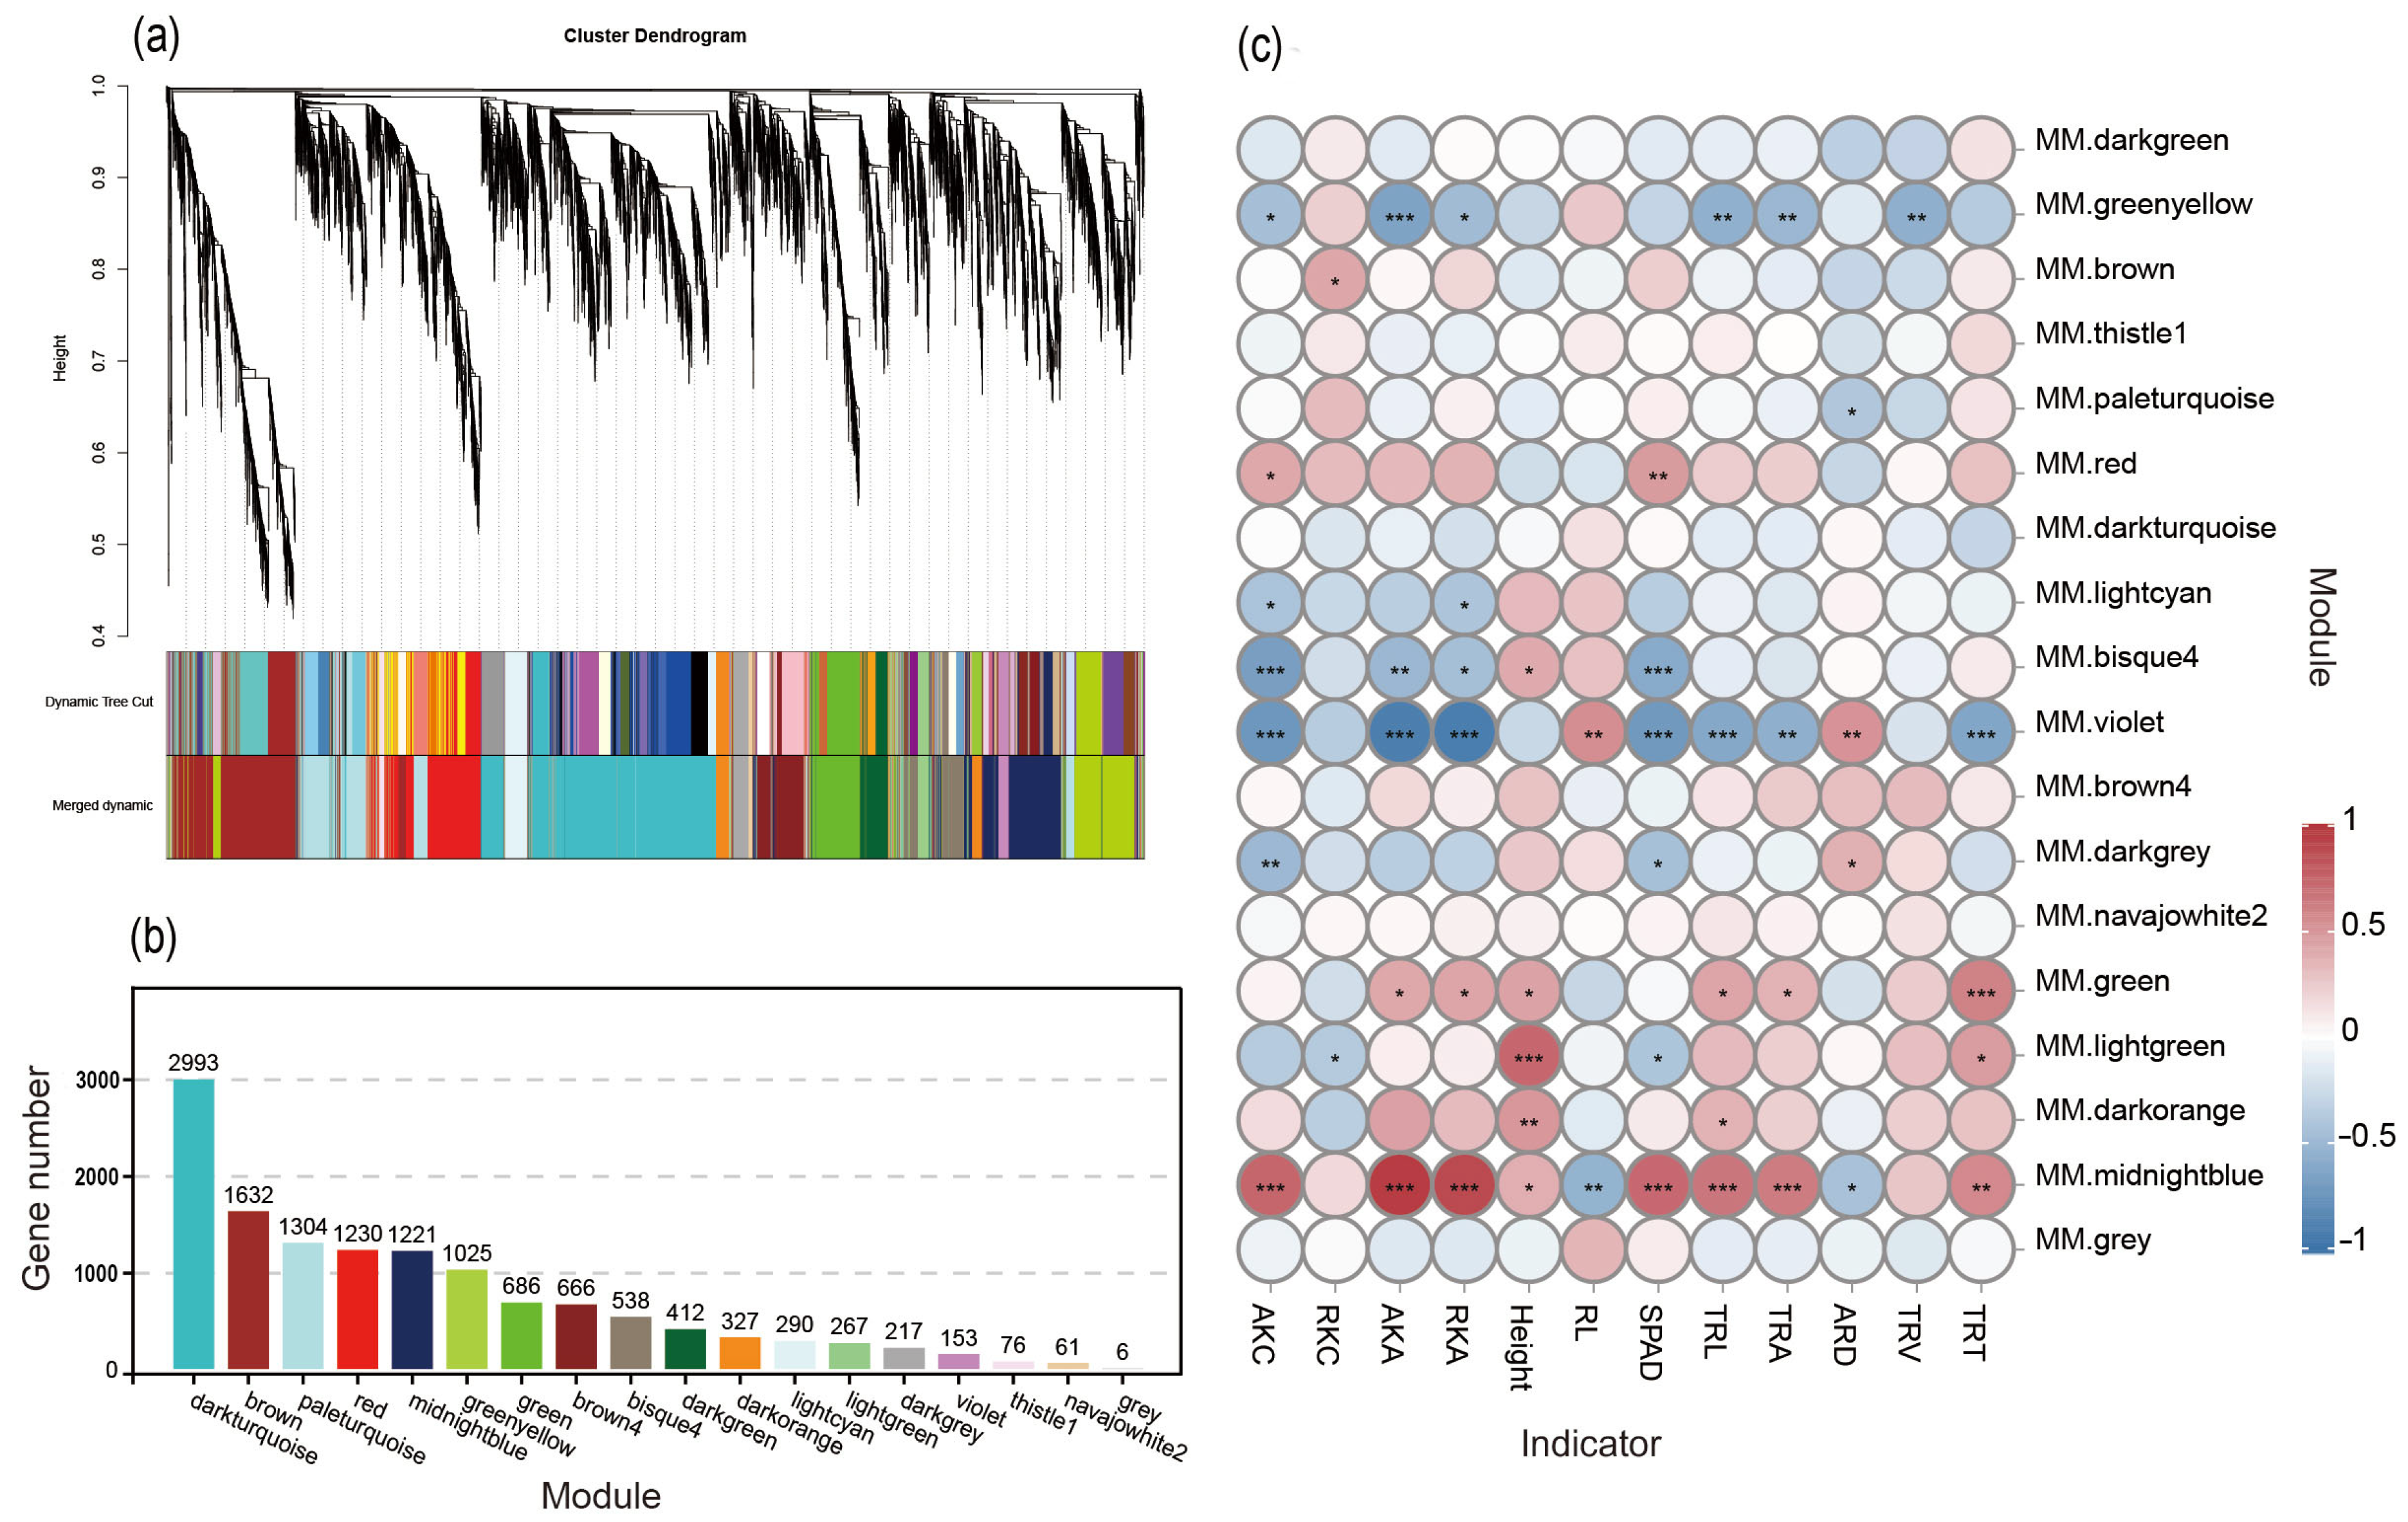
3.6. WGCNA and Co-Expression Module GO Term Enrichment Analysis

DEGs from eight comparison groups were clustered into 18 modules using WGCNA to accurately identify genes responsive to K+-deprivation in wheat roots (Figure 4a,b). Eigengene–trait correlation analysis between modules and physiological indicators showed that 10 modules had significant or highly significant correlations with at least one of the wheat K+ uptake-related indicators (AKC, RKC, AKA, RKA) (Figure 4c). These modules were MM. midnightblue, MM. bisque4, MM. greenyellow, MM. brown, MM. lightgreen, MM. lightcyan, MM. violet, MM. darkgrey, MM. red, and MM. green. The top 20 GO terms for each screened module revealed significant enrichment in various biological processes. Notably, GO terms associated with cellular ion homeostasis, cellular chemical homeostasis, and cation transport were significantly enriched in the MM. bisque4 module (Figure S10). MM. violet showed significant enrichment for the ion channel activity term. The protein kinase activity and kinase activity GO terms were significantly enriched in the MM. greenyellow, MM. brown, and MM. red modules. The S-adenosylmethionine metabolic process and abscisic acid biosynthetic process were significantly enriched in the MM. green module and MM. lightgreen module, respectively. GO terms related to cell wall organization or biogenesis were significantly enriched in the MM. lightcyan and MM. greenyellow modules. Additionally, the MM. midnightblue and MM. darkgrey modules exhibited significant enrichment of GO terms associated with oxidoreductase activity.

3.7. DEGs Involved in K+-Channel and K+-Transporter

DGEs from the 10 screened modules were consolidated into a new gene set for further analysis. In this gene set, several genes related to K+-channels and K+-transporters were found to be upregulated or downregulated in response to K+-deprivation compared with K+-sufficient conditions (CK groups) (Figure 5, Table S4). The expression of AKT1, which encodes an inward K+-channel in wheat roots, was upregulated after 6 h of K+-deprivation but downregulated at 12, 24, and 48 h of K+- deprivation in both XN979 and YM68 compared to the CK group. Genes encoding the weakly inward rectifying K+-channel AKT2 were significantly upregulated under K+-deprivation (Table S4). Meanwhile, expressions of KOR1 and KOR2, which encode SKOR outward K+-channels, were significantly downregulated after 6 h and 12 h of K+-deprivation, respectively. In XN979, expressions of K+-transporter genes HAK1, HAK13, and HAK23 were upregulated at 6, 12, 24, and 48 h following K+-deprivation compared with CK groups (Table S4). Notably, after 48 h of K+-deficiency, the expression levels of HAK1 and HAK13 were significantly upregulated, and HAK23 showed a marked increase after 6 h of K+-deficiency. In YM68, the expression levels of HAK1 were upregulated at all of the measured time points following K+-deprivation. The expression of HAK13 was upregulated only after 6 h, 24 h, and 48 h of K+-deprivation, while HAK23 exhibited upregulation only at 6 h and 48 h of K+-deprivation. Both HAK13 and HAK23 showed downregulation at the other time points.

3.8. DEGs Involved in CBL-CIPK Signaling System

The CBL-CIPK signaling system is a primary pathway in plants for responding to abiotic stresses. GO terms related to protein kinase activity and kinase activity were significantly enriched in the screened modules (Figure S10). In XN979, the expressions of CIPK2, CIPK4, CIPK10, and CIPK19 were upregulated at 6 h, 12 h, 24 h, and 48 h of K+-deprivation (Figure 6, Table S5). Conversely, CBL9, CIPK15, CIPK16, CIPK23, and CIPK31 genes were downregulated throughout the same time periods. TraesCS1B02G370900 and TraesCS1D02G358200 are genes encoding CBL4 protein. The expression of TraesCS1B02G370900 was upregulated at 6 h, 12 h, 24 h, and 48 h of K+-deprivation, and the expression of TraesCS1D02G358200 was only upregulated at 24 h and 48 h of K+-deprivation. In YM68, CIPK2, CIPK6, CIPK10, CIPK19, and CIPK29 were upregulated after 6, 12, 24, and 48 h of K+-deprivation, while CIPK16, CIPK23, and CIPK31 were downregulated. Additionally, CBL9, CIPK7, and CIPK9 were downregulated after 6, 12, and 24 h of K+-deprivation but upregulated after 48 h of K+-deprivation. TraesCS1B02G370900 (encoding CBL4) showed upregulation at all of the measured time points compared to CK.

3.9. DEGs Involved in Phytohormone Biosynthesis and Signal Transduction

DEGs related to phytohormone biosynthesis and signal transduction, identified from 10 selected modules, exhibited significant expression changes under K+-deprivation (Figure 7, Table S6). Fourteen DEGs associated with IAA biosynthesis and signal transduction were identified. In XN979, genes YUC2, YUC8, IAA16, and PIN1C were upregulated after 6 h, 12 h, 24 h, and 48 h of K+-deprivation compared with CK, while genes PIN4, PIN5, ARF5, and ARF13 were downregulated. Furthermore, IAA8 and IAA18 genes were significantly upregulated after 48 h of K+ deficiency. In YM68, YUC8, IAA16, and IAA18 genes showed upregulation under K+-deprivation, whereas PIN4 and PIN5 genes were downregulated.
Thirteen DEGs involved in GA biosynthesis and signal transduction were also identified from 10 screened modules (Figure 7, Table S6). In XN979, GA20OX1 and GA3OX2-3 genes were upregulated after 6 h, 12 h, 24 h, and 48 h of K+-deprivation compared with CK, whereas GA2OX1, GA2OX8, and GAI1 genes were downregulated. In YM68, GA20OX1 and GA3OX2-3 exhibited upregulation, while GA2OX8 was consistently downregulated across all time points. GA2OX1 and GAI1 genes were downregulated after 6 h, 12 h, and 24 h of K+-deprivation, and the gene encoding GAI1 (TraesCS3B02G424600) was significantly upregulated after 48 h of K+-deprivation.
Additionally, 13 DEGs involved in ABA biosynthesis and signal transduction, and 16 DEGs associated with ETH biosynthesis and signal transduction, were identified (Figure 7, Table S6). The VP14 and AO1 genes, related to ABA synthesis, were significantly downregulated after 6 h and 12 h of K+-deprivation in both XN979 and YM68. However, ABCG25 gene, involved in ABA transporter synthesis, was upregulated after 6 h, 12 h, 24 h, and 48 h of K+-deprivation in both varieties. Regarding ETH biosynthesis and signal transduction, ACO1, EIN4, and MPK5 genes in XN979 roots were downregulated after 6 h, 12 h, 24 h, and 48 h of K+-deprivation. In YM68 roots, SAMS and ERF1 genes exhibited significant downregulation at all of the measured time points compared with CK.

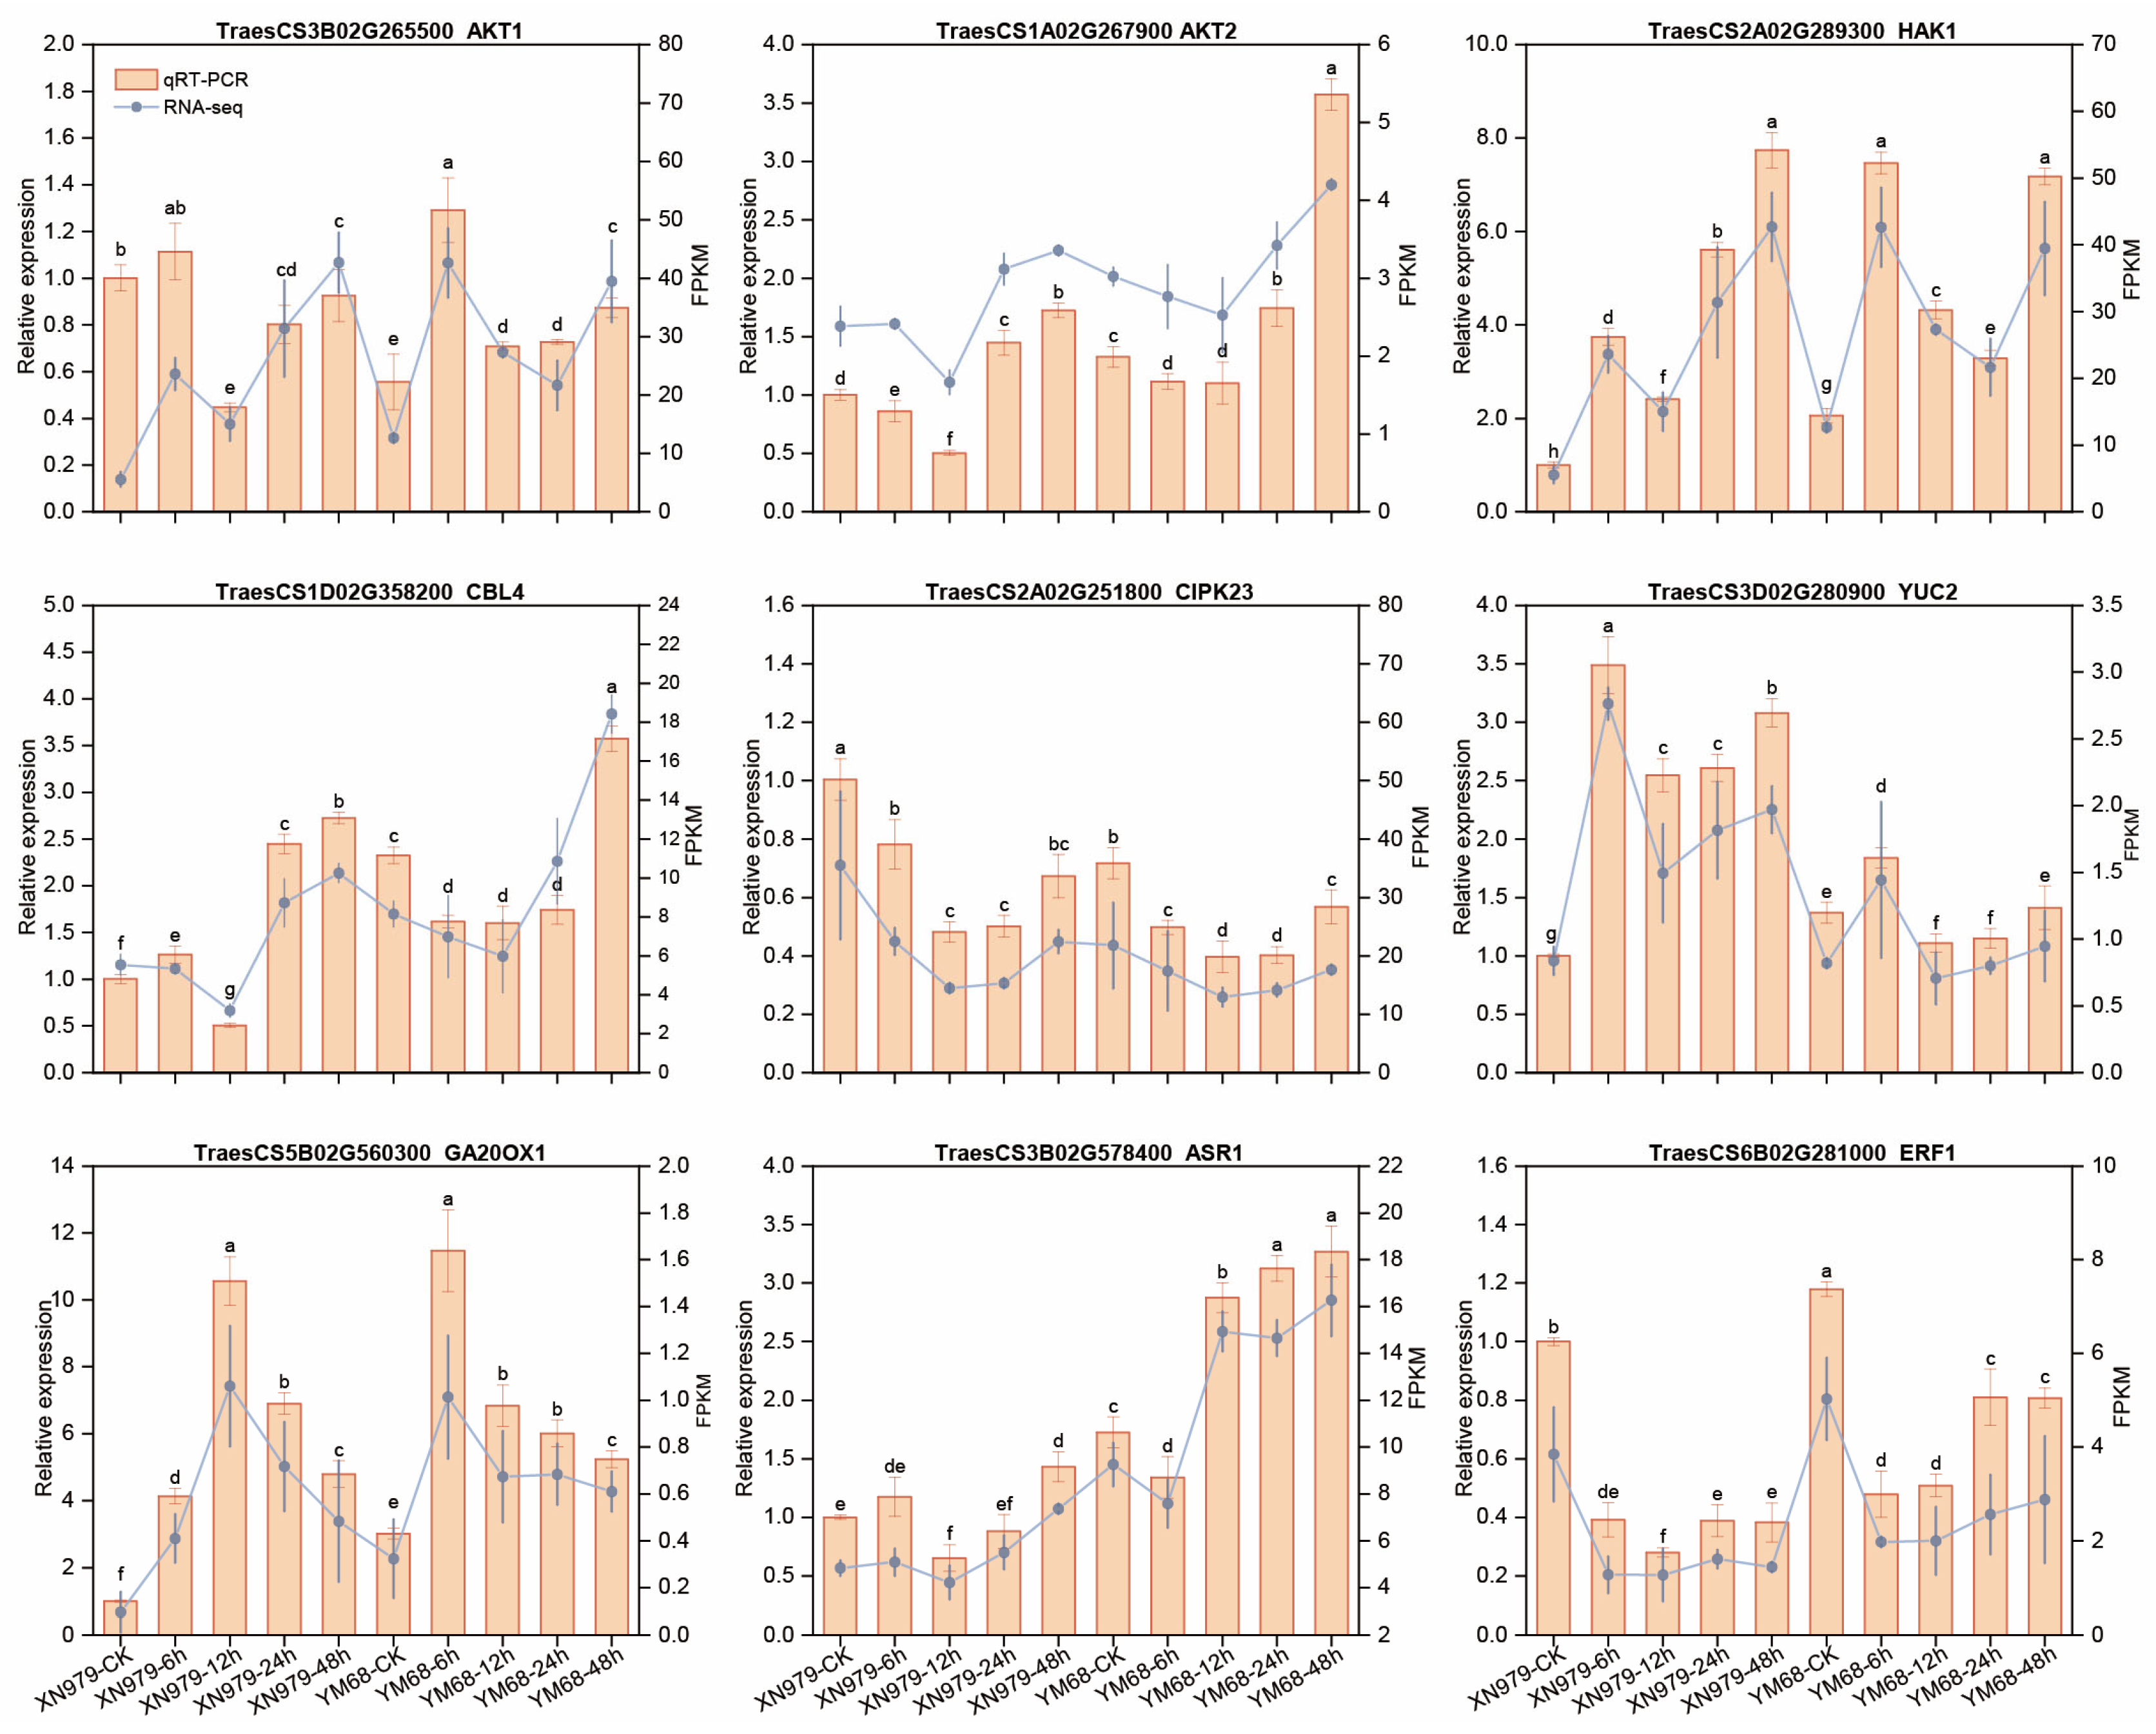
3.10. Validation of DEGs Under K+-Deprivation in XN979 and YM68

Nine DEGs were selected for qRT-PCR analysis to validate RNA-seq data. These genes are all associated with the pathway under investigation in this study. They are AKT1, AKT2, and HAK1 (encoding K+-channels and HAK1 transporter proteins), CBL4 and CIPK23 (related to the CBL-CIPK signaling pathway), and YUC2, GA20OX1, ASR1, and ERF1 (involved in IAA, GA, ABA, and ETH synthesis). The variations in the relative expression levels of these genes were consistent with the FPKM (fragments per kilobase of exon model per million mapped read) values obtained from the RNA-seq analysis (Figure 8). For example, in XN979, the expression levels of AKT1 and HAK1 were upregulated after 6 h of K+-deprivation but downregulated after 12 h compared with XN979-CK. The expression levels of AKT2 and CBL4 were downregulated after 6 h and 12 h of K+-deprivation but upregulated after 24 h and 48 h. Similar expression patterns were also observed in YM68.

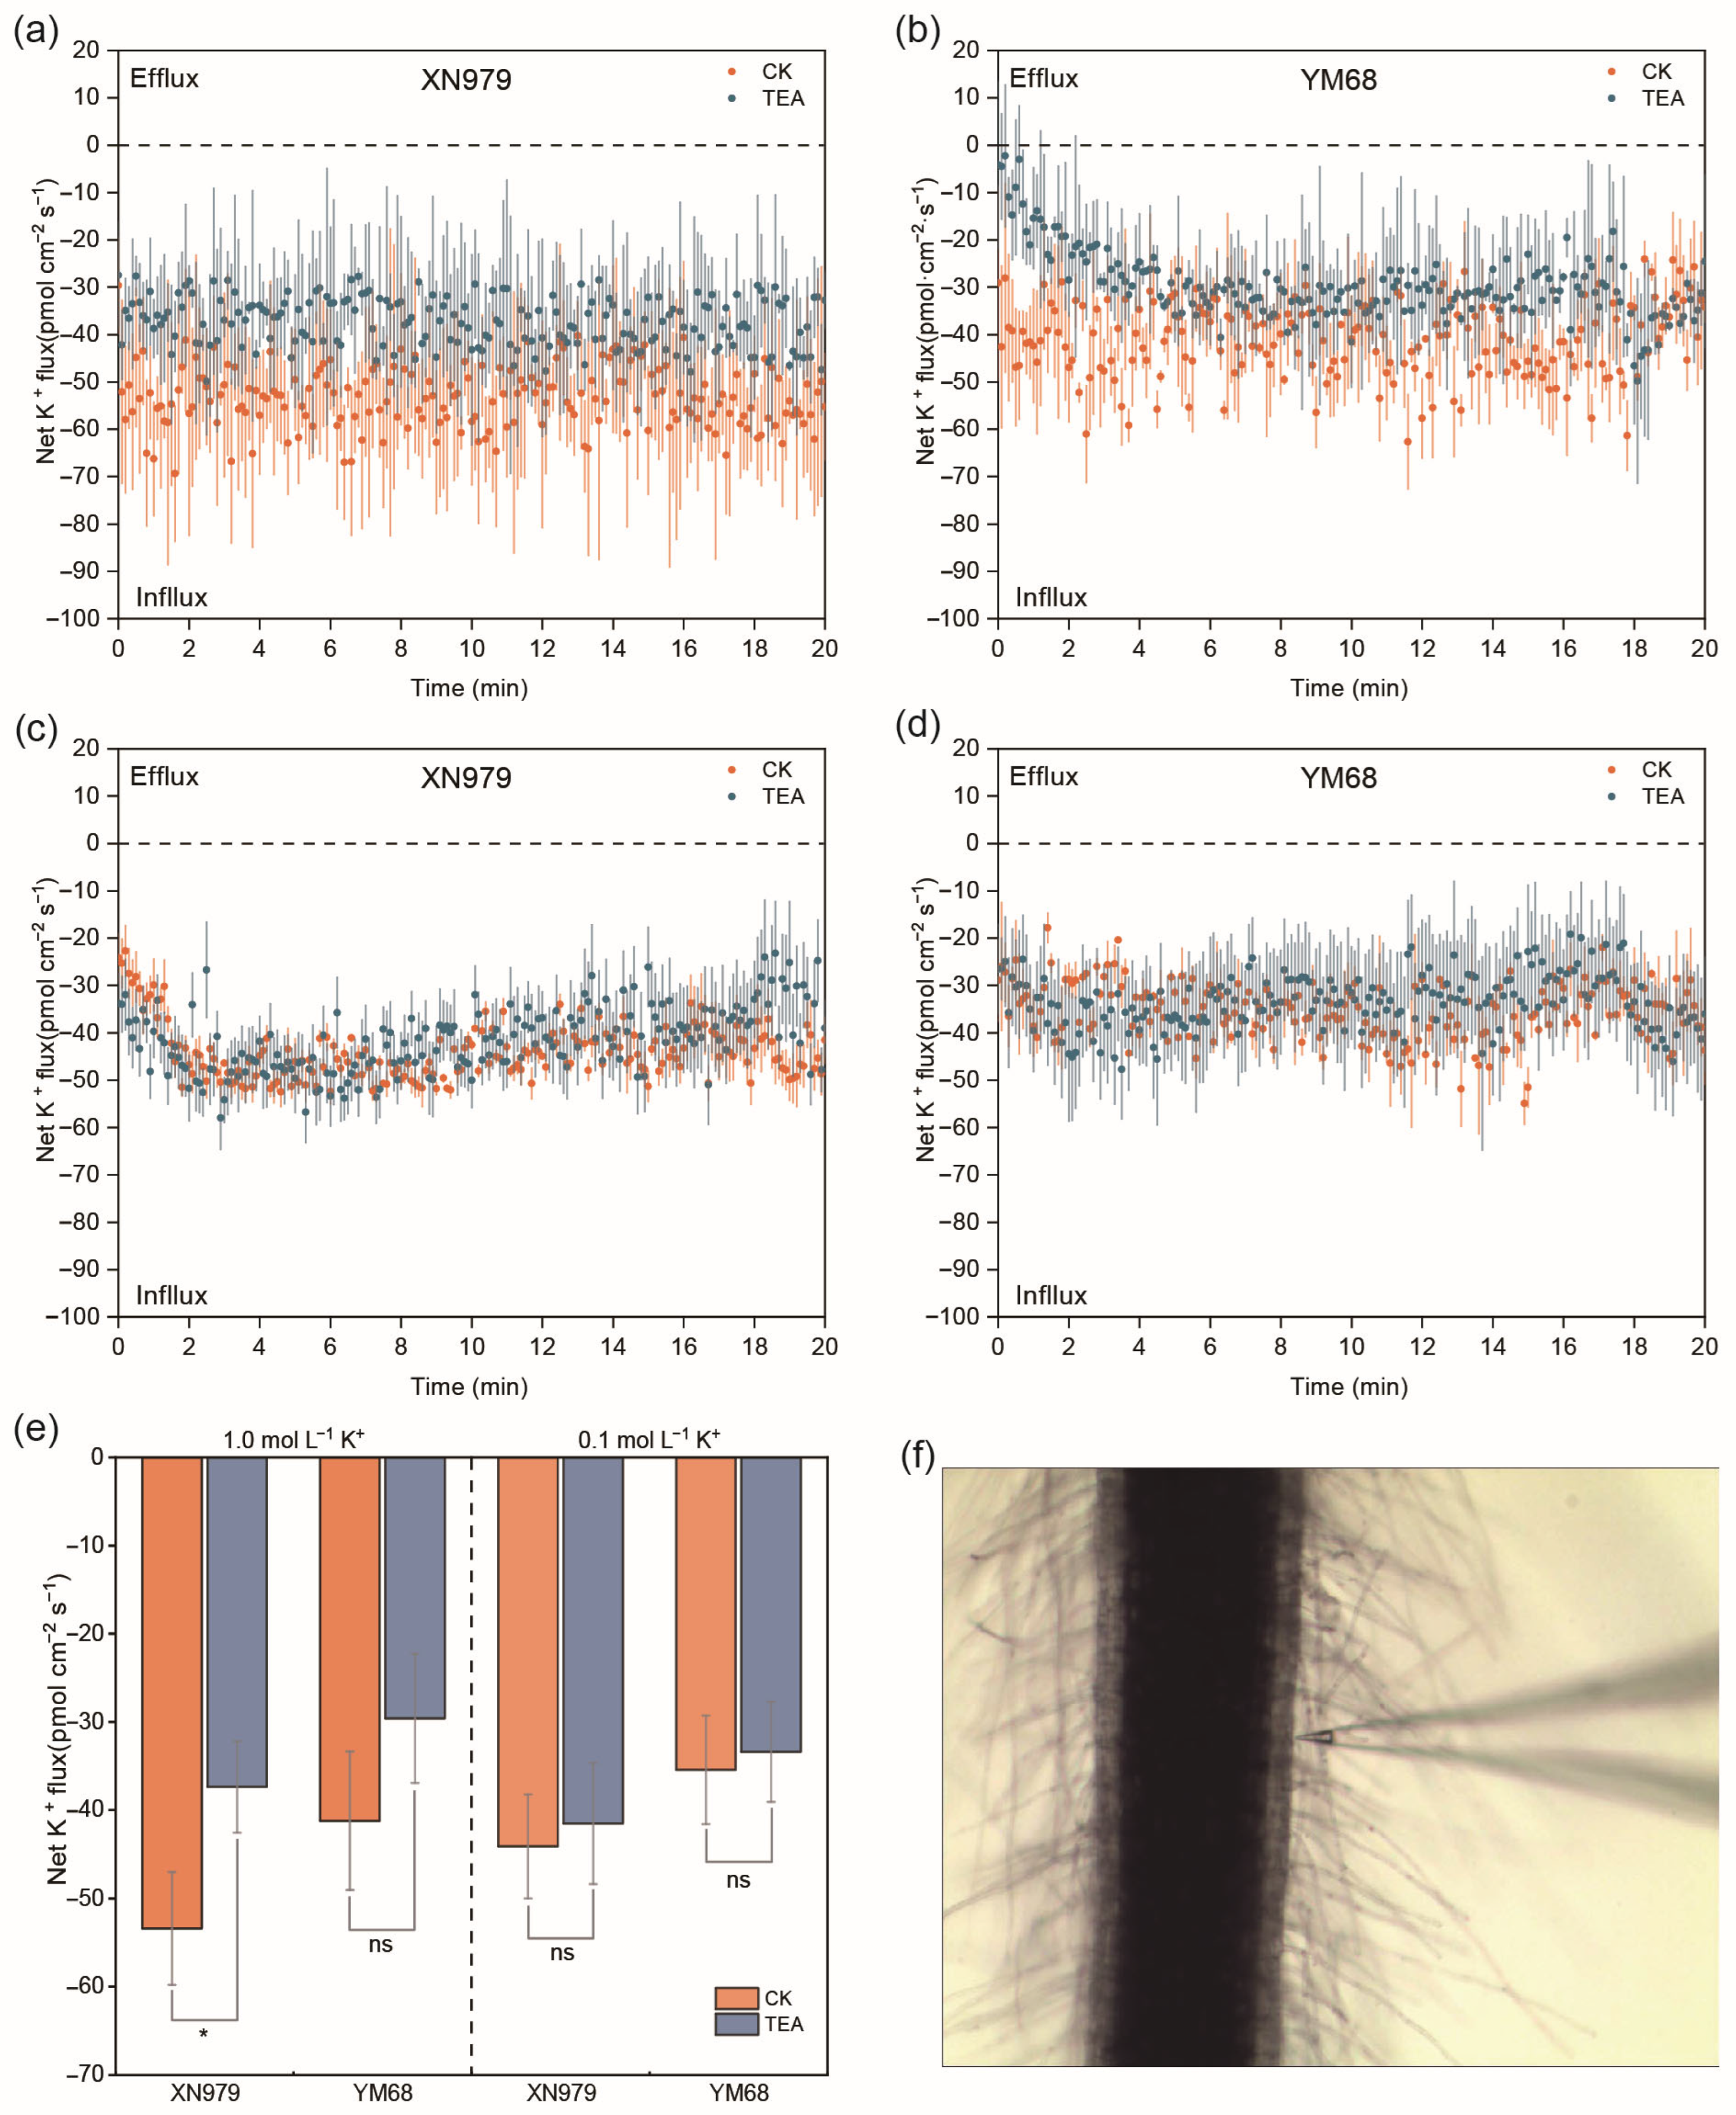
3.11. Net K+ Flux from Root Mature Zones

To investigate changes in K+ transport modes and rates in wheat roots under K+-sufficient and K+-deficient conditions, net K+ flux data from root mature zones were collected with or without the K+-channel blocker TEA (Figure 9f). In XN979, TEA reduced K+ flux from root mature zones under 1.0 mmol L−1 K+ conditions (Figure 9a), while only minor decreases were observed at a few time points under 0.1 mmol L−1 K+ conditions (Figure 9c). The mean K+ flux values in the TEA-treated samples exhibited a significant decrease of 42.91% compared with CK under 1.0 mmol L−1 K+ conditions and a marginal reduction of 6.27% under 0.1 mmol L−1 K+ conditions (Figure 9e). In YM68, TEA reduced K+ flux at most time points under 1.0 mmol L−1 K+ conditions (Figure 9b) and at certain time points under 0.1 mmol L−1 K+ conditions (Figure 9d). The mean K+ flux values in TEA-treated samples showed decreases of 39.25% and 6.27% compared with CK under 1.0 mmol L−1 and 0.1 mmol L−1 K+ conditions, respectively (Figure 9e).

4. Discussion

4.1. Differential K+ Uptake Characteristics of Two Wheat Varieties

K is an essential macronutrient for plant growth, and severe K deficiency in wheat leads to noticeable symptoms such as stunted growth, reduced grain yield, and quality [40,41]. Given the low concentration of plant-available potassium (0.1 mmol L−1–1.0 mmol L−1) in soils [6], several cultivation strategies have been explored to improve K use efficiency in wheat. These strategies include adjusting the rate of K fertilizer application and cultivating varieties with high K use efficiency [42,43]. Our study observed that XN979 exhibited a higher capacity for K accumulation than YM68 under low-K fertilizer application conditions, leading to improved yield (Figure 1a,c). In K1 treatments, both the KUE and KPE of XN979 were significantly enhanced compared with YM68 (Figure 1e,f). These results indicate that XN979 possesses superior abilities in K absorption and utilization, making it better adapted to growth in low-K conditions. However, given that the available K content in soil during the first wheat growing season was higher than in the other two seasons (Table S1) and climatic conditions exhibited significant inter-annual variability in field (Figure S2), the results of the pot experiment conducted under field showed no statistically significant differences in AKA between XN979 and YM68 in the K0 and K1 treatments. Nevertheless, the AKA of XN979 in the K0 and K1 treatments increased by 7.57% and 4.74%, respectively, compared with YM68. Therefore, it is necessary to further compare the potassium absorption and utilization capabilities of these two varieties under controlled conditions.
Wheat roots uptake K+ through ion channels and transport proteins located on root cortex cells [33,44]. However, there are variations in root-mediated K+ uptake characteristics among different wheat varieties [45]. To further elucidate the differences in root K+ uptake characteristics between XN979 and YM68, we conducted a comprehensive analysis of their respective K+ uptake kinetic curves. The results showed that XN979 had a higher K+ uptake rate compared to YM68 (Figure 2a), as well as a higher Vmax and lower Km (Figure 2c). These findings suggest that XN979 has an enhanced capacity for K+ uptake and greater adaptability under K+-deprivation conditions. The dominant modes of K+ transmembrane transport by root cortical cells vary with external K+ concentrations [11,33,37]. In this study, we observed a gradual increase in the proportion of K+ uptake mediated by K+-channels with an increasing external K+ concentration (Figure 2d). Notably, the contribution rate of K+-channels to root K+ uptake in XN979 was higher compared YM68 at external K+ concentrations of 0.2 mmol L−1–0.4 mmol L−1 and 1.2 mmol L−1–1.4 mmol L−1. These findings underscore the vital role played by K+-channels in facilitating K+ transport in wheat roots. In conclusion, XN979 demonstrates higher K uptake efficiency under K+-deficiency conditions and superior capacity for K+ uptake across different external K+ concentration levels compared with YM68.

4.2. Response of Wheat Root K+ Transport to K+-Deprivation

K+-channels and K+-transporters, crucial membrane proteins, facilitate the transmembrane transport of K+ [11,46]. AKT1 protein, an inward-rectifying K+-channel predominantly located in the plasma membrane of root cortical and hair cells [47,48], is regulated by the CBL1/9-CIPK23 complex [21]. Our study observed that in XN979 and YM68, AKT1 gene exhibited a non-significant upregulation at 6 h of K+-deprivation, followed by a downregulation after 12 h, 24 h, and 48 h of K+-deprivation (Figure 5, Table S4). Additionally, the RNA-seq results indicated that the gene expressions of CBL9 and CIPK23 of roots in XN979 and YM68 were both downregulated (Table S5). Furthermore, during the measurement of root tip net K+ fluxes in a 0.1 mmol L−1 K+ test solution for two varieties, we observed no significant impact on the results by inhibiting the function of root K+-channels (Figure 9). These findings indicate that under K+ deficiency, the amount of external K+ uptake via K+-channels in wheat roots is limited. We did not observe upregulation of the expression levels of either the K+-channel AKT1, nor was there a significant increase in the expression level of the CBL9-CIPK23 complex, which regulates AKT1 activity. The AKT2 protein, localized in phloem cells, mediates weakly inward rectifying K+ transport and is crucial for K+ allocation from source to sink [49,50]. It is regulated by the CBL4-CIPK6 complex [51,52]. Under K+-deprivation, AKT2 encoding genes (TraesCS1A02G267900 and TraesCS1D02G267800) were significantly upregulated in XN979 and YM68, respectively (Figure 5, Table S4), and the expression levels of the genes encoding CBL4 showed varied upregulation (Figure 6, Table S5). These suggest a response mechanism in K+ allocation from source to sink partitioning involving AKT2 under external K+-deprivation, aiming to maintain K+ homeostasis in root cells. Furthermore, the expression of genes encoding SKOR K+-channels (KOR1 and KOR2) was downregulated, indicating the reduced transportation of root-derived K+ to aboveground tissues under K+ deficiency (Figure 5, Table S4) [53]. HAK1, HAK13, and HAK23, encoding high-affinity K+-transporters [54,55] exhibited significant upregulation in XN979 after 6, 12, 24, and 48 h of K+-deprivation compared with CK, while in YM68, the upregulation of these genes was more modest (Table S4). The differential expression levels of HAK transporters between two varieties may serve as a crucial role in their disparate K+ uptake capacities under K+-deprived conditions.
In summary, under K+-deprivation conditions (0.1 mmol L−1 K+), the absorption of K+ via the AKT1 K+-channel in wheat roots is not the predominant pathway; instead, root K+ uptake is primarily mediated by HAK transporters. This observation aligns with previous research [8,45]. Furthermore, the upregulation of AKT2 K+-channel synthesis and protein activity, coupled with the downregulation of SKOR synthesis, may contribute to efficient K+ translocation from aboveground tissues to roots, minimizing intra-root K+ loss, and thus ensuring cellular K+ homeostasis in roots.

4.3. Response of CBL-CIPK Signaling System and Phytohormones to K+-Deprivation in Wheat Root

The CBL-CIPK signaling system, activated by Ca2+ signals, regulates plant physiological processes and enhances adaptability to abiotic stress conditions [12,56]. Specifically, CBL9-CIPK23 and CBL4-CIPK6 complexes regulate the activities of AKT1 and AKT2 K+-channels, respectively [17,21,52]. Recent studies have shown that the upregulation of CBL7 gene expression enhances root K+ uptake [57], and CIPK10 protein binding with AKT2 facilitates K+ transport [58]. CIPK proteins are also implicated in cellular osmotic pressure regulation (CIPK2 and CIPK4) [59,60] and the polar growth of plant tissues (CIPK12 and CIPK19) [61,62]. CIPK31 and CIPK32 are involved in H2O2 accumulation and GA synthesis, respectively [57,58]. In Section 4.2, we discussed the regulatory roles of CBL9-CIPK23 and CBL4-CIPK6 complexes on AKT1 and AKT2. Under K+-deprivation, the upregulation of CIPK2, CIPK4, CIPK19, and CIPK32 genes in XN979 and YM68 was observed (Figure 6, Table S5). This suggests that the CBL-CIPK signaling system modulates not only K+-channel activity but also cellular osmotic balance, polar root growth, and GA synthesis and signal transduction under K+-deprivation. Conversely, the downregulation of CIPK31 gene in both varieties suggests inhibited H2O2 accumulation in the roots.
Phytohormones significantly influence root morphology under K+-deprived conditions. GA promotes root elongation and lateral root growth by negatively regulating DELLA protein accumulation [63,64]. Our study found that genes encoding GA synthesis enzymes (GA20OX1 and GA3OX2-3) were upregulated, while GA2OX1, involved in GA oxidation and degradation, was downregulated in XN979 and YM68 roots under K+ deficiency. The GAI1 gene, related to DELLA protein synthesis, showed varied downregulation (Figure 7, Table S6). Furthermore, it has been reported that the synthesis of DELLA protein in wheat is suppressed under K+-deficiency conditions [65], which aligns with the findings presented in this study. These findings suggest that increased GA synthesis under K+-deprivation inhibits DELLA accumulation, promoting root growth. Additionally, IAA accumulation in root apex tissues promotes growth, while ABA inhibits it [26,66]. RNA-seq analysis revealed upregulated IAA synthesis-related genes (YUC2 and YUC8) and downregulated ABA synthesis-related genes (VP14 and AO1) in XN979 and YM68 roots under K+-deprivation (Figure 7, Table S6). These results support the role of IAA and ABA in modulating root morphology under K+-deprived conditions. Previous studies have reported that ETH synthesis enhances Arabidopsis adaptability to K+ deficiency [25]. However, in this study, both XN979 and YM68 showed the suppressed expression of ETH synthase and receptor coding genes under K+-deprivation (Figure 7, Table S6), contradicting the findings in Arabidopsis. This could be due to the ETH-induced suppression of lateral root elongation [67], warranting further research to elucidate these results.

4.4. Regulation of Wheat Root in Response to K+-Deprivation

Previous research has highlighted the critical roles played by K+-channels and K+-transporters in the processes of K+ transport, with notable variations in the absorption, utilization, and transport of K+ among different plant species or even among varieties of the same species [12,68]. This study demonstrates that under K+-deprived conditions in wheat, roots primarily uptake extracellular K+ via the HAK K+ transporter, while the contribution of the AKT1 K+-channel to K+ uptake under these conditions is minimal. This finding was further corroborated by qRT-PCR relative expression analysis (Figure 8) and the measurement of net K+ flux under the test solution with a 0.1 mmol L−1 K+ concentration (Figure 9c–e). The expressions of HAK1 and HAK23 in XN979 were significantly upregulated compared to CK at 6 h, 12 h, 24 h, and 48 h of K+-deprivation (Table S4). The fold changes in their expression levels were higher than those observed in YM68. This could potentially explain the difference in K+ uptake efficiency between two varieties under low-K+ conditions.
Additionally, weakly inward rectifying K+-channels in phloem cells and outward-facing K+-channels in xylem cells are essential for maintaining root K+ homeostasis and supporting normal physiological functions in root cells. The function of AKT2, facilitating K+ loading in the source organ and unloading in the reservoir organ, has been identified [17,52], with its involvement in the salt stress response noted in barley and rice [69,70]. Our findings indicate an upregulation in AKT2 synthesis and activity in the plasma membrane of phloem cells, accompanied by a decrease in SKOR synthesis in the plasma membrane of xylem cells. These changes enhance the transportation of excess K+ from aboveground tissues to roots and reduce K+ loss from roots, thus maintaining cellular K+ homeostasis within root cells (Figure 10). The qRT-PCR results confirmed our speculation regarding the expression levels. The relative expression of AKT2 in XN979 and YM68 was significantly upregulated at 12 h and 24 h under K+ deficiency compared to CK (Figure 8). Additionally, the significant downregulation of KOR1 and KOR2 under K+ deficiency was verified through the analysis of relative expression levels (Figure S11).
The CBL-CIPK signaling system is also involved in the signal transduction of roots under K+-deprived conditions. Specifically, an increase in CBL4 synthesis enhances the K+ transport activity mediated by AKT2 [51], while the increased synthesis of CIPK32 promotes GA biosynthesis [29]. Moreover, our study revealed that genes associated with GA synthesis were significantly upregulated under K+-deprivation, leading to an increase in the GA content in roots. The qRT-PCR results demonstrated that the relative expression levels of GA20OX1 and GA3OX2-3, which encode GA synthetase, were significantly upregulated at all four of the measured time points under K+ deficiency conditions compared with CK (Figure 8, Figure S11). In contrast, the relative expression level of GA2OX1, a negative regulator of GA synthesis, was significantly downregulated under K+ deficiency compared with CK. These findings further corroborate our speculation regarding the response of GA content in the roots to K+ deficiency. This elevation in GA levels inhibits the accumulation of DELLA proteins, thereby promoting root growth and enhancing the development of lateral roots [28]. Variations in hormone synthesis facilitate wheat root growth, increasing the absorption area for K+ uptake and enabling roots to extend deeper into the soil layers for enhanced nutrient acquisition.

5. Conclusions

(1)
The capacity for K+ uptake and utilization under low-K conditions differed significantly between the two wheat varieties. XN979 showed superior K+ uptake capacity and adaptability to external K+ concentration changes compared with YM68. The K+ uptake kinetics test, conducted by controlling the K+ concentration in culture solution, can effectively screen wheat varieties with efficient K+ uptake. Combining the selection of efficient K+ uptake wheat varieties with an application rate of 60 kg hm−2 of K fertilizer can significantly enhance K utilization efficiency in wheat.
(2)
Under various durations of K+-deprivation, two types of varieties with different K+ uptake capacities exhibited reduced AKT1 K+-channel-mediated K+ transport in roots, with the HAK family of K+-transporters becoming the primary mechanism for K+ uptake. The wheat variety with a higher K+ uptake capacity exhibited a higher abundance of significantly upregulated genes encoding root K+-transporters, potentially explaining its enhanced superior capacity to uptake K+ under K+-deprivation. Additionally, the AKT2 K+-channel in phloem cells and SKOR K+-channel in xylem cells were critical in maintaining K+ homeostasis in root cells during K+ deficiency. The CBL-CIPK signaling system and phytohormone signaling pathways played significant roles in modulating wheat root responses to K+-deprivation. The CBL-CIPK system influenced the K+ transport activities of both AKT1 and AKT2 and impacted GA synthesis. K+ deficiency also affected the synthesis and signal transduction of IAA, GA, and ABA. Notably, an upsurge in GA synthesis curbed the synthesis and accumulation of DELLA proteins in roots, stimulating root growth and facilitating branching. These findings highlight that wheat roots employ a complex array of regulatory and responsive mechanisms in the reaction to K+-deprivation, warranting further extensive research.

Supplementary Materials

The following supporting information can be downloaded at: https://www.mdpi.com/article/10.3390/agriculture15090993/s1, Figure S1: Aboveground K accumulation (AKA) of candidate wheat varieties in culture solutions with varying K+ concentrations; Figure S2: The precipitation and average temperature at experiment sites during three successive wheat growing seasons; Figure S3: Growth conditions for field pot experiment and hydroponic culture; Figure S4: The growth of wheat seeding aboveground parts and roots under various durations of K+-deprivation; Figure S5: Identification of DEGs in 8 comparisons; Figure S6: A Venn diagram describing upregulated DEGs in XN979 and YM68; Figure S7: A Venn diagram describing downregulated DEGs in XN979 and YM68; Figure S8: Top 20 GO term annotation analysis of all annotated DEGs in 4 comparisons for XN979; Figure S9: Top 20 GO term annotation analysis of all annotated DEGs in 4 comparisons for YM68; Figure S10: Top 20 GO term annotation analysis of annotated DEGs in 10 screened modules for WGCNA; Figure S11: Relative expression levels of 4 DEGs by qRT-PCR under different durations of K+-deprivation; Table S1: Basic fertilities for soil used for potted plants; Table S2: Primers used for qRT-PCR.; Table S3: Overview of RNA-seq data of treatments; Table S4: Fold change in DEGs associated with K+-transporters and K+-channels; Table S5: Fold change in DEGs associated with CIPKs and CBLs; Table S6: Fold change in DEGs associated with phytohormone; Supplementary Materials and Methods: Measurements of growth-related indicators for wheat seeding aboveground parts and roots under K+-deprivation.

Author Contributions

Conceptualization, Y.H. and X.Y.; methodology, Y.H.; software, J.Z.; validation, M.S.; formal analysis, J.Z. and X.C.; investigation, X.C. and X.D.; resources, S.Z.; data curation, N.H.; writing—original draft preparation, Y.H.; writing—review and editing, N.H. and D.H.; visualization, M.S.; supervision, S.Z.; project administration, X.Y.; funding acquisition, N.H. and D.H. All authors have read and agreed to the published version of the manuscript.

Funding

This research was funded by the National Key Research and Development Program of China “Science and Technology Innovation of High Grain Production Efficiency” (2022YED2300802) and “Henan Provincial Science and Technology Research Project” (242102111099).

Institutional Review Board Statement

Not applicable.

Data Availability Statement

The data presented in this study are available on request from the corresponding author.

Conflicts of Interest

The authors declare no conflicts of interest.

References

  1. Wieser, H.; Koehler, P.; Scherf, K.A. The Two Faces of Wheat. Front. Nutr. 2020, 7, 517313. [Google Scholar] [CrossRef]
  2. Molotoks, A.; Smith, P.; Dawson, T.P. Impacts of land use, population, and climate change on global food security. Food Energy Secur. 2021, 10, 261. [Google Scholar] [CrossRef]
  3. Johnson, R.; Vishwakarma, K.; Hossen, M.S.; Kumar, V.; Shackira, A.M.; Puthur, J.T.; Abdi, G.; Sarraf, M.; Hasanuzzaman, M. Potassium in plants: Growth regulation, signaling, and environmental stress tolerance. Plant Physiol. Biochem. 2022, 172, 56–69. [Google Scholar] [CrossRef]
  4. Run, Y.; Cheng, X.; Dou, W.; Dong, Y.; Zhang, Y.; Li, B.; Liu, T.; Xu, H. Wheat potassium transporter TaHAK13 mediates K+ absorption and maintains potassium homeostasis under low potassium stress. Front. Plant Sci. 2022, 13, 1103235. [Google Scholar] [CrossRef]
  5. Ahanger, M.A.; Agarwal, R.M. Potassium up-regulates antioxidant metabolism and alleviates growth inhibition under water and osmotic stress in wheat (Triticum aestivum L). Protoplasma 2017, 254, 1471–1486. [Google Scholar] [CrossRef] [PubMed]
  6. Gu, X.; Liu, Y.; Li, N.; Liu, Y.; Zhao, D.; Wei, B.; Wen, X. Effects of the Foliar Application of Potassium Fertilizer on the Grain Protein and Dough Quality of Wheat. Agronomy 2021, 11, 1749. [Google Scholar] [CrossRef]
  7. Niu, J.; Zhang, W.; Ru, S.H.; Chen, X.P.; Xiao, K.; Zhang, X.; Assaraf, M.; Imas, P.; Magen, H.; Zhang, F. Effects of potassium fertilization on winter wheat under different production practices in the North China Plain. Field Crop. Res. 2013, 140, 69–76. [Google Scholar] [CrossRef]
  8. Zhan, A.; Zou, C.; Ye, Y.; Liu, Z.; Cui, Z.; Chen, X. Estimating on-farm wheat yield response to potassium and potassium uptake requirement in China. Field Crops Res. 2016, 191, 13–19. [Google Scholar] [CrossRef]
  9. Wang, Y.; Wu, W.H. Regulation of potassium transport and signaling in plants. Curr. Opin. Plant Biol. 2017, 39, 123–128. [Google Scholar] [CrossRef]
  10. Lebaudy, A.; Véry, A.A.; Sentenac, H. K+ channel activity in plants: Genes, regulations and functions. FEBS Lett. 2007, 581, 2357–2366. [Google Scholar] [CrossRef]
  11. Wang, Y.; Wu, W.H. Potassium Transport and Signaling in Higher Plants. Annu. Rev. Plant Biol. 2013, 64, 451–476. [Google Scholar] [CrossRef]
  12. Chérel, I.; Lefoulon, C.; Boeglin, M.; Sentenac, H. Molecular mechanisms involved in plant adaptation to low K+ availability. J. Exp. Bot. 2014, 65, 833–848. [Google Scholar] [CrossRef] [PubMed]
  13. Hiya, H.J.; Nakashima, Y.; Takeuchi, A.; Nakamura, T.; Nakamura, Y.; Murata, Y.; Munemasa, S. Outward-rectifying potassium channels GORK and SKOR function in regulation of root growth under salt stress in Arabidopsis thaliana. J. Plant Physiol. 2024, 302, 154322. [Google Scholar] [CrossRef] [PubMed]
  14. Kleeff, P.J.M.; Gao, J.; Mol, S.; Zwart, N.; Zhang, H.; Li, K.W.; de Boer, A.H. The Arabidopsis GORK K+-channel is phosphorylated by calcium-dependent protein kinase 21 (CPK21), which in turn is activated by 14-3-3 proteins. Plant Physiol. Biochem. 2018, 125, 219–231. [Google Scholar] [CrossRef] [PubMed]
  15. Li, J.; Wu, W.H.; Wang, Y. Potassium channel AKT1 is involved in the auxin-mediated root growth inhibition in Arabidopsis response to low K+ stress. J. Integr. Plant Biol. 2017, 59, 895–909. [Google Scholar] [CrossRef]
  16. Feng, X.; Liu, W.; Cao, F.; Wang, Y.; Zhang, G.P.; Chen, Z.; Wu, F.B. Overexpression of HvAKT1 improves barley drought tolerance by regulating root ion homeostasis and ROS and NO signaling. J. Exp. Bot. 2020, 71, 6587–6600. [Google Scholar] [CrossRef]
  17. Huang, Y.; Yang, S.Y.; Li, J.L.; Wang, S.F.; Wang, J.; Hao, D.L.; Su, Y.H. The rectification control and physiological relevance of potassium channel OsAKT2. Plant Physiol. 2021, 187, 2296–2310. [Google Scholar] [CrossRef]
  18. Cai, K.; Zeng, F.; Wang, J.; Zhang, G.P. Identification and characterization of HAK/KUP/KT potassium transporter gene family in barley and their expression under abiotic stress. BMC Genom. 2021, 22, 317. [Google Scholar] [CrossRef]
  19. Cheng, X.; Liu, X.; Mao, W.; Zhang, X.; Chen, S.; Zhan, K.; Bi, H.; Xu, H. Genome-wide identification and analysis of HAK/KUP/KT potassium transporters gene family in wheat (Triticum aestivum L.). Int. J. Mol. Sci. 2018, 19, 3969. [Google Scholar] [CrossRef]
  20. Li, L.; Kim, B.G.; Cheong, Y.H.; Pandey, G.K.; Luan, S. A Ca2+ signaling pathway regulates a K+ channel for low-K response in Arabidopsis. Proc. Natl. Acad. Sci. USA 2006, 103, 12625–12630. [Google Scholar] [CrossRef]
  21. Li, J.; Long, Y.; Qi, G.; Xu, Z.J.; Wu, W.H.; Wang, Y. The Os-AKT1 channel is critical for K+ uptake in rice roots and is modulated by the rice CBL1-CIPK23 complex. Plant Cell 2014, 26, 3387–3402. [Google Scholar] [CrossRef]
  22. Ragel, P.; Ródenas, R.; García-Martín, E.; Andrés, Z.; Villalta, I.; Nieves-Cordones, M.; Rivero, R.M.; Martínez, V.; Pardo, J.M.; Quintero, F.J.; et al. The CBL-interacting protein kinase CIPK23 regulates HAK5-mediated high-affinity K+ Uptake in Arabidopsis roots. Plant Physiol. 2015, 169, 2863–2873. [Google Scholar] [PubMed]
  23. Lara, A.; Ródenas, R.; Andrés, Z.; Martínez, V.; Quintero, F.J.; Nieves-Cordones, M.; Botella, M.A.; Rubio, F. Arabidopsis K+ transporter HAK5-mediated high-affinity root K+ uptake is regulated by protein kinases CIPK1 and CIPK9. J. Exp. Bot. 2020, 71, 5053–5060. [Google Scholar] [CrossRef]
  24. Kim, M.J.; Ciani, S.; Schachtman, D.P. A peroxidase contributes to ROS production during Arabidopsis root response to potassium deficiency. Mol. Plant 2010, 3, 420–427. [Google Scholar] [CrossRef] [PubMed]
  25. Jung, J.Y.; Shin, R.; Schachtman, D.P. Ethylene mediates response and tolerance to potassium deprivation in Arabidopsis. Plant Cell Online 2009, 21, 607–621. [Google Scholar] [CrossRef] [PubMed]
  26. Antoni, R.; González-Guzmán, M.; Rodriguez, L.; Peirats-Llobet, M.; Pizzio, G.A.; Fernández, M.A.; De Winne, N.; De Jaeger, G.; Dietrich, D.; Bennett, M.J.; et al. PYRABACTIN RESISTANCE1-LIKE8 plays an important role for the regulation of Abscisic Acid signaling in root. Plant Physiol. 2012, 161, 931–941. [Google Scholar] [CrossRef]
  27. Yamauchi, T.; Tanaka, A.; Inahashi, H.; Nishizawa, N.K.; Tsutsumi, N.; Inukai, Y.; Nakazono, M. Fine control of aerenchyma and lateral root development through AUX/IAA- and ARF-dependent auxin signaling. Proc. Natl. Acad. Sci. USA 2019, 116, 20770–20775. [Google Scholar] [CrossRef]
  28. Hetherington, F.M.; Kakkar, M.; Topping, J.F.; Lindsey, K. Gibberellin signaling mediates lateral root inhibition in response to K+-deprivation. Plant Physiol. 2021, 185, 1198–1215. [Google Scholar] [CrossRef]
  29. Liang, B.; Cao, J.; Wang, R.; Fan, C.; Wang, W.; Hu, X.; He, R.; Tai, F. ZmCIPK32 positively regulates germination of stressed seeds via gibberellin signal. Plant Physiol. Biochem. 2023, 199, 107716. [Google Scholar] [CrossRef]
  30. Ruan, L.; Zhang, J.; Xin, X.; Zhang, C.; Ma, D.; Chen, L.; Zhao, B. Comparative analysis of potassium deficiency-responsive transcriptomes in low potassium susceptible and tolerant wheat (Triticum aestivum L.). Sci. Rep. 2015, 5, 10090. [Google Scholar] [CrossRef]
  31. Zhang, B.; Thornburg, T.E.; Liu, J.; Xue, H.; Fontana, J.E.; Wang, G.; Li, Q.; Davis, K.E.; Zhang, Z.; Liu, M.; et al. Potassium deficiency significantly affected plant growth and development as well as microRNA-mediated mechanism in wheat (Triticum aestivum L.). Front. Plant Sci. 2020, 11, 01219. [Google Scholar]
  32. Dreyer, I.; Uozumi, N. Potassium channels in plant cells. FEBS J. 2011, 278, 4293–4303. [Google Scholar] [CrossRef] [PubMed]
  33. Coskun, D.; Britto, D.T.; Kronzucker, H.J. The physiology of channel-mediated K+ acquisition in roots of higher plants. Physiol. Plant. 2014, 151, 305–312. [Google Scholar] [CrossRef] [PubMed]
  34. Ren, Y.; He, X.; Liu, D.; Li, J.J.; Zhao, X.; Li, B.; Tong, Y.; Zhang, A.; Li, Z.S. Major quantitative trait loci for seminal root morphology of wheat seedlings. Mol. Breed. 2012, 30, 139–148. [Google Scholar] [CrossRef]
  35. Percell, W.M.; Howard, D.D.; Essington, M.E. Relationship between total and extractable cotton leaf potassium in studies involving soil and foliar applied treatments. Commun. Soil Sci. Plant Anal. 1995, 26, 3121–3131. [Google Scholar] [CrossRef]
  36. Claassen, N.; Barber, S.A. A method for characterizing the relation between nutrient concentration and flux into roots of intact plants. Plant Physiol. 1974, 54, 564–568. [Google Scholar] [CrossRef]
  37. Renkema, H.; Koopmans, A.; Hale, B.; Berkelaar, E. Thallium and potassium uptake kinetics and competition differ between durum wheat and canola. Environ. Sci. Pollut. Res. 2015, 22, 2166–2174. [Google Scholar] [CrossRef]
  38. Shabala, S.; Demidchik, V.V.; Shabala, L.; Cuin, T.A.; Smith, S.J.; Miller, A.J.; Davies, J.M.; Newman, I.A. Extracellular Ca2+ ameliorates NaCl-Induced K+ loss from Arabidopsis root and leaf cells by controlling plasma membrane K+-permeable channels. Plant Physiol. 2006, 141, 1653–1665. [Google Scholar] [CrossRef]
  39. Liu, J.; Shabala, S.; Zhang, J.; Ma, G.H.; Chen, D.; Shabala, L.; Zeng, F.; Chen, Z.; Zhou, M.; Venkataraman, G.; et al. Melatonin improves rice salinity stress tolerance by NADPH oxidase-dependent control of the plasma membrane K+ transporters and K+ homeostasis. Plant Cell Environ. 2020, 43, 2591–2605. [Google Scholar] [CrossRef]
  40. Zang, F.; Zhang, M.; Zhou, Q.; Wang, X.; Zhong, Y.; Huang, M.; Dai, T.; Jiang, D.; Cai, J. Effect of sulfur and potassium foliar applications on wheat grain protein quality. Field Crops Res. 2024, 319, 109639. [Google Scholar] [CrossRef]
  41. Manning, D.A.C. Mineral sources of potassium for plant nutrition. A review. Agron. Sustain. Dev. 2010, 30, 281–294. [Google Scholar] [CrossRef]
  42. Sedri, M.H.; Roohi, E.; Niazian, M.; Niedbała, G. Interactive Effects of Nitrogen and Potassium Fertilizers on Quantitative-Qualitative Traits and Drought Tolerance Indices of Rainfed Wheat Cultivar. Agronomy 2022, 12, 30. [Google Scholar] [CrossRef]
  43. He, B.; Xue, C.; Sun, Z.; Ji, Q.; Wei, J.; Ma, W. Effect of different long-term potassium dosages on crop yield and potassium use efficiency in the maize-wheat rotation system. Agronomy 2022, 12, 2565. [Google Scholar] [CrossRef]
  44. Mahiwal, S.; Pandey, G.K. Potassium: A vital nutrient mediating stress tolerance in plants. J. Plant Biochem. Biotechnol. 2022, 31, 705–719. [Google Scholar] [CrossRef]
  45. Chachar, K.M.; Chachar, Q.; Chachar, N.A.; Chachar, S.; Chachar, M.H. Genotypic variation for potassium uptake and utilization efficiency in Wheat (Triticum aestivum L.). Int. J. Agric. Technol. 2015, 11, 839–853. [Google Scholar]
  46. Xu, K.; Zhao, Y.; Yu, Y.; Sun, R.; Wang, W.; Zhang, S.; Yang, X. Proteomic Analysis of Roots Response to Potassium Deficiency and the Effect of TaHAK1-4A on K+ Uptake in Wheat. Int. J. Mol. Sci. 2022, 23, 13504. [Google Scholar] [CrossRef]
  47. Niu, F.; Cui, X.; Yang, B.; Wang, R.; Zhao, P.; Zhao, X.; Zhang, H.; Fan, X.; Li, Y.; Deyholos, M.K.; et al. WRKY6 transcription factor modulates root potassium acquisition through promoting expression of in Arabidopsis. Plant J. 2024, 118, 1652–1667. [Google Scholar] [CrossRef] [PubMed]
  48. Lu, Y.; Yu, M.; Jia, Y.; Yang, F.; Zhang, Y.; Xu, X.; Li, X.; Yang, F.; Lei, J.; Wang, Y.; et al. Structural basis for the activity regulation of a potassium channel AKT1 from Arabidopsis. Nat. Commun. 2022, 13, 5682. [Google Scholar] [CrossRef]
  49. Sandmann, M.; Kamil, S.; Pawel, G.; Erwan, M.; Marcio, R.; Gomez-Porras, J.L.; Wendy, G.; Guedes, C.L.G.; Ramírez-Aguilar, S.J.; Ann, C.T.; et al. The K+ battery-regulating Arabidopsis K+ channel AKT2 is under the control of multiple post-translational steps. Plant Signal. Behav. 2011, 6, 558–562. [Google Scholar] [CrossRef]
  50. Michard, E.; Dreyer, I.; Lacombe, B.; Sentenac, H.; Thibaud, J.B. Inward rectification of the AKT2 channel abolished by voltage-dependent phosphorylation. Plant J. Cell Mol. Biol. 2005, 44, 783–797. [Google Scholar] [CrossRef]
  51. Held, K.; Pascaud, F.; Eckert, C.; Gajdanowicz, P.; Hashimoto, K.; Corratgé-Faillie, C.; Offenborn, J.N.; Lacombe, B.; Dreyer, I.; Thibaud, J.B.; et al. Calcium-dependent modulation and plasma membrane targeting of the AKT2 potassium channel by the CBL4/CIPK6 calcium sensor/protein kinase complex. Cell Res. 2011, 21, 1116–1130. [Google Scholar] [CrossRef] [PubMed]
  52. Zhang, R.; Dong, Q.; Zhao, P.; Eickelkamp, A.; Ma, C.; He, G.; Li, F.; Wallrad, L.; Becker, T.; Li, Z.; et al. The potassium channel GhAKT2bD is regulated by CBL–CIPK calcium signalling complexes and facilitates K+ allocation in cotton. FEBS Lett. 2022, 596, 1904–1920. [Google Scholar] [CrossRef] [PubMed]
  53. Liu, K.; Li, L.; Luan, S. Intracellular K+ sensing of SKOR, a Shaker-type K+ channel from Arabidopsis. Plant J. Cell Mol. Biol. 2006, 46, 260–268. [Google Scholar] [CrossRef]
  54. Li, W.; Xu, G.; Alli, A.; Yu, L. Plant HAK/KUP/KT K+ transporters: Function and regulation. Semin. Cell Dev. Biol. 2018, 74, 133–141. [Google Scholar] [CrossRef] [PubMed]
  55. Ankit, A.; Kamali, S.; Singh, A. Genomic & structural diversity and functional role of potassium K+ transport proteins in plants. Int. J. Biol. Macromol. 2022, 208, 844–857. [Google Scholar]
  56. Chen, J.S.; Wang, S.T.; Mei, Q.; Sun, T.; Hu, J.T.; Xiao, G.S.; Chen, H.; Xuan, Y.H. The role of CBL–CIPK signaling in plant responses to biotic and abiotic stresses. Plant Mol. Biol. 2024, 114, 53. [Google Scholar] [CrossRef]
  57. Pérez-Alonso, M.-M.; Guerrero-Galán, C.; Ortega-Villaizán, A.G.; Ortiz-García, P.; Scholz, S.S.; Ramos, P.; Sakakibara, H.; Kiba, T.; Ludwig-Müller, J.; Krapp, A.; et al. The calcium sensor CBL7 is required for Serendipita indica-induced growth stimulation in Arabidopsis thaliana, controlling defense against the endophyte and K+ homoeostasis in the symbiosis. Plant Cell Environ. 2022, 45, 3367–3382. [Google Scholar] [CrossRef]
  58. Chen, X.; Luo, M.; Mo, C.; Li, W.; Ji, Y.; Xie, Q.; Jiang, X. MeCIPK10 regulates the transition of the K+ transport activity of MeAKT2 between low- and high-affinity molds in cassava. J. Plant Physiol. 2022, 280, 153861. [Google Scholar] [CrossRef]
  59. Li, R.; Zhang, J.; Wu, G.; Wang, H.; Chen, Y.; Wei, J. HbCIPK2, a novel CBL-interacting protein kinase from halophyte Hordeum brevisubulatum, confers salt and osmotic stress tolerance. Plant Cell Environ. 2012, 35, 1582–1600. [Google Scholar] [CrossRef]
  60. Du, X.; Yu, R.; Shi, C.; Wang, Y.; Meng, R.; Shi, W.; Jin, M.; Wei, X.; Sun, T. Comparative transcriptomics reveals osmotic and ionic stress key genes contributing to the difference in the salinity tolerance of two pak choi cultivars. Environ. Exp. Bot. 2021, 191, 104621. [Google Scholar] [CrossRef]
  61. Steinhorst, L.; Mähs, A.; Ischebeck, T.; Zhang, C.; Zhang, X.; Arendt, S.; Schültke, S.; Heilmann, I.; Kudla, J. Vacuolar CBL-CIPK12 Ca2+-Sensor-Kinase Complexes Are Required for Polarized Pollen Tube Growth. Curr. Biol. 2015, 25, 1475–1482. [Google Scholar] [CrossRef] [PubMed]
  62. Zhou, L.; Lan, W.; Chen, B.; Fang, W.L.; Luan, S. A Calcium Sensor-Regulated Protein Kinase, CALCINEURIN B-LIKE PROTEIN-INTERACTING PROTEIN KINASE19, Is Required for Pollen Tube Growth and Polarity. Plant Physiol. 2015, 167, 1351–1360. [Google Scholar] [CrossRef] [PubMed]
  63. Binenbaum, J.; Weinstain, R.; Shani, E. Gibberellin Localization and Transport in Plants. Trends Plant Sci. 2018, 23, 410–421. [Google Scholar] [CrossRef] [PubMed]
  64. Tan, H.; Man, C.; Xie, Y.; Yan, J.; Chu, J.; Huang, J. A crucial role of GA-regulated flavonol biosynthesis in root growth of Arabidopsis. Mol. Plant 2019, 12, 521–537. [Google Scholar] [CrossRef]
  65. Moriconi, J.I.; Buet, A.; Simontacchi, M.; Santa-María, G.E. Near-isogenic wheat lines carrying altered function alleles of the Rht-1 genes exhibit differential responses to potassium deprivation. Plant Sci. 2012, 185–186, 199–207. [Google Scholar] [CrossRef]
  66. Tian, X.; Jiang, Q.; Jia, Z.; Fang, Y.; Wang, Z.; Wang, J. Identification of TabZIP family members with possible roles in the response to auxin in wheat roots. Phytochemistry 2022, 196, 113103. [Google Scholar] [CrossRef]
  67. Lewis, D.R.; Negi, S.; Sukumar, P.; Muday, G.K. Ethylene inhibits lateral root development, increases IAA transport and expression of PIN3 and PIN7 auxin efflux carriers. Development 2011, 138, 3485–3495. [Google Scholar] [CrossRef]
  68. Wang, Y.; Wang, X.; Shan, Y.; Sheng, H.; Feng, K. Membrane-Potential Alteration During K+ Uptake of Different Salt-Tolerant Wheat Varieties. Agric. Sci. China 2010, 9, 974–979. [Google Scholar] [CrossRef]
  69. Thabet, S.G.; Moursi, Y.S.; Sallam, A.; Karam, M.A.; Alqudah, A.M. Genetic associations uncover candidate SNP markers and genes associated with salt tolerance during seedling developmental phase in barley. Environ. Exp. Bot. 2021, 188, 104499. [Google Scholar] [CrossRef]
  70. Tian, Q.; Shen, L.; Luan, J.; Zhou, Z.; Guo, D.; Shen, Y.; Jing, W.; Zhang, B.; Zhang, Q.; Zhang, W. Rice shaker potassium channel OsAKT2 positively regulates salt tolerance and grain yield by mediating K+ redistribution. Plant Cell Environ. 2021, 44, 2951–2965. [Google Scholar] [CrossRef]
Figure 1. K uptake and utilization-related indicators of XN979 and YM68 at maturation stage in field pot experiment. (a) Aboveground K accumulation (AKA), (b) root K accumulation (RKA), (c) grain yield, (d) K harvest index (KHI), (e) K uptake efficiency (KUE), and (f) K productive efficiency (KPE). Each point represents one datum from three successive wheat growing seasons. Solid lines represent means, while box boundaries indicate standard error with whisker caps showing the 95% confidence interval. The different letters indicate significant differences between treatments at the p < 0.05 level according to Duncan’s test.
Agriculture 15 00993 g001
Figure 2. K+ uptake kinetic parameters for XN979 and YM68. (a,b) K+ uptake rate for wheat seedings in normal absorption solution (CK, (a)) and absorption solution with K+-channel blocker (Tetraethylammonium, TEA, (b)), and their fitting using M-M equation. The shaded area surrounding the fitted curve represents the 95% confidence interval. (c) Uptake kinetic parameters for XN979 and YM68 in CK and TEA absorption solution; Vmax, maximum rate of K+ uptake; Km, K+ concentrations at which 1/2 of Vmax. (d) Contribution rate of K+-channels to K+ transfer.
Agriculture 15 00993 g002
Figure 3. K content and K accumulation for wheat seeding aboveground parts and roots under various durations of K+-deprivation. (a) AKC, aboveground K content; (b) RKC, root K content; (c) AKA, aboveground K accumulation; (d) RKA, root K accumulation. Different letters indicate significant differences between treatments at the p < 0.05 level according to Duncan’s test. CK, 6 h, 12 h, 24 h, and 48 h represent 0 h, 6 h, 12 h, 24 h, and 48 h of K+-deprivation, respectively.
Agriculture 15 00993 g003
Figure 4. Results of the weighted gene co-expression network analysis. (a) Cluster dendrograms of differentially expressed genes (DEGs) and them divided into modules with different colors, (b) the gene numbers of each module, and (c) relationships between indicators and co-expression modules. AKC, aboveground K content; RKC, root K content; AKA, aboveground K accumulation; RKA, root K accumulation; Height, plant height; RL, the longest root length; SPAD, relative content of chlorophyll; TRL, total length of roots; TRA, total root area; ARD, average root diameter; TRV, total root volume; TRT, total root tips. *, **, and *** represent significant differences at levels of p < 0.05, p < 0.01, and p < 0.001, respectively.
Agriculture 15 00993 g004
Figure 5. Expression levels of DEGs associated with K+-transporters and K+-channels. Heatmap illustrates the normalized fragments per kilobase of transcript per million mapped read (FPKM) values for each gene. CK, 6 h, 12 h, 24 h, and 48 h represent 0 h, 6 h, 12 h, 24 h, and 48 h of K+-deprivation, respectively.
Agriculture 15 00993 g005
Figure 6. Expression levels of DEGs associated with CBL-Interacting Protein Kinases (CIPKs) and Calcineurin B-Like proteins (CBLs). Heatmap illustrates the normalized FPKM values for each gene. CK, 6 h, 12 h, 24 h, and 48 h represent 0 h, 6 h, 12 h, 24 h, and 48 h of K+-deprivation, respectively.
Agriculture 15 00993 g006
Figure 7. Expression levels of DEGs associated with indole-3-acetic acid (IAA), gibberellins (GAs), abscisic acid (ABA), and ethylene (ETH). Heatmap illustrates the normalized FPKM values for each gene. CK, 6 h, 12 h, 24 h, and 48 h represent 0 h, 6 h, 12 h, 24 h, and 48 h of K+-deprivation, respectively.
Agriculture 15 00993 g007
Figure 8. Comparison of expression levels in qRT-PCR and RNA-Seq. Bars depicted relative expression levels of qRT-PCR, while line chart represented mean FPKM values from RNA-seq analysis. Different letters on bars indicate significant differences between treatments at the p < 0.05 level according to Duncan’s test.
Agriculture 15 00993 g008
Figure 9. Net K+ fluxes from root mature zones under test solutions with K+ concentration of 1.0 mmol L−1 and 0.1 mmol L−1. (a,b) Net K+ flux for XN979 and YM68 dynamically changed at a K+ concentration of 1.0 mmol L−1 in test solutions, (c,d) net K+ flux for XN979 and YM68 dynamically changed at a K+ concentration of 0.1 mmol L−1 in test solutions, (e) average values of net K+ flux for XN979 and YM68 at K+ concentrations of 1.0 mmol L−1 and 0.1 mmol L−1 in test solutions, and (f) test point and test angle. * indicates a significant difference at p < 0.05. CK represents the treatment without the K+-channel inhibitor, and TEA represents the treatment with the K+-channel inhibitor.
Agriculture 15 00993 g009
Figure 10. Schematic diagram of wheat root responses to K+-deprivation condition.
Agriculture 15 00993 g010
Disclaimer/Publisher’s Note: The statements, opinions and data contained in all publications are solely those of the individual author(s) and contributor(s) and not of MDPI and/or the editor(s). MDPI and/or the editor(s) disclaim responsibility for any injury to people or property resulting from any ideas, methods, instructions or products referred to in the content.

