Article

Impact of High Temperatures on Tourist Flows in Urban and Rural Areas: Climate Adaptation Strategies in China

1
School of Social Science, Soochow University, Suzhou 215127, China
2
Academy of Culture and Tourism Research, Soochow University, Suzhou 215127, China
*
Author to whom correspondence should be addressed.
Agriculture 2025, 15(9), 980; https://doi.org/10.3390/agriculture15090980
Submission received: 24 March 2025 / Revised: 26 April 2025 / Accepted: 29 April 2025 / Published: 30 April 2025
(This article belongs to the Section Agricultural Economics, Policies and Rural Management)

Abstract

:
The impact of high temperatures on tourist flows in urban and rural areas is both complex and multi-dimensional, yet research remains limited regarding their spatial and temporal differences. This study aims to analyze the changes in tourist flows between urban and rural areas under high-temperature conditions and to identify the key factors driving these patterns, contributing to climate-resilient tourism planning. Using Shanghai, China, as a case study, we constructed an attraction-based tourist flow model with Baidu migration data, integrating a self-organizing feature map for urban–rural classification and Pearson correlation analysis to examine influencing factors. The results showed that high temperatures significantly reduced tourist flows in both urban and rural areas, with a more pronounced impact observed in rural areas. This reduction altered spatial patterns, shifting from a multicentric distribution to an urban-centered concentration. Furthermore, high temperatures affected the timing of tourist flows differently across regions. In urban areas, tourist flows tended to start earlier, and key driving factors, such as facility services and economic levels, remained stable and continued to exert a dominant influence. In contrast, rural tourist flows were delayed under high-temperature conditions, with tourists showing a preference for cooler attractions further from urban centers. These findings highlight the need for targeted climate adaptation strategies, including improving cooling infrastructure in urban areas and promoting eco-friendly, sustainable tourism initiatives in rural regions. This study offers empirical evidence to support policy efforts aimed at fostering coordinated urban–rural tourism development and advancing sustainable adaptation to climate change.

1. Introduction

With the improvement in living standards and the shift in consumption patterns, tourism activities to fulfill leisure and recreational needs have become increasingly frequent [1]. Urban areas and suburban rural tourist attractions emerge as significant options for residents’ daily leisure activities [2,3,4]. High temperatures significantly impact tourist flows in both urban and rural areas, leading to distinct differences in the recreational activities offered at these attractions. Generally, urban tourist attractions provide a diverse range of cultural and entertainment experiences [5], whereas rural attractions primarily focus on nature-based activities, such as hiking, camping, and agricultural tourism [2,6]. In this study, tourist flow refers to the geographical movement of tourists from their place of origin to destinations for recreational purposes [7,8,9]. Accordingly, we define urban tourist flow as the movement of tourists to and from urban tourist attractions, while rural tourist flow pertains to the movement of tourists to and from rural tourist attractions.
However, tourist flows are influenced not only by the types of attractions and activities but also by natural factors, particularly temperature changes, which play a crucial role in shaping these flows. In recent years, global climate warming has intensified high-temperature events, particularly during summer [10,11,12]. According to the IPCC Sixth Assessment Report [13], the intensity, frequency, and duration of heatwaves have increased since the 1950s, and are projected to rise further across all inhabited regions in the future. Current research largely agrees that high temperatures reduce the attractiveness of tourist destinations [10,14,15], negatively impacting tourists’ experience evaluations and overall satisfaction [10]. In China, meteorological standards define a high-temperature day as a day with a maximum temperature of 35 °C or above, a threshold frequently used in climate studies [16,17]. In this paper, we define days reaching or exceeding 35 °C as high-temperature days, while other days are classified as normal-temperature days.
Despite this growing recognition, there remains limited consensus on the specific impacts of high temperatures on tourist flows in urban versus rural areas. Urban areas generally experience higher temperatures than their surrounding rural environments [18]. While some studies suggest that summer heatwaves may drive urban residents to seek cooler conditions in nearby rural areas [19,20,21,22], other scholars argue that urban tourist flows remain relatively unaffected by weather conditions, whereas rural flows may be more sensitive [23,24]. Given these contrasting perspectives, it is essential for the tourism industry to identify and address the distinct impacts of high temperatures on urban and rural areas.
Against the backdrop of significant disruptions to tourist flows caused by high temperatures [10,11,12], adapting to such conditions is essential for the sustainable development of the tourism industry [25]. Effective climate adaptation strategies are essential to address the growing risks posed by climate change [26,27,28]. However, knowledge remains limited regarding the capacity of current adaptation measures to effectively cope with future climate changes, particularly within the unique circumstances of the visitor economy [29]. Therefore, quantifying and analyzing the impacts of high temperatures on urban and rural tourist flows has become a key research focus in climate tourism studies. Additionally, developing effective adaptation mechanisms is essential for regional tourism management and sustainable development.
This study took Shanghai, China, as an empirical case. The purpose was to effectively uncover the characteristics and driving factors of urban and rural tourist flows under high-temperature conditions. To achieve this, we constructed a tourist flow model based on Baidu migration data, combined with self-organizing feature map (SOFM), Jenks natural breaks (JNB), and Pearson correlation analysis. The findings have enriched the theoretical foundations of climate tourism research and have assisted planners in optimizing resource allocation and enhancing the adaptability and resilience of the tourism industry in both urban and rural areas.

2. Literature Review

2.1. Impact of Climate Change on Tourist Flows

Climate change significantly impacts the tourism industry by altering climate resources, which in turn modifies tourist flow patterns. This impact can be analyzed through two primary dimensions. It directly affects tourism destination resources, including natural resources and cultural heritage [30,31], while also indirectly shaping tourists’ demand patterns and decision making, influencing their preferences, expectations, and behaviors [32,33].
However, an effective assessment model for the impact of climate change on tourism remains elusive due to two main challenges. First, the socioeconomic impacts of climate change are challenging to quantify, as they require linking physical climate effects with economic processes [14]. Second, climate change is a long-term process, necessitating extended time series data to accurately observe its impact on tourist flows. For example, Steiger’s [34] study on Austria found that population factors influenced tourist flows more significantly than climatic factors in the first half of the 21st century, whereas climate factors became dominant in the latter half. Consequently, the direct impact of climate change on tourism is often under-quantified. Only a few scholars have used longitudinal panel data at macro levels to assess its impact on tourism economic development, such as state [23] and national scales [11,35]. Most researchers prefer to use climate indices to assess the overall climatic attributes of tourist destinations [36,37], indirectly reflecting climate impacts on tourism. This highlights the need to develop assessment models and computational methods to evaluate climate impacts on tourist flows at a micro level.
The advent of big data offers a promising solution to this challenge. Big data sources, such as Baidu migration data, Tencent migration data, mobile phone user-location signals (MPLS), and social media uploads, provide real-time records of population mobility, significantly increasing data sample size and precision [37,38,39,40,41,42,43]. These data have become essential for investigating spatiotemporal patterns of population mobility [38,39,40,41,42,43] and the underlying influencing factors [41,43].

2.2. Impact of High Temperatures on Urban and Rural Tourist Flow

High temperatures, a prominent feature of climate change, significantly impact tourist flows in both urban and rural areas. Many studies suggest that high temperatures drive urban residents to seek cooler rural areas [19,20,21,22]. For example, Zhang et al. [21,22] found that rural areas, with their higher vegetation coverage, better air quality, and more moderate temperatures, attract urban residents, especially elderly individuals, during summer. Yu et al. [20] found that summer tourism in China often centers around cooler areas like mountainous regions, forests, and waterfronts, suggesting a trend of urban residents migrating to rural areas during high-temperature periods. However, tourist flows are highly dynamic, with spatial clustering emerging, intensifying, or dissipating over time [44]. Real-time analysis of these spatial–temporal dynamics is limited in the literature, indicating a need for further research on the factors driving these changes.

2.3. Climate Adaptation of Tourist Destinations

In tourism research, assessing the impact of global climate change on tourism and exploring mitigation and adaptation strategies have become critical research areas. Climate change presents both challenges and opportunities for tourism, with adaptive strategies helping to mitigate negative impacts and create new possibilities. From one perspective, the adverse impacts of climate change include the degradation of tourism resources, reduced appeal of tourist attractions, and inhibited tourist flows [10,14,15]. Conversely, adopting strategies to adapt to climate change can enhance tourist flows. Examples include collaborative strategy formulation and implementation among multiple stakeholders [15], extending peak tourist seasons beyond summer into spring and autumn to alleviate discomfort from summer heat [45], and expanding green spaces with enhanced shade coverage under prolonged high temperatures [46]. However, these measures need to be tailored to local conditions. In the context of urban and rural tourism in China, locally adapted solutions are essential for effective climate risk management.
Prior to formulating effective adaptation strategies for high-temperature climate change, it is crucial to understand the key factors influencing tourist flows. Tourism is highly sensitive to climate [36,47], and tourist flows under high temperatures are shaped by multiple factors. While subjective elements such as tourists’ economic capacity, time availability, and personal preferences also contribute [21,48], this study focuses on objective, destination-specific attributes, typically grouped into socioeconomic and environmental categories. Socioeconomic factors include demographic shifts [34], infrastructure development [49], and policy frameworks [50]. For example, population aging has increased the sensitivity of middle-aged and older tourists to climatic comfort, affecting both the timing and selection of travel destinations [34]. Well-developed infrastructure enhances safety and resilience during extreme weather events, making destinations more attractive to both tourists and investors [49]. Moreover, adaptive policies can mitigate tourists’ perceived risks [50], supporting the stability of tourist flows. In addition to these socioeconomic drivers, environmental factors—particularly those affecting outdoor tourism—play a significant role in shaping tourist flows [18]. These include geographic features such as elevation, land cover, and topography [19,31]. Natural landscapes like mountains and coastlines are especially appealing to tourists who enjoy outdoor activities [4,6]. However, climate change is transforming environmental conditions in these regions, which may shift tourist preferences and flow patterns [20]. Traditional summer destinations are increasingly facing reduced thermal comfort and diminished attractiveness [19,20], while warming temperatures are making some high-latitude and high-altitude areas more inviting, unlocking new tourism potential [19,20]. These factors shape the spatial and temporal dynamics of tourist behavior and inform targeted, context-specific strategies.

2.4. Shortcomings in the Existing Research and Research Framework of This Study

Despite increasing recognition of the impact of high temperatures on tourist flows in urban and rural areas, significant gaps remain in the literature. First, existing studies mainly address the broad effects of climate change on tourism resources, without offering a quantitative analysis of how high temperatures specifically affect the spatial distribution of and temporal variations in tourist flows. Second, although some scholars suggest that high temperatures may drive urban residents to rural areas, empirical research based on big data and real-time dynamics is limited, hindering a full understanding of the spatiotemporal changes. Given these gaps, this study was of considerable importance. It used Baidu migration big data to develop a tourist flow model at the scenic spot level, providing real-time insights into the dynamic changes in urban and rural tourist flows under high temperatures, thus overcoming the limitations of traditional research methods. Additionally, through spatial data analysis and quantitative models, we have identified how high temperatures differentially impact tourist flows in urban and rural areas, highlighted key influencing factors, and presented a new theoretical framework for managing tourist flows in the context of climate change.
This study proposed a research framework to measure the impact of high temperatures on tourist flows in urban and rural areas. The analyses employed here were novel, as we utilized Baidu migration big data to construct a tourist flow model at the micro level based on individual tourist attractions. It captured the dynamic changes in tourist flows under high-temperature conditions in real time. As shown in Figure 1, various data were collected, with geospatial data processed in a 500 m × 500 m grid. The first step involved identifying the urban–rural structure, and classifying 3A-level and higher tourist attractions in Shanghai as either urban or rural based on their geographic locations. The second step used Baidu migration big data to build an attraction-based tourist flow model. Tourist flows were calculated separately for urban and rural attractions, comparing differences in tourist flows under high temperatures versus normal temperatures. The third step analyzed the key factors driving differences in urban and rural tourist flows under high temperatures, aiming to provide targeted adaptive strategies for destination managers. Based on the previous analysis, the factors were categorized into socioeconomic and natural environmental dimensions. In the case study of Shanghai, and drawing on the relevant literature [47,51,52,53,54], we selected tourist attraction grade (Gra), facility services (Ame), market size (Den), and economic level (Eco) as key socioeconomic indicators, reflecting the development of attractions and nearby infrastructure, market, and economy. Additionally, distance from the city center (Dis) was used as a natural environmental indicator, representing the geographical location of tourist attractions and their accessibility to visitors.

3. Methodology

3.1. Study Area

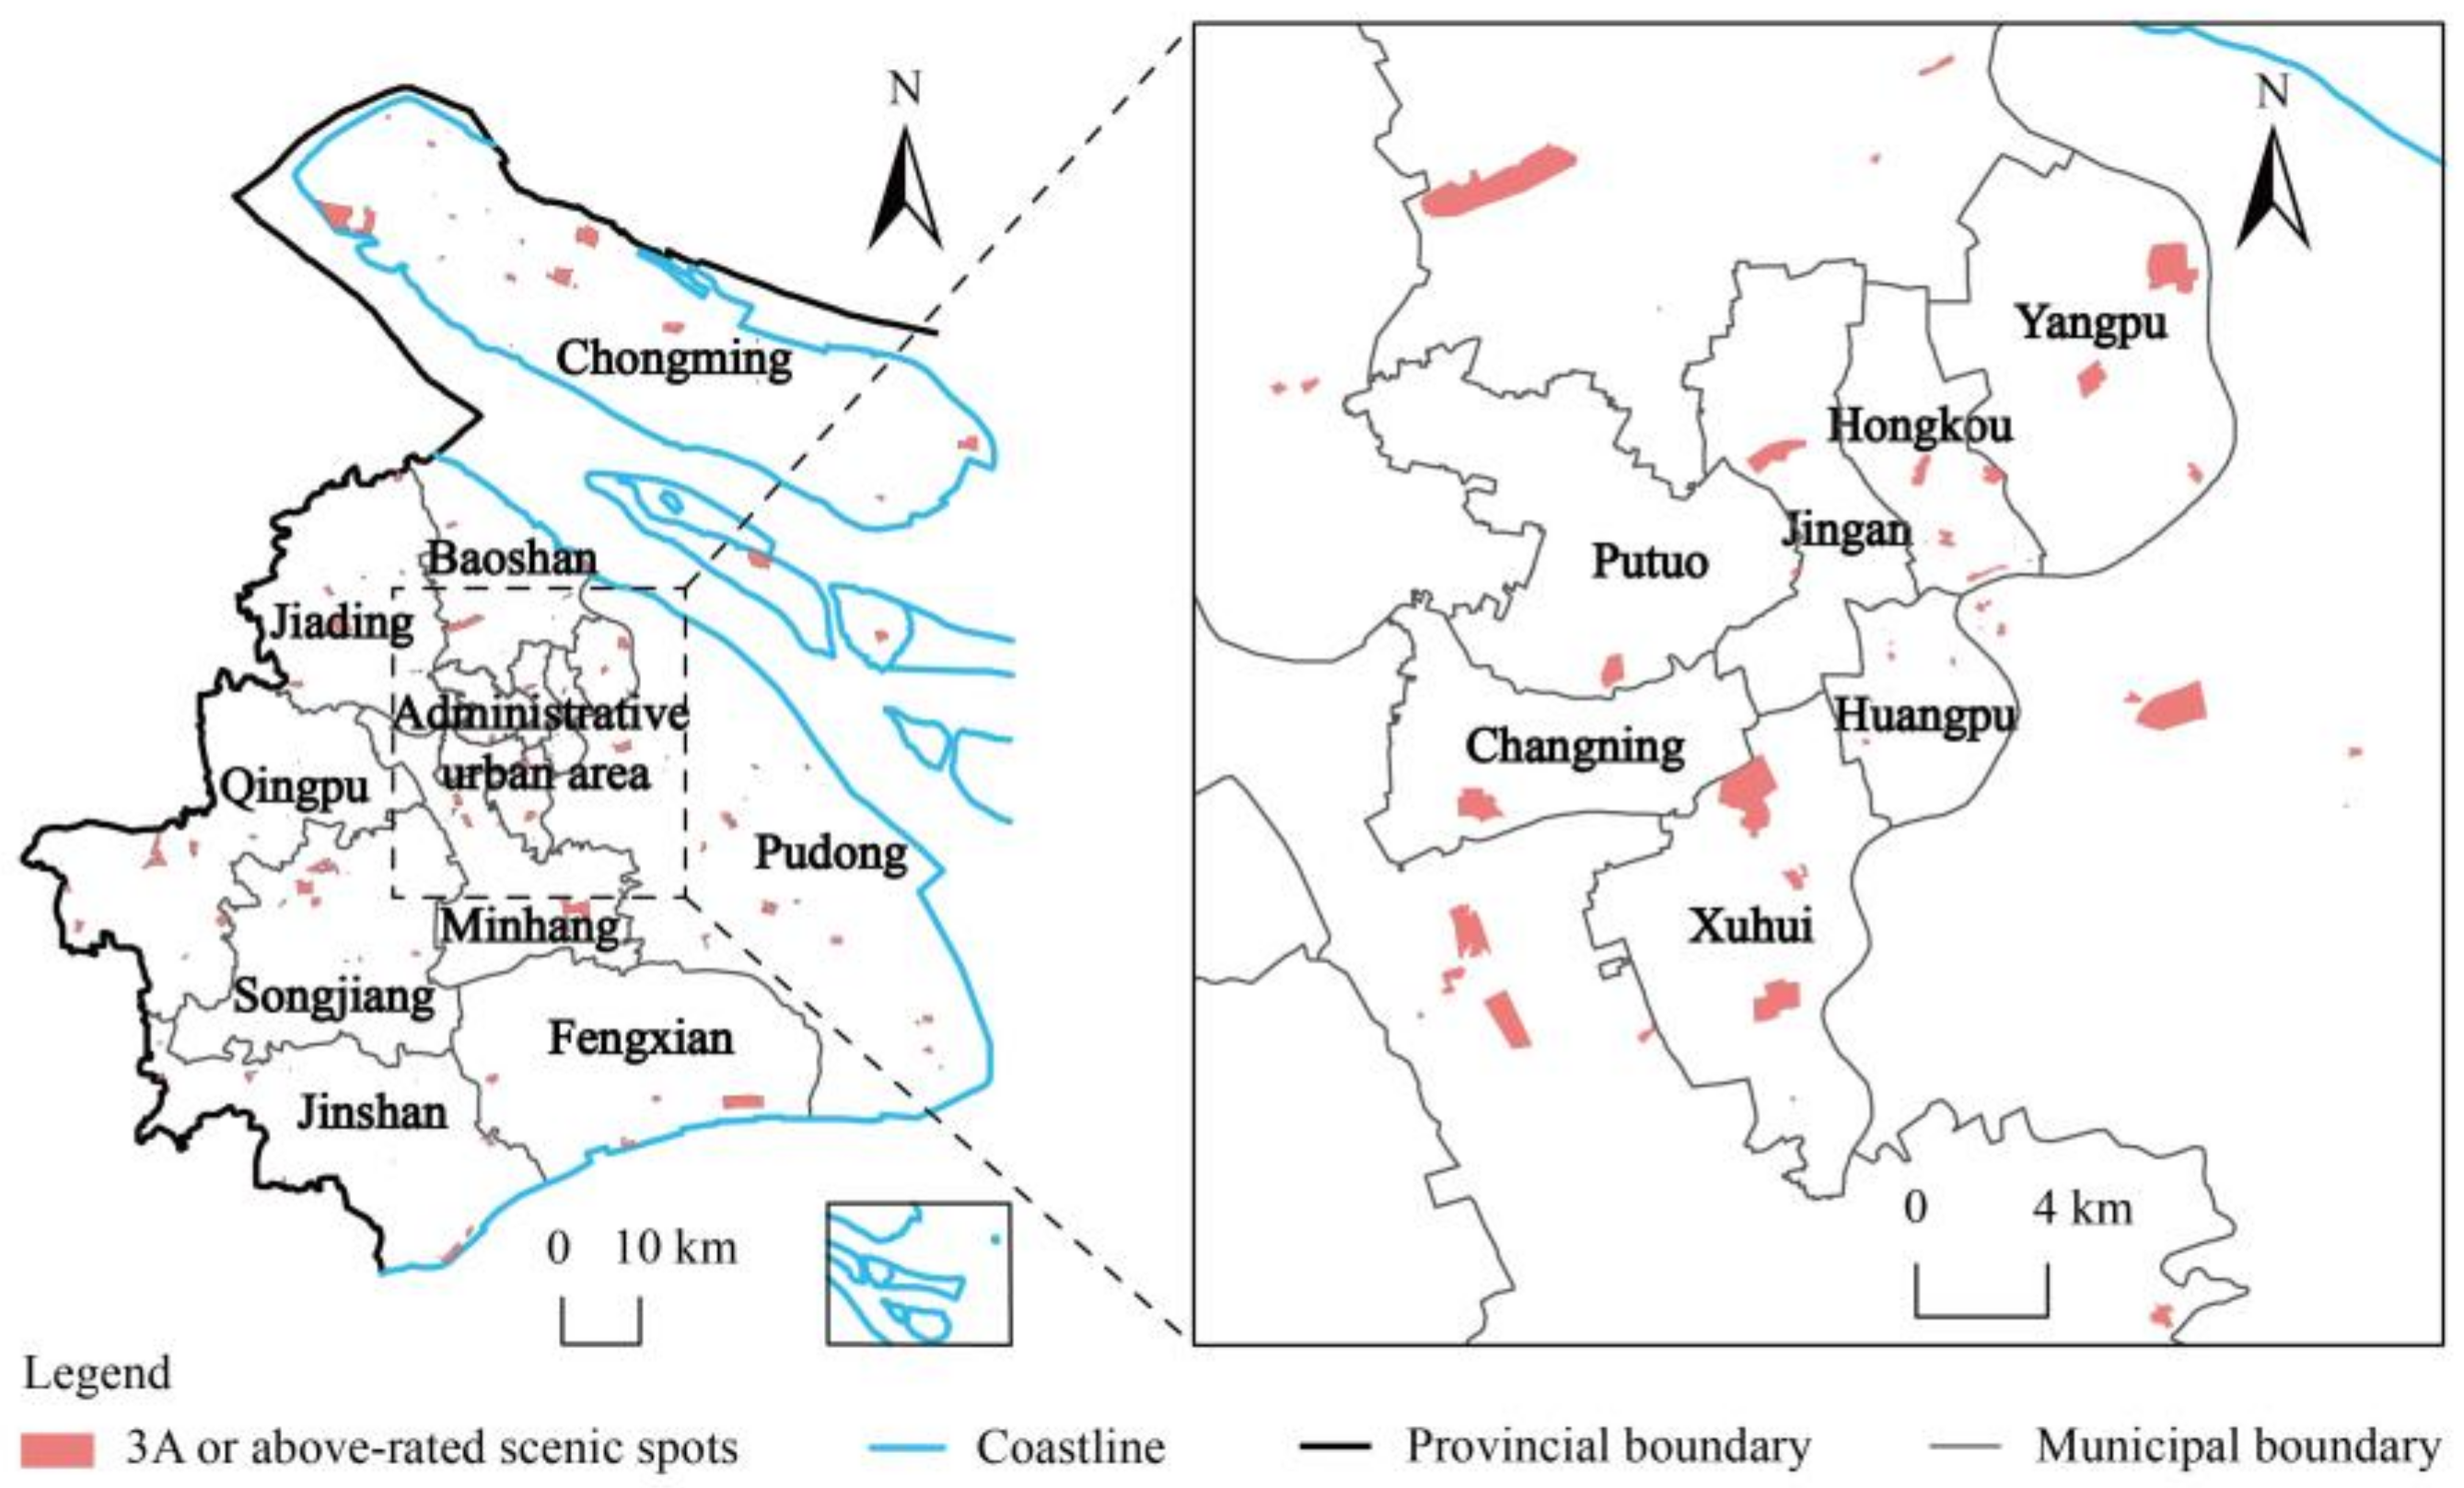
Shanghai, as China’s largest economic hub and a globally renowned tourist destination, possesses a highly developed tourism industry. By August 2024, it had 143 tourist attractions rated 3A and above, attracting 330.07 million visits in 2023. However, as shown in Figure 2, its coastal location makes the tourism sector vulnerable to climate impacts, including smog, typhoons, extreme temperatures, and droughts [55]. Although Shanghai, as a highly urbanized and economically advanced megacity, differs from smaller cities, its diverse climate risks, advanced infrastructure, and complex urban–rural tourist flows make it a valuable case for studying the impact of high temperatures on tourism. An in-depth analysis of Shanghai’s model offers valuable insights for other regions and provides a foundation for future research.

3.2. Data Sources

This study focused on weekends and public holidays from June to August 2024, encompassing a total of 28 days. Data sources included both statistical and spatial geographic datasets from Shanghai.
For statistical data, tourist attractions rated 3A and above were identified based on annual reports. As of August 2024, there were 143 such attractions, including two multi-site groups, resulting in a total of 146 tourist attractions. Hourly temperature data were provided by the National Climate Center of the China Meteorological Administration. The distance between each tourist attraction and the city center was measured using the shortest route provided by Baidu Road Planning in 2024. Population density and economic development data were sourced from district-level statistics in the National Economic and Social Development Statistical Bulletins and government reports. Due to limited data availability, we used 2023 data.
Regarding spatial geographic data, Baidu migration big data, accessed via the Baidu Map platform, provided real-time dynamic data. This dataset includes hourly population data, offering spatial location information based on mobile phone positioning. Before analysis, outliers were removed and missing values were filled using linear interpolation to ensure data validity. Additionally, due to data availability issues, point of interest (POI), construction land, and nighttime light data all originated from 2020. Specifically, POI data were obtained from the open API of Baidu Maps, construction land data were sourced from the Resource and Environment Science and Data Center of the Chinese Academy of Sciences, and NPP/VIIRS nighttime light data were provided by the National Geophysical Data Center (NGDC) of NOAA.
In addition to temperature, Baidu migration, and tourist attraction location data, all other data were standardized before analysis to ensure comparability. Spatial data were transformed to a uniform coordinate system, and time series data (e.g., temperature and migration) were aligned to consistent intervals.

3.3. Methods

3.3.1. SOFM Method

The self-organizing feature map (SOFM) method was employed to delineate the urban and rural structures in Shanghai. SOFM, a type of artificial neural network algorithm, is particularly effective for nonlinear classification, especially as the number of clustering elements increases [56]. The core principle is to input data into the network’s input layer, where similar data points are mapped to approximate positions on the competitive layer of the neural network, thus achieving classification [25,57,58]. This method has been used in various case studies of spatial zoning, including urban–rural structural analysis [25], spatial functional characteristics [57], and classifications of urban typologies [58].
The specific steps were as follows: First, POI data were analyzed using kernel density estimation, then classified into five levels according to the JNB method, followed by reclassification. The reclassified POI data, along with construction land and nighttime light data, were each standardized using min–max normalization and then processed into a 500 m × 500 m grid. Next, these three types of data were clustered using the SOFM method. We performed SOFM clustering using the Neural Network Toolbox in MATLAB R2020a and adjusted the number of neurons based on the data characteristics. The number of neural nodes in SOFM clustering was always 2–4 times the number of clusters [25]. In this study, the number of clusters was set to two, corresponding to urban and rural areas. After testing, the optimal configuration was found with six neural nodes, yielding six clusters. Finally, the clustering results were compared with actual survey data, which accurately classified each grid as either urban or rural, thus identifying the urban and rural structure.

3.3.2. JNB Method

The Jenks natural breaks (JNB) method was used to classify tourist flow into different levels to analyze the spatial distribution of tourist attractions in urban and rural areas. It sorts the samples and, using statistical techniques, identifies natural “breakpoints” in the data, refining the classification by comparing errors between and within categories [59,60]. The formula is:
G V F = 1 S D C M / S D A M
where G V F is the goodness of variance fit and ranges from 0 to 1, where 0 indicates the lowest and 1 the highest classification performance; S D C M refers to the within-class sum of squared deviations; and S D A M denotes the total sum of squared deviations from the dataset mean. Iteration continues until G V F reaches its maximum value.

3.3.3. Tourist Flow Modeling for Tourist Attractions

To capture the dynamic characteristics of tourist flows, a quantitative model for tourist flow was constructed using Baidu migration data. The data were collected on an hourly basis, allowing for precise measurement of variations in tourist flow. In this model, the study area was segmented into 500 m × 500 m grid units, with each tourist attraction’s spatial extent defined by the grid it occupies. The tourist flow for each attraction was calculated independently, reflecting the dynamics of tourist movement. Urban tourist flow refers to the tourist flow at attractions located within urban areas, while rural tourist flow refers to the flow at attractions in rural areas. The formula is:
F i t = P i t P i ( t 1 )
where F i t represents the tourist flow at tourist attraction i at time t , indicating whether there is inflow or outflow. A positive value of F i t represents tourist inflow, while a negative value represents tourist outflow. P i t denotes the population at tourist attraction i at time t , and P i ( t 1 ) represents the population at the previous time interval.

3.3.4. Pearson Correlation Analysis

The Pearson correlation analysis was employed to explore the key factors influencing urban and rural tourist flows under high-temperature conditions. This method provides an intuitive representation of the degree of influence between two or more variables [61]. The formula is:
R x y = i = 1 n ( x i x ¯ ) ( y i y ¯ ) / i = 1 n ( x i x ¯ ) 2 i = 1 n ( y i y ¯ ) 2
where R x y is the correlation coefficient between variables x and y . Here, x i represents the tourist flow at tourist attraction i , while y i denotes the corresponding level of the influencing factor.

4. Results

4.1. Urban and Rural Structures

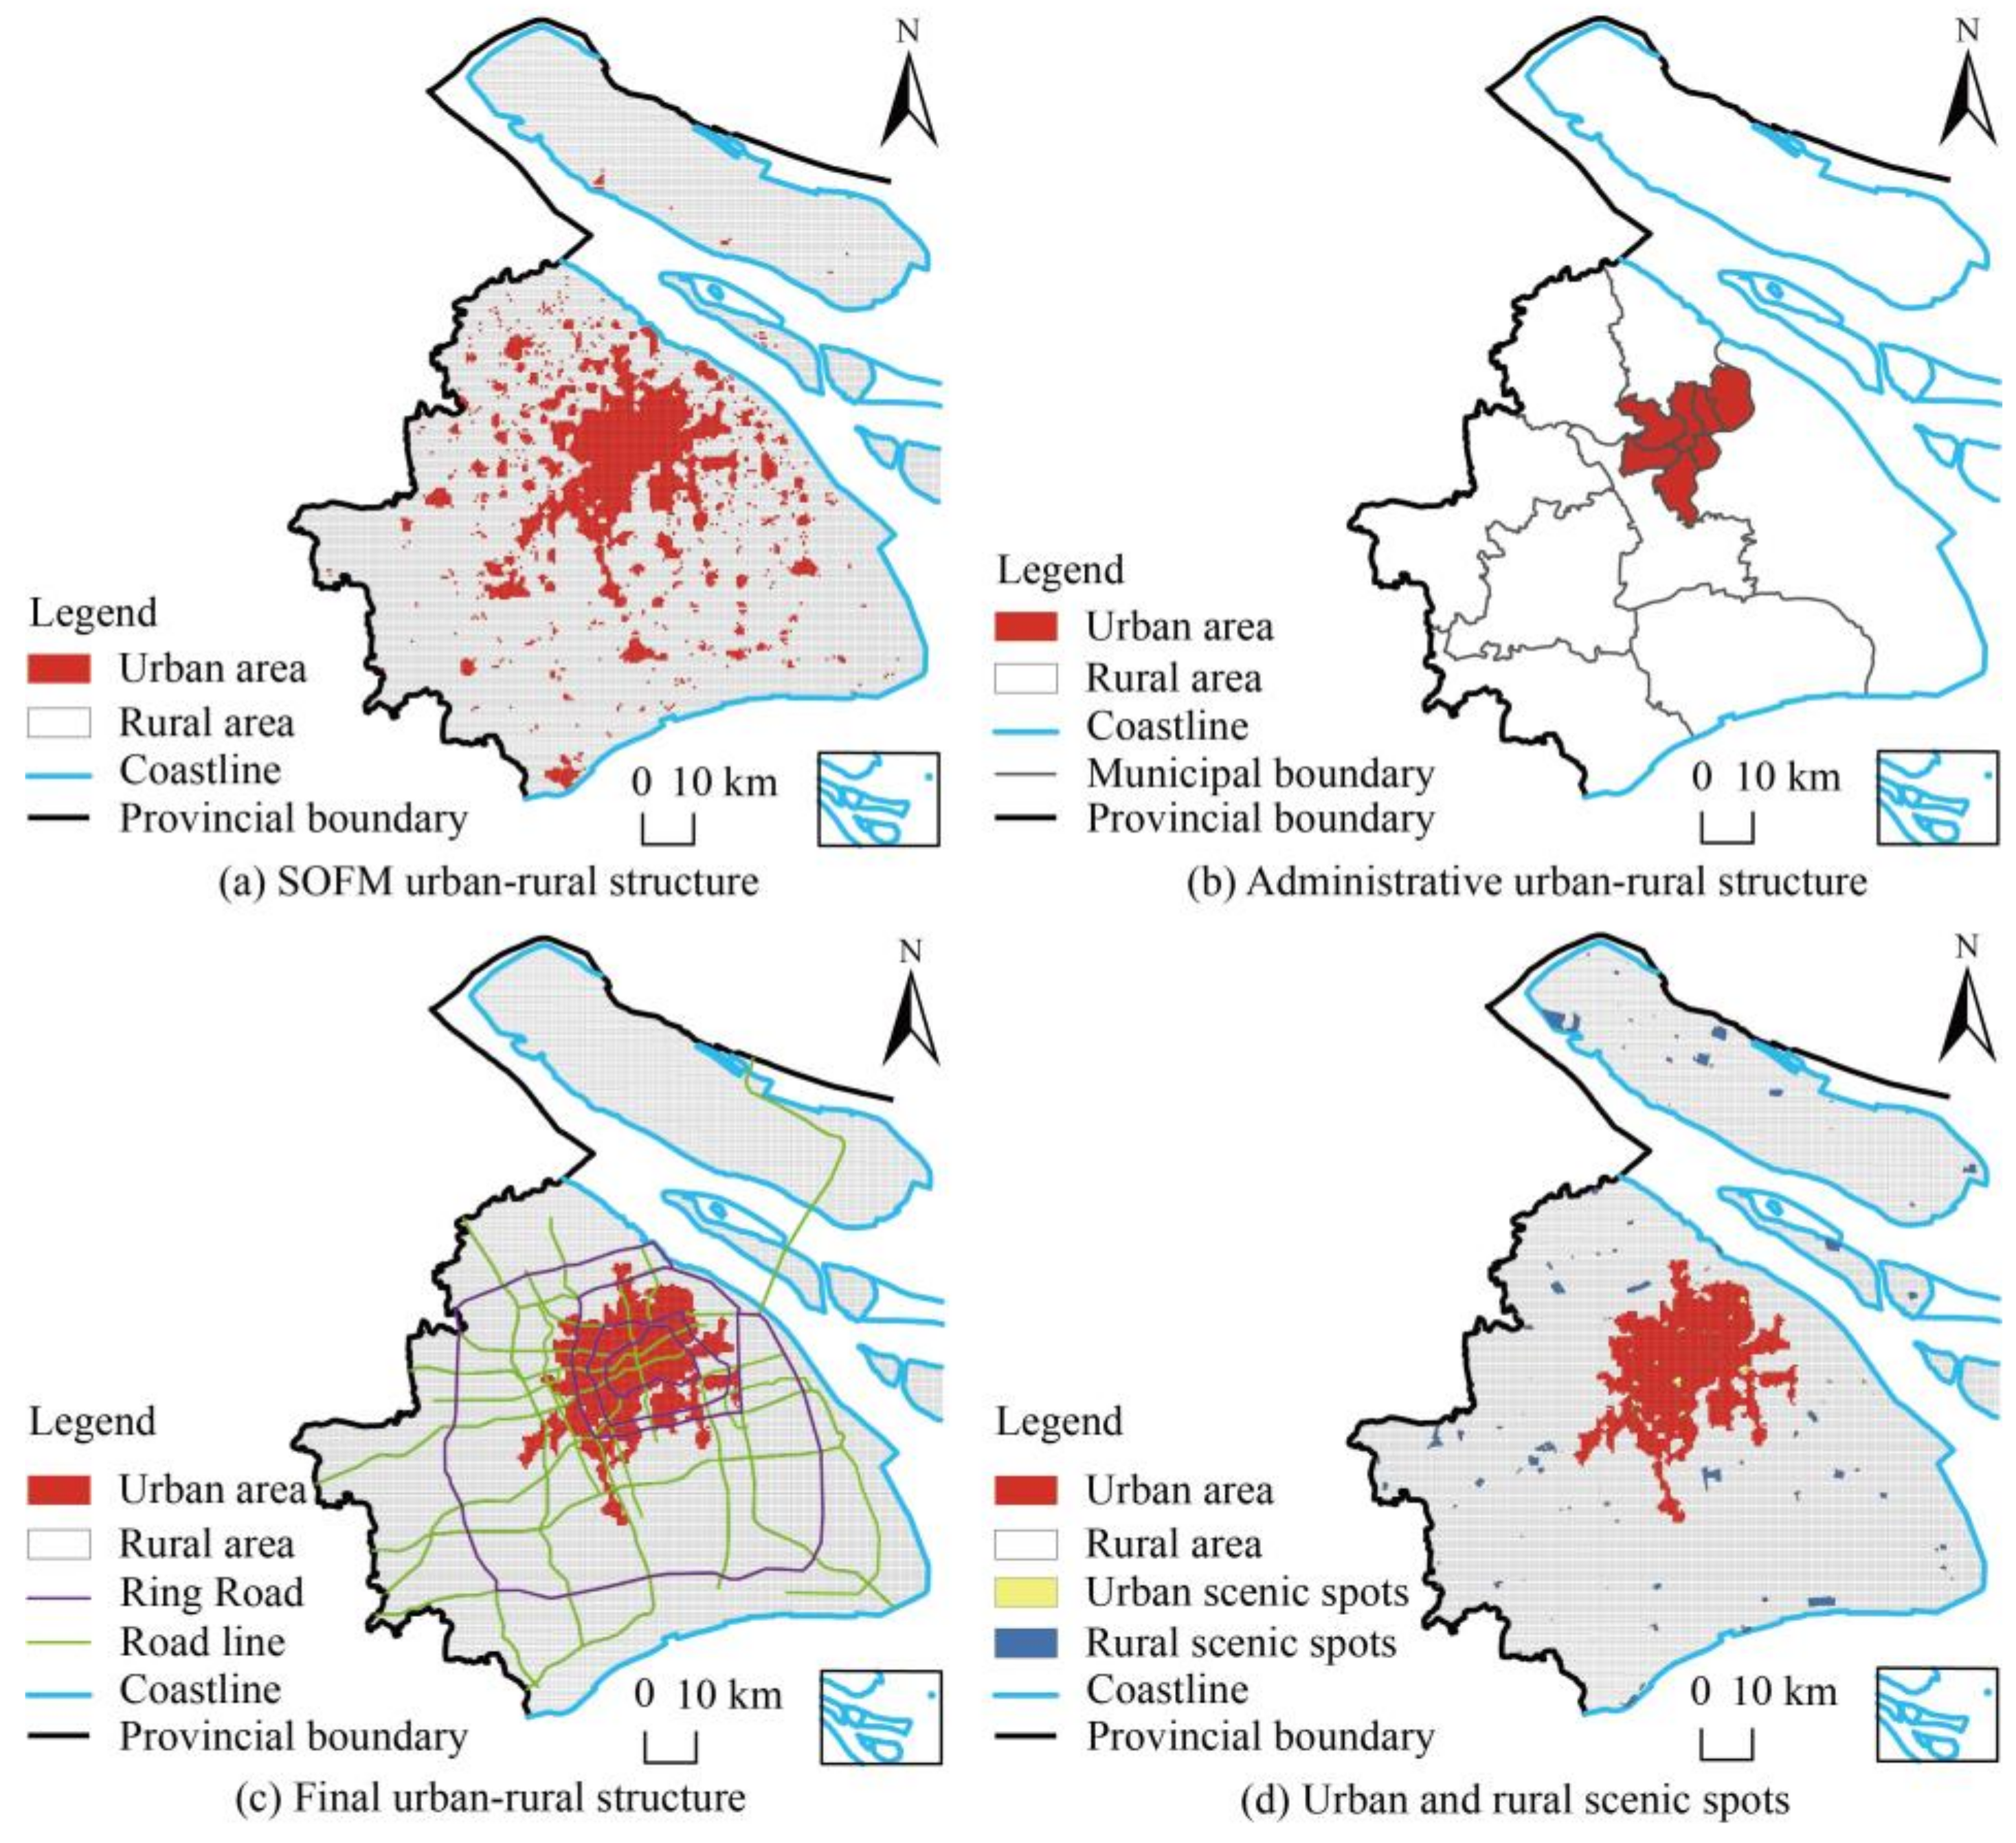
The SOFM method was initially used to identify urban and rural structures (Figure 3a). The administrative boundaries of Shanghai’s urban areas were then used as a reference (Figure 3b), and adjacent areas were classified as urban, with the remaining regions classified as rural (Figure 3c). Based on these calculations, the urban area of Shanghai was determined to cover 840.25 km2, accounting for 13.25% of the total study area. This urban area forms an irregular ring extending along major transportation corridors, characterized by diverse facilities, significant nighttime lighting, and dense built-up areas. As shown in Figure 3a and b, SOFM algorithm-generated urban areas were largely consistent with the administrative urban boundaries. This confirmed the effectiveness of the SOFM method in identifying and optimizing the distribution of urban functional zones [25,57,58].
The tourist attractions rated 3A and above in Shanghai were categorized based on the urban–rural structure, resulting in 47 urban tourist attractions and 99 rural tourist attractions (Figure 3d). Urban tourist attractions are densely clustered and generally occupy smaller areas, often consisting of indoor recreational facilities or cultural heritage sites. In contrast, the rural tourist attractions are more dispersed, occupy larger areas, and showcase natural landscapes.

4.2. Characteristics of Urban and Rural Tourist Flows Under High Temperatures

4.2.1. Temporal Characteristics

To explore the impact of temperature on urban and rural tourist flows, we analyzed the trend characteristics of tourist flows under hourly temperature conditions. During summer, high temperatures negatively impacted tourist flow, with higher temperatures decreasing the trend in tourist movement. When the temperature reached 36.9 °C, tourist flow nearly came to a standstill. As shown in Figure 4, within the temperature range of 19.5 °C to 36.8 °C, tourist flow gradually diminished as the temperature rose. At 36.9 °C, the fluctuation magnitude significantly weakened. This was particularly evident as fluctuations narrowed to between −423 and 1362 persons per hour.
A comparative analysis was conducted to understand the differences in tourist flow between urban and rural areas. The findings indicated that, although urban and rural tourist flows exhibited similar trends, urban tourist flow was generally stronger than that of rural areas. Specifically, first, as shown in Figure 4 and Figure 5, both urban and rural tourist flows displayed similar fluctuation patterns under varying temperature conditions and across different time periods. This suggests that urban–rural integration in Shanghai has significantly enhanced connectivity and accessibility through well-developed infrastructure, promoting shared tourist flows and fostering a more integrated tourism market. Second, as depicted in Figure 5, the absolute volume of tourist flow in urban areas consistently exceeded that in rural areas, regardless of high-temperature conditions. This was attributed to the high population density and greater consumption potential in urban areas, as well as the availability of diverse indoor recreational activities and effective cooling facilities, which helped mitigate the impact of high temperatures. Consequently, tourist inflows and outflows in urban areas remained higher compared to rural areas.
In addition, a further analysis was performed to examine the characteristics of tourist flow in urban and rural areas under high-temperature conditions. The findings indicated that, compared to normal-temperature periods, high temperatures reduced tourist flows in both urban and rural areas, but there were differences in the stage-wise timing of inflows. Specifically, first, as shown in Figure 5b,c, both urban and rural tourist inflows and outflows decreased under high-temperature conditions compared to normal-temperature conditions, but the impact was more pronounced for rural tourist flows than for urban flows. In terms of inflow volume, the number of tourists entering urban areas throughout the day decreased by 179, while rural areas experienced a reduction of 717 tourists. Second, the stage-wise characteristics of tourist flows were analyzed based on the minimum points of inflow. As shown in Figure 5b,c, tourist inflows for both urban and rural areas occurred between 5:00 and 17:00, peaking at 9:00, but exhibited distinct temporal variations during periods of high temperature. Specifically, high temperatures caused the third stage of urban tourist inflows to occur one hour earlier, while the second stage of rural inflows was delayed by one hour. Under high-temperature conditions, urban tourist inflow times were from 5:00 to 12:00, 13:00 to 15:00, and 16:00 to 17:00, while rural inflows occurred from 5:00 to 11:00 and 14:00 to 17:00. During normal-temperature conditions, urban inflow times were 5:00–12:00, 13:00–15:00, and 17:00, whereas rural inflows occurred from 5:00 to 11:00 and 13:00 to 17:00. These differences could be attributed to the fact that, under high-temperature conditions, urban tourists showed reduced movement during the first two stages, but due to well-developed indoor cooling facilities, their inflows resumed earlier during the third stage. In contrast, rural tourists, often exposed to outdoor environments without shade, tended to delay their travel until 14:00, when temperatures moderated.

4.2.2. Spatial Characteristics

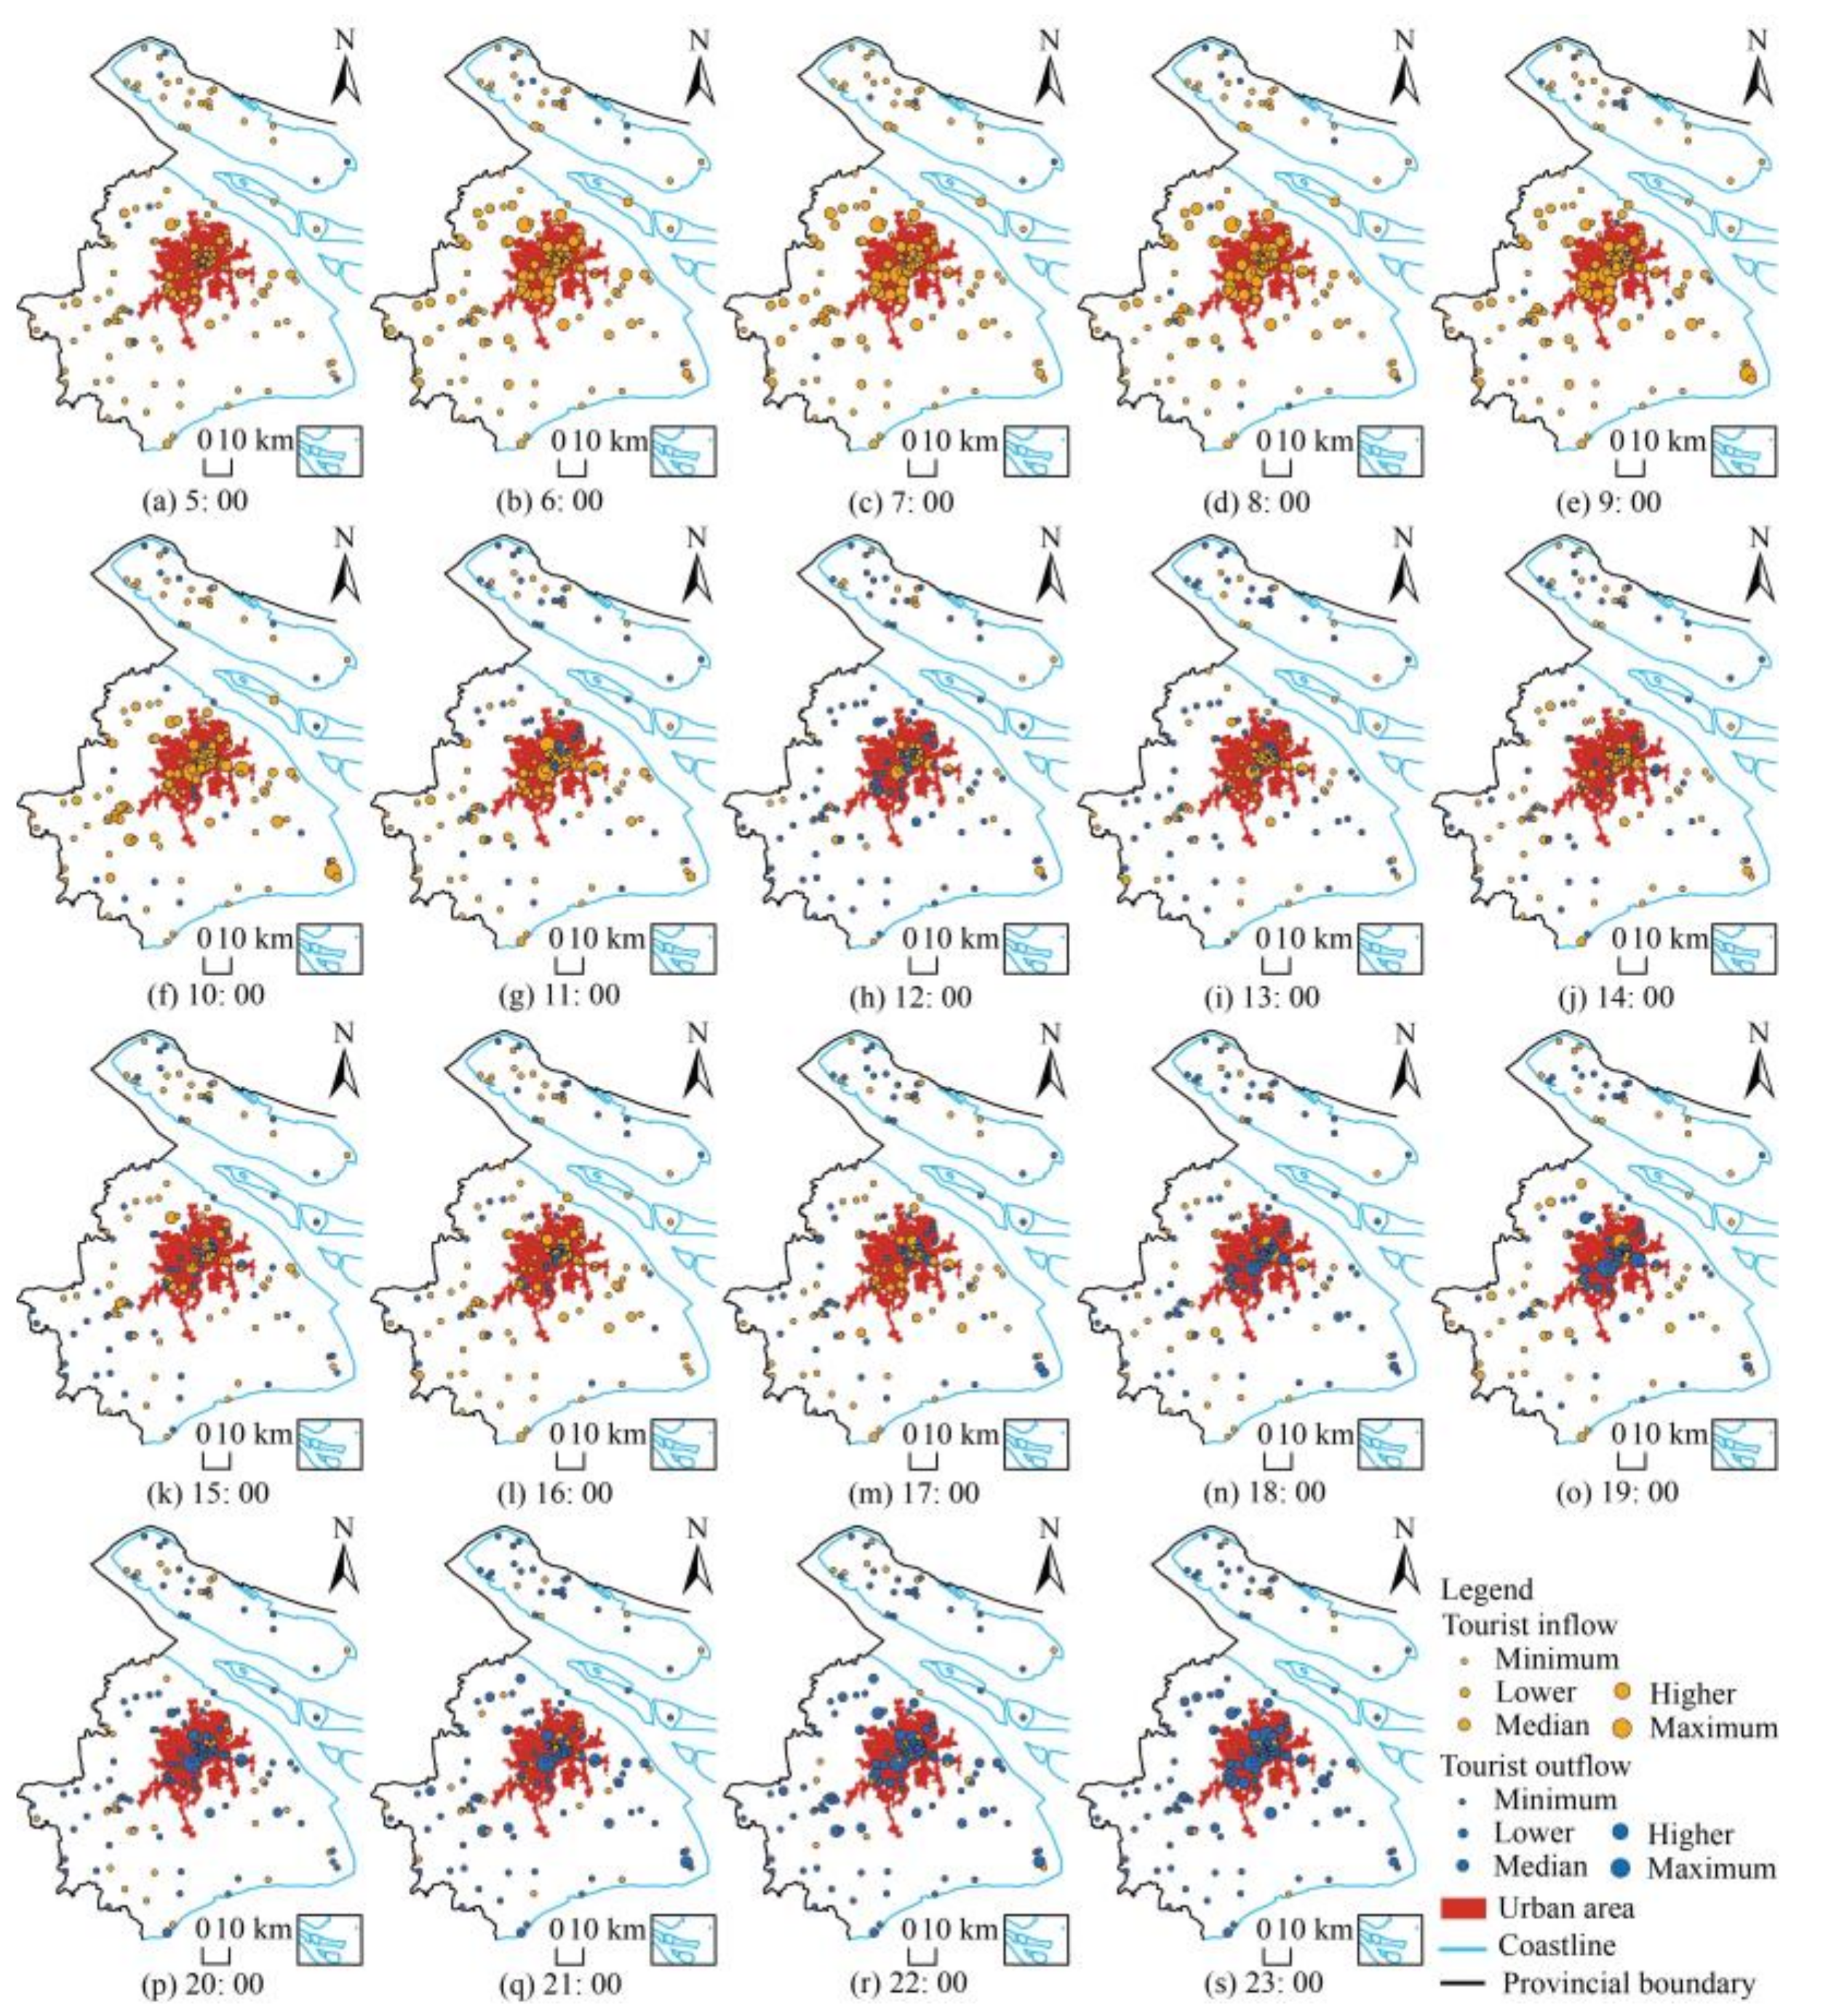
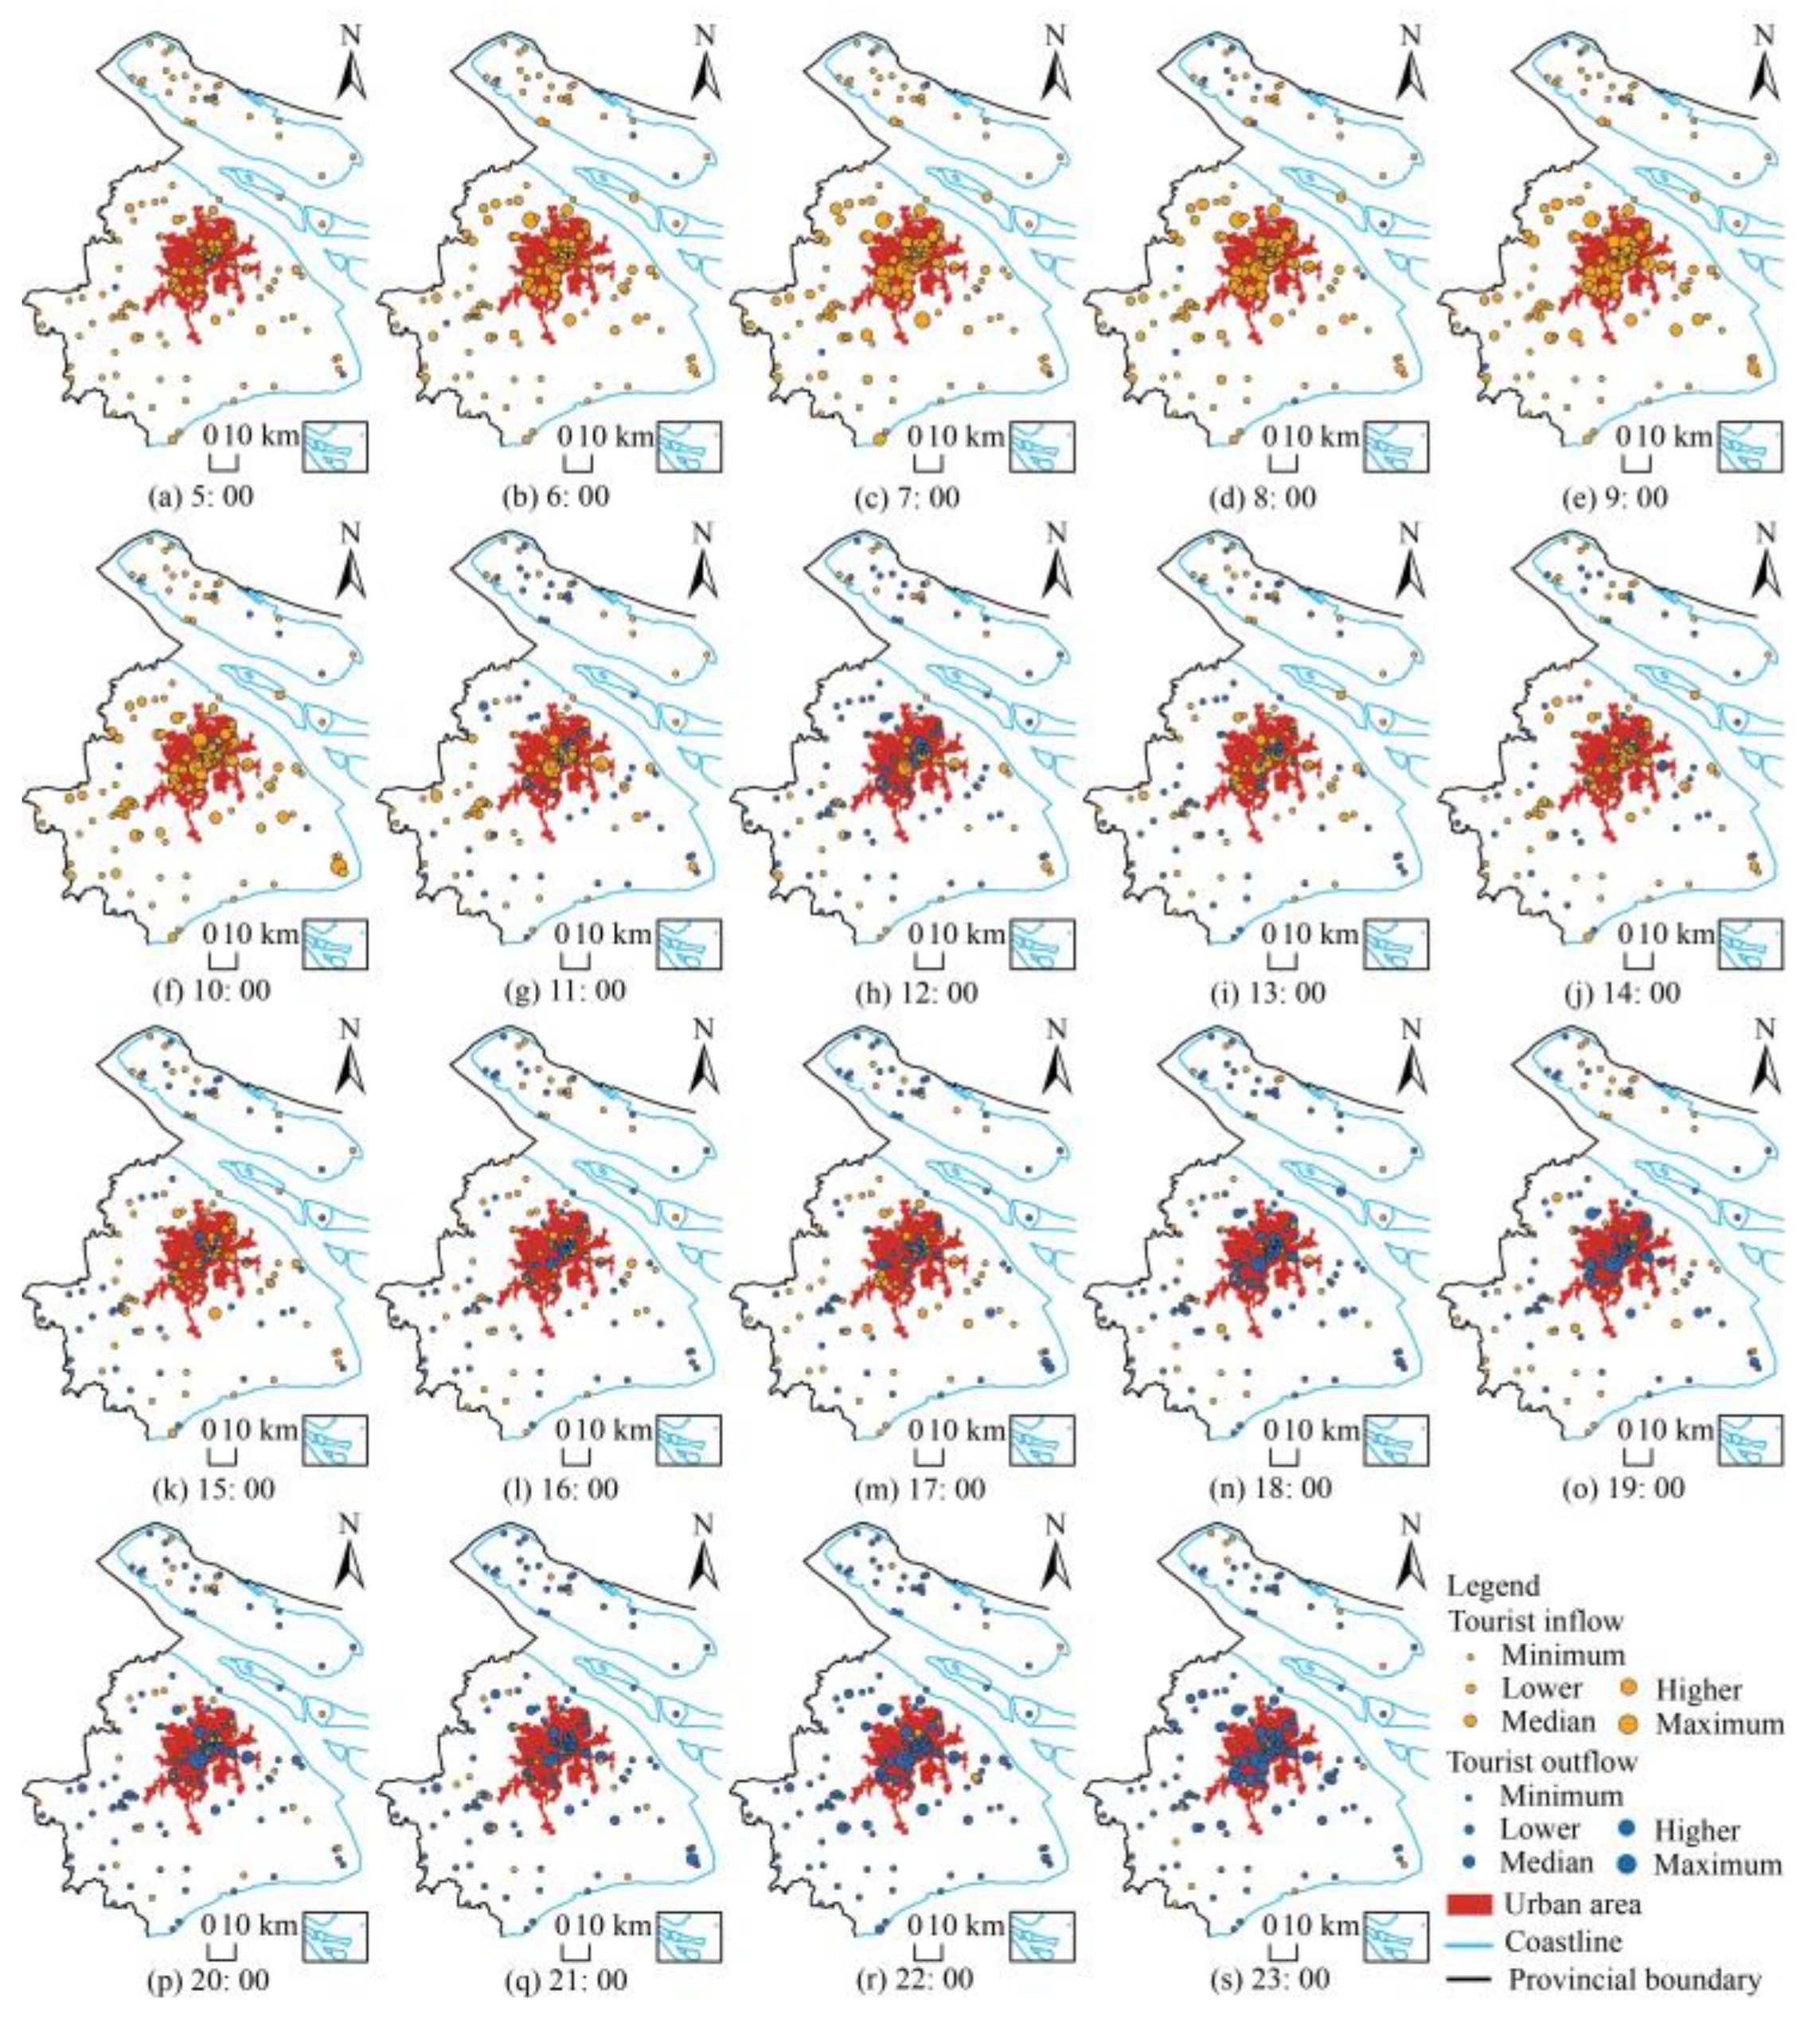
To better understand the spatial differentiation of the impact of high temperatures on tourist flows in urban and rural areas, the JNB method was employed to categorize tourist inflows and outflows into five levels, ranging from low to high. This method enabled a clearer visual analysis of spatial distribution patterns. As shown in Figure 6 and Figure 7, temperature fluctuations not only influenced the temporal patterns of tourist activities but also significantly affected the spatial configuration of tourist flows. The central urban areas, including Huangpu District, Xuhui District, and Jing’an District, consistently served as focal points for both tourist inflows and outflows. In contrast, rural tourist flows exhibited greater spatial variability in response to temperature changes. Specifically:
First, during high-temperature conditions, tourist flows tended to concentrate in urban areas. Figure 6 shows that high-temperature conditions enhanced the clustering effect in urban areas, particularly around major shopping centers and indoor cultural heritage sites within central districts. In rural areas, tourist flows did not exhibit such distinct aggregation points. However, some rural destinations farther from the city center emerged as frequently visited locations during various time periods, including Chongming Island, Dianshan Lake, and Jinshan Coastal areas, which were rich in water bodies and forest resources. This suggested that during high-temperature periods, tourists preferred either short, concentrated activities within urban areas or longer journeys to cooler, remote rural spots.
Second, under normal-temperature conditions, tourist flows exhibited a dispersed, multi-centered pattern, with urban areas serving as the core. As seen in Figure 7, yellow inflow markers indicated not only a concentration in the central urban area but also smaller aggregations in peri-urban rural areas, such as Zhujiajiao Ancient Town in Qingpu District and Happy Valley Theme Park in Songjiang District. This distribution reflected a “city-centric” pattern, where tourist flow gradually diminished as the distance from the urban core increased towards rural areas.

4.3. Key Factors Impacting Urban and Rural Tourist Flows Under High Temperatures

4.3.1. Selection of Impacting Factors

Based on the aforementioned analytical framework, five major influencing factors were selected, building on relevant prior research [47,51,52,53,54]. These factors included distance from the city center (Dis), tourist attraction grade (Gra), facility services (Ame), market size (Den), and economic level (Eco). Specifically, first, previous analysis identified the different effects of high-temperature versus normal-temperature conditions on rural tourist flows based on varying distances, where distance from the city center can reflect the accessibility of rural tourist attractions by road. This factor is particularly critical under extreme weather conditions, where transportation convenience becomes more pronounced [52]. The shortest distance between tourist attractions and the city center, obtained from Baidu Maps, was selected to represent this factor. Second, tourist attraction grade serves as a crucial criterion for visitors when choosing a destination. Higher-grade attractions typically offer more resources, which are directly linked to visitor expectations and experiences [53]. The five-tier classification of tourist attractions used in China was adopted to represent this factor. Third, the quality of facility services is a key factor in attracting tourists and providing a comfortable experience [54]. To quantify this, the average kernel density index of POI in the grid where the attraction is located was used. Fourth, market size reflects the potential number of tourists and the intensity of recreational demand [51]. Population density at the district level, where the tourist attraction is located, was selected to represent market size. Finally, economic level is often considered as a key factor influencing tourists’ travel frequency and spending capacity [47]. The per capita GDP of the district level where the attraction is located was chosen to represent this factor.

4.3.2. Analysis of Impacting Factors

The correlation between influencing factors and tourist flows was quantified using Pearson correlation analysis, providing deeper insight into the key factors affecting urban and rural tourist flows under varying temperature conditions. As shown in Table 1 and Table 2, urban tourist flows were primarily influenced by facility services and economic level, with both factors having a similar degree of impact, regardless of temperature conditions. In contrast, factors such as distance from the city center, tourist attraction grade, and market size exhibited a weaker impact and frequently failed to pass significance tests. This was likely because urban tourist attractions were highly accessible, and the regions where they were located typically had high population densities. As a result, tourists tended to place greater emphasis on quality experiences, such as good facilities, premium services, and high economic development, rather than geographical location or attraction popularity. In addition, the statistical significance varied across time periods. The correlation between facility services and economic level was stronger between 10:00 and 14:00, suggesting that tourists were more dependent on these factors during this time.
For rural tourist flows, distance from the city center, tourist attraction grade, facility services, and market size were effective factors under both high and normal temperatures. In contrast, economic level had a relatively limited effect, as it failed to reach statistical significance in most cases. As shown in Table 1 and Table 2, during periods of high temperatures, distance from the city center became the most influential factor. This effect was most pronounced from early morning to midday, when tourists preferred rural tourist attractions farther from urban areas to escape the heat. These findings suggested that high temperatures heightened tourist sensitivity to the geographical location and climatic conditions of tourist attractions. For example, the peak period for rural tourist inflows occurred between 5:00 and 11:00, and, except for 6:00, rural attractions located farther from the city center attracted more tourists under high-temperature conditions than normal-temperature conditions. In contrast, under normal-temperature conditions, factors such as tourist attraction grade, facility services, and market size had a more significant impact on rural tourism, particularly during the afternoon (14:00–17:00). During this period, tourists prioritized service quality and available resources at tourist attractions, while paying relatively less attention to distance.

4.4. Climate Adaptation Strategies for Urban and Rural Tourism

Distinct climate adaptation strategies have been identified to mitigate the adverse effects of high temperatures, promote the sustainable development of tourism, and enhance visitor experiences. These strategies were derived from the empirical findings of this study, which analyzed the spatiotemporal changes and driving factors of urban and rural tourist flows under high-temperature conditions. Due to differences in infrastructure, environmental resources, and tourist behavior, adaptation measures vary significantly between urban and rural areas.
Urban tourism adaptation strategies, as identified in this study, primarily emphasize infrastructure improvements and service enhancements to mitigate the impacts of high temperatures. Key interventions include expanding green spaces, increasing shaded areas, and developing cooling stations to alleviate urban heat stress. In addition, the study’s findings suggest that flexible scheduling, such as encouraging early morning visits, optimizes visitor experiences while reducing heat exposure. Furthermore, the availability of climate-controlled indoor attractions, such as museums and shopping malls, further supports urban tourism by offering alternatives during extreme heat events.
In contrast, rural areas primarily rely on ecological and nature-based strategies to cope with high temperatures. The study found that tourists are more likely to visit rural areas further from the city center during high temperatures. Agritourism, forest tourism, and water-based recreation effectively attract visitors seeking natural cooling environments. These destinations benefit from lower population density and abundant natural resources, such as rivers and forests, providing thermal comfort without extensive infrastructure modifications. However, challenges persist in enhancing accessibility and visitor facilities, especially in remote regions with insufficient infrastructure to support large tourist influxes during extreme heat periods.
A comparative analysis of urban and rural adaptation strategies highlights distinct approaches suited to their respective environments. Urban areas leverage technological and infrastructural advancements for direct cooling interventions, while rural destinations rely on passive cooling through natural resources. Policymakers must account for these differences when formulating comprehensive climate adaptation strategies to support sustainable tourism.

5. Discussion and Implications

Based on tourist flow data across various time intervals, this study is innovative in systematically analyzing the spatial–temporal patterns and impact factors of tourist flows at urban and rural tourist attractions under high-temperature conditions. Adopting a more dynamic and micro-scale perspective, it offers an innovative research framework for exploring the complex relationship between “high-temperature weather” and “tourist flow”. This study aims to enhance the impact assessment and adaptation framework of climate change, expand the scope of tourism science research, and establish new directions for academic development. Additionally, it provides theoretical foundations and practical guidance for the tourism industry to respond to and adapt to climate change, underscoring significant theoretical and practical implications.

5.1. Temporal Variations in Urban and Rural Tourist Flows Under High Temperatures

Compared to existing research on the impact of climate change on tourism demand [19,21,32], we not only confirmed the impact of climate factors on tourist behavior but also further refined the distinct response patterns of urban and rural tourist flows under extreme high-temperature conditions. Consistent with previous findings, the results demonstrated that high-temperature weather reduced tourist flows [10,14,15,62]. Notably, we identified two key distinctions from existing research. First, contrary to some studies suggesting that urban tourism was less affected by high temperatures [23,24], we found that high temperatures influenced both urban and rural tourist flows. Second, although previous studies commonly suggested that residents were more inclined to visit cooler rural areas for leisure [19,20,21,22], the big data analysis in this study indicated that the inhibitory effect of high temperatures on urban tourism was relatively limited. As a result, urban tourist flow intensity remained significantly higher than that in rural areas. This discrepancy might have arisen from traditional studies often using sampling survey methods, while we adopted a broader big data approach.
Through a comparative analysis of tourist travel times under high and normal temperatures, we found that urban and rural tourists exhibited distinct travel patterns in high-temperature conditions. Urban tourists typically traveled during the cooler morning hours, displaying an “early arrival” pattern. In contrast, rural tourists tended to visit tourist attractions in the afternoon, after temperatures had slightly decreased, demonstrating a “delayed arrival” pattern. This behavior reflects the climate adaptability of tourists [10,63]. A potential explanation is that cities provide good transportation access and advanced indoor cooling systems, offering a more comfortable environment for sightseeing during high temperatures. In contrast, rural tourist attractions, often open-air and outdoor, were more susceptible to high temperatures, prompting tourists to avoid midday heat. This difference supported the view proposed by Shahbaz et al. (2025) [49], which argued that tourist travel times were influenced not only by climate but also by the combined effect of climate conditions and destination facilities. In conclusion, we captured the systematic differentiation in the diurnal time structure of urban and rural tourist flows through empirical data, addressing a gap in existing research at the micro time scale.

5.2. Spatial Variations in Urban and Rural Tourist Flows Under High Temperatures

This study demonstrated that high temperatures significantly reshaped the spatial distribution of tourist flows in both urban and rural areas. High temperatures altered tourist flow patterns, created a more concentrated urban flow pattern, and highlighted the significant impact of extreme weather events on tourist flows [10,11,12]. In urban areas, tourist attractions with well-developed infrastructure and cooling facilities—such as public parks, museums, and commercial centers—attracted large numbers of visitors [64,65]. Sites traditionally associated with culture, leisure, and consumption increasingly function as “climate refuges”, where tourists seek relief and recovery from heat stress [66,67]. This pattern was consistent with the contraction of tourist activity spaces under thermal constraints described by Caldeira et al. (2018) [10]. Importantly, we suggested that these changes represented more than behavioral adjustments, indicating a dynamic reconfiguration of urban tourism functions in response to climate pressures.
In contrast, the transformation of rural tourism space was more complex. Some remote suburban areas offer “ecological cool sources”, such as forests and water bodies, which have potential climatic appeal. However, the overall rural tourist flow declined significantly under high temperatures. This finding challenges the simple “shift to rural” trend suggested by some scholars [19,20,21,22] and highlights the structural vulnerabilities and imbalances in rural tourism spaces [68]. The study further showed that many suburban attractions, which were previously popular due to their proximity and infrastructure, lost their appeal on hot days if they lacked shade, water features, or microclimate regulation. In contrast, more distant destinations with abundant ecological resources—despite historically lower visitation—emerged as preferred options during extreme heat. This suggests that rural tourism areas, once benefiting from proximity and accessibility, may become sources of heat exposure risk under high-temperature conditions. As Wang et al. (2025) [69] noted, heat exposure risks shifted from urban cores to peripheral towns and rural regions with less-developed infrastructure. In this context, ecological suitability—characterized by abundant water bodies and vegetation—becomes the primary factor influencing rural tourism under high temperatures [70,71].

5.3. Differences in Driving Factors

This study identified significant differences in the drivers of tourist flows between urban and rural areas under varying temperature conditions. Urban tourist flows were consistently influenced by facility services and economic level in both high and normal temperature scenarios, aligning with the findings of Nguyen (2021) [72], who emphasized the role of infrastructure in shaping urban tourism. Even under extreme weather conditions, the spatial structure and attractiveness of urban destinations remained largely stable, reflecting strong structural resilience. Wan et al. (2025) [73] supported this observation, noting that urban infrastructure systems retained functionality when exposed to external stressors.
In contrast, rural tourist flows demonstrated greater sensitivity to environmental conditions. The analysis revealed that during high-temperature periods, tourists tended to favor rural destinations located farther from city centers. This shift in dominant factors highlighted the heightened vulnerability of rural tourism systems under climate stress [68,74,75]. While previous research focused on rural tourism’s dependence on natural resources and infrastructure [48], we provided empirical evidence of temperature-driven changes in influential factors. Under high-temperature conditions, distance emerged as the most significant determinant, filling a key gap in destination choice theory in extreme climatic contexts.

5.4. Practical Implications

This study provides targeted recommendations for tourism destination managers to address climate change, particularly in response to high-temperature weather conditions. According to our empirical results, the specific recommendations are as follows:
First, we recommend implementing differentiated management strategies for urban and rural tourism under high-temperature conditions. By comparing tourist flows in urban and rural areas during both high-temperature and normal-temperature heat conditions, we found that high temperatures had a particularly significant impact on rural tourism. These findings support the adoption of context-specific management strategies for urban and rural areas under extremely high-temperature conditions [12], providing an evidence base for policy development. For example, under high-temperature conditions, urban areas became concentrated spaces for tourists, necessitating the addition of cooling zones and air-conditioned facilities in urban leisure spaces [76]. Meanwhile, rural areas located farther from city centers can attract a smaller number of tourists, indicating the potential for optimizing cooling-focused vacation products to encourage longer stays, thereby enhancing rural tourism appeal and economic benefits [21].
Second, optimizing travel arrangements for tourists during high-temperature periods can help reduce congestion during peak hours. The study results indicated that urban tourists tended to arrive earlier at indoor recreational facilities due to the need for cooling, while rural tourists generally avoided the peak midday heat and arrived later. Therefore, guiding tourists to visit during off-peak hours can alleviate congestion at tourist attractions during high-temperature periods, which is particularly relevant for large cities like Shanghai [10,12]. Some climate adaptation strategies include optimizing urban spatial planning, adjusting operational hours for rural attractions during extreme heat periods, and implementing real-time visitor flow monitoring to enhance adaptive capacity.
Third, establishing high-temperature emergency plans and adaptive management strategies is crucial. The study showed that when temperatures reached 36.9 °C, tourist flow nearly halted, and visitor comfort declined rapidly. Consequently, destination managers should develop emergency response mechanisms and adaptive management strategies to improve the resilience of industry personnel and tourists to high-temperature conditions [12,77]. For example, before extreme heat occurs, managers could temporarily close high-risk tourist attractions or set up temporary cooling stations to ensure visitor safety.

5.5. Limitation and Future Studies

Despite the insightful results and suggestions that should help to progress the field, our study has some limitations. Firstly, the study period can be further extended. This study was conducted from June to August 2024, focusing on the short-term effects of high temperatures on tourist flow, without accounting for long-term climate trends and their cumulative impact on tourist behavior. According to statistics from the China Meteorological Administration, the number of high-temperature days in the summer of 2024 was the highest since 1961, with Shanghai ranking eighth among Chinese cities for maximum temperature. This made the data highly representative and valuable for research. Despite the relatively short study period, the 2024 data provided a crucial empirical foundation amidst the increasing frequency of extreme high-temperature events. Future studies should extend the research period to explore how prolonged high temperatures influence tourist preferences and destination choices over time. Secondly, this study focused on Shanghai, a highly urbanized city with well-developed infrastructure and significant exposure to climate risks. Its complexity made it an ideal case for examining the mechanisms of urban and rural tourist flows under high-temperature conditions. The analytical framework developed in this study was highly generalizable. Future research should empirically analyze a broader range of cities to assess the robustness of the findings, thereby providing a more comprehensive understanding of the impact of high temperatures on urban and rural tourist flows. Lastly, the research data can include interviews and questionnaires on tourist behavior. This study focused on analyzing tourist flow models using big data to reveal the objective impact of high temperatures on tourist flow, rather than the subjective factors driving changes in tourist behavior. Subjective data (such as satisfaction and preferences) and objective data (such as tourist numbers and length of stay) are often mutually verifiable. We aimed to draw general conclusions based on objective facts, thereby providing solid support for decision making. However, future research should integrate qualitative methods to explore the underlying motivations for tourists’ behavior changes under high temperatures, such as the impact of weather on comfort or shifts in personal preferences.

6. Conclusions

Defining and revealing the effects of high-temperature weather is fundamental for tourism destinations to formulate climate adaptation strategies. This study proposed a tourist flow model based on Baidu migration big data, which allowed the measurement of high-temperature impacts on urban and rural tourist flows from a mobility perspective. By analyzing tourist flows across 24 h periods, we overcame the limitations of traditional approaches that relied on static analysis through annual [11] or monthly [23,31] data, and further improved accuracy by employing an analysis at the level of individual tourist attractions. Using Shanghai as an example, this study identified urban and rural tourist attractions, measured the effects of high temperatures on urban and rural tourist flows, and analyzed the differential factors contributing to these effects. Additionally, it proposed targeted climate adaptation strategies for urban and rural tourism.
The conclusions were as follows: High-temperature weather reduced both urban and rural tourist flows, with the degree of reduction exhibiting temporal and spatial differences. Temporally, high temperatures had a stronger inhibitory effect on rural tourism, leading to a greater reduction in tourist flow. Urban tourists tended to arrive earlier due to an increased need for indoor recreational cooling, while rural tourists delayed their visits to avoid outdoor heat-related activities. Spatially, under high-temperature conditions, tourist flow shifted from a multi-centered, dispersed pattern in both urban and rural areas under normal-temperature conditions to a concentrated urban pattern. In terms of influencing factors, urban tourist flow was primarily driven by facility service and economic levels, while rural tourist flow was influenced by different variables depending on temperature conditions. During high-temperature weather, tourists tended to prefer rural recreational areas farther from the city center. Conversely, under normal-temperature conditions, factors such as tourist attraction grade, facility services, and market size played a more significant role in shaping rural tourist flow. Finally, we identified distinct climate adaptation strategies, where urban areas addressed high temperatures through infrastructure and technological advancements, while rural destinations utilized natural resources to enhance thermal comfort for tourists.

Author Contributions

M.W.: writing—original draft, visualization, methodology, investigation, formal analysis, data curation, and conceptualization. T.H.: writing—review and editing, validation, supervision, resources, project administration, and funding acquisition. All authors have read and agreed to the published version of the manuscript.

Funding

The research was funded by the National Social Science Foundation of China, grant number 23BGL168.

Institutional Review Board Statement

Not applicable.

Data Availability Statement

Data will be made available on request.

Conflicts of Interest

The authors declare no conflicts of interest.

References

  1. Durán-Camejo, B.R.; Rivera-Vázquez, J.A.; Serrano-Leyva, B.; Batista-Pérez, O. Tourist leisure in scientific production in Scopus: Current trends and research agenda. Rev. San Gregor. 2024, 1, 98–108. [Google Scholar] [CrossRef]
  2. Bielska, A.; Borkowski, A.S.; Czarnecka, A.; Delnicki, M.; Kwiatkowska-Malina, J.; Piotrkowska, M. Evaluating the Potential of Suburban and Rural Areas for Tourism and Recreation, Including Individual Short-Term Tourism under Pandemic Conditions. Sci. Rep. 2022, 12, 20369. [Google Scholar] [CrossRef]
  3. Liao, Y.T.; Chern, S.G. Strategic Ecocity Development in Urban–Rural Fringes: Analyzing Wulai District. Sustain. Cities Soc. 2015, 19, 98–108. [Google Scholar] [CrossRef]
  4. Sun, Y.; Shao, Y.; Chan, E.H.W. Co-Visitation Network in Tourism-Driven Peri-Urban Area Based on Social Media Analytics: A Case Study in Shenzhen, China. Landsc. Urban Plan. 2020, 204, 103934. [Google Scholar] [CrossRef]
  5. Pan, W.; Du, J. Impacts of Urban Morphological Characteristics on Nocturnal Outdoor Lighting Environment in Cities: An Empirical Investigation in Shenzhen. Build. Environ. 2021, 192, 107587. [Google Scholar] [CrossRef]
  6. Ghasemi, M.; González-García, A.; Charrahy, Z.; Serrao-Neumann, S. Utilizing Supply-Demand Bundles in Nature-Based Recreation Offers Insights into Specific Strategies for Sustainable Tourism Management. Sci. Total Environ. 2024, 922, 171185. [Google Scholar] [CrossRef]
  7. Jamhawi, M.M.; Zidan, R.J.; Sherzad, M.F. Tourist Movement Patterns and the Effects of Spatial Configuration in a Cultural Heritage and Urban Destination: The Case of Madaba, Jordan. Sustainability 2023, 15, 1710. [Google Scholar] [CrossRef]
  8. Li, Y.; Gong, G.; Zhang, F.; Gao, L.; Xiao, Y.; Yang, X.; Yu, P. Network Structure Features and Influencing Factors of Tourism Flow in Rural Areas: Evidence from China. Sustainability 2022, 14, 9623. [Google Scholar] [CrossRef]
  9. Xu, D.; Zhang, J.-H.; Huang, Z.; Zhou, Y.; Fan, Q. Tourism Community Detection: A Space of Flows Perspective. Tour. Manag. 2022, 93, 104577. [Google Scholar] [CrossRef]
  10. Caldeira, A.M.; Kastenholz, E. It’s so Hot: Predicting Climate Change Effects on Urban Tourists’ Time–Space Experience. J. Sustain. Tour. 2018, 26, 1516–1542. [Google Scholar] [CrossRef]
  11. Gebbisa, M.B.; Yasin, A.S.; Bacsi, Z. Impacts of Weather Variability on the International Tourism Receipts—Evidence from Ethiopia (1995–2019). Tour. Hosp. 2024, 5, 416–438. [Google Scholar] [CrossRef]
  12. Turek-Hankins, L.L.; Coughlan De Perez, E.; Scarpa, G.; Ruiz-Diaz, R.; Schwerdtle, P.N.; Joe, E.T.; Galappaththi, E.K.; French, E.M.; Austin, S.E.; Singh, C.; et al. Climate Change Adaptation to Extreme Heat: A Global Systematic Review of Implemented Action. Oxf. Open Clim. Change 2021, 1, kgab005. [Google Scholar] [CrossRef]
  13. IPCC. Climate Change 2023: Synthesis Report; Cambridge University Press: New York, NY, USA, 2023. [Google Scholar]
  14. Atstāja, D.; Cakrani, E. Impact of Climate Change on International Tourism Evidence from Baltic Sea Countries. Sustainability 2024, 16, 5203. [Google Scholar] [CrossRef]
  15. Torres-Bagur, M.; Ribas Palom, A.; Vila-Subirós, J. Perceptions of Climate Change and Water Availability in the Mediterranean Tourist Sector. Int. J. Clim. Change Strateg. Manag. 2019, 11, 552–569. [Google Scholar] [CrossRef]
  16. Yi, W.; Bach, A.; Tong, S.; Cheng, J.; Yang, J.; Zheng, H.; Ho, H.C.; Song, J.; Pan, R.; Su, H.; et al. Quantifying the Historical and Future Heat-Related Mortality above the Heat Alert Thresholds of the Inaugural Chinese National Heat-Health Action Plan. Environ. Res. 2024, 262, 119869. [Google Scholar] [CrossRef]
  17. Zhang, Y.; Sun, Y.; Hu, T. Changes in Extreme High Temperature Warning Indicators over China under Different Global Warming Levels. Sci. China Earth Sci. 2024, 67, 1895–1909. [Google Scholar] [CrossRef]
  18. Zhang, K.; Cao, C.; Chu, H.; Zhao, L.; Zhao, J.; Lee, X. Increased Heat Risk in Wet Climate Induced by Urban Humid Heat. Nature 2023, 617, 738–742. [Google Scholar] [CrossRef]
  19. Serquet, G.; Rebetez, M. Relationship between Tourism Demand in the Swiss Alps and Hot Summer Air Temperatures Associated with Climate Change. Clim. Change 2011, 108, 291–300. [Google Scholar] [CrossRef]
  20. Yu, D.; Li, S.; Chen, N.; Hall, M.; Guo, Z. High Temperatures and Tourism: Findings from China. Sustainability 2023, 15, 14138. [Google Scholar] [CrossRef]
  21. Zhang, P.; Wu, L.; Li, R. Development Drivers of Rural Summer Health Tourism for the Urban Elderly: A Demand- and Supply-Based Framework. Sustainability 2023, 15, 10686. [Google Scholar] [CrossRef]
  22. Zhang, P.; Liang, Q.; Li, R.; Guo, S. Differentiation of Rural Summer Health Tourism for Urban Elderly: Tourist Segmentation Based on Tourism Experience. J. Hosp. Tour. Manag. 2024, 59, 149–152. [Google Scholar] [CrossRef]
  23. Falk, M. Summer Weather Conditions and Tourism Flows in Urban and Rural Destinations. Clim. Chang. 2015, 130, 201–222. [Google Scholar] [CrossRef]
  24. McKercher, B.; Shoval, N.; Park, E.; Kahani, A. The [Limited] Impact of Weather on Tourist Behavior in an Urban Destination. J. Travel Res. 2015, 54, 442–455. [Google Scholar] [CrossRef]
  25. Peng, J.; Liu, Q.; Blaschke, T.; Zhang, Z.; Liu, Y.; Hu, Y.; Wang, M.; Xu, Z.; Wu, J. Integrating Land Development Size, Pattern, and Density to Identify Urban–Rural Fringe in a Metropolitan Region. Landsc. Ecol. 2020, 35, 2045–2059. [Google Scholar] [CrossRef]
  26. Bosello, F.; Campagnolo, L.; Cervigni, R.; Eboli, F. Climate Change and Adaptation: The Case of Nigerian Agriculture. Environ. Resour. Econ. 2018, 69, 787–810. [Google Scholar] [CrossRef]
  27. Oramah, C.P.; Olsen, O.E.; Arne Pettersen Gould, K. Assessing the Impact of the Securitization Narrative on Climate Change Adaptation in Nigeria. Environ. Polit. 2022, 31, 1037–1057. [Google Scholar] [CrossRef]
  28. Roson, R.; Sartori, M. Climate Change, Tourism and Water Resources in the Mediterranean: A General Equilibrium Analysis. Int. J. Clim. Change Strateg. Manag. 2014, 6, 212–228. [Google Scholar] [CrossRef]
  29. Scott, D.; Gössling, S. A Review of Research into Tourism and Climate Change-Launching the Annals of Tourism Research Curated Collection on Tourism and Climate Change. Ann. Tour. Res. 2022, 95, 103409. [Google Scholar] [CrossRef]
  30. Berred, S.; Berred, K. Climate Change Issues, Challenges, and Impacts in Terms of Rural Geo-Biological and Cultural Tourism Activity Development in Semiarid Areas: A Case Study from Tata, Bani Geopark (Anti-Atlas, South Morocco). Geoheritage 2021, 13, 110. [Google Scholar] [CrossRef]
  31. Willibald, F.; Kotlarski, S.; Ebner, P.P.; Bavay, M.; Marty, C.; Trentini, F.V.; Ludwig, R.; Grêt-Regamey, A. Vulnerability of Ski Tourism towards Internal Climate Variability and Climate Change in the Swiss Alps. Sci. Total Environ. 2021, 784, 147054. [Google Scholar] [CrossRef]
  32. Gössling, S.; Scott, D.; Hall, C.M.; Ceron, J.-P.; Dubois, G. Consumer Behaviour and Demand Response of Tourists to Climate Change. Ann. Tour. Res. 2012, 39, 36–58. [Google Scholar] [CrossRef]
  33. Scott, D.; Gössling, S.; Hall, C.M. International Tourism and Climate Change. Wiley Interdiscip. Rev. Clim. Change 2012, 3, 213–232. [Google Scholar] [CrossRef]
  34. Steiger, R. Scenarios for Skiing Tourism in Austria: Integrating Demographics with an Analysis of Climate Change. J. Sustain. Tour. 2012, 20, 867–882. [Google Scholar] [CrossRef]
  35. Muñoz, C.; Álvarez, A.; Baños, J.F. Modelling the Effect of Weather on Tourism: Does It Vary across Seasons? Tour. Geogr. 2023, 25, 265–286. [Google Scholar] [CrossRef]
  36. Knowles, N.L.B.; Scott, D. Advancing Ski Tourism Transformations to Climate Change: A Multi-Stakeholder Participatory Approach in Diverse Canadian Destinations. Ann. Tour. Res. Empir. Insights 2024, 5, 100139. [Google Scholar] [CrossRef]
  37. Ullah, N.; Chao, L.; Khan, T.U.; Sai, W.L.; Yazhuo, Z.; Khan, I.A.; Hassan, M.A.; Hu, Y. Insights into Climate Change Dynamics: A Tourism Climate Index-Based Evaluation of Gilgit-Baltistan, Pakistan. Heliyon 2024, 10, e35315. [Google Scholar] [CrossRef]
  38. Gao, Y.; Xu, X.; Wei, Y. Analysis on the Imbalance of Population Flow Network during the Spring Festival Travel Rush in China in 2015. PLoS ONE 2021, 16, e0249520. [Google Scholar] [CrossRef]
  39. Ren, Z.; Jiang, B.; Seipel, S. Capturing and Characterizing Human Activities Using Building Locations in America. ISPRS Int. J. Geo-Inf. 2019, 8, 200. [Google Scholar] [CrossRef]
  40. Sugimoto, K.; Ota, K.; Suzuki, S. Visitor Mobility and Spatial Structure in a Local Urban Tourism Destination: GPS Tracking and Ntwork Analysis. Sustainability 2019, 11, 919. [Google Scholar] [CrossRef]
  41. Wei, B.; Su, G.; Liu, F. Dynamic Assessment of Spatiotemporal Population Distribution Based on Mobile Phone Data: A Case Study in Xining City, China. Int. J. Disaster Risk Sci. 2023, 14, 649–665. [Google Scholar] [CrossRef]
  42. Yao, Y.; Liu, X.; Li, X.; Zhang, J.; Liang, Z.; Mai, K.; Zhang, Y. Mapping Fine-Scale Population Distributions at the Building Level by Integrating Multisource Geospatial Big Data. Int. J. Geogr. Inf. Sci. 2017, 31, 1220–1244. [Google Scholar] [CrossRef]
  43. Zhang, W.; Chong, Z.; Li, X.; Nie, G. Spatial Patterns and Determinant Factors of Population Flow Networks in China: Analysis on Tencent Location Big Data. Cities 2020, 99, 102640. [Google Scholar] [CrossRef]
  44. Zhang, Y.; Jia, T. Dynamic community detection and evolution analysis in multilayer interaction network based on trajectory data. Acta Geogr. Sin. 2023, 78, 490–502. (In Chinese) [Google Scholar]
  45. de la Vara, A.; Cabos, W.; Gutiérrez, C.; Olcina, J.; Matamoros, A.; Pastor, F.; Khodayar, S.; Ferrando, M. Climate Change Impacts on the Tourism Sector of the Spanish Mediterranean Coast: Medium-Term Projections for a Climate Services Tool. Clim. Serv. 2024, 34, 100466. [Google Scholar] [CrossRef]
  46. Fitchett, J.M.; Robinson, D.; Hoogendoorn, G. Climate Suitability for Tourism in South Africa. J. Sustain. Tour. 2017, 25, 851–867. [Google Scholar] [CrossRef]
  47. Scott, D.; Hall, C.M.; Gössling, S. Global Tourism Vulnerability to Climate Change. Ann. Tour. Res. 2019, 77, 49–61. [Google Scholar] [CrossRef]
  48. Lane, B.; Kastenholz, E. Rural Tourism: The Evolution of Practice and Research Approaches–towards a New Generation Concept? J. Sustain. Tour. 2015, 23, 1133–1156. [Google Scholar] [CrossRef]
  49. Shahbaz, M.; Yüksel, S.; Eti, S.; Dinçer, H.; Khamdamov, S.-J. A Fuzzy Decision-Making Model for Enhancing Sustainable Tourism Investments in Climate-Vulnerable Destinations. J. Environ. Manag. 2025, 380, 125151. [Google Scholar] [CrossRef]
  50. Hamida, H.B. Cross-Domain Dynamics: How Geopolitical and Climate Policy Uncertainties Shape Tourism Patterns in the United States. Tour. Econ. 2024, 30, 1835–1856. [Google Scholar] [CrossRef]
  51. Gössling, S.; Peeters, P. Assessing Tourism’s Global Environmental Impact 1900–2050. J. Sustain. Tour. 2015, 23, 639–659. [Google Scholar] [CrossRef]
  52. Su, B. Rural Tourism in China. Tour. Manag. 2011, 32, 1438–1441. [Google Scholar] [CrossRef]
  53. Zhang, H.; Fu, X.; Cai, L.A.; Lu, L. Destination Image and Tourist Loyalty: A Meta-Analysis. Tour. Manag. 2014, 40, 213–223. [Google Scholar] [CrossRef]
  54. Kumar, D.M.; Govindarajo, N.S.; Khen, M.H.S. Effect of Service Quality on Visitor Satisfaction, Destination Image and Destination Loyalty–Practical, Theoretical and Policy Implications to Avitourism. Int. J. Cult. Tour. Hosp. Res. 2019, 14, 83–101. [Google Scholar] [CrossRef]
  55. Shi, J.; Cui, L. Characteristics of High Impact Weather and Meteorological Disaster in Shanghai, China. Nat. Hazards 2012, 60, 951–969. [Google Scholar] [CrossRef]
  56. Zhang, J.; Dong, Y.; Xi, Y. A Comparison of SOFM Ordination with DCA and PCA in Gradient Analysis of Plant Communities in the Midst of Taihang Mountains, China. Ecol. Inform. 2008, 3, 367–374. [Google Scholar] [CrossRef]
  57. Song, Z.; Liu, F.; Lv, W.; Yan, J. Classification of Urban Agricultural Functional Regions and Their Carbon Effects at the County Level in the Pearl River Delta, China. Agriculture 2023, 13, 1734. [Google Scholar] [CrossRef]
  58. Wang, X.; Li, Z.; Feng, Z. Classification of Shrinking Cities in China Based on Self-Organizing Feature Map. Land 2022, 11, 1525. [Google Scholar] [CrossRef]
  59. Nasr, M.; Orwin, J.F. A Geospatial Approach to Identifying and Mapping Areas of Relative Environmental Pressure on Ecosystem Integrity. J. Environ. Manag. 2024, 370, 122445. [Google Scholar] [CrossRef]
  60. Majhi, A.; Dhanya, C.T.; Pattanayak, S.; Chakma, S. Reducing the Uncertainty in the Tropical Precipitation through a Multi-Criteria Decision-Making Approach. Int. J. Climatol. 2024, 44, 5773–5790. [Google Scholar] [CrossRef]
  61. Veettil, A.V.; Fares, A.; Awal, R. Winter Storm Uri and Temporary Drought Relief in the Western Climate Divisions of Texas. Sci. Total Environ. 2022, 835, 155336. [Google Scholar] [CrossRef]
  62. Wang, L.; Xin, L.; Zhu, Y.; Fang, Y.; Zhu, L. Associations between Temperature Variations and Tourist Arrivals: Analysis Based on Baidu Index of Hot-Spring Tourism in 44 Cities in China. Environ. Sci. Pollut. Res. 2023, 30, 43641–43653. [Google Scholar] [CrossRef] [PubMed]
  63. Liu, T.-M.; Ba, Q.-X. Tourists’ Willingness to Pay for Protecting the Agricultural Landscapes Maintained by Rukai Traditional Agricultural Methods. Local Environ. 2025, 30, 480–500. [Google Scholar] [CrossRef]
  64. Guan, Z.; Zhang, H. A Quantitative Analysis of the Complex Response Relationship between Urban Green Infrastructure (UGI) Structure/Spatial Pattern and Urban Thermal Environment in Shanghai. Sustainability 2024, 16, 6886. [Google Scholar] [CrossRef]
  65. Vasconcelos, L.; Langemeyer, J.; Cole, H.V.S.; Baró, F. Nature-Based Climate Shelters? Exploring Urban Green Spaces as Cooling Solutions for Older Adults in a Warming City. Urban For. Urban Gree. 2024, 98, 128408. [Google Scholar] [CrossRef]
  66. Amorim-Maia, A.T.; Anguelovski, I.; Connolly, J.; Chu, E. Seeking Refuge? The Potential of Urban Climate Shelters to Address Intersecting Vulnerabilities. Landsc. Urban Plan. 2023, 238, 104836. [Google Scholar] [CrossRef]
  67. Lo, A.Y.; Jim, C.Y.; Cheung, P.K.; Wong, G.K.L.; Cheung, L.T.O. Space Poverty Driving Heat Stress Vulnerability and the Adaptive Strategy of Visiting Urban Parks. Cities 2022, 127, 103740. [Google Scholar] [CrossRef]
  68. Velea, L.; Irimescu, A.; Bojariu, R.; Chitu, Z. Climate Change and Its Impact on Romanian Rural Tourism—A Review of Actionable Knowledge. Agriculture 2024, 14, 1917. [Google Scholar] [CrossRef]
  69. Wang, Z.; Yang, G.; Chen, H.; Lin, J.; Guan, J.; Cai, D.; Xu, B. Addressing the Heat Exposure Risk Shift towards New Towns and Rural Areas: Potential Strategies Inspired by the Heat Network Resilience. Build. Environ. 2025, 271, 112592. [Google Scholar] [CrossRef]
  70. Cheng, Y.; Liu, X.; Zeng, Z.; Liu, S.; Wang, Z.; Tang, X.; He, B.-J. Impacts of Water Bodies on Microclimates and Outdoor Thermal Comfort: Implications for Sustainable Rural Revitalization. Front. Environ. Sci. 2022, 10, 940482. [Google Scholar] [CrossRef]
  71. Gottardini, E.; Cristofolini, F.; Cristofori, A.; Ferretti, M. Forests Attenuate Temperature and Air Pollution Discomfort in Montane Tourist Areas. Forests 2023, 14, 545. [Google Scholar] [CrossRef]
  72. Nguyen, Q.H. Impact of Investment in Tourism Infrastructure Development on Attracting International Visitors: A Nonlinear Panel ARDL Approach Using Vietnam’s Data. Economies 2021, 9, 131. [Google Scholar] [CrossRef]
  73. Wan, Z.; Lang, Q.; Zhang, Y.; Zhang, J.; Chen, Y.; Liu, G.; Liu, H. Improving the Resilience of Urban Transportation to Natural Disasters: The Case of Changchun, China. Sci. Rep. 2025, 15, 1116. [Google Scholar] [CrossRef]
  74. Ngoma, H.; Finn, A.; Kabisa, M. Climate Shocks, Vulnerability, Resilience and Livelihoods in Rural Zambia. Clim. Dev. 2024, 16, 490–501. [Google Scholar] [CrossRef]
  75. George, A.; Sharma, P.; Pradhan, K.C. Rural–Urban Disparities in Spatiotemporal Pattern of Vulnerability to Climate Change: A Study of Madhya Pradesh, India. Environ. Earth Sci. 2023, 82, 588. [Google Scholar] [CrossRef]
  76. Elnabawi, M.; Hamza, N. Outdoor Thermal Comfort: Coupling Microclimatic Parameters with Subjective Thermal Assessment to Design Urban Performative Spaces. Buildings 2020, 10, 238. [Google Scholar] [CrossRef]
  77. Jayasinghe, G.Y.; Perera, T.A.N.T.; Perera, H.A.T.N.; Karunarathne, H.D.; Manawadu, L.; Weerasinghe, V.P.A.; Sewwandi, B.G.N.; Haroon, M.H.; Malalgoda, C.; Amaratunga, D.; et al. A Systematic Literature Review on Integrating Disaster Risk Reduction (DRR) in Sustainable Tourism (SusT): Conceptual Framework for Enhancing Resilience and Minimizing Environmental Impacts. Int. J. Disaster Risk Reduct. 2024, 111, 104742. [Google Scholar] [CrossRef]
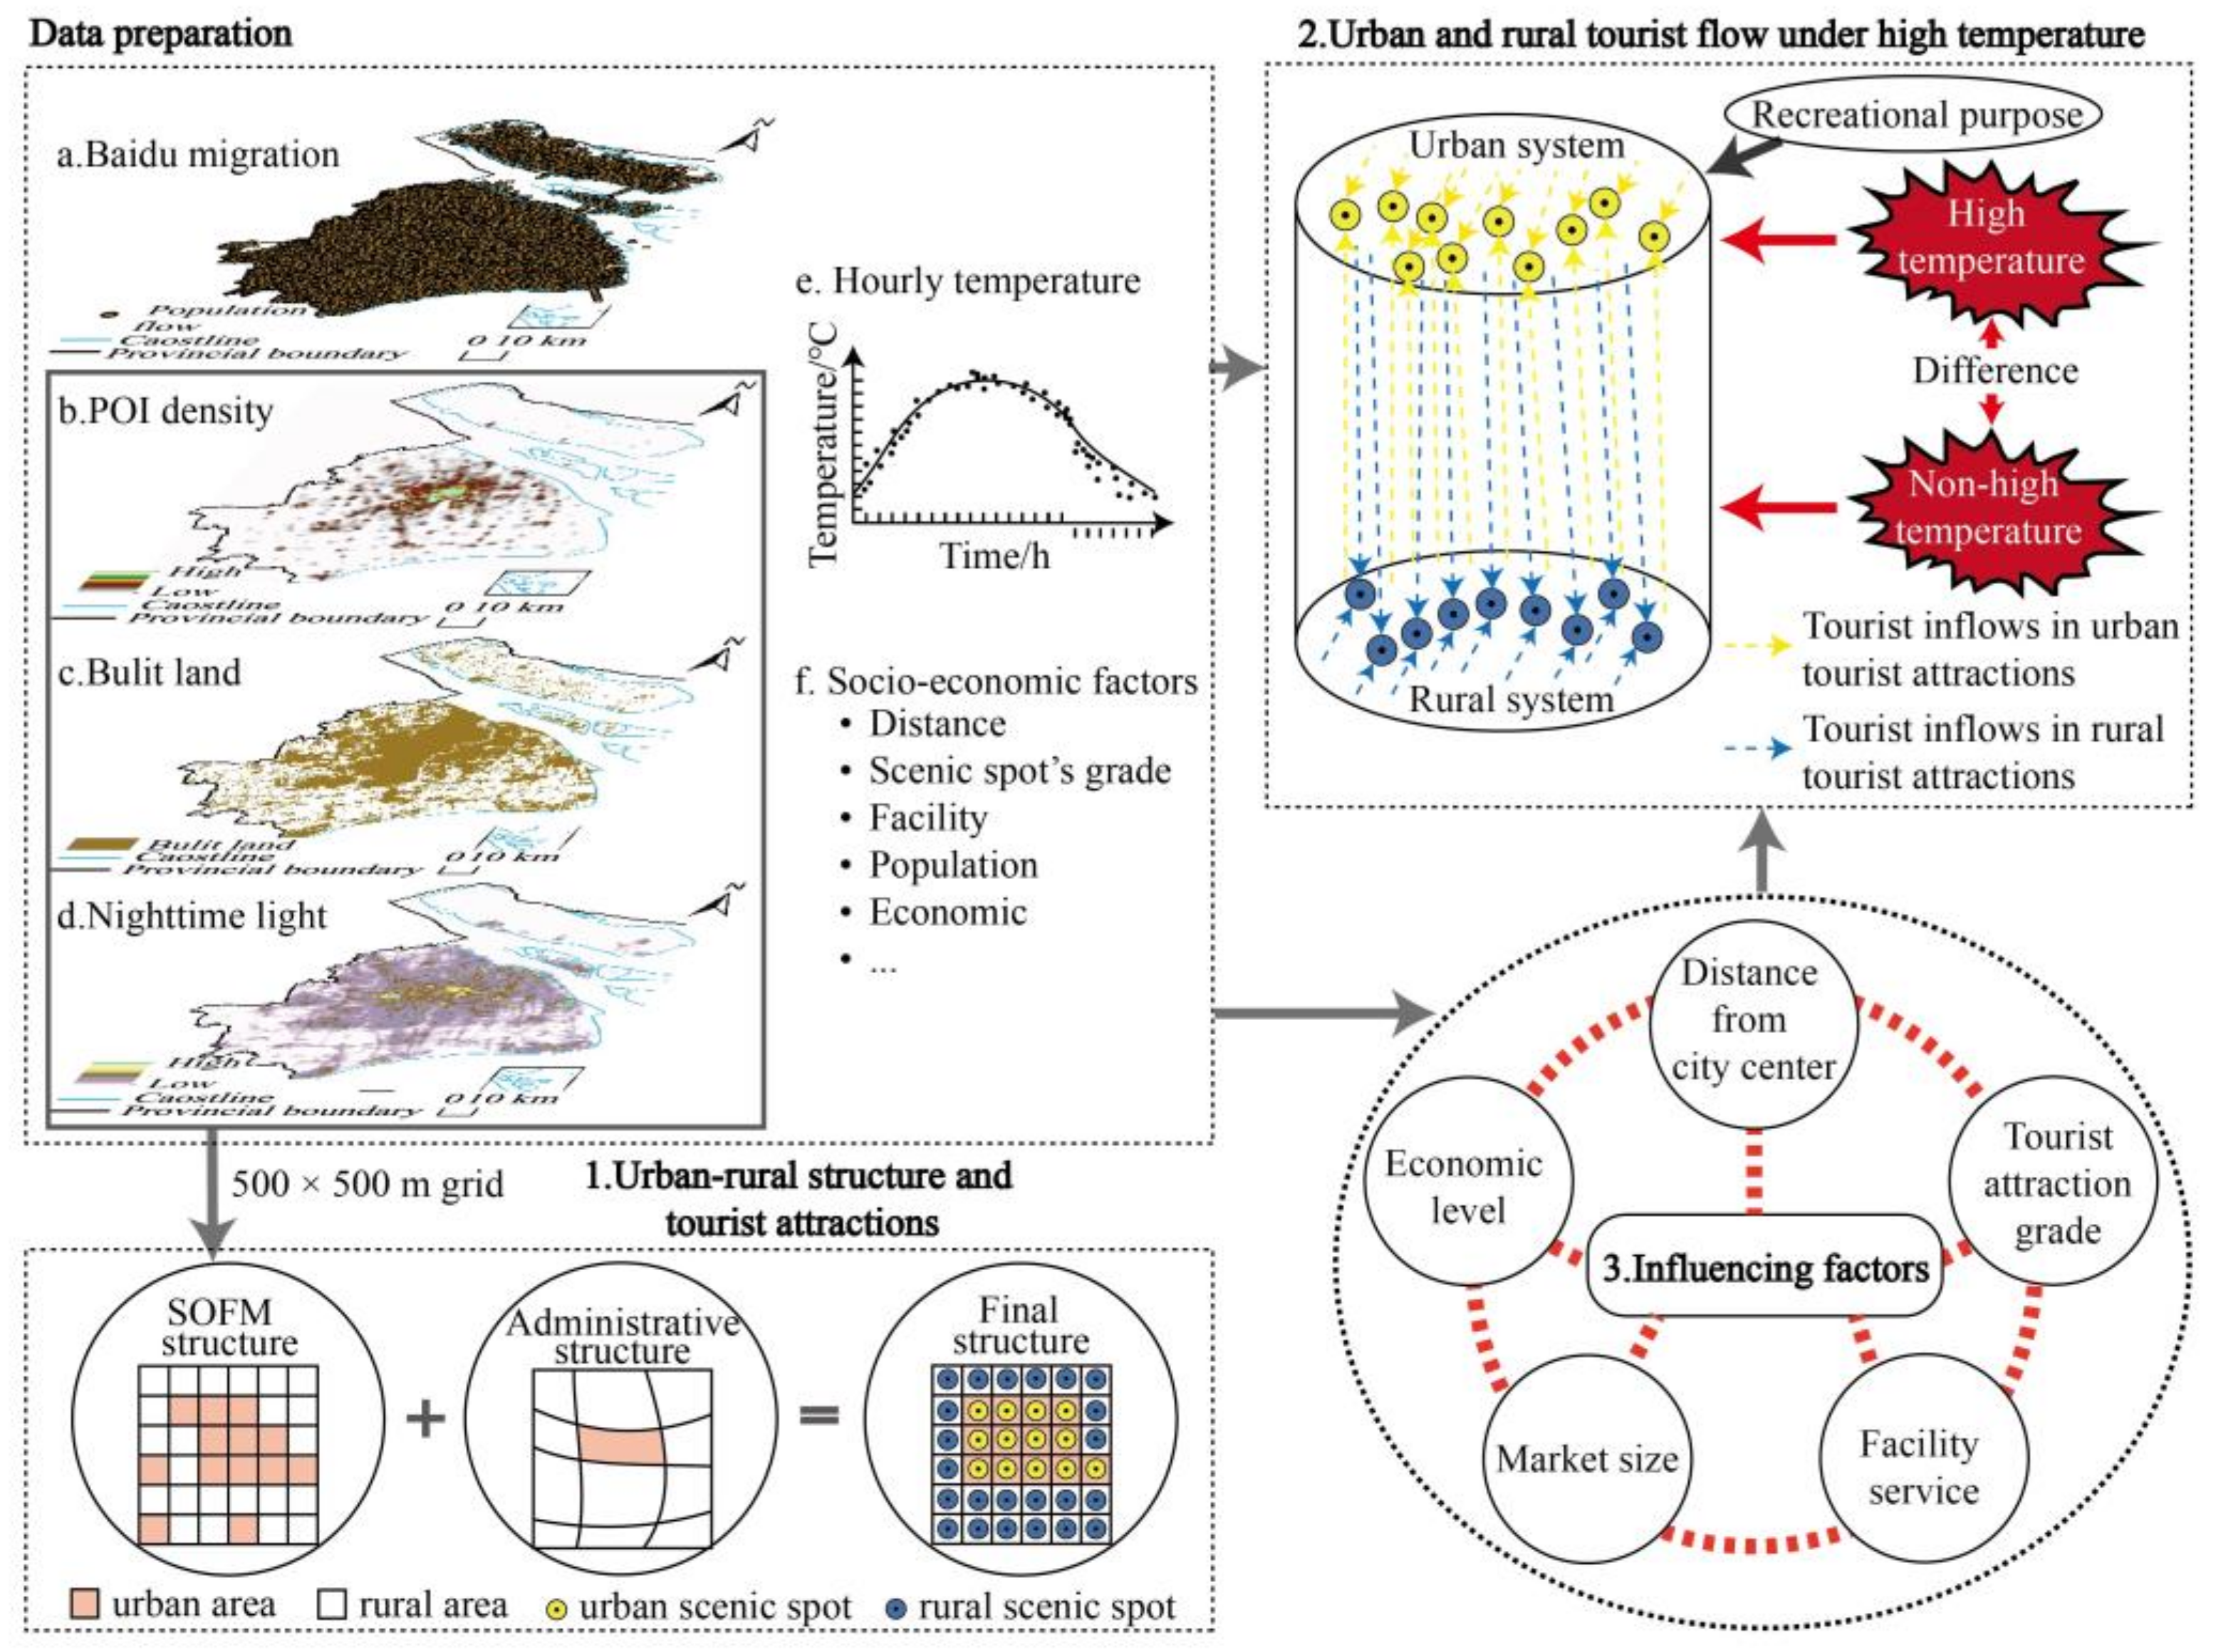
Figure 1. The research framework.
Agriculture 15 00980 g001
Figure 2. Location of the study area.
Agriculture 15 00980 g002
Figure 3. Urban and rural structures.
Agriculture 15 00980 g003
Figure 4. Trends in urban and rural tourist flows under varying temperatures.
Agriculture 15 00980 g004
Figure 5. Temporal evolution characteristics of urban and rural tourist flows under varying temperatures.
Agriculture 15 00980 g005
Figure 6. Spatial evolution characteristics of urban and rural tourist flows under high temperatures.
Agriculture 15 00980 g006
Figure 7. Spatial evolution characteristics of urban and rural tourist flows under normal temperatures.
Agriculture 15 00980 g007
Table 1. Pearson correlation analysis of impact factors under high temperatures.
Time (h)Urban Tourist FlowRural Tourist Flow
DisGraAmeDenEcoDisGraAmeDenEco
00.2750.054−0.2680.017−0.0780.405 **−0.201 *−0.288 **−0.468 **−0.161
10.299 *0.047−0.180−0.055−0.0250.411 **0.187−0.415 **−0.469 **−0.065
20.2560.094−0.075−0.0200.0580.405 **−0.201 *−0.395 **−0.467 **−0.113
30.313 *−0.041−0.267−0.124−0.0580.392 **−0.182−0.421 **−0.342 **−0.125
40.2720.023−0.131−0.1470.0140.269 **−0.188−0.143−0.354 **−0.062
50.085−0.258−0.346 *−0.069−0.374 **−0.360 **0.1780.202 *0.437 **0.192
6−0.171−0.0460.0250.054−0.109−0.406 **0.1600.358 **0.471 **0.136
7−0.2350.0390.1160.0190.007−0.374 **0.213 *0.287 **0.441 **0.043
8−0.232−0.0040.1430.005−0.005−0.362 **0.257 *0.330 **0.425 **0.066
9−0.301 *0.0860.239−0.0180.163−0.367 **0.349 **0.288 **0.432 **0.246 *
10−0.2640.1710.407 **−0.0730.345 *−0.250 *0.369 **0.222 *0.302 **0.210 *
11−0.2510.2260.392 **−0.0800.353 *−0.0760.299 **0.104−0.0470.164
12−0.1790.1870.430 **0.0100.358 *0.227 *−0.011−0.065−0.357 **0.094
13−0.1460.0350.291 *−0.1110.295 *−0.0600.052−0.1730.090−0.067
14−0.2870.2860.364 *−0.1330.403 **−0.1270.171−0.0540.220 *0.138
150.0160.096−0.039−0.245−0.194−0.1250.054−0.1550.264 **0.005
160.009−0.0070.195−0.1700.233−0.330 **0.268 **0.252 *0.284 **0.218 *
17−0.038−0.2410.0800.0600.114−0.116−0.1210.1110.033−0.105
180.237−0.295 *−0.078−0.223−0.106−0.045−0.1140.437 **−0.159−0.064
190.157−0.246−0.0830.150−0.0190.021−0.1200.302 **−0.229 *−0.010
200.272−0.135−0.421 **−0.050−0.361 *0.218 *−0.342 **−0.035−0.186−0.109
210.207−0.092−0.338 *0.137−0.297 *0.250 *−0.271 **−0.427 **−0.207 *−0.251 *
220.129−0.073−0.2350.128−0.2100.359 **−0.296 **−0.359 **−0.329 **−0.169
230.1770.034−0.2780.069−0.2360.434 **−0.306 **−0.331 **−0.441 **−0.197
*, ** = Statistically significant at the 5% and 1% level.
Table 2. Pearson correlation analysis of impact factors under normal temperatures.
Time (h)Urban Tourist FlowRural Tourist Flow
DisGraAmeDenEcoDisGraAmeDenEco
00.2560.030−0.2390.029−0.0630.432 **−0.223 *−0.381 **−0.447 **−0.131
10.311 *0.007−0.205−0.074−0.0300.427 **−0.199 *−0.427 **−0.481 **−0.155
20.2580.065−0.108−0.0860.0780.419 **−0.191−0.420 **−0.442−0.060
30.303 *0.017−0.213−0.082−0.0050.380 **−0.174−0.389 **−0.456 **−0.129
40.323 *0.028−0.161−0.154−0.040.275 **−0.203 *−0.531 **−0.209 *0.005
50.038−0.209−0.2620.008−0.353 *−0.386 **0.1580.299 **0.456 **0.175
6−0.186−0.0470.0370.054−0.098−0.399 **0.1940.291 **0.491 **0.169
7−0.2090.0050.0810.003−0.048−0.381 **0.199 *0.348 **0.430 **0.043
8−0.230−0.0230.1400.0290.028−0.380 **0.267 **0.359 **0.446 **0.086
9−0.2550.0620.1920.0050.111−0.390 **0.358 **0.326 **0.441 **0.207 *
10−0.2770.1720.334 *−0.0320.285−0.350 **0.446 **0.338 **0.348 **0.314 **
11−0.2520.1730.394 **−0.0160.310 *−0.1440.307 **0.1040.0100.197
12−0.1720.1720.414 **−0.0960.357 *0.1470.0690.064−0.248 *0.096
13−0.2170.0190.352 *0.0560.425 **−0.1100.146−0.1300.1400.014
14−0.370 *0.291 *0.393 **−0.0210.446 **−0.221 *0.350 **0.0790.260 **0.054
15−0.0150.0790.036−0.151−0.044−0.250 *0.037−0.1030.356 **0.114
160.187−0.017−0.151−0.188−0.086−0.086−0.202 *0.0600.037−0.024
170.059−0.2440.040−0.232−0.073−0.045−0.311 **0.0770.097−0.155
180.269−0.243−0.202−0.111−0.2610.252 *−0.376 **0.029−0.339 **−0.202 *
190.226−0.154−0.1490.049−0.0950.170−0.236 *0.195−0.362 **−0.070
200.246−0.149−0.331 *−0.036−0.2410.271 **−0.362 **−0.174−0.201 *−0.128
210.146−0.058−0.291 *0.068−0.2660.256 *−0.282 **−0.323 **−0.251 *−0.234 *
220.141−0.045−0.2370.222−0.2090.394 **−0.263 **−0.433 **−0.381 **−0.170
230.232−0.030−0.2720.045−0.1900.433 **−0.265 **−0.364 **−0.457 **−0.185
*, ** = Statistically significant at the 5% and 1% level.
Disclaimer/Publisher’s Note: The statements, opinions and data contained in all publications are solely those of the individual author(s) and contributor(s) and not of MDPI and/or the editor(s). MDPI and/or the editor(s) disclaim responsibility for any injury to people or property resulting from any ideas, methods, instructions or products referred to in the content.