Article

Optimal Water Allocation Considering Water Diversion Projects in an Agricultural Irrigation District

Key Laboratory of Earth Surface Processes and Regional Response in the Yangtze–Huaihe River Basin, School of Geography and Tourism, Anhui Normal University, Wuhu 241002, China
*
Author to whom correspondence should be addressed.
Agriculture 2025, 15(9), 949; https://doi.org/10.3390/agriculture15090949
Submission received: 17 March 2025 / Revised: 19 April 2025 / Accepted: 23 April 2025 / Published: 27 April 2025
(This article belongs to the Section Agricultural Water Management)

Abstract

:
Optimal water resource allocation in agricultural irrigation districts constitutes a core strategy for achieving coordinated regional water–food–ecosystem development. However, current studies rarely integrate inter-basin water diversion projects into the allocation, and the prolonged operation of diversion systems fails to adequately consider their ecological impacts in the irrigation districts. This study incorporates inter-basin water diversion into supply–demand dynamics and considers its influence on groundwater table changes in terrestrial ecological targets. Inexact two-stage stochastic programming (ITSP) was applied for optimal water allocation to address uncertainties from fluctuations in future water availability and interval ambiguity in socioeconomic information. Taking the densely populated agricultural irrigation district of Huaibei as a case study, we established a multi-stakeholder allocation model, considering the Yangtze-to-Huai water diversion project, to maximize comprehensive benefits under multiple scenarios of water availability for the years of 2030 and 2040. The results demonstrate that the district will face escalating water scarcity risks, with demand–supply gaps widening when available water resources decrease. The water redistribution in the second stage reduces scarcity-induced losses, achieving maximum comprehensive benefits. The water diversion project enhances supply capacity and boosts economic gains. The project can also decrease the fluctuation range of the total benefits by 5 × 10⁶ CNY (2030) and 3.4 × 10⁷ CNY (2040), compared with the scenario without the project. From 2030 to 2040, limited water resources will progressively shift toward sectors with higher economic output per unit water, squeezing agricultural allocations. Therefore, for irrigation districts in developing countries, maintaining a minimum guaranteed rate of agricultural water proves critical to safeguarding food security.

1. Introduction

Agricultural water use accounts for over 70% of global water consumption [1]. Its efficiency advantages play a decisive role in alleviating water scarcity crises [2]. This elevates the urgency of developing water resource allocation mechanisms as a critical intervention point, given their dual capacity to govern utilization efficiency and modulate water stress dynamics [3]. Scientific allocation of water resources demonstrates the capacity to balance economic outputs and ecological benefits in agricultural irrigation districts [4]. As a model of scientific allocation, optimal allocation of water resources in agricultural irrigation districts serves as a pivotal strategy for achieving coordinated regional water–food–ecosystem synergies [5]. Through systematic regulation of multiple water sources, including surface water, groundwater, and external water transfers, optimal allocation significantly enhances irrigation reliability, while reducing resource waste [6]. Water diversion projects serve as a critical complement to water resources in irrigation districts [7], not only altering water availability, but also affecting local ecosystems [8].
However, optimal allocation models with irrigation districts as the research boundary rarely incorporate water diversion projects into the water resource allocation process. Current studies focus on how water availability is influenced by diversion projects, and then on how optimal water is allocated for various water-using sectors, including irrigation and domestic water use [9]. The scales, timing, and hydrologic uncertainties of these projects need to be incorporated into the allocation models [10,11]. Nonetheless, certain models still integrate water diversion projects into the optimization model to maximize the benefits of the system [12,13,14]. However, these studies neglect the ecological impacts. Large-scale water diversion projects modify local hydrological cycle patterns [15], either by altering evaporation and infiltration regimes in irrigation areas, or by influencing groundwater tables through artificial source water substitution [16,17]. Current studies lack ecological feedback analysis of regional water cycle alterations under long-term diversion operations. These limitations result in overlooking potential disturbances to the carrying capacity and salt balance of the local water system, ultimately constraining the global optimization potential of multi-source water systems.
Water resource allocation in agricultural irrigation districts requires more theoretical explorations in multi-dimensional synergistic optimization. Current research on water resources in agricultural irrigation districts focuses more on allocation within the agricultural sector. Irrigation efficiency and economic benefits are the general objectives for the optimal allocation of water resources [18,19], lacking dynamic analysis of multi-sector water competition. Although agriculture is the largest water-consuming sector in irrigation districts [20], there are still other water-consuming sectors, such as industry and domestic use, in many densely populated irrigation districts, particularly in developing countries such as China, India, Ethiopia, Iran, Pakistan, and Vietnam [21,22,23,24,25,26]. The resource competition effects between agricultural water use and rapidly expanding industrial and domestic water demands have not been sufficiently quantified. Considering that the water guarantee rate for agricultural use is usually lower than that for industrial and domestic sectors [9], such competition will be even more disadvantageous to food production and ecological protection in agricultural irrigation districts. In developing countries, during urbanization processes, the absence of cross-sector coordination mechanisms exacerbates structural water scarcity conflicts [27].
The methodologies for optimal allocation of water resources in agricultural irrigation districts primarily include deterministic programming, intelligent optimization programming, coupled models, and uncertainty-based optimization methods. Deterministic programming methods such as linear programming (LP), nonlinear programming (NLP), and dynamic programming (DP) exhibit high computational efficiency and yield explicit solutions [28], but they fail to address uncertainties expressed as probability distributions and information available as discrete intervals [29]. Intelligent optimization algorithms like artificial neural networks (ANN) and machine learning (ML) require substantial data support and suffer from the issue of weak physical interpretability [30,31]. Coupled models, such as integrating genetic algorithms (GAs) with hydrological models (e.g., SWAT), face significant challenges in interdisciplinary collaboration and incur high implementation costs [23]. Uncertainty programming, including two-stage stochastic programming (TSP) and interval programming (IP), partially resolves single-dimensional issues, and can strengthen system resilience and mitigate risks [32]. Yet, uncertainty programming lacks synergistic mechanisms for handling coupled multi-dimensional uncertainties [33]. These limitations render traditional models inadequate for generating robust and adaptive allocation schemes when confronted with non-stationary inflows, interval parameters, and decision ambiguities. To address these challenges, the inexact two-stage stochastic programming (ITSP) model integrates interval numbers, stochastic scenario trees, and fuzzy decision-making mechanisms, achieving synergistic optimization of multiple uncertainties [34].
This study aims to ascertain the optimal allocation of water resources among multiple water-consuming sectors in the agricultural irrigation area with the involvement of the basin water diversion project, on the premise of considering the terrestrial ecological objectives of the agricultural irrigation area. An ITSP-based optimal water allocation model is developed, incorporating multiple uncertainties in water availability, model parameters, and decision-making processes. Taking the Huaibei agricultural irrigation district as a case study, the model is designed to achieve optimal water allocation and maximize the comprehensive benefits of the water resource system.

2. Materials and Methods

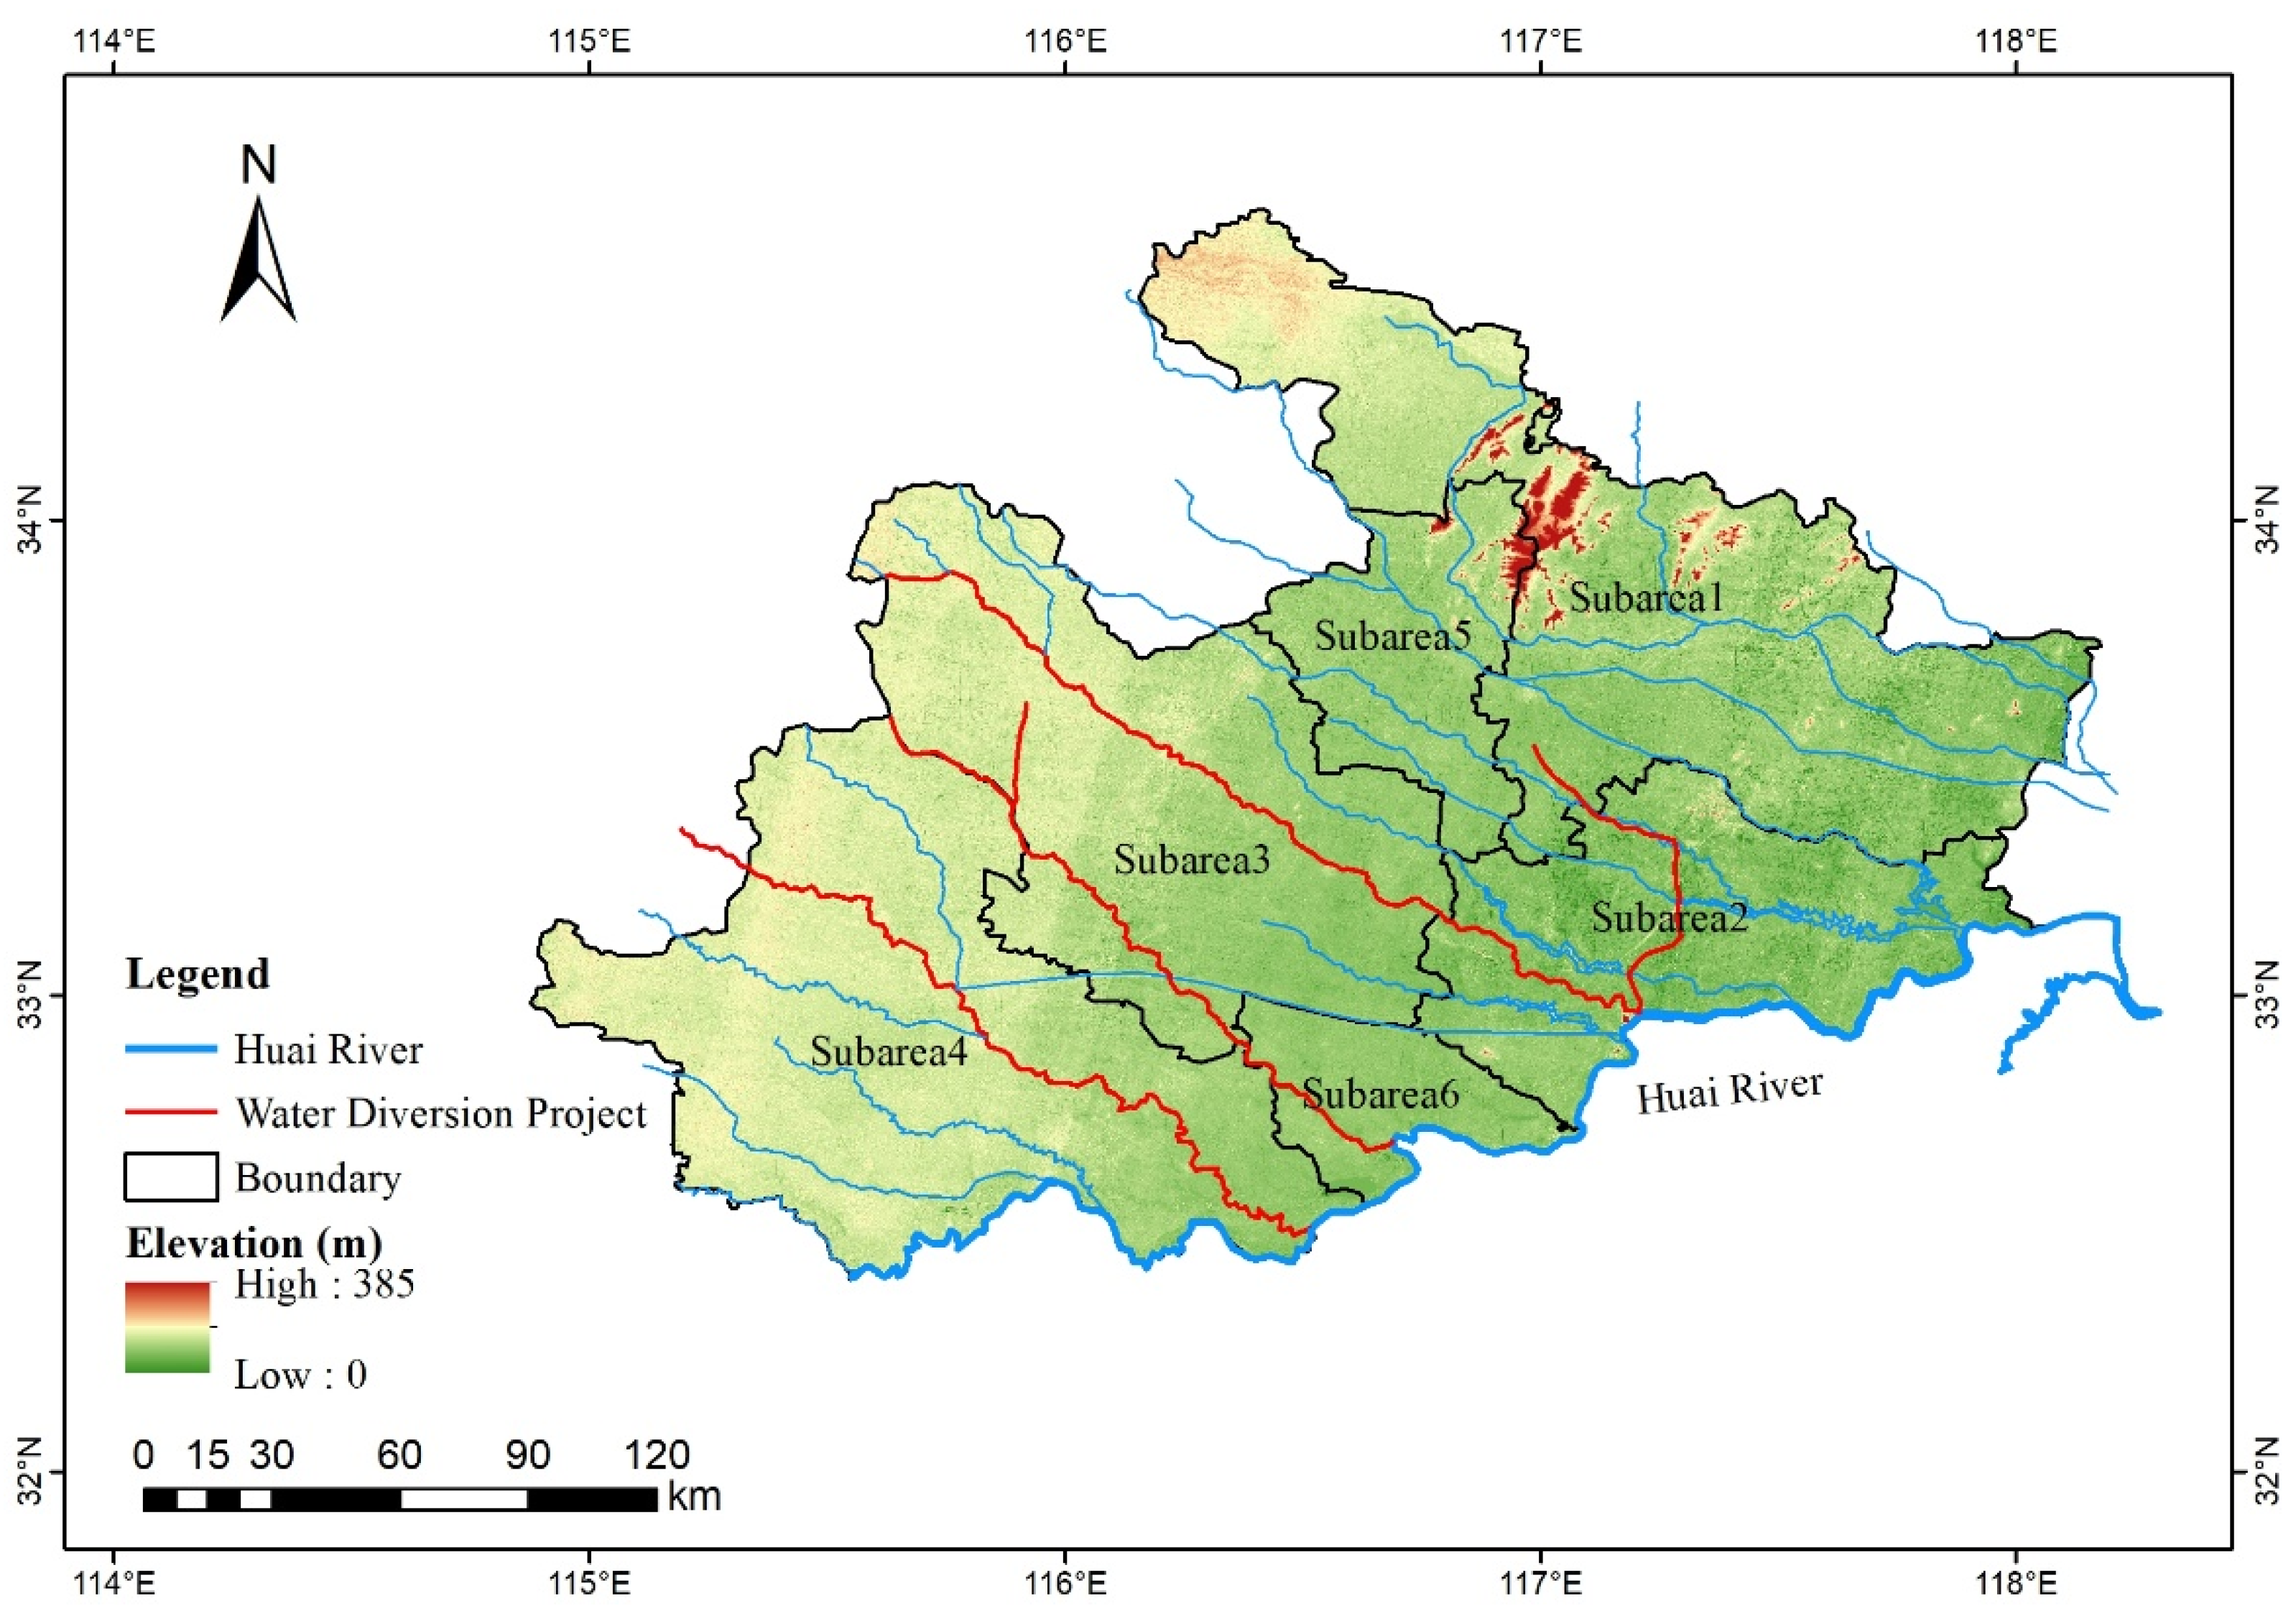
2.1. Study Area and Data Collection

The Huaibei agricultural irrigation (HAI) district is located north of the Huai River in Anhui Province, China. It is part of the North China Plain—the largest plain in China. The HAI district includes six sub-irrigation areas (Huaibei, Fuyang, Suzhou, Bozhou, Huainan, and Bengbu) with a total area of 3.76 × 10⁴ km2 (Figure 1, Table 1). The region features a monsoon climate with dry winters and hot summers [35]. The average annual temperature is 14–15 °C, and the annual precipitation is 770–950 mm, resulting in frequent alternations between droughts and floods [36]. As the largest commercial grain production base in Anhui Province, the district primarily practices dryland farming, with a cropping system of two harvests per year or three harvests every two years. The district accounts for 47.8% of the province’s cultivated land, dominated by winter wheat, corn, and soybeans, contributing over 40% of the province’s grain output and 2.5% of the national total [37], making it a critical region for ensuring China’s national food security.
As a large-scale agricultural irrigation district, limited water resources in the HAI district are predominantly allocated to agricultural production, with agricultural water use accounting for over 80% of the total, while the remaining share is distributed among the industrial, domestic, and environmental sectors [38]. The per capita water availability is only 450 m3, which is less than one-fourth of the national average, classifying the region as one of the most severely water-scarce areas in China [39]. Severe groundwater over-extraction has led to an average annual decline in water levels of 1.2 m. Under future climate change scenarios, the region faces heightened agricultural drought risks [40]. Given the limited total water resources, optimizing regional water allocation to maximize overall benefits is imperative.
The Yangtze-to-Huai River water diversion project is a national key water conservancy project that transfers water from the Yangtze River basin to the Huai River basin through canals [41] (Figure 1). The total length of the water transfer line is 723 km [42], and the project’s first phase was tested for water passage at the end of 2021. The water-receiving area involves 55 counties in the Anhui and Henan provinces, covering a total area of 7.06 × 10⁵ km2 [42]. Once completed, the project will effectively alleviate the shortage of drinking water and agricultural irrigation water in the northern Anhui and eastern Henan regions, as well as improving the ecological environment of the Huai River basin [43].
Data on surface and groundwater resources, the relationship between groundwater depth and storage, and water use quantity were obtained from the Anhui Provincial Water Resources Bulletin (1999–2023) [38]. Water use economic benefits and missing data for certain years were supplemented using the Anhui Statistical Yearbook (2000–2024) [44]. Data on inter-basin water diversion projects were referenced from related studies [43].

2.2. Water Diversion Capacity and Related Ecological Water Table

A water diversion project can alleviate water scarcity and alter groundwater balance in an irrigation district, which might affect the groundwater table and trigger secondary ecological and environmental issues. Both excessively deep and excessively shallow groundwater tables pose ecological risks in irrigation areas [45]. In terms of the Yangtze-to-Huai River water diversion project, a feasible strategy for reducing ecological risks is source water substitution. The principle of the strategy is to incorporate diverted water into the district’s supply system for allocation among various water use sectors, thereby freeing up a portion of the previously used groundwater resources for groundwater recharge and water table restoration.
The water allocation volumes for the HAI district in 2030 and 2040 were determined based on the planning of the Yangtze-to-Huai water diversion project [42], representing allocations in a normal hydrological year. The allocation ratios for wet, normal, and dry years were derived from reference [43], which facilitated the determination of water allocation volumes for wet and dry hydrologic years. The wet, normal, and dry years corresponded to flow frequencies of 25%, 50%, and 75%, respectively. Considering uncertainties such as water intake capacity at the canal head, conveyance losses, additional inflows, and recipient area acceptance, the allocation volumes were defined with a ±20% variation range (Table 2).
The HAI district primarily relies on groundwater as its main water source. The exploitation and utilization of water resources can lead to fluctuations in groundwater tables, affecting plant growth and regional environmental conditions. Therefore, it is necessary to determine the groundwater table range that minimizes adverse ecological impacts based on different ecological objectives, and subsequently define the corresponding groundwater resource availability. On the one hand, located in a semi-arid-to-semi-humid region, excessively shallow groundwater tables in the district may induce waterlogging, root anoxia, or soil salinization [46]. The shallowest water table depth to prevent salinization is set at 2 m [47]. On the other hand, deep groundwater tables may trigger ecological degradation [48]. In this case, the maximum depth suitable for plant growth in the district should not exceed 4 m [49]. For crops, there exists an optimal water table depth range for maximum yield, which is between 1.5 and 3 m in the Huaibei region [50]. Since local crops primarily depend on irrigation and shallow soil water, rather than groundwater replenishment [51], the impact of crop growth on groundwater tables is not considered in this study. Consequently, the groundwater depth range for the HAI district, considering ecological constraints, is determined to be 2–4 m (Table 3).
The corresponding groundwater resource availability can be derived based on the relationship between groundwater table fluctuations and storage capacity in the district. Determining the quantity of water to be substituted as a result of the water diversion project is crucial for achieving ecological protection targets. By analyzing the average groundwater depth during wet, normal, and dry years, the corresponding water resource availability can be determined, allowing for the calculation of water deficits in the district under ecological constraints (Table 3).
Additionally, parts of the HAI district face severe groundwater over-extraction issues, with an average annual over-extraction volume of 2.16 × 10⁸ m3. After the commissioning of the Yangtze-to-Huai River water diversion project, a portion of the diverted water will be allocated for groundwater recharge, which may exacerbate water shortages in the agricultural irrigation system. Therefore, to accurately reflect regional water resource availability, the exploitable groundwater resources must be adjusted by deducting the corresponding over-extraction volume.

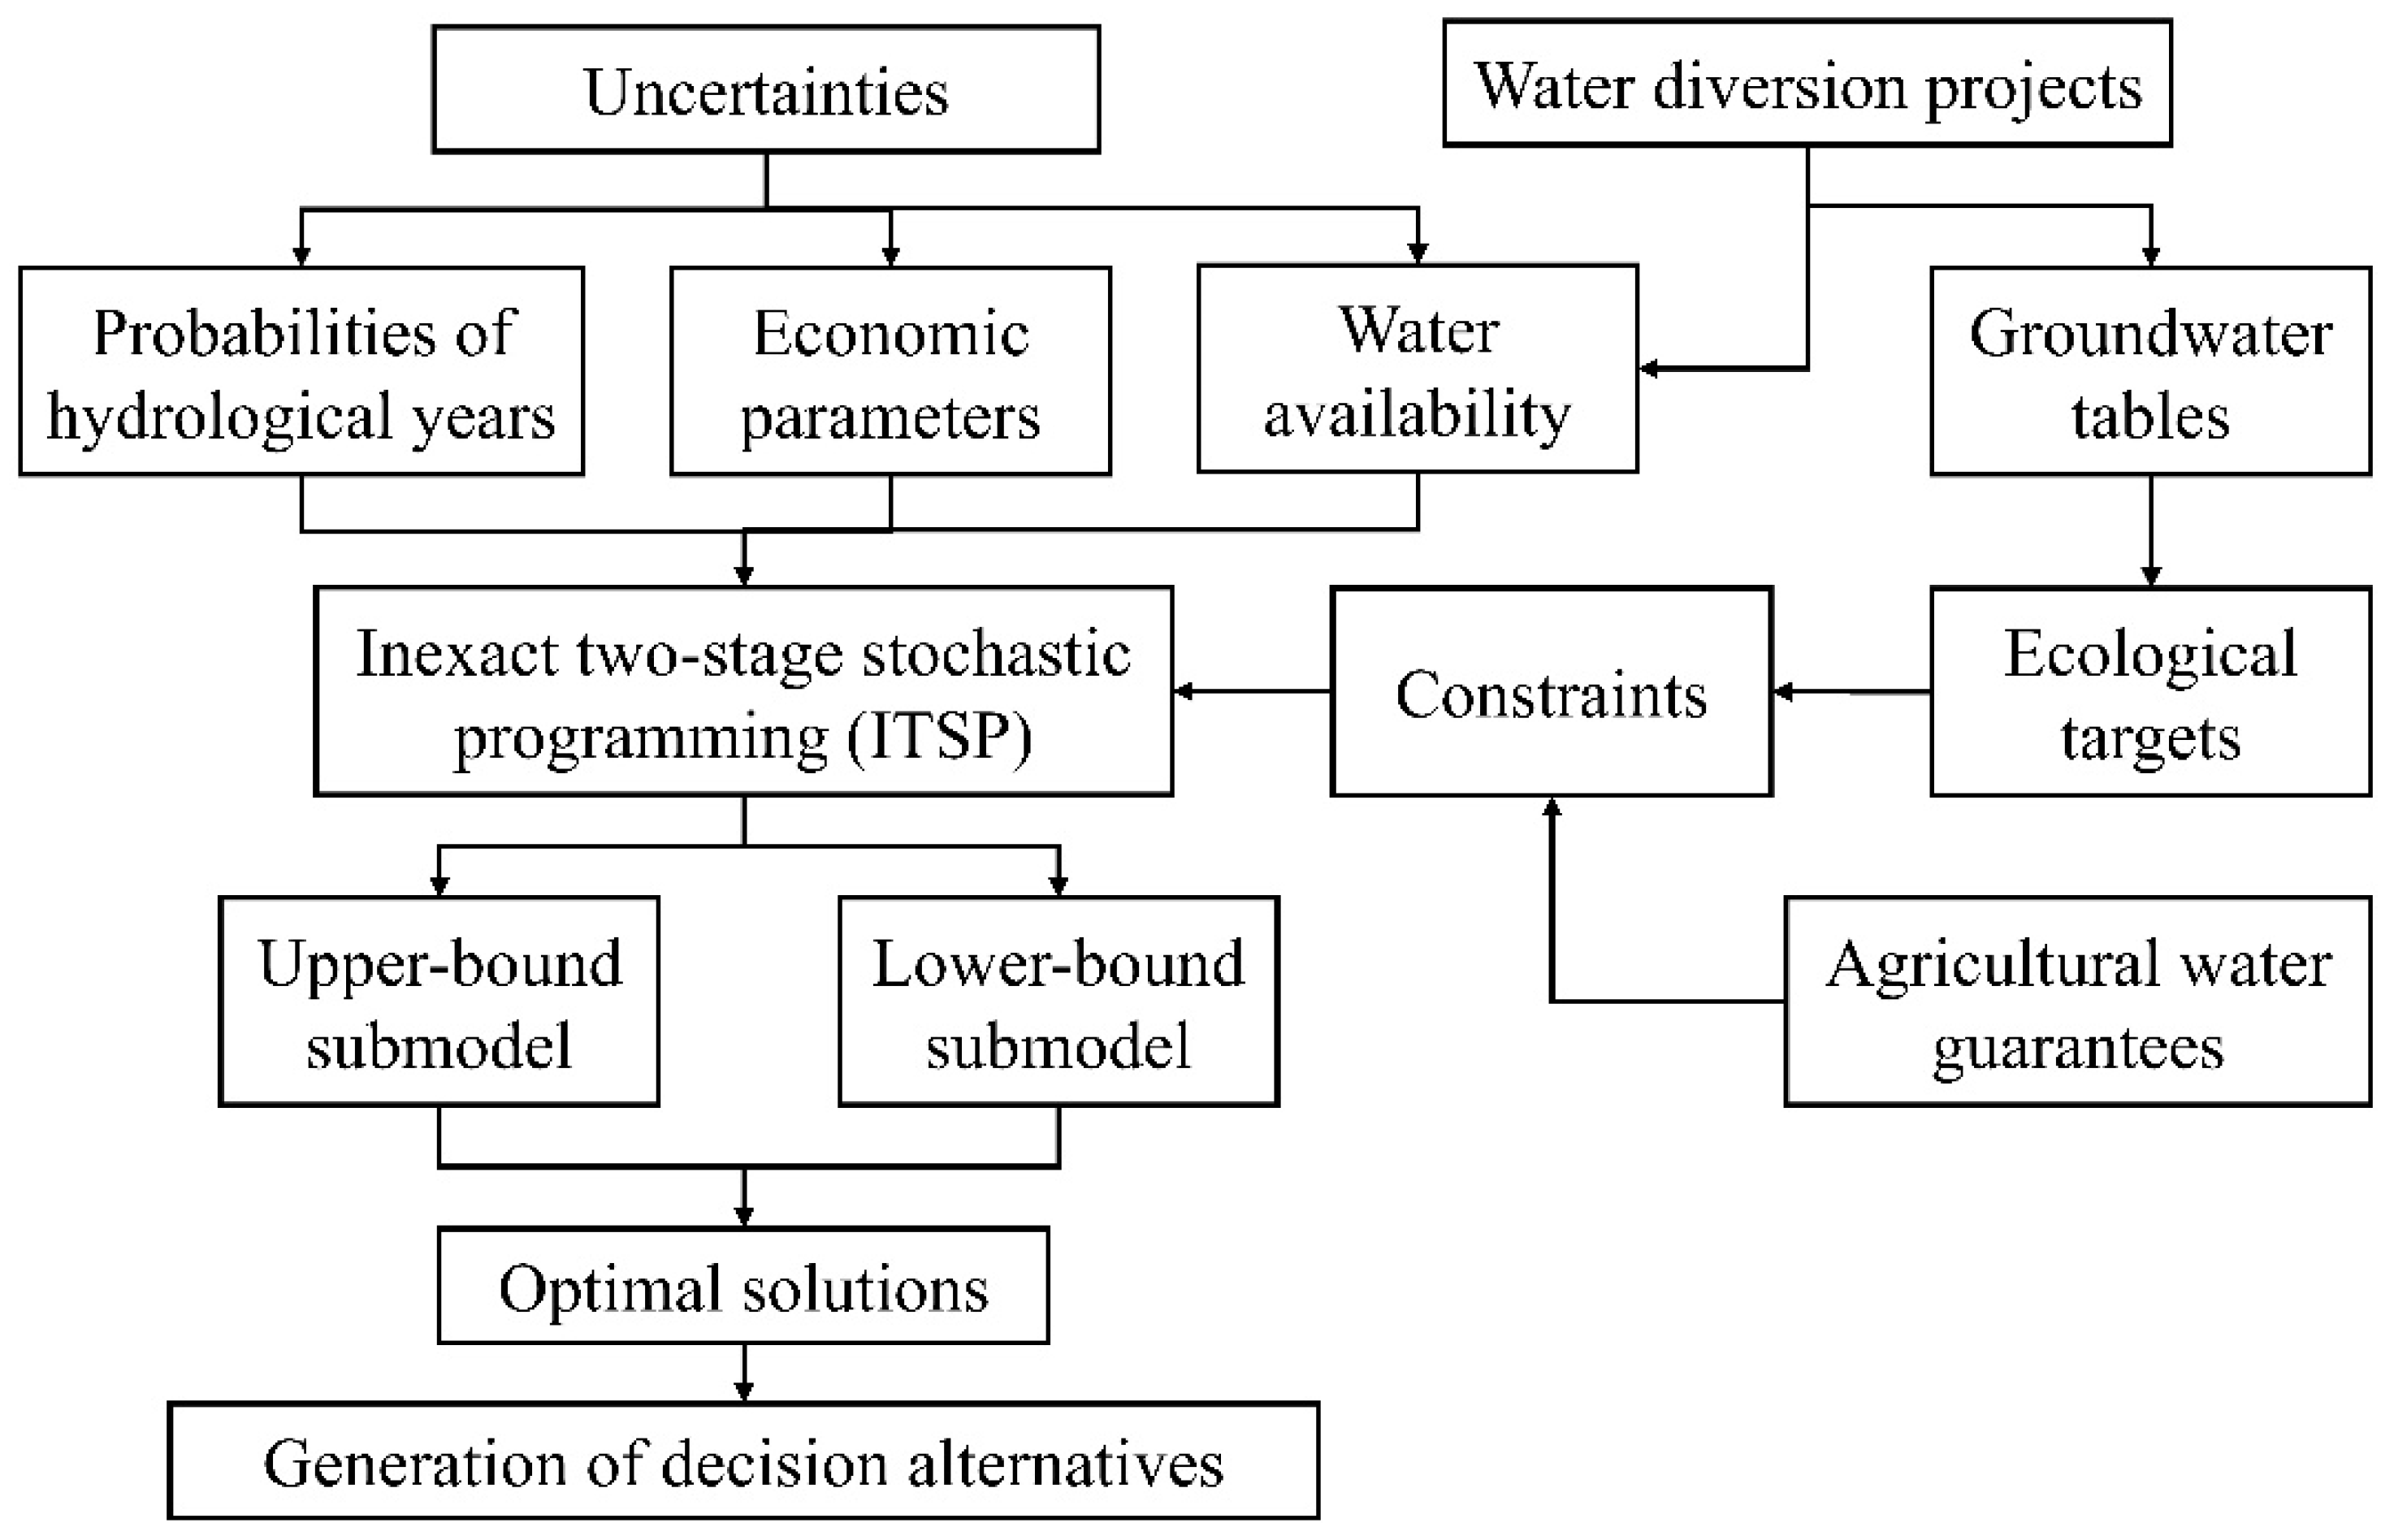
2.3. Two-Stage Stochastic Programming

When addressing diverse policy scenarios for water resource allocation under uncertainties in hydrological data and economic parameters, the two-stage stochastic programming (TSP) approach demonstrates superior performance [52]. The approach is decomposed into two stages: the first stage involves initial decision-making prior to the realization of stochastic events such as runoff, while the subsequent stage implements adjustments to the initial decisions based on observed outcomes [33]. As recourse actions in the second stage may deviate from the first-stage targets and thereby lead to associated penalties, the second-stage decisions aim to minimize these deviations [53]. The general formulation of the TSP model is expressed as follows:
z = m a x C T X E ω ϵ Ω [ Q ( X , ω ) ]
subject to
x ϵ X
Q X , ω = m i n f ( ω ) T y
D ω y h ω + T ( ω ) x
Here, x and y represent the first-stage and second-stage decision variables, respectively, with X ∈ Rn1, C ∈ Rn2, Y ∈ Rn3. The symbol ω denotes the random variable in the probability space (Ω, F, P), where Ω ∈ Rn1, f: Ω → Rn2, h: Ω → Rm2, D: Ω → Rm2×n2, T: Ω → Rm2×n1. Let the random variable take discrete values ωh, with corresponding probabilities ph (h = 1, 2, …, υ and ∑ph = 1). Model (1) can then be reformulated as follows:
max f = C T 1 X h = 1 H p h D T 2 Y
subject to
A r 1 X + A r 2 Y ξ h ,   r 1 , r 2 M ,   M = 1 , 2 , , m , h
x j 0 , x j X , j = 1 , 2 , , n 1
y j h 0 , y j h X , j = 1 , 2 , , n 2
In practical decision-making, certain uncertainties cannot be adequately characterized by probability distributions, but can be represented as interval ranges. For instance, X ± = X , X + = [ a X | X a X + ] . Under such conditions, the aforementioned Model (2) can be reformulated into an inexact two-stage stochastic programming (ITSP) model:
max f ± = C T 1 ± X ± + h = 1 H p h D T 2 ± Y ±
Subject to
A r 1 ± X ± + A r 2 ± Y ± ξ h ± , r 1 , r 2 M ; M = 1 , 2 , , m
A r 3 ± X ± + A r 4 ± Y ± B ± , r 3 , r 4 M ; M = 1 , 2 , , m
x j ± 0 , x j ± X ± , j = 1 , 2 , , n 1
y j h ± 0 , y j h ± Y ± , j = 1 , 2 , , n 2 , h
Model (3) can be solved through three steps. Step 1: Convert the decision variables or represent the first-stage interval variable X ± as a deterministic form X ± = X ± + Δ X z , Δ X = X + X ,   0 z 1 . Step 2: Solve the upper-bound submodel (f+) and obtain the optimal lower-bound solution X o p t + . Step 3: Solve the lower-bound submodel (f) based on the results of f+, and derive the optimal upper-bound solution X o p t . The final interval solutions are given as X o p t ± = [ X o p t , X o p t + ] and f o p t ± = [ f o p t , f o p t + ] .

2.4. The Water Resource Optimization Allocation Model in the Huaibei Agricultural Irrigation District

An ITSP-based water resource optimization allocation model was developed for the HAI district to allocate water resources among four sectors (agricultural, industrial, domestic, and ecological) across six cities in the Huaibei Plain under uncertainties. The model incorporates the impacts of water diversion projects on the total available water resources and groundwater table fluctuations on ecological constraints in the irrigation area, aiming to maximize the economic benefits of the agricultural water resource system. The objective function is formulated as follows:
max f ± = i = 1 4 j = 1 6 b i j ± T i j ± + i = 1 4 j = 1 6 p h c i j ± D i j ±
Subject to the following:
Total water availability constraint:
i = 1 4 j = 1 6 ( T i j ± D i j ± ) j = 1 6 B j h ± + j = 1 6 F j h ±
Groundwater availability constraint:
i = 1 4 j = 1 6 λ ( T i j ± D i j ± ) j = 1 6 G j h ±
Water deficit relationship constraint:
0 D i j ± T i j ± T i m a x ±
Ecological constraint:
D i j ± E h ±
Agricultural water guarantee constraint:
D 3 j ± ( 1 α h ) T 3 j ±
i = 1, 2, 3, 4: agricultural, industrial, domestic, and ecological sectors; j = 1, 2, …, 6: sub-agricultural irrigation areas (Suzhou, Bengbu, Bozhou, Fuyang, Huaibei, Huainan); B j h ± : the total available water resources in region j under hydrological year h; F j h ± : the water diversion volume from the Yangtze-to-Huai project; T i   m a x ± : the maximum allocable water for the sector; G j h ± : groundwater availability; E h ± : the ecological water requirement corresponding to groundwater table constraints; λ : the proportion of groundwater availability out of the total water resource availability, calibrated as 0.33, based on historical water resource data from [54]; α h : the agricultural water guarantee rate, with values set to 70%, 80%, and 90% for wet, normal, and dry hydrological years, respectively.
For Model (4), the decision variables can be converted as T i j ± = T i j + Δ T i j y i j , Δ T i j = T i j + T i j , 0 y i j 1 . First, we solve the upper-bound submodel:
max f + = i = 1 4 j = 1 6 b i j + T i j + + i = 1 4 j = 1 6 p h c i j D i j
Subject to
i = 1 4 j = 1 6 ( T i j + D i j ) j = 1 6 B j h + + j = 1 6 F j h +
i = 1 4 j = 1 6 λ ( T i j + D i j ) j = 1 6 G j h +
0 D i j T i j + T i m a x +
D i j E h +
D 3 j ( 1 α h ) T 3 j +
The optimal solutions y i j   o p t and D i j   o p t can be derived; then, the optimal water allocation T i j ± = T i j + Δ T i j y i j   o p t can be computed. Next, we solve the lower-bound submodel:
max f = i = 1 4 j = 1 6 b i j ( T i j + Δ T i j y i j   o p t ) + i = 1 4 j = 1 6 p h c i j + D i j +
Subject to
i = 1 4 j = 1 6 ( T i j + Δ T i j y i j   o p t ) j = 1 6 B j h + j = 1 6 F j h +
i = 1 4 j = 1 6 λ ( T i j + Δ T i j y i j   o p t D i j + ) j = 1 6 G j h
D i j   o p t D i j + T i j + Δ T i j y i j   o p t
D i j + E h
D 3 j + ( 1 α h ) T 3 j
The optimal solution D i j   o p t can be obtained. The final solutions of Model (4) are expressed in interval form as f o p t ± = [ f o p t , f o p t + ], D o p t ± = [ D o p t , D o p t + ].
Figure 2 shows the general framework of this model. It is based on the ITSP technique, and the water diversion projects influence the model through water availability and the groundwater tables. Eventually, the model can generate future decision alternatives for different periods, like the year 2030 or 2040.

2.5. Water Supply–Demand in the Agricultural Irrigation District

The total water supply in the HAI district exhibits temporal fluctuations. The surface water supply ranges from [21.8 × 10⁸, 191.8 × 10⁸] m3, showing significant variability, while the groundwater supply varies within [49.4 × 10⁸, 99.6 × 10⁸] m3, with relatively stable variations over time. The long-term average annual supplies of surface water and groundwater are 90.8 × 10⁸ m3 and 68.2 × 10⁸ m3, respectively. Groundwater constitutes 42.9% of the total water supply, underscoring its indispensable role. Detailed information on the available water resources can be found in Table 4.
Future water allocation targets for various demand sectors in the agricultural irrigation district were calculated based on historical water use data. For each sector in the sub-irrigation zones, we first collected the water use volume from 1999 to 2023. Then, we established a univariate linear regression relationship between water use volume and time. Thereby, we could predict the expected water demands for the years 2030 and 2040 based on the regression model. Considering potential future changes in industrial structure, economic policies, and social development, we set the water demand as a certain interval. These demands in all the sectors and sub-irrigation zones serve as future allocation benchmarks (Table 5). The results indicate that the agricultural sector has the highest allocation target, followed by the industrial sector, with the ecological sector requiring the least allocation.
Water use economic benefits, a critical parameter in the allocation model, include both the economic revenue per unit of water allocated and the economic losses per unit of water shortage. Economic benefit coefficients for each sector were derived from statistical yearbooks [44]. Table 6 shows that the domestic water sector exhibits the highest economic benefit per unit of water, followed by industrial use, with agriculture ranking the lowest. With socioeconomic development, the economic efficiency increases from 2030 to 2040.

3. Results and Discussion

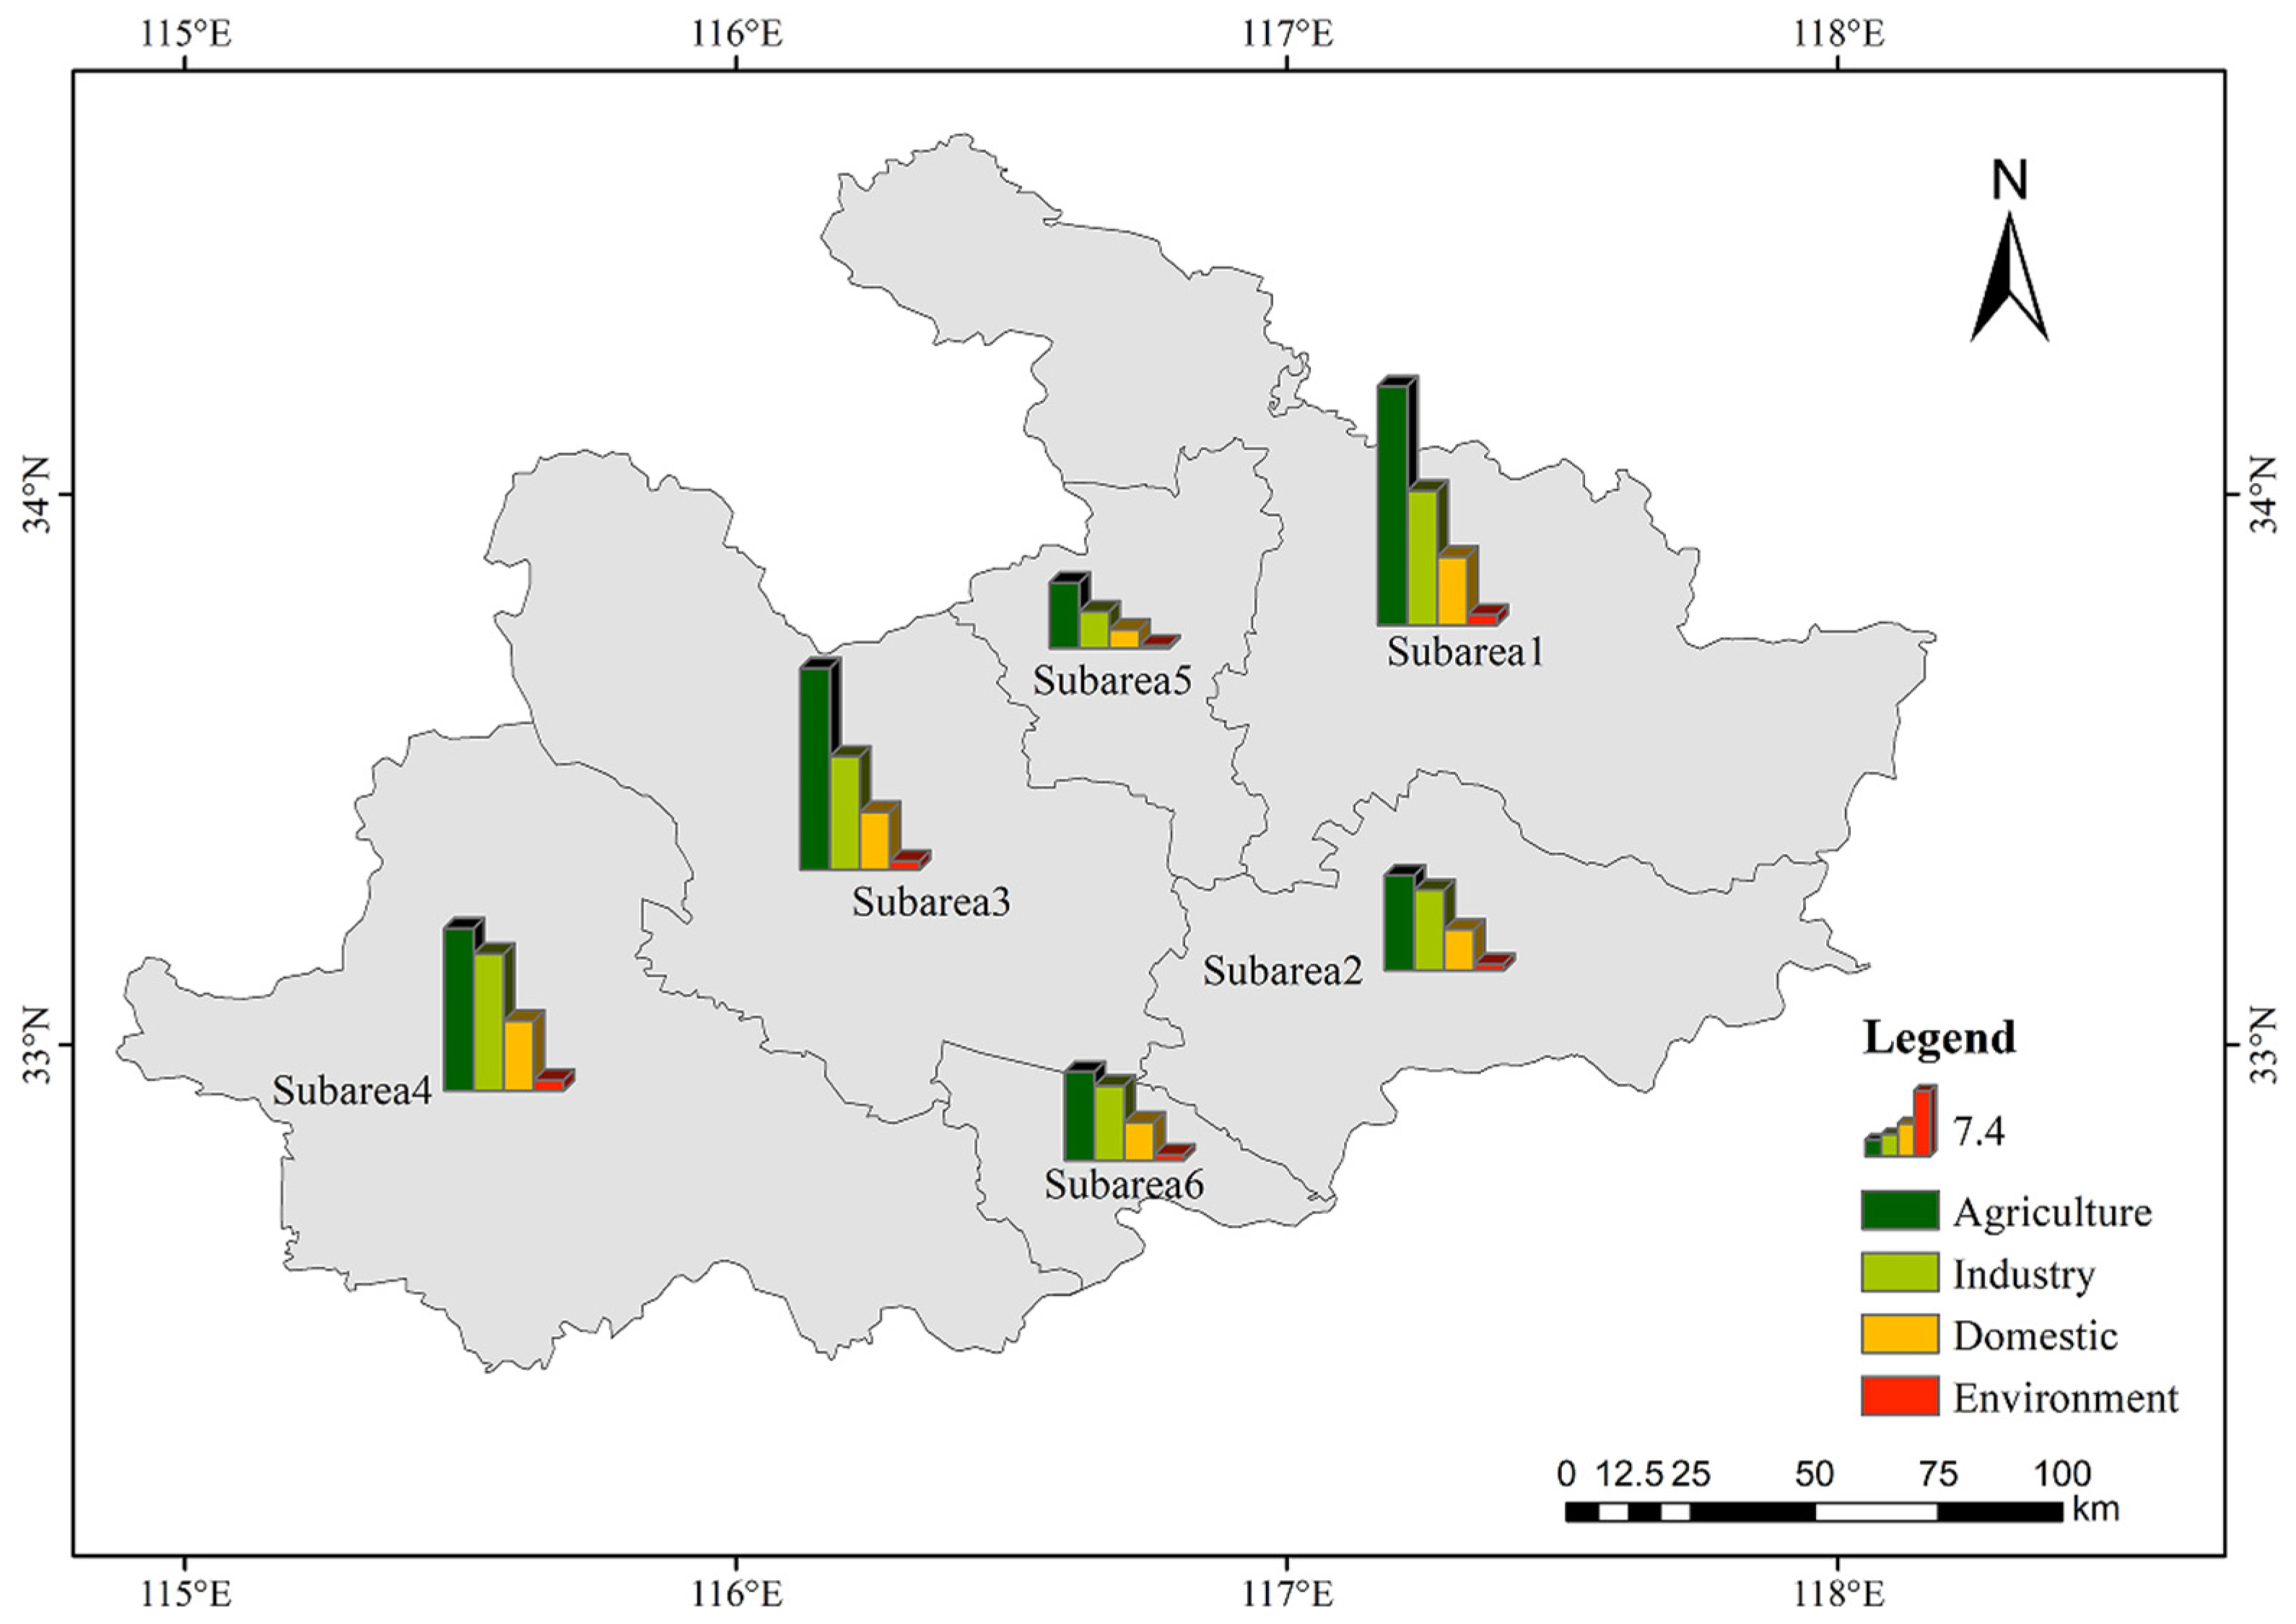
3.1. Initial Water Allocation

The initial water allocation represents the optimal first-stage configuration. As shown in Figure 3, the allocated water volumes across the demand sectors are dominated by agriculture (52.5 × 10⁸ m3), followed by industry (35.5 × 10⁸ m3), domestic use (18.1 × 10⁸ m3), and environmental needs (2.8 × 10⁸ m3). Among sub-irrigation zones, Subarea1 receives the largest total allocation (27.9 × 10⁸ m3), consistent with it having the largest irrigation area and highest agricultural water demand, due to its expansive irrigated cropland and reservoir capacity [37].
Regarding demand fulfillment, all initial allocations fall within the target demand intervals. Most allocations reach the upper bounds of their respective intervals, except for agricultural allocations in Subarea2 and Subarea6, which are set at the lower bounds, and Subarea4, where only 62.8% of the agricultural allocation interval is met. This discrepancy likely stems from the lower economic efficiency of agricultural water use compared to other sectors, leading to prioritization of limited resources for higher-value demands [55].
The total initial water allocation amounts to 108.9 × 10⁸ m3. Under water diversion project operations, the agricultural irrigation system will face water shortages in both dry and normal years, with deficits persisting even in wet years when inflows fall below the initial allocation. Without the water diversion project, severe shortages would occur across all hydrological conditions, significantly exacerbating deficits. These first-stage allocation shortfalls necessitate second-stage optimization to reallocate water among sectors and sub-irrigation zones, ensuring maximum economic benefits for the agricultural district [33].

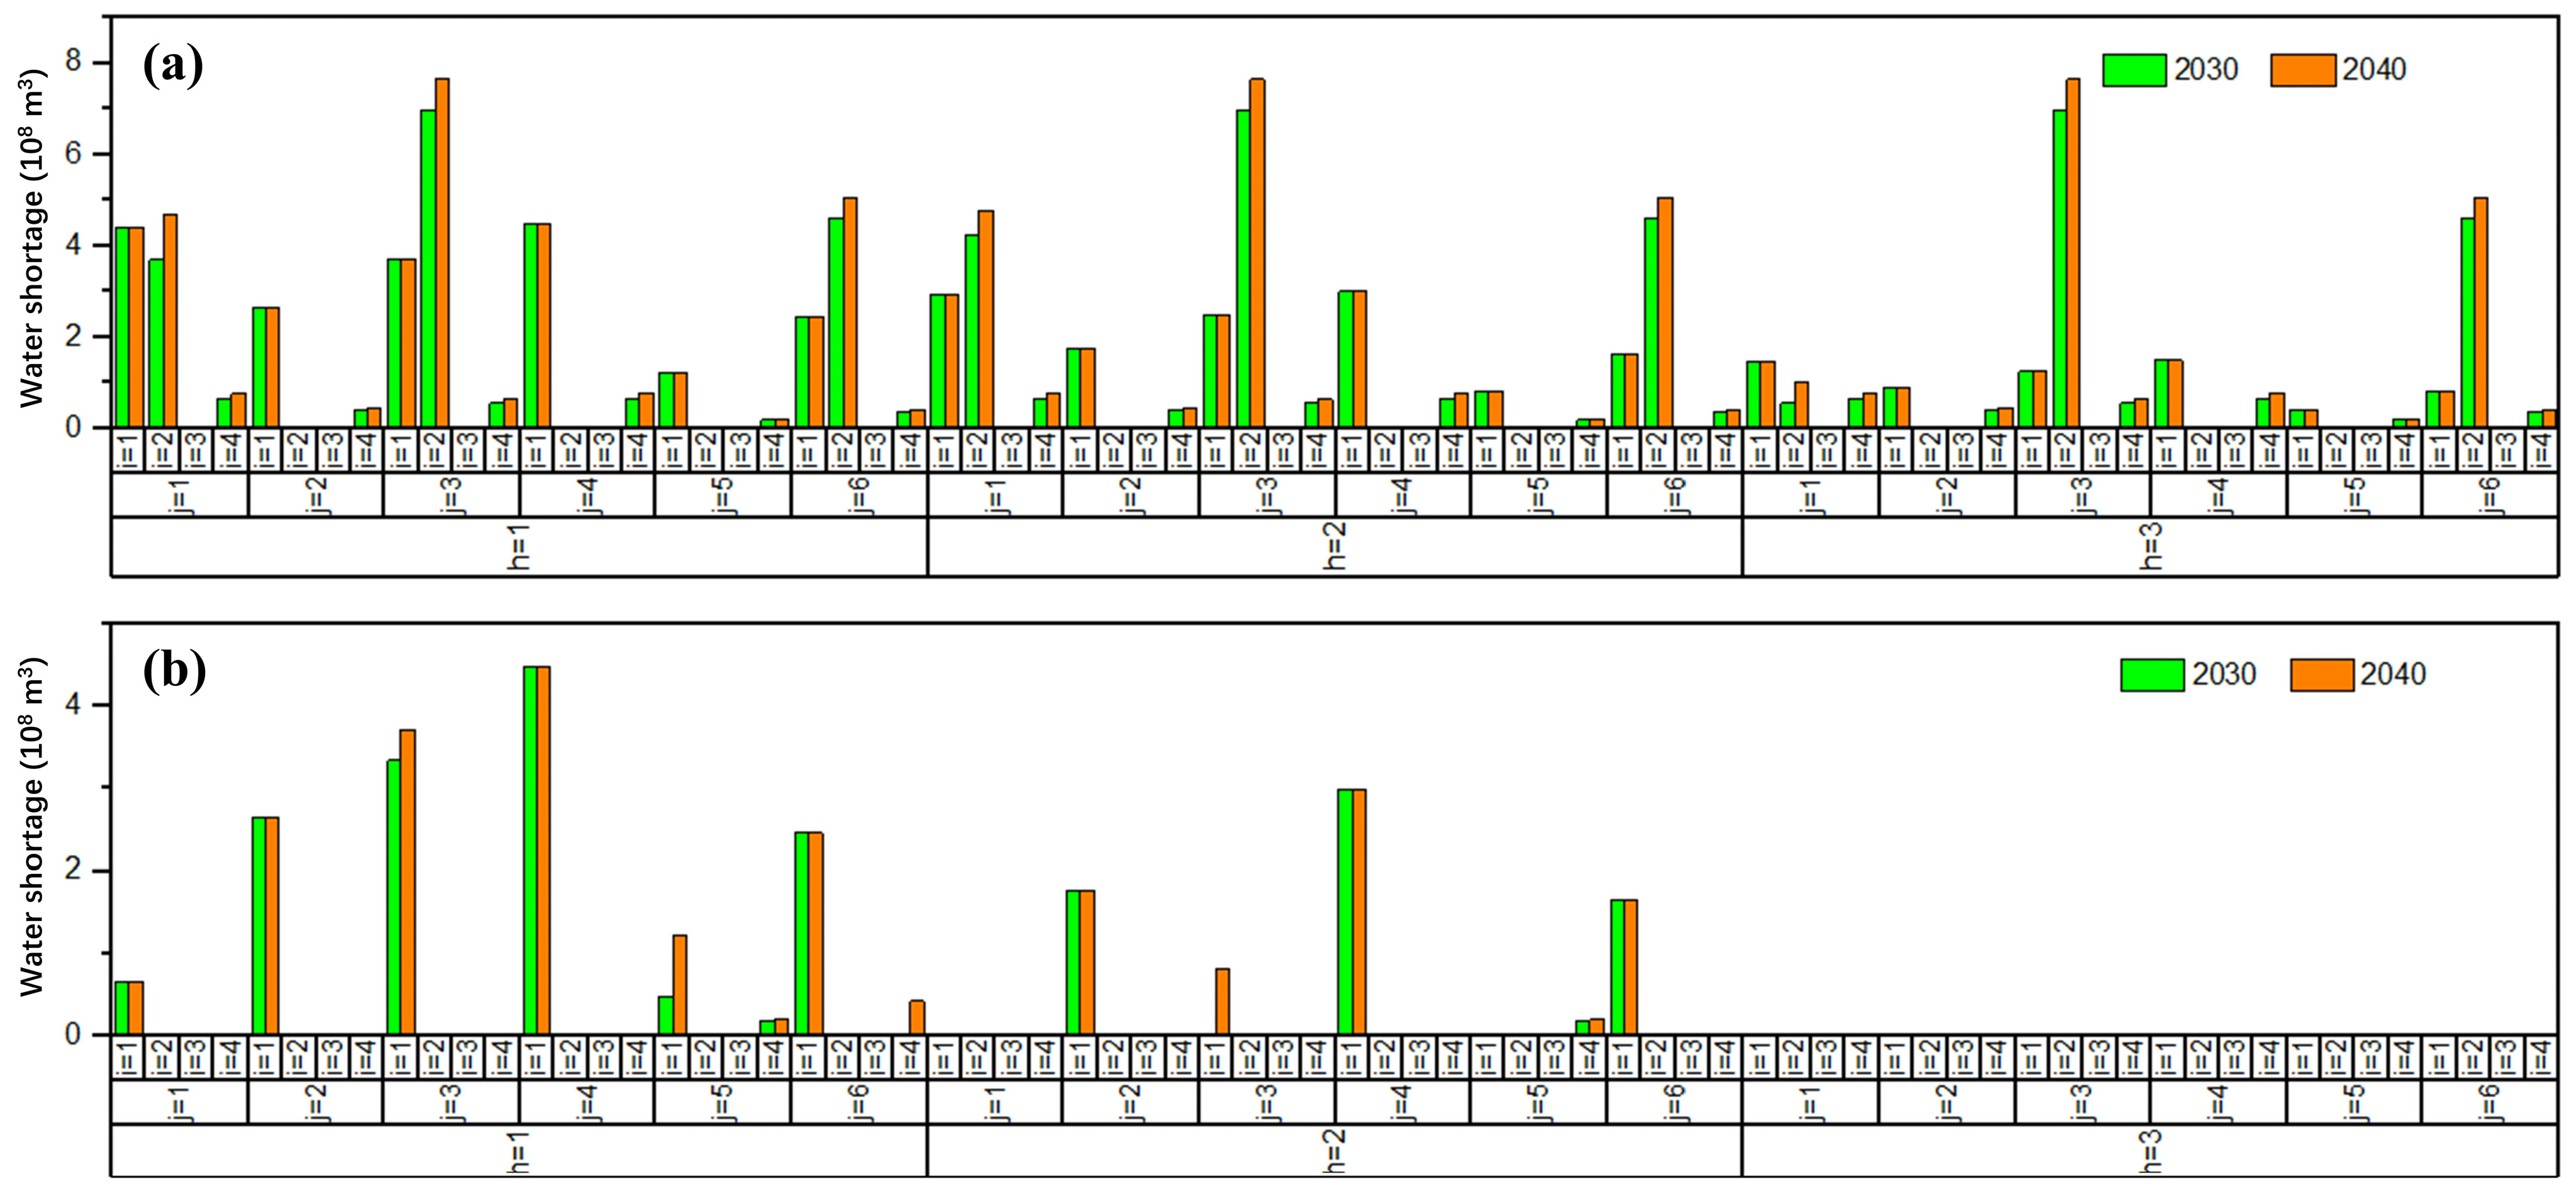
3.2. Water Deficit Amounts

The water deficits generated in the second-stage allocation reflect system state variations under prescribed uncertainties. As shown in Figure 4, the total water deficit in the agricultural irrigation district decreases with increasing water supply. Specifically, under dry hydrological conditions, deficits range from [14.3 × 10⁸, 37.0 × 10⁸] m3 in 2030 to [15.8 × 10⁸, 39.6 × 10⁸] m3 in 2040; for normal years, the values are [6.6 × 10⁸, 31.2 × 10⁸] m3 (2030) and [7.4 × 10⁸, 33.3 × 10⁸] m3 (2040); and in wet years, deficits further decrease to [0, 21.3 × 10⁸] m3 (2030) and [0, 23.3 × 10⁸] m3 (2040). Notably, despite increased diverted-water volumes from 2030 to 2040, the system-wide water deficit expands. This counterintuitive trend is likely due to accelerated water demand growth driven by socioeconomic development, which outpaces supply augmentation efforts [56].
Analysis of the sectors revealed that agriculture and industry exhibit the highest water deficits, while environmental sectors experience minimal shortages, and domestic use remains fully satisfied. As water availability decreases, agricultural deficits intensify, potentially exceeding industrial deficits. For instance, considering the upper-bound deficits in 2030 in wet years, agriculture shows 5.8 × 10⁸ m3 less deficit than industry; in normal years, the gap narrows to 0.2 × 10⁸ m3; and in dry years, agricultural deficits surpass industrial deficits by 3.6 × 10⁸ m3. This demonstrates that under the objective of maximizing regional economic benefits, lower water availability corresponds to reduced allocation priority for agriculture and increased weights for other sectors. Given the HAI district’s critical role as a national grain production base [57], here, we consider setting the agriculture water guarantee rate α h as essential. Therefore, establishing minimum allocation thresholds for agriculture or maintaining its allocation proportion during water-scarce periods are essential measures to safeguard national food security [58].

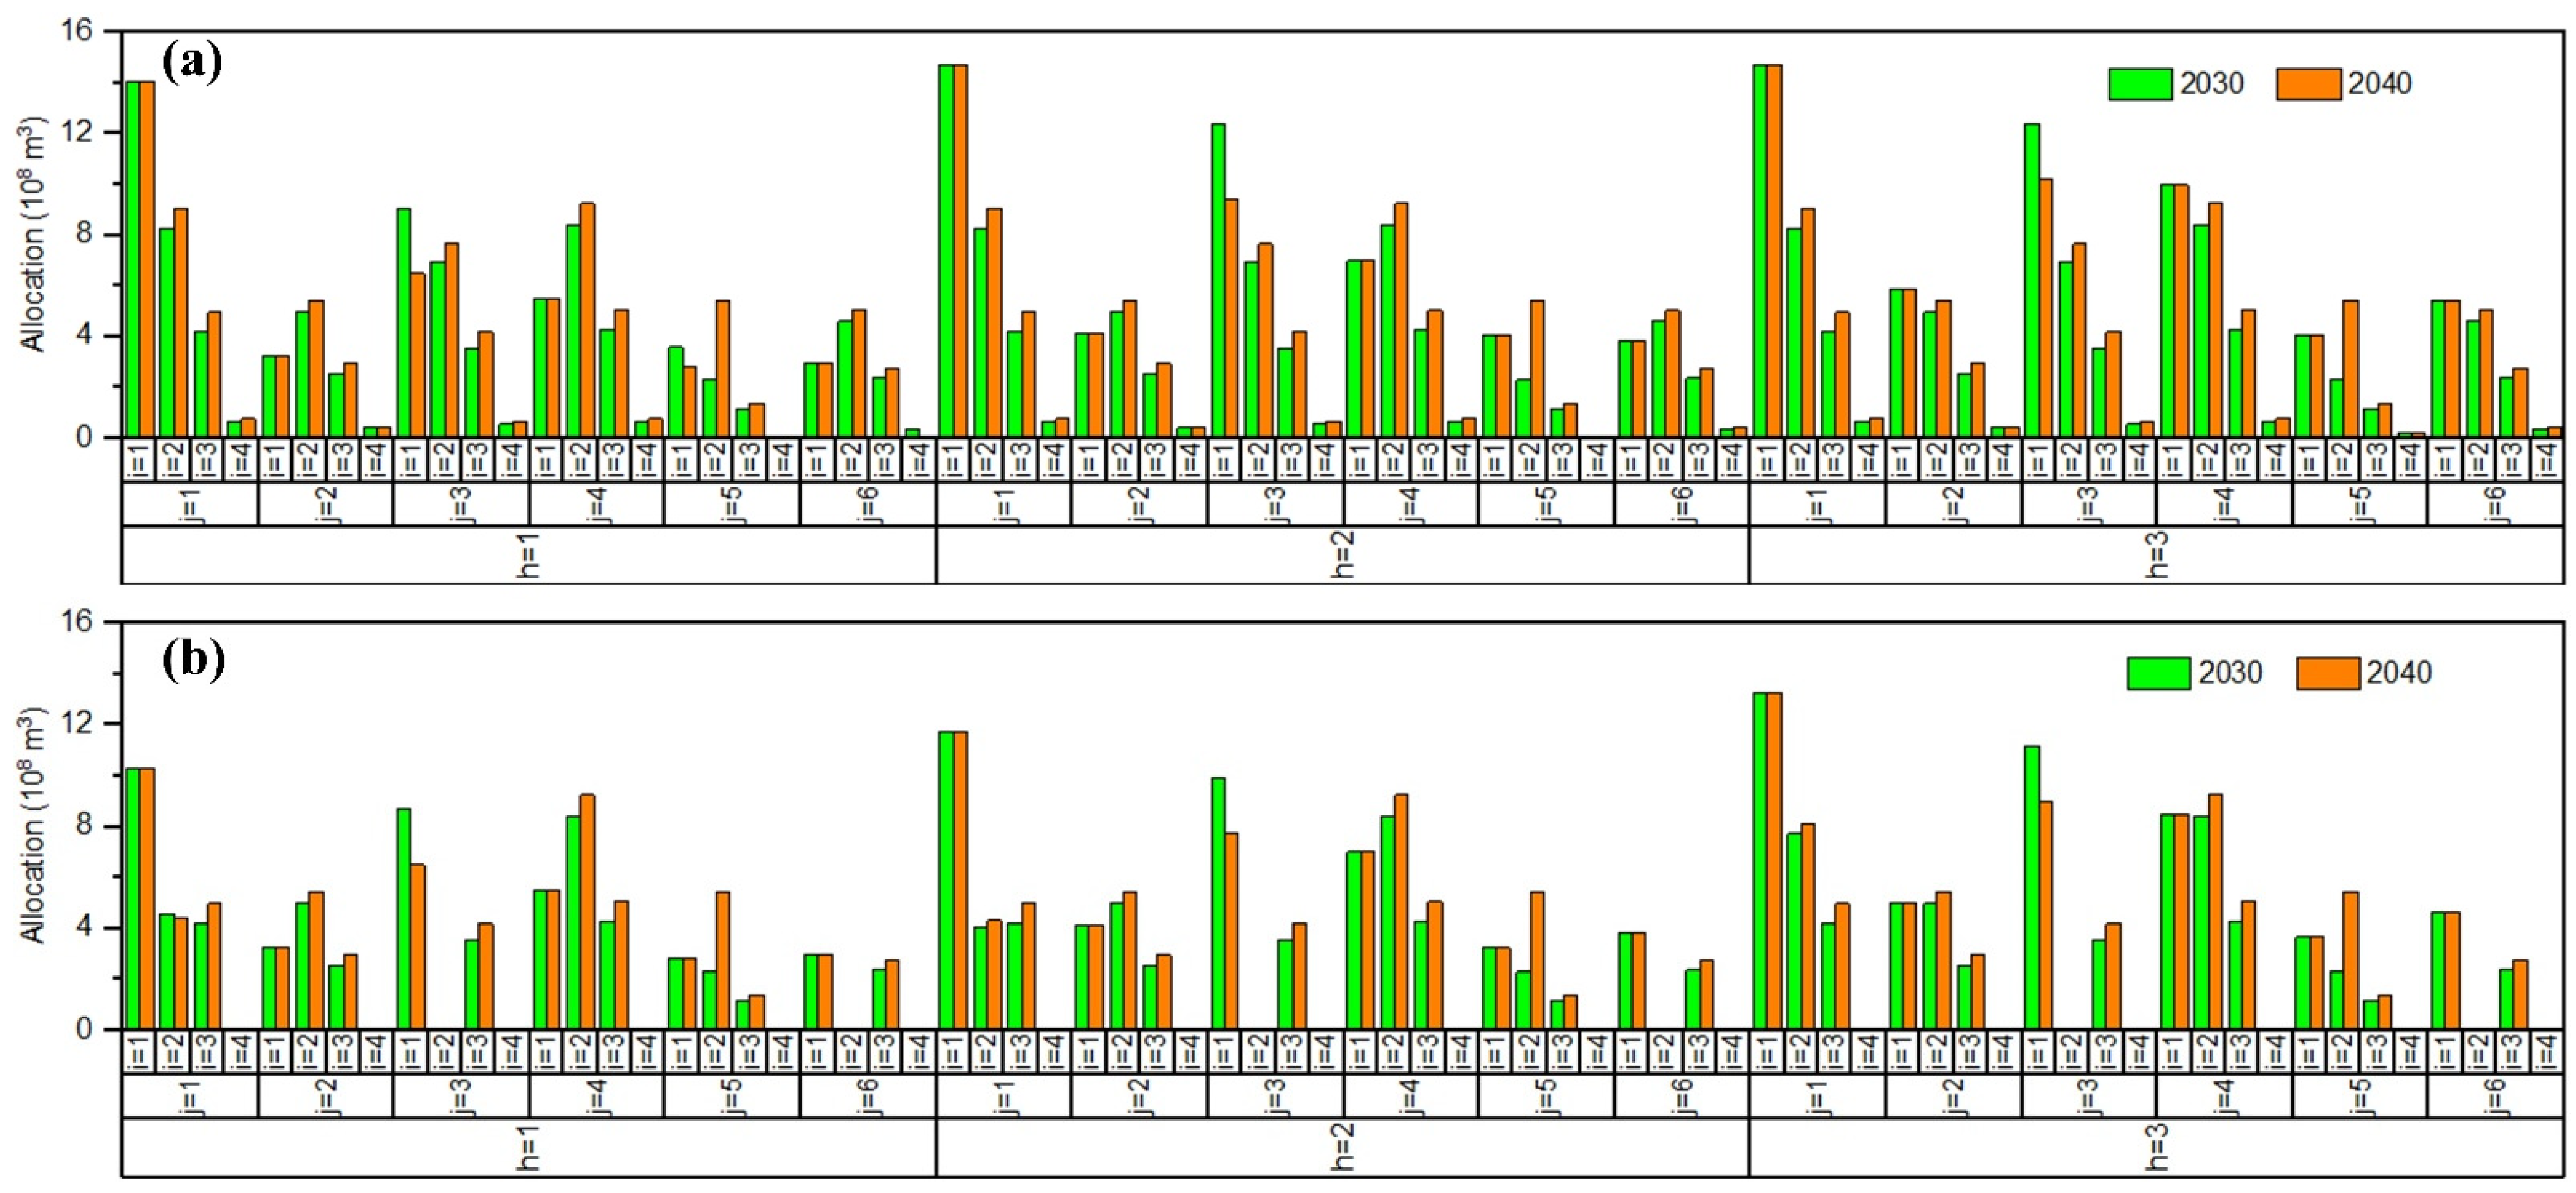
3.3. Water Allocation Strategies

Following the two-stage allocation process, disparities emerge in water allocation fulfillment across sectors. Domestic water demands are fully satisfied according to the initial optimal allocations, while industrial sub-irrigation zones with higher economic benefit coefficients also adhere to their initial optimal allocations. Other sectors or subareas deviate from the optimal configuration. Agriculture and industry remain the two largest water-consuming sectors, as seen in other regions of the world [59,60,61]. From the upper-bound perspective (Figure 5a), agriculture dominates in 2030 (≥38.4 × 10⁸ m3), followed by industry (35.5 × 10⁸ m3), aligning with the initial optimization results. However, by 2040, this trend reverses: industrial allocations surpass agricultural ones (≤36.6 × 10⁸ m3 for agriculture vs. 41.9 × 10⁸ m3 for industry), reflecting a strategic shift under the principle of maximizing total system benefits. Increased water diversion capacity and economic growth drive prioritization of industrial use due to its higher economic return per unit water.
From the lower-bound perspective (Figure 5b), agriculture consistently retains the largest allocation (≥33.5 × 10⁸ m3 in 2030; ≥31.3 × 10⁸ m3 in 2040), followed by industry (≤20.3 × 10⁸ m3 in 2030; ≤24.5 × 10⁸ m3 in 2040), regardless of hydrological conditions or time periods. This underscores the effectiveness of mandatory minimum agricultural water quotas in safeguarding irrigation security. Such measures ensure baseline water availability for agriculture, counterbalancing the economic prioritization of industrial allocations observed in upper-bound scenarios. Ensuring agricultural water allocation in agricultural irrigation districts is necessary, particularly considering that, generally, the water guarantee rate of the agricultural sector is the lowest [9].

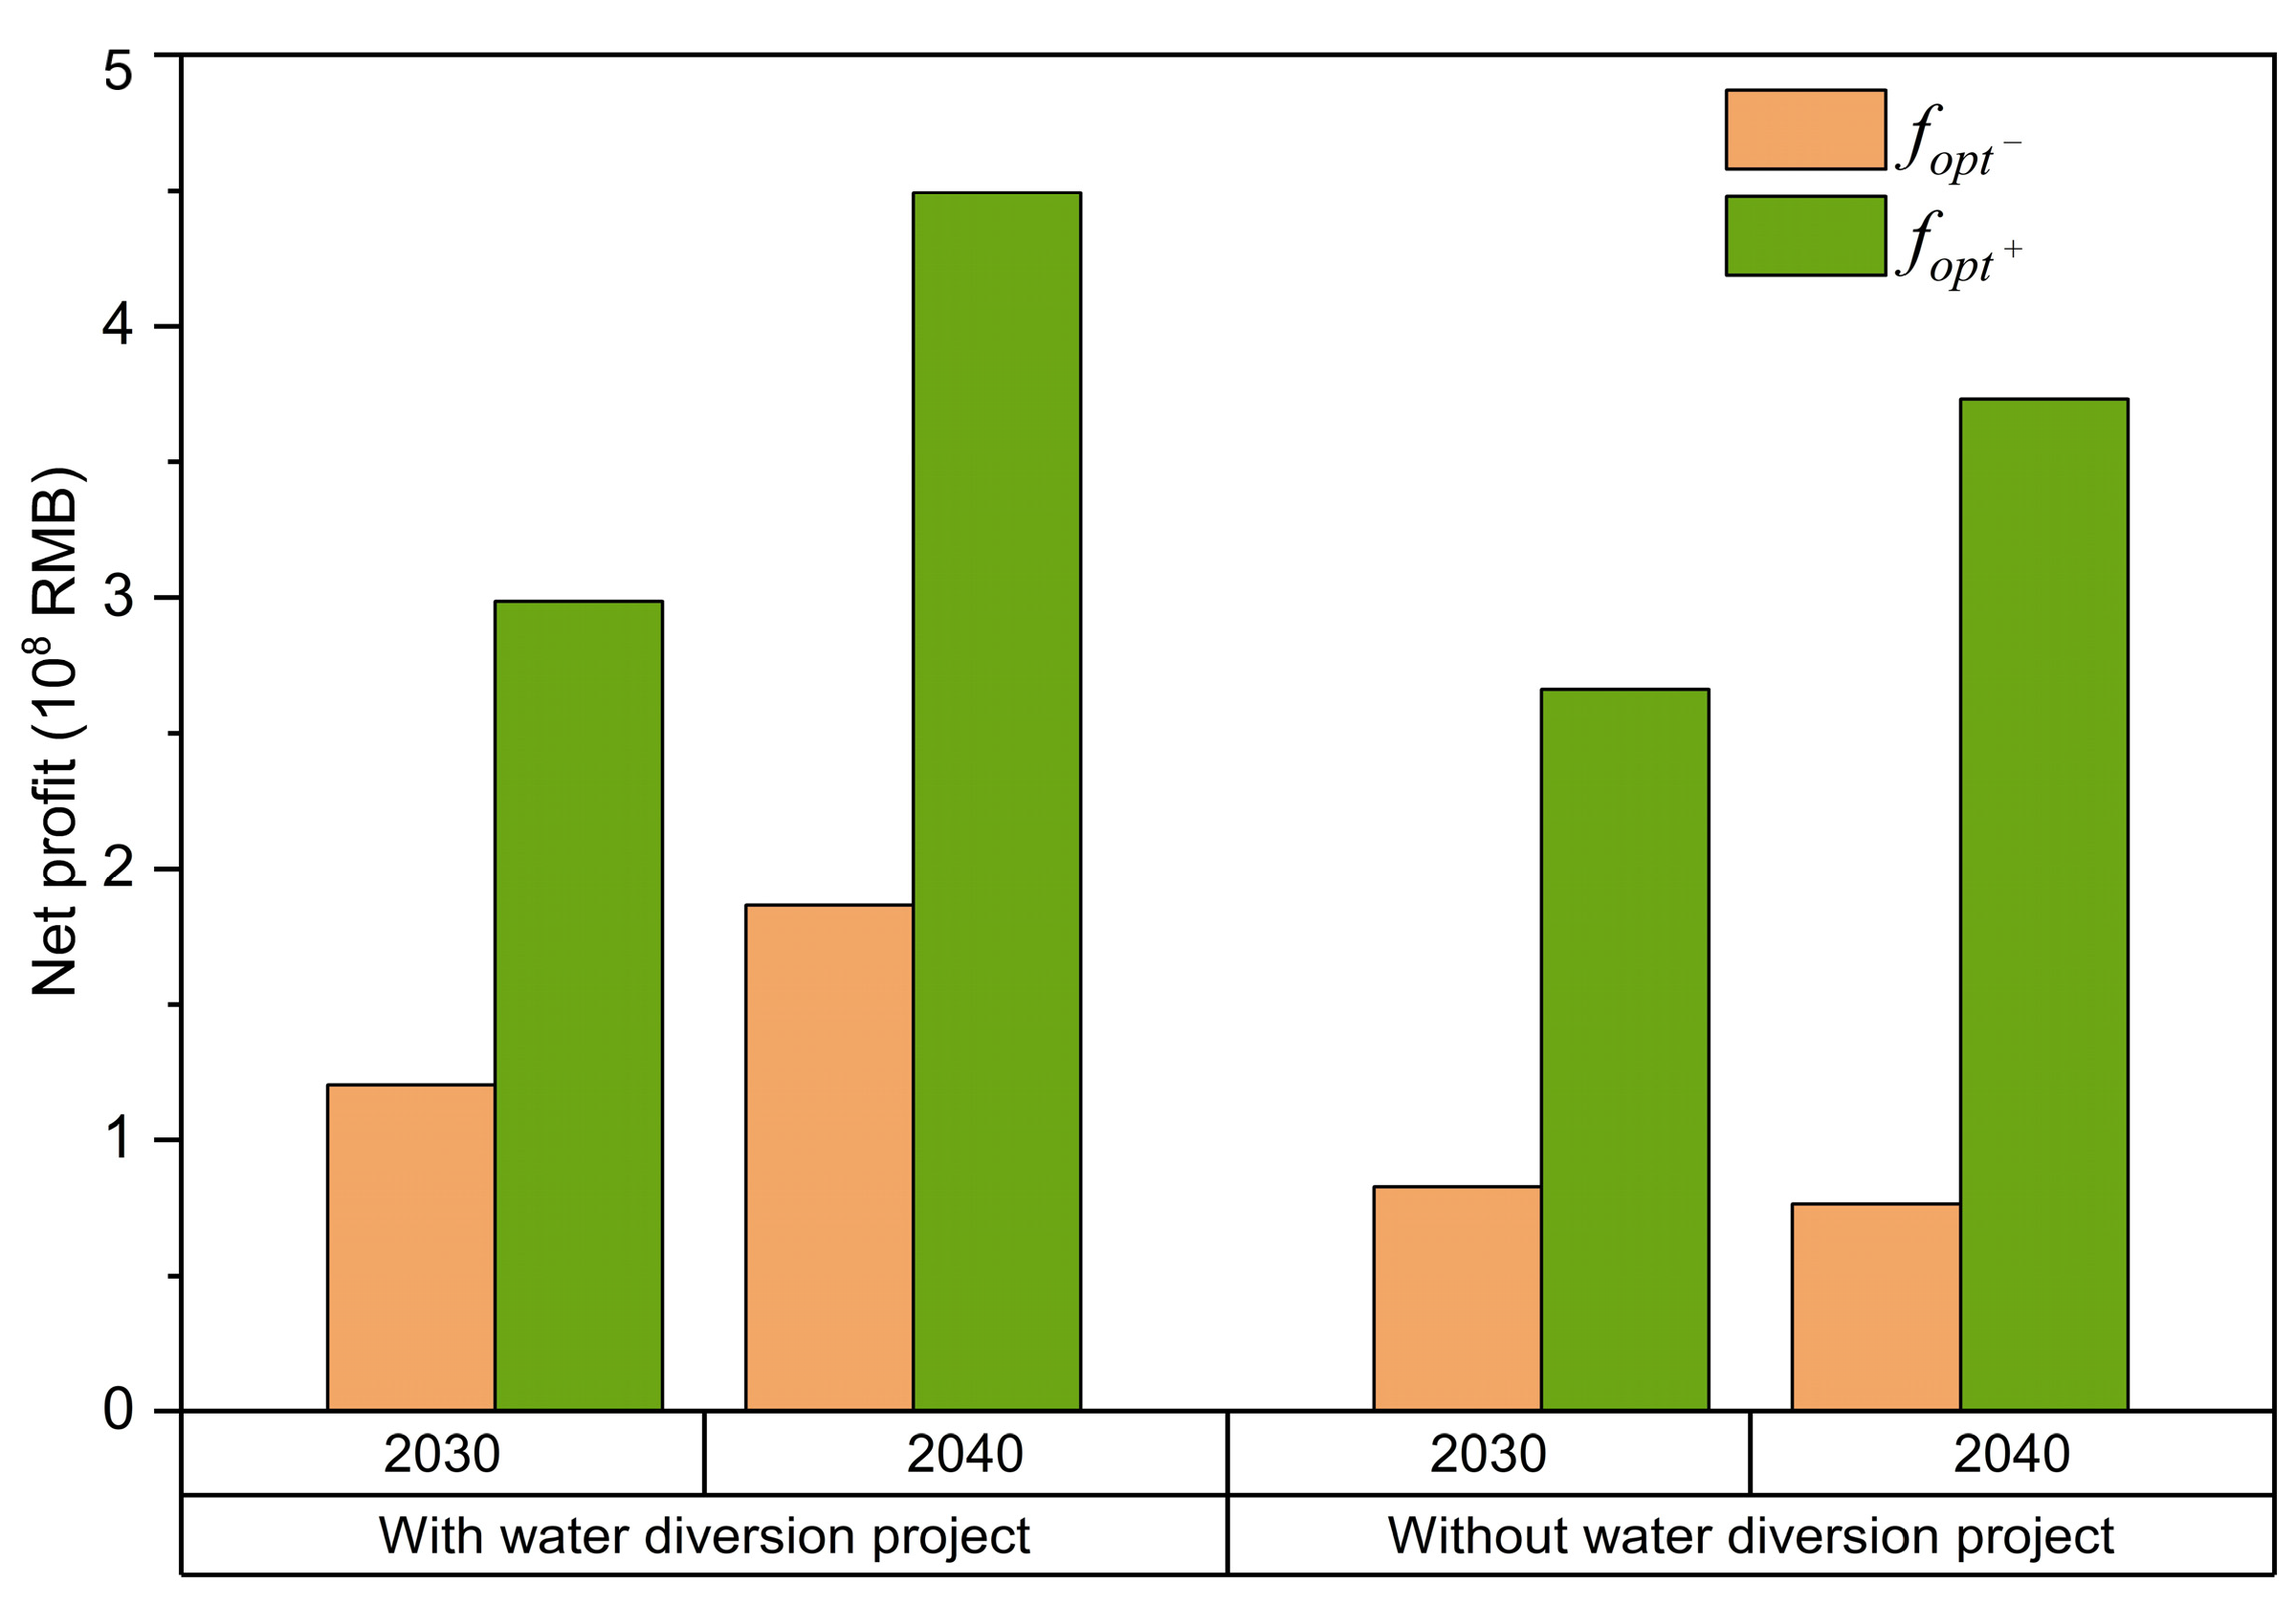
3.4. Economic Benefit Comparison

With the involvement of water diversion projects in water resource allocation, the total net economic benefits of the agricultural irrigation district are maximized across all periods. As shown in Figure 6, in 2030, the total economic benefits amount to [1.2 × 10⁸, 3.0 × 10⁸] CNY, increasing to [1.9 × 10⁸, 4.5 × 108] CNY by 2040. Without water diversion projects, the total economic benefits decline, and uncertainties expand [62]. When water diversion projects are excluded from the allocation model, the total economic benefits in 2030 drop to [0.8 × 10⁸, 2.7 × 10⁸] CNY, and further fluctuate to [0.8 × 10⁸, 3.7 × 10⁸] CNY in 2040. Compared to scenarios with water diversion, the absence of such projects reduces both the upper and lower bounds of economic benefits in the agricultural irrigation district (Figure 6). Additionally, the variability of total benefits increases: the interval lengths of the total economic benefits in 2030 and 2040 expand by 0.05 × 10⁸ CNY (from 1.8 × 10⁸ to 1.85 × 10⁸ CNY) and 0.34 × 10⁸ CNY (from 3.0 × 10⁸ to 3.34 × 10⁸ CNY), respectively. This highlights that water diversion projects not only enhance economic benefits, but also reduce uncertainty in revenue fluctuations.
Furthermore, water diversion projects ensure more sustained economic growth in the agricultural irrigation district. With water diversion, the total economic benefits in 2040 show significant growth compared to 2030. Without such projects, however, the lower bounds of the total economic benefits in 2030 and 2040 are 0.83 × 10⁸ CNY and 0.76 × 10⁸ CNY, respectively. Despite socioeconomic development, the lower bound of total economic benefits in the agricultural irrigation district does not increase, but instead declines, underscoring the critical role of water diversion projects in stabilizing and sustaining economic performance [63].

3.5. Limitations and Future Work

With the inclusion of extra-basin water diversion in the HIA region, optimized allocation through the ITSP model leads to reduced future water scarcity and enhanced overall economic benefits. However, there exist limitations in the data and methodology. Firstly, the research focuses on the allocation of water quantity, while neglecting the influence of water quality. The introduction of extra-basin runoff into the irrigation district alters the original hydrological and hydrodynamic conditions, leading to changes in the water environment situation [64,65]. Extra pollutant discharges from agricultural and industrial activities in the future could also create environmental risks, potentially compromising water allocation objectives [66]. Secondly, the study does not fully consider the impact of evolving water diversion infrastructure. While the main channel of the Yangtze-to-Huai water diversion project will be completed by 2025, supporting irrigation canal systems will remain under construction. For mid–long-term allocation planning, infrastructure issues including channel leakage [67], sediment deposition [68], and structural deterioration in both existing and new diversion works would reduce actual water delivery to sub-irrigation zones [69]. Thirdly, the simplifications adopted for model construction introduced uncertainties, including setting ± 20% fluctuation ranges for diverted water volumes and economic efficiency parameters; ignoring supply-side water reuse and demand-side changes, like crop pattern adjustments and industrial restructuring; not including construction and operation costs in the economic efficiency parameters; and omitting the impacts of climate change on hydrological processes and ecosystems. Future work will focus on integrating these influencing factors into the optimization analysis framework. For practical application, water managers should adapt the model by incorporating localized characteristics of regional water systems, anticipating climate variations, and accounting for agricultural/industrial structural evolution. Critical parameters require regional calibration to minimize uncertainties in achieving water allocation targets.

4. Conclusions

This study establishes an inexact two-stage stochastic programming (ITSP) model for the HAI district, integrating the impacts of the Yangtze-to-Huai water diversion project and its ecological influences to achieve optimal water resource allocation and maximize regional economic benefits. The key findings are as follows:
The HAI district will face increasing water scarcity risks in 2030 and 2040, with larger supply–demand gaps under conditions of lower amounts of available water. By addressing uncertainties in water availability through two-stage allocation (initial allocation and recourse adjustments), the total economic benefits will reach [1.2 × 10⁸, 3.0 × 10⁸] CNY in 2030 and [1.9 × 10⁸, 4.5 × 10⁸] CNY in 2040, balancing ecological protection and economic maximization under limited water resources.
The water diversion projects enhance regional water supply capacity, significantly boosting economic benefits. Compared to scenarios without diversion, the upper bounds of the total benefits in 2030 and 2040 will increase by 0.3 × 10⁸ CNY and 0.8 × 10⁸ CNY, respectively. Concurrently, these projects will stabilize economic growth, reducing benefit fluctuation ranges by 0.05 × 10⁸ CNY (2030) and 0.34 × 10⁸ CNY (2040).
Under the objective of maximizing overall economic benefits, the agricultural sector—with lower economic returns per unit water—experiences larger future deficits than other sectors. As water diversion volumes expand and the economy develops, limited water resources are increasingly prioritized for high-efficiency industrial uses. To safeguard agricultural water security and national food production, maintaining a mandatory minimum allocation proportion for agricultural water use is imperative.

Author Contributions

Conceptualization, L.S. and Y.Y.; methodology, L.S. and L.T.; software, S.D.; validation, S.L.; formal analysis, S.D. and L.T.; resources, L.S.; data curation, Z.N.; writing—original draft preparation, L.S.; writing—review and editing, S.D. and Y.Y.; supervision, L.S.; project administration, L.S. and Y.Y.; funding acquisition, L.S. and Y.Y. All authors have read and agreed to the published version of the manuscript.

Funding

This research was funded by the National Natural Science Foundation of China (NO. 52309075, 42207454), the Natural Science Foundation of Anhui Province (NO. 2308085QD116), the Wuhu Science and Technology Bureau (NO. 2023jc19), the National College Students Innovation and Entrepreneurship Training Program (NO. S202410370018), and the University Scientific Research Project of Department of Education of Anhui Province (NO. KJ2021A0089).

Data Availability Statement

The water resource data are available in the Anhui Provincial Water Resources Bulletin “https://slt.ah.gov.cn/public/column/21731?type=4&catId=32715131&action=list (accessed on 19 April 2025)”, and the socioeconomic data were obtained from the Anhui Statistical Yearbook “https://tjj.ah.gov.cn/ssah/qwfbjd/tjnj/index.html (accessed on 19 April 2025)”. Other data presented in this study are available on request from the corresponding author.

Acknowledgments

The authors are grateful to the journal editors and three anonymous reviewers for their comments and suggestions.

Conflicts of Interest

The authors declare no conflicts of interest.

References

  1. Shu, R.; Cao, X.C.; Wu, M.Y. Clarifying Regional Water Scarcity in Agriculture based on the Theory of Blue, Green and Grey Water Footprints. Water Resour. Manag. 2021, 35, 1101–1118. [Google Scholar] [CrossRef]
  2. Warziniack, T.; Brown, T.C. The importance of municipal and agricultural demands in future water shortages in the United States. Environ. Res. Lett. 2019, 14, 084036. [Google Scholar] [CrossRef]
  3. Li, M.; Xu, Y.; Fu, Q.; Singh, V.P.; Liu, D.; Li, T. Efficient irrigation water allocation and its impact on agricultural sustainability and water scarcity under uncertainty. J. Hydrol. 2020, 586, 124888. [Google Scholar] [CrossRef]
  4. Ji, J.C.; Zhao, T.Q.; Wu, Z.H.; Zhang, F.; Yan, J.; Lu, N.J. Promoting ecological sustainability in the arid farming-pastoral ecotone through optimal water allocation. J. Hydrol. 2025, 652, 132609. [Google Scholar] [CrossRef]
  5. Zuo, Q.T.; Wu, Q.S.; Yu, L.; Li, Y.P.; Fan, Y.R. Optimization of uncertain agricultural management considering the framework of water, energy and food. Agric. Water Manag. 2021, 253, 106907. [Google Scholar] [CrossRef]
  6. Fu, Q.; Li, T.; Cui, S.; Liu, D.; Lu, X. Agricultural Multi-Water Source Allocation Model Based on Interval Two-Stage Stochastic Robust Programming under Uncertainty. Water Resour. Manag. 2018, 32, 1261–1274. [Google Scholar] [CrossRef]
  7. Karandish, F.; Hogeboom, R.J.; Hoekstra, A.Y. Physical versus virtual water transfers to overcome local water shortages: A comparative analysis of impacts. Adv. Water Resour. 2021, 147, 103811. [Google Scholar] [CrossRef]
  8. Yan, H.; Lin, Y.; Chen, Q.; Zhang, J.; He, S.; Feng, T.; Wang, Z.; Chen, C.; Ding, J. A Review of the Eco-Environmental Impacts of the South-to-North Water Diversion: Implications for Interbasin Water Transfers. Engineering 2023, 30, 161–169. [Google Scholar] [CrossRef]
  9. Zhang, L.; Che, L.; Wang, Z. Where are the critical points of water transfer impact on grain production from the middle route of the south-to-north water diversion project? J. Clean. Prod. 2024, 436, 140465. [Google Scholar] [CrossRef]
  10. Wang, J.; Hou, B.; Zhao, Y.; Xiao, W.; Lu, F. Research on Scale Demonstration Technology of Inter Basin Water Transfer Project in Agricultural Irrigation. Water Resour. Manag. 2021, 35, 5243–5258. [Google Scholar] [CrossRef]
  11. Mo, R.; Xu, B.; Zhang, J.; Wang, G.; Zhong, P.-a.; Wang, H.; Zhu, L.; Tan, J. Multiobjective risk-based optimization for real-time interbasin water diversion under decomposed chance-constrained total water use. J. Hydrol. Reg. Stud. 2025, 58, 102252. [Google Scholar] [CrossRef]
  12. Tingsanchali, T.; Boonyasirikul, T. Stochastic dynamic programming with risk consideration for transbasin diversion system. J. Water Resour. Plan. Manag. 2006, 132, 111–121. [Google Scholar] [CrossRef]
  13. Mansouri, R.; Pudeh, H.T.; Yonesi, H.A.; Haghiabi, A.H. Dynamic programming model for hydraulics and water resources simulating and optimizing water transfer system (a case study in Iran). J. Water Supply Res. Technol. Aqua. 2017, 66, 684–700. [Google Scholar] [CrossRef]
  14. Li, M.; Guo, P.; Yang, G.Q.; Fang, S.Q. IB-ICCMSP: An Integrated Irrigation Water Optimal Allocation and Planning Model Based on Inventory Theory under Uncertainty. Water Resour. Manag. 2014, 28, 241–260. [Google Scholar] [CrossRef]
  15. Li, G.; Zhao, K.; Dong, H.; Li, H.; Zhang, Z.; Ma, B.; Li, H.; Zhou, Y. Leakage and evapotranspiration act as two major water losses for the largest lake on North China Plain during water diversion period. Environ. Earth Sci. 2023, 82, 301. [Google Scholar] [CrossRef]
  16. Jiang, X.; Ma, R.; Ma, T.; Sun, Z. Modeling the effects of water diversion projects on surface water and groundwater interactions in the central Yangtze River basin. Sci. Total Environ. 2022, 830, 154606. [Google Scholar] [CrossRef]
  17. Zhang, Y.; Li, G.-M. Influence of south-to-north water diversion on major cones of depression in North China Plain. Environ. Earth Sci. 2014, 71, 3845–3853. [Google Scholar] [CrossRef]
  18. Chang, H.; Li, G.; Zhang, C.; Huo, Z. Efficient and equitable irrigation management: A fuzzy multi-objective optimization model integrating water movement processes. J. Environ. Manag. 2024, 371, 123164. [Google Scholar] [CrossRef]
  19. Pan, Y.; Tian, H.; Farid, M.A.; He, X.L.; Heng, T.; Hermansen, C.; de Jonge, L.W.; Li, F.D.; Gao, Y.L.; Tian, L.J.; et al. Metaheuristic optimization of water resources: A case study of the Manas River irrigation district. J. Hydrol. 2024, 639, 131640. [Google Scholar] [CrossRef]
  20. Kang, J.; Hao, X.M.; Zhou, H.P.; Ding, R.S. An integrated strategy for improving water use efficiency by understanding physiological mechanisms of crops responding to water deficit: Present and prospect. Agric. Water Manag. 2021, 255, 107008. [Google Scholar] [CrossRef]
  21. Chen, Y.-p.; Fu, B.-j.; Zhao, Y.; Wang, K.-b.; Zhao, M.M.; Ma, J.-f.; Wu, J.-H.; Xu, C.; Liu, W.-g.; Wang, H. Sustainable development in the Yellow River Basin: Issues and strategies. J. Clean. Prod. 2020, 263, 121223. [Google Scholar] [CrossRef]
  22. Hamza, A.A.; Getahun, B.A. Assessment of water resource and forecasting water demand using WEAP model in Beles river, Abbay river basin, Ethiopia. Sustain. Water Resour. Manag. 2022, 8, 22. [Google Scholar] [CrossRef]
  23. KhazaiPoul, A.; Moridi, A.; Yazdi, J. Multi-Objective Optimization for Interactive Reservoir-Irrigation Planning Considering Environmental Issues by Using Parallel Processes Technique. Water Resour. Manag. 2019, 33, 5137–5151. [Google Scholar] [CrossRef]
  24. Ringler, C.; Huy, N.V.; Msangi, S. Water allocation policy modeling for the Dong Nai River Basin: An integrated perspective. J. Am. Water Resour. Assoc. 2006, 42, 1465–1482. [Google Scholar] [CrossRef]
  25. Ahmad, S.; Waseem, M.; Wahab, H.; Khan, A.Q.; Jehan, Z.; Ahmad, I.; Leta, M.K. Assessing water demand and supply in the Upper Indus Basin using integrated hydrological modeling under varied socioeconomic scenarios. Appl. Water Sci. 2025, 15, 5. [Google Scholar] [CrossRef]
  26. Buri, E.S.; Keesara, V.R.; Loukika, K.N.; Sridhar, V.; Dzwairo, B.; Montenegro, S. Climate-adaptive optimal water resources management: A multi-sectoral approach for the Munneru river basin, India. J. Environ. Manag. 2025, 374, 124014. [Google Scholar] [CrossRef] [PubMed]
  27. Qin, J.; Duan, W.; Chen, Y.; Dukhovny, V.A.; Sorokin, D.; Li, Y.; Wang, X. Comprehensive evaluation and sustainable development of water-energy-food-ecology systems in Central Asia. Renew. Sustain. Energy Rev. 2022, 157, 112061. [Google Scholar] [CrossRef]
  28. Ratnayake, U.; Harboe, R. Deterministic and stochastic optimization of a reservoir system. Water Int. 2007, 32, 155–162. [Google Scholar] [CrossRef]
  29. Muhammad, Y.S.; Pflug, G.C. Stochastic vs deterministic programming in water management: The value of flexibility. Ann. Oper. Res. 2014, 223, 309–328. [Google Scholar] [CrossRef]
  30. Zhang, S.; Lin, J.; Li, Y.; Zhu, B.; Zhang, D.; Peng, Q.; Jin, T. Water Quality by Spectral Proper Orthogonal Decomposition and Deep Learning Algorithms. Sustainability 2025, 17, 114. [Google Scholar] [CrossRef]
  31. Shen, Y.; Qu, Y.; Dong, C.; Zhou, F.; Wu, Q. Joint Training and Resource Allocation Optimization for Federated Learning in UAV Swarm. IEEE Internet Things J. 2023, 10, 2272–2284. [Google Scholar] [CrossRef]
  32. Huang, G.H. A hybrid inexact-stochastic water management model. Eur. J. Oper. Res. 1998, 107, 137–158. [Google Scholar] [CrossRef]
  33. Huang, G.H.; Loucks, D.P. An inexact two-stage stochastic programming model for water resources management under uncertainty. Civ. Eng. Environ. Syst. 2000, 17, 95–118. [Google Scholar] [CrossRef]
  34. Tu, Y.; Lu, Y.; Xie, Y.; Lev, B. Optimal river basin water resources allocation considering multiple water sources joint scheduling: A bi-level multi-objective programming with copula-based interval-bistochastic information. Comput. Ind. Eng. 2024, 194, 110388. [Google Scholar] [CrossRef]
  35. Kottek, M.; Grieser, J.; Beck, C.; Rudolf, B.; Rubel, F. World map of the Köppen-Geiger climate classification updated. Meteorol. Z. 2006, 15, 1633–1644. [Google Scholar] [CrossRef]
  36. Ren, J.; Wang, W.; Wei, J.; Li, H.; Li, X.; Liu, G.; Chen, Y.; Ye, S. Evolution and prediction of drought-flood abrupt alternation events in Huang-Huai-Hai River Basin, China. Sci. Total Environ. 2023, 869, 161707. [Google Scholar] [CrossRef] [PubMed]
  37. Editorial Committee of “Anhui Statistical Yearbook”. Anhui Statistical Yearbook 2024; China Statistics Press: Beijing, China, 2024. (In Chinese) [Google Scholar]
  38. Department of Water Resources of Anhui Province, Anhui Province Water Resources Bulletin. 1999–2024. Available online: https://slt.ah.gov.cn/public/column/21731?type=4&catId=32715131&action=list (accessed on 19 April 2025). (In Chinese)
  39. Chen, S.; Huang, B.; Yuan, F.; Berndtsson, R.; Qiu, J.; Chen, X.; Hao, Z. Spatiotemporal Changes in Precipitation and Temperature in the Huaibei Plain and the Relation between Local Precipitation and Global Teleconnection Patterns. J. Hydrol. Eng. 2019, 24, 05019019. [Google Scholar] [CrossRef]
  40. Gou, Q.; Zhu, Y.; Horton, R.; Lu, H.; Wang, Z.; Su, J.; Cui, C.; Zhang, H.; Wang, X.; Zheng, J.; et al. Effect of climate change on the contribution of groundwater to the root zone of winter wheat in the Huaibei Plain of China. Agric. Water Manag. 2020, 240, 106292. [Google Scholar] [CrossRef]
  41. Huang, Q.D.; Zhang, H.R.; Xu, J.J.; Yang, F. Scalar configuration, power strategies and water governance: Insights from the politics of the Yangtze-to-Huai Water Transfer Project. Int. J. Water Resour. Dev. 2022, 38, 658–679. [Google Scholar] [CrossRef]
  42. Sun, X.; Sun, L.; Wang, X.; Wang, S. Ecological Compensation Standard and Distribution of Water Diversion in the Project of Leading Water from Changjiang to Huaihe River in Anhui Province. J. Bengbu Univ. 2022, 11, 107–113. [Google Scholar]
  43. Lei, X.; Zhang, L.; Ji, Y.; Sun, J.; Shen, D.; Wang, C. Research on annual water dispatch model of Yangtze -to-Huaihe River Water Diversion. Yangtze River 2021, 52, 1–7. [Google Scholar]
  44. Editorial Committee of “Anhui Statistical Yearbook”. Anhui Statistical Yearbook; China Statistics Press: Beijing, China, 1999–2024. (In Chinese) [Google Scholar]
  45. Li, S.; Yang, G.; Wang, H.; Song, X.; Chang, C.; Du, J.; Gao, D. A spatial-temporal optimal allocation method of irrigation water resources considering groundwater level. Agric. Water Manag. 2023, 275, 108021. [Google Scholar] [CrossRef]
  46. Ren, D.; Xu, X.; Engel, B.; Huang, G. Growth responses of crops and natural vegetation to irrigation and water table changes in an agro-ecosystem of Hetao, upper Yellow River basin: Scenario analysis on maize, sunflower, watermelon and tamarisk. Agric. Water Manag. 2018, 199, 93–104. [Google Scholar] [CrossRef]
  47. He, K.K.; Yang, Y.G.; Yang, Y.M.; Chen, S.Y.; Hu, Q.L.; Liu, X.J.; Gao, F. HYDRUS Simulation of Sustainable Brackish Water Irrigation in a Winter Wheat-Summer Maize Rotation System in the North China Plain. Water 2017, 9, 536. [Google Scholar] [CrossRef]
  48. Yang, G.; Tian, L.; Li, X.; He, X.; Gao, Y.; Li, F.; Xue, L.; Li, P. Numerical assessment of the effect of water-saving irrigation on the water cycle at the Manas River Basin oasis, China. Sci. Total Environ. 2020, 707, 135587. [Google Scholar] [CrossRef]
  49. Liu, R.; Zhao, Y.; Wang, Q.; He, X.; Ma, M.; Lu, C. Research on the restoration target of healthy depth to water table in Haihe Plain. J. Hydraul. Eng. 2022, 53, 1105–1115. [Google Scholar]
  50. Hu, Y. Effects of Different Groundwater Burial Depths on Crop Growth and Yield in Huaibei Plain. Mod. Agric. Sci. Technol. 2023, 23, 34–38. [Google Scholar]
  51. Fan, X.; Schuetze, N. Assessing crop yield and water balance in crop rotation irrigation systems: Exploring sensitivity to soil hydraulic characteristics and initial moisture conditions in the North China Plain. Agric. Water Manag. 2024, 300, 108897. [Google Scholar] [CrossRef]
  52. Ferrero, R.W.; Rivera, J.F.; Shahidehpour, S.M. Dynamic programming two-stage algorithm for long-term hydrothermal scheduling of multireservoir systems. IEEE Trans. Power Syst. 1998, 13, 1534–1540. [Google Scholar] [CrossRef]
  53. Luo, B.; Li, J.B.; Huang, G.H.; Li, H.L. A simulation-based interval two-stage stochastic model for agricultural nonpoint source pollution control through land retirement. Sci. Total Environ. 2006, 361, 38–56. [Google Scholar] [CrossRef]
  54. Li, R.; Liu, M.; Chen, X. A Preliminary Study on the Exploitation Potential and Management of Groundwater Resources in the Huaibei Region of Anhui Province. Gov. Huai River 2011, 8, 62–65. [Google Scholar]
  55. Hsiao, T.C.; Steduto, P.; Fereres, E. A systematic and quantitative approach to improve water use efficiency in agriculture. Irrig. Sci. 2007, 25, 209–231. [Google Scholar] [CrossRef]
  56. Cao, X.; Wang, H.; Wu, C.; Cao, Y.; Gu, Y. Causes and management measures of groundwater overexploitation in Huaihe River Basin and Shandong Peninsula. Adv. Sci. Technol. Water Resour. 2024, 44, 65–73. [Google Scholar]
  57. Yu, W.; Yue, Y.; Wang, F. The spatial-temporal coupling pattern of grain yield and fertilization in the North China plain. Agric. Syst. 2022, 196, 103330. [Google Scholar] [CrossRef]
  58. Li, J.; Li, Z. Physical limitations and challenges to Grain Security in China. Food Secur. 2014, 6, 159–167. [Google Scholar] [CrossRef]
  59. Wang, W.; Gao, L.; Liu, P.; Hailu, A. Relationships between regional economic sectors and water use in a water-scarce area in China: A quantitative analysis. J. Hydrol. 2014, 515, 180–190. [Google Scholar] [CrossRef]
  60. Deng, G.; Yue, X.; Miao, L.; Lu, F. Identification of key sectors of water resource utilization in China from the perspective of water footprint. PLoS ONE 2020, 15, e0234307. [Google Scholar] [CrossRef]
  61. Floerke, M.; Kynast, E.; Baerlund, I.; Eisner, S.; Wimmer, F.; Alcamo, J. Domestic and industrial water uses of the past 60 years as a mirror of socio-economic development: A global simulation study. Glob. Environ. Change-Hum. Policy Dimens. 2013, 23, 144–156. [Google Scholar] [CrossRef]
  62. Peng, Z.; Yin, J.; Zhang, L.; Zhao, J.; Liang, Y.; Wang, H. Assessment of the Socio-Economic Impact of a Water Diversion Project for a Water-Receiving Area. Pol. J. Environ. Stud. 2020, 29, 1771–1784. [Google Scholar] [CrossRef]
  63. Dai, W.; Ni, Z.; Yu, E. Quenching thirst, easing debt: Improvement in water resource endowment alleviates local government debt risk. China Econ. Rev. 2024, 88, 102302. [Google Scholar] [CrossRef]
  64. Zhang, S.; Pang, Y.; Xu, H.; Wei, J.; Jiang, S.; Pei, H. Shift of phytoplankton assemblages in a temperate lake located on the eastern route of the South-to-North Water Diversion Project. Environ. Res. 2023, 227, 115805. [Google Scholar] [CrossRef]
  65. Zhao, C.Y.; Qin, J.; He, X.H.; Zho, M.D. Eco-water diversion project is not a simply measure to improve the ecological environment. Glob. Nest J. 2022, 24, 401–406. [Google Scholar]
  66. Xu, J.; Hou, S.; Yao, L.; Li, C. Integrated waste load allocation for river water pollution control under uncertainty: A case study of Tuojiang River, China. Environ. Sci. Pollut. Res. 2017, 24, 17741–17759. [Google Scholar] [CrossRef]
  67. Mu, Z.F.; Li, T.X.; Liu, D.; Fu, Q.; Hou, R.J.; Li, Q.L.; Ji, Y.; Cui, S.; Li, M. How soil texture, channel shape and cross-sectional area affect moisture dynamics and water loss in irrigation channels. Hydrol. Process. 2021, 35, e14155. [Google Scholar] [CrossRef]
  68. Paudel, K.P.; Schultz, B.; Depeweg, H. Modelling of an irrigation scheme with sediment-laden water for improved water management: A Case Study of Sunsari Morang Irrigation Scheme, Nepal. Irrig. Drain. 2013, 62, 161–169. [Google Scholar] [CrossRef]
  69. Ward, F.A. Financing Irrigation Water Management and Infrastructure: A Review. Int. J. Water Resour. Dev. 2010, 26, 321–349. [Google Scholar] [CrossRef]
Figure 1. The study area, with lines showing the locations of the water diversion project.
Agriculture 15 00949 g001
Figure 2. The framework of the optimal allocation model, considering water diversion projects.
Agriculture 15 00949 g002
Figure 3. Optimized initial water allocation results.
Agriculture 15 00949 g003
Figure 4. Optimized water deficit results in agricultural irrigation districts (panels (a,b) indicate the upper and lower bounds of the optimal results; h, i, and j represent the levels of water availability, sectors of water use, and subareas, respectively).
Agriculture 15 00949 g004
Figure 5. Optimized water allocation in the agricultural irrigation districts (panels (a,b) indicate the upper and lower bounds of the optimal results; h, i, and j represent the levels of water availability, sectors of water use, and subareas, respectively).
Agriculture 15 00949 g005
Figure 6. Economic benefits of the agricultural irrigation district.
Agriculture 15 00949 g006
Table 1. Basic information of the study area.
Area (103 km2)Population (106)GDP (109 CNY)IVA (109 CNY)AVA (109 CNY)
Subarea19.95.3229.150.040.1
Subarea25.33.2211.654.829.1
Subarea38.44.9221.656.129.7
Subarea49.88.1332.494.548.6
Subarea52.71.9136.653.09.3
Subarea61.63.0160.157.815.7
Total37.626.41291.4366.1172.5
Note: GDP, IVA, and AVA represent Gross Domestic Product, Industrial Value Added, and Agricultural Value Added, respectively. The data are for the year 2023.
Table 2. The water diversion volumes (108 m3) of the Yangtze-to-Huai project.
The Year of 2030The Year of 2040
Dry YearNormal YearWet YearDry YearNormal YearWet Year
Subarea1[6.09, 9.13][4.46, 6.68][2.54, 3.80][6.58, 9.86][5.05, 7.57][3.15, 4.73]
Subarea2[3.65, 5.47][2.67, 4.00][1.52, 2.28][3.94, 5.90][3.02, 4.54][1.89, 2.83]
Subarea3[5.13, 7.69][3.75, 5.63][2.14, 3.20][5.54, 8.30][4.26, 6.38][2.66, 3.98]
Subarea4[6.20, 9.30][4.54, 6.80][2.58, 3.88][6.69, 10.03][5.14, 7.70][3.22, 4.82]
Subarea5[1.68, 2.52][1.23, 1.85][0.70, 1.06][1.82, 2.72][1.39, 2.09][0.87, 1.31]
Subarea6[3.39, 5.09][2.48, 3.72][1.42, 2.12][3.66, 5.48][2.81, 4.21][1.76, 2.64]
Table 3. Groundwater table depth and water deficit under ecological constraints.
Depth (m)Water Deficit (×108 m3)
Dry YearNormal YearWet Year
229.4021.4311.93
40.6600
Table 4. Available water resources (108 m3) in the agricultural irrigation district.
Available Surface Water Available Groundwater
Dry yearSubarea1[2.38, 2.86][1.17, 1.41]
(h = 1)Subarea2[7.28, 8.72][3.59, 4.3]
Subarea3[8.64, 10.35][4.26, 5.1]
Subarea4[4.61, 5.52][2.27, 2.72]
Subarea5[8.5, 10.19][4.19, 5.02]
Subarea6[1.36, 1.62][0.67, 0.8]
Normal yearSubarea1[3.01, 3.74][1.48, 1.84]
(h = 2)Subarea2[9.19, 11.43][4.53, 5.63]
Subarea3[10.9, 13.57][5.37, 6.68]
Subarea4[5.81, 7.23][2.86, 3.56]
Subarea5[10.73, 13.35][5.28, 6.57]
Subarea6[1.71, 2.13][0.84, 1.05]
Wet yearSubarea1[3.89, 5.03][1.92, 2.48]
(h = 3)Subarea2[11.89, 15.36][5.86, 7.57]
Subarea3[14.11, 18.24][6.95, 8.98]
Subarea4[7.52, 9.72][3.71, 4.79]
Subarea5[13.88, 17.94][6.84, 8.83]
Subarea6[2.21, 2.86][1.09, 1.41]
Table 5. Future water allocation targets in the agricultural irrigation district.
PeriodSub-Irrigation AreaAgricultureIndustryDomesticEnvironment
2030Subarea1[9.81, 14.71][5.52, 8.28][2.82, 4.22][0.43, 0.65]
Subarea2[5.87, 8.81][3.30, 4.96][1.69, 2.53][0.26, 0.40]
Subarea3[8.26, 12.40][4.65, 6.97][2.38, 3.56][0.37, 0.55]
Subarea4[9.98, 14.98][5.62, 8.42][2.86, 4.30][0.44, 0.66]
Subarea5[2.70, 4.06][1.52, 2.28][0.78, 1.16][0.12, 0.18]
Subarea6[5.46, 8.20][3.07, 4.61][1.57, 2.35][0.24, 0.36]
2040Subarea1[9.81, 14.71][6.06, 9.08][3.30, 4.96][0.50, 0.76]
Subarea2[5.87, 8.81][3.62, 5.44][1.98, 2.96][0.30, 0.46]
Subarea3[8.26, 12.40][5.10, 7.64][2.78, 4.18][0.42, 0.64]
Subarea4[9.98, 14.98][6.16, 9.24][3.36, 5.04][0.51, 0.77]
Subarea5[2.70, 4.06][3.62, 5.44][0.91, 1.37][0.14, 0.20]
Subarea6[5.46, 8.20][3.37, 5.05][1.84, 2.76][0.28, 0.42]
Table 6. Economic efficiency parameters (CNY/m3) of water utilization.
PeriodSubareaCoefficientAgriculture
(i = 1)
Industry
(i = 2)
Domestic
(i = 3)
Environment
(i = 4)
2030j = 1 b i j ± [58.98, 88.46][236.78, 355.18][416.89, 625.33][98.61, 147.91]
c i j ± [94.36, 141.54][378.86, 568.28][667.02, 1000.54][157.78, 236.66]
j = 2 b i j ± [22.72, 34.08][316.22, 474.32][676.85, 1015.27][60.26, 90.40]
c i j ± [36.35, 54.53][505.94, 758.92][1082.96, 1624.44][96.42, 144.64]
j = 3 b i j ± [34.58, 51.88][230.31, 345.47][467.70, 701.56][84.02, 126.02]
c i j ± [55.34, 83.00][368.5, 552.74][748.33, 1122.49][134.42, 201.64]
j = 4 b i j ± [29.48, 44.22][262.41, 393.61][553.16, 829.74][100.44, 150.66]
c i j ± [47.17, 70.75][419.86, 629.78][885.06, 1327.58][160.70, 241.06]
j = 5 b i j ± [39.63, 59.45][283.47, 425.21][815.68, 1223.52][27.37, 41.05]
c i j ± [63.41, 95.11][453.55, 680.33][1305.09, 1957.63][43.79, 65.69]
j = 6 b i j ± [9.82, 14.74][61.26, 91.88][464.94, 697.42][54.82, 82.22]
c i j ± [15.72, 23.58][98.00, 147.01][743.91, 1115.87][87.70, 131.56]
2040j = 1 b i j ± [76.67, 115.00][307.82, 461.72][541.95, 812.93][128.19, 192.29]
c i j ± [122.67, 184.00][492.50, 738.76][867.12, 1300.68][205.10, 307.66]
j = 2 b i j ± [29.54, 44.30][411.08, 616.62][879.90, 1319.86][78.34, 117.52]
c i j ± [47.26, 70.88][657.73, 986.59][1407.85, 2111.77][125.35, 188.03]
j = 3 b i j ± [44.96, 67.44][299.41, 449.11][608.02, 912.02][109.22, 163.84]
c i j ± [71.94, 107.9][479.06, 718.58][972.82, 1459.24][174.76, 262.14]
j = 4 b i j ± [38.33, 57.49][341.13, 511.69][719.11, 1078.67][130.58, 195.86]
c i j ± [61.33, 91.99][545.81, 818.71][1150.58, 1725.86][208.92, 313.38]
j = 5 b i j ± [51.52, 77.28][368.51, 552.77][1060.38, 1590.58][35.58, 53.36]
c i j ± [82.43, 123.65][589.62, 884.42][1696.62, 2544.92][56.92, 85.38]
j = 6 b i j ± [12.77, 19.15][79.63, 119.45][604.42, 906.64][71.26, 106.9]
c i j ± [20.43, 30.65][127.41, 191.11][967.08, 1450.62][114.03, 171.05]
Disclaimer/Publisher’s Note: The statements, opinions and data contained in all publications are solely those of the individual author(s) and contributor(s) and not of MDPI and/or the editor(s). MDPI and/or the editor(s) disclaim responsibility for any injury to people or property resulting from any ideas, methods, instructions or products referred to in the content.

