Article

Optimising Farm Area Allocations Based on Soil Moisture Thresholds: A Comparative Study of Two Dairy Farms with Distinct Soil and Topographic Features

1
Vista Milk SFI Research Centre, Teagasc, Moorepark, Fermoy, P61 C996 Co. Cork, Ireland
2
Earth and Ocean Sciences, Ryan Institute, College of Science and Engineering, University of Galway, H91 TK33 Galway, Ireland
3
Environmental Research Centre, Teagasc, Johnstown Castle, Wexford, Y35 HK54 Co. Wexford, Ireland
4
School of History and Geography, University of Limerick, V94 T9PX Co. Limerick, Ireland
*
Author to whom correspondence should be addressed.
Agriculture 2025, 15(9), 920; https://doi.org/10.3390/agriculture15090920
Submission received: 14 March 2025 / Revised: 16 April 2025 / Accepted: 18 April 2025 / Published: 23 April 2025
(This article belongs to the Section Agricultural Water Management)

Abstract

On intensive dairy farms, good decision making regarding application of fertilisers and irrigation requires an understanding of soil moisture conditions. Targeted fertiliser application not only contributes to high nutrient use efficiency but reduces the potential for leaching of nutrients and controls emissions from farms. This calls for the development of an improved farm management decision support system focussed on precision agriculture solutions for sustainable agriculture. Knowledge of soil moisture at high resolution at the farm scale can help develop such solutions while at the same time reducing the risk of soil compaction by machinery and/or animals, especially under wet conditions. The objective of this study is to examine and compare two intensive dairy farms, with similar average annual rainfall but contrasting soil (but similar drainage) and topographic characteristics, for their resilience towards extreme conditions (e.g., saturation or drought). Soil moisture thresholds for optimal conditions and corresponding farm area proportions were calculated, identifying areas for targeted farm management. This study addresses the knowledge gap of including high-resolution satellite derived soil moisture as a variable in designing farm management systems targeted towards precision agriculture. Farm 1 was situated in a drumlin belt, whereas Farm 2 had lowland terrain, representing major land cover categories in Ireland. The results showed that Farm 2 was more resilient towards extreme conditions and that the variable topography and soil heterogeneity act as a buffer in regulating moisture regimes on the farm, preventing movement towards the extremes. Across the years, Farm 1 showed less variability in optimal farm area proportions and could be managed better than Farm 2 in terms of overall productivity and resilience towards extreme weather conditions such as droughts, even in a drought year. This study showed that along with variations in soil type, topographic features also dictate water movement and therefore soil moisture regimes on farms.

Graphical Abstract

1. Introduction

Europe has been the fastest warming continent of the Earth since the 1980s, warming twice as fast as the global average, according to the European State of the Climate 2023 report [1]. There has been an increase in the frequency and intensity of extreme events, more so from the year 2020 onwards. Since 2020, Europe has witnessed the three warmest years as observed by the Copernicus Climate Change Service [2]. The year 2023 especially stands out, with increased occurrences of both floods and droughts [3]. Southern Europe faced recurrent droughts, while northern Europe experienced flooding. Globally, too, 2023 was the warmest year on record, such that every day experienced a rise of 1 °C from preindustrial levels and two days even saw an increase of 2 °C [4]. However, this was also the year when most European nations experienced “wetter than average” monthly precipitation conditions, especially in Ireland [5]. In the thirty-year period from 1991 to 2020, soil moisture content showed a declining trend in Eastern and Central Europe, especially during summer, based on ERA 5 reanalysis data and modelling, with an increase in the frequency and intensity of severe droughts in Europe [6].
Keeping in line with global trends, Ireland’s average annual temperature has increased by 0.8 °C compared with 1900 [7]. The year 2023 was the warmest on record in Ireland, with average annual temperature rising above 11 °C. March and July were the wettest months, while June was the warmest [8]. Ireland receives an annual average rainfall of 1288 mm as calculated from 1991–2020. Thirty-year annual averages of rainfall from 1991–2020 reveal a declining trend from west to east, with significant regional variations [9]. Such variability and changes in climate can have a significant impact on agriculture, such as lengthier growing seasons and increases in pests and diseases [10]. An increase in the frequency and intensity of precipitation would lead to increased nutrient leaching, increasing the risk of water pollution, while droughts in spring and summer would lead to decreased yields [11,12]. This problem is exacerbated by the intrinsic variability of soils. Approximately 30% of Irish soils are poorly drained or “heavy”, i.e., they remain wet for long periods of time and reach saturation during rainfall [13]. Additionally, saturated soils are at risk of irreversible compaction by animals or machinery [14], which is a common scenario for most dairy farms in Ireland. Compaction leads to “tighter” soils, whereby drainage and gas exchange is reduced, causing lower yields. Nutrient uptake is also negatively impacted, restricting root growth and resulting in water stress. In Ireland, soil compaction has been shown to reduce yields by up to 30%, with effects lasting between two and seven years [15]. Drainage management is therefore imperative for such farms for maximum utilisation of grass and maintaining productivity. Topography, rainfall, and soil texture (and drainage status) are the major governing factors that determine the type of drainage system to be installed on farms [16]. Soil moisture and its spatiotemporal variability are, therefore, critical variables in agriculture and management of agricultural water resources, especially in erratic climatic conditions. This calls for timely and accurate monitoring of soil moisture regimes [17,18,19]. Satellite data are especially useful for designing management strategies, as they can provide an overview of the spatial variability in the soil moisture regime, which is important for farm-management decision support tools.
The objective of this study is to compare two intensive dairy farms in Ireland with contrasting soil types and topography in regard to resilience to extreme events. These farms are representative of a certain subset of dairy farms in Ireland with respect to general soil characteristics, weather conditions, and farm-management regimes. These farms represent farms with the soil type known as “Heavy Soils”, i.e., these soils reach saturation and remain saturated for long periods of time after a rainfall event. Of grassland soils in Ireland, 30% are classified as “Heavy” [13]. This paper aims to capture soil moisture threshold dynamics spatially and temporally using satellite-derived soil moisture and in situ weather and soil moisture deficit (SMD) data to compare the two farms in their resilience to climate change and to analyse differences in management regimes that need to be adopted for sustainable farm management. Furthermore, a comparison is made with respect to areas on the farm that could be safely utilised with minimum damage due to compaction induced by machine traffic and where grass growth is supported. This paper builds on existing studies by Basu et al. [20,21], wherein Sentinel 2 data was used to estimate high-resolution surface soil moisture using the OPTRAM model and soil moisture thresholds were defined for safe trafficability and optimum crop growth for Irish dairy farms, respectively. This study, therefore, addresses the research gap of the inclusion of high-resolution soil moisture estimates as a key variable in a decision support system for effective farm management, which can further be incorporated in designing precision agriculture systems.

2. Materials and Methods

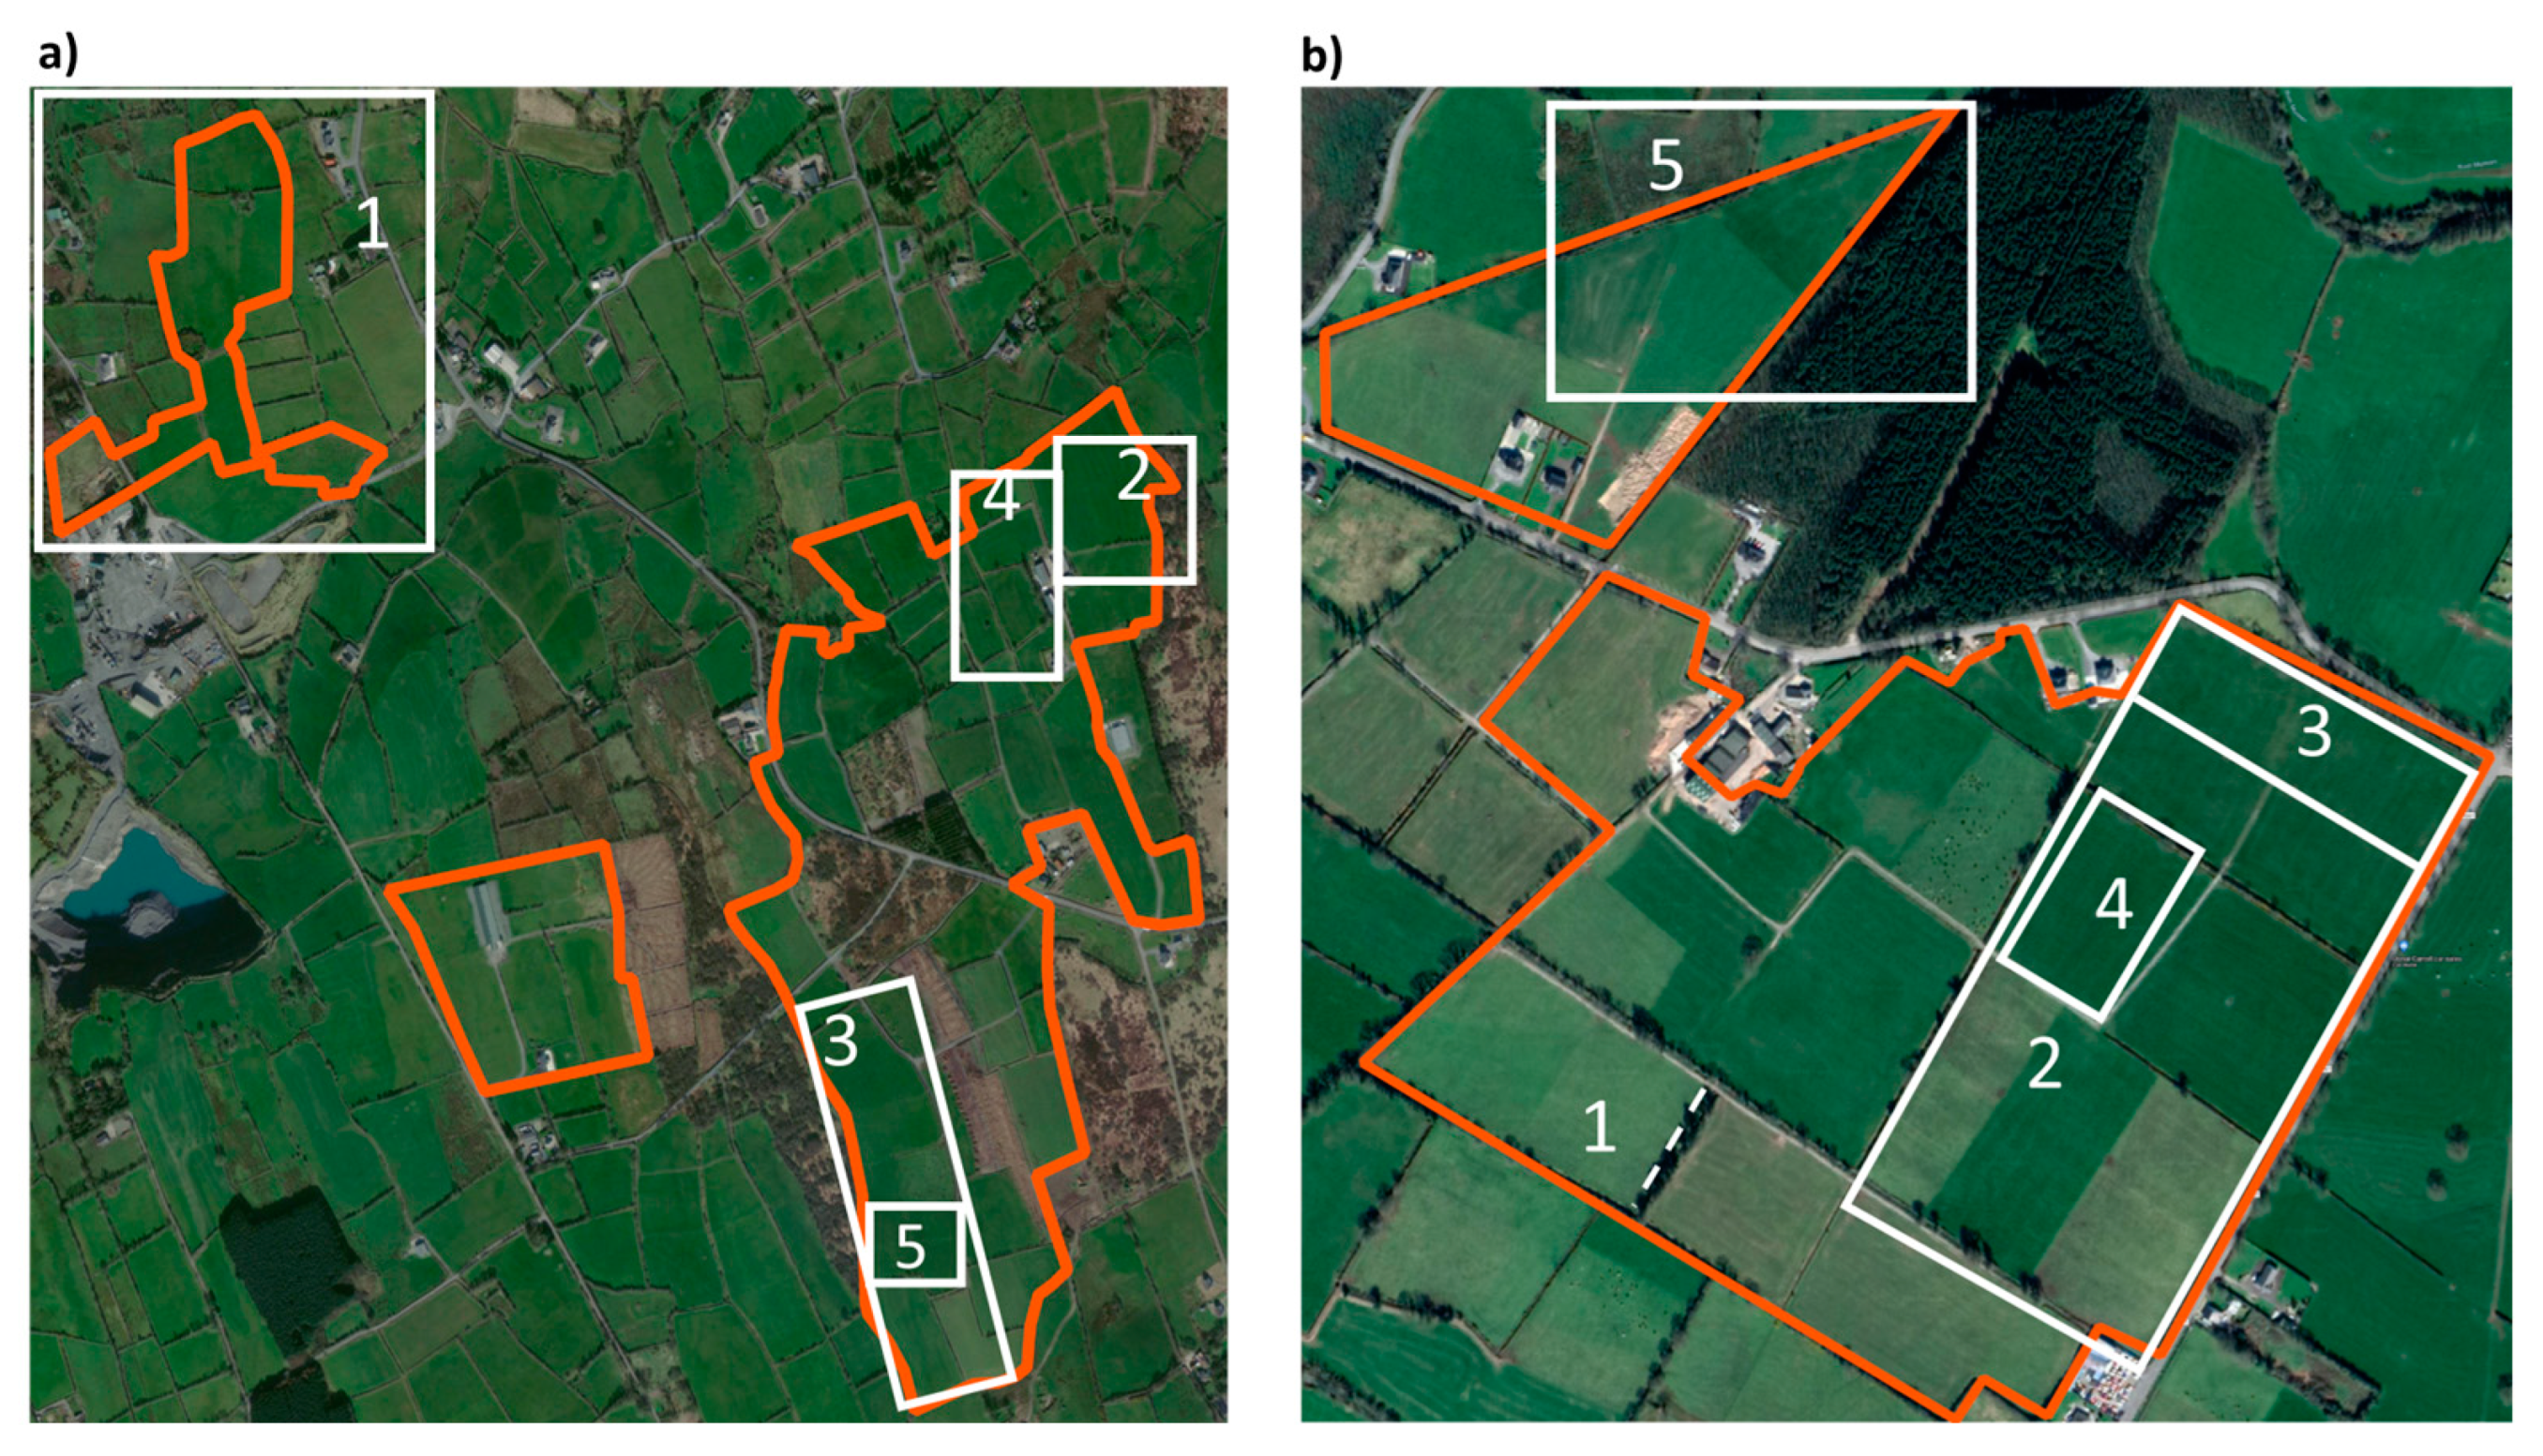
2.1. Site Selection and Characteristics

In Ireland, drumlin landscapes formed during the most recent period of glacial advance in subglacial conditions, and they represent the direction of ice flow [22]. Drumlins are small, oval-shaped hills formed from glacial deposits. These deposits are of varying thickness. Rock cores have thin deposits with drier soils such as luvisols, brown earths, and brown podzolics on the slopes, whereas wetter soils such as surface water gleys can be found on drumlins with thick deposits. At the base of drumlins, wet soils such as groundwater gleys and peat are common because of water accumulation. By contrast, in Ireland, lowland landscapes have acidic soils with underlying glacial deposits made up of sandstones and shales or granite, igneous, and metamorphic materials from hills and mountains [23]. The farms in the present study were chosen in one of each of these landscape types.
Farm 1 is located in Co. Cavan and is approximately 50 hectare (Ha) in size. This site is characterised by drumlin hills with an elevation of 150–200 m, which are drained by many streams between the drumlins. It receives approximately 1100 mm of rainfall annually. Drumlins constitute the second-highest category of land cover in Ireland, and up to two-thirds of drumlins are covered by pastures [24]. A soil survey was carried out at the paddock scale using an auger bore following the protocols developed for the Irish Soil Information System [25] to ascertain soil characteristics such as soil type, texture, colour mottling, etc. The soil texture is clayey, and the dominant soil subgroups on this farm are surface water gleys and brown earths. In the upper slopes of the farm, brown earths and luvisols are more common, while surface water gleys dominate when the slope decreases. Some alluvial soils and groundwater gleys are also found in between the hills. Brown earths and surface water gleys impede percolation of rainwater and lead to soil saturation and waterlogging at the surface. Alluvial soils are commonly found in the hollows and in the lower side of the streams. There is also an area dominated by brown podzolic soils in between two drumlins in a small plateau. To overcome the problems associated with waterlogging on the farms, the farm has a shallow drainage system with gravel moles and underlying pipes, as well as open ditches in numerous areas.
Farm 2 is located on a flat lowland landscape in Co. Tipperary. It is approximately 50 Ha. in size, receiving approximately 980 mm of annual rainfall. Lowlands constitute the highest land cover category in Ireland, and three-fourths of lowlands are covered by pastures [24]. Similarly as with Farm 1, a soil survey was carried out at this farm at the paddock scale using an auger bore. The farm has a loamy or sandy loam soil texture and is majorly dominated by surface water gleys, characterised by a perched water table. Since surface water gleys can contribute towards waterlogging during heavy rainfall events, this site is also equipped with a drainage system consisting of evenly spaced tile drains and open ditches. The next major soil subgroup is brown earths, followed by luvisols in some paddocks. The topography is flat, with very few elevational differences, and the slope is less than 2% for most of the farm, except for paddocks 18–21, where the slope is higher, leading to a greater risk of waterlogged conditions in the depressions. Paddock 7 represents the most common soil subgroup found on the farm, i.e., surface water gleys. Paddock 17 is interesting because of the presence of a peat layer, and paddock 20 represents a hilly region. On this farm, waterlogging after heavy rainfall can be caused either by a rising groundwater table or by a perched water table, which restricts downward movement of water through the soil.
Both farms are equipped with a meteorological station providing daily measures of rainfall, evapotranspiration, temperature, and wind speed. Additionally, the farms have in situ soil moisture sensors [26] providing daily volumetric soil moisture (m3/m3). Each farm has six sensors (shown by yellow cross-hairs in Figure 1 (Farm 1 and Farm 2)), installed at a depth of 15 cm.
Figure 1 shows the farm boundaries of the two farms along with the soil types found thereon. Figure 2 is a slope map (in degrees) for the farms with contour lines. As can be seen in Figure 2, Farm 1 has steeper inclines than Farm 2, which is flat throughout with a maximum slope of 3°. There are two distinct drumlins in Farm 1 (marked by arrows in Figure 2) where the contour lines are dense, and these areas have stepper slopes than other areas on this farm.

2.2. Determining Soil Moisture Thresholds (SMTs) for Trafficability and Optimum Crop Growth

Basu et al. [20] estimated high-resolution normalised surface soil moisture (nSSM) from Sentinel 2 (S-2) data (for years 2017–2022) using the enhanced vegetation index (EVI) and a modified OPTRAM [27] model. Twenty-five and thirty-one S-2 images were used in OPTRAM for farms 1 and 2, respectively. The images were selected based on cloud cover and through an analysis of rainfall and evapotranspiration data such that the time series captured wet, dry, and normal conditions, including any extreme weather events during the time period. The modelled soil moisture was validated against in situ soil moisture data from the farms, with an RMSE of 0.05–0.06 for the farms. nSSM maps for the farms were produced at a spatial resolution of 10 m. Furthermore, Basu et al. (2024b) [21] determined novel soil moisture thresholds (SMTs) in nSSM by developing a linear model between mean nSSM and corresponding daily soil moisture deficit (SMD) estimates for the farms. Daily SMDs for the farms were calculated using the hybrid SMD model of Schulte et al. [28]. This is a water balance model that uses meteorological variables such as rainfall and evapotranspiration to calculate SMD, as shown in Equation (1). This grassland hybrid model calculates daily SMD based on drainage classes and is not based on soil type. To use the SMD model outputs correctly at farm scale, the landowner must be aware of the drainage class of each field, which will then lead them to make informed management decisions regarding trafficking the soils or utilizing grass at that time point for a specific drainage class.
S M D t = S M D t 1 R a i n t + E T t + D r a i n t
where S M D t and S M D t 1 are SMDs on day t and t − 1, respectively in mm; Raint is the daily rainfall (mm/day); ETt is daily actual evapotranspiration (mm/day); and Draint is the water that is drained daily through percolation and/or surface flow. Daily rainfall and evapotranspiration data were available from the meteorological stations on the farms.
To develop a relationship between nSSM and SMD, first, a cumulative sum of 7-day rainfall and evapotranspiration and the SMD for the date of each S-2 image collected in the period from 2017 to 2022 was analysed for the farms. This helped in choosing specific dates from the S-2 time series that represented negative, 0, and positive SMD conditions on the farm for the study period. Out of the total images for each farm as mentioned in the previous paragraph, 13 and 11 S-2 images (and corresponding nSSM maps) were finally selected for Farm 1 and Farm 2, respectively, such that they corresponded to a range of SMD conditions, covering saturation, dryness, and field capacity. Linear regression models were then developed between mean nSSM for these selected S-2 images and the corresponding SMD for the same dates. Following the methodology developed in [21], thresholds of SMD from the literature were used in the regression model to obtain corresponding nSSM values or thresholds for each of the farms. These thresholds would be referred to as the “favourable” or “optimum” SMT in the paper and it defines favourable conditions of safe trafficability and optimum grass growth on the two farms. This approach helped identify specific areas on the farms that could be trafficked safely with minimum risk of soil compaction and where optimal crop growth conditions could be achieved. A piecewise linear regression model was applied between the proportion of the farm area within the favourable SMT and the corresponding SMD for the same day to derive daily farm area proportions for the farms. A flowchart of methodology is presented as Supplementary Information (S1).

2.3. Ancillary Data

Grass growth data (DM (dry matter) kg/Ha) were obtained for both farms from PastureBase [29], which is a database for farm level management information in Ireland. PastureBase consists of dated entries of variables such as grass growth, fertilizer application (rates and type of fertilizer used), and other management activities for farms in Ireland. Additionally, daily measures of rainfall (mm/day) were obtained from the meteorological stations on the farm, which were used to select S-2 images for the study as explained in Section 2.2.

3. Results

3.1. Soil Moisture Thresholds

Figure 3 shows the linear regression model developed between mean nSSM and SMD for Farms 1 and 2, with SMD as the independent variable and mean nSSM as the dependent variable, to obtain corresponding ranges in nSSM for the farms. The SMD thresholds of 10 mm and 50 mm are defined for safe trafficability by machinery in Ireland [30] and optimum grass growth [31], respectively. These SMD thresholds were used in the linear model equation (as shown in Figure 3 (Farm 1 and Farm 2)) to obtain corresponding nSSM thresholds (SMTs). The corresponding nSSM values/thresholds were found to be 0.222 and 0.302 for Farm 1 and 0.235 and 0.315 for Farm 2 for the SMD thresholds of 10 mm and 50 mm, which defined the “favourable” soil moisture range for trafficability and grass growth on the farms.

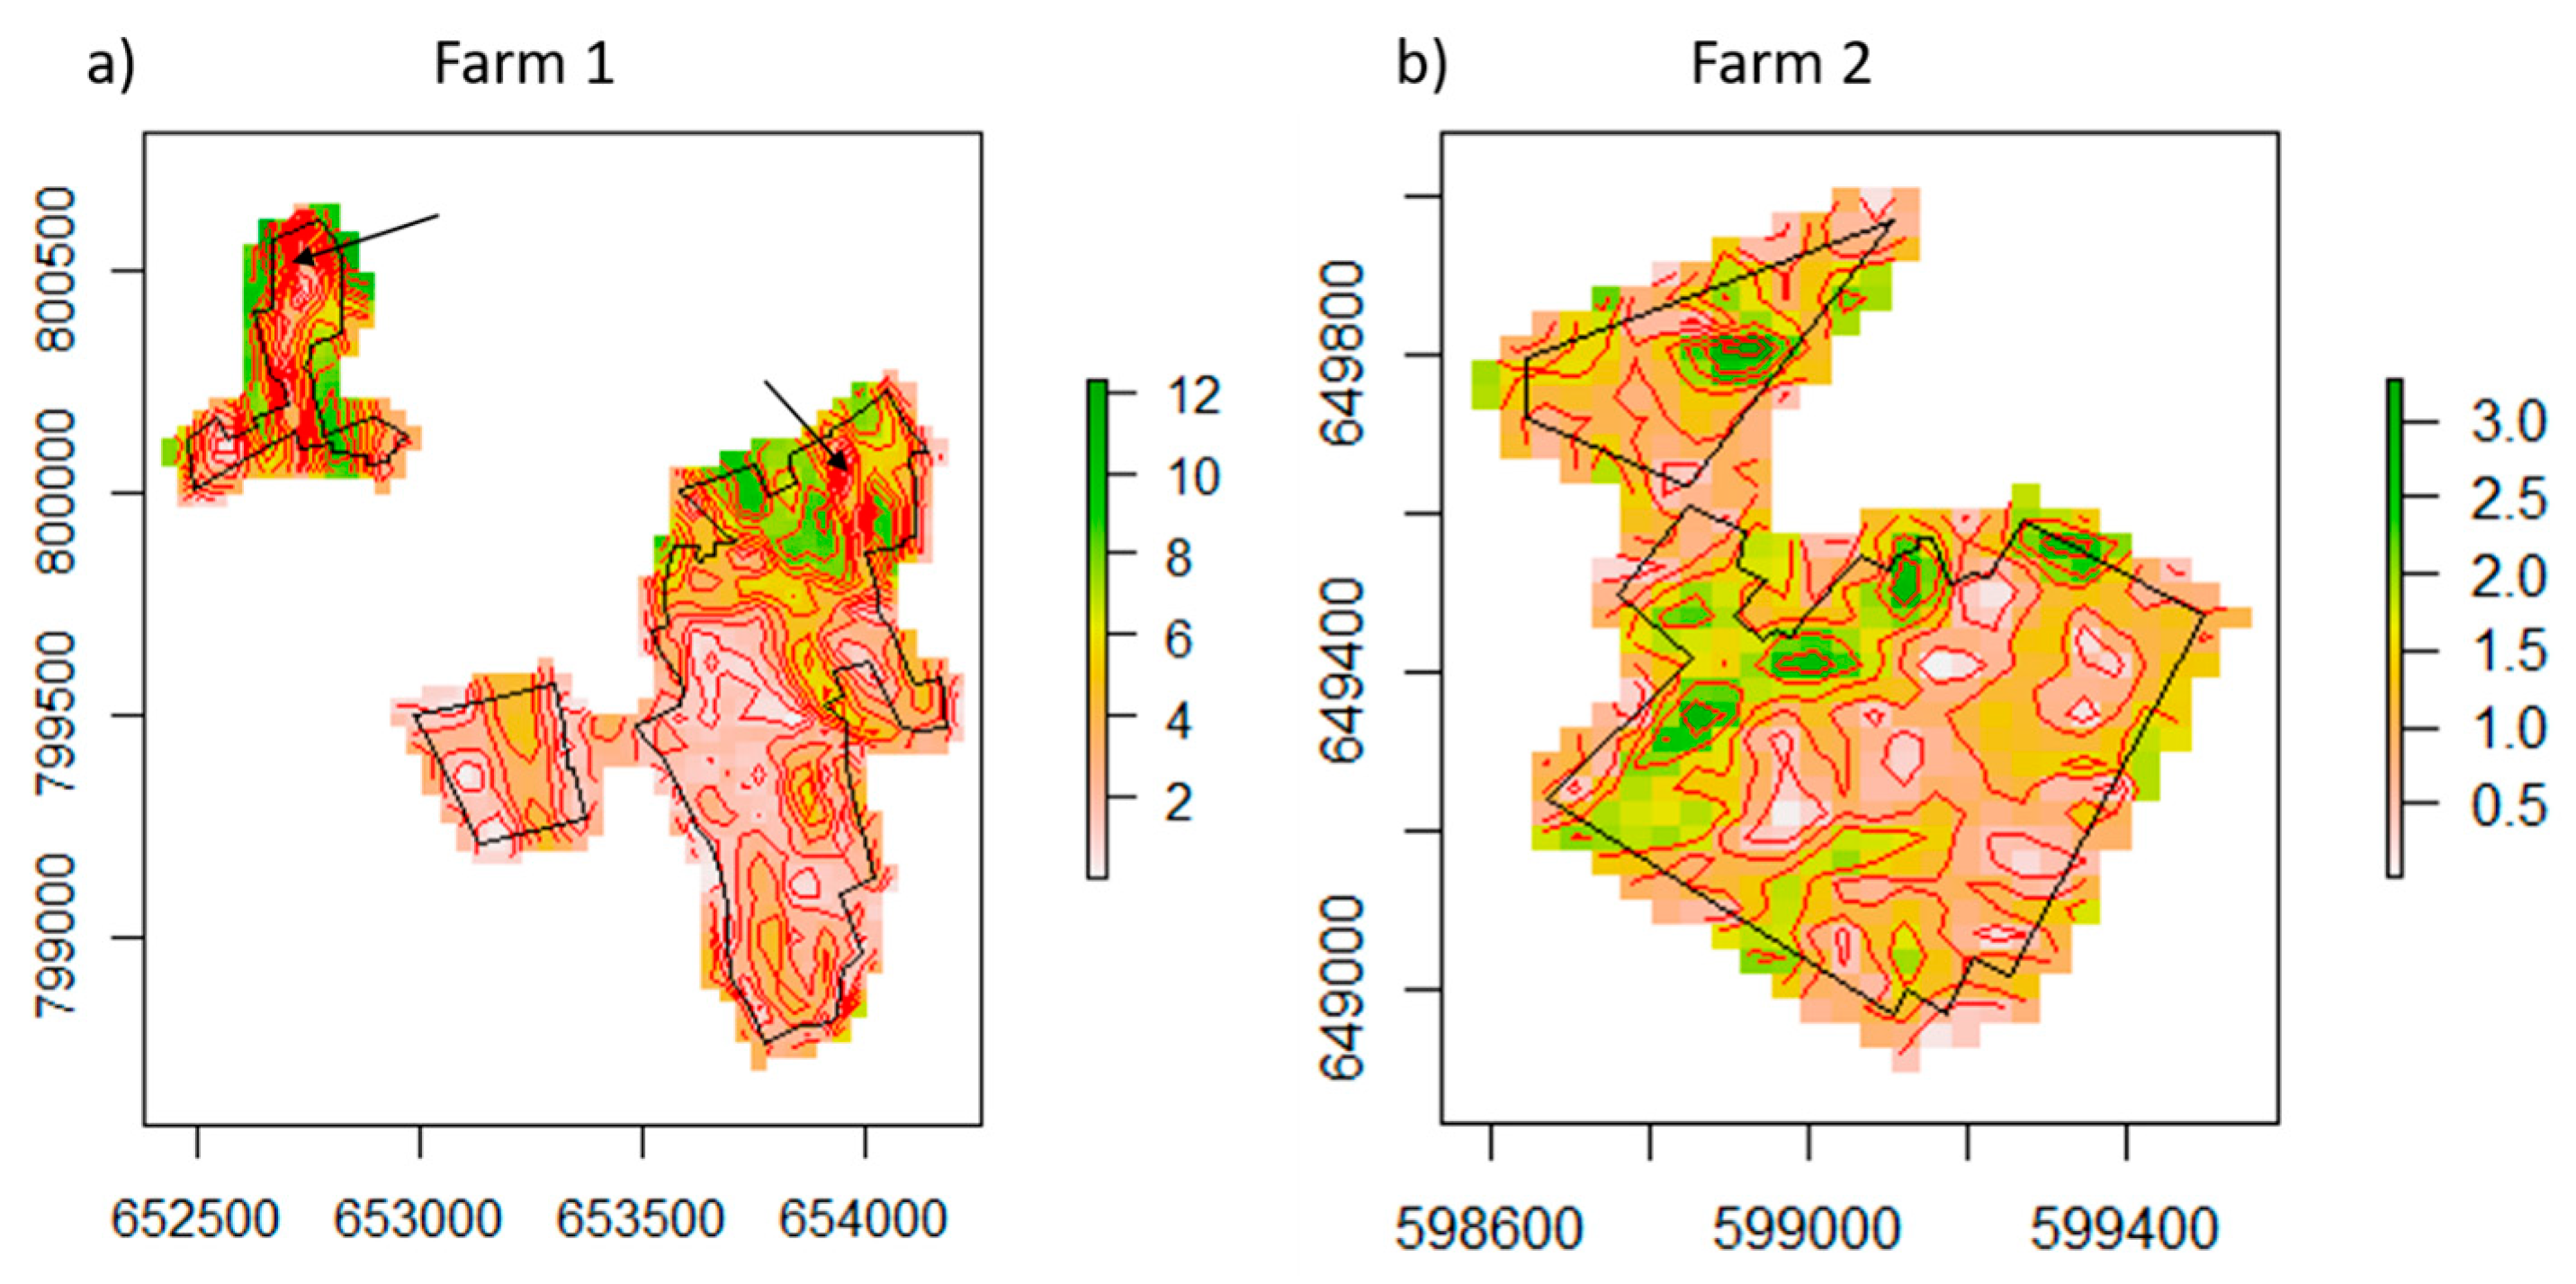
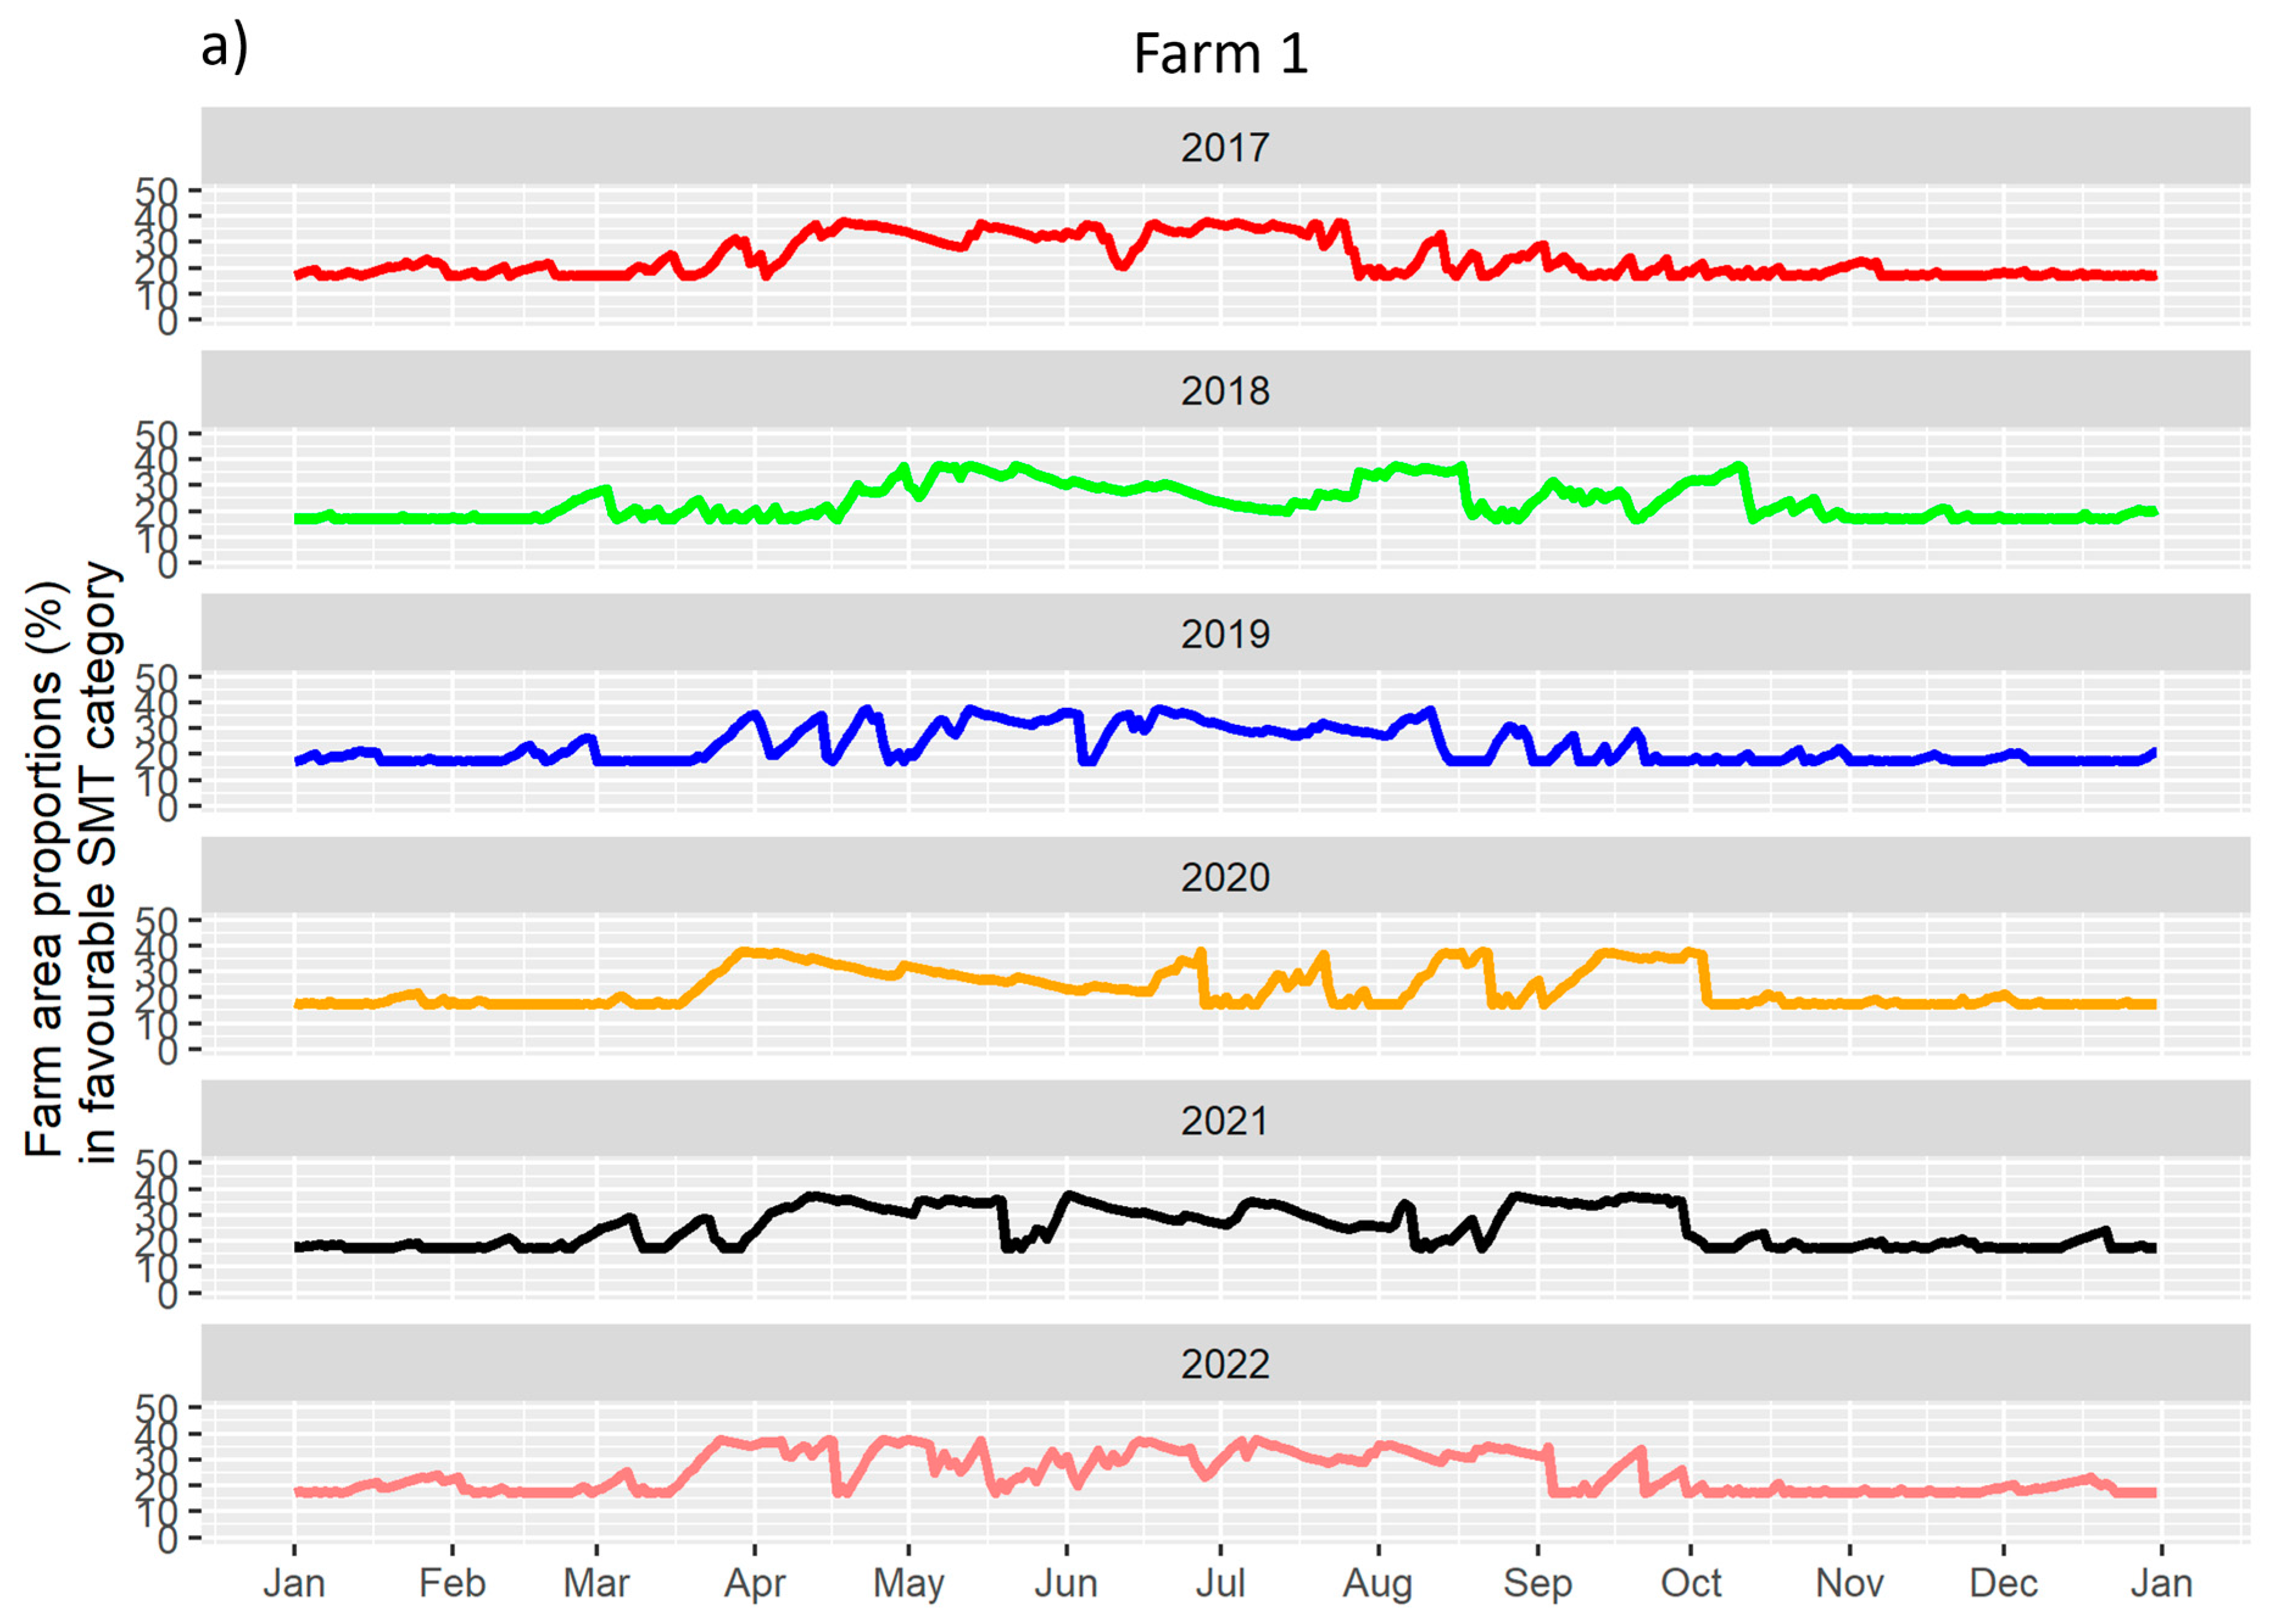
3.2. Patterns of nSSM on the Farms

Figure 4 shows the nSSM maps for Farms 1 and 2 for dates corresponding to negative, roughly zero, and maximum SMDs in the time series. A negative SMD corresponds to very wet conditions when the soil is saturated; an SMD value close to zero indicates field capacity; positive SMD corresponds to very dry conditions; and beyond 50 mm of SMD, drought-like conditions set in. The maps reveal the spatial variability in the soil moisture regime on any given day, from very wet to very dry conditions, and there existed a spatial continuum. Blue areas indicate wet regions where the soil moisture is high and damage from soil compaction would be maximum, red regions indicate very dry conditions where crop growth is not supported, and green regions represent the favourable soil moisture category. As is evident from the maps, the green region was transient and “moved” in time from very wet to very dry conditions. It is interesting to note that even on the driest days (SMD of 81.3 mm and 75.4 mm for Farms 1 and 2, respectively), there existed a small portion of the farm that fell within the favourable SMT range, which was around 15% for Farm 1 and 3% for Farm 2. Figure 5 helps identify specific paddocks within the farm boundaries for the two farms, providing further insights into the nSSM patterns in Figure 4. These paddocks are represented by white rectangles and referred to as area 1, area 2, etc. for each farm. The paddocks depict nSSM patterns that are different from their surroundings, as explained below.
In Farm 1, area 1 (Figure 5a) remained majorly wet except in very dry conditions (SMD = 81.3 mm). The dominant soil subgroup is these paddocks was stagnic or typical brown earth. These soils have a high clay content that restricts downward movement of water through the soil. Paddocks 58 and 59 became very dry as the SMD went beyond 50 mm, although the soils in these paddocks were also poorly drained, which could have been due to management regimes. Area 2 (Figure 5a) also behaved interestingly, as it remained wetter than its surroundings through time, from very wet to very dry soil moisture conditions. This was expected, as the soil subgroup in this region was stagnic brown earths, which have increased clay content that impedes water movement and leading to wetter conditions. Area 3 (Figure 5a) also remained wetter than its surroundings, from very wet to dry conditions, even at SMD 54 mm. Primarily alluvial soils were found here, and the groundwater table was shallow, rising regularly, resulting in wetter soil moisture conditions. Area 4 (Figure 5a), which contained a mixture of luvisol and brown earth, fell within the favourable SMT category even on the driest day. This region tended to be drier than its surroundings, with a portion also falling within the favourable SMT category. This paddock area was dominated by luvisols, which are characterised by good drainage and have a loamy texture. It is important to note that on the ground, the red, blue, and green regions would merge with their preceding and succeeding classes of nSSM and are not rigid boundaries.
In Farm 2, similar patterns for wet, dry, and optimal conditions were seen as in Farm 1. When conditions were reached (SMD 75.4 mm), the entire farm went very dry. Areas 1 and 2 (Figure 5b) remained wetter than their surroundings, except in very dry conditions (SMD = 75.4 mm). This region was dominated by surface water gleys and brown Earths and was poorly drained, explaining this pattern. Area 3 (Figure 5b) was the wettest region on this farm through time, such that even under the driest SMD conditions, a small portion fell within the favourable SMT category. The soil type here was a mixture of surface water gleys and brown earth. Both these soil types have increased clay content, which restricts downward movement of water and can lead to stagnation of water. Even on a relatively dry day (SMD =36.8 mm), this region remained quite wet. The water table was shallow in area 4 (Figure 5b), leading to wetter conditions through time. There was a drain (shown by dashed line), which could help remove excess water and can probably explain why a portion of area 1 fell within the favourable SMT category when field capacity conditions were reached (SMD = 0.6 mm). A portion of area 5 (Figure 5b) remained under favourable SMT conditions even under waterlogged conditions (SMD = −10 mm), and this region got drier as drier conditions were observed. This region also had surface water gleys as the dominant soil type.

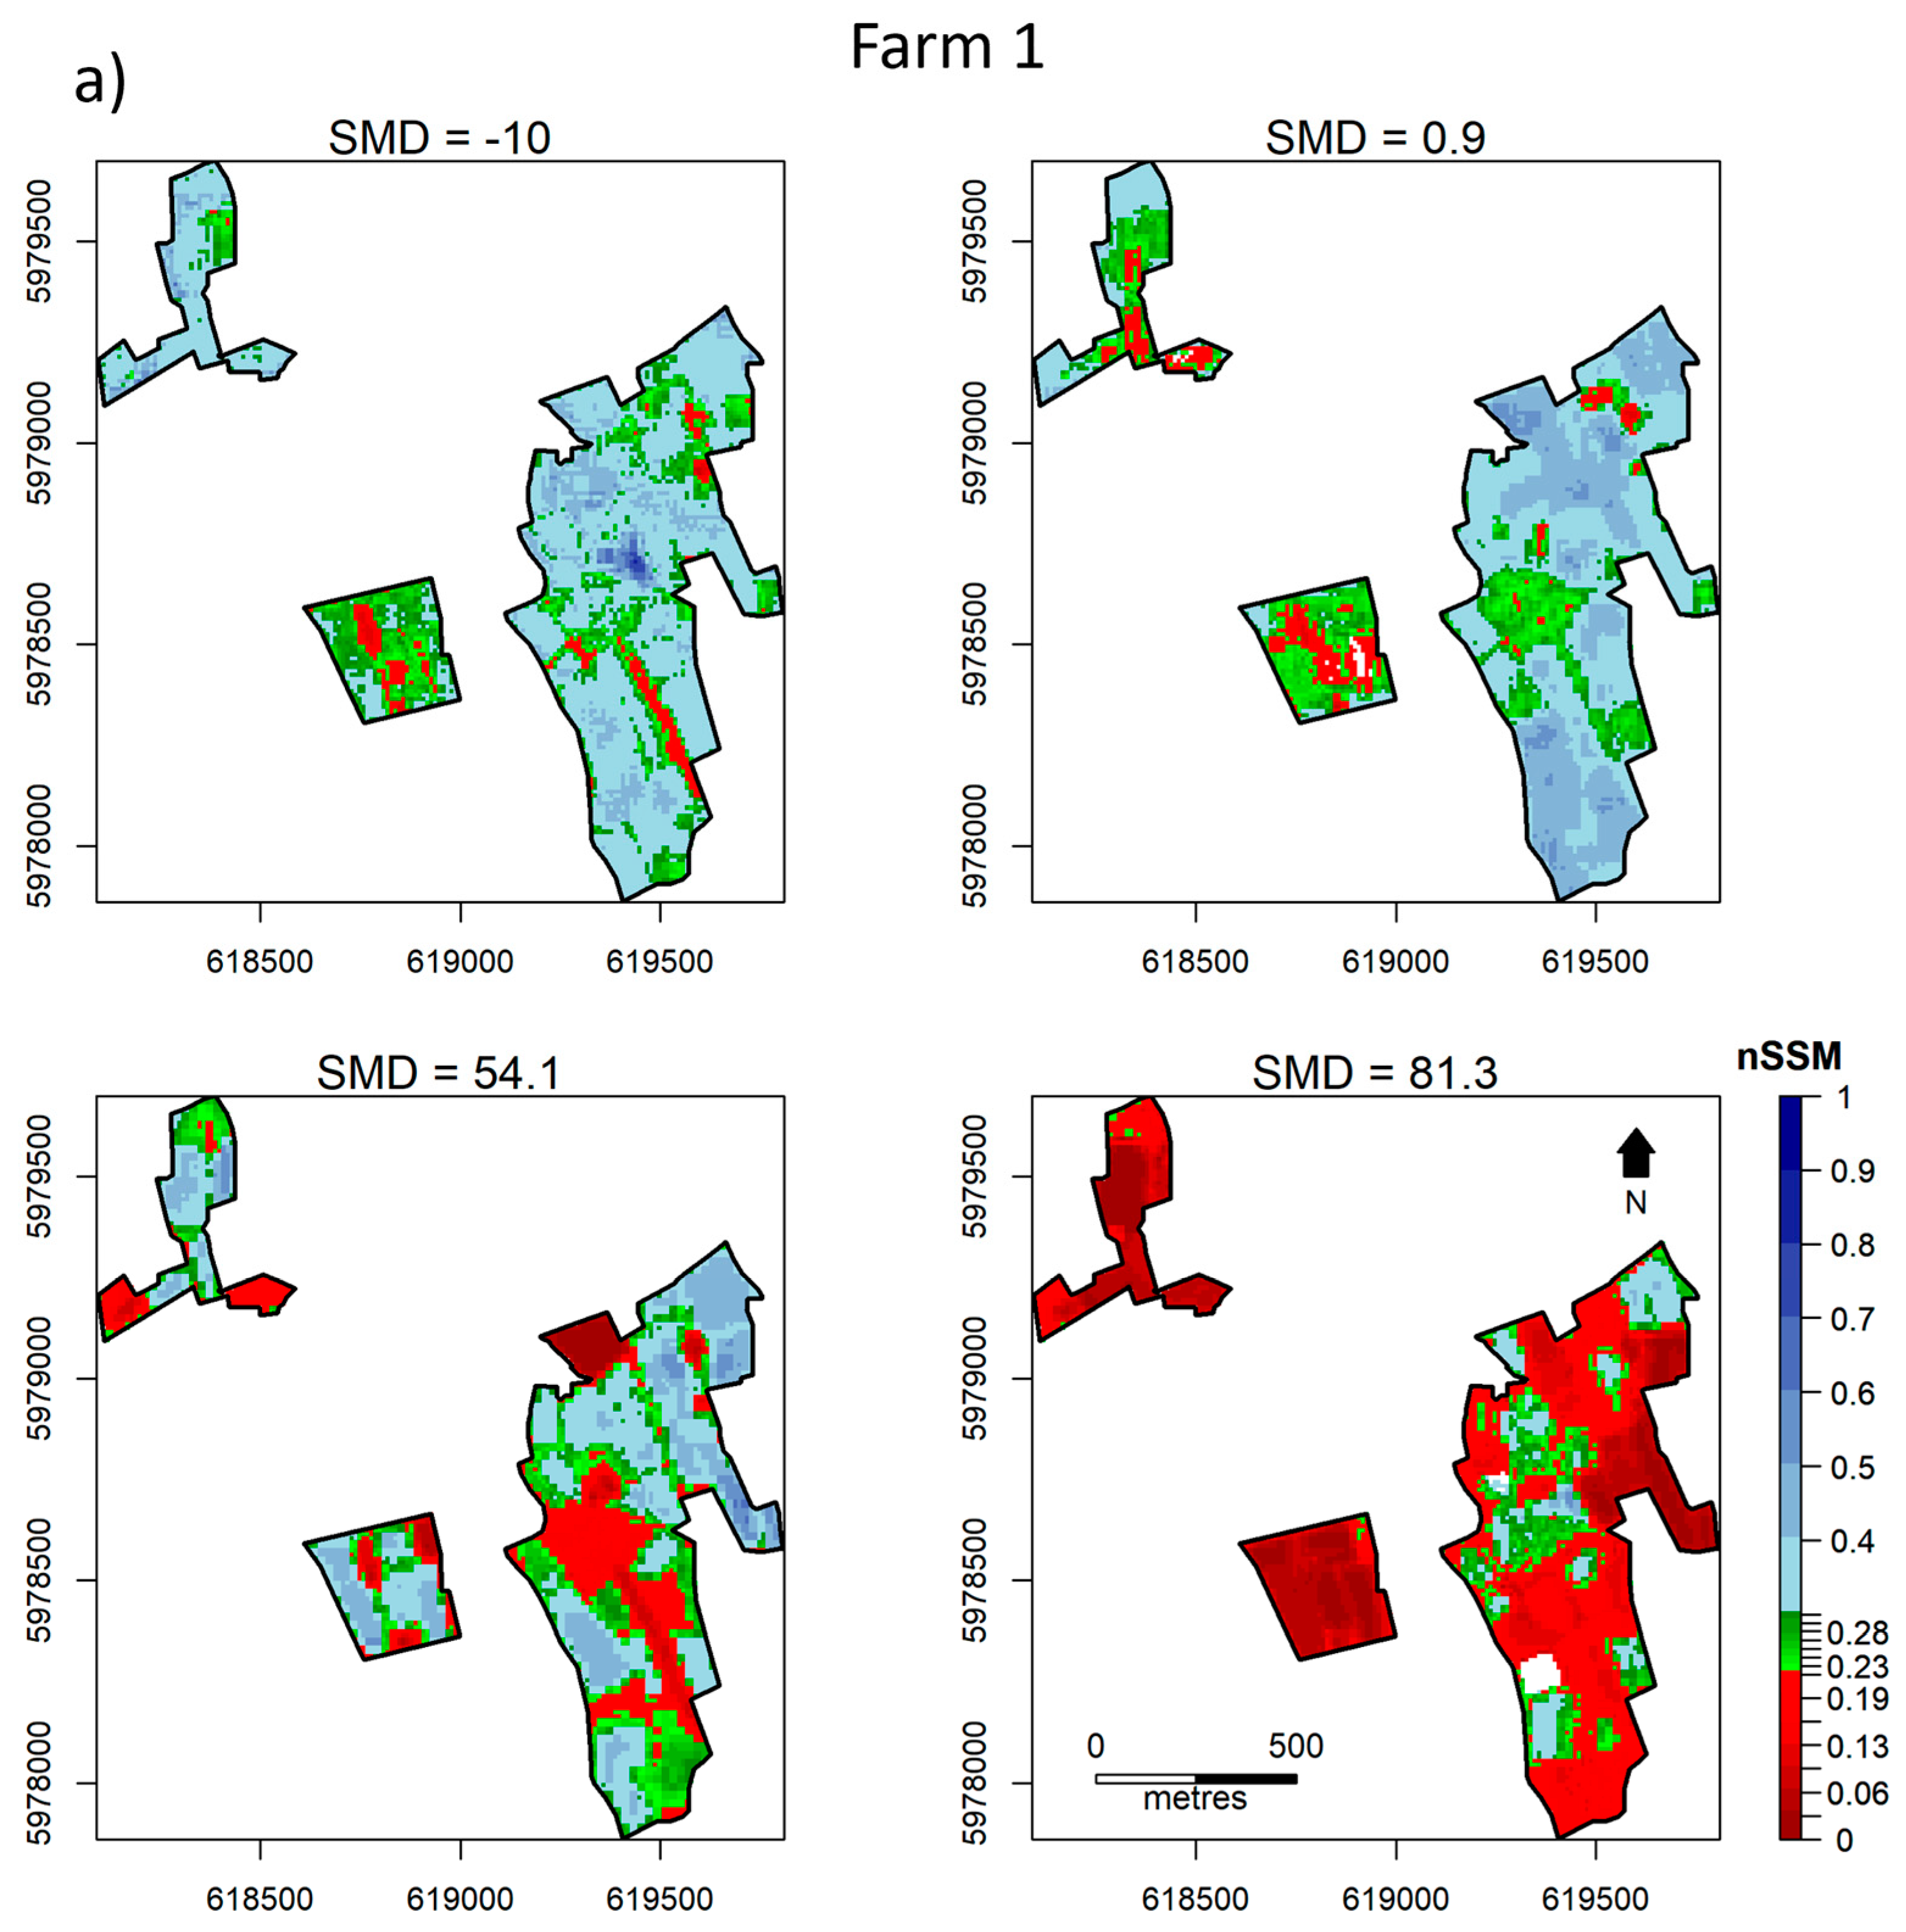
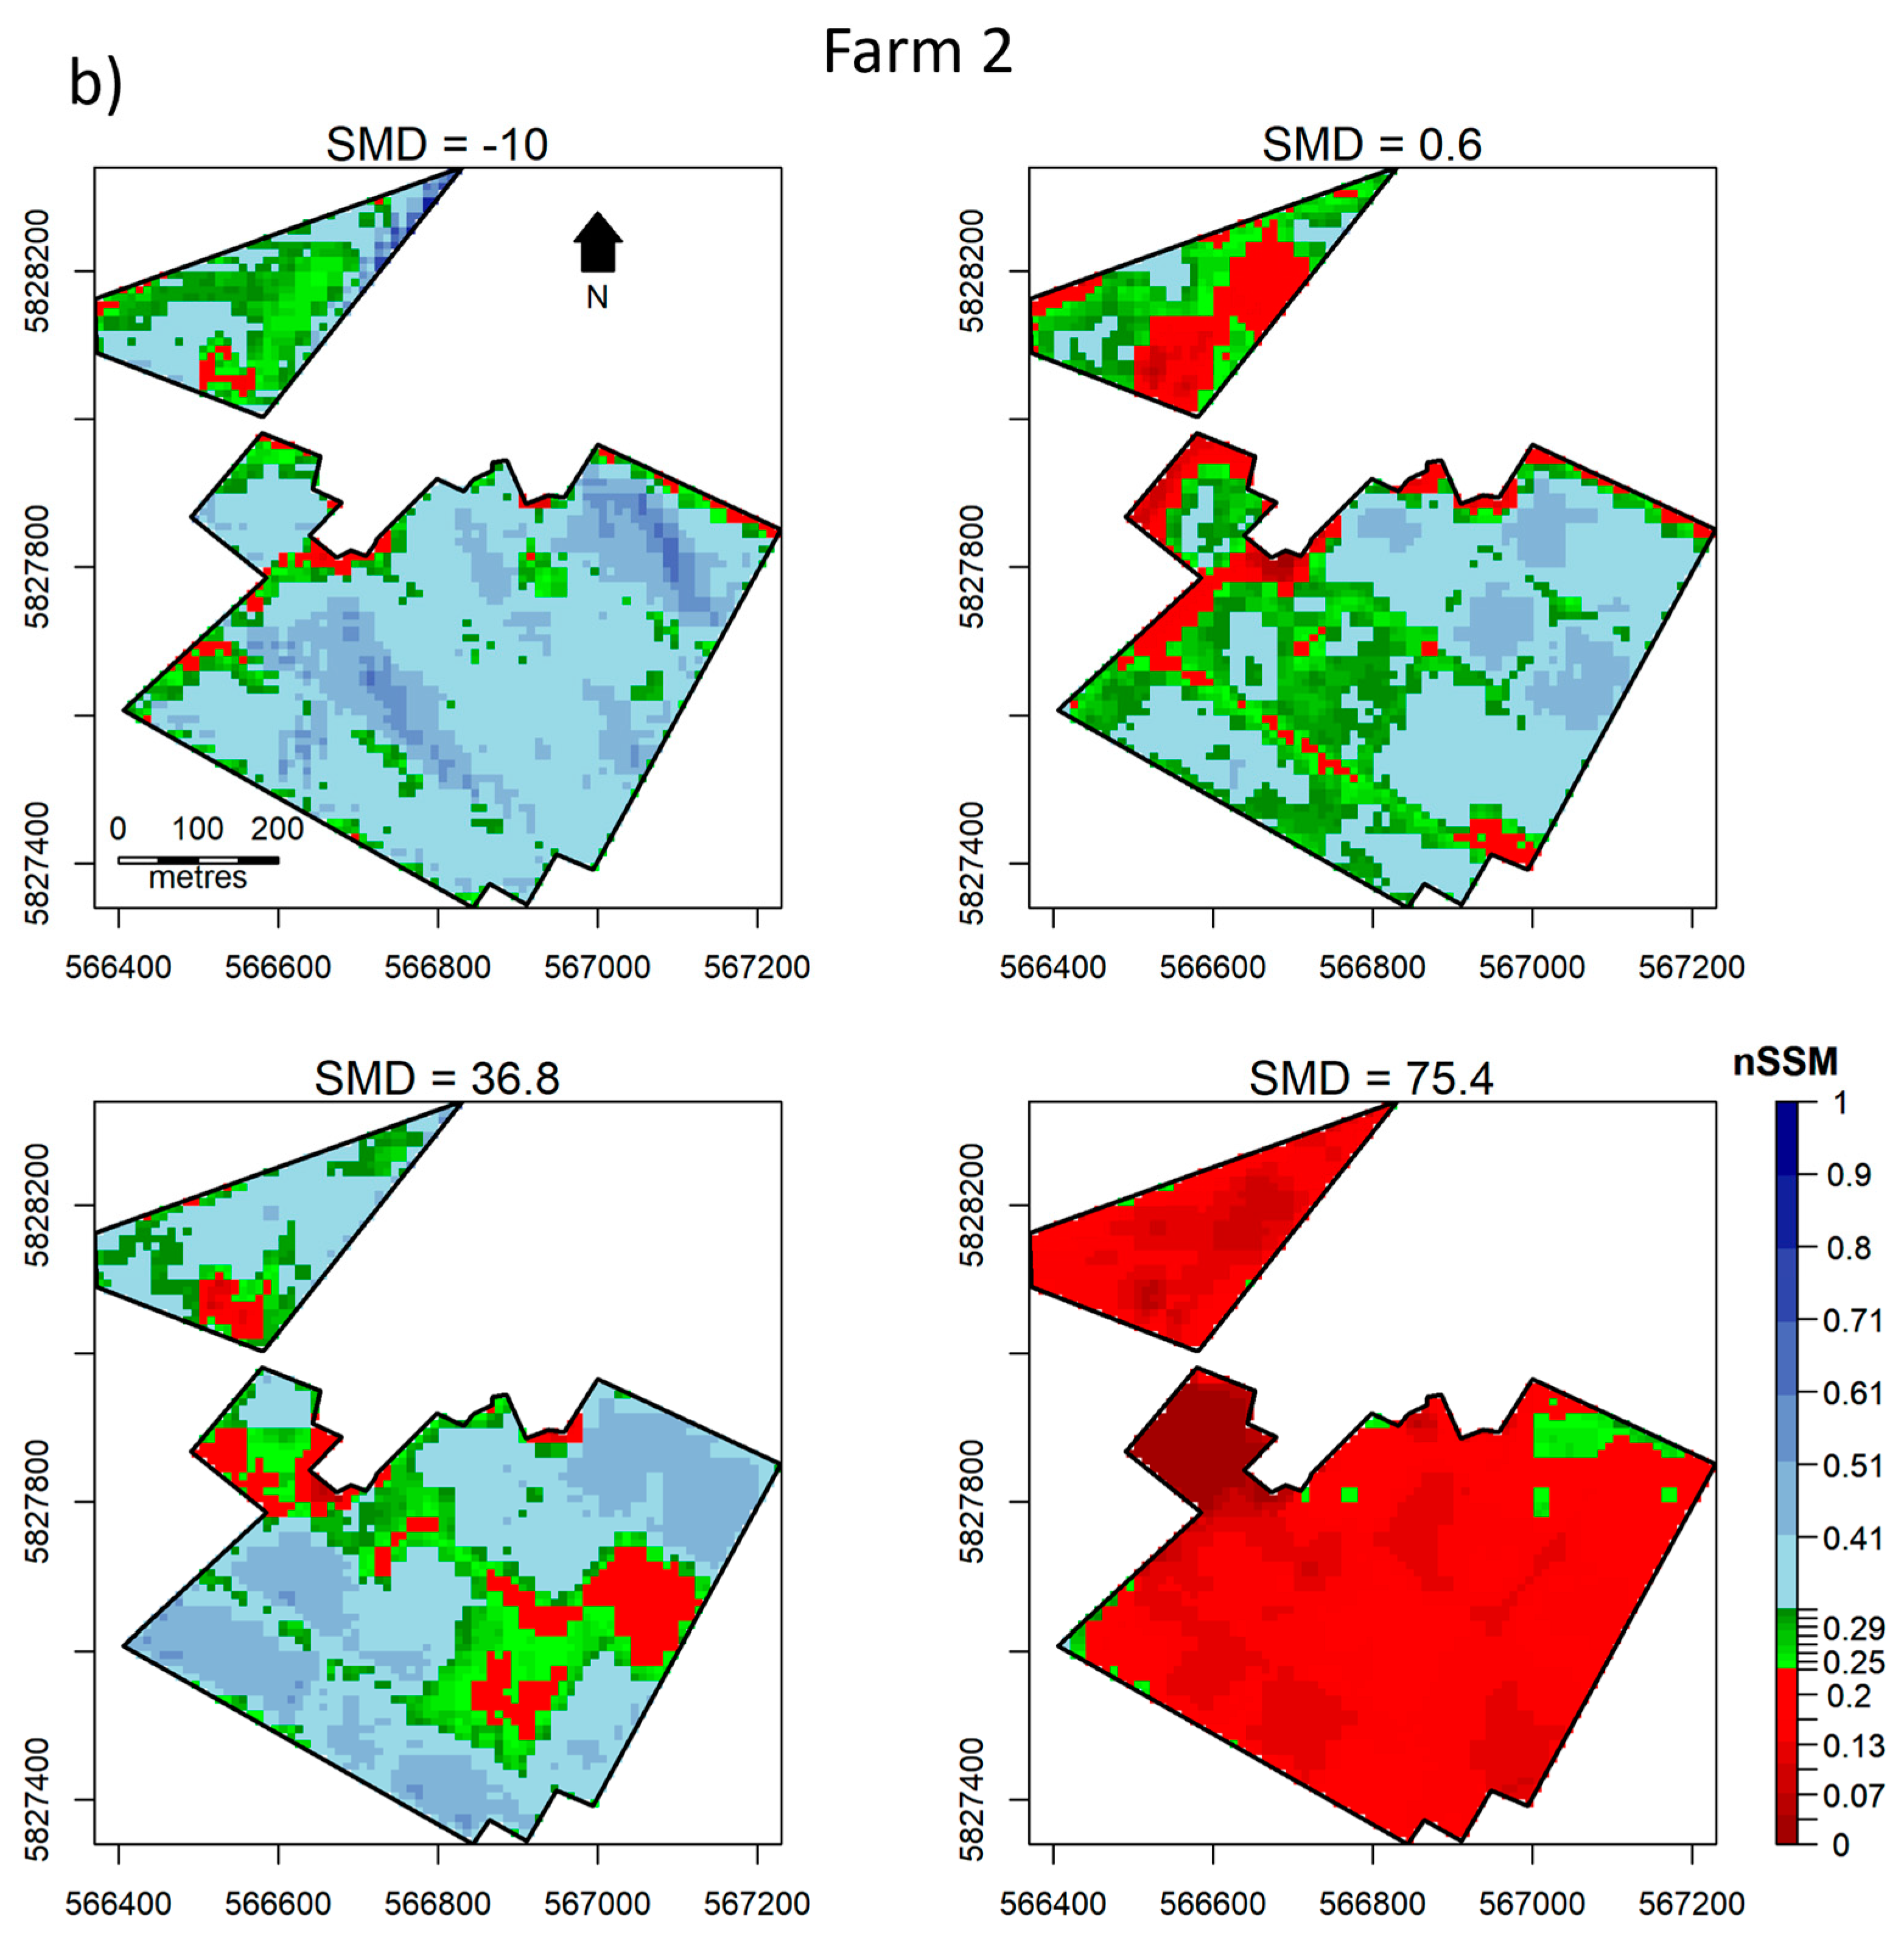
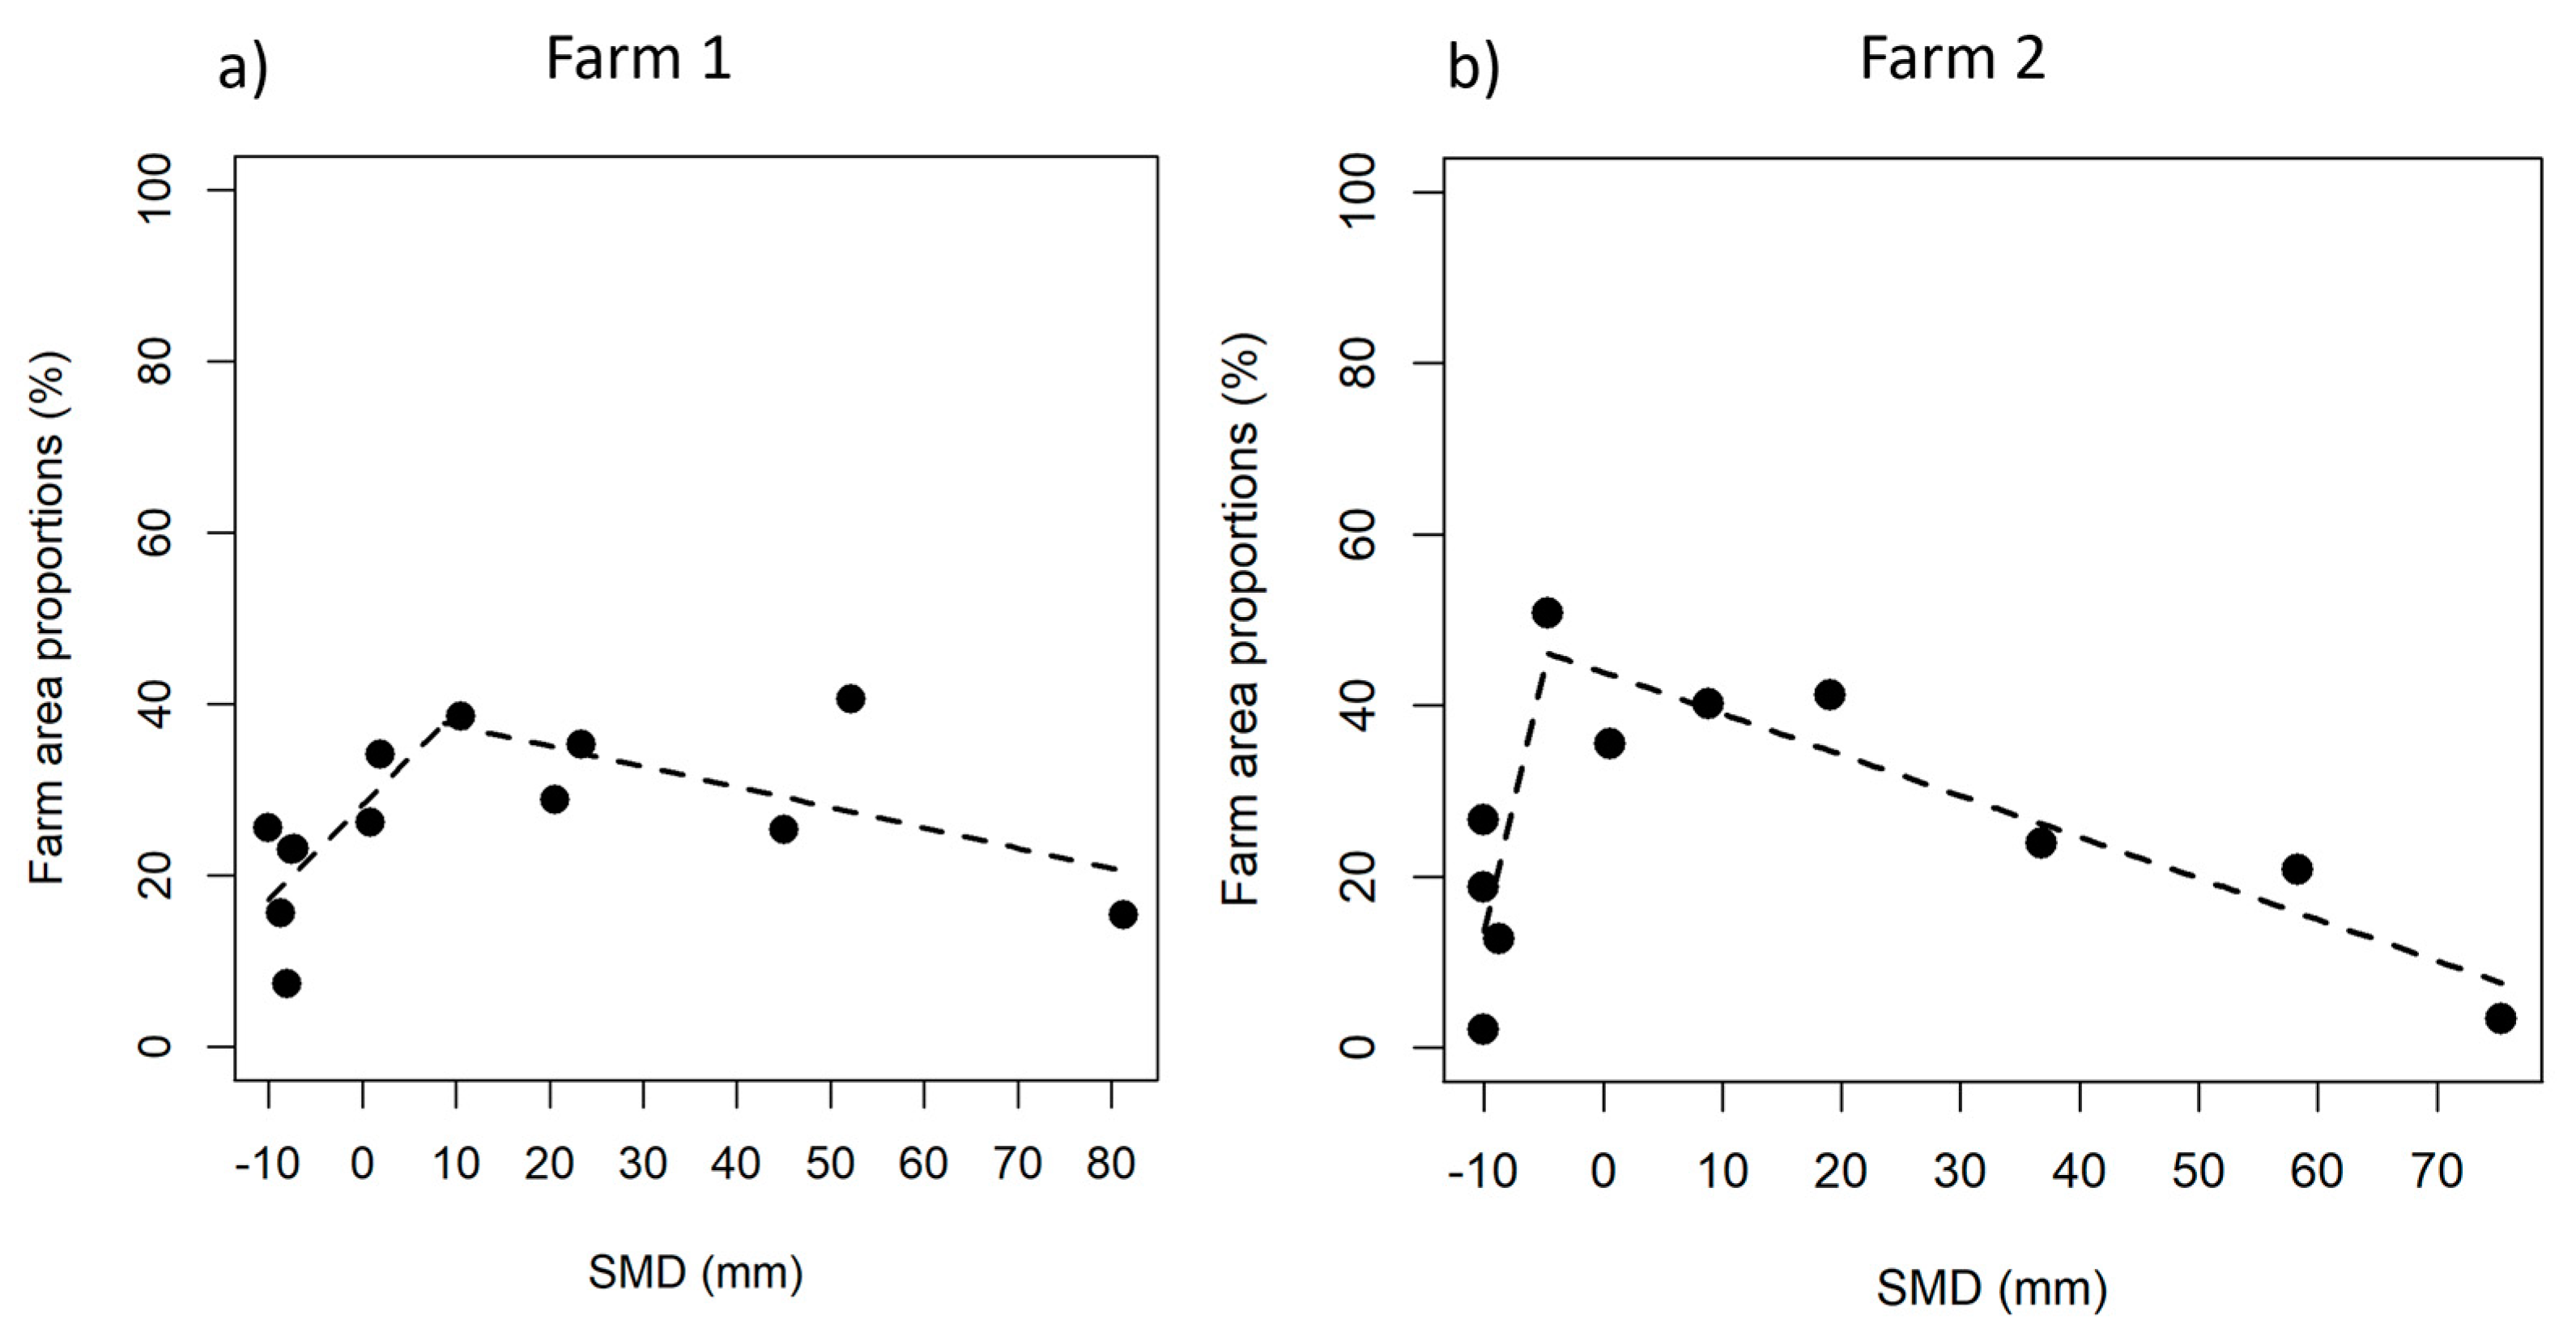
3.3. Proportion of Farm Area in the Favourable SMT

Figure 6 shows the piecewise linear regression model between proportion of farm area in the favourable category of SMT for the farms and the corresponding SMD on these dates. In the absence of a daily Sentinel 2 time series, this model was used for predicting daily farm area proportions in the favourable SMT category, ensuring that the temporal scale of SMD and nSSM time series matched, which was necessary for identifying trends of trafficability and grass growth (Figure 7a,b).
Figure 7 shows the farm area proportions in the favourable SMT category at a daily time step. This helps in identifying the overall performance of the farms in terms of their optimal area for crop growth and minimal soil compaction. It also helps identify their resilience towards any extreme climatic event across the time series, such as drought. It is clear from Figure 7 that Farm 1 had a less volatile time series than Farm 2, and it can be said that Farm 1 remained stable throughout the year, without much variation in the proportion of farm area in the favourable SMT category. Farm 2 showed high variability with respect to these farm area proportions; steep declines could be seen in certain months. Farm 2 sometimes had nearly 50% of the farm area able to be safely trafficked with less damage due to compaction; this figure was around 40% for Farm 1. It is worthwhile to especially analyse the farm area proportions in the favourable SMT category for the years 2017–2019. This is because 2018 was a drought year in Ireland, where anomalies can be expected in terms of the behaviour of the farms. 2017 and 2019 can be considered “normal” years. For both farms, the farm area proportions in the favourable SMT category varied greatly in 2018. However, a very strong drop in the proportion was observed for Farm 2 in July (from nearly 35% in June to less than 10% in July). For Farm 1, the drop was gradual and less severe, and the farm was able to make a recovery in August 2018 to around 30%. Similarly, the time series for the farm area proportions in 2017 and 2019 almost followed a normal distribution for Farm 1, whereas the proportions greatly varied for Farm 2 even in the normal years. For Farm 2, a significant drop in the favourable farm area proportion observed in July 2019, comparable to that in 2018. A steep decline in the favourable farm area proportion was also observed during May–July 2020 for Farm 1. However, compared with Farm 2, Farm 1 was able to make a recovery from the drought in the following year in 2019. In 2020, there was a drop in the favourable farm area proportions for both farms between April and June, the decline being sharper for Farm 2. Figure 8 further illustrates these patterns through a comparison of farm area proportions in the favourable SMT category in 2018 and the average of these proportions for 2017 and 2019. For Farm 1, the green curve represents an almost normal distribution, while the green curve was very dynamic for Farm 2, with a significant reduction in favourable farm area proportions in July. The red curve for Farm 1 depicts a more stable response towards drought than that for Farm 2, with gradual declines. The decline in farm area proportions in the favourable SMT category was much sharper for Farm 2, with less than 10% of area in the favourable category, while Farm 1 had around 25% of area that was safe for farm operations.

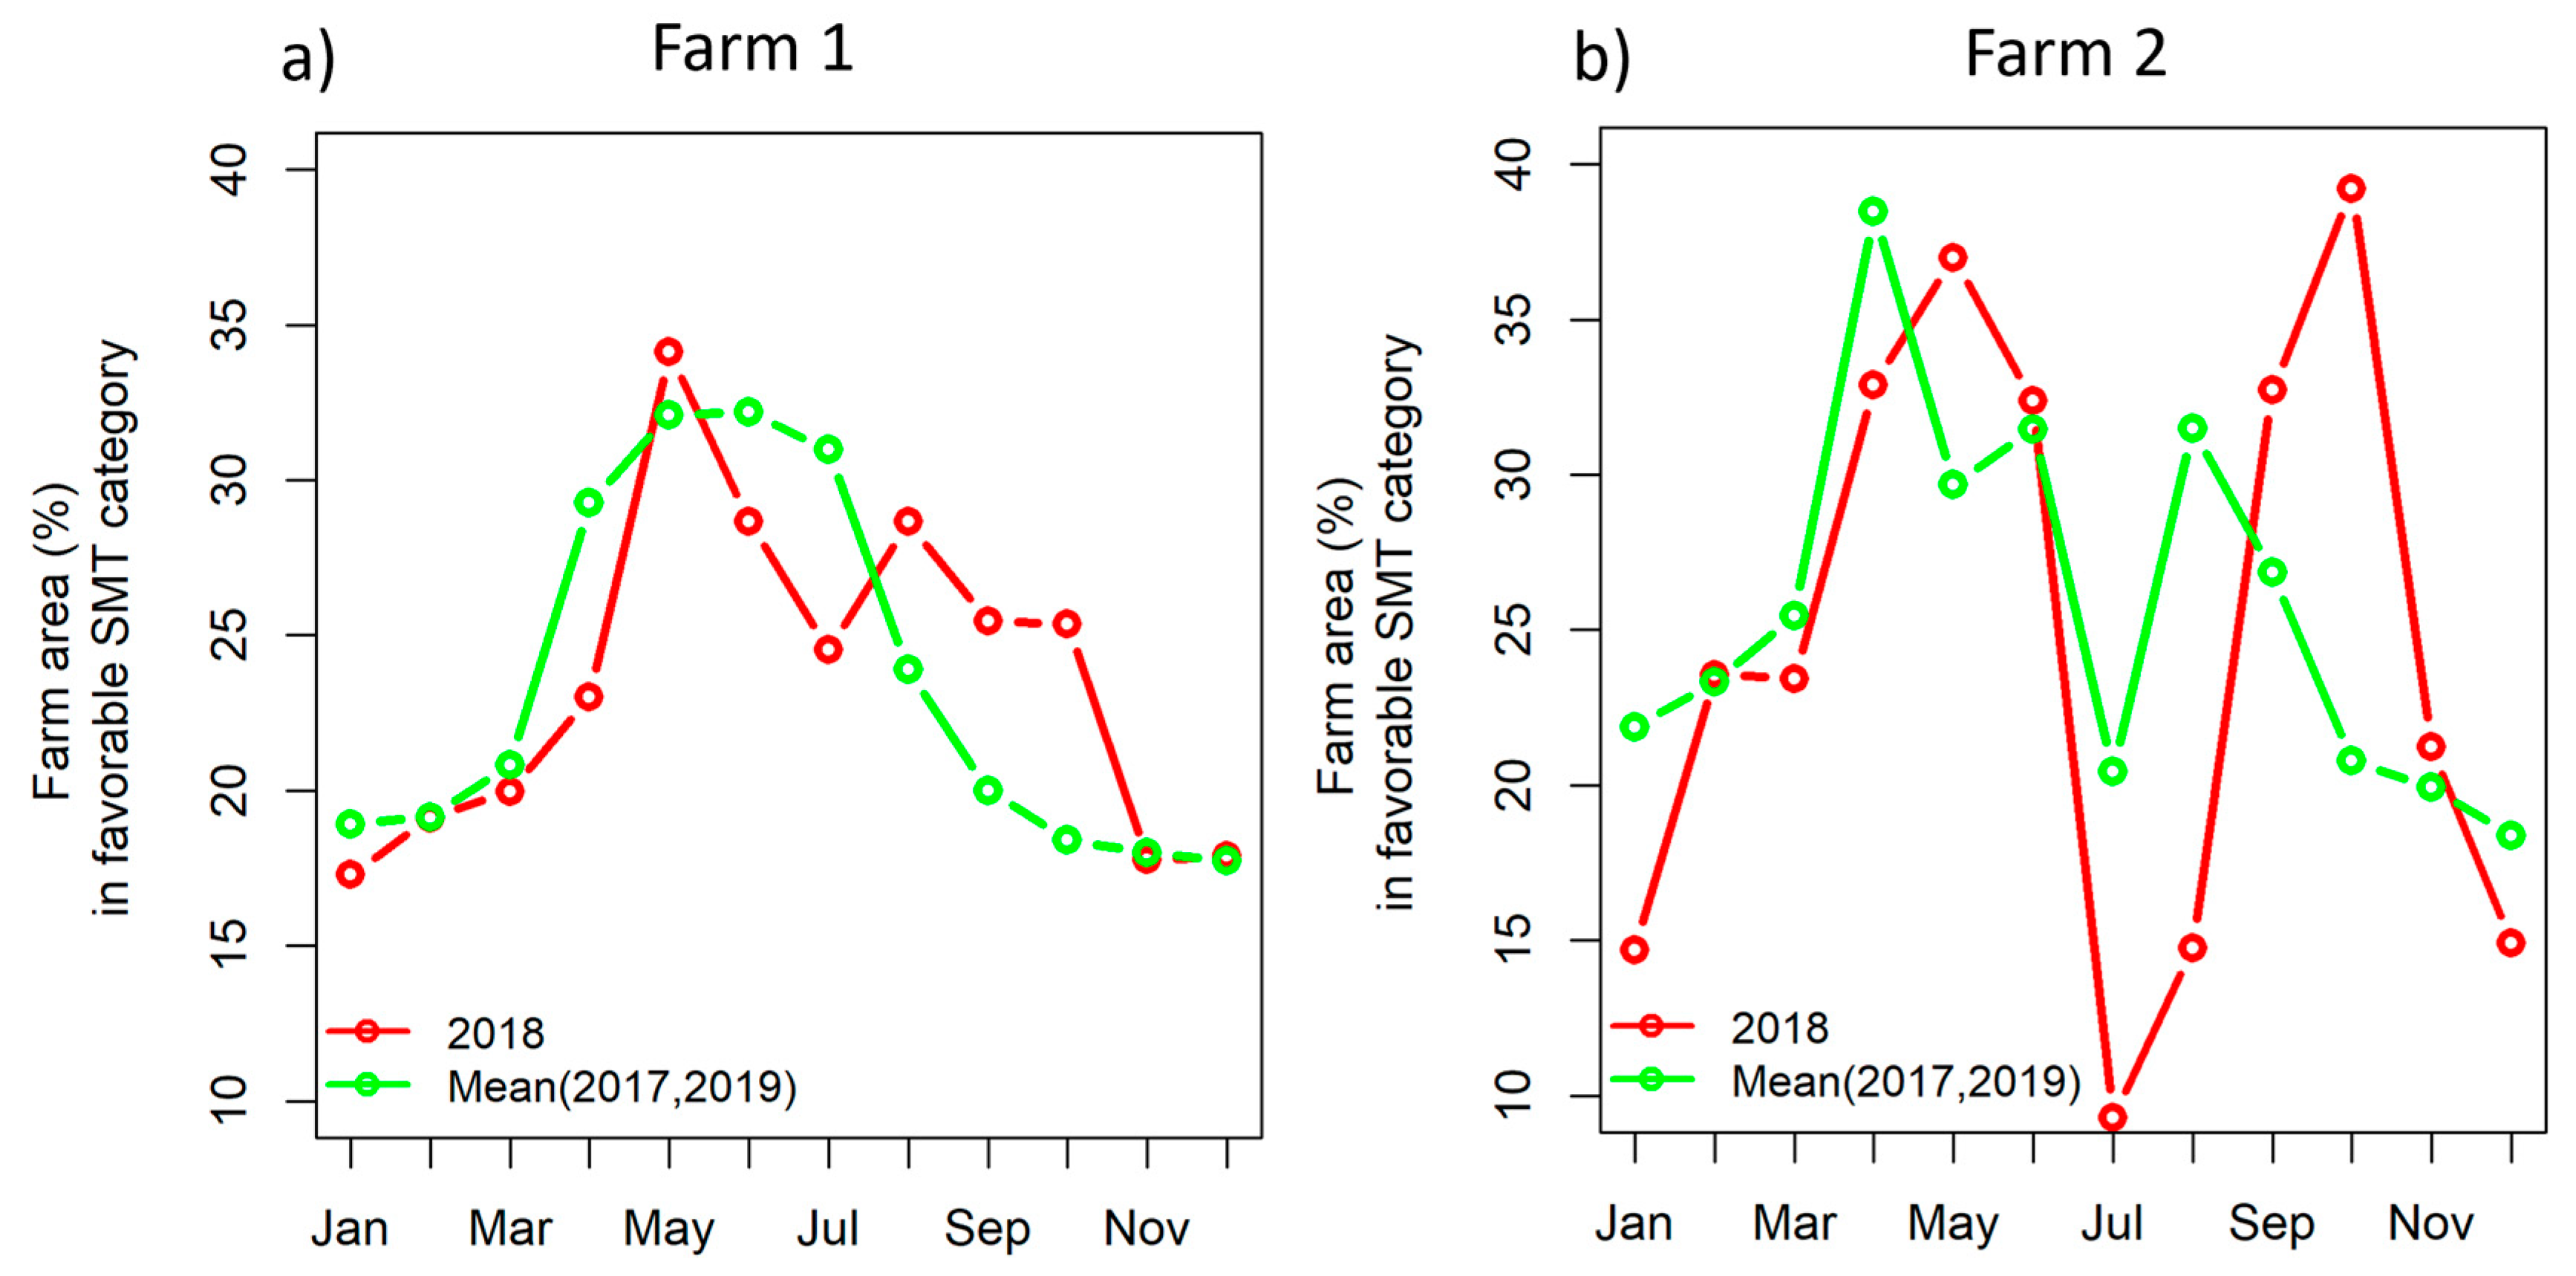
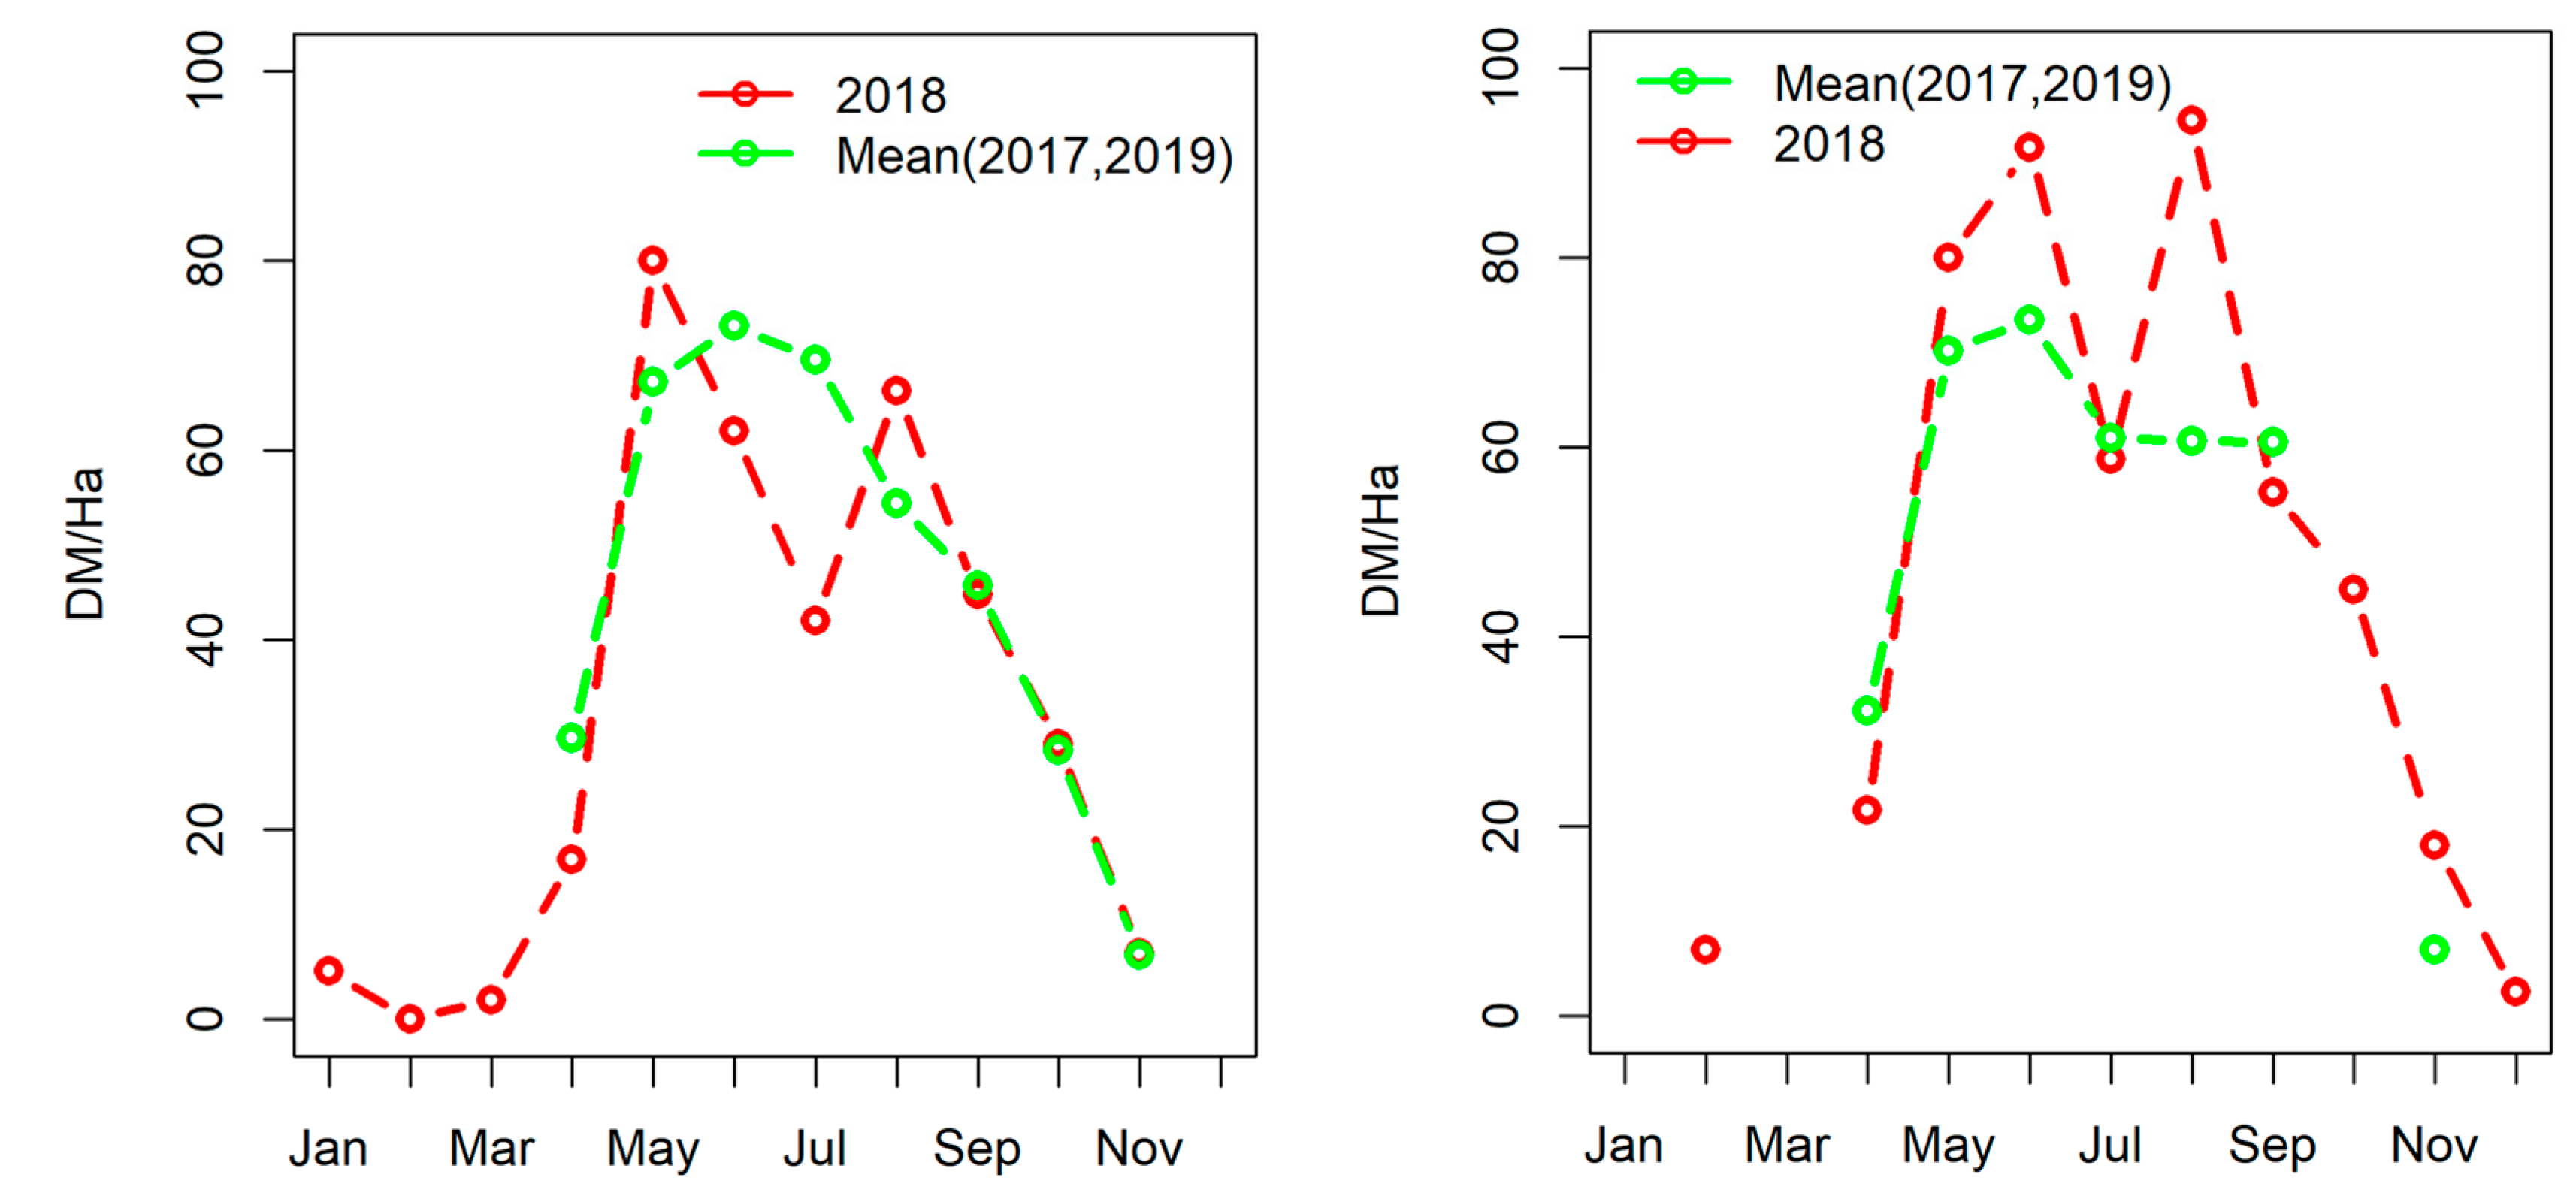
3.4. Comparison of Trends in Farm Area Proportion and Grass Growth Trends

Figure 9 compares the farm area proportions in the favourable SMT category with the corresponding grass growth curves for the year 2017–2019. Average of the variables of grass growth and farm area proportions were calculated for 2017 and 2019 and compared with that in 2018. The average grass growth curve and the farm area proportions followed a near Gaussian distribution for Farm 1, while such patterns were not observed for Farm 2. It is interesting to note that for both farms, the grass growth curves and the farm area proportion curves followed similar trajectories with respect to each other, suggesting that grass growth was indeed supported when conditions on the farm were favourable. In the drought year of 2018, both farms witnessed a decline in grass growth, especially in the month of July. This decline was akin to the pattern in farm area proportions for the farms during this time. The amount of grass produced (DM kg/ha) was, however, higher for Farm 2 in the drought year; this could have been due to differences in management.

4. Discussion

This paper presents a comprehensive overview and comparison of two dairy farms in Ireland with respect to their behaviour and resilience to extreme events (extreme rain and drought). The methodology developed in this paper is simple and can be easily modified to adapt to changing soil moisture conditions due to climate change. This study developed SMTs based on SMD thresholds of 10 mm and 50 mm. However, a recent study by Lepore et al. [32] showed that the risk to physical degradation of soil sets in at SMD ≤ 0 mm, and for farms with multiple trafficking events throughout the year, a 0 mm threshold of SMD minimises damage to soil physical structure. Thus, the methodology developed in this study could be easily modified to include the new thresholds. This study presents an example wherein depending on soil moisture conditions, certain areas of the farm could be used even under very wet or very dry conditions. Farmers require long grazing seasons for increased profits in a pasture-based dairy system such as that in Ireland [33,34,35]. However, this could also increase the risk of permanent damage to soil structure due to compaction, damaging swards and lowering yields [32,36]. A study by Fenger et al. [37] and Beukes et al. [38] demonstrated that controlling grazing based on soil moisture conditions decreased damage due to treading, with no change in annual pasture or milk production.
The two farms were considered similar with respect to their broad soil type and drainage characteristics. However, this study pointed out subtle differences in their topography and soil texture that could have resulted in different abilities to cope with climate change and further ease of management. Farm 2 had less variability with respect to the soil types and topography than Farm 1. Most of the farm was dominated by surface water gleys, followed by typical/stagnic brown earths. Certain regions (area 3, Figure 5b) on this farm remained relatively wet even on a very dry day. This was because the soils on Farm 2 had increased clay content, which restricted downward movement of water, leading to wetter conditions on the surface. Farm 1 also showed majorly wet conditions through time. This farm had both a shallow groundwater table and clayey soil, which explain the high soil moisture conditions on this farm. With other factors, such as rainfall and crop type, remaining similar, topography seems to be the key factor governing for the observed patterns. Soil characteristics in Ireland are dictated by the interaction between time, parent material, topography, climate, and living organisms. With respect to runoff and drainage, topography is an important factor, as it governs the position of soils on the landscape [39]. Since, Farm 2 was flat, any effect of high and low rainfall was almost instantaneous, whereas in Farm 1, differences in slopes gave time for recovery, and soils on the slope behaved differently, acting like a buffer. The steeper slopes in Farm 1 are likely to have promoted less infiltration and more overland flow, whereas the flat terrain in Farm 2 promoted infiltration with less overland flow. This means that low-lying and flat areas received runoff from steep and gently sloping areas of the farm (although the latter areas had some limited infiltration due to higher permeability), leading to wetter conditions and waterlogging. Thus, poorly drained soils dominated low-lying areas [39]. On the slopes for Farm 1, water was able to flow to the surrounding areas, preventing stagnation, while lower areas may have suffered from waterlogging. However, in these farms, which were dominated by poorly-draining soils that tend to get waterlogged after a rainfall event, soils of poor drainage could be found even on slopes where the parent material is of poor permeability, impeding water movement or otherwise leading to development of springs in horizons of high permeability.
Drumlins (as seen in Farm 1) constitute a major physiographic feature of the landscape in north–central Ireland. Lee and Ryan [40] examined a clinosequence of soils associated with drumlin landscapes. The results showed that slope influenced soil profile development, with eroded pseudogleys (imperfectly drained) on the drumlin crest (level to very gently sloping); brown podzolics (moderately well-drained) on the middle slopes (moderately to strongly sloping); pseudogleys with relatively thick A horizons on the lower drumlin slopes (gently to moderately sloping); and gleys (poorly drained) along the drumlin base (level to gently sloping). Since the dominating difference was that of inherent drainage conditions, they may be considered to constitute a catena or a hydrologic sequence, which led to differential soil drainage characteristics at field scale on the Farm 1. This led to contrasting soil moisture conditions within Figure 3 at different SMD extremes (e.g., drought conditions for the farm were not reflected within the drumlin). Farm management would thus be more challenging in Farm 2 because of the absence of a “buffer” phenomenon. Therefore, high-resolution soil moisture maps and terrain data revealed inherent differences between their topography. In future, these differences must be taken into consideration, and modifications should be made to existing farm management decision support tools to achieve higher productivity and efficient utilisation of nutrients and other resources.

5. Conclusions

This study paves the way for the development of a satellite-based farm management decision support tool wherein specific areas on the farm can be identified that perform better than other areas in terms of risk from compaction and supporting crop growth (Figure 3). This study emphasises the importance of soil moisture information for farm-level decision making, such as the adoption of precision farming with targeted fertiliser application and irrigation. Satellite data help address the challenges of obtaining continuous soil moisture measurements over large areas, which is crucial for agricultural water management. In a changing climate, it is imperative to be able to utilise available resources to their maximum capacity. This study illustrates the advantage of using high-resolution satellite-derived soil moisture estimates, such that the spatial variability in soil moisture can been observed for a given day (Figure 4), when otherwise SMD is reported as a constant value for the entire farm.
Through a case study of dairy farms in Ireland presenting regional insights, this study highlights global challenges in agriculture due to climate change and aims to provide a solution for the same. The methodology in this study was developed in Ireland, which has a temperate maritime climate, and the results are specific to the study area. The concept developed in this study could be developed for precision agricultural management globally, especially to meet environmental goals of reducing agricultural water pollution and increasing nutrient efficiency. This study provides a starting point for testing the robustness of this simple approach by applying the methods in different climatological, topographical, and/or farm-management regimes and suggesting necessary modifications. Additionally, the use of microwave datasets could be investigated to take advantage of cloud-penetrating capabilities overcoming limitations of optical data.

Supplementary Materials

The following supporting information can be downloaded at: https://www.mdpi.com/article/10.3390/agriculture15090920/s1.

Author Contributions

R.B.: conceptualization, methodology, software, formal analysis, investigation, data curation, writing—original draft, writing—review and editing; O.F.: conceptualization, methodology, investigation, data curation, writing—review and editing, supervision; G.M.: data curation, software, analysis, writing—review and editing; P.T.: conceptualization, methodology, investigation, data curation, writing—review and editing, supervision, project administration, funding acquisition. All authors have read and agreed to the published version of the manuscript.

Funding

This research and APC was funded by Vista Milk SFI Research Centre, Teagasc, Science Foundation Ireland (SFI) and the Department of Agriculture, Food, and the Marine on behalf of the Government of Ireland under grant number [16/RC/3835].

Institutional Review Board Statement

Not applicable.

Data Availability Statement

The data presented in this study are available on request from the corresponding author. The data are not publicly available because of the need to ensure the privacy of the landowners.

Acknowledgments

The authors thank the farmers involved who provided land access, time, and resources for the study.

Conflicts of Interest

The authors declare no conflict of interest.

References

  1. ECMWF. ECMWF Copernicus Global Climate Highlights. 2023. Available online: https://climate.copernicus.eu/gch-2023-press-resources (accessed on 3 April 2025).
  2. Copernicus Climate Change Service. Copernicus: 2020 Warmest Year on Record for Europe; Globally, 2020 Ties with 2016 for Warmest Year Recorded. Available online: https://climate.copernicus.eu/copernicus-2020-warmest-year-record-europe-globally-2020-ties-2016-warmest-year-recorded (accessed on 15 January 2025).
  3. Nations, U. A Year of Climate Contrasts in Europe. 2023. Available online: https://unric.org/en/2023-a-year-of-climate-contrasts-in-europe/ (accessed on 3 April 2025).
  4. Copernicus Climate Change Service Europe State of The Climate 2023. 2023. Available online: https://climate.copernicus.eu/sites/default/files/custom-uploads/ESOTC%202023/Summary_ESOTC2023.pdf (accessed on 22 April 2024).
  5. Met Eireann Annual Climate Statement for 2023. Available online: https://www.met.ie/annual-climate-statement-for-2023 (accessed on 12 April 2025).
  6. Almendra-Martin, L.; Martinez-Fernandez, J.; Piles, M.; Gonzalez-Zamora, A.; Benito-Verdugo, P.; Gaona, J. Analysis of Soil Moisture Trends in Europe Using Rank-Based and Empirical Decomposition Approaches. Glob. Planet. Chang. 2022, 215, 103868. [Google Scholar] [CrossRef]
  7. EPA. What Impact Will Climate Change Have on Ireland. Available online: https://www.epa.ie/environment-and-you/climate-change/what-impact-will-climate-change-have-for-ireland/#d.en.84746 (accessed on 1 February 2025).
  8. Met Eireann Provisonal State of the Irish Climate Report. 2023. Available online: https://www.met.ie/state-of-the-irish-climate-report-2023 (accessed on 12 December 2024).
  9. Met Eireann Ireland’s 30 Year Climate Averages. Available online: https://www.met.ie/climate/30-year-averages (accessed on 5 February 2025).
  10. Lennon, J.J. Potential Impacts of Climate Change on Agriculture and Food Safety Within the Island of Ireland. Trends Food Sci. Technol. 2015, 44, 1–10. [Google Scholar] [CrossRef]
  11. EPA. Ireland’s Climate Change Assessment Syntheis Report. Available online: https://www.epa.ie/publications/monitoring--assessment/climate-change/ICCA_Synthesis_Report.pdf (accessed on 8 January 2025).
  12. Sweeney, J. Climate Change in Ireland: Science, Impacts and Adaptation. In Palgrave Studies in Media and Environmental Communication; Palgrave Macmillan: Cham, Switzerland, 2020; pp. 15–36. ISBN 978-3-030-47587-1. [Google Scholar]
  13. Teagasc Moorepark Dairy Levy Research Update Teagasc Heavy Soils Programme—Lessons Learned—A Guide to the Key Findings of the Teagasc Heavy Soils Programme to-Date. Available online: https://www.teagasc.ie/media/website/animals/dairy/Heavy-Soils-Lessons-Learned.pdf (accessed on 9 December 2022).
  14. Lepore, E.; Schmidt, O.; Fenton, O.; Tracy, S.; Bondi, G.; Wall, D. Moisture Limits for Grassland Soil to Avoid Structural Damage Due to Machine Trafficking. In Proceedings of the EGU23, Copernicus Meetings. Vienna, Austria, 22 February 2023. [Google Scholar]
  15. Forristal, D. Managing Wet and Weak Soils. Available online: https://www.teagasc.ie/media/website/environment/soil/Teagasc_Drainage_Manual_2022.pdf (accessed on 5 February 2025).
  16. Tuohy, P.; Humphreys, J.; Holden, N.; O’Loughlin, J.; Reidy, B.; Fenton, O. Visual Drainage Assessment: A Standardized Visual Soil Assessment Method for Use in Land Drainage Design in Ireland. In Proceedings of the 2016 10th International Drainage Symposium Conference, Minneapolis, MN, USA, 6–9 September 2016. [Google Scholar]
  17. Nanda, A.; Das, N.; Singh, G.; Bindlish, R.; Andreadis, K.M.; Jayasinghe, S. Harnessing SMAP Satellite Soil Moisture Product to Optimize Soil Properties to Improve Water Resource Management for Agriculture. Agric. Water Manag. 2024, 300, 108918. [Google Scholar] [CrossRef]
  18. Furtak, K.; Wolińska, A. The Impact of Extreme Weather Events as a Consequence of Climate Change on the Soil Moisture and on the Quality of the Soil Environment and Agriculture—A Review. Catena 2023, 231, 107378. [Google Scholar] [CrossRef]
  19. Chatterjee, S.; Desai, A.R.; Zhu, J.; Townsend, P.A.; Huang, J. Soil Moisture as an Essential Component for Delineating and Forecasting Agricultural Rather than Meteorological Drought. Remote Sens. Environ. 2022, 269, 112833. [Google Scholar] [CrossRef]
  20. Basu, R.; Daly, E.; Brown, C.; Shnel, A.; Tuohy, P. Temporal Stability of Grassland Soil Moisture Utilising Sentinel-2 Satellites and Sparse Ground-Based Sensor Networks. Remote Sens. 2024, 16, 220. [Google Scholar] [CrossRef]
  21. Basu, R.; Fenton, O.; Daly, E.; Tuohy, P. Identifying Favourable Conditions for Farm Scale Trafficability and Grass Growth Using a Combined Sentinel-2 and Soil Moisture Deficit Approach. Front. Environ. Sci. 2024, 12, 1331659. [Google Scholar] [CrossRef]
  22. Arosio, R.; Wheeler, A.J.; Sacchetti, F.; Guinan, J.; Benetti, S.; O’Keeffe, E.; van Landeghem, J.J.K.; Conti, L.A.; Furey, T.; Lim, A. The Geomorphology of Ireland’s Continental Shelf. J. Maps 2023, 19, 2283192. [Google Scholar] [CrossRef]
  23. Environmental Protection Agency Irish Soil Information System Synthesis Report. 2014. Available online: https://www.epa.ie/publications/research/land-use-soils-and-transport/EPA-RR130-WEB.pdf (accessed on 17 April 2025).
  24. Carlier, J.; Doyle, M.; Finn, J.A.; Ó hUallacháin, D.; Moran, J. A Landscape Classification Map of Ireland and Its Potential Use in National Land Use Monitoring. J. Environ. Manag. 2021, 289, 112498. [Google Scholar] [CrossRef]
  25. Simo, I.; Creamer, R.E.; Reidy, B.; Jahns, G.; Massey, P.; Hamilton, B.; Hannam, J.A.; McDonald, E.; Sills, P.; Spaargaren, O. Irish Soil Information System. 2008. Available online: http://gis.teagasc.ie/soils/ (accessed on 17 April 2025).
  26. Sensoterra Single Depth Sensor|Sensoterra. Available online: https://www.sensoterra.com/en/product/single-depth-sensor/ (accessed on 13 October 2022).
  27. Sadeghi, M.; Babaeian, E.; Tuller, M.; Jones, S.B. The Optical Trapezoid Model: A Novel Approach to Remote Sensing of Soil Moisture Applied to Sentinel-2 and Landsat-8 Observations. Remote Sens. Environ. 2017, 198, 52–68. [Google Scholar] [CrossRef]
  28. Schulte, R.P.O.; Simo, I.; Creamer, R.E.; Holden, N.M. A Note on the Hybrid Soil Moisture Deficit Model v2.0. Irish J. Agric. Food Res. 2015, 54, 128–131. [Google Scholar] [CrossRef]
  29. Hanrahan, L.; Geoghegan, A.; O’Donovan, M.; Griffith, V.; Ruelle, E.; Wallace, M.; Shalloo, L. PastureBase Ireland: A Grassland Decision Support System and National Database. Comput. Electron. Agric. 2017, 136, 193–201. [Google Scholar] [CrossRef]
  30. Vero, S.E.; Antille, D.L.; Lalor, S.T.J.; Holden, N.M. Field Evaluation of Soil Moisture Deficit Thresholds for Limits to Trafficability with Slurry Spreading Equipment on Grassland. Soil Use Manag. 2014, 30, 69–77. [Google Scholar] [CrossRef]
  31. Teagasc Environment—Fertiliser Advice under Prolonged Dry Soil Conditions—Teagasc|Agriculture and Food Development Authority. Available online: https://www.teagasc.ie/news--events/daily/environment/fertiliser-advice-under-prolonged-dry-soil-conditions.php (accessed on 19 June 2023).
  32. Lepore, E.; Schmidt, O.; Fenton, O.; Tracy, S.; Bondi, G.; Wall, D.P. Traffic Induced Compaction and Physical Quality of Grassland Soil under Different Soil Moisture Deficits. Soil Tillage Res. 2024, 244, 106205. [Google Scholar] [CrossRef]
  33. Hanrahan, L.; McHugh, N.; Hennessy, T.; Moran, B.; Kearney, R.; Wallace, M.; Shalloo, L. Factors Associated with Profitability in Pasture-Based Systems of Milk Production. J. Dairy Sci. 2018, 101, 5474–5485. [Google Scholar] [CrossRef] [PubMed]
  34. Läpple, D.; Hennessy, T.; O’Donovan, M. Extended Grazing: A Detailed Analysis of Irish Dairy Farms. J. Dairy Sci. 2012, 95, 188–195. [Google Scholar] [CrossRef] [PubMed]
  35. Palma-Molina, P.; Hennessy, T.; Dillon, E.; Onakuse, S.; Moran, B.; Shalloo, L. Evaluating the Effects of Grass Management Technologies on the Physical, Environmental, and Financial Performance of Irish Pasture-Based Dairy Farms. J. Dairy Sci. 2023, 106, 6249–6262. [Google Scholar] [CrossRef]
  36. Phelan, P.; Keogh, B.; Casey, I.A.; Necpalova, M.; Humphreys, J. The Effects of Treading by Dairy Cows on Soil Properties and Herbage Production for Three White Clover-Based Grazing Systems on a Clay Loam Soil. Grass Forage Sci. 2012, 68, 548–563. [Google Scholar] [CrossRef]
  37. Fenger, F.; Casey, I.A.; Holden, N.M.; Humphereys, J. Access Time to Pasture under Wet Soil Conditions: Effects on Productivity and Profitability of Pasture-Based Dairying. J. Dairy Sci. 2022, 105, 4189–4205. [Google Scholar] [CrossRef]
  38. Beukes, P.; Romera, A.; Clark, D.; Dalley, D.; Hedley, M.; Horne, D.; Monaghan, R.; Laurenson, S. Evaluating the Benefits of Standing Cows off Pasture to Avoid Soil Pugging Damage in Two Dairy Farming Regions of New Zealand. N. Z. J. Agric. Res. 2013, 56, 224–238. [Google Scholar] [CrossRef]
  39. Gardiner, M.J.; Radford, T. Soil Associations of Ireland and Their Land Use Potential. 1964. Available online: https://www.teagasc.ie/media/website/environment/soil/General.pdf (accessed on 17 April 2025).
  40. Lee, J.; Ryan, M. A Clinosequence of Soils Associated with Drumlin Landscape. Ir. J. Agric. Res. 1965, 4, 1–12. [Google Scholar]
Figure 1. Schematics of locations of farms in Ireland: Upper panel: Farm 1, with a soil map showing the soil types; Lower panel: Farm 2, with a soil map showing the soil types. Note: Polygons delineate study areas and do not necessarily depict accepted national boundaries.
Agriculture 15 00920 g001
Figure 2. Slope maps of the farms with contour lines: (a) Farm 1; (b) Farm 2. Arrows show the presence of drumlins on Farm 1. Units (in legend) are in degrees.
Agriculture 15 00920 g002
Figure 3. Linear regression model between mean nSSM and corresponding SMD for Farm 1 and Farm 2.
Agriculture 15 00920 g003
Figure 4. Examples of nSSM maps for (a) Farm 1 and (b) Farm 2 under different SMD conditions.
Agriculture 15 00920 g004aAgriculture 15 00920 g004b
Figure 5. White rectangles with numbers refer to specific paddocks on the farms that exhibited nSSM patterns different from their surroundings over time, as discussed in Section 3.2: (a) Farm 1; (b) Farm 2. The orange polygons are the corresponding farm boundaries.
Agriculture 15 00920 g005
Figure 6. Piecewise linear regression between farm area proportions (in %) in the favourable SMT category and corresponding SMD for (a) Farm 1 and (b) Farm 2.
Agriculture 15 00920 g006
Figure 7. Daily farm area proportions (in %) in the optimum/favourable SMT category for (a) Farm 1 and (b) Farm 2.
Agriculture 15 00920 g007aAgriculture 15 00920 g007b
Figure 8. Comparison of farm area proportions in the favourable SMT category between a drought year (2018) and two normal years (2017 and 2019) for (a) Farm 1 and (b) Farm 2. The green curve is the average farm area proportions for 2017 and 2019, and the red curve is the proportion for 2018.
Agriculture 15 00920 g008
Figure 9. Comparison of farm area proportions in the favourable SMT category (upper panel) with the corresponding grass growth curves (lower panel) for the farms. The grass growth is measured in DM (dry matter) kg per hectare (Ha). The green curve is the average farm area proportions and average grass growth for 2017 and 2019, and the red curve is for 2018.
Agriculture 15 00920 g009aAgriculture 15 00920 g009b
Disclaimer/Publisher’s Note: The statements, opinions and data contained in all publications are solely those of the individual author(s) and contributor(s) and not of MDPI and/or the editor(s). MDPI and/or the editor(s) disclaim responsibility for any injury to people or property resulting from any ideas, methods, instructions or products referred to in the content.

