Article

Optimizing Sulfur Fertilization for Enhanced Physiological Performance, Grain Filling Characteristics, and Grain Yield of High-Yielding Winter Wheat Under Drip Irrigation

Shandong Provincial Key Laboratory of Dryland Farming Technology, Agronomy College, Qingdao Agricultural University, Qingdao 266109, China
*
Author to whom correspondence should be addressed.
These authors have contributed equally to this work.
Agriculture 2025, 15(9), 1012; https://doi.org/10.3390/agriculture15091012
Submission received: 7 April 2025 / Revised: 2 May 2025 / Accepted: 5 May 2025 / Published: 7 May 2025
(This article belongs to the Section Crop Production)

Abstract

:
The North China Plain is one of the major wheat cultivation regions. As a cornerstone of global food security, wheat makes the enhancement of its yield critically important. Sulfur critically regulates photosynthesis, antioxidant defense, and grain filling dynamics. To elucidate the physiological mechanisms of S in wheat grain filling and guide field practices, a two-year field experiment (2022–2023 and 2023–2024) was conducted in the North China Plain using two dominant cultivars, Jimai 20 (JM20) and Yannong 999 (YN999). Four sulfur (ammonium sulfate) gradients (S1: 15 kg ha−1; S2: 30 kg ha−1; S3: 45 kg ha−1; S4: 60 kg ha−1) and a control (S0) were applied at the jointing stage via a drip fertigation system. The key findings reveal that optimal S application (YN999: 45 kg ha−1; JM20: 30–45 kg ha−1) enhanced post-anthesis photosynthetic capacity by increasing flag leaf SPAD values and superoxide dismutase (SOD) activity while reducing malondialdehyde (MDA) accumulation, thereby delaying leaf senescence. These improvements translated into optimized grain filling parameters: YN999 and JM20 exhibited 2.27–5.62% and 13.20–13.86% increases in mean grain filling rate, 3.92–4.73% and 2.11–4.36% extensions in grain filling duration, and 7.62–7.83% and 9.55–10.23% boosts in thousand grain weight, respectively. Consequently, yield increased by 0.58–1.54 t ha−1 for YN999 and 1.36–1.49 t ha−1 for JM20. Under drip fertigation conditions in the North China Plain, sulfur application at 30–45 kg ha−1 effectively enhances wheat yield. These findings provide fertilization guidance for the development of precision agriculture and can help alleviate the local soil sulfur deficiency trend.

1. Introduction

The North China Plain is one of China’s major wheat-producing areas; wheat serves as the cornerstone of global food security [1], being one of the primary staple crops in many regions worldwide and playing a vital role in meeting global food demands. Ensuring stable and high yields of wheat is crucial for addressing the growing needs of food production. Grain weight, a key determinant of yield [2,3], is significantly influenced by the grain filling process [4]. Optimizing this process is essential for enhancing grain weight and overall wheat productivity. Studies indicate that over 75% of wheat yield relies on photosynthesis during the grain filling stage, with flag leaves contributing 30–50% of assimilates for grain filling [5,6,7]. Therefore, maintaining the photosynthetic capacity of flag leaves post-anthesis is critical for improving grain filling efficiency and final yield.
Sulfur, existing in various forms within plants [8,9], plays pivotal roles in multiple physiological processes, including photosynthesis, stress resistance, grain filling, and grain quality formation [10,11]. Sulfur deficiency severely reduces crop productivity, negatively impacting both yield and quality [12]. As a key element in synthesizing chlorophyll precursors (sulfur-containing amino acids), sulfur is indispensable for chlorophyll formation [13]. Adequate sulfur supply enhances chlorophyll content in crop leaves, thereby improving photosynthetic performance [11,14]. However, photosynthesis generates reactive oxygen species (ROS), which impair the normal physiological functions [15,16]. Sulfur reduces oxidative damage by synthesizing compounds like glutathione and ascorbic acid, which enhance the ascorbate–glutathione cycle [17]. This mechanism effectively scavenges ROS, delays plant senescence [18], and extends the functional duration of leaves during grain filling, ultimately enhancing photosynthetic efficiency and optimizing grain filling characteristics. Sulfur also significantly increases cysteine and methionine concentrations in wheat grains [19], improving grain protein content and quality. However, most Chinese farmers underestimate sulfur’s impact. Yield-focused practices drive farmers to use excessive nitrogen (325 kg ha−1 [20]), which depletes soil nutrients, disrupts sulfur balance [21], and worsens soil sulfur deficiency [9,22]. To curb this trend, it is imperative to raise farmers’ awareness of sulfur application, establish rational sulfur management practices, and develop science-based sulfur application guidelines. Consequently, targeted sulfur supplementation has become essential. However, determining the optimal sulfur application rates remains a key concern for ensuring agricultural sustainability.
Although numerous studies have explored sulfur’s effects on wheat, with sulfur application demonstrating yield improvements [23,24], the specific physiological mechanisms through which sulfur influences wheat grain filling have been rarely studied. This study aims to elucidate this physiological mechanism by analyzing photosynthetic traits and senescence resistance characteristics, employing the Richards grain filling equation to simulate filling parameters. From a physiological perspective, we investigate the impact of sulfur on wheat grain filling while establishing appropriate sulfur application guidelines for farmers to curb the trend of soil sulfur deficiency. Notably, our experimental design utilizes a drip fertigation system to precisely control sulfur application rates, effectively eliminating interference from incidental sulfur-containing fertilizers and ensuring methodological rigor.

2. Materials and Methods

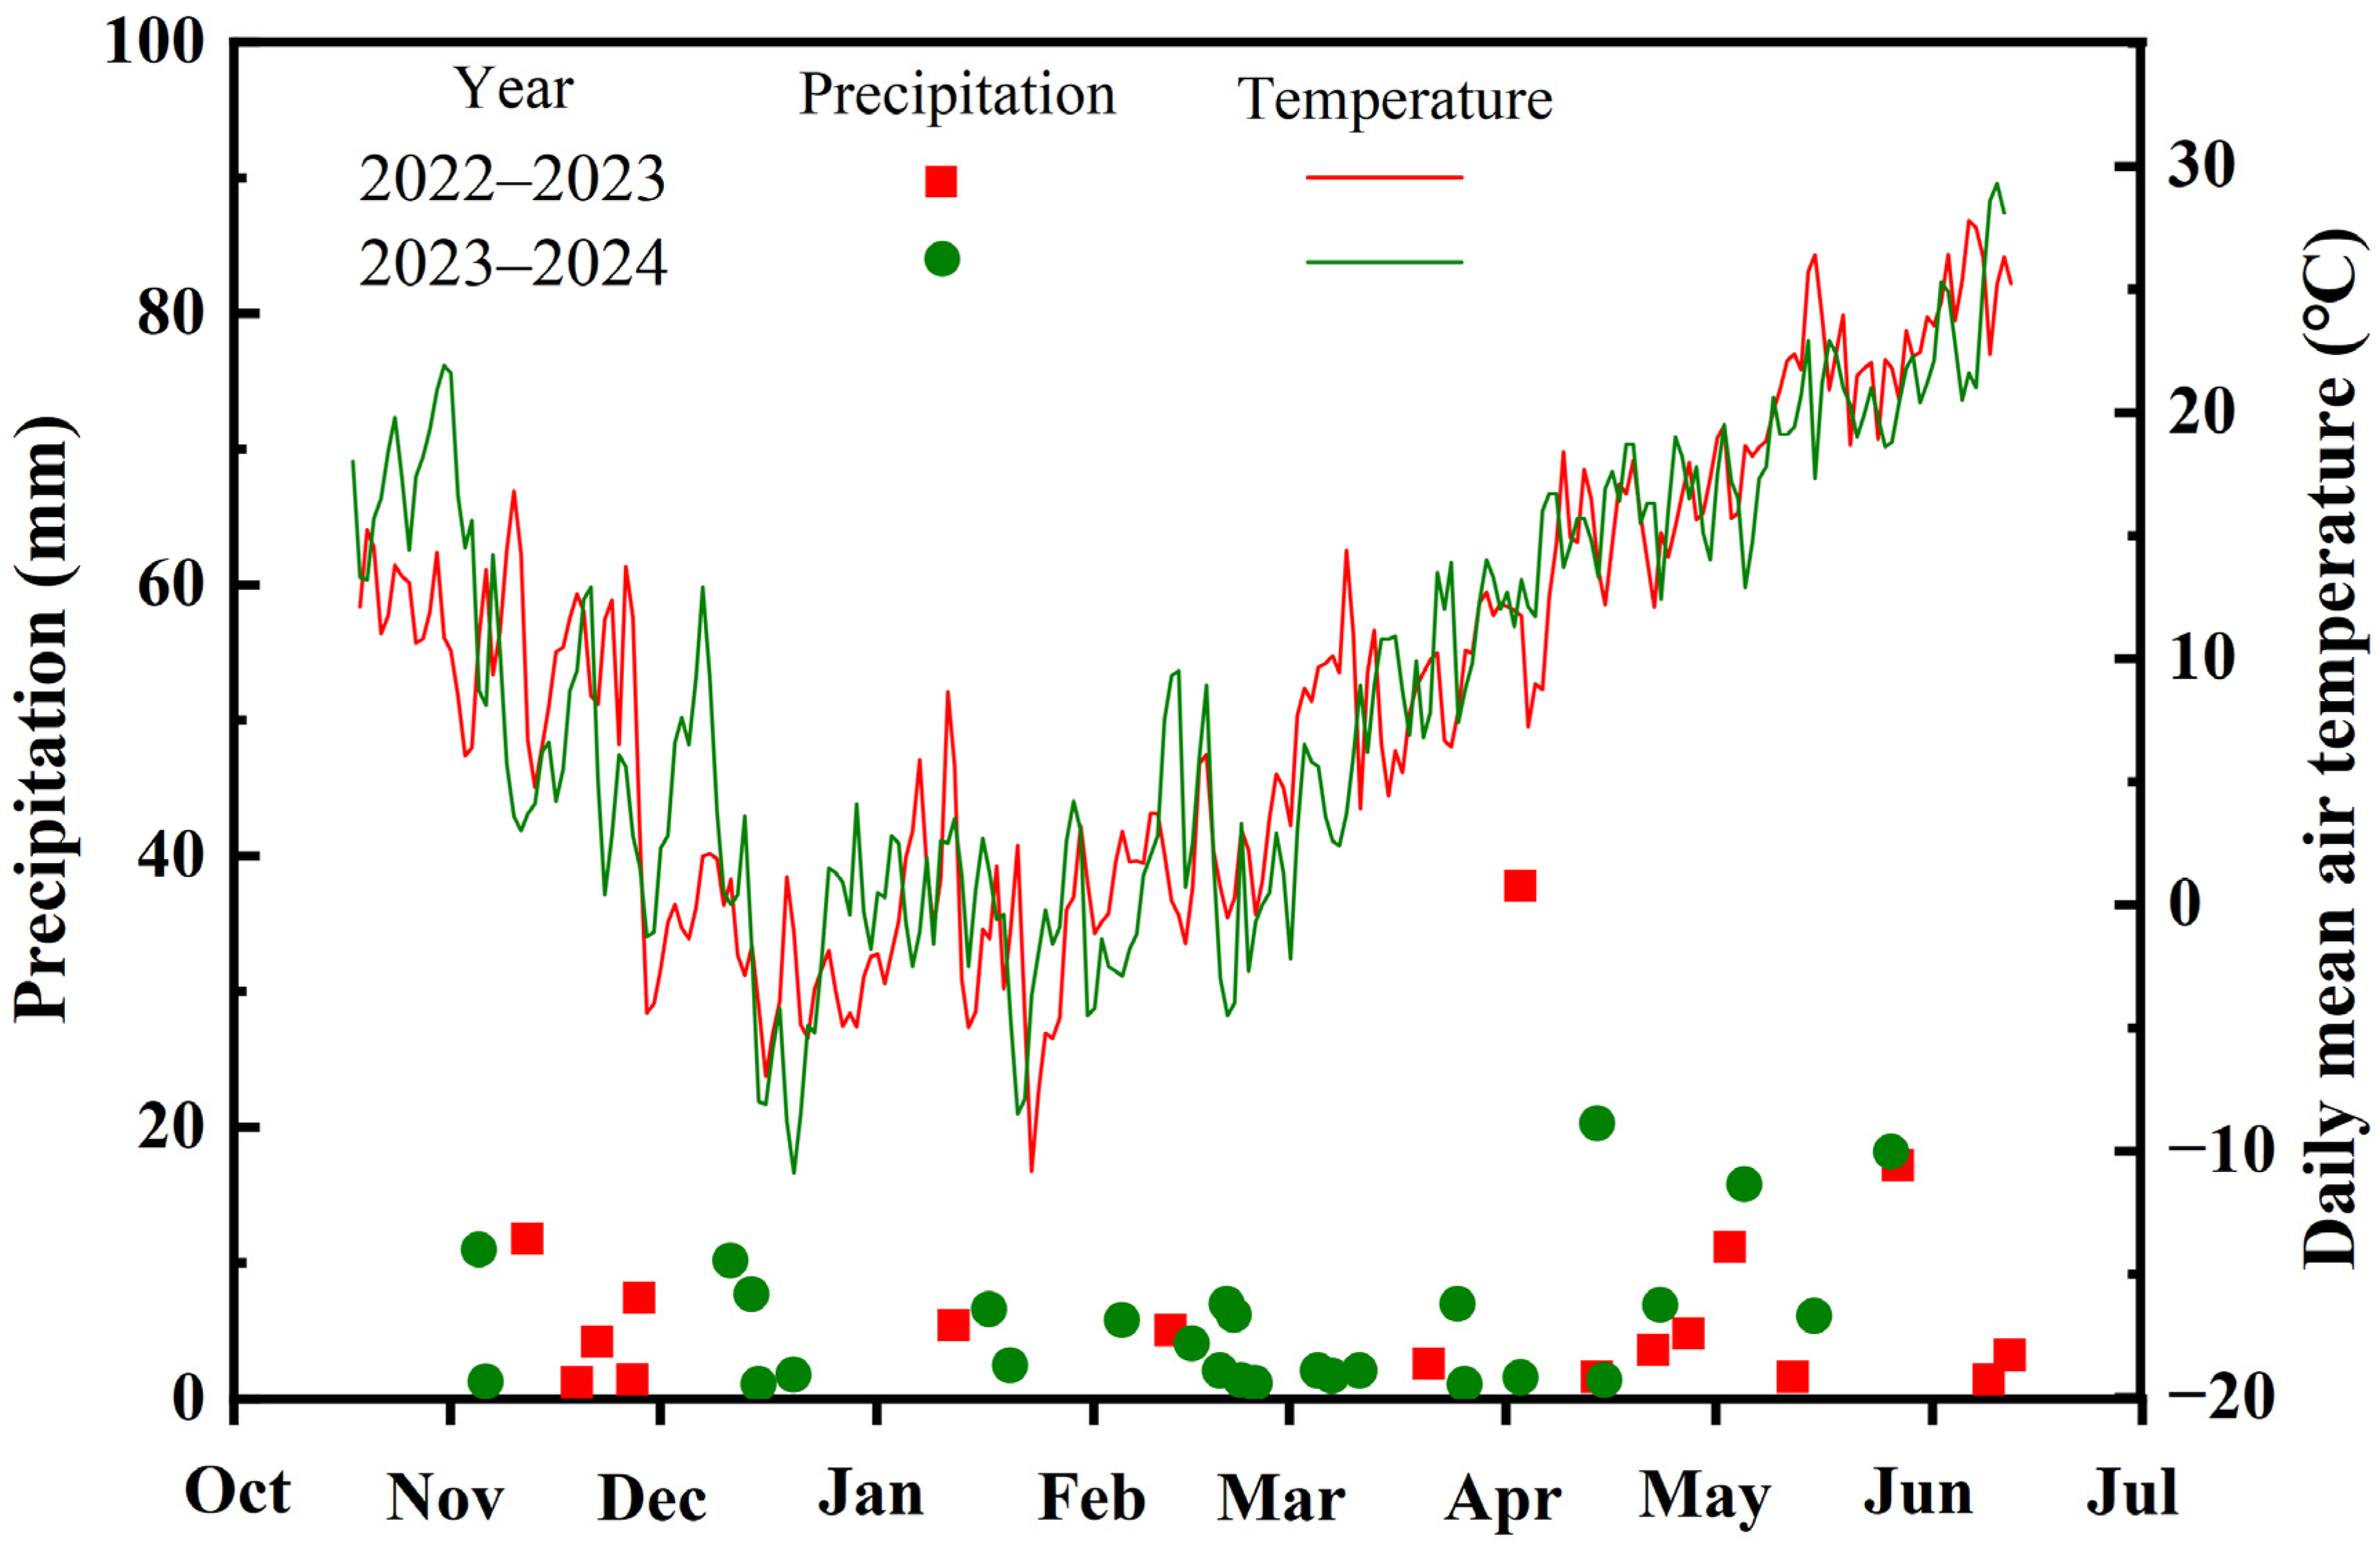
2.1. Experimental Site Description

The field experiment was conducted during the 2022–2024 winter wheat growing seasons (from October to June) at the Jiaozhou Modern Agricultural Demonstration Base of Qingdao Agricultural University (35.53° N, 119.58° E), a region characterized by a semi-humid monsoon climate with sandy loam soil. The initial soil properties (0–20 cm depth) were as follows: pH 7.3, organic matter 15.3 g kg−1, available nitrogen 99.8 mg kg−1, available phosphorus 29.8 mg kg−1, available potassium 126.6 mg kg−1, and available sulfur 20.8 mg kg−1. Climatic data, including precipitation and accumulated temperature during the experimental period, are presented in Figure 1. The total growing season precipitation measured 121.4 mm in the first year and 154.3 mm in the second year. The sowing rates for winter wheat varieties Yannong 999 and Jimai 20 were 185 kg ha−1 and 165 kg ha−1, respectively. The sowing dates for the two-year trial were 20 October 2022 and 19 October 2023, with corresponding harvest dates of 13 June 2023 and 11 June 2024.

2.2. Experimental Design

The experiment was arranged in a completely randomized block design with three replications. Each plot measured 5 m × 13.33 m, totaling 30 plots. Wheat was planted with 20 cm row spacing. The tested wheat cultivars were “Yannong 999” (abbreviated as YN999) and “Jimai 20” (abbreviated as JM20). YN999 was bred by the Yantai Academy of Agricultural Sciences (Shandong Province), while JM20 was developed by the Shandong Academy of Agricultural Sciences. Both cultivars are widely cultivated in the Huang-Huai-Hai Plain.
For each cultivar, five sulfur application gradients (S, kg ha−1) were established: 0 (S0), 15 (S1), 30 (S2), 45 (S3), and 60 (S4). Across all of the treatments, nitrogen (N), phosphorus (P), and potassium (K) fertilizers were uniformly applied at rates of 210 kg ha−1, 90 kg ha−1, and 90 kg ha−1, respectively. Nitrogen fertilizer was split into two applications, with a basal-to-topdressing ratio of 3:4. To ensure sulfur-free basal fertilization, the basal fertilizers were supplied as urea (N = 46%), monopotassium phosphate (P2O5:K2O = 52:34), and potassium chloride (K2O = 60%). Potassium chloride was used to balance the phosphorus and potassium inputs. Topdressing with nitrogen and sulfur fertilizers was applied via a drip fertigation system at the jointing stage [25,26], using urea (N = 46%) and ammonium sulfate (N:S = 21:24), respectively (Table 1). The drip tapes were spaced at 60 cm intervals, with each tape serving three adjacent wheat rows. Each plot received 60 mm of irrigation water at both the jointing and flowering stages, with water meters used to monitor irrigation volumes. Other agronomic practices (e.g., pesticide application and weeding) followed local conventional farming protocols.

2.3. Measurement Items and Methods

2.3.1. Relative Chlorophyll Content (SPAD)

The relative chlorophyll content (SPAD) was measured using a handheld chlorophyll meter (SPAD 502, Konica Minolta, Tokyo, Japan). Measurements were taken from the flag leaves of 10 representative plants (three repetitions) per plot at 7, 14, 21, and 28 days after anthesis.

2.3.2. Photosynthetic Characteristics of Flag Leaves

Net photosynthetic rate (Pn), stomatal conductance (Gs), intercellular CO2 concentration (Ci), and transpiration rate (Tr) of flag leaves were measured using a portable photosynthesis system (LI-6400, LI-COR, Lincoln, NE, USA) between 9:00 and 11:00 a.m. on 0, 7, 14, 21, and 28 days after anthesis. For each plot (three repetitions), 10 representative plants were selected for the measurements.

2.3.3. Senescence Characteristics of Flag Leaves

At 0, 7, 14, 21, and 28 days after anthesis, 10 flag leaves were randomly sampled from each plot (three repetitions). After rapid freezing in liquid nitrogen, the samples were stored at −80 °C. Superoxide dismutase (SOD) activity and malondialdehyde (MDA) content were measured using reagent kits following the manufacturer’s protocols (Solarbio, Beijing, China).

2.3.4. Grain Filling

Starting from the anthesis stage, about 150 consistent and representative wheat spikes were selected from each plot for labeling, and 10 labeled spikes were randomly selected each time; grains were taken from the middle of the wheat spike at the 7th, 14th, 21st, 28th and 35th days, respectively. The fresh grains were killed in an oven at 105 °C for 30 min and then dried at 75 °C until constant weight. Then, the Richards equation [27,28] was used to simulate the wheat grain filling process. The number of days after anthesis t was used as the independent variable and the 1000-grain weights W per measurement was used as the dependent variable.
W = A ( 1 + B e K t ) 1 N
where time after anthesis (d) is the independent variable t; 1000-grain weight (g) of grains in each period is the dependent variable W; A represents the ultimate growth quantity (g); K is the growth rate parameter; B and N are the stereotyped parameters of the equation curve; and R2 is the equation coefficient of determination. The first-order derivative of the Richards equation was taken to obtain the grain filling rate equation:
G = A K B e K t N ( 1 + B e K t ) N + 1 N
R0 is the initial grain filling potential, and some grain filling parameters were derived from the Richards equation and the filling rate equation. The second-order derivative of Equation (2) was used to obtain the time when the grains reached the maximum grain filling rate (Tmax):
R 0 = K N
T m a x = ( l n B l n N ) K
Substitute Equation (4) into Equation (2) to obtain the maximum grain filling rate (Gmax):
G m a x = A K ( 1 + N ) N + 1 N
Substitute Equation (4) into Equation (1) to obtain the grain weight that achieves the maximal grain filling rate (Wmax):
W m a x = A ( 1 + N ) 1 N
Integrate Equation (2) to obtain the mean grain filling rate (Gmean):
G m e a n = A K 2 N + 4
The active grain filling period D is the ultimate growth quantity, A, divided by Gmean; the grains complete approximately 90 percent of the total grain filling during the active grain filling period:
D = 2 N + 2 K
The grain filling rate equation has 2 inflection points, according to which, the filling period can be divided into three periods: the gradual increase period, the rapid increase period, and the slow increase period. These two inflection points, t1 and t2, can be obtained according to Equation (2); assuming that the end of filling is reached when 99% A is reached, the point in time is T0.99:
t 1 = I n N 2 + 3 N + N N 2 + 6 N + 5 2 B K
t 2 = I n N 2 + 3 N N N 2 + 6 N + 5 2 B K
T 0.99 = ln ( 100 99 ) N 1 B K
The gradual increase period of the grain filling process is (0–t1), the rapid increase period is (t1–t2), and the slow increase period is (t2–T0.99). The grain weights of the three periods are W1, W2, and W3, respectively, so that the grain filling rates are MG1, MG2, and MG3, and the contribution rates, RGC1, RGC2, and RGC3, of the gradual, rapid, and slow increase periods are, respectively:
M G 1 = W 1 t 1 , M G 2 = W 2 W 1 t 2 t 1 , M G 3 = W 3 W 2 T 0.99 t 2
R G C 1 = W 1 A , R G C 2 = W 2 W 1 A , R G C 3 = W 3 W 2 A

2.3.5. Analysis of Yield and Yield Components

At the wheat maturity stage, three 1.25 m × 2.4 m sampling areas were selected in each replicate plot to investigate and calculate the number of spikes per unit area. At harvest, all plants from the middle row of the selected sampling area were harvested to determine the number of grains per spike and the thousand-grain weight. The selected sampling area was then expanded to 5 m × 4 m for each treatment. The grains used for spike and grain measurements were included in the plot yield, and the final yield was calculated based on the harvested area.

2.3.6. Data Analysis and Processing

The data were processed using Microsoft Excel 2019. Variance analysis (ANOVA) was conducted using IBM SPSS 26 software, while Pearson’s correlation analysis and plotting were performed using Origin 2021. All data analyses were repeated three times to ensure analytical accuracy.

3. Results

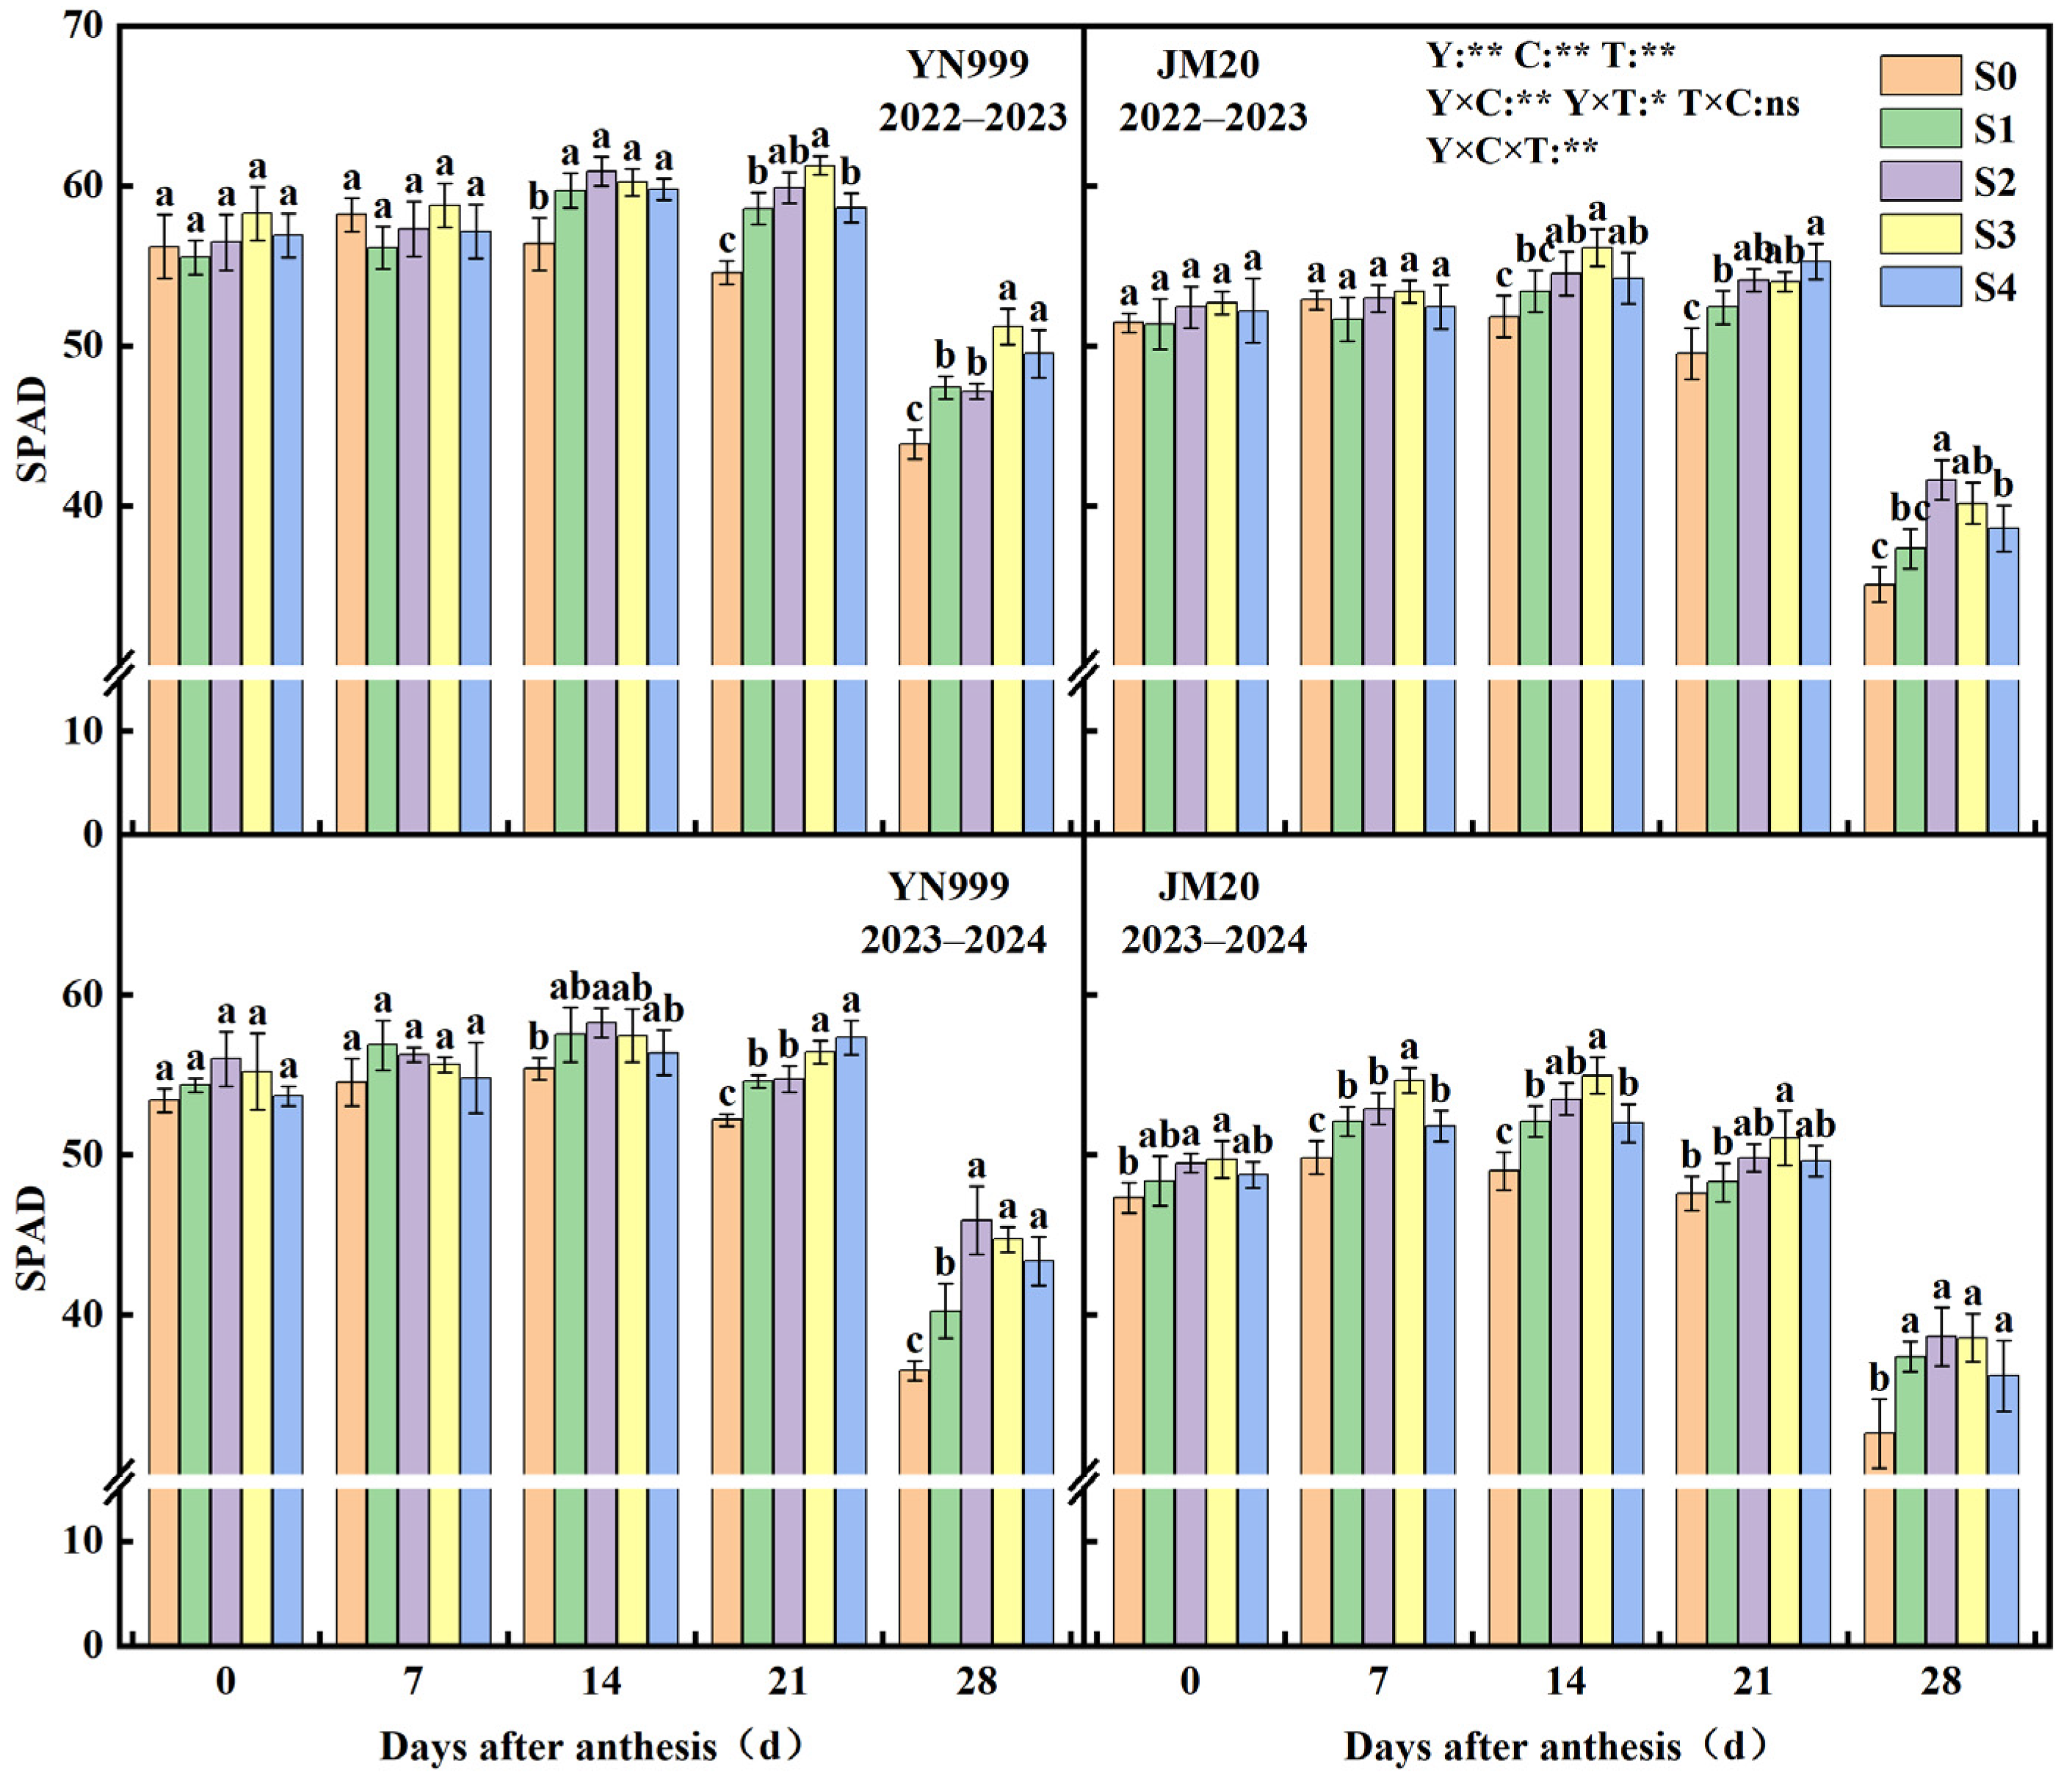
3.1. Effect of Sulfur Application on the SPAD of Winter Wheat Flag Leaves

As shown in Figure 2, the pattern of change in flag leaf SPAD values of all cultivars over the two years first increased and then decreased, and the SPAD values of YN999 were significantly higher than those of JM20 in both years. In the 2022–2023 growing season, the SPAD values under the S0 treatment for both varieties peaked on the 7th day after anthesis (DAA); compared to the S0 treatment, sulfur application significantly delayed the time to reach peak SPAD values in both varieties (14 DAA or 21 DAA). Significant effects of sulfur application compared to S0 were observed starting from 14 DAA in both cultivars, showing an initial increase followed by a decrease with increasing sulfur application rates. The overall SPAD trends among treatments were S3 > S4 > S2 > S1 > S0 for YN999 and S2 = S3 > S4 > S1 > S0 for JM20. In the 2023–2024 growing season, YN999 followed a similar pattern to the first year, whereas JM20 exhibited a more pronounced response to sulfur fertilization. Compared with S0, sulfur application had significant effects on post-anthesis SPAD values throughout the period, with the treatment trend changing to S3 > S2 > S4 > S1 > S0. Additionally, the analysis of variance revealed that year, variety, and treatment all significantly affected post-anthesis wheat flag leaf SPAD values, with no interaction between treatment and variety, while all other factors showed significant interactions on SPAD.

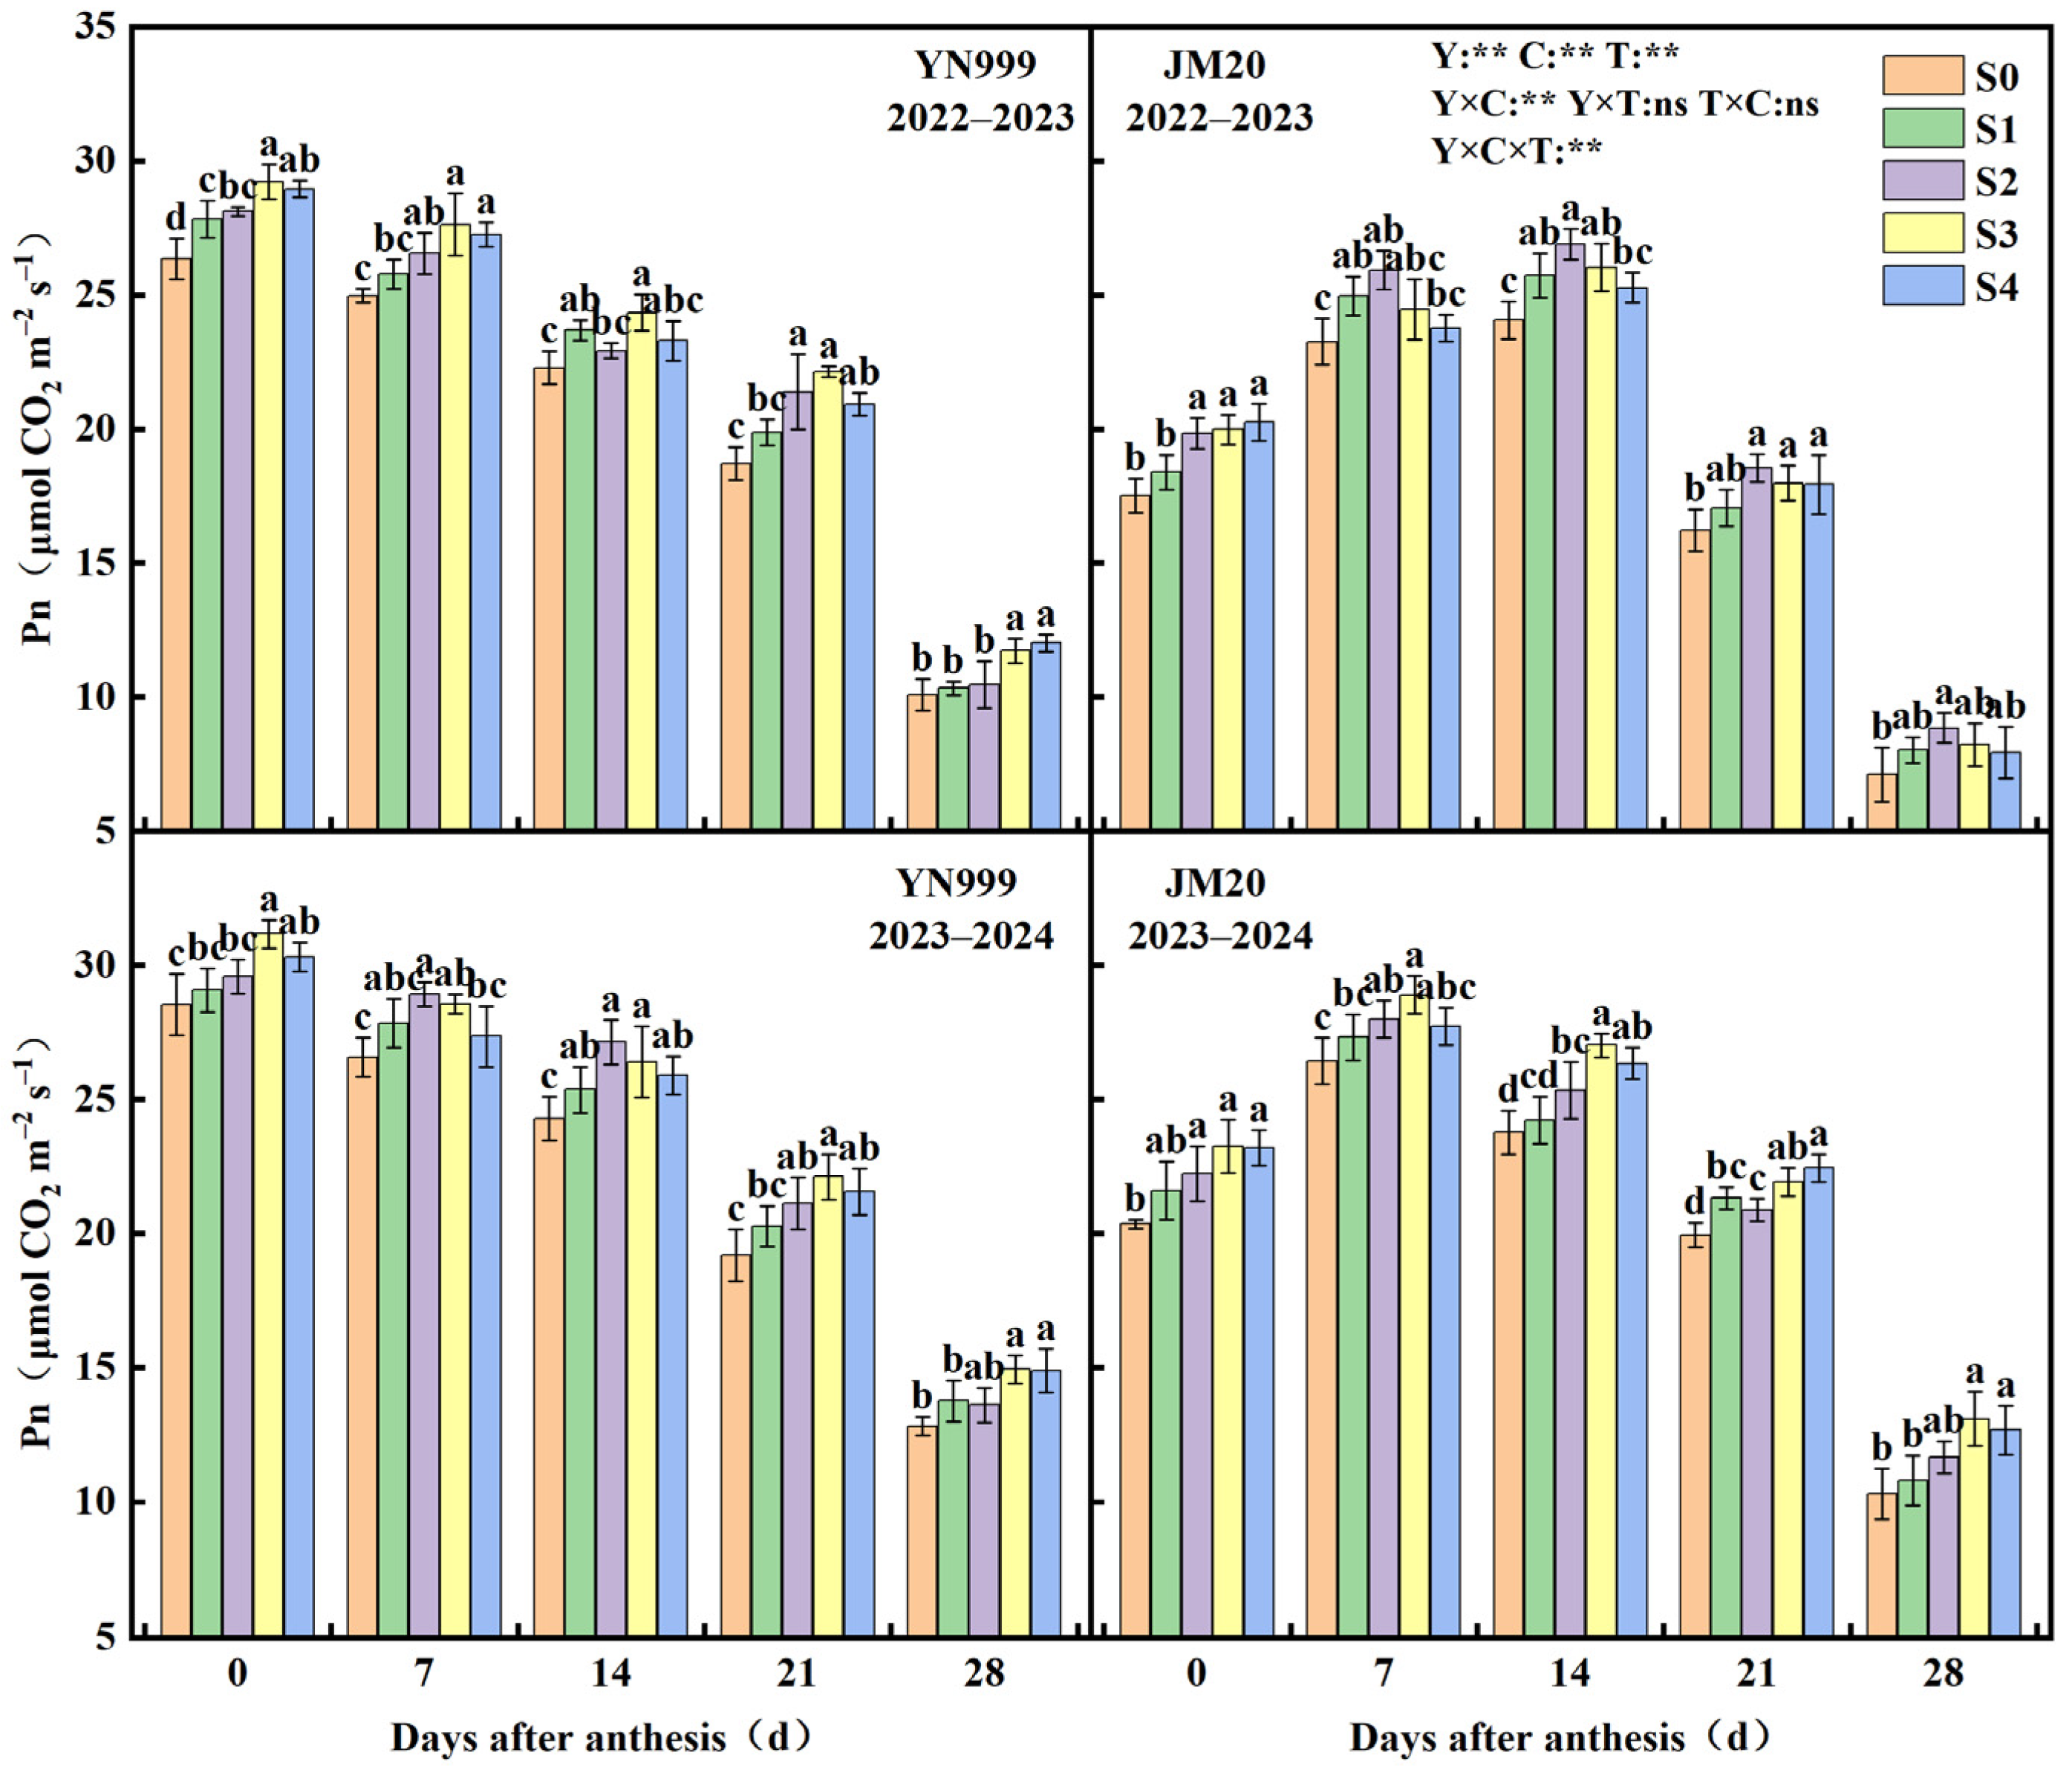
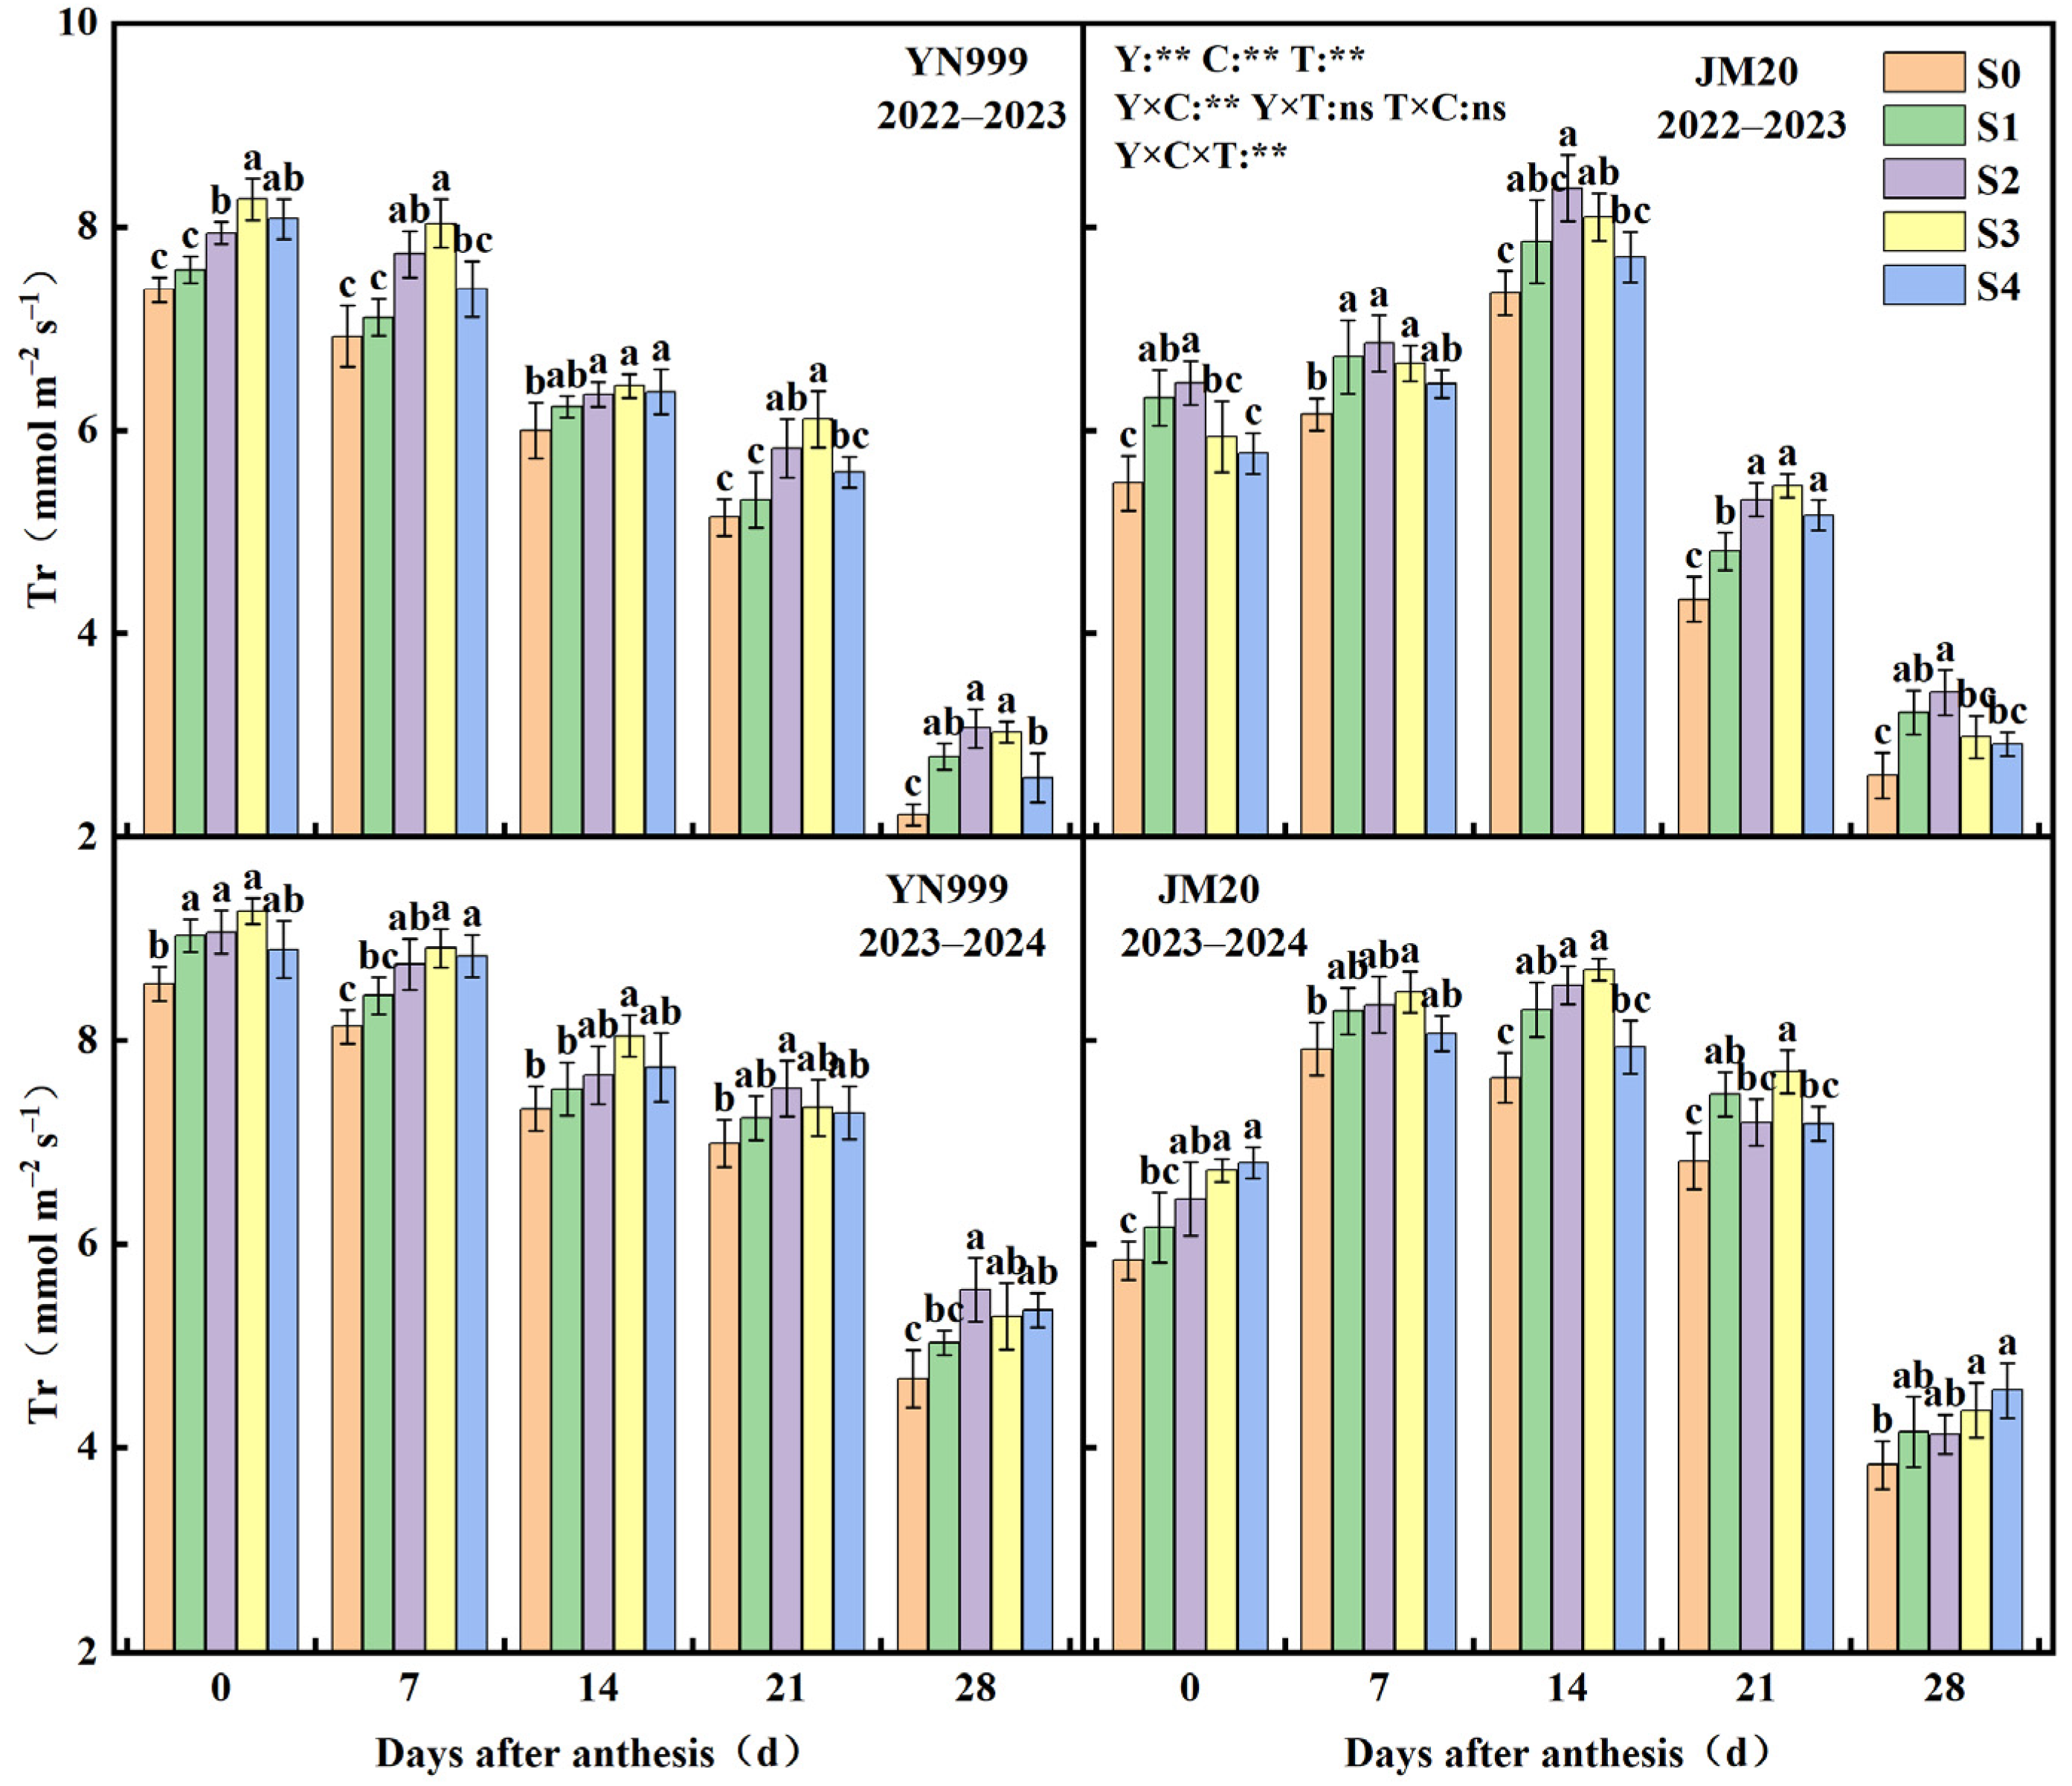
3.2. Effect of Sulfur Application on the Photosynthetic Characteristics of Winter Wheat Flag Leaves

Figure 3, Figure 4, Figure 5 and Figure 6 display the photosynthetic characteristics of winter wheat flag leaves during 0–28 days after anthesis (DAA) across two growing seasons. Compared to the S0 treatment, sulfur application significantly increased the net photosynthetic rate (Pn), transpiration rate (Tr), and stomatal conductance (Gs) in all cultivars, while reducing the intercellular CO2 concentration (Ci). During the 2022–2023 growing season, for JM20, Pn, Tr, and Gs initially increased and then decreased from 0 to 28 DAA, while Ci declined slowly before rising rapidly. YN999 reached peak values in Pn, Tr, and Gs at 0 DAA and the minimum Ci at the same time point. In contrast, JM20 reached peak Pn and Tr at 14 DAA, peak Gs at 7 DAA, and the minimum Ci at 7 DAA. Under the S3 treatment, YN999 showed peak Pn, Tr, and Gs at 7, 14, and 21 DAA, with consistently higher levels at 0 and 28 DAA, while Ci remained lower throughout the flowering period, displaying significant differences compared to S0. The S4 treatment resulted in higher Pn at 0, 7, and 28 DAA, elevated Tr at 0 and 14 DAA, and increased Gs at 0 and 7 DAA for YN999. Although S1 and S2 generally outperformed S0 in Pn, Tr, Gs, and Ci across the flowering period, most differences were non-significant. For YN999, Pn ranked as S3 > S4 > S2 > S1 > S0, Tr and Gs followed S3 > S2 > S4 > S1 > S0, and Ci trended as S4 < S3 < S2 < S1 < S0. JM20 under S2 treatment achieved peak Pn and Gs from 7 to 28 DAA, peak Tr from 0 to 14 DAA and at 28 DAA, and the minimum Ci at 0, 7, 21, and 28 DAA, with significant differences compared to S0. S3 slightly outperformed S4 in Pn at 7 and 14 DAA, but showed no differences in other periods, while Tr and Gs for S3 surpassed S4 throughout 0–28 DAA and Ci for S4 was marginally lower than S3 without significance. Overall, S3 exhibited superior photosynthetic performance to S4. JM20′s Pn and Gs followed S2 > S3 > S4 > S1 > S0, Tr ranked S2 > S3 > S1 > S4 > S0, and Ci trended as S2 < S4 < S3 < S1 < S0. During the 2023–2024 season, YN999 maintained trends consistent with the first year, with S3 sustaining peak or elevated levels across 0–28 DAA (Pn, Tr, Gs: S3 > S2 > S4 > S1 > S0; Ci: S3 < S4 < S2 < S1 < S0). JM20, however, displayed shifted trends: S3 replaced S2 as the optimal treatment (Pn, Gs: S3 > S4 > S2 > S1 > S0; Tr: S3 > S2 > S4 > S1 > S0; Ci: S3 < S4 < S2 < S1 < S0), with Pn and Gs peaking at 7 DAA, Tr at peaking 14 DAA, and Ci transitioning from stable to rising post-anthesis. Additionally, year, cultivar, and treatment all significantly affected post-anthesis wheat flag leaf Pn, Tr, Gs, and Ci. Among these effects, a three-way interaction among year, cultivar, and treatment was observed for Pn, Tr, and Ci, while a two-way interaction between year and treatment was also exhibited specifically for Ci.

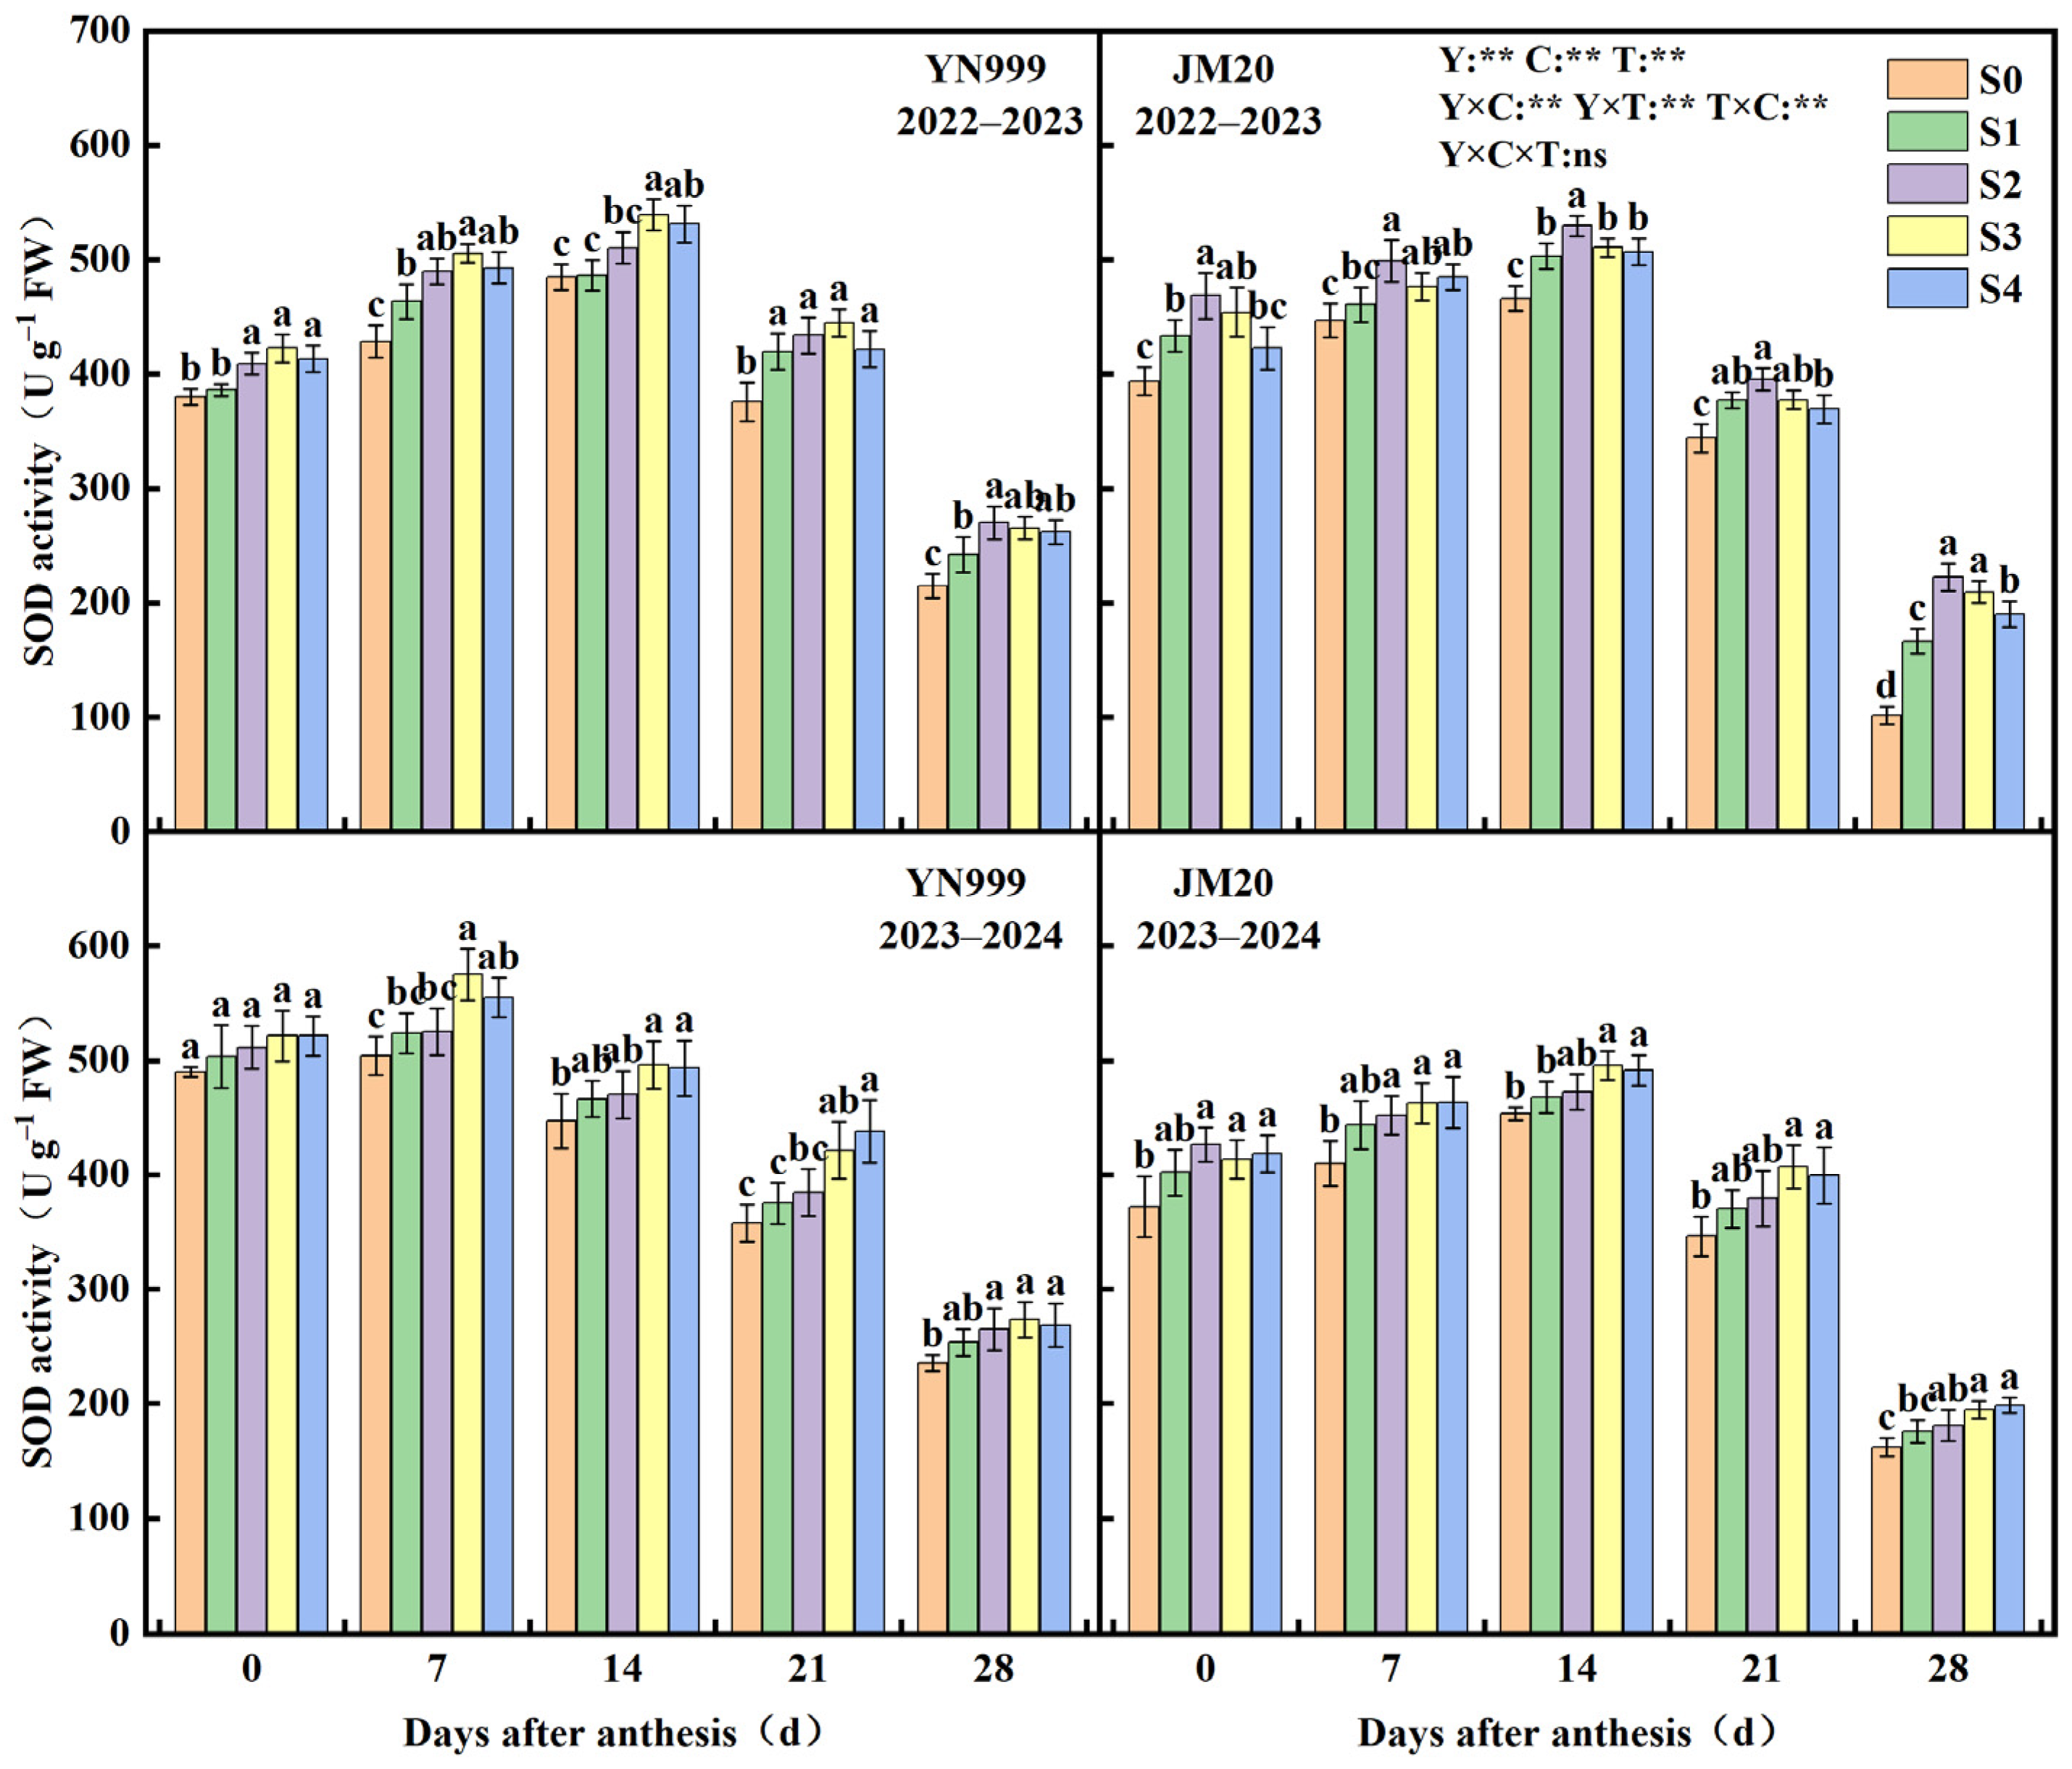
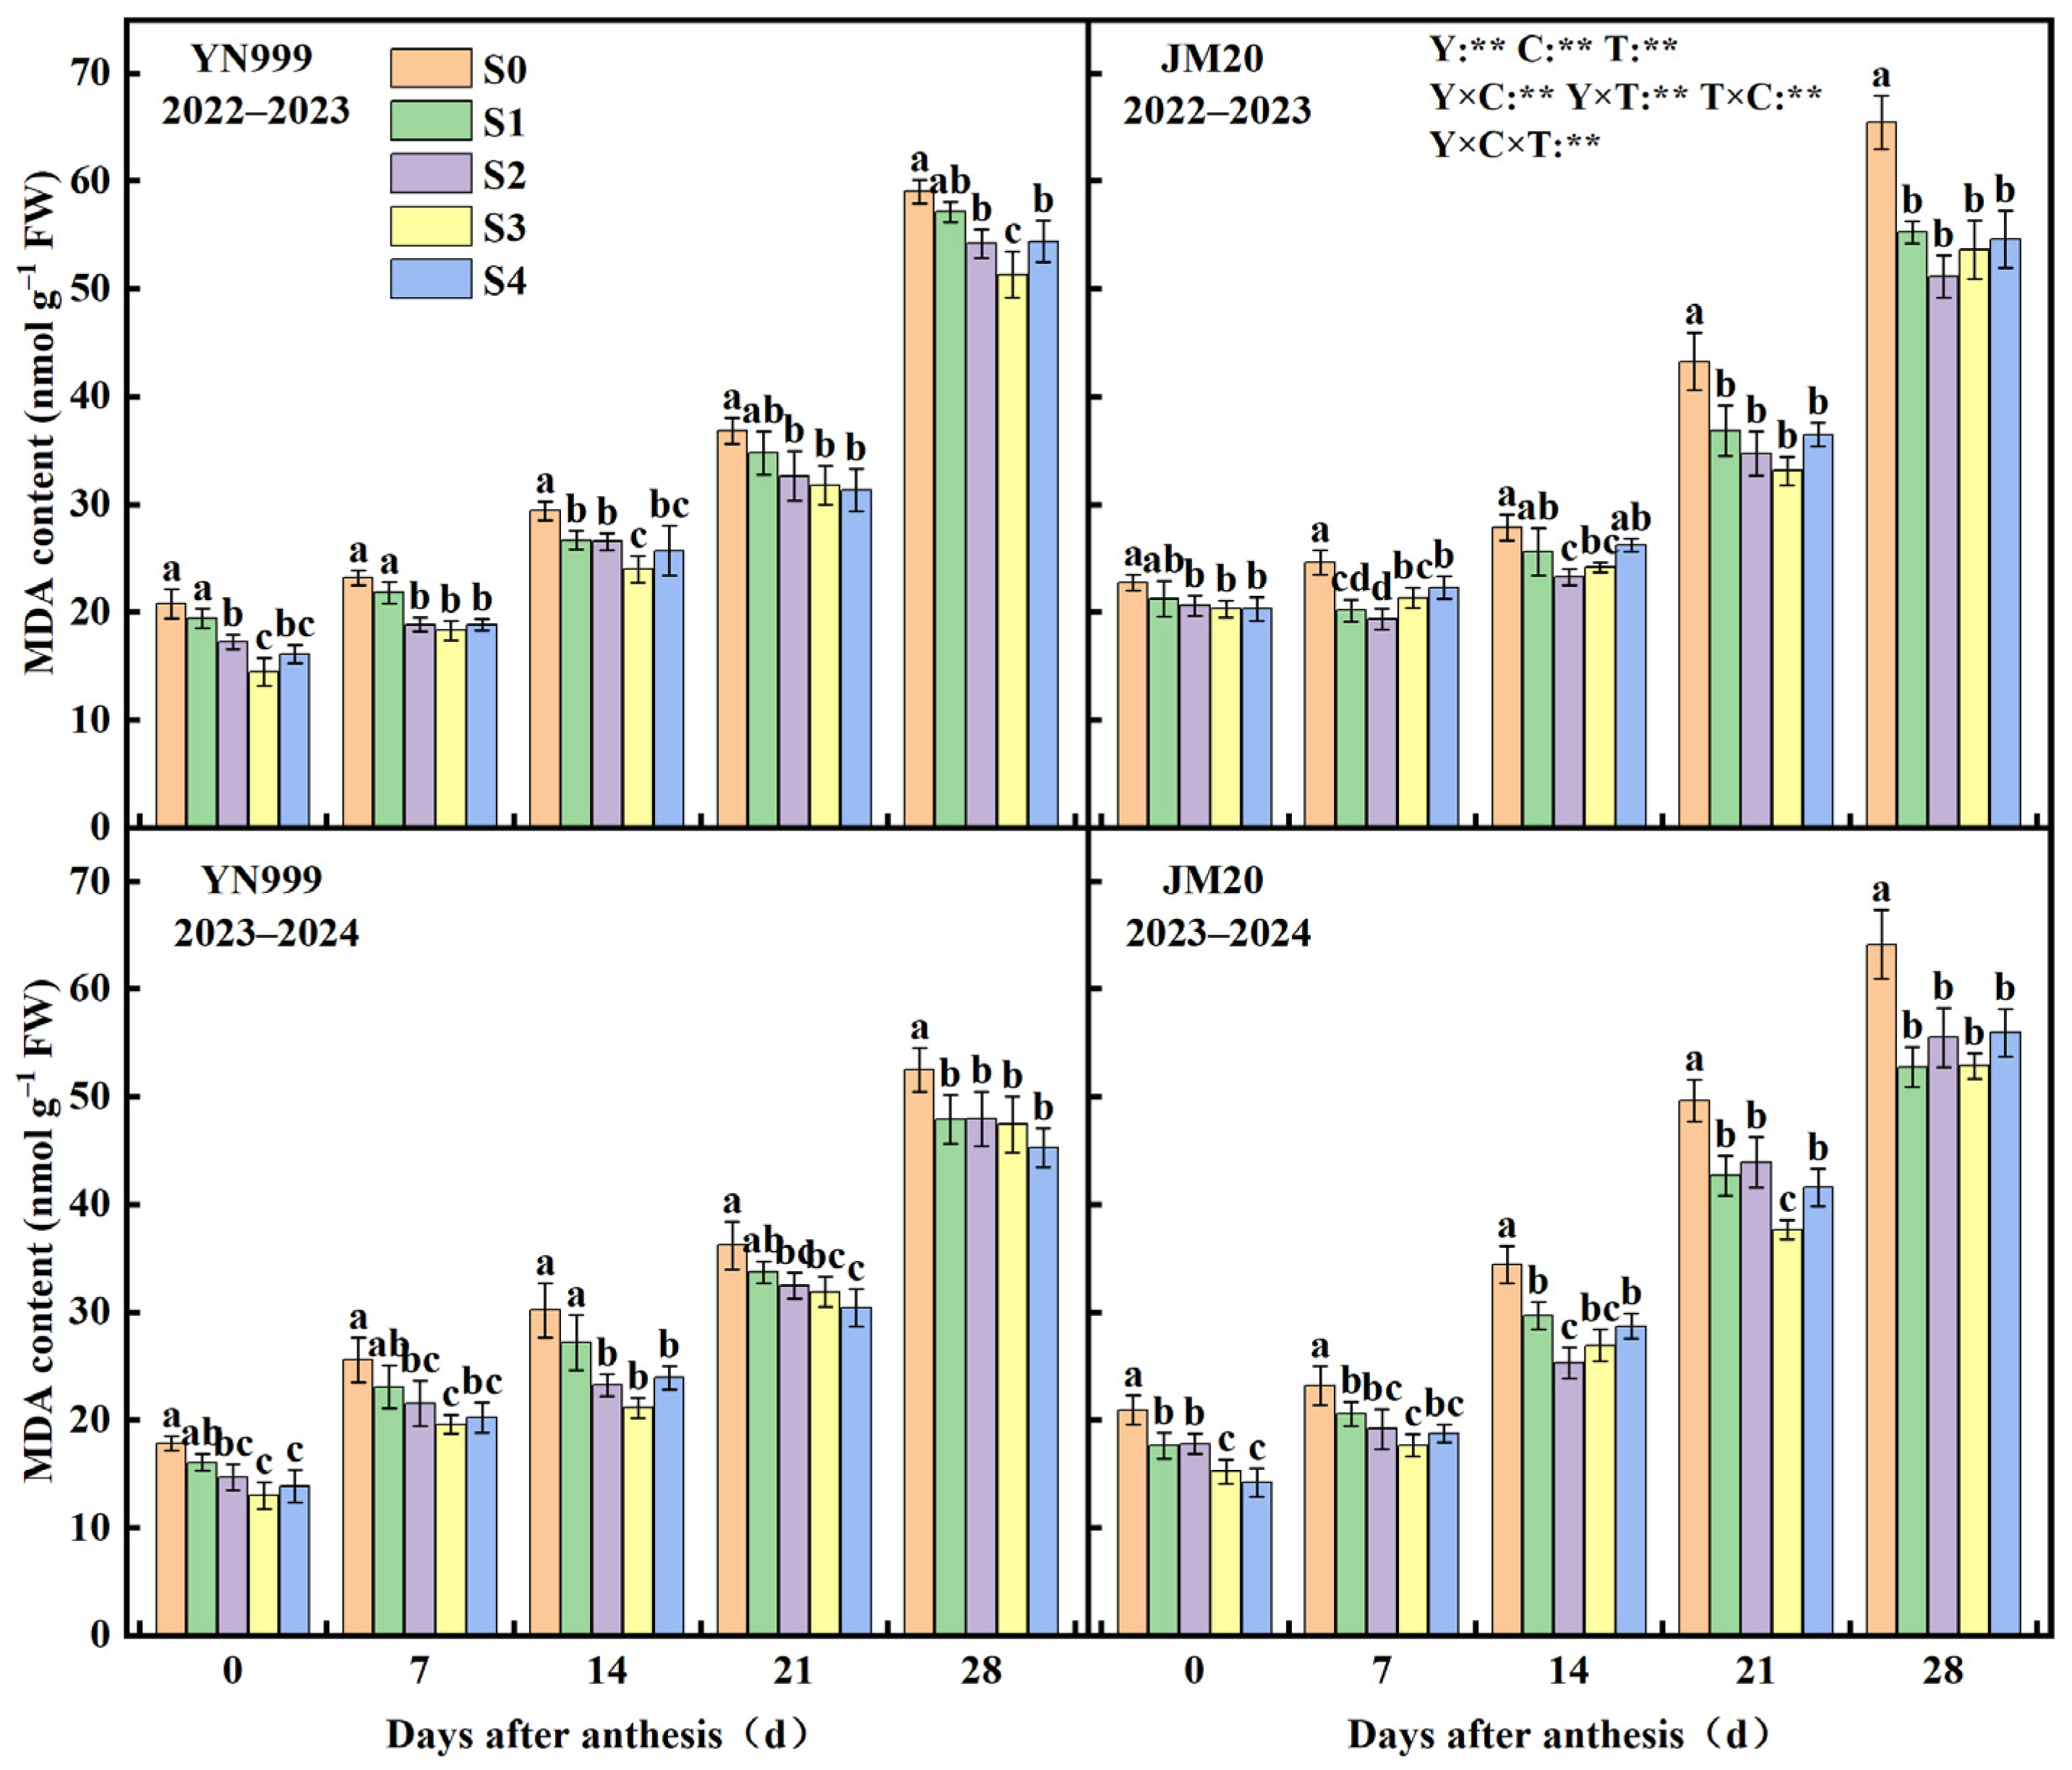
3.3. Effect of Sulfur Application on the Senescence Characteristics of Winter Wheat Flag Leaves

As shown in Figure 7, during the two-year experiment, the superoxide dismutase (SOD) activity of both cultivars exhibited an initial increase followed by a decline as the growth stages progressed. Sulfur application significantly enhanced SOD activity in both cultivars compared to the S0 treatment. In the 2022–2023 growing season, the SOD activity of both cultivars first increased and then decreased with increasing sulfur application rates. For YN999, the overall trend of SOD activity across treatments was S3 > S4 = S2 > S1 > S0, while for JM20, it was S2 > S3 > S4 > S1 > S0. In the 2023–2024 growing season, YN999 showed a trend similar to the first year, whereas for JM20, no significant differences in SOD activity were observed between the S3 and S4 treatments throughout the post-anthesis period, with the overall trend being S3 = S4 > S2 > S1 > S0. Analysis of variance revealed that year, cultivar, and treatment all had significant effects on SOD activity, with two-way interactions observed between each pair of factors.
As shown in Figure 8, during the two-year experiment, the malondialdehyde (MDA) content of all cultivars gradually increased as the growth stages progressed. Compared to the S0 treatment, sulfur application significantly reduced MDA content. In the 2022–2023 growing season, for YN999, no significant differences in MDA content were observed among the S2, S3, and S4 treatments at 7 and 14 days after anthesis (DAA), while for JM20, no significant differences were found among sulfur treatments at 21 and 28 DAA. With increasing sulfur application rates, the overall trends of MDA content for YN999 and JM20 were S3 < S4 < S2 < S1 < S0 and S2 < S1 < S3 < S4 < S0, respectively. In the 2023–2024 growing season, YN999 exhibited the same trend as the first year, whereas JM20 showed consistent patterns at 21 and 28 DAA compared to the first year, but the overall trend shifted to S3 < S2 = S4 < S1 < S0. The analysis of variance indicated that year, cultivar, and treatment all had significant effects on MDA content, with interaction effects observed between all factors.

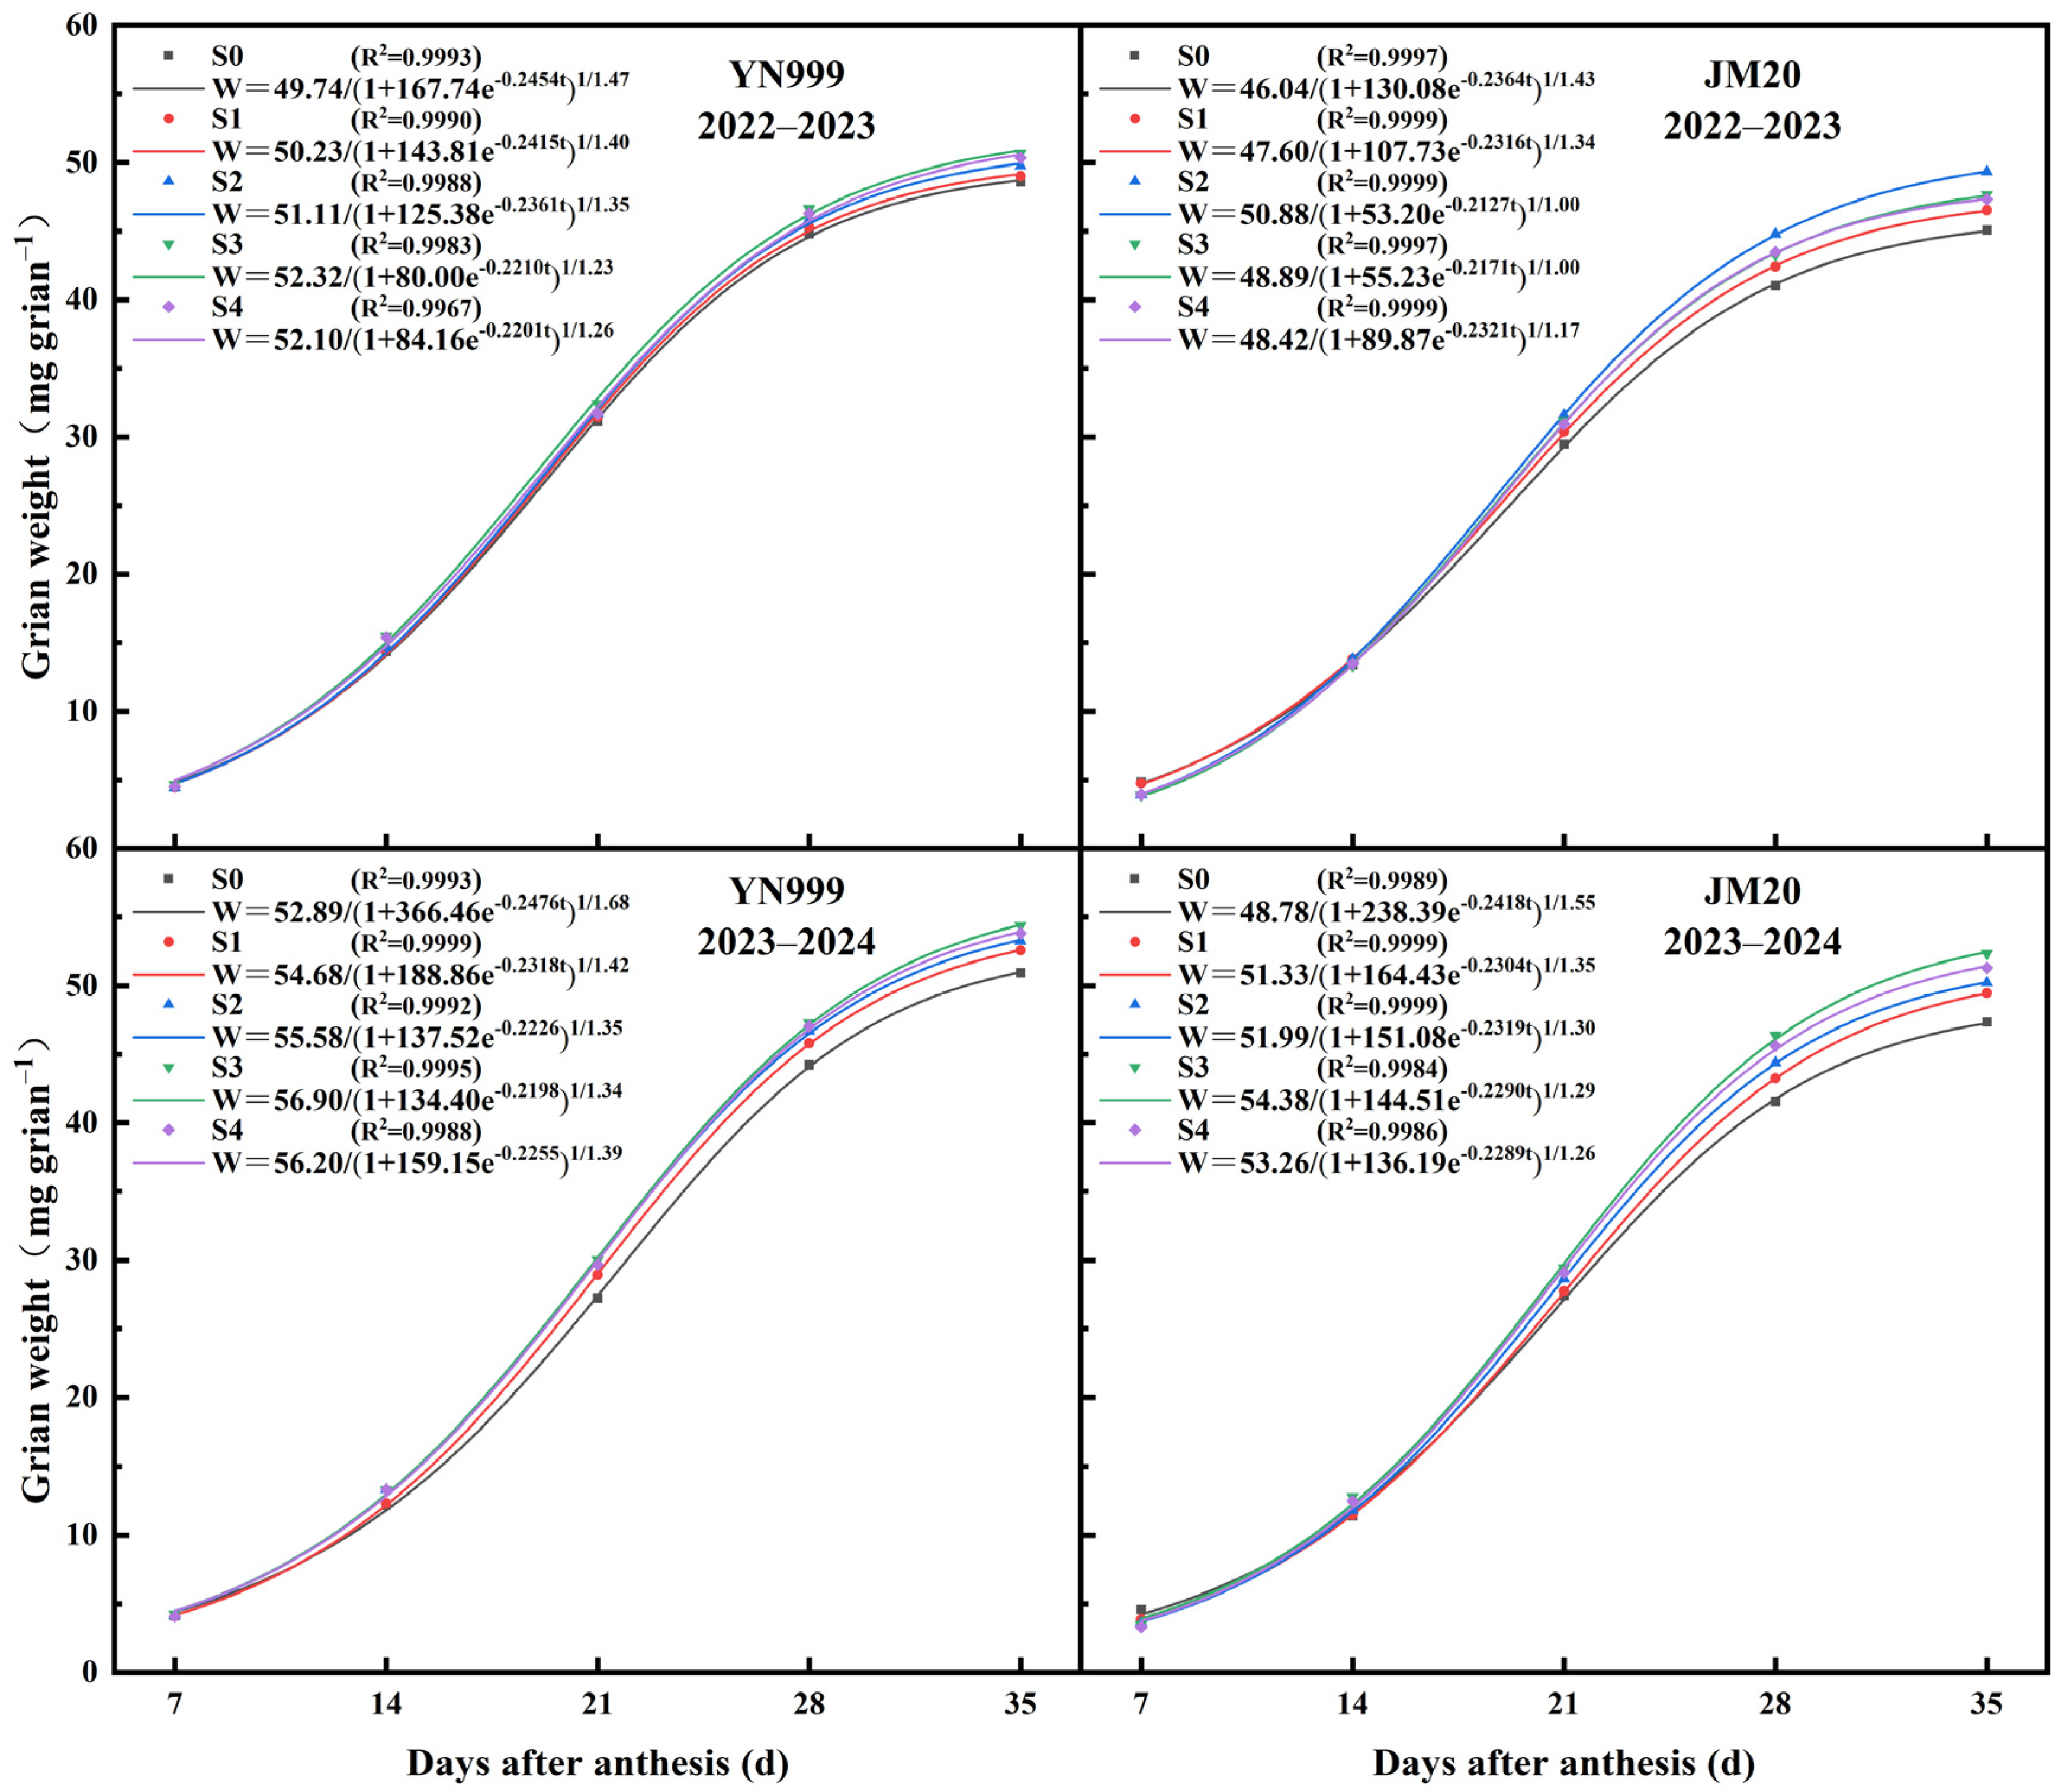
3.4. Effect of Sulfur Application on the Richards Grain Filling Curve and Fitting Equation in Winter Wheat

Figure 9 illustrates the grain filling process and the corresponding fitting equations under different sulfur application treatments. All treatments showed fitting coefficients (R2) exceeding 0.99, confirming that the Richards equation effectively describes the grain filling process of wheat across sulfur application rates. The grain growth dynamics consistently exhibited a “slow–fast–slow” pattern. For YN999, the grain filling curves in both seasons followed the order S3 > S4 > S2 > S1 > S0. In contrast, JM20 showed S2 > S3 > S4 > S1 > S0 in the first season, but shifted to S3 > S4 > S2 > S1 > S0 in the second season. With increasing sulfur application, both the grain filling curves and final growth parameter (A) of the varieties exhibited an initial increase followed by a decline. During the second growing season, sulfur had a more pronounced effect on A. Compared to the S0 treatment, the maximum increases in A for YN999 and JM20 under sulfur application were 7.58% and 11.48%, respectively.

3.5. Effect of Sulfur Application on the Grain Filling Parameters of Wheat

As shown in Table 2, compared to the S0 treatment, sulfur application increased R0, Gmax, Wmax, Gmean, and T0.99 across both growing seasons for all varieties. With increasing sulfur application rates, Gmax, Wmax, Gmean, and T0.99 for both cultivars generally exhibited an initial rise followed by a decline, whereas R0 showed no clear trend. In the 2022–2023 growing season, the Gmax and Gmean of YN999 peaked under the S2 treatment, while T0.99 reached its maximum under the S4 treatment. Although no parameters peaked under the S3 treatment, all metrics remained at relatively high levels for YN999. For JM20, Gmax, Gmean, and T0.99 all peaked under the S2 treatment. In the 2023–2024 growing season, the Gmax, Gmean, and T0.99 of YN999 peaked under the S3 treatment, while JM20’s Gmax and Gmean also peaked under S3. However, no significant differences in T0.99 were observed among treatments for JM20. The ANOVA revealed that cultivar, year, and treatment had significant effects on R0, Tmax, Gmax, Wmax, and Gmean. Treatment showed no significant effect on D, and cultivar had no significant impact on T0.99. Additionally, interactions between year and treatment, as well as between treatment and cultivar, were observed for Gmean.

3.6. Effect of Sulfur Application on the Grain Filling Characteristics of Winter Wheat at Different Grain Filling Stages

As shown in Table 3, based on the two inflection points of the grain filling–fitting curve, the grain filling process was divided into three phases: the gradual increase period, rapid increase period, and slow increase period. The relative growth contribution (RGC) of each phase was influenced by both its duration and the mean grain filling rate (MG) during that phase. Compared to the S0 treatment, sulfur application during both experimental years reduced RGC1, but increased RGC2 and RGC3 in all cultivars. In the 2022–2023 growing season, sulfur application altered RGC in YN999 primarily by modifying the duration of the gradual increase, rapid increase, and slow increase periods (with minimal changes in MG). For JM20, sulfur application significantly affected MG in all phases (exhibiting greater MG variation than YN999), notably decreasing MG1 while increasing MG2 and MG3, although it only significantly influenced the duration of the slow increase period. In the 2023–2024 growing season, the overall trends for both cultivars remained consistent with the first year, with JM20 still showing larger MG variations than YN999; however, a minor difference was observed: no significant differences in MG1 were detected among treatments for JM20. Analysis of variance indicated that year, cultivar, and treatment had significant effects on MG2, MG3, RGC2, and RGC3, while neither the year nor treatment showing significant effects on MG1 or the duration of the slow increase period.

3.7. Effect of Sulfur Application on the Yield and Yield Components of Winter Wheat

As shown in Table 4, compared to the S0 treatment, sulfur application significantly increased the 1000-grain weight and yield of all varieties over the two years, with both parameters showing an initial increase followed by a decrease as sulfur application rates increased. Compared to S0, the maximum yield increases induced by sulfur fertilization for YN999 and JM20 were 16.65% and 18.26%, respectively. During the 2022–2023 growing season, sulfur application showed no significant effect on the number of spikes per hectare or grains per spike for YN999, while both yield and 1000-grain weight followed the trend S3 > S4 > S2 > S1 > S0. For JM20, sulfur application increased the number of spikes per hectare compared to S0, but had no significant effect on grains per spike, with yield and 1000-grain weight trends being S2 > S1 > S3 > S4 > S0. In the 2023–2024 growing season, YN999 exhibited similar patterns to the first year, whereas JM20 showed altered trends for yield and 1000-grain weight: S3 > S2 > S4 > S1 > S0. Analysis of variance revealed that year, variety, and treatment all had significant effects on yield and 1000-grain weight. However, year showed no significant impact on grains per spike, and treatments had no significant effect on spike number. Significant interactions were observed between year and treatment and year and variety for yield. All regression lines show an upward trend, indicating a significant positive correlation between sulfur fertilizer application rates and grain yields (Figure 10).

3.8. Correlation Analysis of SPAD, Photosynthetic Characteristics, Senescence Traits, and Yield

GY represents the grain yield of winter wheat. Figure 11 shows the correlation analysis between SPAD, flag leaf photosynthetic characteristics, senescence traits, and winter wheat yield. In both varieties, SPAD, Pn, Tr, Gs, and SOD were significantly positively correlated with grain yield, while Ci and MDA were significantly negatively correlated with grain yield.

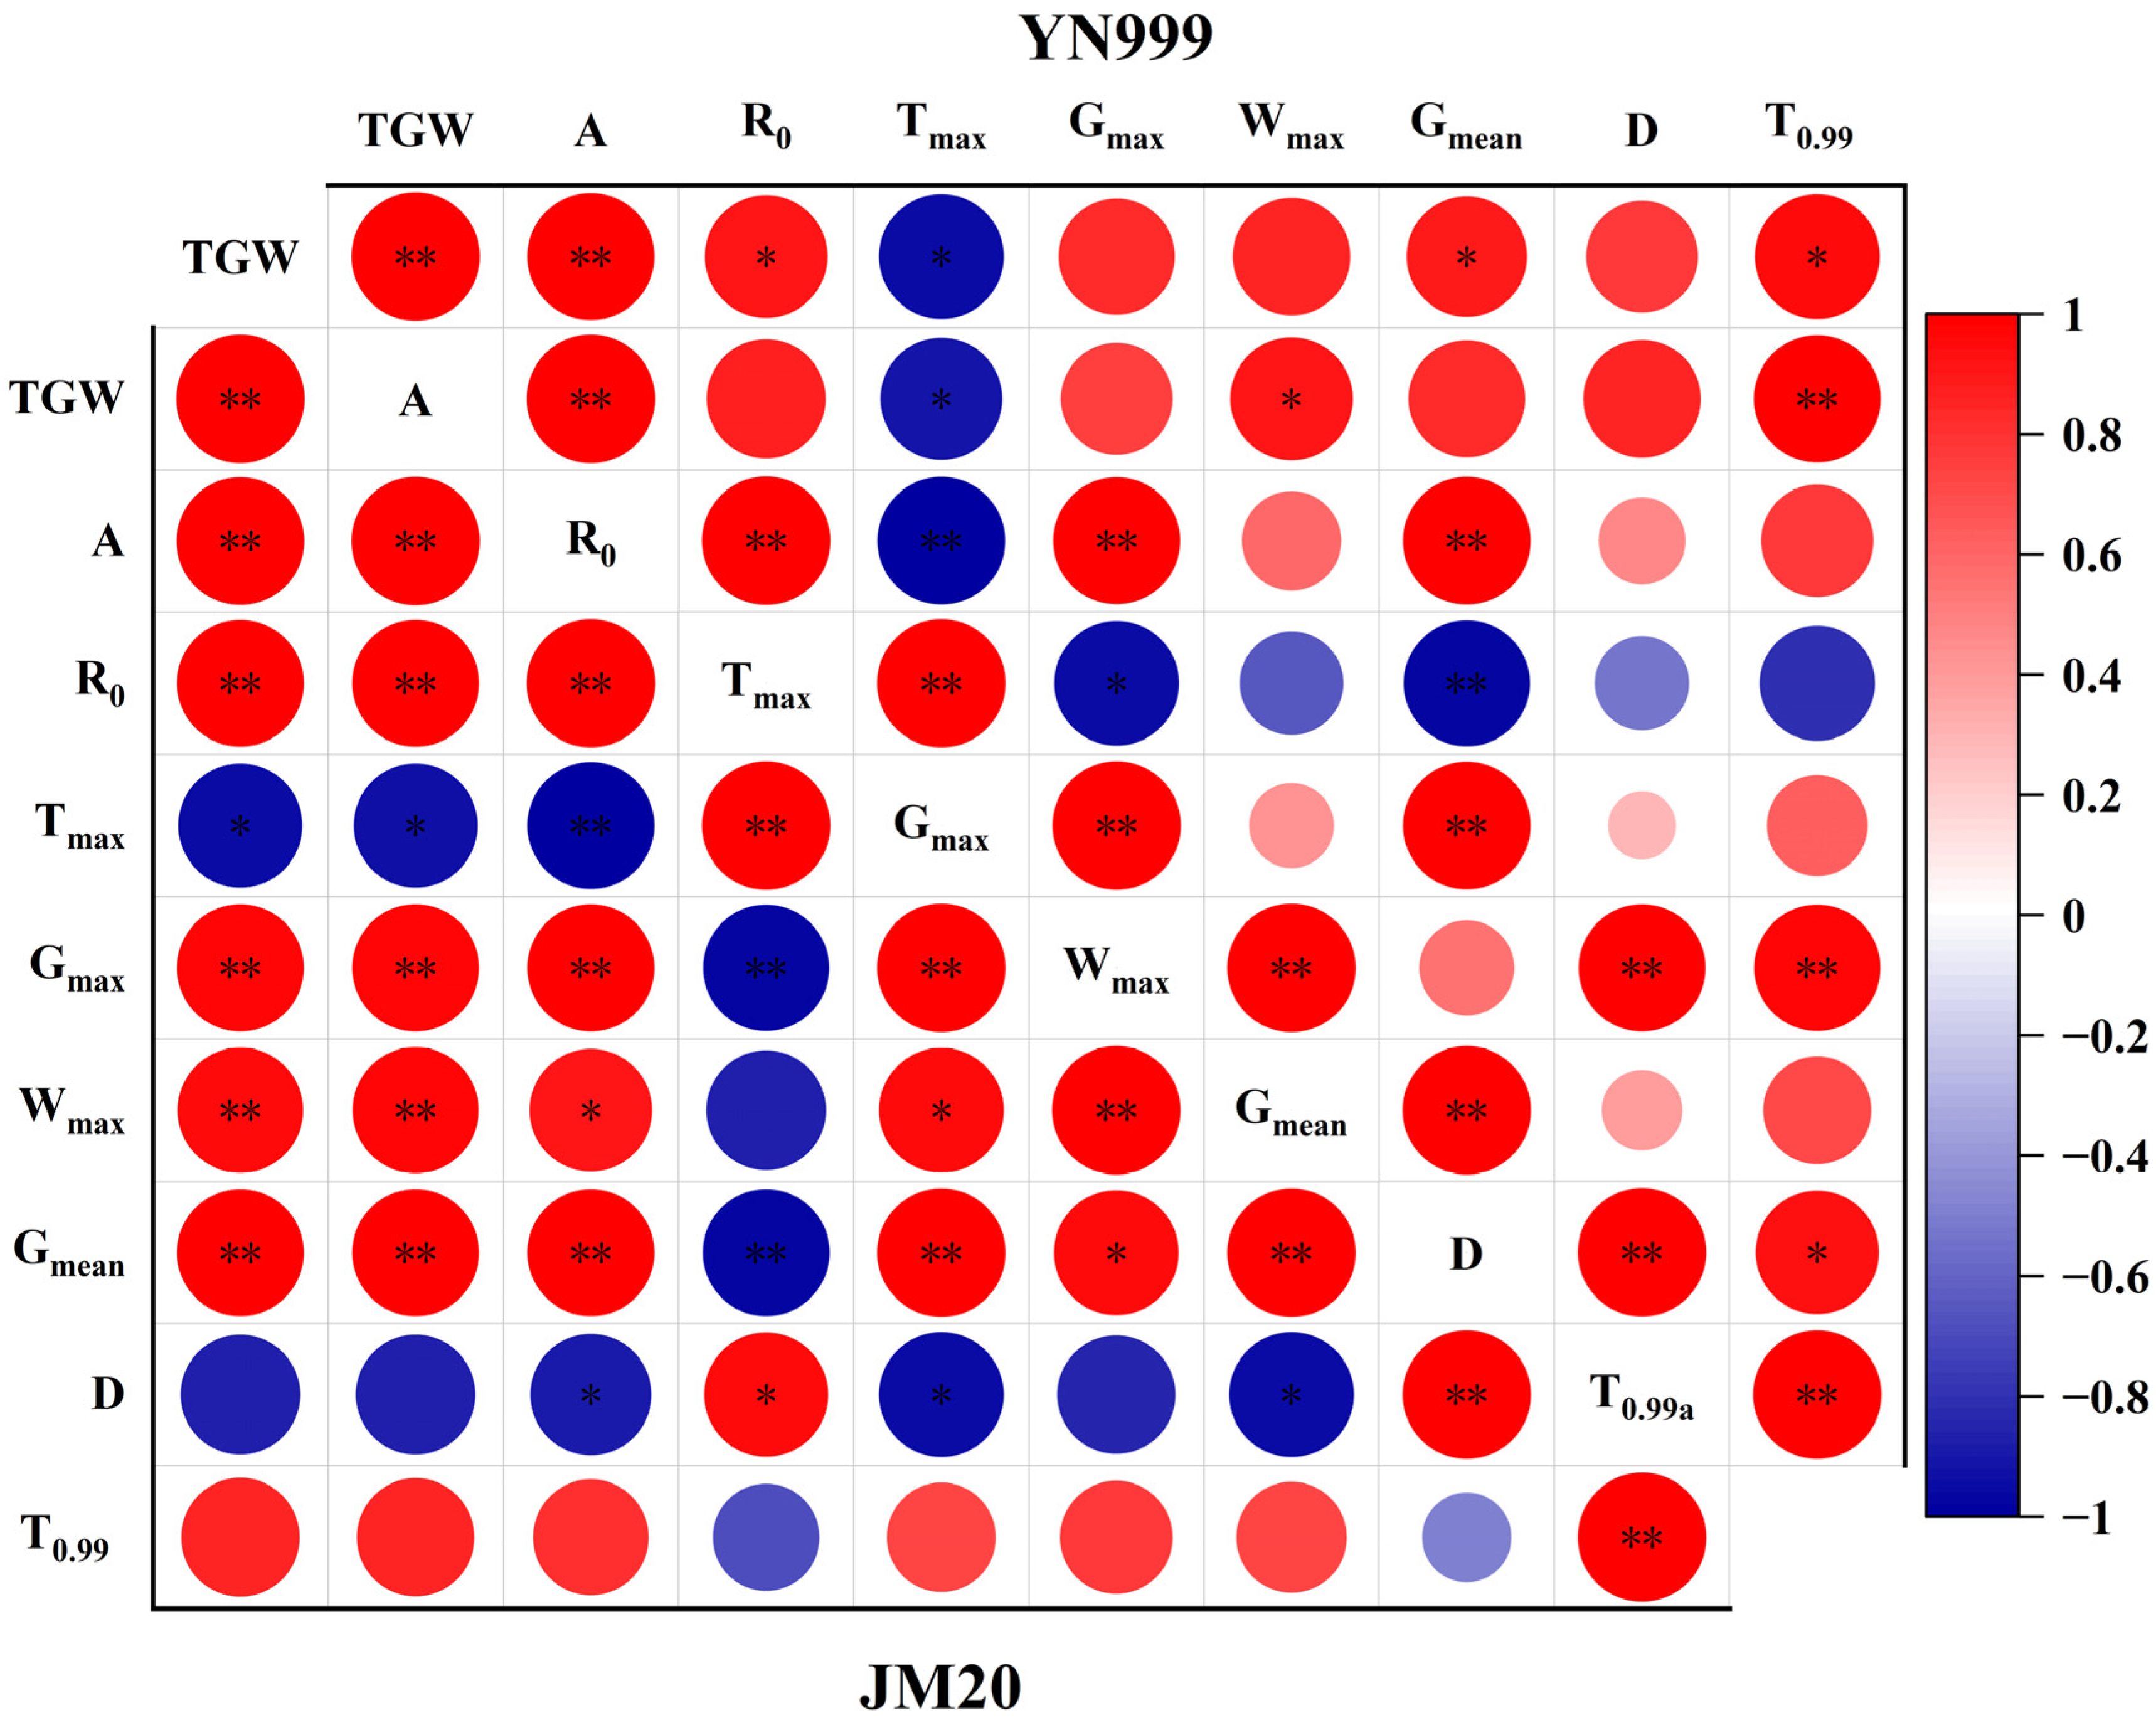
3.9. Correlation Analysis of Final Growth and Grain Filling Parameters with Grain Weight

As shown in Figure 12, during the grain filling process, for YN999, TGW was positively correlated with A, R0, Gmean, and T0.99 and negatively correlated with Tmax and RGC1. For JM20, TGW was positively correlated with A, R0, Gmax, Wmax, and Gmean and negatively correlated with Tmax and RGC1. The correlations between grain filling parameters and TGW were generally similar across varieties, indicating that sulfur primarily increased TGW, and thus yield, by altering these grain filling parameters.

4. Discussion

In this study, the application of sulfur fertilizer showed significant positive benefits for the yield of different wheat varieties over two years. We found that when the control yield (S0) reached 8000 kg ha−1 and 9000 kg ha−1, the highest yield for each cultivar was achieved at sulfur application rates of 30 kg ha−1 and 45 kg ha−1, respectively. This indicates that the sulfur application rate is dynamically responsive to yield control, with the optimal sulfur application rate changing when wheat is in a higher yield potential and better climatic conditions. In this experiment, the two-year trials exhibited distinct patterns, likely attributable to the superior climatic conditions in the second year compared to the first year (e.g., solar radiation, temperature, and rainfall conditions). These favorable conditions enhanced wheat photosynthetic carbon assimilation rates and nitrogen metabolism, triggering a surge in biosynthetic demand for sulfur-containing coenzymes and sulfur-containing amino acids, thereby necessitating higher sulfur input to maintain productivity, particularly in cultivar JM20. Moreover, from a cost–benefit perspective, the application of sulfur fertilizer (ammonium sulfate) at 30–45 kg ha−1 incurred substantially lower costs compared to the economic gains from the yield increase of 0.58–1.54 t ha−1. Notably, in this trial, the effect of sulfur fertilization on yield components was predominantly reflected in grain weight enhancement. While increased grain weight might theoretically occur at the expense of spike number per unit area or grains per spike, no significant alterations in either spike number or grains per unit area were observed under the experimental conditions. This may be because the sulfur was only applied at the jointing stage, a time when wheat tillering is nearly finalized, meaning that small amounts of sulfur have limited influence on effective tiller numbers, resulting in small differences in spike number and spikes per hectare between treatments. Early sulfur application in wheat tillering can increase spike number by 10–70% [29], while sulfur application at the jointing stage significantly affects wheat grain weight, consistent with previous studies [30].
The duration and rate of grain filling reflect the grain filling level [31], which in turn affects the final grain weight and yield at maturity [32,33,34]. In this experiment, sulfur application significantly increased the average grain filling rate and duration over two years for each cultivar. The entire grain filling period can be divided into the gradual increase phase, rapid increase phase, and slow increase phase [35]. Sulfur application increased the final grain weight contribution rate (RGC) during the rapid and slow increase phases. Interestingly, YN999 increased its RGC primarily by extending the duration of the rapid and slow increase phases, while JM 20 primarily increased its RGC by improving the filling rate during these phases. Few previous studies have explored the varietal specificity of wheat responses to sulfur under drip fertigation conditions, whereas this study demonstrates that, under drip fertigation, while sulfur application improved the grain filling process in both cultivars, the specific improvement mechanisms differed, and the optimal sulfur application rates varied. Comprehensive analysis of the two-year trials revealed that YN999 exhibited higher sulfur requirements than JM20. As sulfur application increased, the duration of grain filling, filling rate, and theoretical grain weight first increased and then decreased, which is consistent with previous studies [36,37], suggesting that sulfur application should be within an optimal range. Additionally, we found that the changes in grain filling parameters and RGC patterns across stages due to sulfur application were similar to the results of increased nitrogen fertilization [38,39]. This finding supports the existence of an interaction between nitrogen and sulfur [40,41]. Both nitrogen and sulfur are essential elements for synthesizing photosynthetic precursors and antioxidants, sharing remarkably similar existence patterns and functional roles within plants. They play critical roles in both photosynthetic systems and antioxidant systems [13,42], where a deficiency in either element reduces the utilization efficiency of the other [41]. Furthermore, this study has certain limitations, as it exclusively investigates sulfur’s effects on wheat under a single nitrogen fertilization level. The optimal sulfur requirements for wheat may vary under different nitrogen application levels, necessitating further explorations of their synergistic interactions in subsequent trials.
Grain filling levels are regulated by photosynthetic capacity [5,6,7]. In this experiment, sulfur fertilization significantly increased the net photosynthetic rate, stomatal conductance, and transpiration rate for each cultivar, while reducing intercellular CO2 concentration, consistent with previous studies [43,44]. As sulfur application increased, photosynthetic capacity in each cultivar showed a trend of first increasing and then decreasing, confirming the impact of sulfur on photosynthetic capacity [11], and further supporting the regulatory role of photosynthesis in grain filling levels. Chlorophyll is a key substance in capturing light energy during photosynthesis [45] and can be used as an indirect measure of photosynthetic capacity. In this experiment, sulfur fertilization significantly increased the SPAD values of wheat flag leaves and notably delayed the time to reach the peak SPAD value. Sulfur also maintained higher SOD activity throughout the grain filling period, enhancing the ability to scavenge ROS produced by photosynthesis. The reduction in MDA content further indicated a decrease in oxidative damage to the plant. These two factors highlight the importance of sulfur in the antioxidant system [18,46]. Higher SPAD values and antioxidant capacity provided strong support for maintaining higher photosynthetic ability in wheat during the later stages of grain filling. Maintaining high photosynthetic ability effectively improved grain filling levels, which led to increased grain weight and, ultimately, higher yield. The correlation analysis shows that yield was significantly positively correlated with SPAD values, photosynthetic capacity, and antioxidant capacity, which strongly support this conclusion.

5. Conclusions

In summary, sulfur application effectively maintained higher post-anthesis SPAD values and enhanced antioxidant capacity in wheat, thereby sustaining elevated photosynthetic activity, improving grain filling processes to increase grain weight, and ultimately boosting yield. In the North China Plain, optimal yield improvements were achieved with sulfur application rates of 30–45 kg ha−1, although cultivar-specific responses to sulfur fertilization were observed, suggesting that high-yielding cultivars may require adjusted sulfur rates. This study provides a theoretical foundation for precision sulfur management. Future research should prioritize dynamic monitoring of soil sulfur status and integrate precision agriculture tools (e.g., automatic weather stations) to optimize sulfur application. These findings could help shift farmers’ nitrogen-focused fertilization practices while mitigating soil sulfur deficiency trends. However, it is important to note that these conclusions were derived under drip fertigation systems and may differ from traditional flood irrigation practices; thus, our results should not be directly extrapolated to conventional farming systems.

Author Contributions

Conceptualization, H.D. and W.L.; methodology, H.D.; software, H.D. and W.L.; validation, H.D. and W.L.; formal analysis, H.D.; investigation, Y.J. and Y.D.; resources, L.Z., J.J. and S.L.; data curation, H.D.; writing—original draft preparation, H.D. and W.L.; writing—review and editing, H.D.; visualization, H.D.; supervision, C.Z.; project administration, C.Z.; funding acquisition, C.Z. All authors have read and agreed to the published version of the manuscript.

Funding

Qingdao Science and Technology Benefit for People Demonstration Special Project (24-1-8-xdny-1-nsh); Shandong Province Key Research and Development Plan Project (2022CXPT009); Shandong Province Major Science and Technology Innovation Project (2019JZZY010716); Shandong Province Major Industry Public Relations Project for New and Old Kinetic Energy Conversion (2021-54); Qingdao Modern Agricultural Industry Technology System Wheat Innovation Promotion Team Project (6622316104).

Institutional Review Board Statement

Not applicable.

Data Availability Statement

The data are available from the corresponding author upon reasonable request.

Conflicts of Interest

The authors declare no conflicts of interest.

References

  1. Hawkesford, M.J.; Araus, J.L.; Park, R.; Calderini, D.; Miralles, D.; Shen, T.M.; Zhang, J.P.; Parry, M.A.J. Prospects of doubling global wheat yields. Food Energy Secur. 2013, 2, 34–48. [Google Scholar] [CrossRef]
  2. He, J.N.; Shi, Y.; Zhao, J.Y.; Yu, Z.W. Strip rotary tillage with subsoiling increases winter wheat yield by alleviating leaf senescence and increasing grain filling. Crop J. 2020, 8, 327–340. [Google Scholar] [CrossRef]
  3. Rivera-Amado, C.; Molero, G.; Trujillo-Negrellos, E.; Reynolds, M.; Foulkes, J. Estimating organ contribution to grain filling and potential for source upregulation in wheat cultivars with a contrasting source–sink balance. Agronomy 2020, 10, 1527. [Google Scholar] [CrossRef]
  4. Baillot, N.; Girousse, C.; Allard, V.; Piquet-Pissaloux, A.; Gouis, J. Different grain-filling rates explain grain-weight differences along the wheat ear. PLoS ONE 2018, 13, e0209597. [Google Scholar] [CrossRef]
  5. Guo, Z.J.; Shi, Y.; Yu, Z.W.; Zhang, Y.L. Supplemental irrigation affected flag leaves senescence post-anthesis and grain yield of winter wheat in the Huang-Huai-Hai Plain of China. Field Crops Res. 2015, 180, 100–109. [Google Scholar] [CrossRef]
  6. Mu, H.; Jiang, D.; Wollenweber, B.; Dai, T.; Jing, Q.; Cao, W. Long-term low radiation decreases leaf photosynthesis, photochemical efficiency and grain yield in winter wheat. J. Agron. Crop Sci. 2010, 196, 38–47. [Google Scholar] [CrossRef]
  7. Liu, X.M.; Meng, Y.; Gu, W.R.; Tong, T.; Li, C.F.; Li, W.H. Plant Growth Regulators Application Improves Spring Maize Yield by Improving Net Photosynthesis and Grain Filling Rate. Int. J. Agric. Biol. 2019, 22, 1223–1230. [Google Scholar] [CrossRef]
  8. Saito, K. Sulfur Assimilatory Metabolism. The Long and Smelling Road. Plant Physiol. 2004, 136, 2443–2450. [Google Scholar] [CrossRef]
  9. Zenda, T.; Liu, S.; Dong, A.; Duan, H. Revisiting Sulphur—The Once Neglected Nutrient: It’s Roles in Plant Growth, Metabolism, Stress Tolerance and Crop Production. Agriculture 2021, 11, 626. [Google Scholar] [CrossRef]
  10. Roa, G.A.; Quintana-Obregón, E.A.; González-Renteria, M.; Ruiz Diaz, D.A. Increasing wheat protein and yield through sulfur fertilization and its relationship with nitrogen. Nitrogen 2024, 5, 553–571. [Google Scholar] [CrossRef]
  11. Sharma, R.K.; Cox, M.S.; Oglesby, C.; Dhillon, J.S. Revisiting the role of sulfur in crop production: A narrative review. J. Agr. Food Res. 2024, 15, 101013. [Google Scholar] [CrossRef]
  12. Scherer, H.W. Sulphur in crop production—Invited paper. Eur. J. Agron. 2001, 14, 81–111. [Google Scholar] [CrossRef]
  13. Narayan, O.P.; Kumar, P.; Yadav, B.; Dua, M.; Johri, A.K. Sulfur nutrition and its role in plant growth and development. Plant Signal. Behav. 2023, 18, 2030082. [Google Scholar] [CrossRef]
  14. Booali, S.; Zoufan, P.; Zare Bavani, M.R. Effect of biofertilizer containing Thiobacillus bacteria along with different levels of chemical sulfur fertilizer on growth response and photochemical efficiency of small radish plants (Raphanus sativus L. var. shushtari) under greenhouse conditions. Sci. Hortic. 2024, 327, 112835. [Google Scholar] [CrossRef]
  15. Domínguez, F.; Cejudo, F.J. Chloroplast dismantling in leaf senescence. J. Exp. Bot. 2021, 72, 5905–5918. [Google Scholar] [CrossRef]
  16. Tavanti, T.R.; Melo, A.; Moreira, L.D.K.; Sanchez, D.E.J.; Silva, R.D.; Silva, R.M.D.; Reis, A.R.D. Micronutrient fertilization enhances ROS scavenging system for alleviation of abiotic stresses in plants. Plant Physiol. Bioch. 2021, 160, 386–396. [Google Scholar] [CrossRef]
  17. Zhu, Y.; Tian, W.; Xie, Y.; Guo, T.C.; Wang, C.; Liu, N. Effects of Sulphur Ascorbic Acid and Glutathione Circulatory System in Flag Leaf of Winter Wheat. Acta Bot. Boreali-Occident. Sin. 2010, 30, 2191–2196. [Google Scholar]
  18. Mukwevho, E.; Ferreira, Z.; Ayeleso, A. Potential Role of Sulfur-Containing Antioxidant Systems in Highly Oxidative Environments. Molecules 2014, 19, 19376–19389. [Google Scholar] [CrossRef]
  19. Wrigley, C.W.; Du Cros, D.L.; Fullington, J.G.; Kasarda, D.D. Changes in polypeptide composition and grain quality due to sulfur deficiency in wheat. J. Cereal Sci. 1984, 2, 15–24. [Google Scholar] [CrossRef]
  20. Ju, X.-T.; Xing, G.-X.; Chen, X.-P.; Zhang, S.-L.; Zhang, L.-J.; Liu, X.-J.; Cui, Z.-L.; Yin, B.; Christie, P.; Zhu, Z.-L.; et al. Reducing environmental risk by improving N management in intensive Chinese agricultural systems. Proc. Natl. Acad. Sci. USA 2009, 106, 3041–3046. [Google Scholar] [CrossRef]
  21. Shahane, A.A.; Shivay, Y.S.; Prasanna, R.; Kumar, D. Nutrient removal by rice-wheat cropping system as influenced by crop establishment techniques and fertilization options in conjunction with microbial inoculation. Sci. Rep. 2020, 10, 21944. [Google Scholar] [CrossRef] [PubMed]
  22. David, M.B.; Gentry, L.E.; Mitchell, C.A. Riverine Response of Sulfate to Declining Atmospheric Sulfur Deposition in Agricultural Watersheds. J. Environ. Qual. 2016, 45, 1313–1319. [Google Scholar] [CrossRef]
  23. Kulczycki, G. The effect of elemental sulfur fertilization on plant yields and soil properties. Adv. Agron. 2021, 167, 105–181. [Google Scholar]
  24. Mandi, S.; Shivay, Y.S.; Prasanna, R.; Nayak, S.; Baral, K.; Reddy, K.S.; Borate, R.B. Insights into the Response of Elemental Sulfur Fertilization on Crop Yield and Nutritional Quality of Durum Wheat. J. Soil Sci. Plant Nutr. 2024, 24, 8306–8320. [Google Scholar] [CrossRef]
  25. Xie, Y.-X.; Zhang, H.; Zhu, Y.-J.; Zhao, L.; Yang, J.-H.; Cha, F.-N.; Liu, C.; Wang, C.-Y.; Guo, T.-C. Grain yield and water use of winter wheat as affected by water and sulfur supply in the North China Plain. J. Integr. Agric. 2017, 16, 614–625. [Google Scholar] [CrossRef]
  26. Hamani, A.K.M.; Abubakar, S.A.; Si, Z.Y.; Kama, R.; Gao, Y.; Duan, A.W. Responses of grain yield and water-nitrogen dynamic of drip-irrigated winter wheat (Triticum aestivum L.) to different nitrogen fertigation and water regimes in the North China Plain. Agric. Water Manag. 2023, 288, 108494. [Google Scholar] [CrossRef]
  27. Richards, F.J. A flexible growth function for empirical use. J. Exp. Bot. 1959, 10, 290–301. [Google Scholar] [CrossRef]
  28. Jiang, Q.; Du, Y.; Tian, X.; Wang, Q.; Xiong, R.; Xu, G.; Yan, C.; Ding, Y. Effect of panicle nitrogen on grain filling characteristics of high-yielding rice cultivars. Eur. J. Agron. 2016, 74, 185–192. [Google Scholar] [CrossRef]
  29. Hřivna, L.; Kotková, B.; Burešová, I. Effect of Sulphur Fertilization on Yield and Quality of Wheat Grain. Cereal Res. Commun. 2015, 43, 344–352. [Google Scholar] [CrossRef]
  30. Liu, Z.; Fu, X.Y.; Wang, S.; Ma, J.Y.; Li, D.X.; Li, R.Q. Effects of Sulfur Application Period on Yield and Physiological Characteristics of Strong-Gluten Wheat. Acta Agric. Boreali-Sin. 2024, 39, 102–109. [Google Scholar]
  31. Pireivatlou, A.S.; Aliyev, R.; Lalehloo, B.S. Grain filling rate and duration in bread wheat under irrigated and drought stressed conditions. J. Plant Physiol. Breed. 2011, 1, 69–86. [Google Scholar]
  32. Bolaños, J. Physiological bases for yield differences in selected maize cultivars from Central America. Field Crops Res. 1995, 42, 69–80. [Google Scholar] [CrossRef]
  33. Borrás, L.; Gambín, B.L. Trait dissection of maize kernel weight: Towards integrating hierarchical scales using a plant growth approach. Field Crops Res. 2010, 118, 1–12. [Google Scholar] [CrossRef]
  34. Liu, H.X.; Si, X.M.; Wang, Z.Y.; Cao, L.J.; Gao, L.F.; Zhou, X.L.; Wang, W.X.; Wang, K.; Jiao, C.Z.; Zhuang, L.; et al. TaTPP-7A positively feedback regulates grain filling and wheat grain yield through T6P-SnRK1 signalling pathway and sugar-ABA interaction. Plant Biotechnol. J. 2023, 21, 1159–1175. [Google Scholar] [CrossRef]
  35. Lv, X.K.; Han, J.; Liao, Y.C.; Liu, Y. Effect of phosphorus and potassium foliage application post-anthesis on grain filling and hormonal changes of wheat. Field Crops Res. 2017, 214, 83–93. [Google Scholar] [CrossRef]
  36. Shen, X.S.; Zhu, Y.J.; Guo, T.C.; Li, G.Q.; Qu, H.J. Effects of Sulphur Application on Characteristics of Grain Filling and Grain Yield of Winter Wheat Cultivar ‘Yumai 50’. Acta Bot. Boreali-Occident. Sin. 2007, 27, 1265–1269. [Google Scholar]
  37. Zhao, Y.X.; Li, N.; Zhou, F.; Li, X.-F.; Wang, L.-Q. Effects of N and S application on grain filling characteristics and yield of winter wheat. Chin. J. Appl. Ecol. 2014, 25, 1366–1372. [Google Scholar]
  38. Ouyang, X.; Jiang, G.; Liu, J.; Wang, H.; Wang, R. Effect of nitrogen reduction on the remobilization of post-anthesis assimilates to grain and grain-filling characteristics in a drip-irrigated spring wheat system. Crop Sci. 2023, 63, 293–305. [Google Scholar] [CrossRef]
  39. Wang, J.J.; Sun, X.; Hussain, S.; Yang, L.H.; Gao, S.S.; Zhang, P.; Chen, X.L.; Ren, X.L. Reduced nitrogen rate improves post-anthesis assimilates to grain and ameliorates grain-filling characteristics of winter wheat in dry land. Plant Soil 2024, 499, 91–112. [Google Scholar] [CrossRef]
  40. Shivay, Y.S.; Pooniya, V.; Prasad, R.; Pal, M.; Bansal, R. Sulphur-coated Urea as a Source of Sulphur and an Enhanced Efficiency of Nitrogen Fertilizer for Spring Wheat. Cereal Res. Commun. 2016, 44, 513–523. [Google Scholar] [CrossRef]
  41. Ullah, I.; Muhammad, D.; Mussarat, M. Effect of Various Nitrogen Sources at Various Sulfur Levels on Maize-Wheat Yield and N/S Uptake under Different Climatic Conditions. J. Plant Growth Regul. 2023, 42, 2073–2087. [Google Scholar] [CrossRef]
  42. Noor, H.; Yan, Z.Z.; Sun, P.J.; Zhang, L.M.; Ding, P.C.; Li, L.H.; Ren, A.X.; Sun, M.; Gao, Z.Q. Effects of Nitrogen on Photosynthetic Productivity and Yield Quality of Wheat (Triticum aestivum L.). Agronomy 2023, 13, 1448. [Google Scholar] [CrossRef]
  43. Xie, Y.; Zhu, Y.; Guo, T.C.; Wang, C.; Wang, Y.; Ma, D. Effects of sulphureous fertilization on photosynthetic and physiological characteristics and yields of winter wheat. J. Plant Nutr. Fertil. 2009, 15, 403–409. [Google Scholar]
  44. Tian, W.; Zhu, Y.; Guo, T.C.; Xie, Y.; Zhu, X.; Wang, F. Effects of irrigation and sulphur and their interactions on photosynthetic characteristics and yield of winter wheat. Agric. Res. Arid. Areas 2009, 27, 114–119. [Google Scholar]
  45. Vishniac, W.; Rose, I.A. Mechanism of chlorophyll action in photosynthesis. Nature 1958, 182, 1089–1090. [Google Scholar] [CrossRef]
  46. Zahid, A.; Ul Din, K.; Ahmad, M.; Hayat, U.; Zulfiqar, U.; Askri, S.M.H.; Anjum, M.Z.; Maqsood, M.F.; Aijaz, N.; Chaudhary, T.; et al. Exogenous application of sulfur-rich thiourea (STU) to alleviate the adverse effects of cobalt stress in wheat. BMC Plant Biol. 2024, 24, 126. [Google Scholar] [CrossRef]
Figure 1. Experimental site rainfall and temperature chart.
Agriculture 15 01012 g001
Figure 2. Effect of sulfur application on SPAD values of flag leaves in winter wheat after anthesis. The type of mean comparison test was Duncan’s new multiple range method. The vertical bar represents the standard error and the different lowercase letters above the error line represent the significant difference in the mean values of different treatments of the same measurement item (p  <  0.05). Y, C, and T represent year, cultivar, and treatment, respectively. “*” indicates significant differences at the 0.05 level and “**” indicates significant differences at the 0.01 level.
Agriculture 15 01012 g002
Figure 3. Impact of sulfur application on the photosynthetic parameter Pn of flag leaves. The type of mean comparison test was Duncan’s new multiple range method. The vertical bar represents the standard error, and the different lowercase letters above the error line represent the significant difference in the mean values of different treatments of the same measurement item (p  <  0.05). Y, C, and T represent year, cultivar, and treatment, respectively. “**” indicates significant differences at the 0.01 level.
Agriculture 15 01012 g003
Figure 4. Impact of sulfur application on the photosynthetic parameter Tr of flag leaves. The type of mean comparison test was Duncan’s new multiple range method. The vertical bar represents the standard error, and the different lowercase letters above the error line represent the significant difference in the mean values of different treatments of the same measurement item (p  <  0.05). Y, C, and T represent year, cultivar, and treatment, respectively. “**” indicates significant differences at the 0.01 level.
Agriculture 15 01012 g004
Figure 5. Impact of sulfur application on the photosynthetic parameter Gs of flag leaves. The type of mean comparison test was Duncan’s new multiple range method. The vertical bar represents the standard error, and the different lowercase letters above the error line represent the significant difference in the mean values of different treatments of the same measurement item (p  <  0.05). Y, C, and T represent year, cultivar, and treatment, respectively. “**” indicates significant differences at the 0.01 level.
Agriculture 15 01012 g005
Figure 6. Impact of sulfur application on the photosynthetic parameter Ci of flag leaves. In Figure 3, Figure 4, Figure 5 and Figure 6, Pn, Tr, Gs, and Ci represent net photosynthetic rate, transpiration rate, stomatal conductance, and intercellular CO2 concentration, respectively. The type of mean comparison test was Duncan’s new multiple range method. The vertical bar represents the standard error, and the different lowercase letters above the error line represent the significant difference in the mean values of different treatments of the same measurement item (p  <  0.05). Y, C, and T represent year, cultivar, and treatment, respectively. “**” indicates significant differences at the 0.01 level.
Agriculture 15 01012 g006
Figure 7. Impact of sulfur application on SOD activity of flag leaves. The type of mean comparison test was Duncan’s new multiple range method. The vertical bar represents the standard error, and the different lowercase letters above the error line represent the significant difference in the mean values of different treatments of the same measurement item (p  <  0.05). Y, C, and T represent year, cultivar, and treatment, respectively. “**” indicates significant differences at the 0.01 level.
Agriculture 15 01012 g007
Figure 8. Impact of sulfur application on MDA content of flag leaves. The type of mean comparison test was Duncan’s new multiple range method. The vertical bar represents the standard error, and the different lowercase letters above the error line represent the significant difference in the mean values of different treatments of the same measurement item (p  <  0.05). Y, C, and T represent year, cultivar, and treatment, respectively. “**” indicates significant differences at the 0.01 level.
Agriculture 15 01012 g008
Figure 9. Impact of sulfur application on grains filling fitting curves and fitting equations of wheat.
Agriculture 15 01012 g009
Figure 10. Relationship between sulfur application rate and grain yield. The blue is JM20 and the red is YN999, the regression equation for YN999 is at the top of the image, and the regression equation for JM20 is at the bottom of the image.
Agriculture 15 01012 g010
Figure 11. Correlation analysis of SPAD, photosynthetic, and senescence characteristics with yield. GY, SPAD, Pn, Tr, Gs, Ci, SOD, and MDA represent grain yield, relative chlorophyll content, net photosynthetic rate, transpiration rate, stomatal conductance, intercellular CO2 concentration, superoxide dismutase, and malondialdehyde, respectively. “*” indicates significant differences at the 0.05 level, and “**” indicates significant differences at the 0.01 level.
Agriculture 15 01012 g011
Figure 12. Correlation analysis of ultimate growth quantity and filling parameters with thousand grain weight. TGW: thousand grain weight; A: ultimate growth quantity; R0: initial grain filling potential; Tmax: time of maximum grain filling rate occurrence; Gmax: maximum grain filling rate; Wmax: grain weight achieving the maximal grain filling rate; Gmean: mean grain filling rate; D: active grain filling date; T0.99: duration of grain filling; RGC1, RGC2, and RGC3 are the contribution rates of grain growth amount in the gradual, rapid, and slow increase periods of grain filling to the final grain weight, respectively. “*” indicates significant differences at the 0.05 level, and “**” indicates significant differences at the 0.01 level.
Agriculture 15 01012 g012
Table 1. Fertilizer applications in different treatments.
TreatmentN
kg ha−1
P
kg ha−1
K
kg ha−1
S
kg ha−1
BasalTopdressingBasalBasalTopdressing
S09012090900
S115
S230
S345
S460
Table 2. Grain filling parameters based on the Richards equation.
YearCultivarTreatmentR0Tmax
(d)
Gmax
(mg·grain−1·d−1)
Wmax
(mg)
Gmean
(mg·grain−1·d−1)
D
(d)
T0.99
(d)
2022–23YN999S00.1672 b19.30 a2.67 bc26.88 a1.76 b28.30 b38.04 b
S10.1725 ab19.18 a2.70 ab26.88 a1.78 a28.17 b38.20 b
S20.1750 ab19.18 a2.73 a27.14 a1.80 a28.39 b38.65 b
S30.1799 a18.90 b2.70 ab27.25 a1.79 a29.23 a39.70 a
S40.1754 ab19.11 ab2.66 c27.26 a1.76 b29.58 a39.98 a
JM20S00.1655 b19.09 a2.41 b24.76 ab1.59 b29.02 a38.49 b
S10.1726 b18.94 ab2.50 b25.23 ab1.65 b28.76 a38.64 b
S20.2126 a18.66 bc2.70 a25.45 a1.80 a28.26 ab40.31 a
S30.2164 a18.47 c2.65 a24.49 b1.77 a27.65 ab39.57 ab
S40.1985 a18.70 bc2.67 a24.97 ab1.77 a27.31 b38.50 b
2023–24YN999S00.1471 b21.74 a2.71 c29.43 a1.78 c29.77 bc40.30 b
S10.1643 a21.13 b2.82 ab29.38 a1.86 ab29.36 c40.78 ab
S20.1657 a20.79 a2.80 b29.50 a1.85 b30.06 ab41.43 ab
S30.1646 a20.98 a2.84 a30.15 a1.88 a30.35 a41.88 a
S40.1623 a21.02 a2.83 a30.03 a1.87 a30.07 ab41.39 ab
JM20S00.1560 b20.81 a2.53 c26.68 c1.66 d29.40 a39.83 a
S10.1706 a20.84 a2.67 b27.27 bc1.76 c29.10 a40.79 a
S20.1795 a20.52 ab2.77 ab27.38 bc1.83 b28.43 a40.35 a
S30.1771 a20.60 ab2.86 a28.63 a1.89 a28.78 a40.67 a
S40.1820 a20.46 b2.83 a27.90 ab1.87 ab28.49 a40.53 a
ANOVAY **************
C ************ns
T **********ns**
Y × C nsnsnsnsns**
Y × T *ns******nsns
T × C **ns**ns****ns
Y × C × T *nsns*ns*ns
Note: R0: initial grain filling potential; Tmax: time of maximum grain filling rate occurrence; Gmax: maximum grain filling rate; Wmax: grain weight achieving the maximal grain filling rate; Gmean: mean grain filling rate; D: active grain filling date; T0.99: duration of grain filling. The type of mean comparison test was Duncan’s new multiple range method. Different lowercase letters following the data in the same column of the same year indicate significant differences among different treatments within the same variety (p  <  0.05). Y, C, and T represent year, cultivar, and treatment, respectively. “*” indicates significant differences at the 0.05 level, and “**” indicates significant differences at the 0.01 level.
Table 3. Grain filling parameters for different filling periods.
YearCultivarTreatmentGradual Increase PeriodRapid Increase PeriodSlow Increase Period
Days
(D)
MG1
(mg·grain−1·d−1)
RGC1
(%)
Days
(D)
MG2
(mg·grain−1·d−1)
RGC2
(%)
Days
(D)
MG3
(mg·grain−1·d−1)
RGC3
(%)
2022–23YN999S013.41 a0.96 a26.03 a11.77 b2.35 bc55.61 c12.86 b0.67 ab17.37 c
S113.27 a0.96 a25.38 ab11.81 b2.38 ab55.91 bc13.12 b0.68 a17.71 bc
S213.20 ab0.96 a24.87 abc11.97 b2.40 a56.14 abc13.49 b0.68 a17.99 abc
S312.65 c0.98 a23.64 c12.50 a2.37 abc56.57 a14.55 a0.67 ab18.67 a
S412.80 bc0.97 a23.90 bc12.61 a2.34 c56.69 ab14.57 a0.66 b18.52 ab
JM20S013.03 a0.91 a25.74 a12.11 a2.12 b55.73 c13.35 c0.61 c17.53 c
S112.92 a0.92 a24.96 ab12.11 a2.20 b56.10 bc13.61 bc0.63 bc17.95 bc
S212.46 a0.86 ab21.15 c12.41 a2.37 a57.72 a15.45 a0.66 a20.13 a
S312.41 a0.84 b21.25 c12.12 a2.33 a57.68 a15.05 ab0.65 ab20.07 a
S412.82 a0.87 ab23.00 bc11.76 a2.35 a56.97 ab13.92 bc0.66 a19.03 ab
2023–24YN999S015.70 a0.94 a28.03 a12.08 c2.39 c54.64 b12.52 b0.69 b16.33 b
S115.01 ab0.94 a25.75 ab12.25 bc2.48 ab55.71 ab13.52 ab0.71 a17.54 ab
S214.45 b0.95 a24.83 b12.68 ab2.46 b56.16 a14.30 a0.70 ab18.01 a
S314.57 b0.97 a24.73 b12.82 a2.50 a56.21 a14.49 a0.71 a18.06 a
S414.71 b0.97 a25.27 b12.62 ab2.49 ab55.96 a14.06 a0.71 a17.77 a
JM20S014.75 a0.89 a26.82 a12.12 a2.22 c55.23 b12.96 b0.64 b16.95 b
S114.71 a0.87 a24.88 b12.27 a2.35 b56.13 a13.81 a0.67 b17.98 ab
S214.49 a0.87 a24.31 b12.06 a2.43 ab56.39 a13.80 a0.69 ab18.30 a
S314.49 a0.91 a24.30 b12.21 a2.51 a56.40 a13.97 a0.71 a18.30 a
S414.39 a0.89 a23.98 b12.13 a2.48 a56.53 a14.00 a0.70 a18.49 a
ANOVAY **ns********ns****
C ***********ns****
T **ns*************
Y × C ns*ns*nsnsnsnsns
Y × T ns**nsns**nsns*ns
T × C ns**ns****nsns**ns
Y × C × T ns**nsnsnsnsnsnsns
Note: MG1, MG2, and MG3 denote the average rate of grain filling in the gradual-, rapid-, and slow-increase periods, respectively. RGC1, RGC2, and RGC3 are the contribution rates of grain growth amount in the gradual, rapid, and slow increase periods of grain filling to the final grain weight, respectively. The type of mean comparison test was Duncan’s new multiple range method. Different lowercase letters following the data in the same column of the same year indicate significant differences among different treatments within the same variety (p  <  0.05). Y, C, and T represent year, cultivar, and treatment, respectively. “*” indicates significant differences at the 0.05 level, and “**” indicates significant differences at the 0.01 level.
Table 4. Impact of sulfur application on yield and yield components in winter wheat.
YearCultivarTreatment1000-Grain
Weight (g)
Number of Grains per Spike Number of Spikes HectareGrain Yield (kg ha−1)
2022–23YN999S048.28 c36.34 a590.01 a8875.31 c
S149.87 b36.17 a594.12 a9093.07 bc
S250.98 ab35.95 a590.09 a9159.54 abc
S352.06 a35.62 a598.61 a9458.36 a
S451.62 a35.43 a591.97 a9266.55 ab
JM20S045.12 c31.63 a623.97 b7422.63 c
S146.53 bc32.89 a638.68 ab8498.10 ab
S249.43 a32.46 a645.44 a8778.31 a
S347.85 b32.31 a647.06 a8389.91 b
S447.54 b31.88 a636.92 ab8261.97 b
2023–24YN999S052.08 c35.03 a628.05 a9248.85 c
S153.85 b35.27a641.20 a9933.97 b
S255.49 a35.68 a636.85 a10,472.82 ab
S356.05 a36.02 a645.07 a10,789.21 a
S455.72 a35.87 a634.52 a10,442.82 ab
JM20S048.38 c32.06 a672.20 b8774.36 c
S150.67 b32.27 a668.10 b9227.62 bc
S251.98 ab33.23 a678.89 ab9998.72 a
S353.33 a32.85 a691.23 a10,262.66 a
S452.45 a32.22 a681.08 ab9598.83 ab
ANOVAY **ns****
C ********
T ***ns**
Y × C ns*ns*
Y × T ns*ns**
T × C nsnsnsns
Y × C × T nsnsnsns
Note: The type of mean comparison test was Duncan’s new multiple range method. Different lowercase letters following the data in the same column of the same year indicate significant differences among different treatments within the same variety (p  <  0.05). Y, C, and T represent year, cultivar, and treatment, respectively. “*” indicates significant differences at the 0.05 level, and “**” indicates significant differences at the 0.01 level.
Disclaimer/Publisher’s Note: The statements, opinions and data contained in all publications are solely those of the individual author(s) and contributor(s) and not of MDPI and/or the editor(s). MDPI and/or the editor(s) disclaim responsibility for any injury to people or property resulting from any ideas, methods, instructions or products referred to in the content.

