Article

The Effects of Multi-Scenario Land Use Change on the Water Conservation in the Agro-Pastoral Ecotone of Northern China: A Case Study of Bashang Region, Zhangjiakou City

1
Institute of Grassland, Flowers and Ecology, Beijing Academy of Agriculture and Forestry Sciences, Beijing 100097, China
2
School of Information Engineering, China University of Geoscience, Beijing 100083, China
*
Authors to whom correspondence should be addressed.
Agriculture 2025, 15(9), 1008; https://doi.org/10.3390/agriculture15091008
Submission received: 27 March 2025 / Revised: 20 April 2025 / Accepted: 25 April 2025 / Published: 6 May 2025

Abstract

:
Water resource management is crucial for sustainable agricultural and ecological development, particularly in regions with complex land-use patterns and sensitive eco-systems. The Bashang region of Zhangjiakou city, located in the agro-pastoral ecotone of northern China, is an ecologically fragile area that is currently undergoing significant land use and climate changes. Despite the importance of understanding the interplay between land use, climate change, and water conservation, few studies have comprehensively evaluated their combined effects on regional water resources. This study addresses this gap by investigating the spatiotemporal changes in the water yield (WY) and water conservation capacity (WCC) of the Bashang region under different land use and climate scenarios for the year 2035. This research employs the FLUS model to predict the future land use and the InVEST model to estimate the WY and WCC under a natural development scenario (NDS), an agricultural production scenario (APS), an ecological protection scenario (EPS), and a land planning scenario (LPS). The results reveal that the WCC is primarily influenced by precipitation, land use, and the topography. This study finds that scenarios which focus on ecological protection and land use optimization, such as the EPS and LPS, significantly enhance the water conservation capacity of the study region Notably, the LPS scenario, which limits urban expansion and increases the amount of ecological land, provides the best balance between the water yield and conservation. The findings highlight the need for integrated approaches to land use and water resource management, particularly in agro-pastoral transitional zones. The unique contribution of this research lies in its comprehensive modeling approach, which combines land use, climate data, and water resource analysis, and which provides valuable insights for sustainable land and water management strategies.

1. Introduction

Water scarcity has emerged as a major global challenge, profoundly impacting ecosystems, agricultural productivity, development in society and the economy [1]. As population growth and the demand for freshwater escalate, the consequences of water scarcity become increasingly pervasive, manifesting in various forms, such as diminished agricultural yields and intensified competition for limited resources [2,3]. Land-use changes have a profound impact on the spatiotemporal development of water source conservation, directly influencing processes such as water storage, infiltration, evaporation, and replenishment, and thereby altering the hydrological cycle and availability of water resources [4]. Changes in land use—especially the growth of agricultural zones, urban development, and the rising designation of land for industrial use—are driving a growing disparity between the supply of water and the demand for it, leading to intricate and shifting patterns in the distribution and use of water resources [5,6,7]. This problem is especially pronounced in agro-pastoral ecotones, where the land use often exhibits obvious transitional and fluctuating characteristics and water resource constraints are further compounded due to the frequent conversion of grasslands, forests, and cultivated land [8]. Among the most sensitive ecological transition zones to global change, the northern agro-pastoral transitional zone in China has long been a focal point of land use and land cover (LULC) research. Over time, driven by policy directions at different development stages and the interplay of human activities and natural environmental factors, the region has experienced frequent and persistent expansions and contractions of land types such as grasslands, forests, and croplands [9]. Unregulated land use practices, such as urban sprawl occupying agricultural land and the over-cultivation of cropland, have led to a series of environmental issues, including reduced vegetation cover, land degradation, and large-scale water resource depletion. These problems have severely compromised the sustainable development of both the ecological and economic systems in the region [10,11]. Given the increasing complexity of existing water resource constraints, it is imperative to comprehensively examine the interactions between land-use changes and the water resources in this region to better understand the drivers of environmental change and inform future policy decisions.
The water conservation capacity (WCC) of an ecosystem refers to its capacity to maintain its water volume under specific temporal and spatial conditions. As a core mechanism for sustaining the functions of regional ecosystems and maintaining their hydrological balance, it plays a crucial role in flood retention, peak flow reduction, water purification, and runoff regulation [12,13]. Ecosystems, including natural vegetation, grasslands, and forests, can significantly enhance the storage capacity and utilization efficiency of water resources through processes such as transpiration, soil moisture retention, and groundwater recharge [14]. However, the irrational evolution of the LULC structure has led to a decline in the WCC and water yield (WY) in many regions resulting in increasingly prominent ecological and environmental problems [15,16,17]. Previous studies have shown that the LULC significantly impact hydrological and ecological systems, yet their effects vary across regions. For example, in China’s Sanjiangyuan region, land use practices have led to grassland degradation, reducing the area’s capacity to intercept precipitation [18]. In arid regions such as Iran’s Sirvan Basin, despite afforestation efforts, declining precipitation has exacerbated water scarcity. In contrast, in the Yellow River Basin, a substantial reduction in agricultural land, coupled with the large-scale implementation of the “Grain for Green” policy, has notably enhanced the WCC [19]. These regional disparities highlight the necessity of assessing the impact of LULC changes on water conservation in specific policy and governance contexts [20]. However, existing studies that simulate changes in the WCC of different areas under future land-use scenarios predominantly focus on natural development, ecological protection, and agricultural expansion. They often overlook scenario designs that are tailored to regional land-use planning frameworks and strategic development goals [21,22]. This gap limits the ability to comprehensively assess the WCC of an area and its relation to policy-driven land-use transitions. Given the spatial heterogeneity of land-use patterns and the divergent impacts of policy directives on land-use changes, there remains a theoretical gap in the understanding of how future land-use transformations under policy planning frameworks will influence water resources in China’s northern agro-pastoral ecotone. Therefore, investigating the complex interplay between spatial land use planning and water resources in this area is essential for formulating effective water resource management policies and promoting regional sustainability.
With the advancement of research and the continuous refinement of remote sensing technologies, numerous quantitative methods for assessing the water conservation capacity of an area have been developed. Conventional methods encompass the integrated water storage approach, the water balance technique, the canopy interception method, soil water retention strategies, precipitation storage methods, annual runoff assessments, and subsurface runoff evaluations. Furthermore, a range of modeling approaches have been applied, including the Soil and Water Assessment Tool (SWAT), the Integrated Valuation of Ecosystem Services and Trade-offs (InVEST) model, and the cellular automata (CA) model [23,24]. Among these models, the InVEST framework is particularly popular because of its versatile data integration and robust ability to capture spatial variations. Moreover, with the maturation of land-use change prediction techniques, numerous predictive models have been developed. Among the most widely applied at present are the Markov model, the system dynamics model, cellular automata, the SLEUTH model, the CLUE-S model, and the FLUS model. However, certain limitations persist [25]. The system dynamics and Markov models struggle with spatial information processing and lack the capacity to effectively describe spatial land-use patterns. Cellular automata and the SLEUTH model, while useful, fail to account for the influence of socio-economic factors. The CLUE-S model can simulate multiple LULC changes simultaneously but overlooks the possibility of transitions among non-dominant land categories [26]. In contrast, the FLUS model, integrating artificial neural networks (ANNs), system dynamics (SD), and cellular automata (CA), introduces adaptive inertia coefficients and a roulette-wheel competition mechanism to address the limitations of traditional linear regression methods in land use classification. This makes it particularly well-suited for complex land use systems [27].
As a representative region of the agro-pastoral ecotone in northern China, the Bashang region of Zhangjiakou city is characterized by an arid and semi-arid climate. Agriculture and animal husbandry serve as the dominant industries in this area, with the water consumption in these sectors accounting for over 70% of the total water use [28]. Over the past few decades, the agricultural structure of the region has undergone a significant transformation, shifting from traditional rain-fed dryland farming to irrigation-based agriculture. Since the mid-1990s, the area that is planted with high-water-consuming crops (such as off-season vegetables, potatoes, and sugar beets) has expanded notably, increasing by 34.12% from 2005 to 2015, reaching 125,000 hm2. Meanwhile, the area of rain-fed crops has sharply decreased by 58.5% during the same period. Concurrently, from 1990 to 2020, the area of cultivated land expanded by 1434.99 km2, leading to a substantial surge in irrigation water demand [24,29]. The combination of intensive agricultural irrigation and the impacts of climate change has triggered a severe water ecological crisis. The number of lakes and marshes decreased dramatically from 155 in 1996 to 28 in 2015, with the total area of lakes shrinking from 199.41 km2 to 25.22 km2. Groundwater over-extraction has risen continuously since 2003, peaking at 223 million cubic meters in 2009 (reduced to 144 million cubic meters by 2017), while the groundwater levels dropped rapidly between 1996 and 2008, followed by a slower decline after 2009. Studies indicate that the synergistic effects of agricultural intensification and climate change have not only exacerbated water resource shortages and amplified the imbalance between supply and demand [30,31], but have also significantly weakened water conservation functions by altering hydrological processes [32]. Consequently, investigating the spatiotemporal variations in and distribution patterns of the WCC of the Bashang region of Zhangjiakou city under projected land-use change scenarios is paramount for enhancing the regional water conservation capacity, advancing ecological environmental protection, and promoting the sustainable development of the socio-economic system.
This research primarily focused on (1) simulating LULC changes across four different scenarios: the natural development scenario (NDS), the agricultural production scenario (APS), the ecological protection scenario (EPS), and the land planning scenario (LPS) based on FLUS model; (2) assessing the WCC of the Bashang region in Zhangjiakou city using the InVEST model; and (3) examining the potential effects of LULC changes on the regional WCC function under various scenarios. By elucidating future trends in water resource dynamics within the agro-pastoral transitional zone, this research offers a solid scientific basis for policymakers to develop effective strategies for water resource management and conservation.

2. Materials and Methods
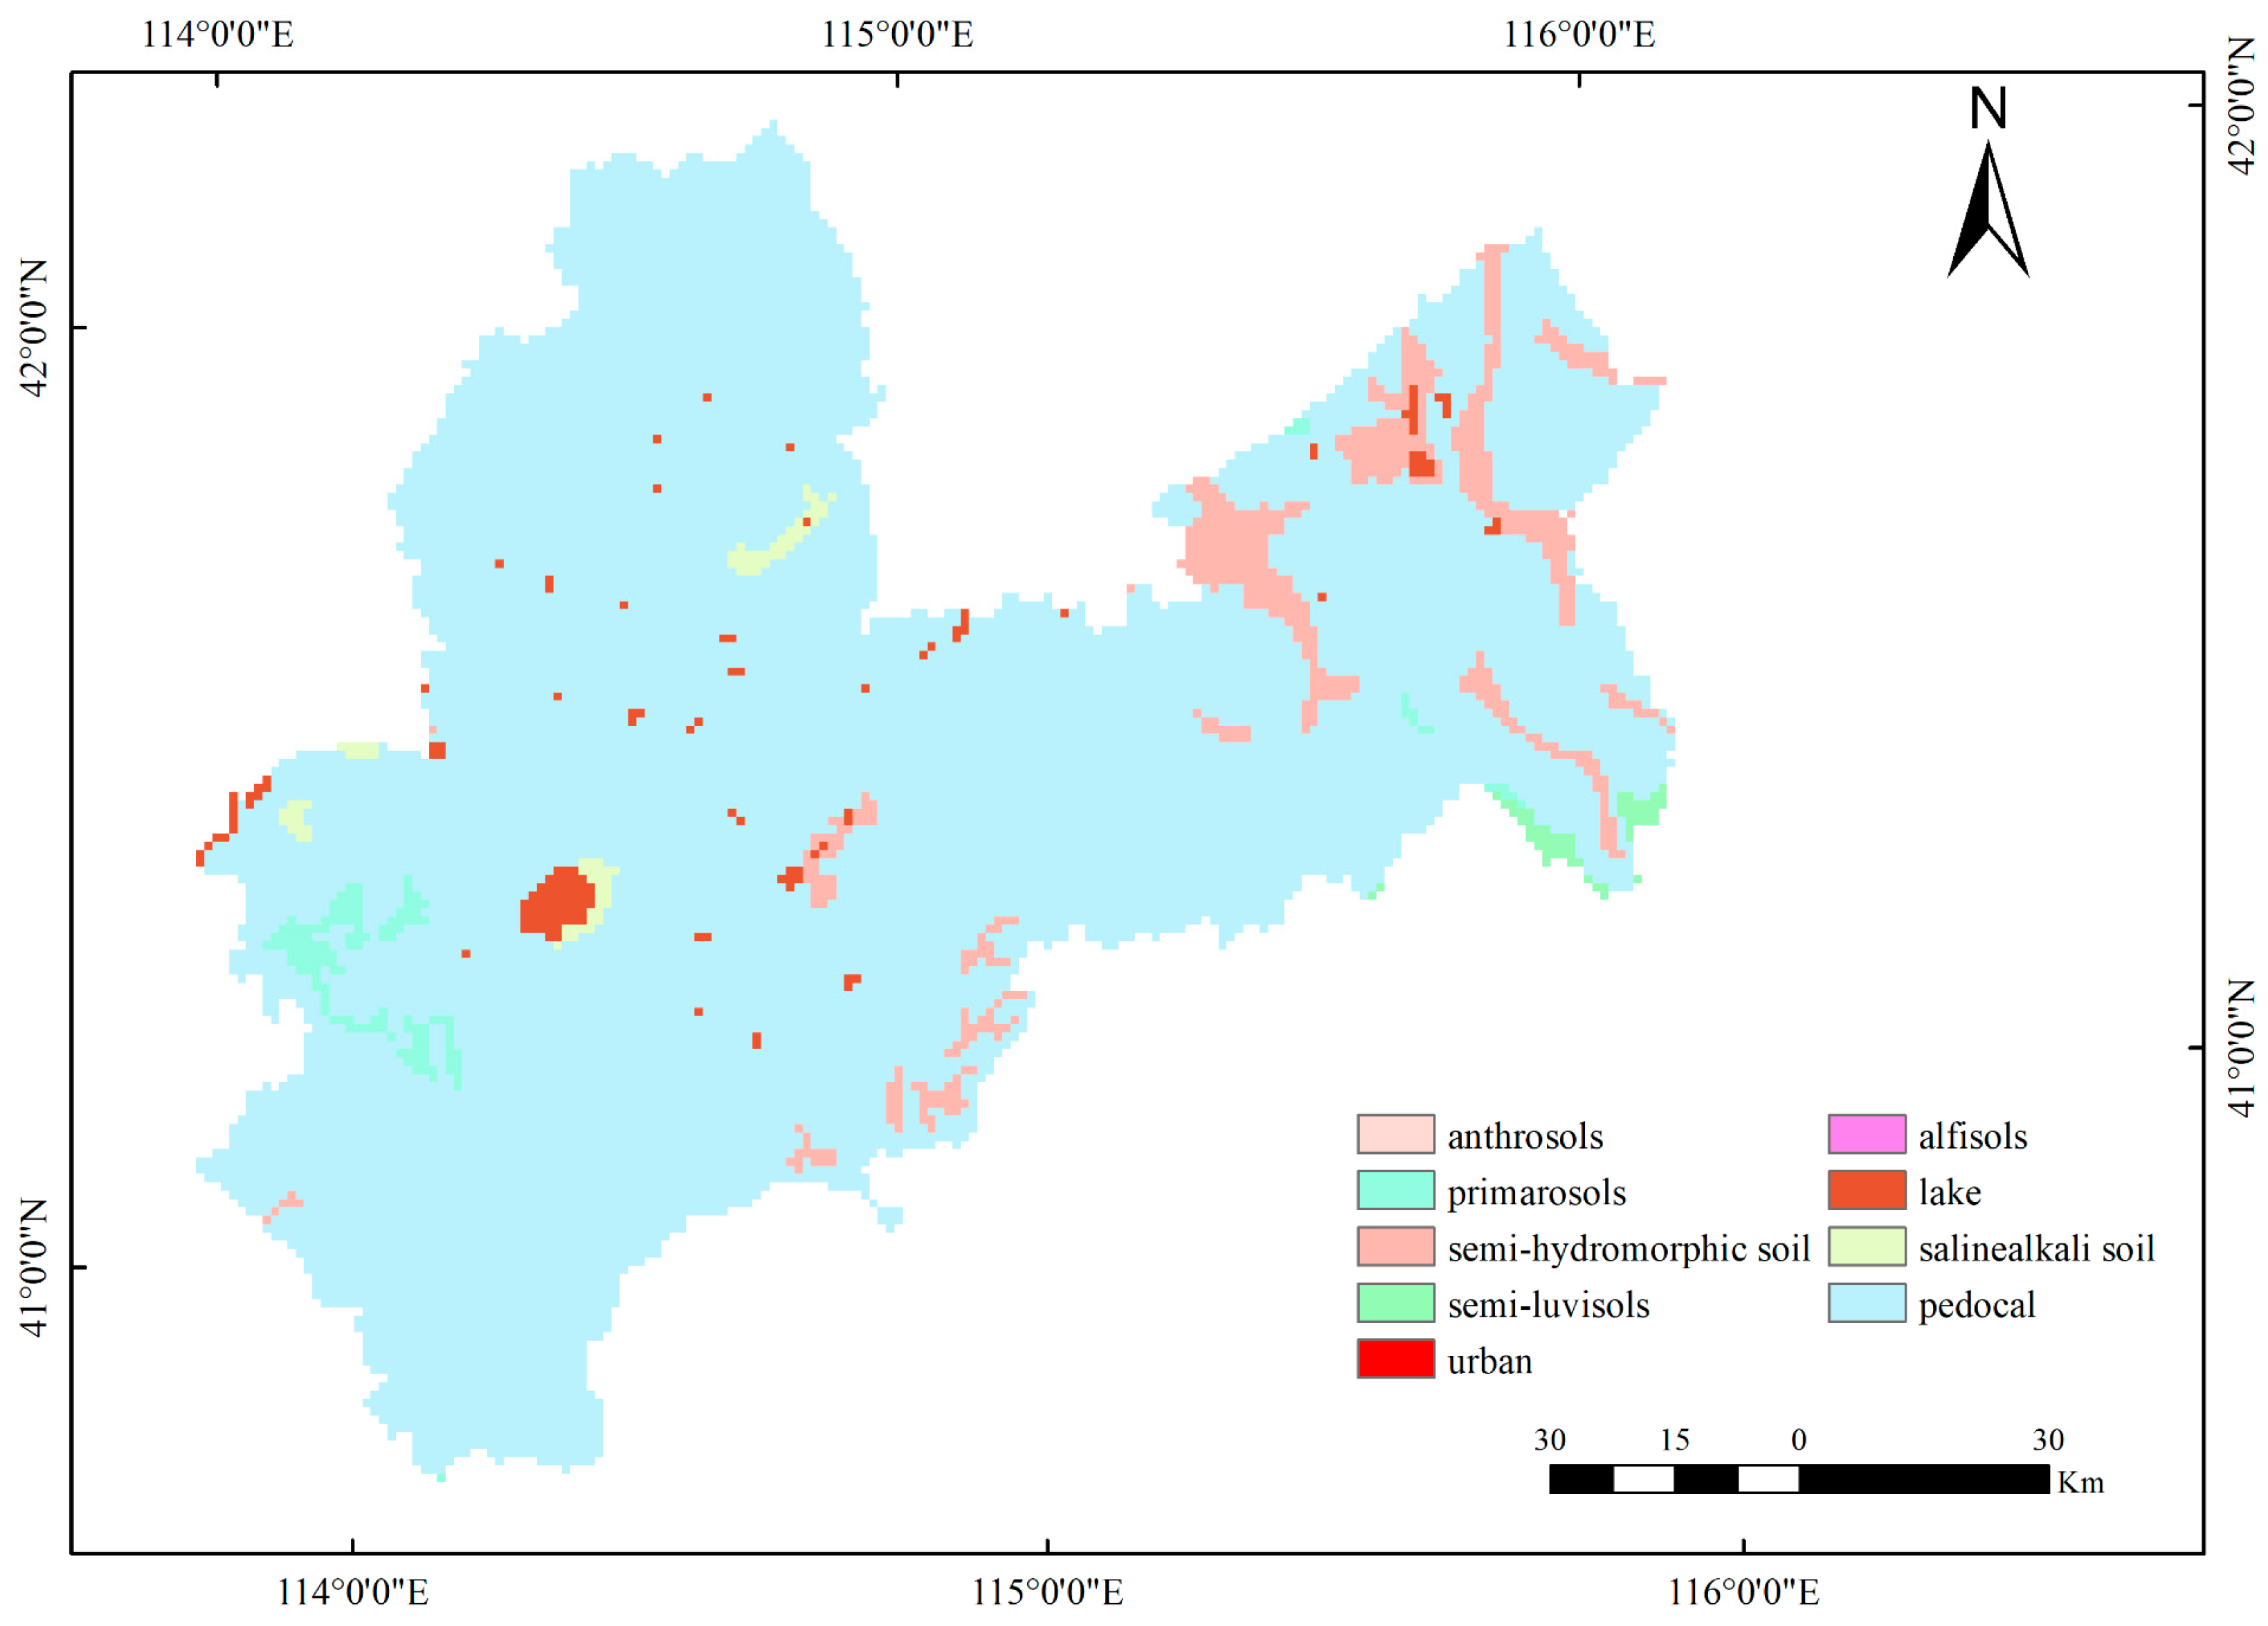
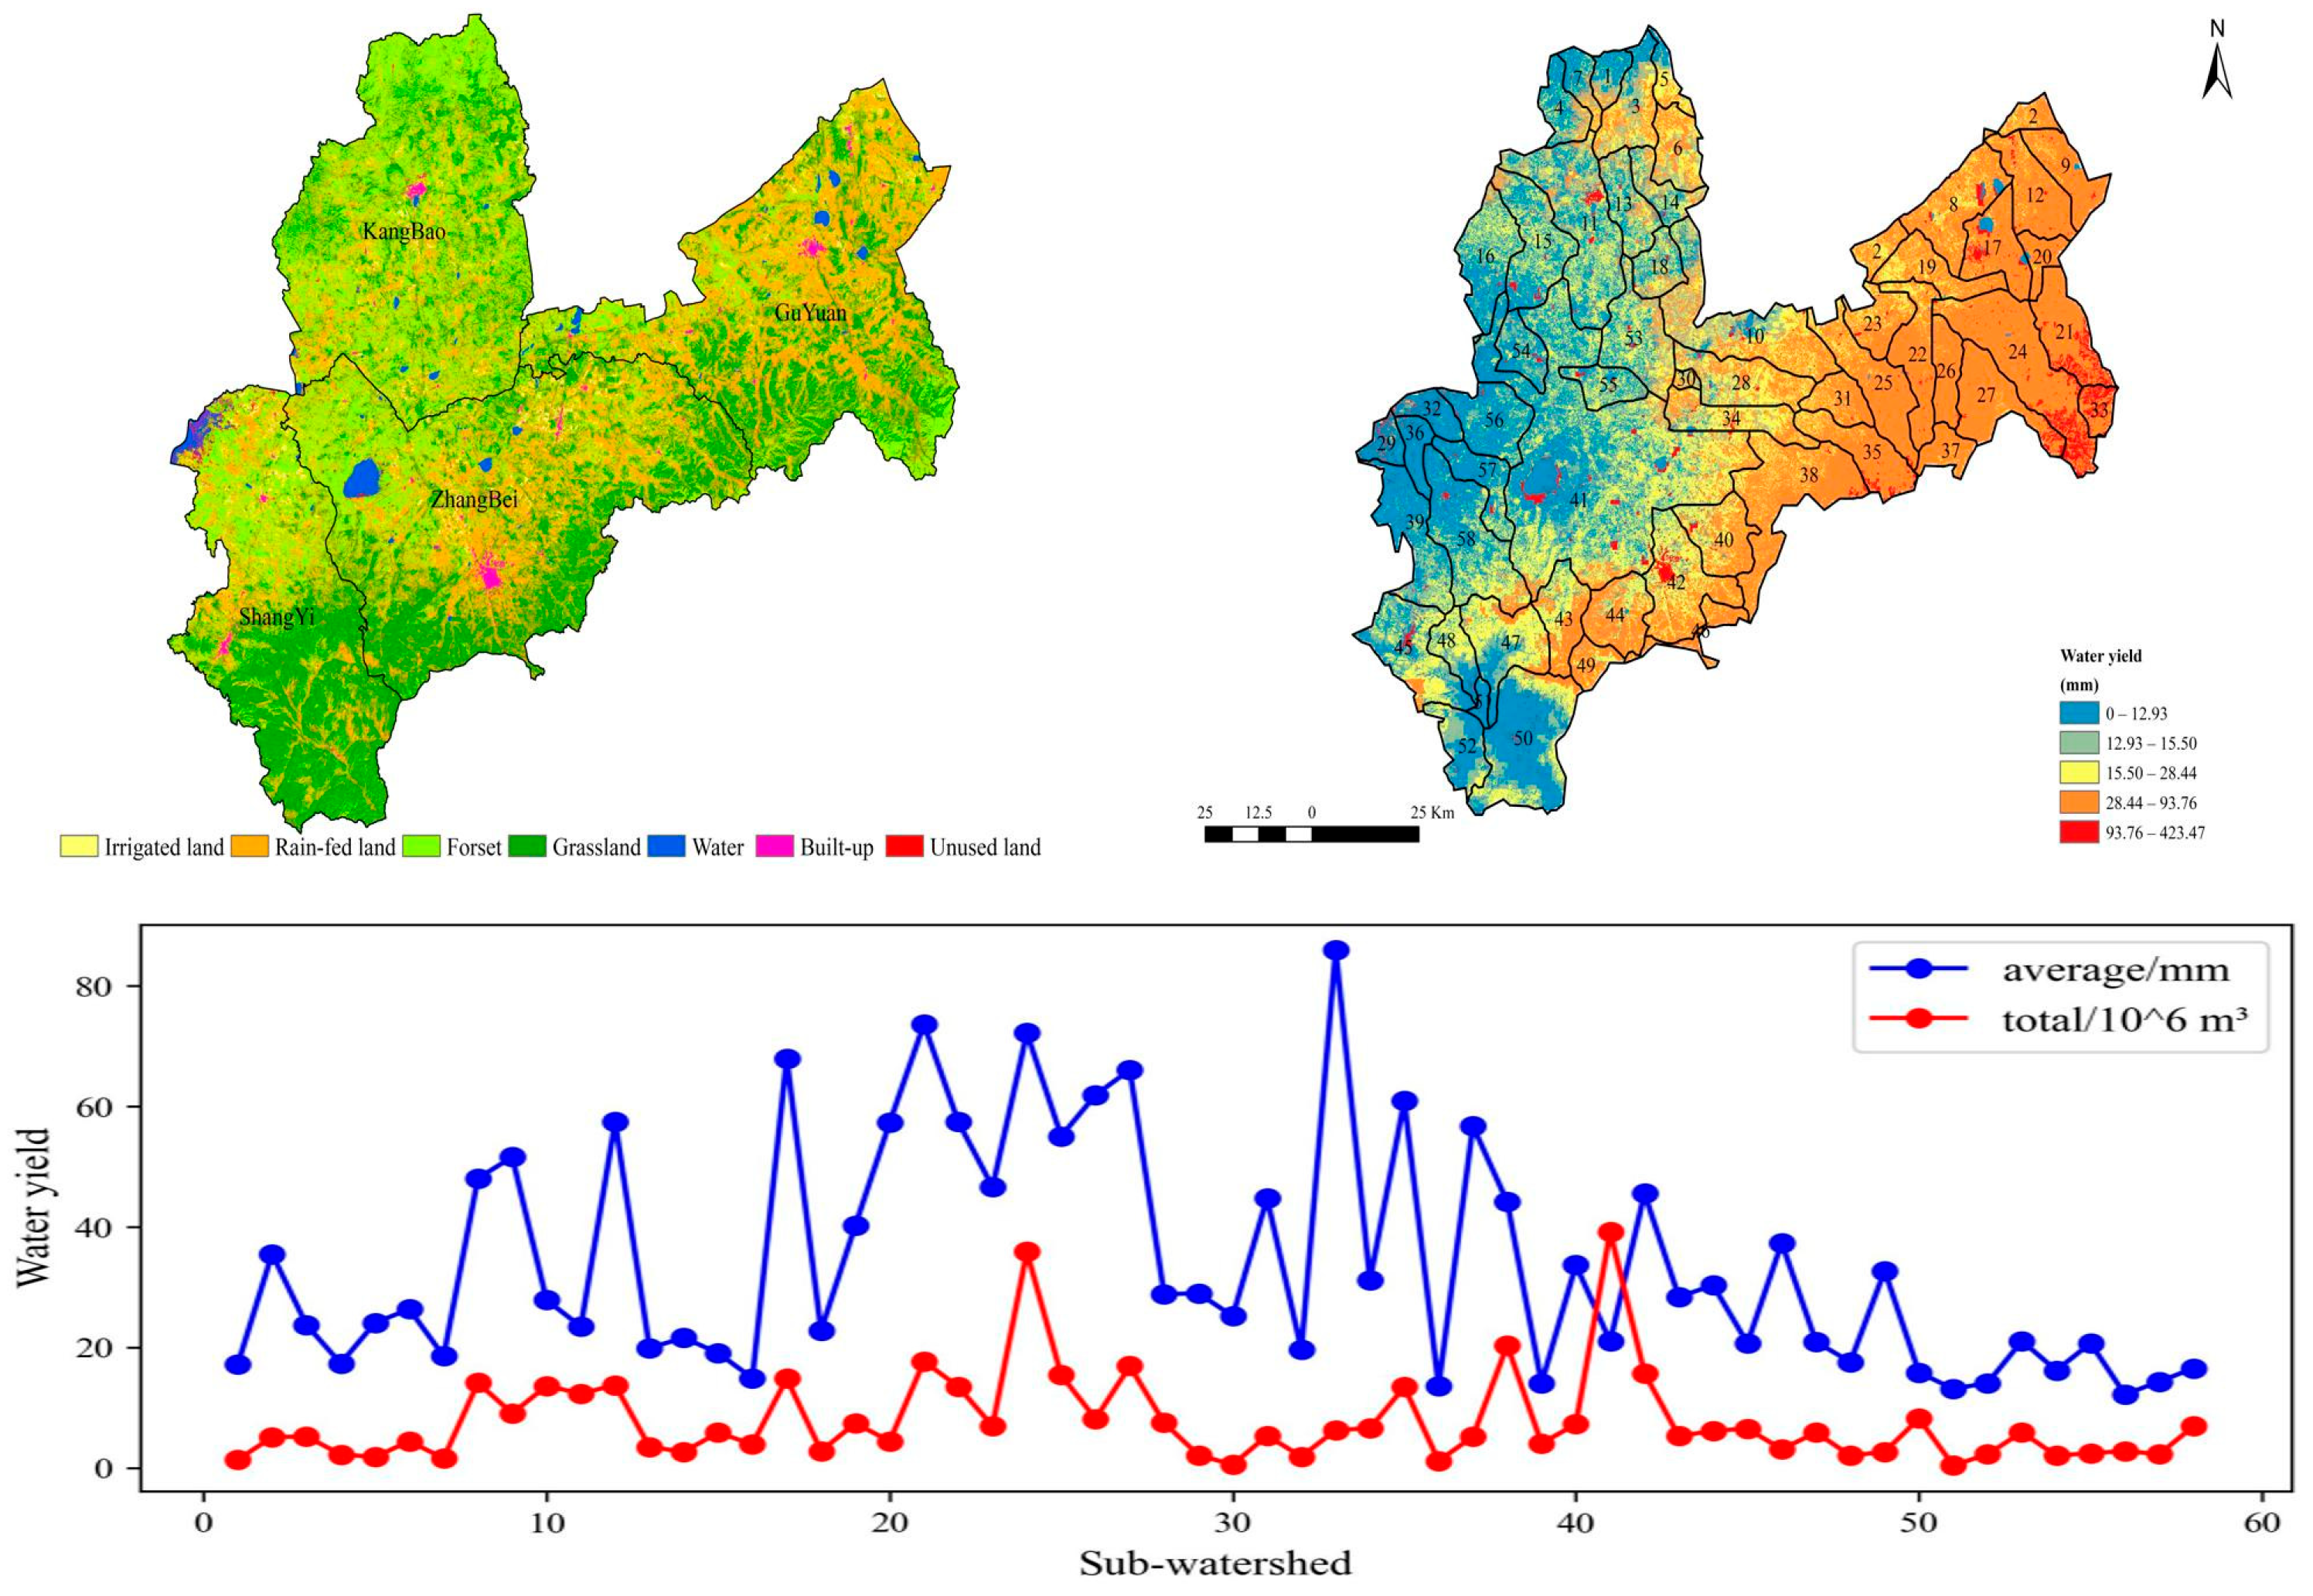
2.1. Study Area

The Bashang region of Zhangjiakou city is situated at the intersection of the North China Plain and the Inner Mongolia Plateau in the northwestern part of Hebei Province, China, between 113°48′ E–116°03′ E and 40°43′ N–42°10′ N (Figure 1). The region comprises four counties—Kangbao, Shangyi, Guyuan, Zhangbei, Saibei Management District, and Chabei Management District—and serves as a critical transportation hub connecting northeastern, northern, and northwestern China, encompassing a total area of 13,761.32 km2. It acts as a vital ecological barrier in China and represents a strategic area for the management of water resources and environmental protection in proximity to the Chinese capital, Beijing. The region experiences a temperate continental monsoon climate, characterized by an average annual rainfall of 447.07 mm, an average annual temperature of 3.05 °C, and an elevation range of 848–2167 m. The land-use pattern in Bashang region is dominated by cropland, forestland, and grassland. However, the recent expansion of cropland has intensified conflicts between the supply of land resources and the demand for them, reduced the total area of forest and grassland resources, and exacerbated the overexploitation of groundwater. These changes in land use significantly affect the ecosystem’s structure and hydrological processes, and their associated functions.

2.2. Data Sources

This study utilized diverse data sources, including LULC, natural environmental variables, socio-economic indicators, and accessibility factors (Table 1). LULC data were reclassified into 7 categories using ARCGIS 10.5 software: rain-fed land, irrigated land, forest, grassland, water, built-up land, and unused land (Figure 2). Elevation data with a spatial resolution of 30 m were sourced from the Geospatial data cloud (https://www.gscloud.cn/), and slope and aspect variables were subsequently derived from these elevation data. Climate data, including average monthly precipitation, temperature, and potential evapotranspiration from 1990 to 2020 were sourced from the Tibetan Plateau Data Center (TPDC, http://data.tpdc.ac.cn/). Soil type data were sourced from Resources and Environment Science Data Platform (https://www.resdc.cn/). The soil type classifications for the Bashang region of Zhangjiakou are as follows: anthrosols, alfisols, primarosols, semi-hydromophic soli, salinealkali soli, semi-luvisols, and pedocal (Figure 3). Soil parameter data were derived from version 1.2 of the Harmonized World Soil Database (HWSD) published by the Food and Agriculture Organization of the United Nations (FAO, https://www.fao.org/) at 1000 m resolution. The HWSD dataset includes soil composition parameters such as percentages of sand, clay, silt, and organic carbon. Based on these data, soil saturated hydraulic conductivity and plant-available water capacity (PAWC) were calculated. In addition, socio-economic data including 2020 population density and 2020 gross domestic product (GDP) were obtained from the Resources and Environment Science Data Platform (https://www.resdc.cn/). Accessibility factors were obtained from Geospatial data cloud (https://www.gscloud.cn), and the road network data were converted to raster maps using the Euclidean distance analysis function of ArcGIS. All datasets were resampled to 30 m resolution using ArcGIS 10.5 (Esri, Redlands, CA, USA) software for input into the FLUS v2.4 (Wuhan University, Wuhan, China) and InVEST models 3.14 (Stanford, CA, USA).

2.3. Land-Use Change Analysis and Multiscenarios Prediction

2.3.1. Geoinformation Tupu Model Analysis

The geoinformation tupu model is a framework designed for modeling and analyzing complex spatial information while representing multilevel geospatial information through cartographic methods. This model facilitates the integration of temporal evolution and spatial distribution information from land-use maps into specialized maps [33]. Based on the evolutionary characteristics of the LULC from 1990 to 2005 and 2020, the geoinformation tupu is categorized into five types: early-change type, later-change type, repeated-change type, continuous-change type, and stable type [34]. The geoinformation tupu was obtained according to Equation (1).
T i = G 1 × 10 n 1 + G 2 × 10 n 2 G n × 10 n n
where T i represents the value of pixel i in the map, and G n represents the land use type in a period of n.

2.3.2. Multi-Scenarios Setting

Taking into account the current LULC status and future LULC development objectives of Bashang region, four development scenarios were identified: natural development scenario (NDS), agricultural production scenario (APS), ecological protection scenario (EPS), and land planning scenario (LPS) [35]. The formulation of land transfer rules under each scenario is informed by the research results. The specific design rules for each scenario are as follows:
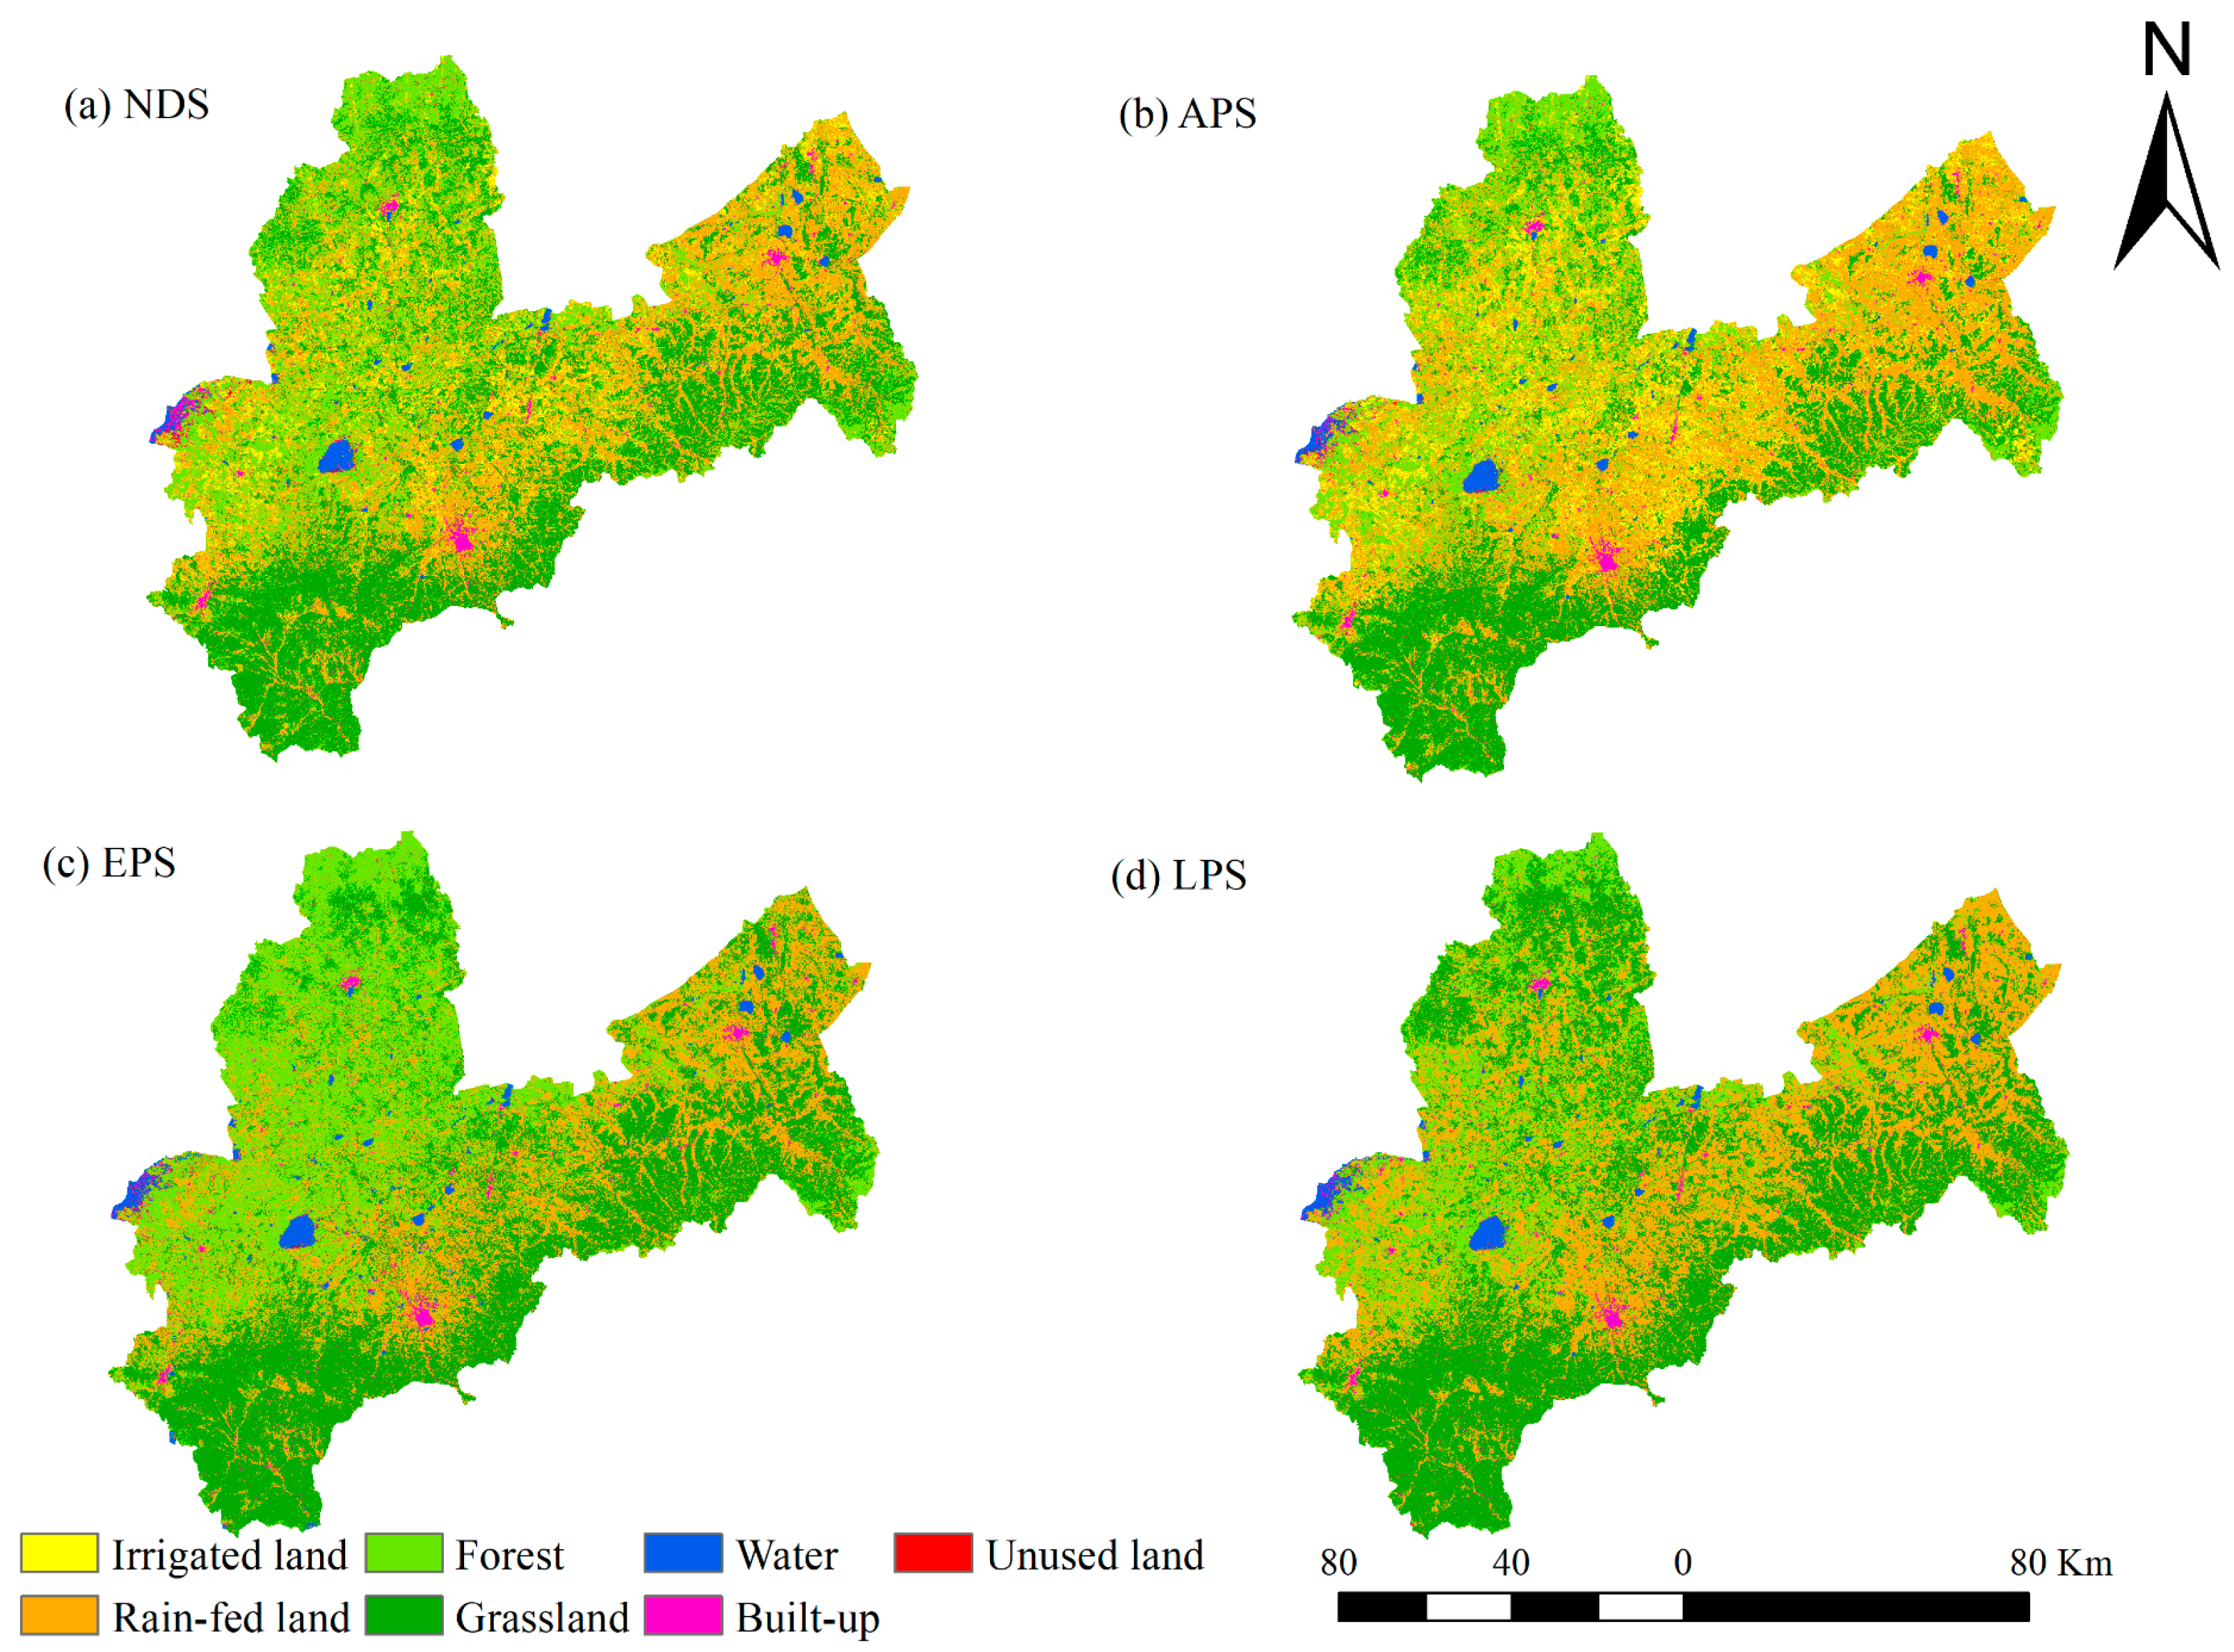
  • NDS (natural development scenario): This scenario excludes the influence of anthropogenic and socio-environmental factors. It forecasts land-use changes for 2035, relying exclusively on the natural trends in land-use transformation observed between 1990 and 2020.
  • APS (agricultural production scenario): In this scenario, the study region simulates the maximum extent of arable land expansion under an agricultural development objective. Specifically, the conversion of unused land, forest, and grassland into arable land is promoted while ensuring that existing arable land (both irrigated and rain-fed land) remains unchanged. Therefore, in the configuration of neighborhood weights, the transition probabilities for irrigated land and rain-fed land were increased by 30%. Prohibitions were imposed on the conversion of cultivated land to other types.
  • EPS (ecological protection scenario): This scenario incorporates ecological conservation objectives for the study area. This study proposes, for this scenario, simulating the maximized expansion of ecological lands, particularly forest and grassland. The framework emphasizes the dual imperatives of protecting and enhancing ecological land resources. Under this configuration: (1) strict prohibitions were instituted against the conversion of forest and grassland to other types and the transformation of unutilized land to cultivated areas; (2) transition from rain-fed land to irrigated land was restricted; (3) neighborhood weights underwent strategic adjustments—irrigated land weights were decreased by 50%, rain-fed land weights were reduced by 20%, and grassland and woodland weights were increased by 40%.
  • LPS (land planning scenario): according to the Zhangjiakou Capital Water Conservation Functional Area and Ecological Environment Support Area Construction Plan (2019–2035), the objectives for 2035 are set as follows: The Bashang region of Zhangjiakou will progressively transition irrigated land to alternative land uses while restoring abandoned land through grass planting. Additionally, as stipulated in the Land Use Master Plan for Four Counties in the Bashang Region of Zhangjiakou (2021–2035), the permanent basic farmland area in Zhangjiakou Bashang is designated as 4551.26 km2. Based on these planning targets, the LPS is defined as follows: (1) full conversion of irrigated land to rain-fed land while strictly prohibiting the transformation of other land categories into irrigated land; (2) reduce the transition probability of irrigated land by 50%, while increasing the transition probability of forestland and grassland by 20% and 40%, respectively; (3) ensure cultivated land area remains within the protection red line for basic farmland; (4) strictly prohibit the conversion of forestland and grassland to other types.

2.3.3. The FLUS Model

The FLUS model, proposed in 2017 by internationally renowned geo-simulation experts Xiaoping Liu and Xia Li, is designed to simulate LULC changes driven by natural factors and human activities, as well as to predict future LULC scenarios [27]. By improving the traditional cellular automata (CA) approach, the model integrates the combined effects of natural and anthropogenic influences, enabling the simulation and forecasting of diverse land-use changes. To ensure the predictive effectiveness of the FLUS model, its accuracy must be verified against empirical data prior to making future predictions [36]. For this study, the 2005 LULC map was utilized as the baseline spatial model, while the 2020 LULC data were used to represent the demand for simulating the spatial distribution of LULC in 2020. Simulation accuracy was evaluated by comparing the simulated results with actual data, and optimal parameter settings were determined based on this assessment. Before simulating the spatial distribution of LULC for 2035, the Markov model was applied to forecast future trends. Using the 2020 LULC map as the baseline spatial pattern and the projected LULC area as the demand, and incorporating factors such as land development probabilities and additional constraints, the spatial distribution of LULC in 2035 was generated through spatial simulation.

2.4. Water Conservation Assessment

The assessment of WCC functions comprises two key components. First, the InVEST model is applied to quantify spatial and temporal variations in WY across the study area. Based on these results, the model further estimates WCC, analyzing both its spatial distribution and quantitative changes for 2020 and under four LULC scenarios for 2035.

2.4.1. The InVEST Water Yield Model

The InVEST annual water yield model is a water balance-based tool designed to evaluate water resource performance within a specific region [37]. This model aids decision-makers in understanding the impacts of LULC on water availability and plays a critical role in valuing ecosystem services. By simplifying complex hydrological processes, the model estimates the total annual WY for each pixel (x) within the watershed. This estimation is calculated by subtracting the actual annual evapotranspiration (AET) from the total annual rainfall (P) within the catchment area [37]. The final output includes both the total and average water yields.
The WY model utilizes the Budyko curve and average annual precipitation to estimate the annual WY for each pixel within the study area. The calculation is governed by Equation (2):
Y x = 1 A E T x P x × P x
Here, A E T x represents the annual actual evapotranspiration of grid unit x, while P x denotes the annual precipitation of the same unit. For vegetative LULC types, the evapotranspiration component of the water balance, expressed as A E T ( x ) / P x , closely follows the Budyko curve proposed by Zhang et al. [38]. This curve describes the relationship between potential evapotranspiration and actual evapotranspiration according to Equation (3).
A E T x P x = 1 + P E T x P x 1 + P E T x P x w 1 w
P E T ( x ) represents the potential evapotranspiration, and w x is a parameter that characterizes the inherent climate-soil properties of the area. The parameter w x is empirically determined by the model using the expression proposed by Donohue et al. [39], as described by Equation (4):
w x = Z × A W C x P x + 1.25
In this formula, Z is a constant, often referred to as the “seasonal factor,” which encapsulates rainfall patterns and other hydrogeological characteristics of the region. Its values typically range from 1 to 30. Based on the findings of Donohue et al. [39], Z can be approximated as 0.2 × N, where N represents the total number of precipitation events per year. Additionally, A W C ( x ) denotes the available water content within the plant, expressed in mm. This value is estimated as the product of the plant-available water capacity (PAWC), the depth of rooting restriction, and the minimum rooting depth of the vegetation according to Equation (5).
A W C x = M i n R e s t . l a y e r . d e p t h , r o o t . d e p t h × P A W C
Root depth refers to the soil depth where root growth is restricted by physical or chemical barriers. Conversely, the rooting depth of vegetation is typically defined as the depth that contains 95% of the root biomass for a given vegetation type.
Additionally, the model requires a table of biophysical coefficients corresponding to each LULC type, as detailed in Table 2. This table includes information on vegetation characteristics (LULC_veg), plant evapotranspiration coefficients (Kc), and rooting depths specific to each LULC category used in the model.

2.4.2. Calculation Method of Water Conservation

After calculating the water yield using the InVEST model, the results must be adjusted to account for the topographic index, flow velocity, and other influencing factors. The correction is obtained using Equation (6):
R e t e n t i o n = min 1 , 249 V e l o c i t y × min 1 , 0.9 × T I 3 × min 1 , K s a t 300 × Y
Retention represents the WCC (mm), T I denotes the topographic index, velocity is the velocity coefficient, K s a t is the saturated soil hydraulic conductivity (cm day−1), and Y is the WY calculated by the model (mm).

2.4.3. Validation of InVEST Model Accuracy

Based on the water yield coefficient data for the Bashang region of Zhangjiakou from the 2020 Hebei Water Resources Bulletin, this study conducted iterative validation of the water-yield estimates generated by the InVEST model. Through systematic calibration of the Zhang coefficient within the model, a well-defined fitting relationship between the Zhang coefficient and simulated water yield was established (Figure 4a). Building on this, repeated simulations of the 2020 water yield (WY) for the study area, coupled with sensitivity analysis, enabled the calculation of the elasticity index (E). The results indicate that, when the absolute sensitivity index (|E|) exceeds 0.5—corresponding to Zhang coefficient values below 0.3—the model exhibits high sensitivity, whereby a 1% change in the Zhang parameter results in a change greater than 0.5% in the water yield (Figure 4b). In contrast, when the Zhang coefficient exceeds 1.5, |E| approaches zero, indicating a marked decline in sensitivity and suggesting that the system has reached a state of hydrological equilibrium. Notably, when the Zhang coefficient is set to 1.5, the simulated water yield coefficient precisely matches the official figure (WY = 0.09) reported in the Hebei Water Resources Bulletin. This finding highlights the strong applicability and reliability of the InVEST model—when calibrated with a validated Zhang coefficient—for simulating water yield in regions with comparable geographic and hydrogeological conditions.

2.4.4. FLUS-INVEST Model Framework

The technical framework of the FLUS-INVEST model is illustrated in Figure 5.

3. Results

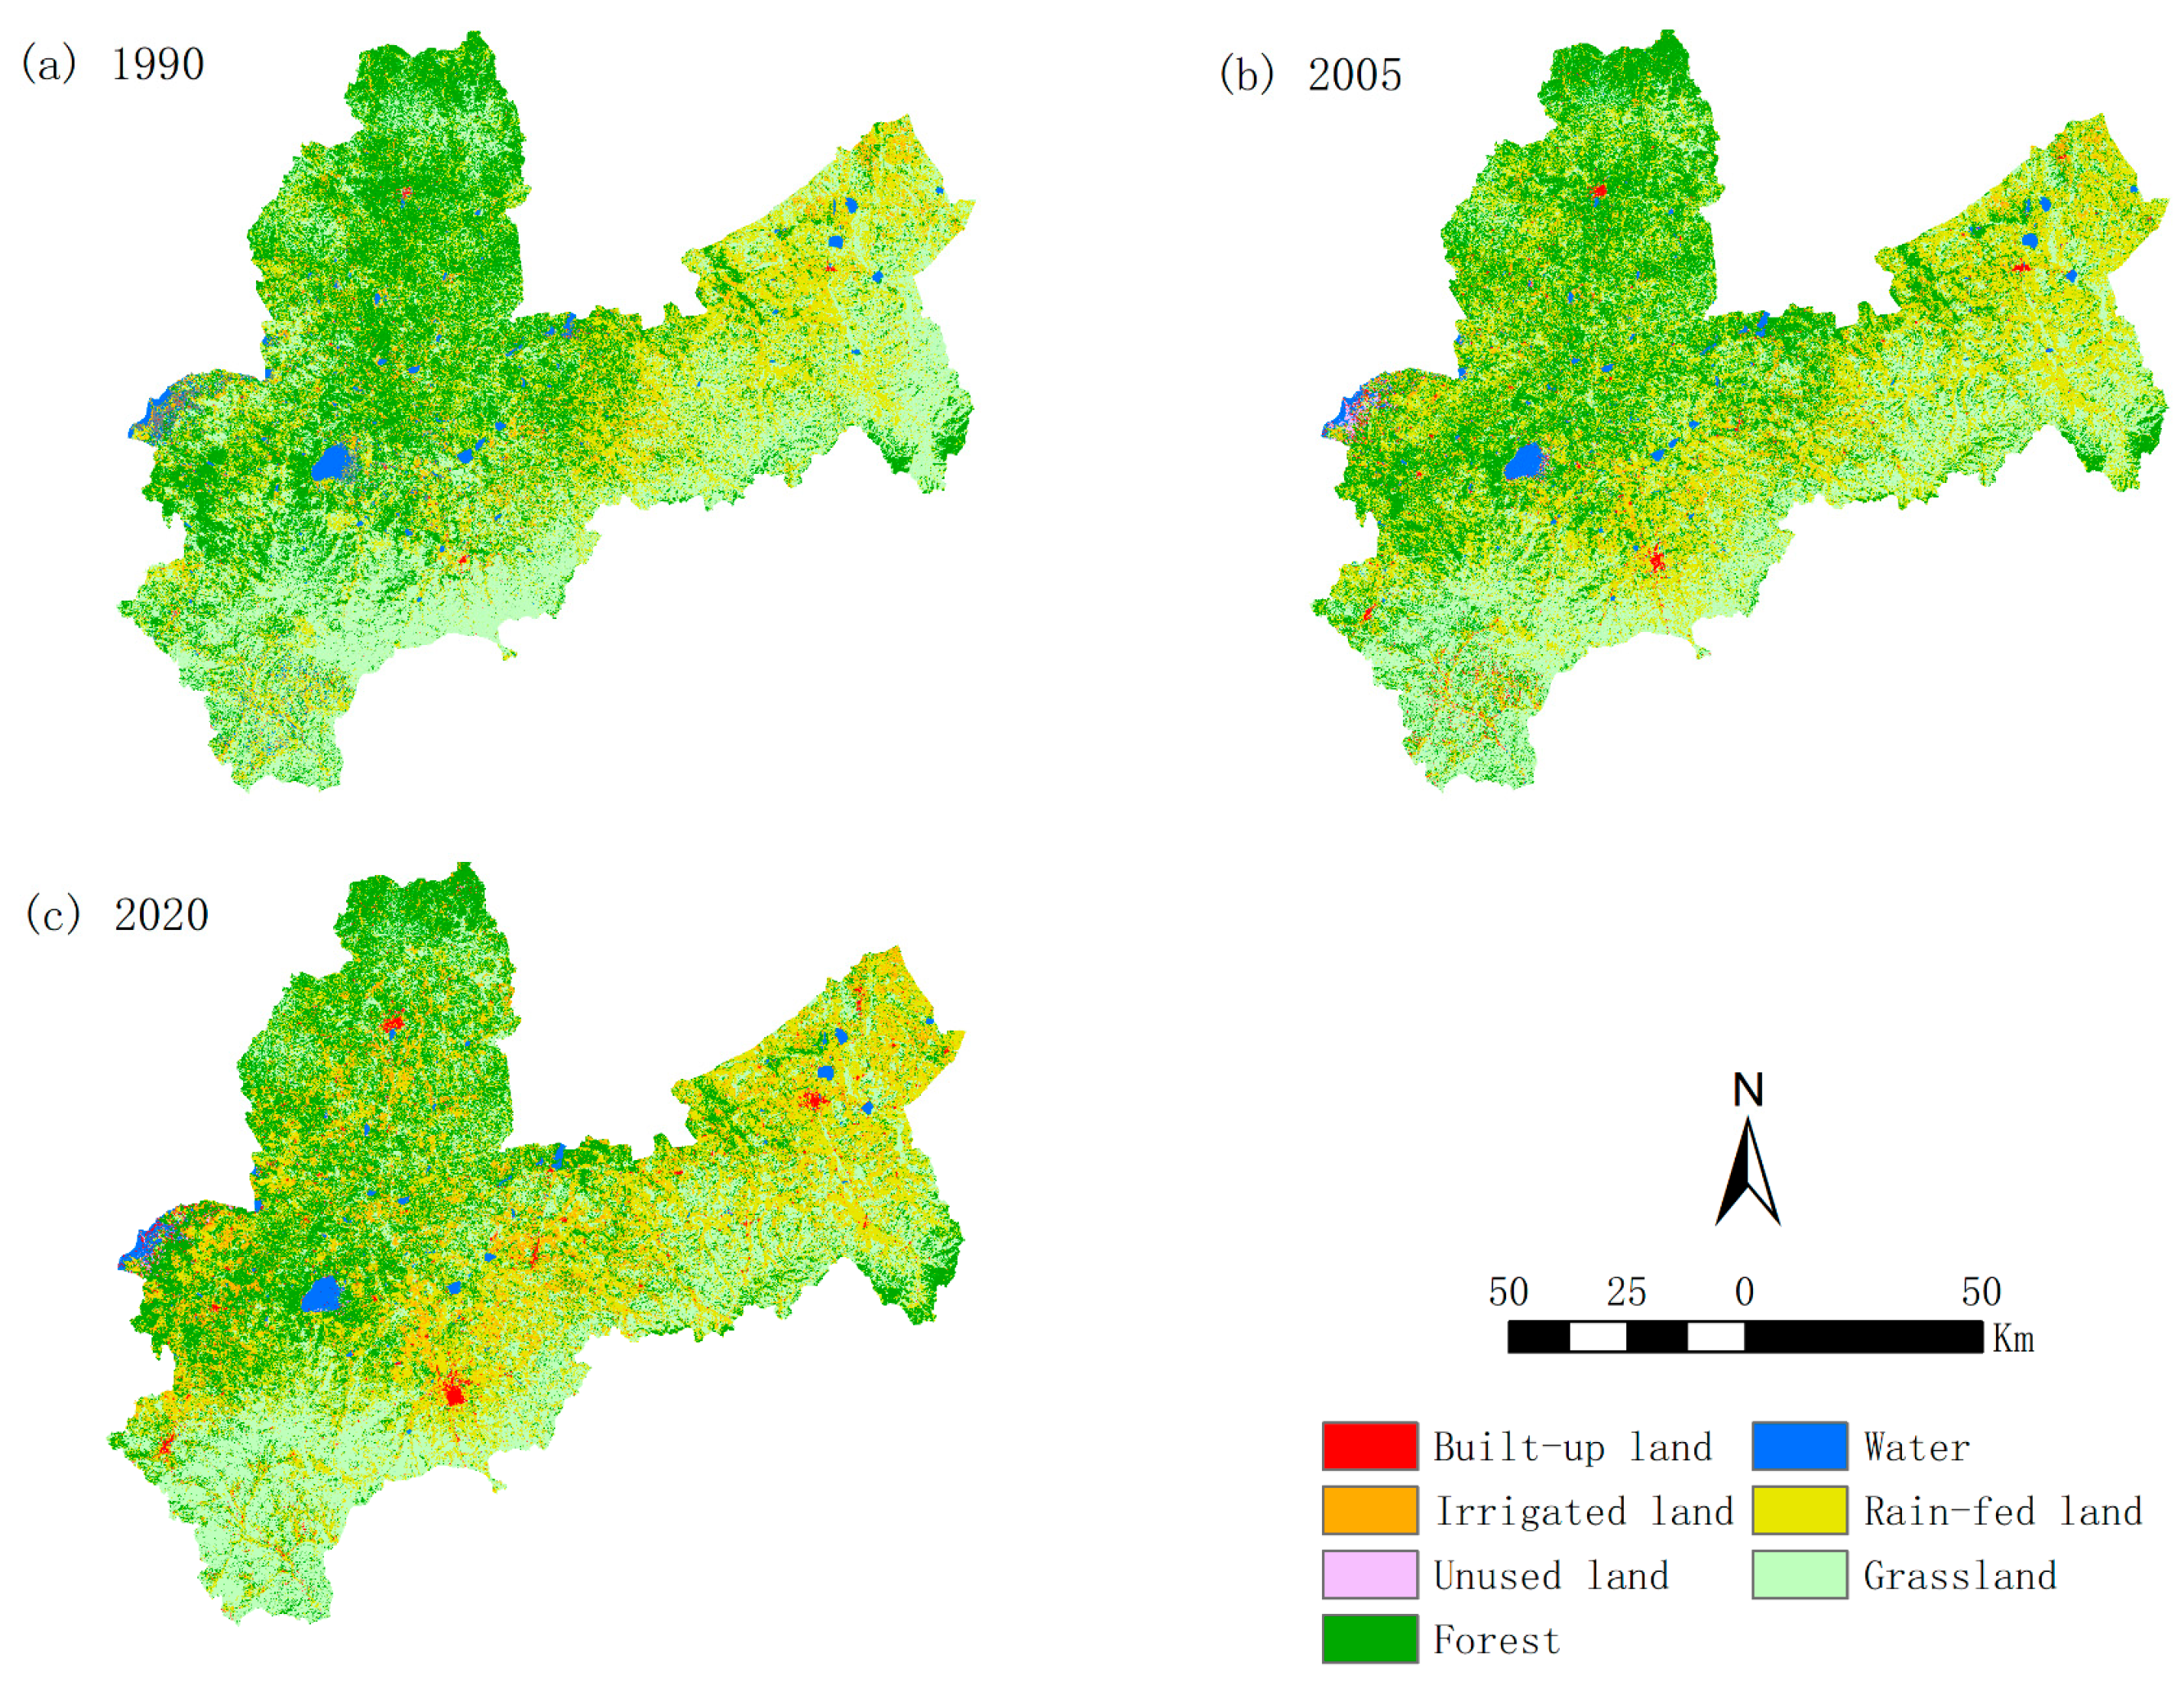
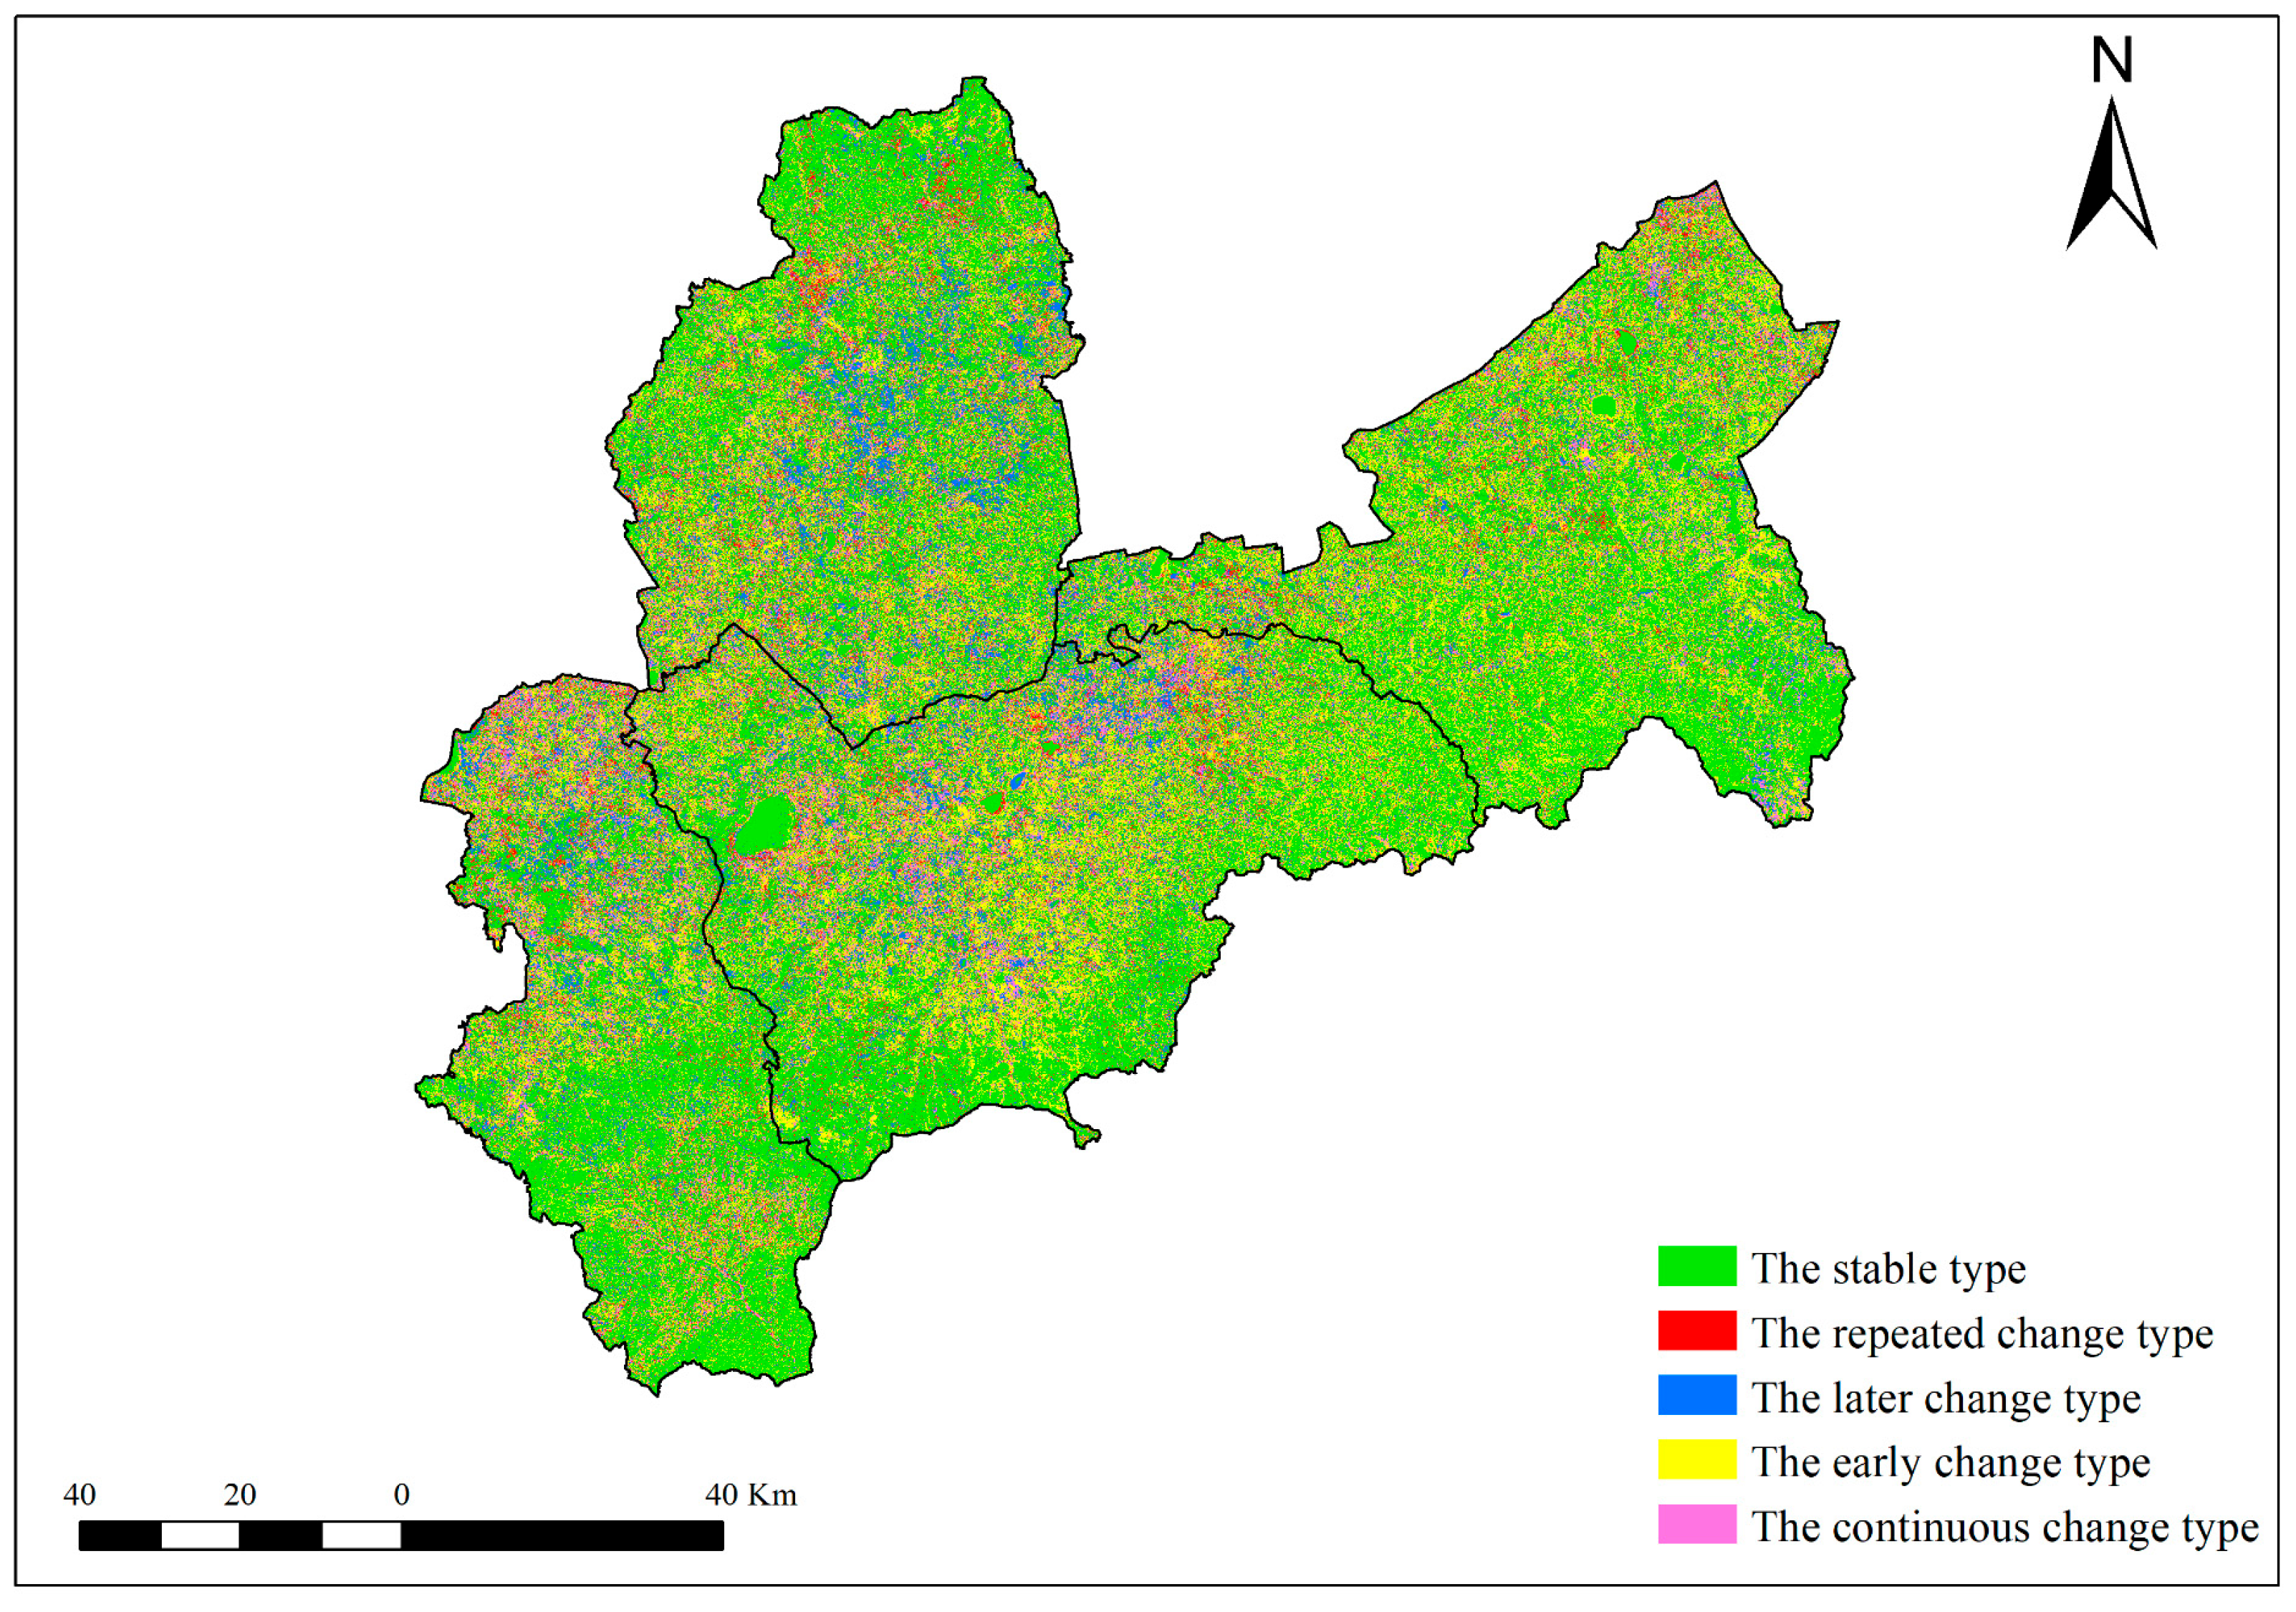
3.1. Geoinformation Tupu of LULC

Conflicting interests among stakeholders regarding the manner and extent of land use often result in land use conflicts. The evolution of the LULC can be viewed as the spatial manifestation of these conflicts over time. Analysis of the evolution of the LULC from 1990 to 2020 reveals that the land-use change is predominantly characterized by stable types, followed by early-change types, while repeated-change types account for the smallest proportion of the area (Figure 6). This indicates that most land use in the area has remained static, although a substantial portion underwent significant transformation during an early phase. Furthermore, it highlights the difficulty of reverting land to its original use once it has been changed. In the early-change category, the transitions primarily included ‘grassland-rain-fed land-rain-fed land’ (30.18%), ‘rain-fed land-grassland-grassland’ (12.78%), ‘woodland-rain-fed land-rain-fed land’ (11.99%), and ‘woodland-grassland’ (11.60%). For the later-change types, notable transitions were ‘woodland-forestland-rain-fed land’ (22.84%), ‘woodland-forestland-grassland’ (18.53%), ‘grassland-grassland-rain-fed land’ (13.08%), and ‘rain-fed land-rain-fed land-forestland’ (9.85%). The Bashang region of Zhangjiakou city, as a region heavily focused on agriculture and animal husbandry, has experienced extensive conversion between cropland (both irrigated and rain-fed land) and forest and grassland since 1990. By 2020, 2933.99 km2 of forest and grassland had been reclaimed for cropland, while 1478.79 km2 of land that was previously cropland was converted back to forest and grassland. This dynamic has resulted in spatial competition among the arable land, forest, and grassland land types, with the latter two categories ultimately losing ground (Table 3). This phenomenon underscores the growing dichotomy between the imperative for environmental conservation and the continuous expansion of agricultural and animal husbandry activities.

3.2. Multi-Scenario LULC Simulation

The FLUS model was applied to simulate land use in the Bashang region of Zhangjiakou for the year 2020, and the results were cross-validated against actual land use data (Table 4). The simulation achieved an accuracy that exceeded 80% for irrigated farmland, rainfed farmland, forest, and grassland. However, the accuracy was relatively lower for water bodies, built-up areas, and unused land, primarily due to their limited area and scattered spatial distribution. The overall simulation accuracy reached 86.93%, with a Kappa coefficient of 0.81, indicating strong model performance. These results demonstrate that the FLUS model is well-suited for capturing land use dynamics and can be reliably used for future LULC scenario projections. Using the validated 2020 LULC raster data as inputs, coupled with the Markov module, the FLUS model projected the spatial distribution of land use types under the NPS, APS, EPS, and LPS scenarios for 2035 (Figure 7). The projections indicate that the most substantial changes are anticipated in cultivated land, grassland, and forest areas.
In the NDS, the cultivated land—particularly irrigated land—exhibits a trend of expansion, with the area of irrigated land increasing by 203.31 km2 by 2035. In contrast, other land use types experience contraction, with the forest and grassland areas shrinking by 174.43 km2 and 94.99 km2, respectively. Spatial distribution analysis revealed that the cultivated land expanded primarily outward from its 2020 distribution, notably in the northern and central regions of Guyuan County, the central and eastern parts of Zhangbei County, and the central-southern areas of Kangbao County. This expansion predominantly encroached upon grassland and forestland, and was driven primarily by socio-economic development and the growing demand for construction land.
In the APS, the goal is to secure food production and sustain farmers’ livelihoods while maximizing the potential for cultivated land expansion. Compared to 2020, this scenario leads to a reduction of 1703.92 km2 in ecological land use types such as forest, grassland, and water bodies, along with a 9.01 km2 decrease in unused land. In contrast, the area of irrigated and rain-fed land increases by 1688.43 km2. Spatially, a significant expansion of the cultivated land, predominantly dry land, occurs in the central and northern parts of Guyuan and Zhangbei County. Furthermore, there is a notable shift from forest and grassland to irrigated land in the northwestern part of Shangyi County and the central-southern areas of Kangbao County.
In the EPS, the focus is on the preservation of ecological land, with a primary emphasis on promoting the expansion of forests, grasslands, and water bodies. Under this scenario, the expansion of cultivated land is effectively curbed. Compared to 2020, the 867.08 km2 of irrigated land is reduced, and the area of dry land decreases by 603.77 km2, which constitutes 30% of its original area. In contrast, the total area of forest, grassland, and water bodies expands by 1477.51 km2. From a spatial perspective, compared to the NDS, the ecological land in the Bashang region of Zhangjiakou city has largely been restored. Grassland recovery is particularly prominent in the southwestern part of Guyuan, the northeastern part of Zhangbei, and the southern part of Shangyi County. The forest restoration is most noticeable in Kangbao County and the northwestern part of Shangyi County.
Under the LPS, the cultivated land within the study area undergoes consolidation, with scattered irrigated land gradually transitioning to rain-fed land. Water bodies in the western part of Zhangbei County and the northwestern part of Shangyi County expand outward from their centers. The grasslands are primarily concentrated in the southwestern region of Shangyi, the western part of Zhangbei, and Guyuan County, showing gradual expansion towards the northwest. In Kangbao County, there has been a notable transformation of forestland into grassland, largely due to the sparsely distributed trees and grasses within the forest. The sparse forests in the Bashang region of Zhangjiakou city are unable to thrive in the region’s arid and semi-arid conditions, leading to their gradual transformation into grassland. Overall, this scenario strikes a balance between ecological protection and agricultural development, effectively curbing ecological degradation, optimizing agricultural structures, and playing a crucial role in the ecological construction and sustainable socio-economic development of the Bashang region of Zhangjiakou city.
As illustrated in Figure 8 and Table 5, significant variations in LULC evolution emerge across the four development scenarios for 2035. The NDS follows historical land use trends without policy constraints. Consequently, the areas of irrigated and rain-fed land expand significantly, increasing by 23.45% and 1.29%, respectively, compared to 2020. However, this growth comes at the expense of forest and grassland, which shrink by 4.32% and 2.14%, respectively. The continuous expansion of agricultural and residential areas encroaches on ecological zones, including forests, grasslands, and water bodies, thereby threatening the area’s long-term ecological security. This pattern highlights risks associated with ecosystem service degradation, which could undermine regional socio-economic and environmental sustainability. Designed to prioritize agricultural expansion, the APS enforces strict farmland protection policies, leading to a substantial 34% increase in cropland compared to 2020. However, these measures accelerate the conversion of forests and grasslands into agricultural land, exacerbating the competition between agricultural production and ecological conservation. The EPS emphasizes forest and grassland restoration, with both land types increasing by 13.01% and 4.87%, respectively, compared to 2020. However, the significant decline in arable land underscores a key limitation of the ecology-first approach—insufficient synergy between ecological conservation and food security, which may challenge sustainable land management. The LPS aligns with future development policies by balancing policy objectives with environmental constraints. It promotes the conversion of irrigated land to rain-fed land, which subsequently transitions into forest and grassland. The total area of cropland remains stable at 4551.27 km2, adhering to the red-line policy for permanent farmland protection. Notably, the area of grassland expands significantly, increasing by 27% compared to 2020. By maintaining a balanced distribution of forest, grassland, and cropland, the LPS supports both agricultural productivity and ecological sustainability, which makes it a more pragmatic and resilient land-use strategy for the agro-pastoral transition zone.

3.3. Evaluation of Water Conservation Based on InVEST and Main Driver Analysis

The InVEST model was used to calculate the water production for the year 2020, revealing a gradual increase in the annual WY from the northwest to the southeast across the study area (Figure 9). A comparison of the average WY and total water production in the sub-basins in the study area indicated that the highest WY was observed in Guyuan and the northern part of Zhangbei County. This can be primarily attributed to the region’s high precipitation levels, its extensive grassland areas, and the limited interception capacity of grassland, which, together, increase the amount of surface runoff and, in turn, increase water production. In contrast, water-producing areas in the northwestern parts of Kangbao and Shangyi Counties, which are characterized by higher forest vegetation cover and lower proportions of arable land, show different hydrological dynamics. The forest canopy, along with the deciduous layer and soil layer, plays a significant role in intercepting precipitation, reducing surface runoff, and influencing the overall water production levels.
The WCC of the Bashang region was calculated using Equation (6), with the mean value for the entire raster cell ranging from 0 to 82.71 mm. As shown in Figure 10, the overall low WCC in the Bashang region is evident. The spatial variation in this capacity follows the general pattern of water yield distribution, with higher values being observed in the southeastern part of the region. The areas that exhibit a high WCC are characterized by factors such as high precipitation, low evapotranspiration, shallow soil depths, high altitudes, and high values of saturated hydraulic conductivity. To assess the correlation between the water conservation capacity of the studied area and these driving factors, the Spearman correlation coefficient was calculated (Figure 11). The statistical analysis revealed a significant positive correlation between water conservation capacity and precipitation (0.51), elevation (0.55), and evapotranspiration (0.46). In contrast, negative correlations were observed between water conservation capacity and soil depth (−0.30), evapotranspiration (−0.46), soil permeability (−0.20), and the topographic index (−0.16).

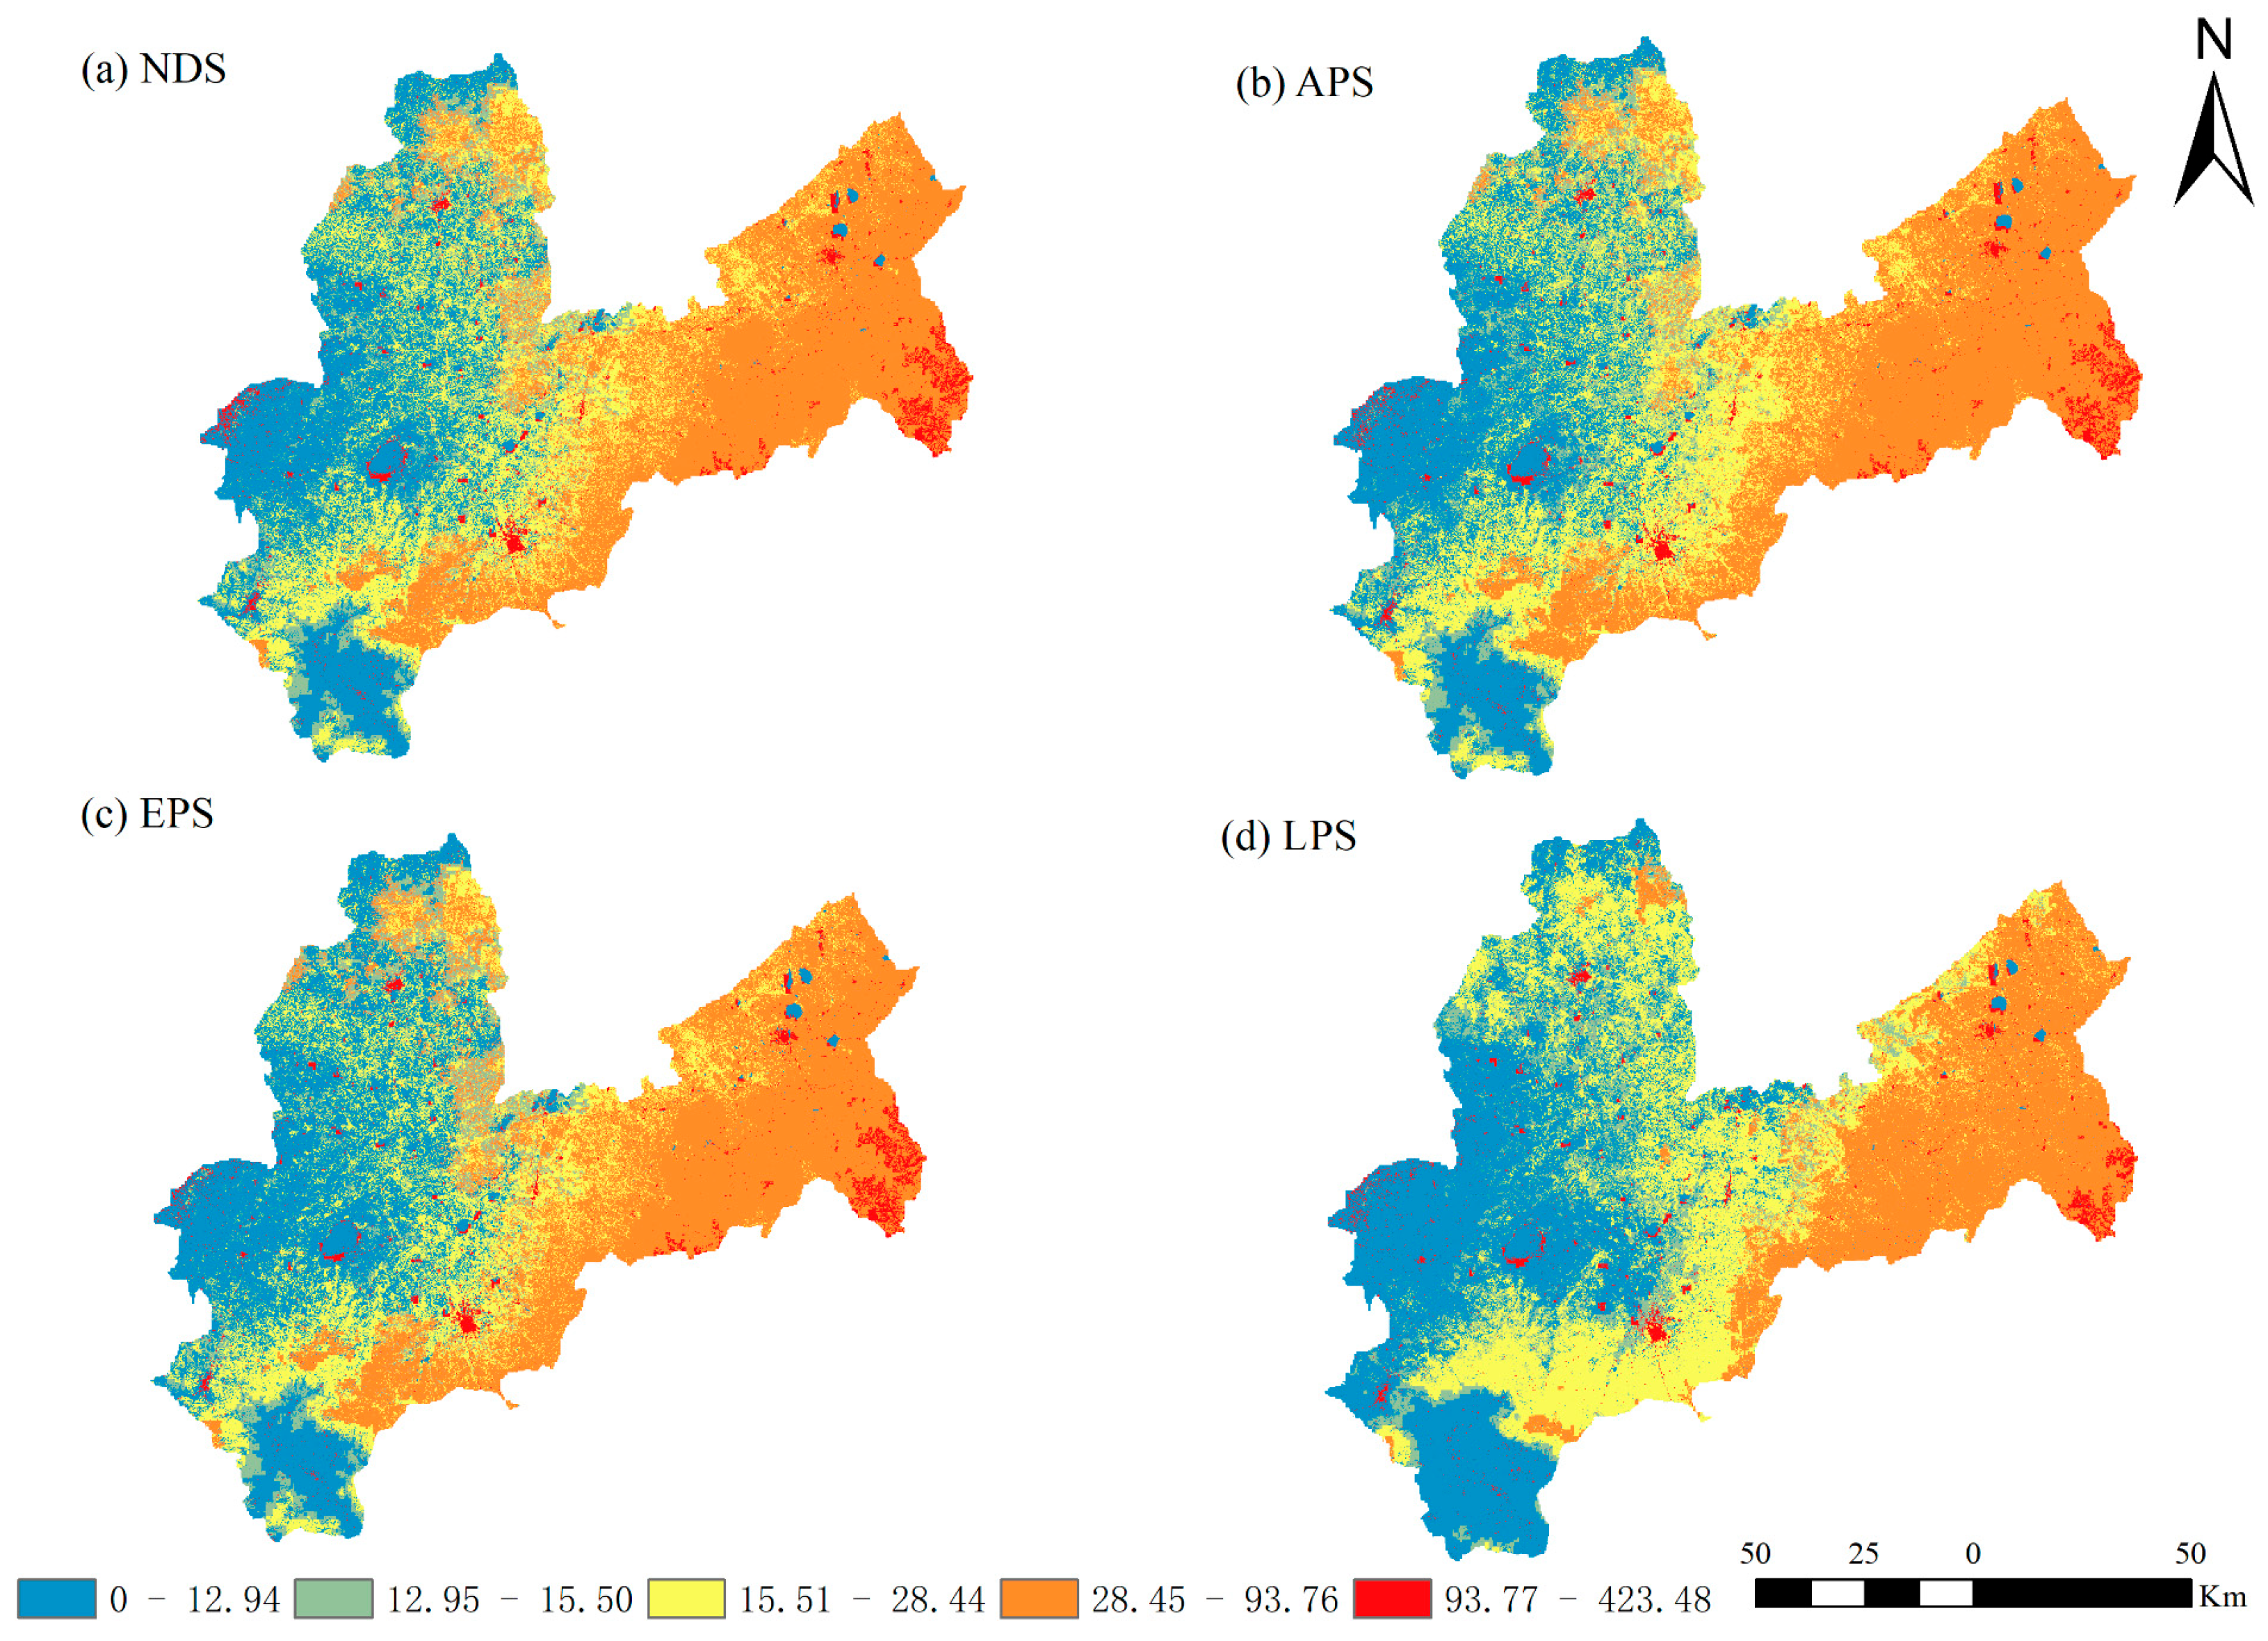
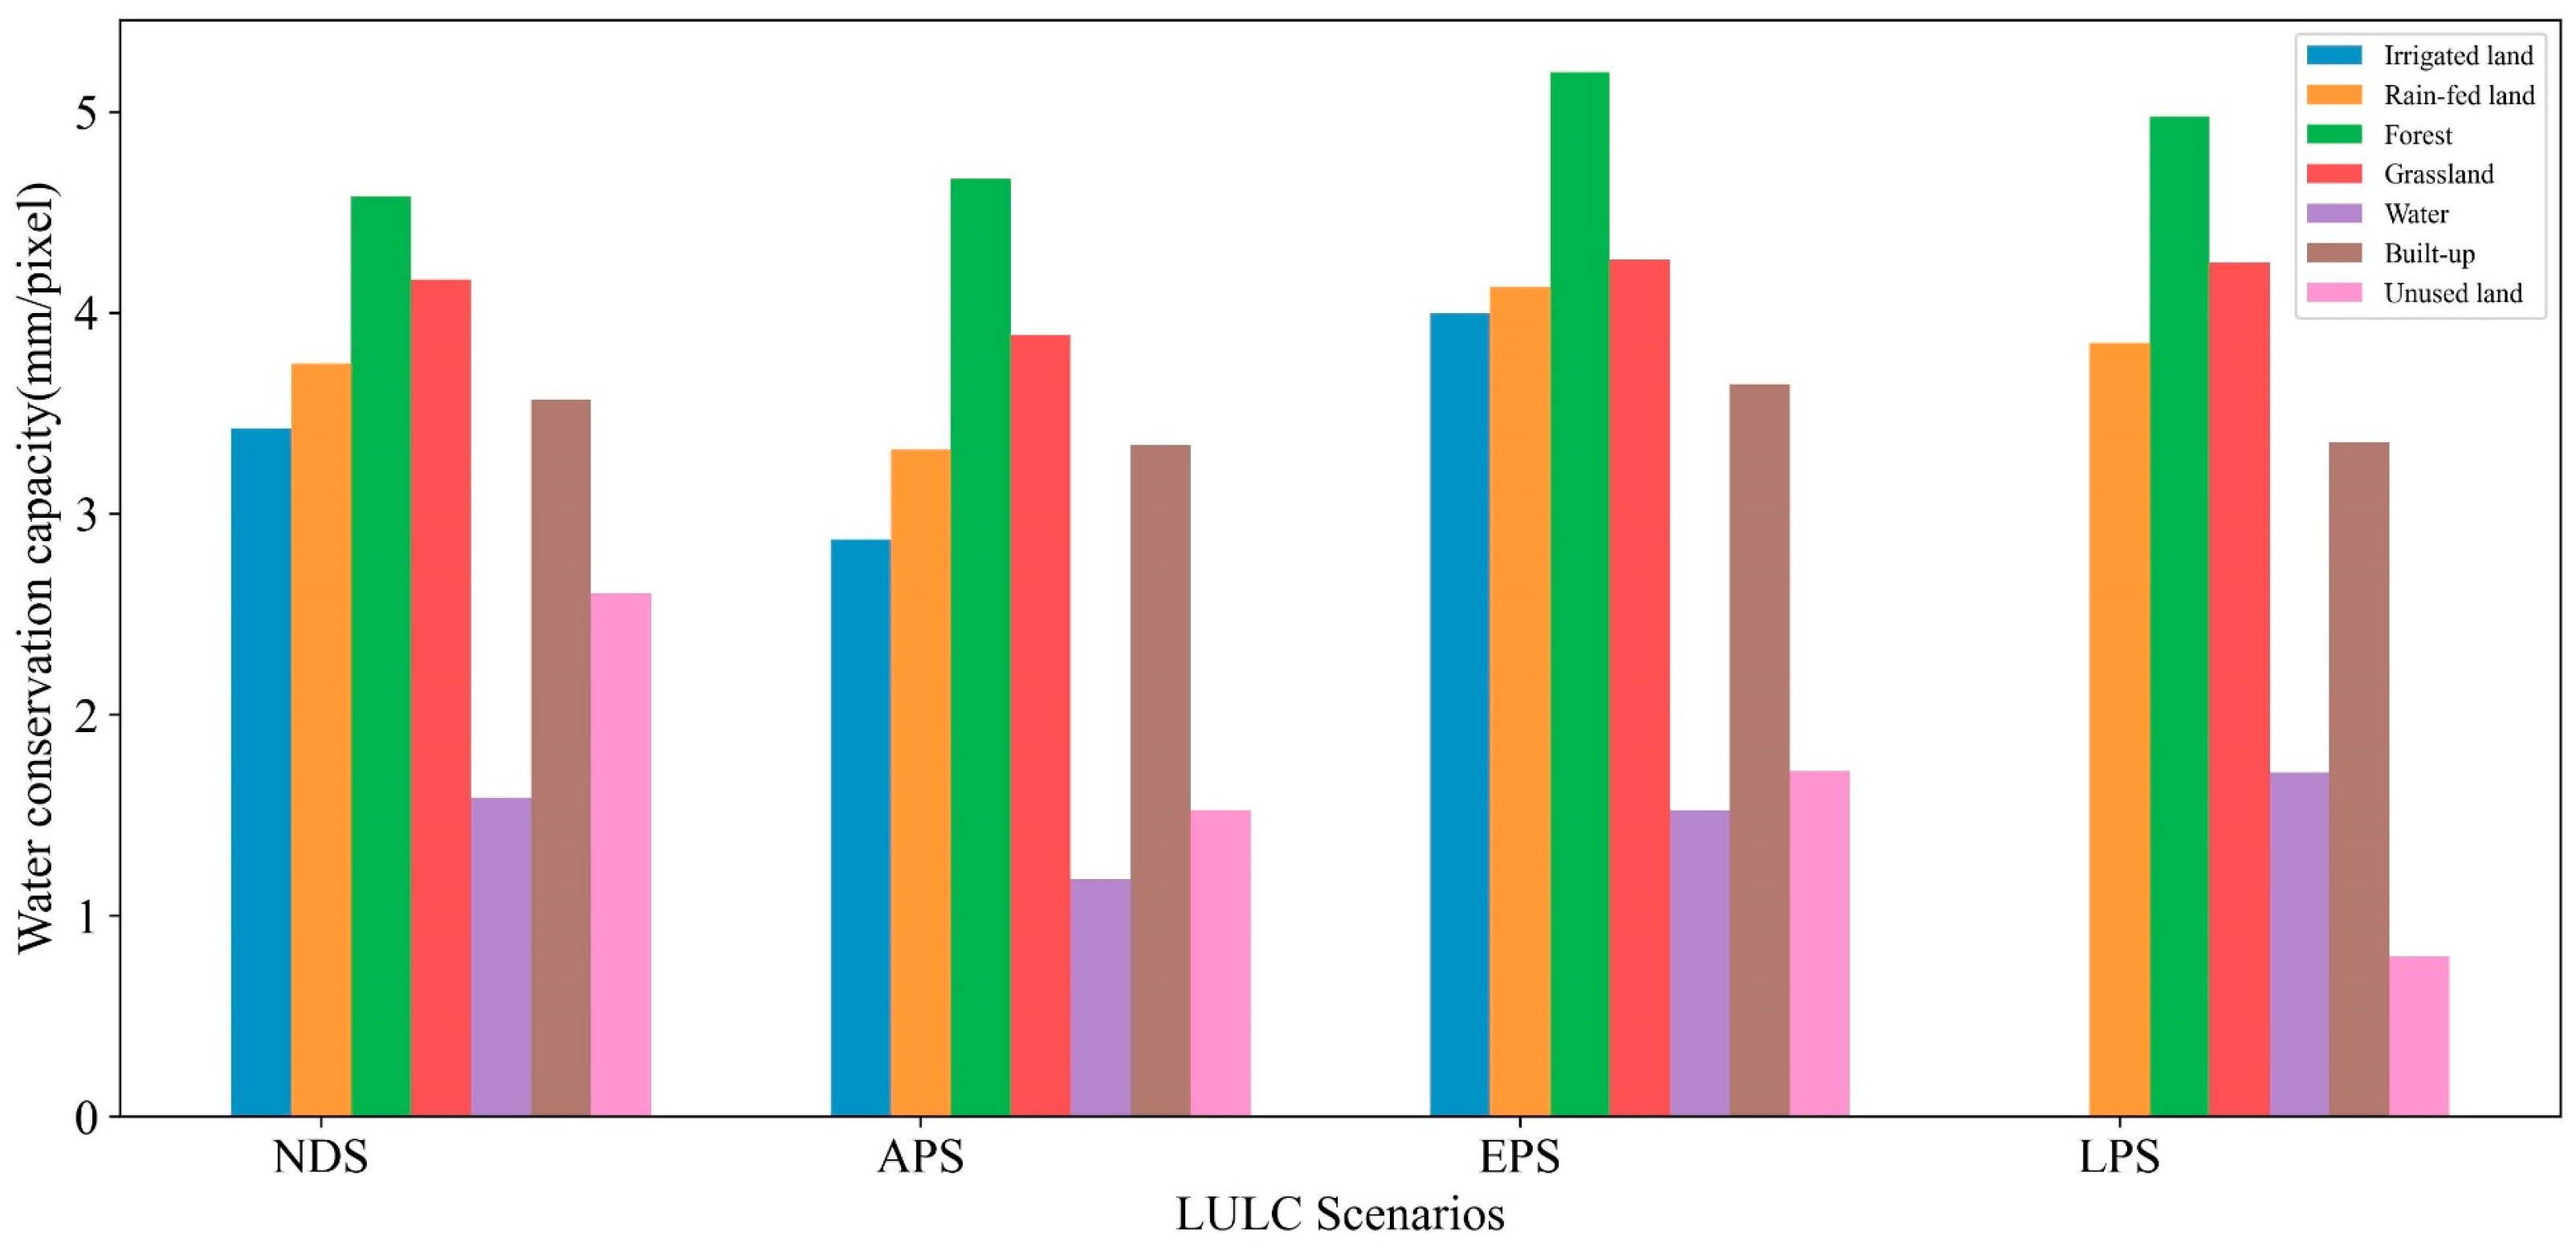
3.4. Multi-Scenario Water Conservation Simulation

This study analyzes the WY under different LULC scenarios for 2035 (Figure 12). Using the InVEST model within the 2020 environmental context, we simulated the water yield for 2035 under four scenarios: the NDS, the APS, the EPS, and the LPS. Spatially, the water yield under different scenarios for 2035 exhibited a pattern of lower values in the northwest and higher values in the southeast, which is consistent with the spatial distribution trend observed in 2020 (Figure 7). The descending order of the water yields was LPS > NDS > APS > EPS (Table 4), with all scenarios exceeding 2020 levels. The mean grid cell water yields were 35.066, 33.362, 32.885, and 32.741 mm pixe−1, respectively, indicating that spatial land use planning significantly impacts the water yield. Under the LPS, the complete retirement of irrigated cropland reduced the water consumption demand, thereby increasing the water yield. The NDS followed natural development trends of the LULC, where a diminished surface interception capacity due to reduced forest and grassland coverage, combined with cropland expansion increasing the water demand, paradoxically resulted in a higher WY compared to 2020. The APS showed the most significant cropland expansion, with the irrigated and dryland areas increasing by 583.41 and 849.52 km2, respectively, compared to the NDS, leading to elevated water demand and, consequently, a lower water yield than both the NDS and LPS. Under the EPS, enhanced surface infiltration and interception capacities from restored forest and grassland ecosystems resulted in a reduced WY.
Based on the projected WY for 2035 under different LULC scenarios, we calculated the WCC for the NDS, APS, EPS, and LPS by integrating the topographic index, flow velocity coefficient, and saturated soil hydraulic conductivity (Figure 13). The ranking of the WCC across these scenarios was as follows: EPS > LPS > NDS > APS. The mean grid cell water conservation capacities were 3.990, 3.875, 3.801, and 3.418 mm/pixel, corresponding to total water conservation volumes of 28.464 × 10⁶, 27.701 × 10⁶, 26.556 × 10⁶, and 24.031 × 10⁶ m3, respectively (Table 6). Notably, the EPS and LPS exhibited higher WCCs than in 2020, whereas the NDS and APS showed declines. Despite having the lowest WY, the EPS achieved the highest WCC due to the superior rainfall interception capabilities of forests and grasslands compared to other land types. The substantial expansion of forest and grassland in the EPS (significantly exceeding that in other scenarios) enhanced its water conservation potential. Conversely, the APS exhibited the lowest WCC due to cropland expansion, which not only increased the water consumption but also encroached upon forests and grasslands, thereby reducing the surface interception capacity. While the LPS demonstrated a higher WCC than the NDS and APS, it remained lower than that of the EPS. This pattern resulted from frequent land conversions under the LPS, particularly large-scale forest–grassland transitions. Given that grasslands have a weaker interception capacity than forests, the LPS yielded the highest WY but failed to surpass the EPS in terms of its WCC.
The spatial relationship of the water conservation capacity (WCC) to the land use type among sub-watersheds under four land-use change scenarios was assessed using the Local Moran’s I index (Figure 12). The sub-watersheds were subsequently clustered into three categories based on their WCC levels: high water conservation capacity (HWCC), middle water conservation capacity (MWCC), and low water conservation capacity (LWCC). Analysis of variance (ANOVA) revealed statistically significant differences among the three clusters (p < 0.05). A comparative analysis of the four scenarios showed that the ecological protection scenario (EPS) exhibited the highest mean WCC values across all cluster types—7.64 mm for HWCC, 4.08 mm for MWCC, and 2.29 mm for LWCC. However, the EPS also had the largest LWCC area, covering 4824.09 km2. In contrast, the living production scenario (LPS) demonstrated lower average WCC values in all three clusters compared to the EPS. Notably, the LWCC area under the LPS was the smallest (1800.35 km2), while the MWCC area was the largest (10,602.69 km2). These findings suggest that the land use distribution under the LPS scenario may be more spatially optimized for supporting water conservation.

4. Discussion

4.1. Effects of LULC on Water Conservation Function

This study employed the FLUS model to forecast future LULC trends in the Bashang region of Zhangjiakou city for 2035, taking into account four different scenarios. The analysis revealed significant variations in the projected distribution of cultivated land, forest areas, and grasslands across these scenarios [40]. Subsequently, the InVEST model was employed to calculate the WY and estimate the WCC of each scenario. The findings suggest that land-use changes exert complex and multifaceted effects on water retention, particularly in ecologically sensitive agro-pastoral transition zones. A comparison of the water retention capacities across different land types showed the following order: forest > grassland > dryland > irrigated land > built-up areas > unused land > water bodies (Figure 14). Among the various land types, forests exhibit a significantly better water conservation capacity compared to grasslands. This is primarily due to the multi-layered vegetation structure of forests, which includes trees, shrubs, herbaceous plants, and a litter layer. Forests effectively intercept precipitation, delay surface runoff, and reduce evaporation, significantly increasing the water retention of forested areas. The forest canopy’s shading effect and transpiration help regulate the local climate, lower the runoff coefficient, and promote groundwater recharge [41]. Additionally, the litter layer absorbs substantial amounts of water, suppresses evaporation, and improves the soil structure. The well-developed deep root systems and porous organic-rich soils of forests further enhance their water infiltration and deep storage capacity [42]. In contrast, grasslands have simpler vegetation types, shallow root systems, and compacted soils, which limit their water retention ability [43]. Specifically, in the Zhangjiakou Bashang region, a typical agro-pastoral ecotone, grasslands are highly vulnerable to degradation due to overgrazing and phenological changes, resulting in a decline in their water conservation capacity. The WCC of cropland is generally lower than that of forest and grassland. Moreover, within the cropland types, rain-fed land exhibits a higher WCC than irrigated land. This is primarily because irrigated land in the Bashang region of Zhangjiakou is predominantly used for vegetable cultivation, which is characterized by high evapotranspiration rates and substantial water consumption.
Changes in LULC, such as urbanization, cropland expansion, deforestation, and ecological restoration, directly influence the runoff, retention, and recharge capacities of water resources [44,45,46]. The evolution of the LULC and its impact on water conservation functions in the agricultural-pastoral transitional zone of Bashang presents both universal trends and regional specificities. In the evolution of the LULC, the process of urbanization has driven the conversion of cropland and forested areas into construction land in urban and peri-urban regions. This shift has led to an expansion of the area of impervious surfaces, significantly the area’s reducing surface infiltration and evapotranspiration capacity. As a result, while the WY tends to increase, the WCC declines [15]. This pattern is also evident in the Bashang region of Zhangjiakou, where the acceleration of urbanization under the NDS resulted in an increased WY but a marked reduction in the WCC. Some studies have found that cropland expansion and deforestation contributed to a notable decline in the WCC in southern Iran, Duero’s River Basin, and the Bosten Lake Basin [16,47,48]. The same result can be anticipated in the Bashang region of Zhangjiakou under future cropland expansion, where the WCC is projected to decline noticeably with the large-scale expansion of cropland. Research in the Yellow River Basin has showed that the implementation of the “Grain for Green” policy led to a 36.25 mm increase in the area’s WCC in 2020 compared to the 2011 average, highlighting the positive effect of forest restoration [49]. This aligns with projected increases in the WCC in the Bashang region of Zhangjiakou under future ecological protection scenarios, where land-use changes dominated by forest restoration result in the highest WCC. In the Danjiang River Basin, the land use has shown a transition from cropland and forest to grassland, which has enhanced the region’s WCC. Notably, in this area, grassland exhibits a higher water conservation capacity than forestland [50]. Similarly, in the Bashang region of Zhangjiakou, policy-driven grassland restoration has also contributed to an improved WCC. However, the rate of WCC increase under grassland restoration is lower than that observed with forest recovery, underscoring the varying impacts of LULC evolution on the WCC across different regions. This highlights the importance of formulating region-specific land use plans. Although the water conservation capacity of forests is higher than that of grassland, the restoration of grasslands is far more important than that of forests in the Bashang region of Zhangjiakou from the perspective of the coordinated development of the social economy and ecological protection. Such targeted and ecological priority land-use strategies are essential for safeguarding future water resources in transitional agro-pastoral zones.

4.2. Impact of Different Scenarios on Water Conservation Function

The comparison of the water conservation capacities (WCCs) achieved under four different development scenarios reveals notable insights. The natural development scenario (NDS) reflects a continuation of the current land use trends without strong policy intervention. In this scenario, the WCC gradually declines, posing significant risks to regional ecological security. The agricultural production scenario (APS), which prioritizes the expansion of cultivated land, severely undermines the ecosystem’s water conservation capacity, thereby disrupting the ecological balance. Although the ecological protection scenario (EPS) achieves the highest WCC, it overlooks national priorities related to food security and socio-economic development, which may threaten its long-term sustainability. In contrast, the land planning scenario (LPS), guided by policy-driven spatial planning, strikes a relatively balanced allocation between cultivated and ecological land. This balanced configuration not only enhances the water yield but also strengthens water conservation functions, making the LPS a practical and adaptable approach for future spatial planning and water resource management. However, the WCC under the LPS is still lower than that of the EPS, mainly due to the conversion of forested land into grassland under policy guidance. Such transformations reduce the soil infiltration rates and surface water retention, thereby weakening the overall hydrological regulation capacity. The results highlight the ongoing trade-off between land use optimization and water resource protection in policy formulation. Similar trade-offs and land use-driven water resource dynamics have been observed in other semi-arid and transitional regions. For instance, in the Yellow River Basin of China reported that afforestation under ecological scenarios strengthened water conservation, but conflicted with food production needs, mirroring the EPS–LPS comparison in this study [49]. In the Qinghai-Tibet Plateau, it was found that ecological restoration plans yielded higher hydrological benefits, but at the cost of agricultural productivity [51]. Similarly, research in the Ethiopian Highlands emphasized that integrated land management strategies that balance cultivated land and forested areas offer the most stable long-term benefits for both water resource conservation and rural livelihoods [52]. These findings collectively underscore that the effectiveness of land use policies in enhancing water-related ecosystem services is highly context-dependent and influenced by socio-economic policy factors. Therefore, future land use planning should aim to reconcile ecological integrity with socio-economic demands, promoting a more sustainable balance between environmental protection and agricultural development.
Based on the observed land use conditions and the simulated outcomes under the LPS scenario, the following policy recommendations are proposed: (1) strictly enforce ecological land protection regulations to prevent the unsustainable encroachment of forest and grassland, thereby safeguarding the water conservation functions and ecological security in the capital’s source region; (2) designate core ecological conservation zones while ensuring the protection of permanent basic farmland, and implement ecological restoration initiatives—such as the “Grain-to-Grassland” program—to enhance landscape resilience; and (3) establish urban growth boundaries to guide the rational expansion of construction land and adopt a dynamic equilibrium mechanism to balance cropland and grassland to support sustained ecosystem services in the Bashang region of Zhangjiakou.

4.3. Climate Impacts on Water Conservation Function

A comparative analysis of the spatial distributions between water conservation capacity and precipitation patterns across 2020 and the four 2035 scenarios (Figure 9 and Figure 13) revealed strong spatial consistency, indicating a close correlation between climate evolution and water conservation capacity. The findings of this study are consistent with those of previous regional studies. For instance, research in Kentucky, USA, demonstrates that the spatiotemporal distribution of precipitation is a dominant factor that influences the WCC, with the coupling effects of climate and land-use change significantly affecting water resource dynamics. Precipitation, as the core driver of water conservation, directly influences the soil infiltration and groundwater recharge efficiency, and its intensity and distribution characteristics play a crucial role in water resource protection [53]. Similarly, studies conducted in the Tibetan Plateau highlight that moderate and evenly distributed rainfall is beneficial for soil absorption and groundwater recharge, thereby enhancing the water conservation capacity. In contrast, extreme rainfall events, such as heavy storms, can increase surface runoff, reduce infiltration, and potentially lead to flooding and soil erosion, undermining hydrological functions [40,54]. While the InVEST model effectively simulates the synergistic effects of the climate and land-use change on water conservation, uncertainties in future climate projections remain a challenge. For example, research conducted in the Ganjiang River Basin, using CMIP6 climate models, indicates that climate change has a much higher sensitivity to runoff compared to land-use changes [55]. However, their combined effects significantly influence the water resource infiltration capacity and exacerbate flood risks. Furthermore, the evolution of different land use types under various future climate scenarios, such as those projected under the CMIP6 SSPs, will have distinct impacts on water conservation. Specifically, wetland restoration plays a critical role in enhancing watershed resilience, whereas the expansion of urban areas, particularly in densely populated zones, will reduce the surface retention capacity and ultimately diminish the regional water conservation potential of these areas [56,57]. Although ecosystem models simplify complex processes, their uncertainties can affect the accuracy of simulation results. Future research will prioritize optimizing ecohydrological process representations through experimental and field-based observations, aiming to enhance simulation accuracy and reduce uncertainties. Concurrently, this work will integrate future scenario datasets to simulate water resource dynamics under varying climatic scenarios, thereby improving the predictive capabilities for sustainable water management under global change pressures.

4.4. Limitations and Future Works

The FLUS model was used in this study to forecast future LULC patterns and evaluate changes in water conservation across different scenarios. Although valuable conclusions were reached, this study has several uncertainties and limitations. The regulation of water conservation functions under land-use changes exhibits marked spatial heterogeneity and multi-scale coupling characteristics. Ecohydrological responses differ fundamentally between the macro and micro scales and are nonlinearly moderated by regional environmental baselines. At broader scales, land cover transformations—such as urban expansion and deforestation—often trigger systemic hydrological risks. In contrast, micro-scale ecological interventions, such as green infrastructure, can exert localized, positive regulatory effects on water cycling. Empirical evidence supports this scale-dependent differentiation. Between 1990 and 2015, the expansion of built-up areas in the Beijing–Tianjin–Hebei urban agglomeration increased the proportion of impervious surfaces to 38.5%, resulting in a 5.1% rise in the annual water yield [58]. Similarly, in the Mereb-Gash River Basin of the Horn of Africa, deforestation and unregulated urban growth led to intensified surface runoff and diminished groundwater recharge [11]. In contrast, ecosystem service-based land management has demonstrated substantial ecological benefits. In the central region of South Africa, converting 30% of the grassland on slopes greater than 3% into evergreen forest established a multilayered canopy structure, enhancing the mean monthly water yield by 171% compared to baseline conditions [59]. Likewise, urban green spaces—including parks and green roofs—have been shown to mitigate urban heat island effects, reduce surface temperatures, and improve local water retention and cooling capacities [60]. Given the scale-dependent nature of land use impacts on water provisioning services, integrating multi-source remote sensing data, land use trajectories, and regional biophysical factors across spatial scales is essential. Such an approach can provide critical insights to support evidence-based and sustainable land and water resource management policies.
In simulating future land-use scenarios, this study primarily focused on current trends in land use and climate change factors, without fully accounting for potential changes in future socio-economicsocio-economic conditions and their impacts on land use and WCCs. Factors such as population growth and economic development could significantly influence land-use patterns, yet they were not included in this analysis. Socio-economic development fosters industrial restructuring and technological advancement, with improvements in agricultural practices reducing the demand for arable land [61]. However, this variable was not incorporated into the current model, which may have led to an overestimation of farmland expansion and its encroachment on natural vegetation, thereby leading to underestimation of the ecosystem’s capacity for water conservation. Empirical studies from China’s coastal regions have revealed a negative correlation between GDP density and water conservation capacity, indicating that rapid economic growth—through urbanization—can compress ecological space and weaken hydrological regulation functions [62]. In addition, the aggregation of populations into urban agglomerations accelerates the expansion of construction land, resulting in decreased regional water conservation capacities (WCCs) and intensifying hydrological imbalances in urban regions [63]. Conversely, trends of counter-urbanization and rural depopulation have led to farmland abandonment in certain regions, promoting the regeneration of secondary forests. Research conducted in eastern Tibet and western Sichuan further demonstrates that the contribution of natural forest protection to water yields surpasses that of artificial vegetation cover [64]. Therefore, future modeling efforts should consider such natural recovery processes to more accurately evaluate their impact on the WCC of relevant areas. Furthermore, this study concentrated on the spatiotemporal evolution of the WCC of the study region under different scenarios, without examining the potential effects of water conservation changes on future ecosystem services and the environmental quality [65]. The ability to conserve water is essential for the sustainable management of regional water resources and plays a crucial role in preserving ecosystem stability and biodiversity [66]. Therefore, integrating regional water resource management with the flow of ecosystem services and quantitatively evaluating the effectiveness of various mitigation strategies would enhance the comprehensiveness and applicability of the research [67,68]. Future research should include a broader array of socio-economic and climate change scenarios to assess their impacts on land use, as well as their joint effects on water conservation and ecosystem services. The integration of spatial simulation with ecosystem service function evaluation would facilitate the quantification and comparison of different mitigation strategies, providing policymakers with a more scientifically grounded basis for promoting sustainable agricultural growth and long-term ecological conservation.

5. Conclusions

This study reveals that the Bashang region of Zhangjiakou experienced frequent land use transitions between 1990 and 2020, with the rate of change declining significantly from 27.83% during 1990–2005 to 11.83% in the subsequent period (2005–2020). Using the InVEST model, the estimated water yield (WY) and water conservation capacity (WCC) for 2020 were 446.063 × 10⁶ m3 and 27.027 × 10⁶ m3, respectively. Furthermore, the integration of the FLUS and InVEST models to simulate four development scenarios for 2035 revealed substantial spatial variability in land use dynamics and associated water resource outcomes. Notably, the natural development scenario (NDS) and agricultural production scenario (APS) led to considerable expansions in irrigated and rain-fed cropland, respectively. In contrast, the ecological protection scenario (EPS) prioritized the restoration of forest and grassland, significantly enhancing the area’s water conservation capacity, albeit at the cost of reducing the amount of arable land, which limits the balance between ecological protection and agricultural needs. Overall, the land planning scenario (LPS), implemented under the permanent basic farmland protection policy, achieved the highest water yield while maintaining a comparatively high water conservation capacity. Its alignment with the national development goals set for 2035 underscores its potential as a balanced and feasible strategy for future land use planning in transitional agro-pastoral regions. Nevertheless, further spatial adjustments are necessary to accommodate local development demands and to promote a sustainable balance between ecological landscape conservation and water resource management.

Author Contributions

Conceptualization, R.Z. and W.Z.; Formal analysis, R.Z. and Z.P.; Funding acquisition, W.Z.; Investigation, R.Z., H.K., H.X. and Z.P.; Methodology, W.Z.; Supervision, H.K., H.X., C.C., G.Z., Z.P. and W.Z.; Validation, R.Z., C.C. and G.Z.; Writing—original draft, R.Z. and W.Z.; Writing—review & editing, R.Z. and W.Z. All authors have read and agreed to the published version of the manuscript.

Funding

This research was funded by Special Project on Hi-Tech Innovation Capacity of Beijing Academy of Agriculture and Forestry Sciences, grant number (JCX20230406) and (KJCX20230305). This research was supported by Beijing Natural Science Foundation, grant number (8232028).

Institutional Review Board Statement

Not applicable.

Data Availability Statement

The data presented in this study are available on request from the corresponding author.

Acknowledgments

We are deeply grateful to the experts at the Institute of Grassland, Flowers, and Ecology, Beijing Academy of Agriculture and Forestry Sciences, and the professors at China University of Geosciences, Beijing, for their valuable contributions.

Conflicts of Interest

The authors declare no conflicts of interest.

Abbreviations

The following abbreviations are used in this manuscript:
WYWater Yield
WCCWater Conservation Capacity
LULCLand Use/Land Cover

References

  1. He, C.; Liu, Z.; Wu, J.; Pan, X.; Fang, Z.; Li, J.; Bryan, B.A. Future global urban water scarcity and potential solutions. Nat. Commun. 2021, 12, 4667. [Google Scholar] [CrossRef] [PubMed]
  2. Boretti, A.; Rosa, L. Reassessing the projections of the World Water Development Report. npj Clean Water 2019, 2, 15. [Google Scholar] [CrossRef]
  3. Rosa, L.; Chiarelli, D.D.; Rulli, M.C.; Dell’Angelo, J.; D’Odorico, P. Global agricultural economic water scarcity. Sci. Adv. 2020, 6, eaaz6031. [Google Scholar] [CrossRef]
  4. Winkler, K.; Fuchs, R.; Rounsevell, M.; Herold, M. Global land use changes are four times greater than previously estimated. Nat. Commun. 2021, 12, 10. [Google Scholar] [CrossRef]
  5. Guo, Q.; Yu, C.; Xu, Z.; Yang, Y.; Wang, X. Impacts of climate and land-use changes on water yields: Similarities and differences among typical watersheds distributed throughout China. J. Hydrol. Reg. Stud. 2023, 45, 101294. [Google Scholar] [CrossRef]
  6. Liu, X.; Liu, Y.; Wang, Y.; Liu, Z. Evaluating potential impacts of land use changes on water supply–demand under multiple development scenarios in dryland region. J. Hydrol. 2022, 610, 127811. [Google Scholar] [CrossRef]
  7. Qiao, J.; He, J.; Li, Y.; Yang, X.; Peng, Y.; Wang, H.; Yu, F.; Wu, J.; Gong, S.; Che, H.; et al. Analysis of the spatiotemporal changes in global land cover from 2001 to 2020. Sci. Total Environ. 2023, 908, 168354. [Google Scholar] [CrossRef]
  8. Fernando, M.; Néstor, M.; Ximena, Q.; María, J.; Paúl, C. What Do We Know about Water Scarcity in Semi-Arid Zones? A Global Analysis and Research Trends. Water 2022, 14, 2685. [Google Scholar] [CrossRef]
  9. Yang, R.J.; Chen, H.; Chen, S.; Ye, Y.M. Spatiotemporal evolution and prediction of land use/land cover changes and ecosystem service variation in the Yellow River Basin, China. Ecol. Indic. 2022, 145, 109579. [Google Scholar] [CrossRef]
  10. Zhao, L.; Shen, Y.J.; Liu, M.; Wang, Y.; Li, Y.; Pei, H. The Impacts of Land Use Changes on Water Yield and Water Conservation Services in Zhangjiakou, Beijing’s Upstream Watershed, China. Sustainability 2023, 15, 11077. [Google Scholar] [CrossRef]
  11. Measho, S.; Chen, B.; Pellikka, P.; Trisurat, Y.; Guo, L.; Sun, S.; Zhang, H. Land Use/Land Cover Changes and Associated Impacts on Water Yield Availability and Variations in the Mereb-Gash River Basin in the Horn of Africa. J. Geophys. Res. Biogeosci. 2020, 125, e2020JG005632. [Google Scholar] [CrossRef]
  12. Li, M.Y.; Liang, D.; Xia, J.; Song, J.X.; Cheng, D.D.; Wu, J.T.; Cao, Y.L.; Sun, H.T.; Li, Q. Evaluation of water conservation function of Danjiang River Basin in Qinling Mountains, China based on InVEST model. J. Environ. Manag. 2021, 286, 12. [Google Scholar] [CrossRef] [PubMed]
  13. Woldesenbet, T.A.; Elagib, N.A.; Ribbe, L.; Heinrich, J. Hydrological responses to land use/cover changes in the source region of the Upper Blue Nile Basin, Ethiopia. Sci. Total Environ. 2017, 575, 724–741. [Google Scholar] [CrossRef]
  14. Pan, T.; Zuo, L.; Zhang, Z.; Zhao, X.; Sun, F.; Zhu, Z.; Liu, Y. Impact of Land Use Change on Water Conservation: A Case Study of Zhangjiakou in Yongding River. Sustainability 2020, 13, 22. [Google Scholar] [CrossRef]
  15. Jie, G.; Feng, L.; Hui, G.; Bin, Z.C.; Ling, Z.X. The impact of land-use change on water-related ecosystem services: A study of the Guishui River Basin, Beijing, China. J. Clean. Prod. 2016, 163, 148–155. [Google Scholar] [CrossRef]
  16. Daneshi, A.; Brouwer, R.; Najafinejad, A.; Panahi, M.; Zarandian, A.; Maghsood, F.F. Modelling the impacts of climate and land use change on water security in a semi-arid forested watershed using InVEST. J. Hydrol. 2021, 593, 18. [Google Scholar] [CrossRef]
  17. Wang, G.Q.; Yang, H.C.; Wang, L.J.; Xu, Z.X.; Xue, B.L. Using the SWAT model to assess impacts of land use changes on runoff generation in headwaters. Hydrol. Process. 2014, 28, 1032–1042. [Google Scholar] [CrossRef]
  18. Li, M.; Di, Z.H.; Yao, Y.J.; Ma, Q. Variations in water conservation function and attributions in the Three-River Source Region of the Qinghai-Tibet Plateau based on the SWAT model. Agric. For. Meteorol. 2024, 349, 109956. [Google Scholar] [CrossRef]
  19. Zuo, D.P.; Chen, G.; Wang, G.Q.; Xu, Z.X.; Han, Y.N.; Peng, D.Z.; Pang, B.; Abbaspour, K.C.; Yang, H. Assessment of changes in water conservation capacity under land degradation neutrality effects in a typical watershed of Yellow River Basin, China. Ecol. Indic. 2023, 148, 110145. [Google Scholar] [CrossRef]
  20. Balist, J.; Malekmohammadi, B.; Jafari, H.R.; Nohegar, A.; Geneletti, D. Detecting land use and climate impacts on water yield ecosystem service in arid and semi-arid areas. A study in Sirvan River Basin-Iran. Appl. Water Sci. 2022, 12, 4. [Google Scholar] [CrossRef]
  21. Kayitesi, N.M.; Guzha, A.C.; Tonini, M.; Mariethoz, G. Land use land cover change in the African Great Lakes Region: A spatial-temporal analysis and future predictions. Environ. Monit. Assess. 2024, 196, 852. [Google Scholar] [CrossRef]
  22. Radeloff, V.C.; Nelson, E.; Plantinga, A.J.; Lewis, D.J.; Helmers, D.; Lawler, J.J.; Withey, J.C.; Beaudry, F.; Martinuzzi, S.; Butsic, V.; et al. Economic-based projections of future land use in the conterminous United States under alternative policy scenarios. Ecol. Appl. 2012, 22, 1036–1049. [Google Scholar] [CrossRef] [PubMed]
  23. Liu, Y.C.; Jing, Y.D.; Han, S.M. Multi-scenario simulation of land use/land cover change and water yield evaluation coupled with the GMOP-PLUS-InVEST model: A case study of the Nansi Lake Basin in China. Ecol. Indic. 2023, 155, 11. [Google Scholar] [CrossRef]
  24. Liu, W.C.; Wu, J.H.; Fei, X.; Mu, D.W.; Zhang, P.B. Modeling the effects of land use/land cover changes on river runoff using SWAT models: A case study of the Danjiang River source area, China. Environ. Res. 2023, 242, 117810. [Google Scholar] [CrossRef]
  25. Matlhodi, B.; Kenabatho, P.K.; Parida, B.P.; Maphanyane, J.G. Analysis of the Future Land Use Land Cover Changes in the Gaborone Dam Catchment Using CA-Markov Model: Implications on Water Resources. Remote Sens. 2021, 13, 2427. [Google Scholar] [CrossRef]
  26. Wang, Q.Z.; Guan, Q.Y.; Sun, Y.F.; Du, Q.Q.; Xiao, X.; Luo, H.P.; Zhang, J.; Mi, J. Simulation of future land use/cover change (LUCC) in typical watersheds of arid regions under multiple scenarios. J. Environ. Manag. 2023, 335, 117543. [Google Scholar] [CrossRef]
  27. Liu, X.P.; Liang, X.; Li, X.; Xu, X.C.; Ou, J.P.; Chen, Y.M.; Li, S.Y.; Wang, S.J.; Pei, F.S. A future land use simulation model (FLUS) for simulating multiple land-use scenarios by coupling human and natural effects. Landsc. Urban Plan. 2017, 168, 94–116. [Google Scholar] [CrossRef]
  28. Qi, X.; Feng, K.; Sun, L.; Zhao, D.; Huang, X.; Zhang, D.; Liu, Z.; Baiocchi, G. Rising agricultural water scarcity in China is driven by expansion of irrigated cropland in water scarce regions. One Earth 2022, 5, 1139–1152. [Google Scholar] [CrossRef]
  29. Schmitt, R.; Rosa, L.; Daily, G. Global expansion of sustainable irrigation limited by water storage. Proc. Natl. Acad. Sci. USA 2022, 119, e2214291119. [Google Scholar] [CrossRef]
  30. Yang, D.W.; Yang, Y.T.; Jun, X. Hydrological cycle and water resources in a changing world: A review. Geogr. Sustain. 2021, 2, 115–122. [Google Scholar] [CrossRef]
  31. Cao, X.X.; Wang, H.J.; Zhang, B.; Liu, J.L.; Yang, J. Sustainable management of land use patterns and water allocation for coordinated multidimensional development. J. Clean. Prod. 2024, 457, 14. [Google Scholar] [CrossRef]
  32. Song, C.; Yan, J.J.; Sha, J.H.; He, G.Y.; Lin, X.X.; Ma, Y.F. Dynamic modeling application for simulating optimal policies on water conservation in Zhangjiakou City, China. J. Clean. Prod. 2018, 201, 111–122. [Google Scholar] [CrossRef]
  33. Wei, L.Y.; Mao, M.J.; Zhao, Y.X.; Wu, G.H.; Wang, H.B.; Li, M.H.; Liu, T.D.; Wei, Y.H.; Huang, S.R.; Huang, L.Y.; et al. Spatio-temporal characteristics and multi-scenario simulation analysis of ecosystem service value in coastal wetland: A case study of the coastal zone of Hainan Island, China. J. Environ. Manag. 2024, 368, 18. [Google Scholar] [CrossRef] [PubMed]
  34. Yang, A.M.; Zhu, L.; Chen, S.H.; Jin, H.; Xia, X.X. Geo-informatic spectrum analysis of land use change in the Manas River Basin, China during 1975–2015. J. Appl. Ecol. 2019, 30, 3863–3874. [Google Scholar] [CrossRef]
  35. Zhang, H.; Xu, E.; Zhu, H. An ecological-living-industrial land classification system and its spatial distribution in China. Resour. Sci. 2015, 37, 1332–1338. [Google Scholar]
  36. Jiang, X.T.; Zhai, S.Y.; Liu, H.; Chen, J.; Zhu, Y.Y.; Wang, Z. Multi-scenario simulation of production-living-ecological space and ecological effects based on shared socio-economic pathways in Zhengzhou, China. Ecol. Indic. 2022, 137, 16. [Google Scholar] [CrossRef]
  37. Cong, W.C.; Sun, X.Y.; Guo, H.; Shan, R.F. Comparison of the SWAT and InVEST models to determine hydrological ecosystem service spatial patterns, priorities and trade-offs in a complex basin. Ecol. Indic. 2020, 112, 13. [Google Scholar] [CrossRef]
  38. Zhang, L.; Hickel, K.; Dawes, W.R.; Chiew, F.H.S.; Western, A.W.; Briggs, P.R. A rational function approach for estimating mean annual evapotranspiration. Water Resour. Res. 2004, 40, 14. [Google Scholar] [CrossRef]
  39. Donohue, R.J.; Roderick, M.L.; McVicar, T.R. Roots, storms and soil pores: Incorporating key ecohydrological processes into Budyko’s hydrological model. J. Hydrol. 2012, 436, 35–50. [Google Scholar] [CrossRef]
  40. Xue, J.; Li, Z.X.; Feng, Q.; Gui, J.; Zhang, B.J. Spatiotemporal variations of water conservation and its influencing factors in ecological barrier region, Qinghai-Tibet Plateau. J. Hydrol.-Reg. Stud. 2022, 42, 17. [Google Scholar] [CrossRef]
  41. Wu, X.; Shi, W.; Guo, B.; Tao, F. Large spatial variations in the distributions of and factors affecting forest water retention capacity in China. Ecol. Indic. 2020, 113, 106152. [Google Scholar] [CrossRef]
  42. Bonnesoeur, V.; Locatelli, B.; Guariguata, M.R.; Ochoa-Tocachi, B.F.; Vanacker, V.; Mao, Z.; Stokes, A.; Mathez-Stiefel, S.-L. Impacts of forests and forestation on hydrological services in the Andes: A systematic review. For. Ecol. Manag. 2019, 433, 569–584. [Google Scholar] [CrossRef]
  43. Zou, J.L.; Zhang, Y.; Tobin, B.; Saunders, M.; Cacciotti, E.; Benanti, G.; Osborne, B. Contrasting effects of water deficits and rewetting on greenhouse gas emissions in two grassland and forest ecosystems. Agric. For. Meteorol. 2025, 362, 110396. [Google Scholar] [CrossRef]
  44. Sun, F.X.; Lyu, Y.H.; Fu, B.J.; Hu, J. Hydrological services by mountain ecosystems in Qilian Mountain of China: A review. Chin. Geogr. Sci. 2016, 26, 174–187. [Google Scholar] [CrossRef]
  45. Yan, X.; Cao, G.C.; Cao, S.K.; Yuan, J.; Zhao, M.L.; Tong, S.; Li, H.D. Spatiotemporal variations of water conservation and its influencing factors in the Qinghai Plateau, China. Ecol. Indic. 2023, 155, 13. [Google Scholar] [CrossRef]
  46. Hu, W.M.; Li, G.; Li, Z.N. Spatial and temporal evolution characteristics of the water conservation function and its driving factors in regional lake wetlands-Two types of homogeneous lakes as examples. Ecol. Indic. 2021, 130, 14. [Google Scholar] [CrossRef]
  47. Rivas-Tabares, D.; Tarquis, A.M.; De Miguel, A.; Gobin, A.; Willaarts, B. Enhancing LULC scenarios impact assessment in hydrological dynamics using participatory mapping protocols in semiarid regions. Sci. Total Environ. 2022, 803, 149906. [Google Scholar] [CrossRef]
  48. Chen, J.Z.; Kasimu, A.; Reheman, R.; Wei, B.H.; Han, F.Q.; Zhang, Y. Temporal and spatial variation and prediction of water yield and water conservation in the Bosten Lake Basin based on the PLUS-InVEST model. J. Arid Land 2024, 16, 852–874. [Google Scholar] [CrossRef]
  49. Chen, G.; Zuo, D.; Xu, Z.; Wang, G.; Han, Y.; Peng, D.; Pang, B.; Abbaspour, K.C.; Yang, H. Changes in water conservation and possible causes in the Yellow River Basin of China during the recent four decades. J. Hydrol. 2024, 637, 131314. [Google Scholar] [CrossRef]
  50. Yang, J.Y.; Shu, Z.Y.; Yang, F.; Fu, D.L.; Ma, L.; Zhang, L.W.; Xue, Y.Z. Temporal and spatial variation characteristics of water conservationfunction of Upper Danjiang River Basin in Qinling Mountains and itsinfluencing factors. Coal Geol. Explor. 2023, 51, 133–145. [Google Scholar] [CrossRef]
  51. Liu, S.; Dong, Y.; Sun, Y.; Wang, Q. Multi-Scale Ecological Restoration Strategies to Enhance Water Conservation in Ruoergai on the Qinghai-Tibet Plateau. Plants 2025, 14, 1085. [Google Scholar] [CrossRef]
  52. Lemann, T.; Roth, V.; Zeleke, G.; Subhatu, A.; Kassawmar, T.; Hurni, H. Spatial and Temporal Variability in Hydrological Responses of the Upper Blue Nile basin, Ethiopia. Water 2019, 11, 21. [Google Scholar] [CrossRef]
  53. Bai, Y.; Ochuodho, T.O.; Yang, J. Impact of land use and climate change on water-related ecosystem services in Kentucky, USA. Ecol. Indic. 2019, 102, 51–64. [Google Scholar] [CrossRef]
  54. Wen, X.; Shao, H.Y.; Wang, Y.; Lv, L.F.; Xian, W.; Shao, Q.F.; Shu, Y.; Yin, Z.Q.; Liu, S.H.; Qi, J.G. Assessment of the Spatiotemporal Impact of Water Conservation on the Qinghai-Tibet Plateau. Remote Sens. 2023, 15, 22. [Google Scholar] [CrossRef]
  55. Gong, L.; Zhang, X.; Pan, G.Y.; Zhao, J.Y.; Zhao, Y. Hydrological responses to co-impacts of climate change and land use/cover change based on CMIP6 in the Ganjiang River, Poyang Lake basin. Anthropocene 2023, 41, 100368. [Google Scholar] [CrossRef]
  56. Wu, Y.F.; Sun, J.X.; Hu, B.T.; Xu, Y.J.; Rousseau, A.N.; Zhang, G.X. Can the combining of wetlands with reservoir operation reduce the risk of future floods and droughts? Hydrol. Earth Syst. Sci. 2023, 27, 2725–2745. [Google Scholar] [CrossRef]
  57. Muhammad, A.H.; Muhammad, W.; Muhammad, A.; Muhammad, A.U.R.T.; Xiao, J.; Yang, T.; Shi, P. An integrated land change modeler and distributed hydrological model approach for quantifying future urban runoff dynamics. Sci. China-Earth Sci. 2024, 67, 3288–3301. [Google Scholar] [CrossRef]
  58. Li, S.; Yang, H.; Lacayo, M.; Liu, J.; Lei, G. Impacts of Land-Use and Land-Cover Changes on Water Yield: A Case Study in Jing-Jin-Ji, China. Sustainability 2018, 10, 960. [Google Scholar] [CrossRef]
  59. Woyessa, Y.E.; Welderufael, W.A. Impact of land-use change on catchment water balance: A case study in the central region of South Africa. Geosci. Lett. 2021, 8, 34. [Google Scholar] [CrossRef]
  60. Demisse, M.; Hishe, S.; Getahun, K. LULC dynamics and the effects of urban green spaces in cooling and mitigating micro-climate change and urban heat island effects: A case study in Addis Ababa city, Ethiopia. J. Water Clim. Change 2024, 15, 3033–3055. [Google Scholar] [CrossRef]
  61. Karthikeyan, L.; Chawla, I.; Mishra, A.K. A review of remote sensing applications in agriculture for food security: Crop growth and yield, irrigation, and crop losses. J. Hydrol. 2020, 586, 124905. [Google Scholar] [CrossRef]
  62. Zhou, L.Y.; Cui, W.L.; Yang, F. Spatiotemporal variations and driving forces analysis of ecosystem water conservation in coastal areas of China. Ecol. Indic. 2024, 162, 112019. [Google Scholar] [CrossRef]
  63. Zhang, S.Q.; Yang, P.; Xia, J.; Wang, W.Y.; Cai, W.; Chen, N.C.; Hu, S.; Luo, X.G.; Li, J.; Zhan, C.S. Land use/land cover prediction and analysis of the middle reaches of the Yangtze River under different scenarios. Sci. Total Environ. 2022, 833, 155238. [Google Scholar] [CrossRef] [PubMed]
  64. Wang, M.Y.; Qi, S.; Guo, Y.R.; Zhang, P.; Lai, J.J.; Zhang, L.; Ma, L.X.; Liu, S.D. Driving mechanism of water yield in the ecological and water conservation zone of east Tibet and west Sichuan province. ACTA Ecol. Sin. 2024, 44, 9520–9534. [Google Scholar] [CrossRef]
  65. Zhang, L.Q.; Li, J.X. Identifying priority areas for biodiversity conservation based on Marxan and InVEST model. Landsc. Ecol. 2022, 37, 3043–3058. [Google Scholar] [CrossRef]
  66. Wu, C.X.; Gao, P.; Xu, R.R.; Mu, X.M.; Sun, W.Y. Influence of landscape pattern changes on water conservation capacity: A case study in an arid/semiarid region of China. Ecol. Indic. 2024, 163, 14. [Google Scholar] [CrossRef]
  67. Chang, S.; Shan, L.S.; Song, Y.Q. Response of Ecosystem Service Value to Land Use Change in Zhangjiakou. Acta Sci. Nat. Univ. Pekin. 2015, 51, 1149–1156. [Google Scholar] [CrossRef]
  68. Xie, G.D.; Zhang, C.X.; Zhen, L.; Zhang, L.M. Dynamic changes in the value of China’s ecosystem services. Ecosyst. Serv. 2017, 26, 146–154. [Google Scholar] [CrossRef]
Figure 1. Geographical location of the Bashang region in Zhangjiakou city.
Agriculture 15 01008 g001
Figure 2. Distribution of land use in Zhangjiakou Bashang region in 1990, 2005, and 2020.
Agriculture 15 01008 g002
Figure 3. Distribution of soil types in Zhangjiakou Bashang region.
Agriculture 15 01008 g003
Figure 4. The influence of the Zhang coefficient on simulated water yield: fitting relationships and sensitivity analysis.
Agriculture 15 01008 g004
Figure 5. Conceptual framework of the FLUS-INVEST model.
Agriculture 15 01008 g005
Figure 6. Distribution of transfers by land use type, 1990–2020.
Agriculture 15 01008 g006
Figure 7. 2035 land-use change for the four scenarios for Bashang region.
Agriculture 15 01008 g007
Figure 8. Percentage of different scenarios of LULC in 2020 and 2035.
Agriculture 15 01008 g008
Figure 9. Status of water yield and LULC in the sub-basin in 2020.
Agriculture 15 01008 g009
Figure 10. Current spatial distribution of water conservation capacity and drivers in 2020.
Agriculture 15 01008 g010
Figure 11. Correlation analysis of drivers of water conservation capacity.
Agriculture 15 01008 g011
Figure 12. Spatial variation in WY across the four scenarios in 2035.
Agriculture 15 01008 g012
Figure 13. Spatial distribution of WCC for the different scenarios in 2035.
Agriculture 15 01008 g013
Figure 14. The average WCC across different land-use types for the different scenarios in 2035.
Agriculture 15 01008 g014
Table 1. Sources of data acquisition.
Data TypeData NameData Source
LULC dataLULC from 1990 to 2020Resources and environment science data platform https://www.resdc.cn/
Natural environmentElevationGeospatial data cloud (https://www.gscloud.cn)
SlopeExtraction from elevation
Aspect
Average monthly temperatureNational Tibetan Plateau Data Center
Average monthly precipitation
Potential evapotranspiration
Percentages of sand, clay, silt and organic carbonFood and Agriculture Organization of the United Nations (FAO, https://www.fao.org/)
Soil TypeResources and environment science data platform (https://www.resdc.cn/)
Accessibility factorsDistance from mainGeospatial data cloud (https://www.gscloud.cn)
road, distance from
main railway
Socio-economicPopulation density,Resources and environment science data platform
(https://www.resdc.cn/)
gross domestic product
(GDP)
Table 2. Physiological coefficients for different land use types.
LULCLULC_vegRoot_depthKc
Irrigated land13000.954
Rain-fed land13000.865
Forest135001.009
Grassland15000.8
Water area001.05
Built-up land010.2
Unused land000.6
Table 3. Land-use transfers as a percentage, 1990–2020.
Geoinformation Tupu TypeArea (km2)ProportionCharacteristics
The stable type6023.972743.78%The LULC remained unchanged
from 1990–2020
The continuous-change type1334.34369.70%The LULC changed in 1990–2005/2005–2020
without repeated types
The repeated-change type943.0296.85%The LULC changed in the early stages as opposed to the later stages
The later-change type1628.158511.83%The LULC changed in the period of 2005–2020
The early-change type3828.907827.83%The LULC changed from 1990 to 2005 but did not change from 2005 to 2020
Table 4. Number of actual and simulated land use pixels and classification accuracy in 2020.
LULCProducer’s AccuracyUser’s AccuracyOverall AccuracyKappa
Irrgiated land85.69%86.29%86.93%0.81
Rain-fed land85.50%85.38%
Forest84.50%84.60%
Grassland90.93%90.92%
Water body72.45%71.13%
Built-up75.75%75.15%
Unused land46.00%46.35%
Table 5. LULC changes under different scenarios from 2020 to 2035.
ScenariosLULC Type(km2)
Irrigated LandRain-Fed LandForestGrasslandWater BodyBuilt-UpUnused Land
2020867.08 4035.74 4033.58 4435.96 165.55 191.45 31.69
2035 NDS1070.39 4087.93 3859.15 4340.97 147.29 225.95 29.37
2035 APS1653.80 4937.45 3226.86 3548.76 155.55 215.95 22.68
2035 EPS694.67 3431.97 4558.26 4651.79 206.69203.80 13.87
2035 LPS0.00 4551.27 3157.81 5635.96 206.73 205.04 4.24
2020–2035 APS786.72 901.71 −806.72 −887.20 −10.00 24.50 −9.01
2020–2035 EPS−172.41 −603.77 524.68 215.83 41.14 12.35 −17.82
2020–2035 NDS203.31 52.19 −174.43 −94.99 −18.26 34.50 −2.32
2020–2035 LPS−867.08 515.53 −875.77 1200.00 41.18 13.59 −27.45
2020–2035 NDS Percentage23.45%1.29%−4.32%−2.14%−11.03%18.02%−7.32%
2020–2035 APS Percentage90.73%22.34%−20.00%−20.00%−6.04%12.80%−28.43%
2020–2035 EPS Percentage−19.88%−14.96%13.01%4.87%24.85%6.45%−56.23%
2020–2035 LPS Percentage−100.00%12.77%−21.71%27.00%24.87%7.10%−86.62%
Table 6. Total water yield, average water yield, and water conservation capacity for different scenarios in 2035.
ScenarioWater YieldWater Conservation Capacity
Mean (mm pixel−1)Total (106 m3)Mean (mm pixel−1)Total (106 m3)
202032.720446.0633.82027.027
2035 NDS33.362454.8083.80126.556
2035 APS32.885448.3173.41824.031
2035 EPS32.714446.3283.99028.464
2035 LPS35.066478.0923.87527.701
Disclaimer/Publisher’s Note: The statements, opinions and data contained in all publications are solely those of the individual author(s) and contributor(s) and not of MDPI and/or the editor(s). MDPI and/or the editor(s) disclaim responsibility for any injury to people or property resulting from any ideas, methods, instructions or products referred to in the content.

