Abstract
Watermelon is a widely cultivated fruit and vegetable that is native to Africa and has become one of the world’s important summer fruits. Watermelon seed vigor has a critical impact on watermelon planting and yield, and seed water content is a key factor in maintaining vigor during seed storage and germination. In this study, reflectance and transmittance spectral data from hyperspectral imaging were fused to improve the detection accuracy of moisture content in watermelon seeds. First, watermelon seed samples with different water content gradients were prepared by dividing all 456 selected watermelon seeds into 10 groups and drying them in a drying oven at 60 °C for 0, 3, 5, 10, 15, 20, 25, 30, 40, and 50 min. Reflectance and transmission spectra of 456 watermelon seeds were collected by a hyperspectral imaging system, and the single spectral data were subsequently used to build PLSR and LSSVR models for quantitative analysis of watermelon seed moisture content. Model performance is enhanced by Competitive Adaptive Reweighted Sampling (CARS), Unrelated Variable Elimination (UVE), and primary and intermediate data fusion methods. Primary data fusion improves model predictions compared to single models based on reflectance and transmission spectra. The intermediate data fusion of the feature spectral data of reflectance and transmittance selected by the CARS algorithm improves the prediction effect of the model more obviously, in which the model with the best prediction accuracy is Raw-CRAS-LSSVR, whose and RMSEP are 0.9149 and 0.0144, respectively, which improves the prediction effect of the model built by a single full-spectrum datum by 5.72%. This study demonstrates that hyperspectral reflectance and transmission imaging techniques combined with data fusion can effectively detect watermelon seed moisture content quickly and with high accuracy.
1. Introduction
Watermelon is native to South Africa, and is a fruit that is consumed daily for its nutritious properties and sweet and crispy flavor, as well as other characteristics that people love. Watermelon pulp is rich in nutrients such as protein, carbohydrates, dietary fiber, potassium, phosphorus, calcium, iron, and sodium. The seeds, on the other hand, contain aromatic oils and can be used for fried food [1]. The moisture content of watermelon seeds is a critical parameter for evaluating seed quality, as it directly influences both seed yield and overall quality [2]. When the water content is too high, seed respiration is increased and microorganisms are allowed to multiply, causing mold to develop and affecting germination. When the water content is too low, it causes the cells to die from lack of water and the seeds become inactive [3]. Only a certain range of moisture content is favorable for seed storage and germination rate; excessive or insufficient moisture content can impair the metabolic activity and viability of the seed [4]. Hence, accurate moisture content measurement is crucial for ensuring the optimal storage conditions and maximizing the germination potential of watermelon seeds.
Currently, there are many researchers using various chemical and physical methods for detecting the moisture content of watermelon seeds, including Karl Fischer titration and weight-drying. Karl Fischer titration determines the moisture content of a sample by reacting iodine and sulfur dioxide with water, depending on the amount of iodine consumed by the water [5]. The weight-drying method involves placing the seeds in a temperature-controlled drying oven, waiting for the weight of the seeds to stop changing before removing the seeds, and then determining the moisture content based on the weight of the seeds lost [6]. Although these methods effectively assess the hydration level of watermelon seeds, they can destroy the seed activity, which can lead to complicated and time-consuming work if the watermelon seeds are in large batches. In recent years, scholars have applied a variety of non-destructive testing techniques for seed quality assessment, including methods such as near-infrared spectroscopic analysis, thermography, and X-ray inspection [7]. Near-infrared (NIR) spectroscopy surpasses other optical sensing techniques in both cost-effectiveness and detection speed, making it a widely adopted method for assessing seed quality, such as by detecting moisture and protein in soybean [8], the vigor of maize seeds [9], and the moisture content of cherry seeds [10], among others. However, conventional NIR spectroscopy methods are limited to acquiring spectral data from a single point on the surface of the sample, and cannot obtain comprehensive information on seed quality.
In order to solve the limitations of the above detection techniques, this study proposes to detect the water content of watermelon seeds by a hyperspectral non-destructive testing technique. Hyperspectral imaging technology utilizes a hyperspectral imager to capture the spatial imagery of the target object across various spectral bands. Depending on the specific imaging modalities employed, it can be divided into hyperspectral reflectance imaging and transmittance imaging. Zhang et al. [11] used near-infrared spectroscopy and hyperspectral reflectance imaging to predict the moisture content of maize seeds. Comparative analyses showed that the PLSR model using hyperspectral reflectance data was superior to the PLSR model based on near-infrared spectroscopy. Sun et al. [12] used hyperspectral reflection imaging (HRI) to assess the moisture content of barley seeds. SVR and PLSR models were constructed based on full-band spectral and feature wavelength spectral data, respectively. The results showed that the SVR model constructed using the feature wavelengths selected by the successive projection algorithm (SPA) yielded the most accurate results, with a coefficient of determination of prediction () of 0.883 and a root mean square error of prediction (RMSEP) of 0.0198%. Lu et al. [13] used hyperspectral reflection imaging combined with a support vector regression (SVR) algorithm to predict the moisture content of rice seeds. The results showed that the SVR model optimized using the Simulated Annealing Genetic Algorithm (SAGA) performed best, with a coefficient of determination of prediction () of 0.8892 and root mean square error of prediction (RMSEP) of 0.0296 after clustering feature wavelengths selected by the successive projection algorithm. Although hyperspectral reflection technology shows great potential in assessing seed moisture content, the reflection spectral data can only provide surface information on the samples, and the accuracy of the model’s prediction of moisture content needs to be improved. To address the limitations of single reflection spectral data, hyperspectral reflection combining transmission imaging techniques and data fusion methods is proposed to improve the accuracy and robustness of watermelon seed moisture content prediction in this study.
In summary, the transmission spectra were added to the reflection spectra, and data fusion of both reflection and transmission spectra was conducted to identify the most effective data type for accurately predicting the hydration level of watermelon seeds in this study. The specific research objectives are as follows: (1) PLSR and LSSVR models were developed to quantify the moisture content of watermelon seeds based on various preprocessed reflectance and transmission spectral data, respectively; (2) the various preprocessed full-band reflectance and transmission spectral data were combined and modeled again for PLSR and LSSVR; (3) critical wavelengths of reflectance and transmission spectra were extracted by the CARS and UVE algorithms to enhance the prediction of the watermelon seed moisture content model using the intermediate fusion strategy.
2. Materials and Methods
2.1. Sample Preparation
The experimental sample used in this study was a sample of watermelon seeds. Watermelons were purchased as seed melons from Huishi Agricultural Chain Limited Liability Company in Gansu Province, China. The watermelon was cut to remove pulp and impurities and remove the seeds. The watermelon seeds were clean. Deformities, insects, and broken grains were removed and the watermelon seeds with full grains were selected. clean watermelon seeds were dried in a ventilated area until there was no water on the surface of the seeds. To increase the gradient of the watermelon seed moisture content, all the 456 watermelon seeds selected were divided into 10 groups, and the samples were subsequently placed in a drying oven at 60 °C and removed in batches after 0, 3, 5, 10, 15, 20, 25, 30, 40, and 50 min. We waited for the watermelon seed temperature to decrease to room temperature before subsequent spectral acquisition [14].
2.2. Hyperspectral Data Acquisition
In this experiment, a Gaia hyperspectral imaging system with a spectral wavelength range of 390.2–1014.0 nm was used to acquire data from watermelon seed samples. A schematic diagram of the hyperspectral imaging setup is shown in Figure 1. The system is composed of a Lenovo Co-45 computer (Wuhan, China), an ImSpector V10E spectrometer (Specim, Finland), a C8484-05G camera (Hamamatsu, Japan), an imaging spectrometer, four halogen lamps, a transmitted light source, and an electrically controlled displacement stage. The system was operated using SpectralView software (https://headwallphotonics.com/products/software/hyperspec-iii-and-spectralview/ (accessed on 27 April 2025)) (Shanghai, China), which was used to configure the instrument parameters. The hyperspectral instrument needs to be warmed up for 30 min. Subsequently, when collecting the reflection images of watermelon seeds, the exposure time of the camera was set to 6 ms. When collecting the transmission images, the exposure time of the camera was set to 3 ms. The forward speed of the displacement platform was set to 1.5 cm/s, and the backward speed was set to 3 cm/s. After the parameters were set each time to collect a sample of watermelon seeds, the watermelon seeds were placed on the displacement platform, driven by the platform to move to the sampling position, and put through the computer software processing to complete the image acquisition. The reflection and transmission spectral data of 176 bands in the wavelength range of 390.2 to 1014.0 nm were collected in this experiment.
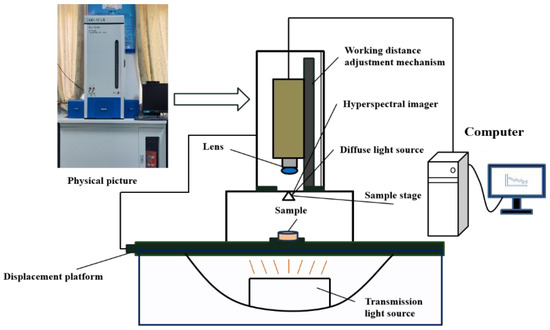
Figure 1.
Schematic diagram of the hyperspectral imaging system.
2.3. Spectral Extraction
In order to correct errors caused by dark current effects and ambient light disturbances in Charge-Coupled Device (CCD) cameras, the original image needs to be calibrated for black and white balance. First, the hyperspectral system parameters were adjusted to the same settings as when the samples were collected, and the lens cover was put on to obtain a dark reference image; subsequently, the lens cover was removed, and a polytetrafluoroethylene white plate image was collected as a white reference image [15]. Finally, the original images of the watermelon seed samples were corrected using Equation (1) and the acquired black and white reference images.
In Equation (1), is the initial image; is a full white reference image; is a full dark reference image; and I is the corrected image of the watermelon seed sample. The corrected hyperspectral images were processed for spectral extraction using ENVI 5.3 software. The center of the watermelon seeds was selected as the region of interest (ROI), which corresponds to a rectangular area approximately 50 pixels in size. The average spectra of the ROI were extracted from the reflection and transmission images as the reflectance and transmittance spectra of watermelon seeds, which are used for detecting the moisture content of watermelon seeds.
2.4. Moisture Measurement
For moisture measurement of watermelon seeds using the drying method, firstly, the watermelon seeds were weighed using an electronic analyzing balance of model FA2004B, and the weight of each group of watermelon seeds was recorded for the first drying according to the respective drying time, and it was taken as the weight of the watermelon seeds before drying. Subsequently, after reflection and transmission images of the watermelon seeds were collected, all the watermelon seeds were again dried in a drying oven until the weight did not change, and the weight of the watermelon seeds at this point was measured as the weight after drying [16]. The water content was calculated according to the following Equation (2).
where is the water content of the watermelon seeds, M1 is the weight of a single watermelon seed before drying, and M2 is the weight of a single watermelon seed after drying. The Kennard–Stone (K-S) algorithm was applied to divide the samples into a modeling set (342 grains) and a prediction set (114 grains) in a ratio of 3:1. As shown in Table 1, the modeling set (35.91–11.49%) and the prediction set (33.69–12.90%) have different ranges of water content, and the modeling set has a wider range of watermelon seed water content compared with the prediction set. This difference contributes to the robustness and generalization of the model.

Table 1.
Water content of watermelon seeds in modeling and prediction sets.
2.5. Spectral Preprocessing
In spectral analysis, raw spectral data often contain multiple interferences, such as noise, background signals, and other non-target information. These interfering factors reduce the learning efficiency and predictive performance of the model; therefore, preprocessing of raw data is a critical step to improve the accuracy and robustness of subsequent data analysis and modeling [17]. In this study, three widely adopted data preprocessing techniques were employed—the Baseline correction (Baseline), De-Trending (DT), and Standard Normal Variate (SNV) techniques—and the impact of the selected preprocessing methods on the predictive performance of the model was evaluated to identify the most appropriate preprocessing approach for watermelon seed moisture content detection.
2.6. Screening of Characteristic Wavelengths
In the case of a large number of bands, there are some bands that are highly correlated with each other or even redundant. Redundant bands not only increase the computational load of the model, but also may lead to bias in the training and prediction phases of the model, while weakening the stability of the model to cope with changes in complex data. Therefore, the band selection should be performed on spectral data to extract a subset of informative and representative bands for subsequent analysis. In this study, the Uninformative Variable Elimination (UVE) algorithm and the Competitive Adaptive Reweighted Sampling (CARS) algorithm were used to implement the data downscaling process, respectively. The CARS algorithm is used to select the variables with larger absolute values of the regression coefficients from the Partial Least Squares (PLS) model and excludes those with smaller weights through the CARS technique. Subsequently, the algorithm minimizes the RMSECV through interactive validation to filter out the optimal subset of variables, reliably identify characteristic wavelength information that accurately reflects changes in the detected variables, and have strong predictive ability from the raw spectral data [18]. The UVE algorithm was used by calculating the correlation between each frequency band and the target variable; the most relevant frequency bands to the target variable were retained, and those with weak or no correlation were excluded [19].
2.7. Data Fusion
Data fusion involves the integration, correlation, and processing of information from multiple data sources to overcome the limitations of relying on a single data source, and the fused data can provide more complete and accurate information characterization than a single piece of information. In this study, the reflection spectra and transmission spectra collected through hyperspectral imaging are spliced, and the fused dataset contains information represented by both spectra. Different datasets train different models with different effects, and the features of the fused spectra are used as inputs to the model to improve the model prediction accuracy [14]. As shown in Figure 2, two data fusion methods are used in this study for reflection and transmission spectral data, namely low-level data fusion and mid-level data fusion to improve the prediction of watermelon seed moisture content.
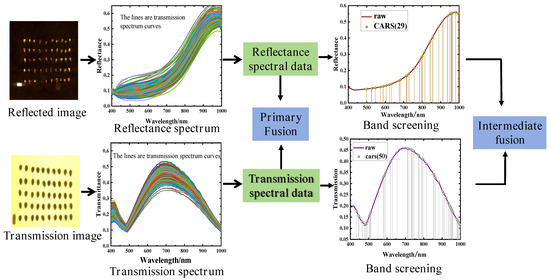
Figure 2.
Flowchart of data fusion.
2.8. Modeling and Evaluation
In this study, the Kennard–Stone (K-S) algorithm was used to classify the spectral data of 456 watermelon seeds (modeling set: prediction set = 3:1), with 342 modeling sets and 114 prediction sets, to build the models of PLSR and LSSVR. In the PLSR model building process, the appropriate number of components was chosen to maximize the variability in the original data and avoid overfitting, and PLSR was able to effectively capture the information in the spectral data related to watermelon seed classification by mapping the spectral data to a new latent variable space, thus building a predictive model [20]. The LSSVR model utilizes a nonlinear radial basis function and optimizes the regularization and kernel parameters through grid search. The advantage of LSSVR over traditional SVR algorithms lies in the simplification of the training process, which can be solved by a system of linear equations, reducing computational time and complexity [21]. The evaluation of model performance is mainly viewed through the samples in the prediction set, and the evaluation metrics include root mean square error prediction (RMSEP) and the correlation coefficient ().
3. Results and Discussion
3.1. Spectral Analysis
The spectral curves of reflectance and transmittance extracted for all watermelon seed samples with different water contents are shown in Figure 3a,b. In spectral analysis, if the measured objects exhibit similar spectral characteristics, it indicates that they have a high degree of similarity in chemical composition. From Figure 3a,b, it can be seen that the reflectance and transmission spectra of all watermelon seed samples show a similar trend, but the magnitudes of the reflectance and transmittance values of watermelon seeds with different moisture contents are not the same. As shown in Figure 3c, the average reflection spectrum has an absorption peak around 990 nm, which may be due to the C-H stretching vibration, C=H absorption vibration, O-H stretching vibration, and OH-O bending vibration [22]. As shown in Figure 3d, the transmission spectrum has an absorption valley at around 475 nm, which arises from a cause that may be related to chlorophyll IIa, chlorophyll IIb, or carotenoids [14]. The standard deviation of the transmission spectra was larger in the range of 600–850 nm because the water molecules showed strong absorbance in this range, and with the change in water content, the absorption degree of water molecules to the transmitted light of different wavelengths changed, which led to the larger fluctuation of the transmission spectra in this range. In summary, the difference between reflectance and transmittance is beneficial to the modeling of watermelon seed water content.
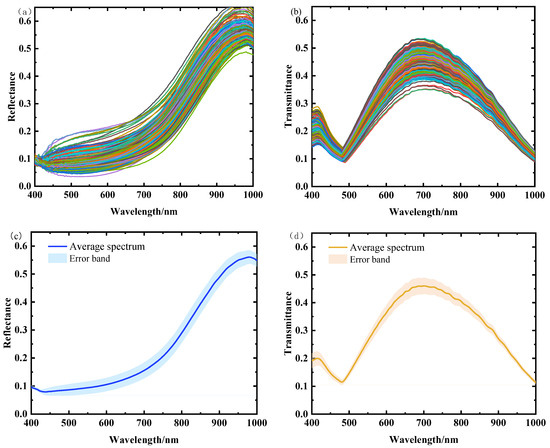
Figure 3.
(a) Reflectance spectra of all samples; (b) transmission spectra of all samples; (c) average reflection spectra; (d) average transmission spectra.
3.2. Modeling and Analysis
3.2.1. PLSR and LSSVR Modeling Based on Reflection Spectral Data
A total of 176 wavelength reflectance spectral data based on raw spectra and Baseline, DT, and SNV preprocessing were used to develop PLSR and LSSVR models to predict the water content of watermelon seeds. The corresponding prediction results of these models are listed in Table 2. The analysis of the prediction results of the established models for water content in watermelon seeds revealed that among the PLSR and LSSVR models based on the reflection spectral data, the DT-LSSVR model was found to be more predictive, with an of 0.6182 and an RMSEP of 0.0310. The results were better than those obtained using the hyperspectral technique to detect the moisture content of hairy beans [23]; the and RMSEP for the optimal model for predicting the moisture content of hairy beans using reflectance spectral data were 0.5127 and 0.2286, respectively. The PLSR and LSSVR models built from reflectance spectral data were less effective in predicting seed moisture content. The poor results of the model based on reflection spectroscopy for predicting seed moisture content might be attributed to the fact that reflection spectroscopy mainly reflects the surface information of the samples, and surface contamination, impurities, or changes in surface smoothness might interfere with the reflection spectroscopy signals, leading to inaccurate predictions.
Table 2.
Predictions of PLSR and LSSVR models based on reflection spectral data.
3.2.2. PLSR and LSSVR Modeling Based on Transmission Spectral Data
The PLSR and LSSVR models were based on the original spectra and three preprocessed transmission spectral data at 176 wavelengths, and the prediction outcomes are presented in Table 3. Based on the modeling outcomes, it is evident that the LSSVR model constructed using the original spectra and the three preprocessed transmission spectral data is better than the PLSR model as a whole, within which the Baseline–LSSVR model performs the best, with an of 0.8788 and an RMSEP of 0.0172. It can be found by comparing the data in Table 2 and Table 3 that the prediction results of the PLSR and LSSVR models are significantly better than those of the models constructed based on reflection spectral data. The reason for this finding could lie in the enhanced capacity of transmission spectra to vividly illustrate the internal configuration and chemical constitution of materials, especially in terms of moisture content. Absorption peaks of moisture are more pronounced in transmission spectra, with higher signal intensity and characterization. As a result, transmission spectra tend to capture the absorption characteristics of moisture or other substances better than reflection spectra, thereby improving prediction accuracy [24].
Table 3.
Predictions of PLSR and LSSVR models based on transmission spectral data.
3.3. PLSR and LSSVR Modeling Based on Low-Level Data Fusion
In the process of low-level data combination, by directly combining the reflection spectral information and the transmission spectral information, although more valuable feature variables are introduced to the model, it also leads to an increase in the complexity of the input data and introduces some invalid information and noise variables [25]. The details are displayed in Table 4; the best prediction model for PLSR and LSSVR based on low-level data fusion is Baseline–LSSVR, with an and RMSEP of 0.8875 and 0.0166, respectively. The results show that the performance of the models based on the fusion of low-level data is better than that based on single reflection and transmission spectral data.
Table 4.
Predictions of PLSR and LSSVR models based on low-level data fusion.
3.4. Characteristic Band Selection
Through band screening, redundant or irrelevant bands can be removed to avoid overfitting of information to elevate the prediction accuracy of the model and decrease the computational burden [26]. In order to improve the running speed of the model, CARS and UVE algorithms are utilized in this study for feature band screening of reflection and transmission spectra after preprocessing by the Baseline correction, De-Trending, and Standard Normal Variate (SNV) algorithms, respectively. The original reflection spectrum is used as an example to introduce the principle of CARS and UVE screening bands. The process of screening variables by the CARS algorithm is shown in Figure 4. The CARS algorithm is sampled 100 times, during which the number of variables is gradually reduced, with the rate of reduction changing exponentially from fast to slow. The characteristic wavelength is determined by the minimum RMSECV during the sampling period, reaching a minimum at 41 samples, when a minimum value of 0.0332 is obtained, followed by a rapid increase.
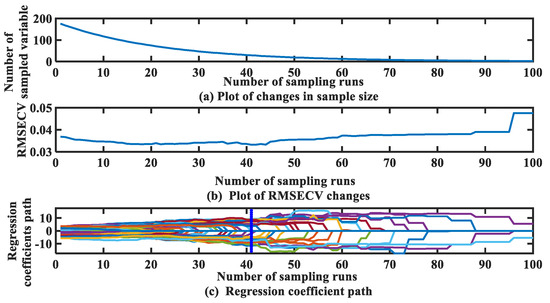
Figure 4.
Feature wavelength selection process based on the CARS algorithm.
The process by which the UVE algorithm screens feature wavelengths is depicted in Figure 5. The left side of the blue line is the 176 spectral variables that need to be screened, and the dashed line is the upper and lower boundaries of the noise domain when the threshold value for screening spectral variables is 38.08. The spectral variables within the blue dashed area are discarded, and the remaining spectral variables outside the dashed area are the selected feature wavelengths.
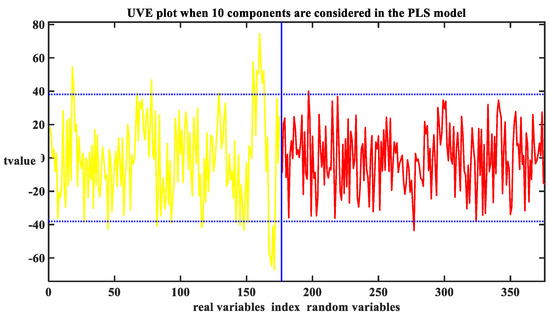
Figure 5.
UVE algorithm feature wavelength screening process.
Table 5 shows the quantity of feature wavelengths chosen by the CARS and UVE algorithms, with different preprocessing algorithms providing different spectral features. The number of spectral feature wavelength points selected by both the CARS and UVE algorithms is less than the quantity of full-spectrum wavelength points. The quantity of selected feature wavelengths accounted for 9.09% (T-SNV-UVE) to 40.9% (R-SNV-CARS) of the full wavelengths, which means it was able to effectively quicken the running pace of the model. Furthermore, it can substantially elevate the model’s generalization prowess and prediction fidelity.
Table 5.
Number of spectral feature wavelength points screened based on CARS and UVE algorithms.
The results of the CARS and UVE algorithms for picking characteristic wavelengths are analyzed using raw reflection and transmission spectra, respectively. As shown in Figure 6, Figure 6a shows that 29 characteristic wavelength points, accounting for 16.47% of the total wavelength, are screened by the CARS algorithm for the R spectrum; Figure 6b shows that 50 characteristic wavelength points, accounting for 28.41% of the total wavelength, are screened by the CARS algorithm for the T spectrum; Figure 6c shows that 28 characteristic wavelength points, accounting for 15.91% of the total wavelength, are screened by the UVE algorithm for the R spectrum; and Figure 6d shows the T spectrum screened by the UVE algorithm with 66 characteristic wavelength points, accounting for 37.50% of the total wavelength.
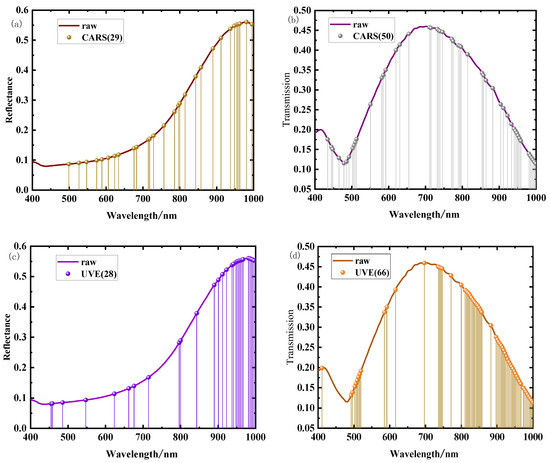
Figure 6.
CARS algorithm’s process of selection of variables. (a) Reflection spectral–CARS algorithm, R-CARS; (b) transmission spectral–CARS algorithm, T-CARS; (c) reflection spectral–UVE algorithm, R-UVE; and (d) transmission spectral–UVE algorithm, T-UVE.
3.5. Water Content Prediction Model for Feature Spectra
3.5.1. Prediction Model for Characteristic Wavelengths Based on Reflection Spectra
Reflection spectra and three of their preprocessed versions are analyzed in bands using the CARS and UVE algorithms. This reduction in the number of spectra accelerates the model’s execution, and the identified characteristic wavelengths are utilized to construct the PLSR and LSSVR models. As shown in Table 6, the PLSR and LSSVR models constructed using the CARS algorithm that are utilized to identify and select the characteristic wavelengths from the reflection spectra show superior prediction performance compared with the corresponding full-spectrum models. Of these, the Baseline–PLSR model shows outstanding prediction results, coupled with an of 0.6683 and RMSEP of 0.0290, respectively, which are better than those of the best model derived from the full spectrum. The prediction is improved by 8.10%.
Table 6.
Reflection spectral model predictions after selection based on the CARS algorithm.
As shown in Table 7, for the PLSR and LSSVR prediction models established for the reflection spectra and their three preprocessed spectra based on the feature wavelengths selected by UVE, except for the RAW-LSSVR model with a 1.4% enhancement, the prediction effect of the rest of all the models decreased to a certain extent, which may be attributed to the fact that the UVE algorithm not only removes irrelevant variables but also excludes some of the relevant information, resulting in a decrease in model prediction ability. The optimal prediction model is the DT-LSSVR model, with an and RMSEP of 0.5953 and 0.0319, respectively, which is a 3.70% decrease in prediction compared to the optimal model built from reflection spectra of the full spectrum.
Table 7.
Reflection spectral model prediction results after selection based on UVE algorithm.
3.5.2. Predictive Modeling of Characteristic Wavelengths in Transmission Spectra
The transmission spectra and their three preprocessed spectra are screened in bands using the CARS and UVE algorithms, and the selected characteristic wavelengths are used to build PLSR and LSSVR models. As shown in Table 8, regarding the PLSR and LSSVR models constructed by using the CARS algorithm to choose the characteristic wavelengths of the transmission spectra, the best prediction model is the RAW-LSSVR model, with an and RMSEP of 0.8914 and 0.0163, respectively. The model’s prediction performance is improved compared with the one built with the full-spectrum data, with a 3.00% enhancement in prediction accuracy. These findings imply that the characteristic wavelengths picked out using the CARS algorithm help to improve the predictive power of the model.
Table 8.
Transmission spectral model predictions after selection based on the CARS algorithm.
As shown in Table 9, of the PLSR and LSSVR prediction models established for the transmission spectra and their three preprocessed spectra with the characteristic wavelengths chosen through the UVE, the RAW-LSSVR model is the most optimal prediction model, achieving an of 0.8775 and an RMSEP of 0.0173, respectively. The models’ prediction results are to some extent more favorable than the results of the models built on the basis of full-spectrum data, but the variable selection method that improves the prediction results of the two models most is the CARS, which is usually better than the UVE algorithm in terms of accuracy and the effect of band selection, especially in high-dimensional data and complex datasets, and the CARS algorithm can better retain the key information in the data [27].
Table 9.
Transmission spectral model predictions after selection based on UVE algorithm.
3.6. PLSR and LSSVR Modeling Based on Mid-Level Data Fusion
Intermediate data fusion methods utilize the full information of both spectra by extracting the characteristic variables in the reflectance and transmission spectra and combining these variables to form a new data matrix. In the context of this study, the CARS algorithm and the UVE algorithm were used for feature extraction, aiming to remove irrelevant variables and superfluous information within the spectral data, thus simplifying the complexity of the model. As shown in Table 8 and Table 9, the CARS algorithm outperforms the UVE algorithm in feature variable extraction, especially in the data fusion model based on reflection and transmission spectra. As a result, the key wavelengths chosen through the CARS algorithm from the reflection and transmission spectra were used for mid-level data fusion. Table 10 shows the prediction results for watermelon seed moisture content using the PLSR and LSSVR models of these fused data. Among them, the RAW-LSSVR model performed the best, with an and RMSEP of 0.9149 and 0.0144, respectively, which improved by 2.63% over the optimal model developed using a single spectral characteristic variable, and by 5.72% over the optimal model constructed from full-spectrum data. These results indicate that integrating reflection and transmission spectral information through mid-level data fusion can significantly improve the accuracy of the model in predicting watermelon seed moisture content.
Table 10.
Mid-level data fusion model predictions based on CARS band screening.
4. Conclusions
During the course of this study being conducted, hyperspectral imaging was employed to assess the moisture content of watermelon seeds. To enhance the accuracy of moisture content prediction, the data fusion technique incorporating both reflection and transmission spectral data was utilized. The key results can be summarized as follows:
- (1)
- In a model that is founded on a solitary reflection and transmission spectrum, the model using transmission spectral data outperformed the reflection data. Among the models founded on a solitary reflection or transmission spectrum, the LSSVR model founded on the original transmission spectrum showed the best results, with an and RMSEP of 0.8654 and 0.0182, respectively.
- (2)
- By applying primary data fusion relying on reflection and transmission spectra, the model’s performance can be improved. The best predictive model for primary data fusion was Baseline–LSSVR, with an and RMSEP of 0.8875 and 0.0166, respectively. Models based on primary data fusion predict better results compared with the models based on single spectral data; this model was upgraded by 2.55%.
- (3)
- The performance of the prediction model based on the feature wavelengths screened by the CARS and UVE algorithms for band screening was improved. The best prediction model was the T-Raw-CARS-LSSVR model, with an and RMSEP of 0.8914 and 0.0163, respectively. The prediction was improved by 3.00% compared with the model for the full-spectrum data.
- (4)
- The CARS algorithm proved to be a more effective wavelength selection method than the UVE algorithm. Intermediate data fusion, using feature wavelengths selected by CARS from reflection and transmission spectra, optimized model predictions. The RAW-CRAS-LSSVR model achieved the most accurate prediction, with an and RMSEP of 0.9149 and 0.0144, respectively. The LSSVR model constructed using intermediate fused spectral data demonstrated the most substantial enhancement in predicting the moisture content of watermelon seeds. Its prediction accuracy increased by 5.72% when compared to the model developed from single full-spectrum data.
This research demonstrates that the integration of hyperspectral imaging and a data fusion approach is capable of precisely assessing the moisture content of watermelon seeds. Compared to a single spectrum, the intermediate fused data contain more sample information about watermelon seeds, resulting in a significant improvement in the stability and accuracy of the model they create. Such a finding lays a robust theoretical groundwork for the application of hyperspectral imaging in the evaluation of seed quality.
Author Contributions
S.O. contributed to conceptualization, methodology, and the original manuscript. S.L. was responsible for data curation, formal analysis, and manuscript review and editing. B.L. provided expertise in visualization, supervision, and resources. All authors have read and agreed to the published version of the manuscript.
Funding
This work was supported by the Natural Science Foundation of Jiangxi Province [No. 20232BAB211023] and Jiangxi Poyang Talent Support Program−High−level Overseas Talent Project [No. 20242BCE50060].
Data Availability Statement
The data can be provided upon request.
Conflicts of Interest
The authors state that they are not aware of any existing competing financial interests or personal connections that might have seemingly affected the work presented in this article.
References
- Maoto, M.M.; Beswa, D.; Jideani, A.I. Watermelon as a potential fruit snack. Int. J. Food Prop. 2019, 22, 355–370. [Google Scholar] [CrossRef]
- Hay, F.R.; Rezaei, S.; Wolkis, D.; McGill, C. Determination and control of seed moisture. Seed Sci. Technol. 2023, 51, 267–285. [Google Scholar] [CrossRef]
- Ali, A.S.; Elozeiri, A.A. Metabolic processes during seed germination. Adv. Seed Biol. 2017, 2017, 141–166. [Google Scholar] [CrossRef]
- Guan, X.; Ramaswamy, H.; Zhang, B.; Lin, B.; Hou, L.; Wang, S. Influence of moisture content, temperature and heating rate on germination rate of watermelon seeds. Sci. Hortic. 2020, 272, 109528. [Google Scholar] [CrossRef]
- Wang, Z.; Fan, S.; Wu, J.; Zhang, C.; Xu, F.; Yang, X.; Li, J. Application of long-wave near infrared hyperspectral imaging for determination of moisture content of single maize seed. Spectrochim. Acta Part A Mol. Biomol. Spectrosc. 2021, 254, 119666. [Google Scholar] [CrossRef]
- Jittanit, W.; Srzednicki, G.; Driscoll, R. Corn, rice, and wheat seed drying by two-stage concept. Dry. Technol. 2010, 28, 807–815. [Google Scholar] [CrossRef]
- Rahman, A.; Cho, B.K. Assessment of seed quality using non-destructive measurement techniques: A review. Seed Sci. Res. 2016, 26, 285–305. [Google Scholar] [CrossRef]
- Hacisalihoglu, G.; Gustin, J.L.; Louisma, J.; Armstrong, P.; Peter, G.F.; Walker, A.R.; Settles, A.M. Enhanced single seed trait predictions in soybean (Glycine max) and robust calibration model transfer with near-infrared reflectance spectroscopy. J. Agric. Food Chem. 2016, 64, 1079–1086. [Google Scholar] [CrossRef]
- Zhu, Y.; Fan, S.; Zuo, M.; Zhang, B.; Zhu, Q.; Kong, J. Discrimination of New and Aged Seeds Based on On-Line Near-Infrared Spectroscopy Technology Combined with Machine Learning. Foods 2024, 13, 1570. [Google Scholar] [CrossRef]
- Alves, M.C.D.S.; Silva, T.A.D.; Tonetti, O.A.O.; José, A.C.; Hein, P.R.G.; Faria, J.M.R. Use of near infrared spectroscopy for estimating moisture content in Brazilian cherry (Eugenia uniflora L.) seeds submitted to dehydration. CERNE 2024, 30, e103414. [Google Scholar] [CrossRef]
- Zhang, Y.; Guo, W. Moisture content detection of maize seed based on visible/near-infrared and near-infrared hyperspectral imaging technology. Int. J. Food Sci. Technol. 2020, 55, 631–640. [Google Scholar] [CrossRef]
- Sun, H.; Zhang, L.; Rao, Z.; Ji, H. Determination of moisture content in barley seeds based on hyperspectral imaging technology. Spectrosc. Lett. 2020, 53, 751–762. [Google Scholar] [CrossRef]
- Lu, B.; Sun, J.; Yang, N.; Wu, X.; Zhou, X.; Shen, J. Quantitative detection of moisture content in rice seeds based on hyperspectral technique. J. Food Process Eng. 2018, 41, e12916. [Google Scholar] [CrossRef]
- Ou-yang, S.T.; Yao, C.; Wan, Y.R.; Zou, J.P.; Wu, J.; Chen, N.; Li, B. Detection of moisture and size of winter melon seeds based on hyperspectral imaging and convex polygon size measurement. J. Food Compos. Anal. 2024, 136, 106789. [Google Scholar] [CrossRef]
- He, X.; Feng, X.; Sun, D.; Liu, F.; Bao, Y.; He, Y. Rapid and nondestructive measurement of rice seed vitality of different years using near-infrared hyperspectral imaging. Molecules 2019, 24, 2227. [Google Scholar] [CrossRef]
- Wang, F.; Shao, W.; Yang, D. Effect of different drying methods on drying characteristics and quality of Camellia oleifera seeds. J. Food Process. Preserv. 2021, 45, e15976. [Google Scholar] [CrossRef]
- Singh, T.; Garg, N.M.; Iyengar, S.R. Nondestructive identification of barley seeds variety using near-infrared hyperspectral imaging coupled with convolutional neural network. J. Food Process Eng. 2021, 44, e13821. [Google Scholar] [CrossRef]
- Chen, H.; Lin, Z.; Tan, C. Fast quantitative detection of sesame oil adulteration by near-infrared spectroscopy and chemometric models. Vib. Spectrosc. 2018, 99, 178–183. [Google Scholar] [CrossRef]
- Jiang, X.; Ge, K.; Liu, Z.; Chen, N.; Ouyang, A.; Liu, Y.; Huang, Y.; Li, J.; Hu, M. Non-destructive online detection of early moldy core apples based on Vis/NIR transmission spectroscopy. Chem. Biol. Technol. Agric. 2024, 11, 63. [Google Scholar] [CrossRef]
- Ryu, J.; Hong, S.J.; Park, S.; Kim, E.; Lee, C.H.; Kim, S.; Ismail, A.; Lee, C.; Kim, D.; Jo, C.; et al. Nondestructive freshness evaluation of mackerel fish using Vis/NIR hyperspectral imaging and multivariate analysis. J. Food Eng. 2024, 377, 112086. [Google Scholar] [CrossRef]
- Chen, J.; Men, Y.; Li, Y.; Zhu, Y.; Chen, X.; Tian, G.; Zhang, G. Quantitative analysis of wool and cashmere fiber mixtures using NIR spectroscopy. AUTEX Res. J. 2024, 24, 20240010. [Google Scholar] [CrossRef]
- Sun, J.; Nirere, A.; Dusabe, K.D.; Yuhao, Z.; Adrien, G. Rapid and nondestructive watermelon (Citrullus lanatus) seed viability detection based on visible near-infrared hyperspectral imaging technology and machine learning algorithms. J. Food Sci. 2024, 89, 4403–4418. [Google Scholar] [CrossRef] [PubMed]
- Wilson, R.H.; Nadeau, K.P.; Jaworski, F.B.; Tromberg, B.J.; Durkin, A.J. Review of short-wave infrared spectroscopy and imaging methods for biological tissue characterization. J. Biomed. Opt. 2015, 20, 030901. [Google Scholar] [CrossRef] [PubMed]
- Li, B.; Su, C.T.; Yin, H.; Zou, J.P.; Liu, Y.D. Detection of moisture content of edamame based on the fusion of reflectance and transmittance spectra of hyperspectral imaging. J. Chemom. 2024, 38, e3574. [Google Scholar] [CrossRef]
- Nettleton, D.F.; Orriols-Puig, A.; Fornells, A. A study of the effect of different types of noise on the precision of supervised learning techniques. Artif. Intell. Rev. 2010, 33, 275–306. [Google Scholar] [CrossRef]
- Montesinos López, O.A.; Montesinos López, A.; Crossa, J. Overfitting, model tuning, and evaluation of prediction performance. In Multivariate Statistical Machine Learning Methods for Genomic Prediction; Springer International Publishing: Cham, Switzerland, 2022; pp. 109–139. [Google Scholar] [CrossRef]
- Wang, B.; He, J.; Zhang, S.; Li, L. Nondestructive prediction and visualization of total flavonoids content in Cerasus Humilis fruit during storage periods based on hyperspectral imaging technique. J. Food Process Eng. 2021, 44, e13807. [Google Scholar] [CrossRef]
Disclaimer/Publisher’s Note: The statements, opinions and data contained in all publications are solely those of the individual author(s) and contributor(s) and not of MDPI and/or the editor(s). MDPI and/or the editor(s) disclaim responsibility for any injury to people or property resulting from any ideas, methods, instructions or products referred to in the content. |
© 2025 by the authors. Licensee MDPI, Basel, Switzerland. This article is an open access article distributed under the terms and conditions of the Creative Commons Attribution (CC BY) license (https://creativecommons.org/licenses/by/4.0/).