Article

Exploring Determinants of and Barriers to Climate-Smart Agricultural Technologies Adoption in Chinese Cooperatives: A Hybrid Study

1
Department of Decision Science, Faculty of Business and Economics, Universiti Malaya, Kuala Lumpur 50603, Malaysia
2
Department of Engineering Science and Mechanics, Shibaura Institute of Technology, 3-7-5 Toyosu, Koto-ku, Tokyo 135-8548, Japan
3
College of Mechanical Engineering, Chongqing University of Technology, Chongqing 400054, China
4
Ungku Aziz Centre, Department of Decision Science, Faculty of Business and Economics, Universiti Malaya, Kuala Lumpur 50603, Malaysia
*
Authors to whom correspondence should be addressed.
Agriculture 2025, 15(9), 1005; https://doi.org/10.3390/agriculture15091005
Submission received: 23 March 2025 / Revised: 29 April 2025 / Accepted: 2 May 2025 / Published: 6 May 2025
(This article belongs to the Section Agricultural Economics, Policies and Rural Management)

Abstract

:
The loss of agricultural production due to climate change and natural disasters has attracted widespread attention. Climate-smart agricultural technologies (CSATs) are attracting attention as a solution to address climate change while achieving sustainable agricultural development. However, in the Chinese context, research on cooperatives’ intention to adopt such technologies is relatively limited. This study investigated the factors influencing the behavioral intentions of Chinese farmers’ cooperatives to adopt CSATs using a behavioral reasoning theory (BRT) framework. A structured questionnaire was administered to 308 participants using purposive sampling techniques. For data analysis, an artificial neural network (ANN) and fuzzy set qualitative comparative analysis (fsQCA) complemented the disjointed two-stage partial least squares structural equation modeling (PLS-SEM) approach to ensure the robustness of the results and provide important practical insights. The results suggest that values (perceived value of government environmental concern, value of openness to change) shape the determinants of and barriers to CSAT adoption by cooperatives, but do not have a direct impact on behavioral intentions. The “determinants” all positively influenced adoption behavioral intentions, with “agricultural extension and advisory service” having the greatest impact on behavioral intentions, followed by “opinion leaders’ recommendation” and “policy support”. Among the “barriers”, only “perceived risk” and behavioral intention were negatively correlated. Behavioral intention to adopt CSATs by cooperatives has a positive effect on willingness to pay, which motivated cooperatives to pay more to acquire the technology. Based on the findings, this study provides theoretical insights for researchers and policy implications for governments, agricultural organizations, policymakers, and agri-technology companies.

1. Introduction

The global environmental situation has faced many serious challenges in recent times, with climate change, ecological degradation, and loss of biodiversity becoming increasingly serious problems [1]. And environmental problems pose multifaceted problems for agricultural production. Global warming may lead to higher temperatures in certain areas, which may affect crop growth cycles and yields. For example, high temperatures may lead to limited growth of crops such as wheat and maize, or even to heat damage [2]. Moreover, climate change can lead to changes in precipitation patterns and the possibility of extreme weather events such as droughts or floods, which directly affect agricultural production [3]. Droughts can lead to insufficient water for crops, while floods can lead to inundation of crops or damage to land [4]. In addition to having an impact on crop yields, high temperatures and frequent changes in precipitation may lead to soil erosion, salinization, or acidification, which directly affect soil fertility [5]. And in some areas, over-tillage or poor farming practices, combined with climate change, can lead to soil degradation, which in turn can affect the health of crops [6]. The World Food Programme (WFP) predicts that climate change could lead to a nearly 20 per cent increase in global hunger and malnutrition by 2050, affecting millions of people around the globe, especially in developing countries [7]. Although climate change poses a challenge to global food production, with the development of modern agriculture, many new yield-enhancing and food preservation technologies are beginning to be gradually applied [8,9].
Climate change (CC) can further reduce productivity and make production more volatile [10]. Many countries around the world are planning to adopt climate-smart agriculture (CSA) methods to improve agriculture [10,11]. Since 2011, climate-smart agriculture (CSA) has been scaling up agricultural systems globally, particularly in sub-Saharan Africa, to improve productivity, increase resilience to climate change, and, where feasible, reduce greenhouse gas emissions [12]. Climate-smart agricultural technologies (CSATs) have become an important means of addressing climate change by enhancing the adaptive capacity of agricultural systems, improving resource use efficiency, and reducing negative environmental impacts [13]. Not only do they help to improve the sustainability and productivity of agriculture, but they also provide an effective way to slow the process of climate change [14]. Through the widespread adoption of these technologies, global agricultural systems will be better able to adapt to potentially more extreme and unpredictable climate change in the future [15]. CSATs are strongly promoted in many countries, for example, water-saving agriculture is strongly promoted in Israel, where more than 100 companies produce and develop smart irrigation tools [16]. Meanwhile, in India, the government-led National Climate-Smart Agriculture Programme (NCAP) promotes crop varieties that are drought-resistant, heat-tolerant, and resistant to pests and diseases [17].
Around the world, the adoption of CSATs has also yielded satisfactory results, with the main benefits being increased agricultural productivity, enhanced climate resilience of agricultural systems, promotion of efficient use of water resources, and increased farmers’ income and agricultural resilience [18]. Eight CSATs (seed management techniques, soil nutrient management, etc.) adopted by 350 potato-growing households in Nyandarua County, Kenya, were shown to increase potato yields by between 39 and 61 per cent, with seed management techniques having the most significant effect on potato yields [19]. In the case of rice cultivation, a Vietnamese study showed that the adoption of CSATs (water-saving techniques and improved stress-tolerant varieties) could increase net rice income (NRI), but even more so when these technologies were combined [20]. A study on millet production in Mali showed that micronutrient fertilizer (MD) and intercropping (IC) increased millet production by 69% and 27%, respectively, while reducing food insecurity by 13% [21].
China has made some progress in the large-scale application of CSATs in recent years. For example, in recent years, Jilin has launched the Agricultural Mechanization Intelligent Cloud Platform for Conservation Tillage Operation Monitoring, which monitors 31.5 million mu of arable land, enabling farmers to use their mobile phones to achieve the remote control of farm machinery for a number of functions, such as precision sowing and automatic harvesting [22,23]. However, at the same time, the application of CSAT development in China has encountered obstacles such as insufficient technology diffusion and acceptance by farmers, and unbalanced regional development [24]. In rural areas, many farmers have low awareness and acceptance of new technologies and lack adequate technical training and knowledge support. For example, in Fujian, farmers are less interested in using herbicides on their farms, with only 20 per cent of respondents in Fujian Province using organic herbicides, while more than 60 per cent of respondents claimed that they are still using chemical weed/pesticide/disease control agents on their farms [25]. Some economically developed regions (e.g., the south-east coast) are at the forefront of precision agriculture (PA) and climate-smart agricultural technologies (CSATs), such as Jiangsu, Zhejiang, and Guangdong provinces [26]. In contrast, the western and northern regions (e.g., Inner Mongolia, Gansu, Ningxia, etc.) have a relatively weak economic and technological base, and the popularity of the application of climate-smart agricultural technologies is low, with large development gaps and technological backwardness [27]. However, research on facilitating and hindering factors affecting the adoption of CSATs is still in its infancy (confined to a specific region or a specific technology), and thus in-depth studies on factors affecting the adoption of CSATs are necessary [25,28].
There is a wide range of research on CSAT adoption around the world, but several areas of focus are still lacking: (1) Compared to other countries, research on the adoption of and impediments to CSATs is still relatively vacant in China. (2) Most of the research on CSATs has unilaterally focused on either factors that promote adoption or factors that impede adoption, rather than a combination of multidimensional factors. (3) Research on the adoption intention of CSATs focuses on smallholder farmers, individual farmers, or farmer households, rather than on economically stronger groups, farmers’ cooperatives.
In Vietnam, gender, age, number of household workers, climate-related factors, farm characteristics, distance to markets, access to climate information, confidence in the expertise of extension workers, membership of social/agricultural groups, and attitudes towards risk were the main factors influencing the decision to adopt CSATs [20]. In India, farmers’ awareness and adoption of CSAT are closely related to several factors, including level of education, annual income, exposure to agricultural mass media, participation in extension programs, sense of innovation, motivation to achieve, risk orientation, and scientific orientation [29]. Studies of CSATs in the context of China have focused more on the effects after CSAT adoption rather than on the factors that influence technology adoption, like CSATs can reduce production costs by 10–15 per cent for fertilizers and pesticides alone [30]. Even if a few studies have focused on factors affecting adoption, there are limitations in the target population or region. For example, land ownership, access to loans, agricultural extension, and access to organizations had a significant effect on CSA practice adoption rates, but the study was conducted only with farmers in Fujian Province [25]. Appendix A Table A1 is a concise summary of previous studies. This study’s in-depth research on factors influencing the adoption of CSATs in the Chinese context will fill this research gap.
Much of the research on the adoption of CSATs has focused on factors that promote adoption, such as government subsidies and financial support, simplicity and operability of the technology, risk tolerance, and innovative character [31,32]. A few studies focus on factors that hinder adoption, such as high initial investment, fear of risk, and distrust [33]. Most research focuses on one-sided factors, facilitators, or hindrances; this study will fill this research gap by utilizing behavioral reasoning theory (BRT). The greatest strength of BRT is that it provides an integrated perspective to understand human behavior, i.e., the facilitating and hindering of multidimensional perspectives [34].
Based on a study of 384 smallholder farmers in the Great Rift Valley (GRV) of Ethiopia, it was found that age, gender, and education of the household head, size of farmland, livestock ownership, income, access to credit, access to climate information, training, and extension linkages influenced the adoption of CSA technologies [35]. Several factors were significantly associated with farmers’ awareness and adoption of CSAT in India, including level of education, annual income, exposure to agricultural mass media, participation in extension programs, innovativeness, achievement motivation, risk orientation, and scientific orientation [29]. Meanwhile, data from a study of family farms in Southern Africa showed that female bargaining power, drought shocks, and access to information on CSA technologies had a positive impact on the likelihood of investing in a portfolio of CSA technologies [36]. The above studies showed that the adoption studies of CSATs have not focused on the more economically powerful groups, farmers’ cooperatives, who can integrate collective resources, share risks, share information, and provide professional support to increase the efficiency and effectiveness of technology adoption [37]. And this study will fill the research gap.
This study aims to fill a research gap by assessing the behavioral intention (BI) of Chinese farmers’ cooperatives to adopt CSATs. The specific objectives of this study are as follows:
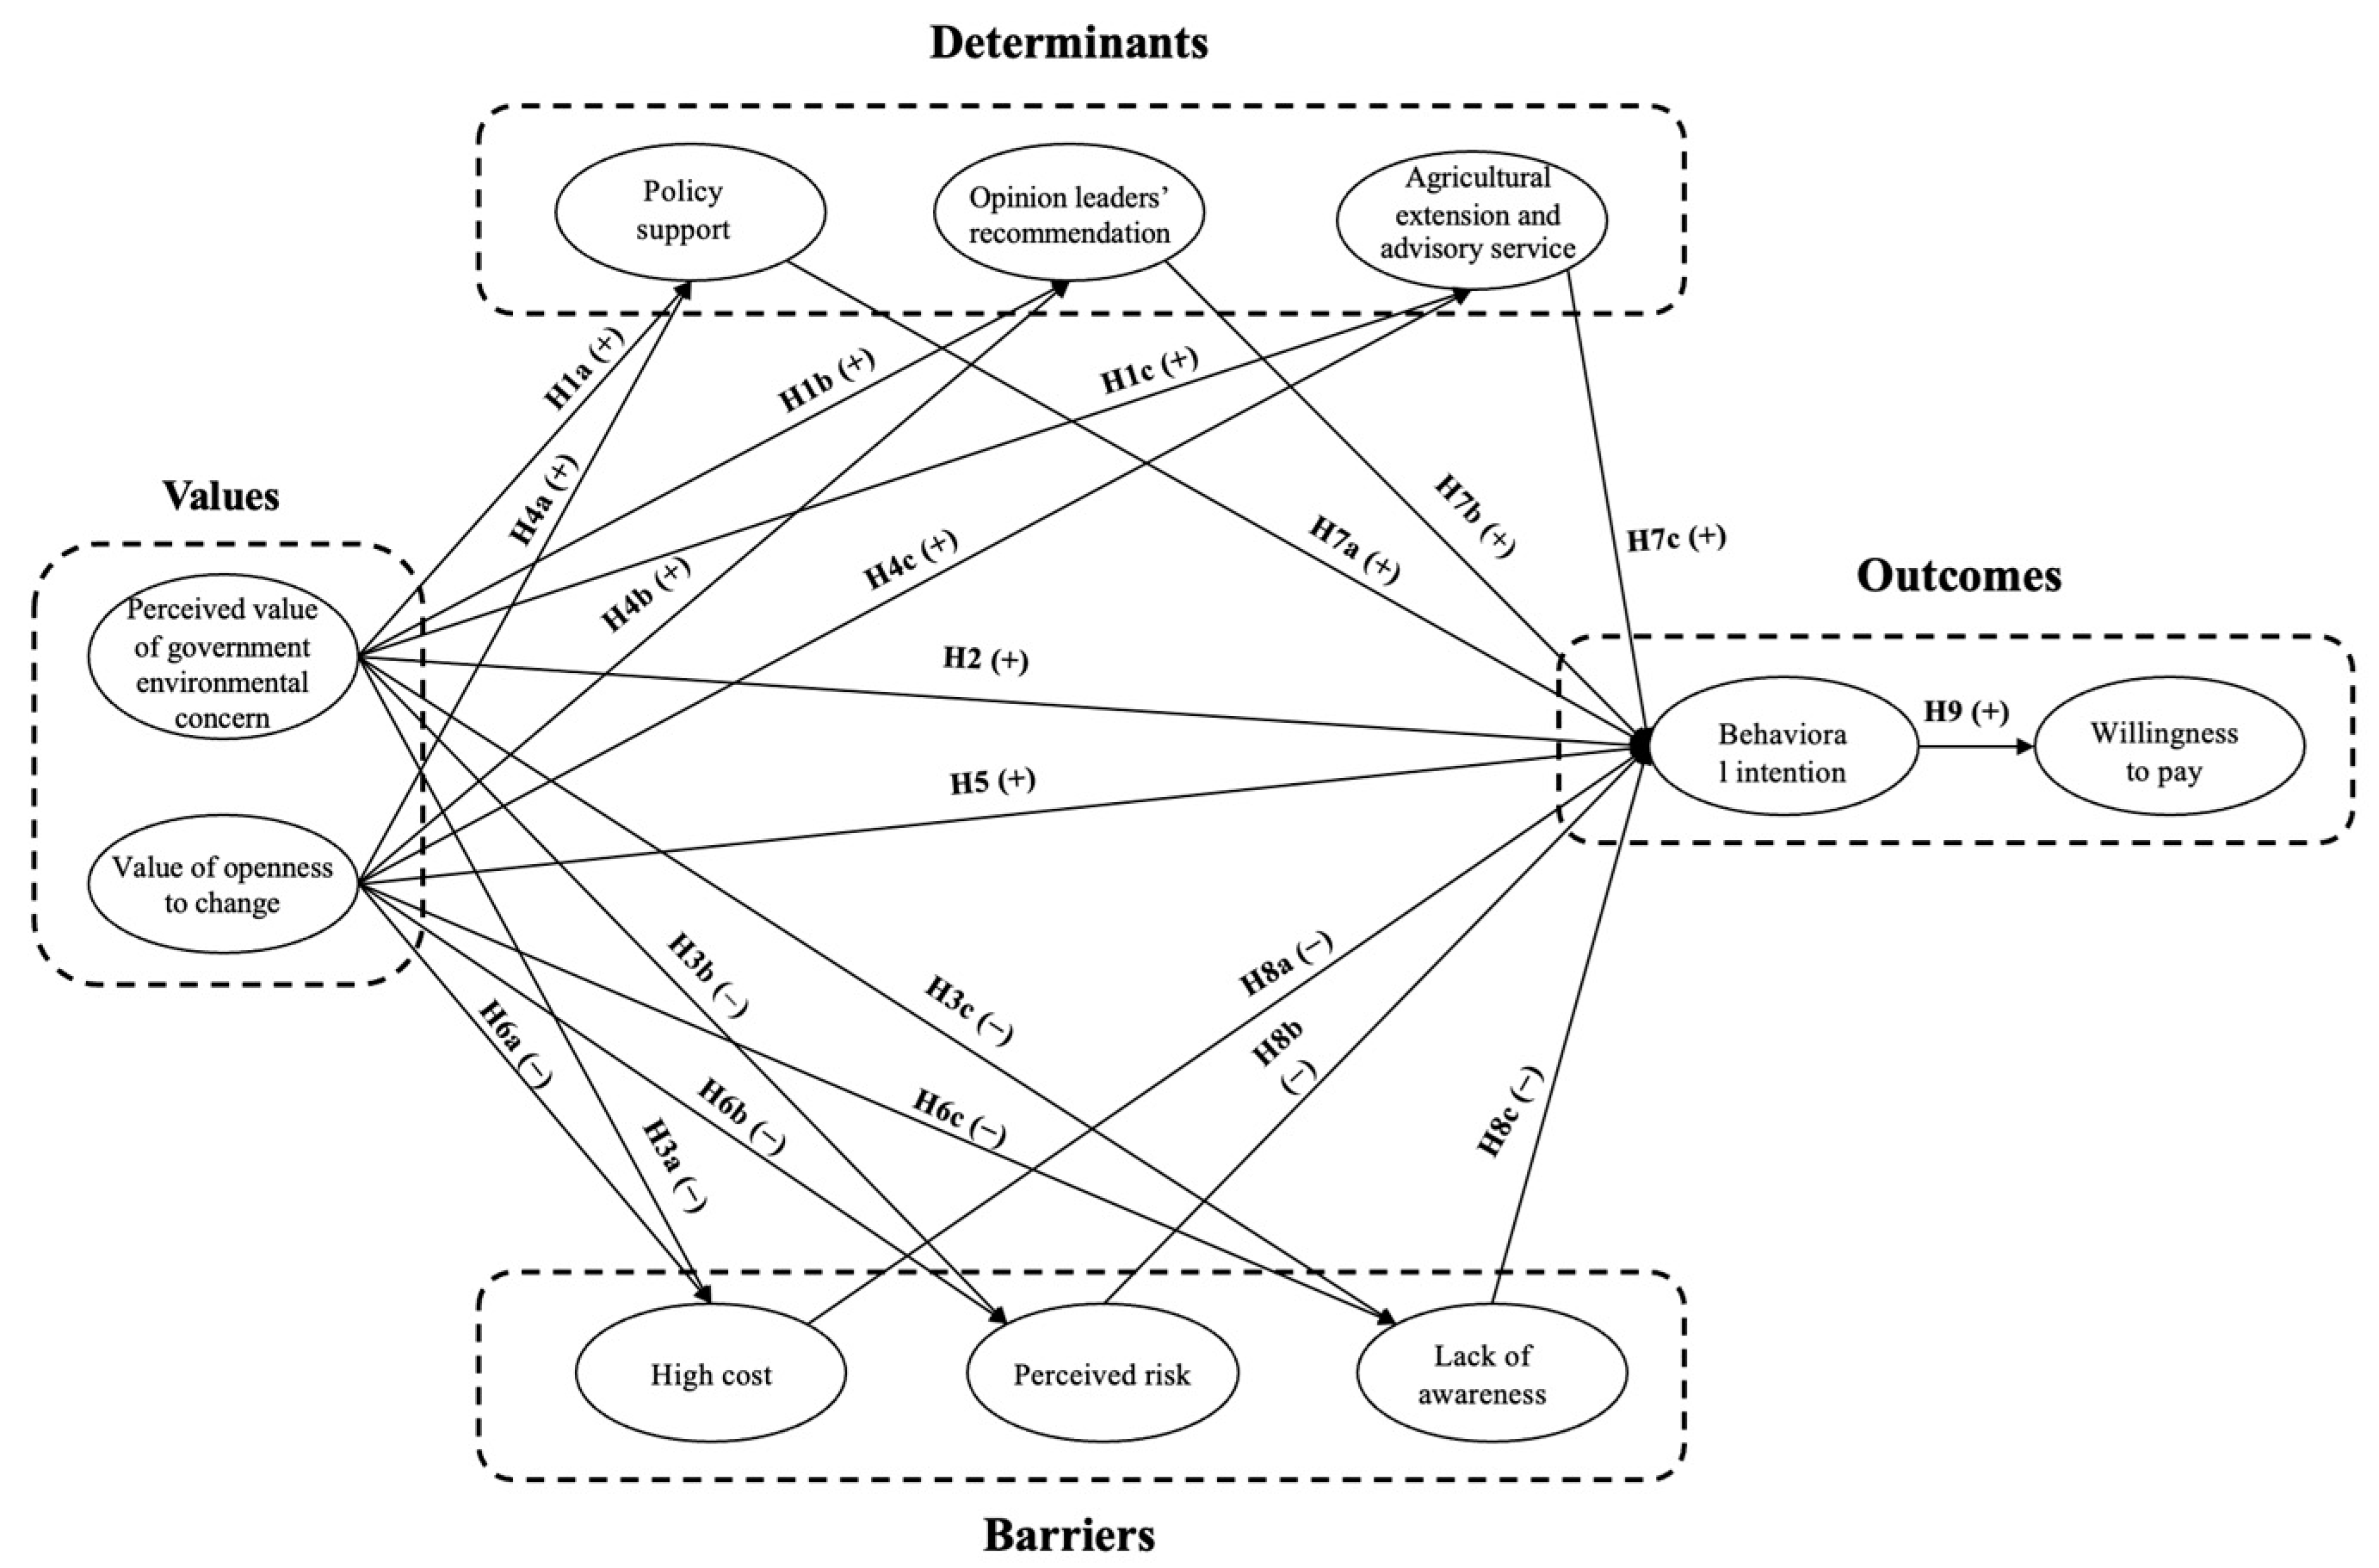
  • To investigate the behavioral intention (BI) of Chinese farmers’ cooperatives to adopt CSATs.
  • To analyze the influence of value factors (perceived value of government environmental concern, value of openness to change) on determinants (policy support, opinion leaders’ recommendation, agricultural extension and advisory service), barriers (high cost, perceived risk, lack of awareness), and behavioral intention (BI).
  • To analyze the effects of (policy support, opinion leaders’ recommendation, agricultural extension and advisory service) and barriers (high cost, perceived risk, lack of awareness) on behavioral intention (BI).
  • To analyze the impact of behavioral intention (BI) to adopt CSATs on willingness to pay (WTP).
This study extracted the factors influencing the adoption of CSATs by a literature review and modeled the factors through the concepts of behavioral reasoning theory (BRT) and willingness to pay (WTP). A total of 308 valid data were obtained through questionnaires, and a hybrid SEM-ANN and fsQCA approach was utilized to reveal the quantitative relationships between the variables and to further explore the complex combinations and the contextual dependencies [38]. This combination allowed for a more comprehensive analysis. The results of the analyses showed that the four factors, policy support (PS), opinion leaders’ recommendation (OLR), agricultural extension and advisory service (AEAS), and perceived risk (PR) are confirmed to have significant influences on the behavioral intentions to adopt CSATs, with agricultural extension and advisory service (AEAS) and perceived risk (PR) sharing larger effects. Finally, the results of the study are expected to provide actionable insights for policymakers and industry leaders to help them develop strategies to increase the adoption of CSATs by cooperatives and support the achievement of agricultural sustainability in China.
This paper is structured as follows: Section 1 defines the research problems and highlights the research gaps. Then, in Section 2 and Section 3, the paper analyzes the core theoretical framework and assumptions of farmers’ cooperatives adopting CSAT in the Chinese research context. The theoretical framework includes values, determinants, barriers, and outcome factors. Section 4 describes the quantitative survey techniques and data collection methods. Section 5 analyzes the relationship between values, determinants, barriers, behavioral intention (BI), and willingness to pay (WTP). Section 6 discusses previous relevant studies and new findings of this study, and their theoretical and practical contributions. Section 7 explores the limitations and recommendations for future research.

2. Literature Review

2.1. CSAT Adoption in China

In China, CSATs have gradually gained widespread use in response to increasing climate change and environmental challenges to agricultural production [39]. Simple and low-cost CSATs, such as water-saving irrigation, straw return, organic fertilizers, sensing system soft robotics, and high-yield seeds, have been promoted first in rural China, led by government advocacy [40,41,42,43]. Farmers acknowledged that the government’s popular education made it initially easier for them to accept new agricultural technologies. With the increase in farmers’ income and the popularity of social networks, farmers’ interest in mechanized and costly CSATs has risen considerably in recent years. For example, drone and remote sensing technology have found favor with farmers in large crop areas in the northern part of China, where they use drones and satellite remote sensing to monitor growth, soil moisture, and pests and diseases on farmland so as to accurately determine the needs of crops for targeted management [44,45].
At the same time, the research also shows that technology adoption plays a positive role in improving productivity and boosting net income. Adoption of adaptive and mitigating climate-smart agricultural technologies (CSAPs) by rice farmers in Hubei Province can increase farmers’ rice yields by 15.879 per cent and net incomes by 19.288 per cent, as well as mitigate the impacts of extreme weather events [46]. Low-carbon practices can increase the output rate of farmland by 2.4 per cent and that of neighboring farmland by 1.2 per cent [47]. The agricultural production system in the North China Plain reduced the carbon footprint of agriculture between 2000 and 2016, which led to more efficient use of nitrogen fertilizer and water resources and increased economic profitability [48].

2.2. Behavioral Reasoning Theory

Behavioral reasoning theory (BRT) was introduced by Westaby in 2005 to explain how individuals’ reasoning during the decision-making process affects their attitudes and intentions [49]. According to BRT, beliefs and values indirectly influence intentions and actual behaviors by shaping an individual’s positive or negative justifications for a behavior [34]. The main point of the BRT model is an understanding of the reasons that individuals provide for adopting or avoiding behaviors, which can be either in support of (determinants) or against (barriers) the intention [49]. These reasons influence the individual’s attitudes and intentions, which ultimately influence the actual behavior [50]. At the same time, the theory stresses that reasons mediate between beliefs and global motivation, while directly influencing intentions [51]. Intentions as the core outcome of the model and the focus of the research are refined into purchase intentions, adoption intentions, or behavioral intentions in consumer behavior research [50,52]. BRT provides a valuable framework for understanding individual reasoning in the decision-making process, especially in contexts involving complex decisions [34]. This study utilizes BRT as its theoretical framework to explore behavioral reasoning perspectives in relation to the adoption of climate-smart agricultural technologies. In this direction, this study examines how cooperatives’ values shape determinants and barriers for the adoption of CSATs and behavioral intentions towards the adoption of CSATs, which in turn affects the willingness to pay for CSATs.

2.3. Willingness to Pay (WTP)

Willingness to pay (WTP) denotes the maximum price a buyer is willing to pay for a given quantity of a good [53]. Research on WTP has focused on examining the premium consumers are willing to pay and how the premium is measured [54]. In recent years, in addition to the above aspects of research, scholars have also paid attention to the factors affecting WTP. With study of the PV industry in Pakistan, it was found that the likelihood that farmers would be willing to pay extra for green power increased with education, household income, and lack of access to grid electricity, but decreased with age and the cost of green energy technologies [55]. Meanwhile, the concept of willingness to pay (WTP) has been integrated into the extended theory of planned behavior (TPB) as a result extension, to delve deeper into the practical implications of behavioral intentions [56,57]. For example, one of the studies was on willingness to pay a premium for 3D-printed food as an extension of the theory of planned behavior (TPB), where intention to purchase 3D-printed food significantly influences the willingness to pay a premium for 3D-printed food [56]. The same framework is also found in the study of consumers’ willingness to pay for green transport, where intention to purchase is significantly and positively related to willingness to pay for green transport [57]. The innovation of this study is to combine WTP with the BRT model so that WTP appears in the research framework as a result of the BRT model. In this study, WTP is integrated into the BRT model because of behavioral intention (see [56]). While previous WTP studies have focused more on individual consumers [55,56,57], this study concentrates on WTP research in farmer cooperatives (organizational level).

3. Research Model

The conceptual model for this study is based on the BRT framework as shown in Figure 1. This study takes perceived value of government environmental concerns (VGEC) and value of openness to change (VOC) as values. Firstly, the existing literature explores the role of environmental concerns in research on green sustainability, including green technology adoption [58]. Therefore, it can also be applied in the context of technologies related to sustainable agricultural development. Meanwhile, the government’s concern for the environment significantly influences farmers’ environmental awareness and behavior through policy and advocacy [59]. Regarding the value of openness to change (VOC) as a more common value, individuals or organizations with high openness traits are more inclined to accept and adopt new technologies [60], which can be extended to investigating behavioral intentions towards the adoption of CSATs. Prior research has demonstrated that value of openness to change positively influences adoption intentions [61].
Similarly, this study identified determinants and barriers based on qualitative research and the prior literature. The review suggests that government policy support, leadership advice, and extension services are determinants of farmers’ adoption of new technologies [62]. However, high prices, perceived risk, and lack of understanding of the technology may be potential reasons against adoption [63]. Therefore, the conceptual model includes policy support (PS), opinion leaders’ recommendation (OLR), and agricultural extension and advisory service (AEAS) as determinants, as well as high cost (HC), perceived risk (PR), and lack of awareness (LOA) as barriers. In addition, the study used behavioral intention to adopt CSATs and willingness to pay for CSATs as outcome variables.
As shown in Figure 1, this study hypothesizes that values have significant and positive effects on determinants and behavioral intention to adopt, and also have significant but negative effects on barriers. Furthermore, this study hypothesizes that determinants have significant and positive effects on behavioral intention, and barriers have significant and negative effects on behavioral intention. Regarding the outcomes section, this study hypothesizes that behavioral intention has a significant and positive effect on willingness to pay.

3.1. Values and Reasons

Environmental concern refers to the extent to which individuals are concerned about the quality of the environment and are aware of and worried about environmental issues [64]. Perceived value of government environmental concern (VGEC) extends to cooperatives’ perceptions of the degree of environmental concern of the government. When the public perceives that the government attaches importance to environmental issues, their support for the relevant policies will increase significantly [65]. In addition, the effectiveness of national agricultural extension services depends primarily on the degree of government involvement and the importance it attaches to environmental issues [66]. Government attention to environmental issues and the formulation of appropriate policies will enhance agricultural extension services [67]. At the same time, the government’s environmental policies and support for sustainable agricultural practices will influence opinion leaders’ decisions in promoting smart agricultural technologies [68]. Thus, it can be hypothesized as follows, which partially addresses research objective 2.
H1a. 
Perceived value of government environmental concern (VGEC) has a significant and positive impact on policy support (PS).
H1b. 
Perceived value of government environmental concern (VGEC) has a significant and positive impact on opinion leaders’ recommendation (OLR).
H1c. 
Perceived value of government environmental concern (VGEC) has a significant and positive impact on agricultural extension and advisory service (AEAS).
Concern for environmental protection may lead farmers to be wary of high-cost technologies [68]. Thus, high costs in the context of increased environmental protection requirements may lead farmers to be cautious about adopting new technologies. Moreover, farmers who lack knowledge about digital environmental policy have a negative attitude towards the use of digital technology in environmental policy [69]. Meanwhile, risk perception had a significant effect on herders’ environmental attitude and the relationship between risk perception and environmental behavior was not positive [70]. Thus, it can be hypothesized as follows, which partially addresses research objective 2.
H3a. 
Perceived value of government environmental concern (VGEC) has a significant and negative impact on high cost (HC).
H3b. 
Perceived value of government environmental concern (VGEC) has a significant and negative impact on perceived risk (PR).
H3c. 
Perceived value of government environmental concern (VGEC) has a significant and negative impact on lack of awareness (LOA).
Openness to change refers to an individual’s or group’s receptivity and willingness to accept new ideas, methods, or technologies [71]. The meta-analysis showed openness as a factor influencing the adoption of agricultural technology [72]. Farmers with higher openness were more willing to try new agricultural technologies and responded more positively to government policy support [73]. At the same time, farmers with higher openness are also more likely to obtain information and technical support through extension services [74]. Organizations and individuals must be open to innovation and change in order to successfully achieve widespread technology diffusion, thus increasing the support of agricultural opinion leaders and promoting wider adoption of the technology [75]. Thus, it can be hypothesized as follows, which partially addresses research objective 2.
H4a. 
Value of openness to change (VOC) has a significant and positive impact on policy support (PS).
H4b. 
Value of openness to change (VOC) has a significant and positive impact on opinion leaders’ recommendation (OLR).
H4c. 
Value of openness to change (VOC) has a significant and positive impact on agricultural extension and advisory service (AEAS).
Farmers with a high degree of openness, while willing to try precision farming techniques, may be skeptical about the economic viability of new technologies when faced with high costs [76]. Meanwhile, farmers with a higher risk appetite are more likely to implement transformative land use changes, but such changes are usually accompanied by a higher perception of risk [77], and openness may positively influence farmers’ decisions to adopt new technologies by reducing perceived risk [78]. Lack of knowledge and trust in new technologies is a barrier that farmers face in adopting them, and although farmers with higher openness are more willing to try new technologies, their lack of knowledge about them may limit their adoption behavior [79]. Thus, it can be hypothesized as follows, which partially addresses research objective 2.
H6a. 
Value of openness to change (VOC) has a significant and negative impact on high cost (HC).
H6b. 
Value of openness to change (VOC) has a significant and negative impact on perceived risk (PR).
H6c. 
Value of openness to change (VOC) has a significant and negative impact on lack of awareness (LOA).

3.2. Values and Behavioral Intention

Government environmental regulation can significantly enhance farmers’ adoption behavior towards green technologies by enhancing social trust and social capital [80]. High public support for green roof technologies (GRs) stems from willingness to pay for government-supported projects [81]. This suggests that the public’s intention to adopt green agricultural technologies is enhanced when they have a positive attitude towards the government’s environmental protection values [82]. Thus, it can be hypothesized as follows, which partially addresses research objective 2.
H2. 
Perceived value of government environmental concern (VGEC) has a significant and positive impact on behavioral intention (BI) to adopt CSATs.
There is a significant correlation between behavioral and psychological factors, such as farmers’ level of aspiration, and the adoption of climate-smart agricultural practices such as crop rotation and organic soil improvement [79]. Specifically, innovative farmers are more willing to experiment with new practices and take risks, which promotes the adoption of climate-smart agricultural technologies [36]. Thus, it can be hypothesized as follows, which partially addresses research objective 2.
H5. 
Value of openness to change (VOC) has a significant and positive impact on behavioral intention (BI) to adopt CSATs.

3.3. Reasons and Behavioral Intention

Behavioral reasoning theory (BRT) proposes that reasons that support the behavior enhance behavioral intentions, while reasons that oppose the behavior weaken behavioral intentions [49]. Thus, reasons can have both positive and negative effects on behavioral intentions, depending on whether they are for or against the behavior, which refers to determinants or barriers [83].
Based on the literature review, three factors can be regarded as determinants to positively influence the adoption of climate-smart agricultural technologies. Policy and institutional factors are key drivers for the adoption of climate-smart agricultural technologies in Europe, with policies making these technologies more attractive to farmers [84]. At the same time, extension services in agriculture increase farmers’ awareness and adoption of climate-smart agricultural practices by reducing information asymmetries [85]. Recommendations and positive evaluations by opinion leaders can significantly increase individual willingness to accept new technologies [86], while the trust built between opinion leaders and farmers helps to increase technology acceptance [87]. Thus, it can be hypothesized as follows, which partially addresses research objective 3.
H7a. 
Policy support (PS) has a significant and positive impact on behavioral intention (BI) to adopt CSATs.
H7b. 
Opinion leaders’ recommendation (OLR) has a significant and positive impact on behavioral intention (BI) to adopt CSATs.
H7c. 
Agricultural extension and advisory service (AEAS) has a significant and positive impact on behavioral intention (BI) to adopt CSATs.
Based on the literature review, three factors can be regarded as barriers to positively influence the adoption of climate-smart agricultural technologies. The high cost of inputs such as seeds, fertilizers, and irrigation make smallholder farmers face financial constraints in adopting climate-smart agricultural technologies, which limits their ability to access and use new technologies [88]. In addition, farmers are concerned about the possible economic risks, technical complexity, and impact on existing production practices that new agricultural technologies may bring, thus reducing interest in new technologies [89]. Perceived risks such as economic, technological, and social risks increase farmers’ hesitation and resistance to new technologies [88]. Farmers’ knowledge of climate-smart agricultural technologies is at a low to medium level [29], and there is also an information gap between technology suppliers and users [13], with lack of awareness and limited technical understanding on the user side being one of the main barriers [90]. Thus, it can be hypothesized as follows, which partially addresses research objective 3.
H8a. 
High cost (HC) has a significant and negative impact on behavioral intention (BI) to adopt CSATs.
H8b. 
Perceived risk (PR) has a significant and negative impact on behavioral intention (BI) to adopt CSATs.
H8c. 
Lack of awareness (LOA) has a significant and negative impact on behavioral intention (BI) to adopt CSATs.

3.4. Behavioral Intention and Willingness to Pay

Users with a higher willingness to adopt public transport are more likely to pay for the service [91]. A review of 80 studies also confirms this view, with behavioral factors driving both willingness to adopt and WTP [92]. In the case of agricultural technologies, willingness-to-adopt farmers are more likely to invest in technologies such as resilient rice varieties and integrated nutrient management [93]. When farmers are already willing to adopt CSA practices, financial incentives and government support further increase farmers’ willingness to pay [33]. This suggests that farmers who show a strong willingness to adopt CSA techniques are more likely to show higher willingness to pay [94]. Thus, it can be hypothesized as follows, which partially addresses research objective 4.
H9. 
Behavioral intention (BI) to adopt CSATs has a significant and positive impact on willingness to pay (WTP) for CSATs.

3.5. Control Variables

The selected control variables include the average age of the farmers, the size of the cooperative (specifically the number of members of the cooperative), and the average level of education of the farmers. Based on the results of previous studies, all of these variables have a significant effect on new technology adoption behavior. Older farmers reduced their willingness to adopt because they were unfamiliar with the new technology, but younger farmers were more adaptable to the technology and had higher expectations of the potential benefits of the new technology [95,96]. Also, for organizations, larger organizations usually have more resources (e.g., financial, human, and technological infrastructure), which makes them more likely to adopt new technologies [97,98]. Meanwhile, farmers with higher levels of education are more inclined to adopt new technologies because they have greater awareness and understanding of new technologies [99].

4. Research Method

4.1. Data Collection

Data on farmers’ cooperatives in China were collected using purposive random sampling techniques. The sample consisted of cooperatives from four provinces (Hebei, Henan, Shandong, and Sichuan), categorized according to the region they belonged to. The four provinces selected were the provinces with the highest number of registered cooperatives, all over 100,000 for each. Because China is so large, with 34 administrative regions, and over 2 million cooperatives registered, it is not feasible to conduct random or stratified sampling of cooperatives in the whole of China. Four large agricultural provinces were selected for purposive sampling in this study. And the main agricultural products of these four provinces are different, so the data from these four provinces are representative. The questionnaire was sent to approximately 1000 potential respondents and received 322 complete responses. After removing outliers, the cooperative situation was reviewed. This study only targets cooperatives that had experience in adopting CSATs or had plans to adopt CSATs in the next five years. Cooperatives with no practical usage and no intention to adopt in the coming period were not targeted in this study and the data would be removed before data analysis. This is because the researcher was not able to effectively analyze the impact of determinants and barriers on behavioral intentions among cooperatives that have no intention on CSATs. Cooperatives that had already adopted climate-smart agriculture technologies or had plans to adopt CSATs in the next five years were considered eligible respondents, and this was ensured with a filter question on application experience [100]. As a result, the final sample contained only 308 pieces of collected data, a response rate of 30.8%. In addition to the demographic questions, participants had to answer 72 indicators listed in Appendix A Table A2. All indicators were marked as required to avoid missing responses. The demographic descriptions of respondents are provided in Appendix A Table A3.

4.2. Measurement Scale

Measurement instruments in this study were derived from the previous literature on agricultural technology adoption and related fields. The components of determinants (policy support, opinion leaders’ recommendation, agricultural extension and advisory service) were taken from [101,102]. The components of barriers (high cost, perceived risk, lack of awareness) were adapted from [103,104,105,106] and tweaked to suit the context of CSATs. The items of values (perceived value of government environmental concern, value of openness to change) were taken from previous studies in the field of agricultural technology [103,106,107] and adapted to the characteristics of Chinese farmers. Indicators for behavioral intentions and willingness to pay were taken from [101,103,104,105,106,107]. Prior to the distribution, the questionnaire was first pre-tested with 15 participants to ensure that the measurement items have good reliability and validity.

4.3. Common Method Bias

Respondents may adjust their responses based on social acceptability rather than giving the true answer [108]. Participants were assured of anonymity to avoid the above issues. And it was informed in advance that there are no right or wrong answers to the questions and that participants should show their honest opinions. The questionnaire collection lasted for 3 months and there was no difference in the data between early and late responses because of the variance chi-square test sig > 0.05 (confidence level 95%, p-value = 0.05) [109]. Next, as a statistical diagnostic, Harman’s single-factor test indicated that a single factor could only explain 27.605% of the variance, well below the 50% threshold [110]. Furthermore, the FCVIF test indicated that the VIF values for all indicators were below the recommended threshold of 3.0 [111]. The above tests confirmed the absence of common method bias in the study and paved the way for further analyses.

4.4. Data Analysis Method

This study employs a few different data analysis methods to derive meaningful insights and ensure the robustness of the results. As a symmetric modeling approach, the variance-based SEM (PLS-SEM using SmartPLS 4.1.0.3) technique was employed to test the reliability, validity, and predictive strength of the model and to further test the hypothesized relationships [112]. PLS-SEM is widely used in commercial research due to its sensitivity, simplicity, and predictive power [113], and it can deal with complex model structures and performs better in predicting relationships between variables compared to traditional covariance-based SEM [114]. As shown in Figure 1, instead of modeling the causes as second-order constructs, we modeled them as first-order constructs using the PLS-SEM approach to enhance the interpretability of the constructs and to explore in depth the specific variables that influence behavioral intentions [115]. In addition, an artificial neural network (ANN) analysis was conducted, which can complement SEM by resolving nonlinear relationships, but lacking interpretability; therefore, combining SEM and ANN into a hybrid model improves predictive accuracy while retaining explanatory power [116]. This study also compared fuzzy set qualitative comparative analysis (fsQCA) with partial least squares SEM (PLS-SEM). FsQCA provided more nuanced, case-specific insights through the identification of multiple causal pathways, increasing the robustness and depth of analysis, especially in behavioral studies [117]. In summary, SEM identifies statistically significant relationships. An ANN improves predictive accuracy and handles nonlinear interactions. And fsQCA further reveals multiple causal pathways and complex configurations. For cooperatives, the adoption of new technologies can involve many factors. In turn, policy formulation needs to take many factors into account. A mixed research approach can help to understand the complexity of cooperatives’ perceptions of new technologies and provide stronger support. The results of the study can improve the science and effectiveness of relevant government policies.

4.5. Assessment of Reliability, Validity, and Predictive Relevance of the Model

The reliability and validity of the structure were assessed in the first phase of pre-testing. In the next stage, the final model of the study was evaluated on the data basis of 308 responses, and it was noted that the outer loading of items exceeded the threshold value of 0.7, indicating that the observed variable reflects the latent variables well [118]. The loading values of VOC2, VOC5, AEAS1, OLR2, PR1, LOA5, and BI5, on the other hand, were lower than 0.7 (as shown in Appendix A Table A4), but did not affect the structural composite reliability (CR) and average variance extracted (AVE) and were therefore retained [119]. As can be seen in Table 1, Cronbach’s alpha (CA) ranged between 0.832 and 0.912, while the composite reliability (CR) ranged between 0.877 and 0.927, which is higher than the threshold of 0.70, thus confirming internal consistency and reliability [120]. Convergent validity was also validated as the average variance extracted (AVE) values ranged from 0.544 to 0.593, which was above the cutoff value of 0.50 [111]. Discriminant validity was established through the Fornell–Larcker criterion as well as the HTMT ratios. The square root of the AVE exceeded the correlation between the respective constructs [111].
Similarly, the HTMT ratios for all variables were below the threshold of 0.85 (Table 2) [121]. Subsequently, the explanatory power of the model was assessed using the coefficient of determination (R2). Based on the R2 measure, the model explained 43.5% of the variance in behavioral intention and 25.1% of the variance in willingness to pay. Finally, regarding assessing the power of the model, the Q2 value for behavioral intentions was 0.230, indicating that the model has predictive power [122].

5. Results

5.1. Hypothesis Testing

Hypothesis testing was conducted using SmartPLS (4.1.0.3) and the bootstrapping program with 5000 subsamples. Hypothesis testing resulted in 17 out of 21 hypotheses being supported (Table 3).
Values (perceived value of government environmental concern, value of openness to change) positively influence the determinants (policy support, opinion leaders’ recommendation, agricultural extension and advisory service), leading to the acceptance of H1a (β = 0.303, t = 5.241 > 2.57), H1b (β = 0.229, t = 3.842 > 2.57), H1c (β = 0.273, t = 4.240 > 2.57), H4a (β = 0.313, t = 5.380 > 2.57), H4b (β = 0.380, t = 6.208 > 2.57), and H4c (β = 0.302, t = 5.006 > 2.57). Meanwhile, values (perceived value of governmental environmental concern, value of openness to change) negatively influence barriers (high cost, perceived risk, lack of awareness) to acceptance of H3a (β = −0.235, t = 3.662 > 2.57), H3b (β = −0.272, t = 4.513 > 2.57), H3c (β = −0.264, t= 4.678 > 2.57), H6a (β = −0.200, t = 2.895 > 2.57), H6b (β = −0.313, t = 5.188 > 2.57), and H6c (β = −0.284, t = 4.493 > 2.57).
However, values (perceived value of governmental environmental concern, value of openness to change) do not show having a significant effect on behavioral intentions to adopt CSATs in this study; therefore, H2 (β = 0.039, t = 0.799) and H5 (β = 0.034, t = 0.606) are not supported.
All determinants (policy support, opinion leaders’ recommendation, agricultural extension and advisory service) have significant and positive effects on behavioral intention. Thus, H7a (β = 0.128, t = 2.171 > 1.96), H7b (β = 0.182, t = 2.751 > 1.96), and H7c (β = 0.284, t = 4.463 > 2.57) are supported. Conversely, perceived risk as one of the barriers to adoption has a significant and negative effect on behavioral intention; thus, H8b (β =−0.190, t = 3.168 > 2.57) is accepted. However, high cost and lack of awareness have no significant effect on behavioral intention in this study; therefore, H8a (β =−0.038, t = 0.606) and H8c (β =−0.018, t = 0.278) are not supported. Cooperatives’ behavioral intention to adopt CSATs largely influences their willingness to pay for CSATS; therefore, H9 (β =−0.501, t = 9.082 > 2.57) is supported.

5.2. ANN Analysis

ANN analysis has been executed via SPSS 27.0 using the multi-layer perceptron feed-forward backward propagation (MLP-FFBP) training mechanism with S-shaped activation functions for both hidden layers and output layers (with 2 hidden layers), as shown in Figure 2. The 10-fold cross-validation method was used to avoid overfitting, where 90% of the data were used for training and the remaining 10% for testing purposes and the optimization algorithm for training is the gradient descent [123]. Table 4 shows that the average RMSE values for each training and testing model were 0.102 and 0.094, indicating strong explanatory power [124]. After ensuring the predictive strength of the ANN models, a sensitivity analysis was performed in which the normalized importance of the behavioral intent predictors was calculated based on the average of the relative importance obtained through 10 ANN iterations. Finally, the results of the ANN analysis were compared with those of the SEM analysis, and the results were found to be consistent (Table 5).

5.3. FsQCA Results

In this study, fsQCA was conducted using fsQCA 4.0 software to find out the best synergistic combination of predictors. The data were calibrated to a percentile-based criterion with thresholds of upper 95% quartile for full set members, median (50% quartile) for intersections, and lower 5% quartile for full set non-members [125]. Subsequently, a truth table was generated using a raw consistency threshold of 0.85 and a case threshold of 4 [126]. Standard analysis and necessary condition analysis were performed using the truth table. Table 6 lists the combinations under the intermediate solution. Overall, the intermediate solution has a solution coverage of 0.453 and a solution consistency of 0.914. This indicates that the model has moderate predictive power, which is more common in social science research [126].

6. Discussion and Contribution

6.1. Discussion

Values positively influence the determinants (policy support, opinion leaders’ recommendation, agricultural extension and advisory service), which suggests that values positively influence the factors that promote the adoption of CSATs, consistent with the findings of [66,67,68,73,74,75]. The relationship between values and determinants suggests that perceived value of government environmental concern (VGEC) and value of openness to change (VOC) are an important basis for shaping cooperatives’ reasons for supporting or opposing the adoption of CSATs [49]. This indicates that CSATs’ policies and extension services should be aligned with the ethical values of cooperatives. Meanwhile, values negatively influence barriers (high cost, perceived risk, lack of awareness), suggesting that values (perceived value of governmental environmental concern, value of openness to change) influence cooperatives’ intuitive judgments about behaviors [127], which in turn influence their reasons for forming objections to behaviors, consistent with the findings of [69,70,76,77,78,79]. This suggests that focusing on cooperatives’ values can weaken cooperatives’ barriers to adopting CSATs.
However, values do not show having a significant effect on behavioral intentions to adopt CSATs in this study, which may be because in some cases, values have a limited direct effect on behavioral intentions, but rather indirectly through other mediating variables (e.g., determinants, barriers) [128]. This may be since values influence an individual’s evaluation of the outcome of a behavior, which in turn influences their reasons for adopting it and the reasons for barriers, whereas values have a limited direct effect on behavior [49]. The results of the analysis of mediating effects corroborates this point, which are displayed in Appendix A Table A5. Values act as internal guides that influence the decision-making process in cooperatives [129]. While values themselves do not directly determine behavior, they indirectly influence behavioral intentions by influencing the beliefs and rationale of cooperatives. The results show that although values do not have a significant direct effect on behavioral intentions, values (perceived value of governmental environmental concern, value of openness to change) can enhance the adoption intentions of cooperatives by positively influencing determinants (policy support, opinion leaders’ recommendation, agricultural extension and advisory service), and values also enhance the adoption behavioral intentions of CSATs by reducing the effects of barrier-perceived risk (see in Appendix A Table A5).
All determinants (policy support, opinion leaders’ recommendation, agricultural extension and advisory service) have significant and positive effects on behavioral intention. This result is supported by previous studies that have shown that policy support would be more attractive for new technologies, agricultural extension services reduce information asymmetry thereby increasing cooperatives’ knowledge of the technology, and the authority of opinion leaders can also increase trust in new technologies; all these measures would influence cooperatives’ behavioral intention to adopt CSATs [84,85,86,87]. Conversely, perceived risk as one of the barriers to adoption has a significant and negative effect on behavioral intention, indicating that perceived risks (economic risks, technological complexity, and impacts on existing production practices) of new technologies reduce the behavioral intentions of cooperatives to adopt CSATs [88]. However, high cost and lack of awareness have no significant effect on behavioral intention in this study. Previous studies have also shown that the effect of cognitive load on the adoption of agricultural technologies depends on the complexity of the technology and the support provided, and that the lack of cognitive ability does not significantly affect the adoption of simple or highly automated technologies [130]. The more adopted technologies in China at this stage are drip irrigation technology, high yielding seeds, etc., which do not require a high level of awareness of the technology. Moreover, high costs can be mitigated by external measures such as policy support and extension services, thus reducing the negative impact on agricultural technology adoption, also supporting the findings of this study [76]. When faced with high costs, cooperatives may still choose to adopt new technologies, also because of their potential long-term benefits and competitive advantages [131].
Cooperatives’ behavioral intention to adopt CSATs largely influences their willingness to pay for CSATs, which suggests that enhancing cooperatives’ intention to adopt CSATs can lead them to be willing to pay the maximum amount when purchasing new technologies, which is consistent with the findings of previous studies [33,93,94].
From the ANN results, the construct observed to be most important for CSAT adoption behavioral intentions is agricultural extension and advisory service, followed by perceived risk, opinion leaders’ recommendation, and policy support. The findings suggest that agricultural services are a key predictor of CSAT adoption intention and that efforts should be made to organize extension services that are conducive to CSATs’ understanding and awareness. Also, the results indicated that the negative role of perceived risk is relatively high, and positive actions should be taken to reduce the risk perception of cooperatives towards new technologies. The study also advocates other possible measures to enhance the recognition of CSATs by opinion leaders.
According to the fsqca result (Table 6), solution 1 and solution 2 suggest that even though perceived value of government environmental concern or value of openness to change do not have a direct effect on behavioral intentions, in the absence of the influence of the three barriers (high cost, perceived risk, lack of awareness), a combination of values (perceived value of government environmental concern, value of openness to change) can collectively increase the adoption behavioral intentions of CSATs by emphasizing the agricultural extension service or enhancing the support of opinion leaders. Solution 3 scored the highest on raw coverage (0.356), indicating that it explained the most cases, and solution 3 suggests that a combination of values and determinants can work together to promote CSATs’ adoption behavioral intentions in the absence of a combination of the two barrier factors, high cost and lack of awareness. Solution 4 scored the highest on unique coverage (0.034), indicating that it provided the most unique explanations. Solution 4 suggests that if the cooperative has perceived value of government environmental concern and value of openness to change, and the new technology is supported by extension services and recommendation by opinion leaders, the barrier of high cost may instead increase adoption intentions. High-cost technology adoption can be seen as a long-term investment, with cooperatives gaining a future competitive advantage by getting ahead of the game, especially when the cooperative believes that technology can deliver long-term gains and a competitive advantage [131]. Solution 5 scored the highest on consistency (0.968), suggesting that the combination of conditions has the best logical consistency. Solution 5 reveals the impact on the combination of determinants and barriers. After the lack of high cost and perceived risk, opinion leaders’ recommendation and agricultural extension service can dominate the behavioral intention of cooperatives to adopt CSATs, while at the same time, value of openness to change, policy support, and lack of awareness all contribute to adoption intention. Overall, the results of fsQCA are like the outcomes of PLS-SEM and ANN, but with some differences, revealing that values can play a greater role in combination with other variables and that barriers do not always reduce adoption intentions. FsQCA provides a richer interpretation of the results and offers robustness.

6.2. Theoretical Contribution

The prior literature has addressed numerous aspects of CSATs. However, few researchers have focused on the behavioral intentions to adopt CSATs and willingness to pay. In China, researchers have focused more on the technology’s performance rather than the factors affecting adoption intentions [22,23,25]. The current study provides much-needed theoretical support for the values and factors that influence the adoption behavior of Chinese cooperatives towards CSATs. This study uses the BRT framework to thoroughly understand Chinese cooperatives’ attitudes towards CSATs, including the role of values. In addition, this study extends the knowledge of cooperatives’ intentions towards CSAT adoption by introducing the concept of WTP. By integrating values, determinants, barriers, behavioral intentions, and willingness to pay, this study provides a comprehensive framework and thus a solid foundation for future research.
The study also provides methodological novelty to the field by combining symmetric and asymmetric relationship modeling. Including the new value, perceived value of government environmental concern, introduces a new perspective on values research in the Chinese context. The results of this study may be useful in formulating development strategies for CSATs in developing countries with low agricultural mechanization and modernization. Alternatively, the framework used in this study could be extended to these countries by including some country-specific factors.

6.3. Practical Contribution

As climate change and natural disasters continue to have an increasing impact on agricultural production, farmers are gradually turning to agricultural technologies that are resilient to such damage, such as high-yield seeds and greenhouses [5]. Adoption of CSATs is seen as a solution and cooperatives need to be open-minded to new technologies. The openness value of cooperatives and their concern for the environment will make them pay more attention to relevant technologies. Agri-technology companies can collaborate with government and policy making organizations to provide CSAT-related content popularization activities for cooperatives. In addition, policy support, recommendations from opinion leaders, and agricultural extension services can greatly influence cooperatives’ willingness to adopt, with agricultural extension services playing the most important role. Therefore, policymakers should respond to the focus of cooperatives’ concerns and formulate policies accordingly, such as providing technical support. For example, the government can lead free trial activities to allow cooperatives to learn more about the advantages of CSATs. Policies such as providing interest-free loans or cash subsidies to cooperatives that adopt new technologies can help them adopt high-cost technologies. In addition, agricultural technology companies should focus on the opinions of opinion leaders, and obtaining the support of opinion leaders can be through the extension services of technology. Whereas perceived risk has a negative impact on behavioral intention, such as fear of the complexity of the technology and concern about the effectiveness, the government and agricultural companies can reduce the distance between farmers and the technology by organizing more trial services or lectures and improving the perception of cooperatives [27]. When agri-technology companies can provide extension services and the technology is recommended by opinion leaders, high costs or lack of awareness can increase the cooperative’s intention to adopt, and they will expect more from the expensive product. Overall, this study provides government, policymakers, and agri-tech firms with options to promote the adoption of CSATs.

7. Conclusions

While the Chinese Government may directly intervene in the economic activities of rural cooperatives to achieve macroeconomic goals, standardized farmers’ cooperatives abroad are usually controlled by farmer members with clear decision-making and residual claim rights [132]. Therefore, it is necessary to take Chinese farmers’ cooperatives as the research object, and this research is unique and can provide theoretical support for future research on Chinese cooperatives. This study provides a comprehensive framework to understand the adoption intentions of cooperatives towards CSATs. This study uses the BRT framework to understand the effects of values, determinants, and barriers on the behavioral intentions of Chinese cooperatives towards adopting CSATs and further validates the effects on willingness to pay. Although values do not have a direct effect on adoption behavioral intentions, they can indirectly contribute to cooperatives’ adoption intentions of CSATs by shaping the determinants. The determinants that promote adoption are agricultural extension and advisory service, policy support, and opinion leaders’ recommendation, and barriers as perceived risk, with agricultural extension and advisory service contributing the most to adoption intention, followed by policy support and opinion leaders’ recommendation. Because Chinese farmers’ cooperatives are closer to the government, government-led policies or extension services are more likely to be determinants of technology adoption. Despite the sincere efforts of the authors, this study is not without limitations. The sample consisted of cooperatives from only four provinces in China, so it is not reasonable to generalize the results and findings to other regions. Instead, future research could focus on other regions or even other developing countries. In addition, the data collected in this study were cross-sectional and may not have captured temporal effects. Therefore, we call on researchers to conduct longitudinal studies to accommodate changes in behavioral intentions over time. This study is a cross-sectional study that only covers the perceptions of cooperatives on CSATs over the characteristic period, and subsequent researchers can use this study as a basis for a longitudinal follow-up study. Another limitation of this study is that only cooperatives were considered in this study for three main reasons. Firstly, cooperatives are much more economically strong and aware of technology compared to individual farmers [37]. Cooperatives can build or purchase large-scale equipment, such as biogas digesters, in a uniform manner, whereas individual farmers have limited strength. Secondly, the organization is more capable of fighting against risks, which makes the organization more inclined to embrace new technologies [87]. Thirdly, cooperatives work more closely with the government and are more likely to receive relevant policy support. Future research could focus more on individual farmers, after all, because cooperatives cannot be all things to all people regarding technology. The adoption of technologies by individual farmers is characterized by low cost, effectiveness, and simplicity. Future research could focus on specific technologies as research topics, such as drip irrigation technology or heat-tolerant seeds. In addition, this study focused on three determinants and three barriers, and future research can expand to study more influencing factors.

Author Contributions

Conceptualization, X.F. and S.Z.; methodology, X.F. and S.Z.; software, X.F.; validation, X.F., J.C. and Y.P.; formal analysis, X.F.; investigation, X.F. and J.C.; resources, X.F. and S.Z.; data curation, X.F. and Y.P.; writing—original draft preparation, X.F. and J.C.; writing—review and editing, X.F. and Z.M.; visualization, X.F. and S.Z.; supervision, S.Z.; project administration, S.Z.; funding acquisition, X.F. All authors have read and agreed to the published version of the manuscript.

Funding

This research received no external funding.

Institutional Review Board Statement

The study was conducted in accordance with the Declaration of Helsinki, and approved by Universiti Malaya Research Ethics Committee (UMREC) (UM.TNC2/UMREC_2517 and 16 May 2023).

Data Availability Statement

The data presented in this study are available on request from the corresponding author.

Acknowledgments

This work was supported by equipment funded through the “Intelligent Connected New Energy Vehicle Teaching System” project of Chongqing University of Technology, under the national initiative “Promote large-scale equipment renewals and trade-ins of consumer goods”.

Conflicts of Interest

The authors declare no conflicts of interest.

Abbreviations

The following abbreviations are used in this manuscript:
CSATsClimate-smart agricultural technologies
BRTBehavioral reasoning theory
ANNArtificial neural network
FsQCAFuzzy set qualitative comparative analysis
PLS-SEMPartial least squares structural equation modeling
WFPThe World Food Programme
CCClimate change
CSAClimate-smart agriculture
NCAPNational Climate-Smart Agriculture Programme
WTPWillingness to pay
VGECValue of government environmental concerns
VOCValue of openness to change
PSPolicy support
OLROpinion leaders’ recommendation
AEASAgricultural extension and advisory service
HCHigh cost
PRPerceived risk
LOALack of awareness
BIBehavioral Intention

Appendix A

Table A1. A concise summary table of prior studies.
AuthorsRegionTypeDeterminantsBarriersPopulationReference
Sanogo et al. (2023)MaliRice farming systems Limited input availability/lack of control over technologies/insufficient labor availability/insufficient availability/high cost of seedlings for reforestation/lack of information on developed technologies/limited land access for women and youthFarmers[85]
Pedersen et al. (2024)EuropeCSA practices technologiesPersonal drivers/technological-related drivers/economic drivers/social driversPersonal barriers/technological- or practice-related barriers/social barriers/institutional and policy barriers/economic barriersStakeholder[84]
Ma et al. (2024) CSA practicesLabor endowment/land tenure security/access to extension services/agricultural training/membership/support from NGO/climate conditions/access to information Smallholder farmers[89]
Rusha (2023)AfricaCSA practices and technologies Lack of appropriate policies and political commitment
Lack of knowledge/institutional constraints/financial constraints
Smallholder farmers[88]
Tran et al. (2020)VietnamWater-saving techniques improved stress-tolerant varietiesAccess to climate information/confidence on the know-how of extension/membership of social/agricultural groupsDistance to marketsFarmers[20]
Mallappa and Pathak (2023)IndiaCSATEducation level/annual income/exposure to agricultural mass media/participation in extension programs/innovativeness/achievement motivation/risk orientation/scientific orientationHigh cost of inputs/limited knowledge about CSAT/youth migration from rural areasFarmers[29]
Sattar et al. (2023)Fujian, ChinaCSATLandholding/loan access/access to agricultural extensions and organizations Farmers[25]
Autio et al. (2021)KenyaCSA practices technologiesAgricultural extension services/development interventionsLack of awareness/uncertainty in product prices/lack of land ownership/scarcity of arable land/lack of capitalFarmers[90]
Table A2. Measurement items.
ConstructsItemsMy Cooperative
Perceived value of government environmental concern (VGEC)VGEC1the government is of the opinion that messing with nature might have terrible results.
VGEC2the government acknowledges that other living things, including plants and animals, have the same right to life as humans do.
VGEC3the government considers it likely that humans are engaging in severe environmental abuse.
VGEC4the government concerns with the limited resources that we currently have
VGEC5the government is aware of any news regarding environmental protection.
VGEC6the government is very concerned about the condition of the environment worldwide, and we think that the environment has been seriously affected.
VGEC7the government thinks people can be protectors as well.
VGEC8the government is of the opinion that the development of agriculture is greatly benefited by a healthy ecological environment.
VGEC9the government wants to avoid utilizing technology and purchasing things that hurt the environment.
Value of openness to change (VOC)VOC1is constantly exploring new farming techniques.
VOC2is willing to try out novel ideas and farming techniques.
VOC3is open to trying out new farming techniques.
VOC4is prepared for risk-taking and adventure.
VOC5is open to experimenting with any farming innovations, not only new methods.
VOC6believes that new methods and technologies can help us earn more money in the future.
Policy support (PS)PS1is encouraged by the government to be more creative in assisting farmers.
PS2may receive government assistance among the digital infrastructure.
PS3has taken significant steps to implement climate change rules and regulations.
PS4will be more willing to try CSAT if receiving government funding.
PS5is more willing to try CSAT if our products qualify for tax breaks.
PS6is able to raise awareness of the adoption of CSAT because of the present government’s marketing efforts.
PS7is influenced to adopt CAST because of the government promotions and encouragement.
Opinion leader’s recommendationOLR1is influenced by opinion leaders
OLR 2has the history of success of past technologies taking
OLR 3has a track record of success with previous technologies.
OLR 4will consider recommendations from opinion leaders.
OLR 5has faith that opinion leaders will carefully consider their choices.
OLR 6will take technologies that others have successfully used in the past.
OLR 7will save time learning how to use technologies if opinion leaders have used new technologies before.
Agricultural extension and advisory service (AEAS)AEAS1is able to contact extension services on CSAT
AEAS 2can know well about CSAT through extension services
AEAS 3is able to get what we exactly want to know about the CSAT
AEAS 4knows that extension services are essential for new technologies.
AEAS 5knows that extension services are essential for farming
AEAS 6knows that extension services can make true and useful information flow to farmers.
AEAS 7knows that extension services can establish trust relations between technology providers and farmers.
High cost (HC)HC1feels that the price of CSAT is extremely high.
HC2feels the other expenses will be high for CSAT.
HC3considers the costs for the CSAT certificates are high.
HC4deems CSAT seem to have a low price/performance ratio.
HC5considers CSAT are not fair prices in terms of cost performance.
HC6considers CSAT have higher input costs than other technologies.
HC7believes CSAT seem to have a lower cost performance ratio compared to the current technologies.
Perceived risk (PR)PR1considers CSAT may have technical risk.
PR2considers CSAT may not improve the efficiency of agricultural management.
PR3fears that our electronic devices may be misused by the collection center.
PR4feels a risk that CSAT provider companies will share the data of our farm with other farmers without our farmers’ cooperative’s consent.
PR5receives a high risk that data from our farmers’ cooperative will allow agriculture technology providers to make decisions about our farms.
PR6will increase the costs of farming
PR7fears CAST may not improve the grower’s revenue.
Lack of awareness (LOA)LOA1is confused that if CAST will not benefit our farming
LOA2fears what they say about function of CAST is an exaggeration
LOA3is not sure if CAST will help me a lot with my farming
LOA4believes Climate-change threats to farming are exaggerated
LOA5believes CAST cannot help with environmental protection
LOA6believes not many species will become extinct in the next decade thousands
LOA7thinks environmental protection cannot improve our quality of life
LOA8thinks environmental protection doesn’t mean a better world
Behavioral intention (BI)BI 1has a strong likelihood to buy CSAT.
BI 2intends to use CSAT in agricultural production.
BI 3intends to recommend CSAT to others.
BI 4has plans to adopt CSAT within next five years.
BI 5considers buying CSAT.
BI 6intends to use CSAT forever.
BI 7believes we have to use CSAT for farming in the near future.
Willingness to pay (WTP)WTP1would like to pay for CSAT
WTP2is able to pay a premium to purchase CSAT
WTP3is interested to pay a higher price for CSAT than similar agricultural technology.
WTP4will use CSAT in agricultural firming even if the price increases.
WTP5will use CSAT via information technology devices, even if the price increases.
WTP6doesn’t bother to pay more to make sure we can buy the real CSAT
WTP7has a very high willingness to pay more to purchase CSAT.
Table A3. Descriptive analysis results.
CategorySub-CategoryFull Sample
(N = 308)
Frequency
Percentage (%)
Length of cooperatives≤5 years9129.55%
6–10 years15249.35%
11–20 years6521.10%
Size of cooperatives≤5 members8728.25%
6–10 members15851.30%
11–40 members6320.45%
LocationShandong4715.26%
Henan4715.26%
Hebei16453.25%
Sichuan5016.23%
Average age41–50 years old18058.44%
Over 50 years old12841.56%
Service provided by cooperatives (can choose more than one)Sales7725.00%
Storage3511.36%
Event support14948.38%
Transportation16453.25%
Information Service289.09%
Processing3511.36%
Agricultural technical support18459.74%
Procurement of product materials12339.94%
Table A4. Results of outer loadings values.
ItemsOuter LoadingItemsOuter LoadingItemsOuter LoadingItemsOuter LoadingItemsOuter Loading
VGEC10.820AEAS10.697OLR10.784HC10.712BI10.760
VGEC20.715AEAS20.747OLR20.694HC20.716BI20.768
VGEC30.768AEAS30.789OLR30.807HC30.793BI30.792
VGEC40.734AEAS40.737OLR40.757HC40.763BI40.727
VGEC50.779AEAS50.713OLR50.767HC50.809BI50.696
VGEC60.766AEAS60.711OLR60.751HC60.811BI60.711
VGEC70.777AEAS70.769OLR70.804HC70.780BI70.768
VGEC80.763PS10.741PR10.682LOA10.718WTP10.756
VGEC90.770PS20.736PR20.710LOA20.772WTP20.762
VOC10.756PS30.748PR30.754LOA30.789WTP30.801
VOC20.699PS40.759PR40.757LOA40.750WTP40.753
VOC30.732PS50.754PR50.724LOA50.692WTP50.742
VOC40.795PS60.734PR60.766LOA60.752WTP60.710
VOC50.666PS70.740PR70.791LOA70.748WTP70.790
VOC60.768 LOA80.759
Table A5. Analysis of mediating effects.
RelationshipTotal EffectDirect EffectIndirect EffectVAFCI LLCI ULMediation
βT ValueβT ValueβT Value
VGEC → AEAS → BI0.2533.924 ***0.0390.7990.0782.882 ***31%0.0370.124Partial Mediation
VGEC → HC → BI0.2533.924 ***0.0390.7990.0090.5664%−0.0150.037No Mediation
VGEC → LOA → BI0.2533.924 ***0.0390.799−0.0050.267−2%−0.0340.024No Mediation
VGEC → OLR → BI0.2533.924 ***0.0390.7990.0422.269 **17%0.0140.074Weak Mediation
VGEC → PR → BI0.2533.924 ***0.0390.7990.0522.624 ***20%0.0230.087Partial Mediation
VGEC → PS → BI0.2533.924 ***0.0390.7990.0391.924 **15%0.0090.075Weak Mediation
VOC → AEAS → BI0.2914.613 ***0.0340.6060.0863.309 ***30%0.0450.130Partial Mediation
VOC → HC → BI0.2914.613 ***0.0340.6060.0080.5503%−0.0120.033No Mediation
VOC → LOA → BI0.2914.613 ***0.0340.606−0.0050.271−2%−0.0350.027No Mediation
VOC → OLR → BI0.2914.613 ***0.0340.6060.0692.378 ***24%0.0250.120Partial Mediation
VOC → PR → BI0.2914.613 ***0.0340.6060.0592.603 ***20%0.0260.100Partial Mediation
VOC → PS → BI0.2914.613 ***0.0340.6060.0401.941 **14%0.0090.076Weak Mediation
** p < 0.05, *** p < 0.01.

References

  1. Wudu, K.; Abegaz, A.; Ayele, L.; Ybabe, M. The impacts of climate change on biodiversity loss and its remedial measures using nature based conservation approach: A global perspective. Biodivers. Conserv. 2023, 32, 3681–3701. [Google Scholar] [CrossRef]
  2. Zhu, T.; Fonseca De Lima, C.F.; De Smet, I. The heat is on: How crop growth, development, and yield respond to high temperature. J. Exp. Bot. 2021, 72, 7359–7373. [Google Scholar] [CrossRef] [PubMed]
  3. Frame, D.J.; Rosier, S.M.; Noy, I.; Harrington, L.J.; Carey-Smith, T.; Sparrow, S.N.; Stone, D.A.; Dean, S.M. Climate change attribution and the economic costs of extreme weather events: A study on damages from extreme rainfall and drought. Clim. Change 2020, 162, 781–797. [Google Scholar] [CrossRef]
  4. Zhang, Q.; Wang, Y. Distribution of hazard and risk caused by agricultural drought and flood and their correlations in summer monsoon-affected areas of China. Theor. Appl. Climatol. 2022, 149, 965–981. [Google Scholar] [CrossRef]
  5. Haj-Amor, Z.; Araya, T.; Kim, D.G.; Bouri, S.; Lee, J.; Ghilou, W.; Yang, Y.; Kang, H.; Jhariya, M.K.; Banerjee, A.; et al. Soil salinity and its associated effects on soil microorganisms, greenhouse gas emissions, crop yield, biodiversity and desertification: A review. Sci. Total Environ. 2022, 843, 156946. [Google Scholar] [CrossRef] [PubMed]
  6. Gameda, C.; Gelata, F.T.; Jiqin, H. Review of adoption and impact assessment on conservation agriculture in Ethiopia. Int. J. Mark. Hum. Resour. Res. 2022, 3, 203–210. [Google Scholar] [CrossRef]
  7. WFP. Climate Crisis and Malnutrition—A Case for Acting Now. August 2021. Available online: https://docs.wfp.org/api/documents/WFP-0000131581/download/?_ga=2.38385056.2099735367.1737877901-534930147.1737877900 (accessed on 15 March 2025).
  8. Peng, Y.; Yang, X.; Li, D.; Ma, Z.; Liu, Z.; Bai, X.; Mao, Z. Predicting flow status of a flexible rectifier using cognitive computing. Expert Syst. Appl. 2025, 264, 125878. [Google Scholar] [CrossRef]
  9. Peng, Y.; Li, D.; Yang, X.; Ma, Z.; Mao, A. Review on Electrohydrodynamic (EHD) Pump. Micromachines 2023, 14, 321. [Google Scholar] [CrossRef]
  10. Hussain, S.; Amin, A.; Mubeen, M.; Khaliq, T.; Shahid, M.; Hammad, H.M.; Sultana, S.R.; Awais, M.; Murtaza, B.; Amjad, M. Climate smart agriculture (CSA) technologies. In Building Climate Resilience in Agriculture: Theory, Practice and Future Perspective; Springer: Berlin/Heidelberg, Germany, 2022; pp. 319–338. [Google Scholar]
  11. Mizik, T. Climate-Smart Agriculture on Small-Scale Farms: A Systematic Literature Review. Agronomy 2021, 11, 1096. [Google Scholar] [CrossRef]
  12. Kirina, T.; Groot, A.; Shilomboleni, H.; Ludwig, F. Demissie. Scaling Climate Smart Agriculture in East Africa: Experiences and Lessons. Agronomy 2022, 12, 820. [Google Scholar] [CrossRef]
  13. Sarker, M.N.I.; Hossain, B.; Shi, G.Q.; Firdaus, R.B.R. Promoting net-zero economy through climate-smart agriculture: Transition towards sustainability. Sustain. Sci. 2023, 18, 2107–2119. [Google Scholar] [CrossRef]
  14. Praveen, B.; Sharma, P. A review of literature on climate change and its impacts on agriculture productivity. J. Public Aff. 2019, 19, e1960. [Google Scholar] [CrossRef]
  15. Parra-López, C.; Abdallah, S.B.; Garcia-Garcia, G.; Hassoun, A.; Sánchez-Zamora, P.; Trollman, H.; Jagtap, S. Carmona-Torres. Integrating digital technologies in agriculture for climate change adaptation and mitigation: State of the art and future perspectives. Comput. Electron. Agric. 2024, 226, 109412. [Google Scholar] [CrossRef]
  16. Jiang, J. Research on the mechanism of green industry investment to promote sustainable utilization of water resources. Int. J. Low-Carbon Technol. 2024, 19, 2709–2716. [Google Scholar] [CrossRef]
  17. DeFries, R.; Liang, S.F.; Chhatre, A.; Davis, K.F.; Ghosh, S.; Rao, N.D.; Singh, D. Climate resilience of dry season cereals in India. Sci. Rep. 2023, 13, 9960. [Google Scholar] [CrossRef]
  18. Taufiq-Hail, A.; Yusof, S.A.B.; Al Shamsi, I.R.H.; Bino, E.; Saleem, M.; Mahmood, M.; Kamran, H. Investigating the impact of customer satisfaction, trust, and quality of services on the acceptance of delivery services companies and related applications in Omani context: A Predictive model assessment using PLSpredict. Cogent Bus. Manag. 2023, 10, 2224173. [Google Scholar] [CrossRef]
  19. Andati, P.; Majiwa, E.; Ngigi, M.; Mbeche, R.; Ateka, J. Effect of climate smart agriculture technologies on crop yields: Evidence from potato production in Kenya. Clim. Risk Manag. 2023, 41, 100539. [Google Scholar] [CrossRef]
  20. Tran, N.L.D.; Rañola, R.F.; Sander, B.O.; Reiner, W.; Nguyen, D.T.; Nong, N.K.N. Determinants of adoption of climate-smart agriculture technologies in rice production in Vietnam. Int. J. Clim. Change Strateg. Manag. 2019, 12, 238–256. [Google Scholar] [CrossRef]
  21. Traore, B.; Birhanu, B.Z.; Sangaré, S.; Gumma, M.K.; Tabo, R.; Whitbread, A.M. Contribution of Climate-Smart Agriculture Technologies to Food Self-Sufficiency of Smallholder Households in Mali. Sustainability 2021, 13, 7757. [Google Scholar] [CrossRef]
  22. Chengliang, L.; Hongzhen, L.; Yanming, L.; Liang, G.; Zhonghua, M. Analysis on status and development trend of intelligent control technology for agricultural equipment. Nongye Jixie Xuebao/Trans. Chin. Soc. Agric. Mach. 2020, 51. [Google Scholar]
  23. NGOIC. Jilin: Promoting High-Quality Development of Agricultural Mechanisation to Build the Foundation of Food Security. 2022. Available online: https://mp.weixin.qq.com/s?__biz=MzIzMDE5NTM1MQ==&mid=2651939479&idx=5&sn=df0d491fc43d25fd502859b2d8922599&chksm=f352eb6fc4256279af9749ae2a8e45ea08cf77413edb103a2bb092bb8f27b43b2c3983fa8399&scene=27 (accessed on 15 March 2025).
  24. Zhang, X. Alternative Perspectives on Fostering Inclusive and Sustainable Development: Three Cases of Rural Development in China. Ph.D. Thesis, SOAS University of London, London, UK, 2024. [Google Scholar]
  25. Sattar, R.S.; Mehmood, M.S.; Raza, M.H.; Wijeratne, V.; Shahbaz, B. Evaluating adoption of climate smart agricultural practices among farmers in the Fujian Province, China. Environ. Sci. Pollut. Res. 2023, 30, 45331–45341. [Google Scholar] [CrossRef] [PubMed]
  26. Cheng, W.J.; Li, Y.H.; Zuo, W.J.; Du, G.M.; Stanny, M. Spatio-temporal detection of agricultural disaster vulnerability in the world and implications for developing climate-resilient agriculture. Sci. Total Environ. 2024, 928, 172412. [Google Scholar] [CrossRef]
  27. Zhu, H.; Geng, C.; Chen, Y. Urban–Rural Integration and Agricultural Technology Innovation: Evidence from China. Agriculture 2024, 14, 1906. [Google Scholar] [CrossRef]
  28. Tong, Q.M.; Yuan, X.Y.; Zhang, L.; Zhang, J.B.; Li, W.J. The impact of livelihood capitals on farmers’ adoption of climate-smart agriculture practices: Evidence from rice production in the Jianghan Plain, China. Clim. Risk Manag. 2024, 43, 100583. [Google Scholar] [CrossRef]
  29. Mallappa, V.K.H.; Pathak, T.B. Climate smart agriculture technologies adoption among small-scale farmers: A case study from Gujarat, India. Front. Sustain. Food Syst. 2023, 7, 1202485. [Google Scholar] [CrossRef]
  30. Dou, X.; Wei, X. Extension of Climate Smart Agriculture Technology and its Policy Effects in China. J. Dev. Areas 2023, 57, 105–112. [Google Scholar] [CrossRef]
  31. Aziz, M.A.; Ayob, N.H.; Ayob, N.A.; Ahmad, Y.; Abdulsomad, K. Factors influencing farmer adoption of climate-smart agriculture technologies: Evidence from Malaysia. Hum. Technol. 2024, 20, 70–92. [Google Scholar] [CrossRef]
  32. Lee, C.-L.; Orton, G.; Lu, P. Global Meta-Analysis of Innovation Attributes Influencing Climate-Smart Agriculture Adoption for Sustainable Development. Climate 2024, 12, 192. [Google Scholar] [CrossRef]
  33. Gemtou, M.; Kakkavou, K.; Anastasiou, E.; Fountas, S.; Pedersen, S.M.; Isakhanyan, G.; Erekalo, K.T. Pazos-Vidal. Farmers’ Transition to Climate-Smart Agriculture: A Systematic Review of the Decision-Making Factors Affecting Adoption. Sustainability 2024, 16, 2828. [Google Scholar] [CrossRef]
  34. Sahu, A.K.; Padhy, R.; Dhir, A. Envisioning the future of behavioral decision-making: A systematic literature review of behavioral reasoning theory. Australas. Mark. J. 2020, 28, 145–159. [Google Scholar] [CrossRef]
  35. Sisay, T.; Tesfaye, K.; Ketema, M.; Dechassa, N.; Getnet, M. Climate-Smart Agriculture Technologies and Determinants of Farmers’ Adoption Decisions in the Great Rift Valley of Ethiopia. Sustainability 2023, 15, 3471. [Google Scholar] [CrossRef]
  36. Mutenje, M.J.; Farnworth, C.R.; Stirling, C.; Thierfelder, C.; Mupangwa, W.; Nyagumbo, I. A cost-benefit analysis of climate-smart agriculture options in Southern Africa: Balancing gender and technology. Ecol. Econ. 2019, 163, 126–137. [Google Scholar] [CrossRef]
  37. Valentinov, V. Why are cooperatives important in agriculture? An organizational economics perspective. J. Institutional Econ. 2007, 3, 55–69. [Google Scholar] [CrossRef]
  38. Hew, J.-J.; Lee, V.-H.; Leong, L.-Y. Why do mobile consumers resist mobile commerce applications? A hybrid fsQCA-ANN analysis. J. Retail. Consum. Serv. 2023, 75, 103526. [Google Scholar] [CrossRef]
  39. Singh, R.; Singh, G.S. Traditional agriculture: A climate-smart approach for sustainable food production. Energy Ecol. Environ. 2017, 2, 296–316. [Google Scholar] [CrossRef]
  40. Shen, X.; Jin, S.; Liang, Z.H.; Ao, R.J. Unravelling the effects of straw return on rice production in central China: Evidence for future policy-making. Soil Use Manag. 2024, 40, e13118. [Google Scholar] [CrossRef]
  41. Mao, Z.; Hosoya, N.; Maeda, S. Flexible electrohydrodynamic fluid-driven valveless water pump via immiscible interface. Cyborg Bionic Syst. 2024, 5, 0091. [Google Scholar] [CrossRef]
  42. Sato, Y.; Peng, Y.; Funabora, Y.; Doki, S. Funabot-finger cot: Bio-inspired worm robot for peristaltic wave locomotion and tubular structure climbing. In Proceedings of the 2024 IEEE/SICE International Symposium on System Integration (SII), Ha Long, Vietnam, 8–11 January 2024. [Google Scholar]
  43. Mao, Z.; Yoshida, K.; Kim, J.-W. Fast packaging by a partially-crosslinked SU-8 adhesive tape for microfluidic sensors and actuators. Sens. Actuators A-Phys. 2019, 289, 77–86. [Google Scholar] [CrossRef]
  44. Inoue, Y. Satellite- and drone-based remote sensing of crops and soils for smart farming—A review. Soil Sci. Plant Nutr. 2020, 66, 798–810. [Google Scholar] [CrossRef]
  45. Mao, Z.; Kobayashi, R.; Nabae, H.; Suzumori, K. Multimodal strain sensing system for shape recognition of tensegrity structures by combining traditional regression and deep learning approaches. IEEE Robot. Autom. Lett. 2024, 9, 10050–10056. [Google Scholar] [CrossRef]
  46. Liang, Z.; Zhang, L.; Li, W.; Zhang, J.; Frewer, L.J. Adoption of combinations of adaptive and mitigatory climate-smart agricultural practices and its impacts on rice yield and income: Empirical evidence from Hubei, China. Clim. Risk Manag. 2021, 32, 100314. [Google Scholar] [CrossRef]
  47. Li, L.; Huang, Y. Sustainable Agriculture in the Face of Climate Change: Exploring Farmers’ Risk Perception, Low-Carbon Technology Adoption, and Productivity in the Guanzhong Plain of China. Water 2023, 15, 2228. [Google Scholar] [CrossRef]
  48. Xin, Y.; Tao, F. Have the agricultural production systems in the North China Plain changed towards to climate smart agriculture since 2000? J. Clean. Prod. 2021, 299, 126940. [Google Scholar] [CrossRef]
  49. Westaby, J.D. Behavioral reasoning theory: Identifying new linkages underlying intentions and behavior. Organ. Behav. Hum. Decis. Process. 2005, 98, 97–120. [Google Scholar] [CrossRef]
  50. Nicholls, J.; Schimmel, K. Satisfaction as reasons for and against generosity decisions: A behavioral reasoning theory exploration. Mark. Manag. J. 2016, 26, 86–100. [Google Scholar]
  51. Claudy, M.C.; Peterson, M.; O’driscoll, A. Understanding the attitude-behavior gap for renewable energy systems using behavioral reasoning theory. J. Macromark. 2013, 33, 273–287. [Google Scholar] [CrossRef]
  52. Tufail, H.S.; Yaqub, R.M.S.; Alsuhaibani, A.M.; Ramzan, S.; Shahid, A.U.; Refat, M.S. Consumers’ purchase intention of suboptimal food using behavioral reasoning theory: A food waste reduction strategy. Sustainability 2022, 14, 8905. [Google Scholar] [CrossRef]
  53. Wertenbroch, K.; Skiera, B. Measuring consumers’ willingness to pay at the point of purchase. J. Mark. Res. 2002, 39, 228–241. [Google Scholar] [CrossRef]
  54. Dey, M.M.; Rahman, M.S.; Dewan, M.F.; Sudhakaran, P.O.; Deb, U.; Khan, M.A. Consumers’ willingness to pay for safer fish: Evidence from experimental auctions in Bangladesh. Aquac. Econ. Manag. 2024, 28, 460–490. [Google Scholar] [CrossRef]
  55. Elahi, E.; Khalid, Z.; Zhang, Z. Understanding farmers’ intention and willingness to install renewable energy technology: A solution to reduce the environmental emissions of agriculture. Appl. Energy 2022, 309, 118459. [Google Scholar] [CrossRef]
  56. Yang, M.; Gao, J.; Yang, Q.; Al Mamun, A.; Masukujjaman, M.; Hoque, M.E. Modeling the intention to consume and willingness to pay premium price for 3D-printed food in an emerging economy. Humanit. Soc. Sci. Commun. 2024, 11, 274. [Google Scholar] [CrossRef]
  57. Schniederjans, D.G.; Starkey, C.M. Intention and willingness to pay for green freight transportation: An empirical examination. Transp. Res. Part D Transp. Environ. 2014, 31, 116–125. [Google Scholar] [CrossRef]
  58. Xia, D.; Chen, W.; Gao, Q.; Zhang, R.; Zhang, Y. Research on enterprises’ intention to adopt green technology imposed by environmental regulations with perspective of state ownership. Sustainability 2021, 13, 1368. [Google Scholar] [CrossRef]
  59. Wang, B.; Hu, D.; Hao, D.; Li, M.; Wang, Y. Influence of government information on farmers’ participation in rural residential environment governance: Mediating effect analysis based on moderation. Int. J. Environ. Res. Public Health 2021, 18, 12607. [Google Scholar] [CrossRef] [PubMed]
  60. Hsu, H.-Y.; Liu, F.-H.; Tsou, H.-T.; Chen, L.-J. Openness of technology adoption, top management support and service innovation: A social innovation perspective. J. Bus. Ind. Mark. 2019, 34, 575–590. [Google Scholar] [CrossRef]
  61. Tewari, A.; Mathur, S.; Srivastava, S.; Gangwar, D. Examining the role of receptivity to green communication, altruism and openness to change on young consumers’ intention to purchase green apparel: A multi-analytical approach. J. Retail. Consum. Serv. 2022, 66, 102938. [Google Scholar] [CrossRef]
  62. Lin, T.; Ko, A.P.; Than, M.M.; Catacutan, D.C.; Finlayson, R.F.; Isaac, M.E. Farmer social networks: The role of advice ties and organizational leadership in agroforestry adoption. PLoS ONE 2021, 16, e0255987. [Google Scholar] [CrossRef]
  63. Jayashankar, P.; Nilakanta, S.; Johnston, W.J.; Gill, P.; Burres, R. IoT adoption in agriculture: The role of trust, perceived value and risk. J. Bus. Ind. Mark. 2018, 33, 804–821. [Google Scholar] [CrossRef]
  64. Fransson, N.; Gärling, T. Environmental concern: Conceptual definitions, measurement methods, and research findings. J. Environ. Psychol. 1999, 19, 369–382. [Google Scholar] [CrossRef]
  65. Ruan, H.; Qiu, L.; Chen, J.; Liu, S.; Ma, Z. Government trust, environmental pollution perception, and environmental governance satisfaction. Int. J. Environ. Res. Public Health 2022, 19, 9929. [Google Scholar] [CrossRef]
  66. FAO. Public Sector Agricultural Extension. Available online: https://www.fao.org/4/Y5061E/y5061e06.htm?utm_source=chatgpt.com (accessed on 8 April 2025).
  67. Maake, M.M.S.; Antwi, M.A. Farmer’s perceptions of effectiveness of public agricultural extension services in South Africa: An exploratory analysis of associated factors. Agric. Food Secur. 2022, 11, 34. [Google Scholar] [CrossRef]
  68. Li, J.; Liu, G.; Chen, Y.; Li, R. Study on the influence mechanism of adoption of smart agriculture technology behavior. Sci. Rep. 2023, 13, 8554. [Google Scholar] [CrossRef]
  69. Granado-Díaz, R.; Colombo, S.; Romero-Varo, M.; Villanueva, A.J. Farmers’ attitudes toward the use of digital technologies in the context of agri-environmental policies. Agric. Syst. 2024, 221, 104129. [Google Scholar] [CrossRef]
  70. Zhang, Z.; Zhang, L.; Cui, J. A study of the impact of risk perception on the pro-environmental behaviour of herders in the Sanjiangyuan region. Sci. Rep. 2024, 14, 6788. [Google Scholar] [CrossRef]
  71. Augustsson, H.; Richter, A.; Hasson, H.; von Thiele Schwarz, U. The need for dual openness to change: A longitudinal study evaluating the impact of employees’ openness to organizational change content and process on intervention outcomes. J. Appl. Behav. Sci. 2017, 53, 349–368. [Google Scholar] [CrossRef]
  72. Ruzzante, S.; Labarta, R.; Bilton, A. Adoption of agricultural technology in the developing world: A meta-analysis of the empirical literature. World Dev. 2021, 146, 105599. [Google Scholar] [CrossRef]
  73. Zhang, X.; Yang, Q.; Al Mamun, A.; Masukujjaman, M.; Masud, M.M. Acceptance of new agricultural technology among small rural farmers. Humanit. Soc. Sci. Commun. 2024, 11, 1641. [Google Scholar] [CrossRef]
  74. Becerra-Encinales, J.F.; Bernal-Hernandez, P.; Beltrán-Giraldo, J.A.; Cooman, A.P.; Reyes, L.H.; Cruz, J.C. Agricultural Extension for Adopting Technological Practices in Developing Countries: A Scoping Review of Barriers and Dimensions. Sustainability 2024, 16, 3555. [Google Scholar] [CrossRef]
  75. Colton, J.S. Adoption, diffusion, and scaling of agricultural technologies in developing countries. In Sustainable Agriculture Reviews; Springer: Berlin/Heidelberg, Germany; Volume 18, 2015; pp. 45–75. [Google Scholar] [CrossRef]
  76. Munz, J.; Maurmann, I.; Schuele, H.; Doluschitz, R. Digital transformation at what cost? A case study from Germany estimating the adoption potential of precision farming technologies under different scenarios. Smart Agric. Technol. 2024, 9, 100585. [Google Scholar] [CrossRef]
  77. Niles, M.T.; Stahlmann-Brown, P.; Wesselbaum, D. Risk tolerance and climate concerns predict transformative agricultural land use change. Agric. Syst. 2025, 223, 104195. [Google Scholar] [CrossRef]
  78. Spiegel, A.; Britz, W.; Finger, R. Risk, risk aversion, and agricultural technology adoption—A novel valuation method based on real options and inverse stochastic dominance. Q Open 2021, 1, qoab016. [Google Scholar] [CrossRef]
  79. Tabe-Ojong, M.P.J.; Kedinga, M.E.; Gebrekidan, B.H. Behavioural factors matter for the adoption of climate-smart agriculture. Sci. Rep. 2024, 14, 798. [Google Scholar] [CrossRef] [PubMed]
  80. Guo, Z.; Chen, X.; Zhang, Y. Impact of environmental regulation perception on farmers’ agricultural green production technology adoption: A new perspective of social capital. Technol. Soc. 2022, 71, 102085. [Google Scholar] [CrossRef]
  81. Meyer, N.; Trandafir, S. Public attitudes and preferences for green rooftop technologies in the US: A choice experiment. Agric. Resour. Econ. Rev. 2023, 52, 320–346. [Google Scholar] [CrossRef]
  82. Shen, Y.; Shi, R.; Yao, L.; Zhao, M. Perceived value, government regulations, and farmers’ agricultural green production technology adoption: Evidence from China’s Yellow River Basin. Environ. Manag. 2024, 73, 509–531. [Google Scholar] [CrossRef]
  83. Alifah, Q.; Kusumawati, N. Determining Determinants and Barriers that Influence Smart Home Appliances Adoption Intention Using the Behavioral Reasoning Theory Method. In Proceedings of the 4th International Conference on Economics, Business and Economic Education Science (ICE-BEES 2021), Semarang, Indonesia, 27–28 July 2021. [Google Scholar]
  84. Pedersen, S.M.; Erekalo, K.T.; Christensen, T.; Denver, S.; Gemtou, M.; Fountas, S.; Isakhanyan, G.; Rosemarin, A.; Ekane, N.; Puggaard, L. Drivers and Barriers to Climate-Smart Agricultural Practices and Technologies Adoption: Insights from stakeholders of Five European Food Supply Chains. Smart Agric. Technol. 2024, 8, 100478. [Google Scholar] [CrossRef]
  85. Ma, W.; Rahut, D.B. Climate-smart agriculture: Adoption, impacts, and implications for sustainable development. Mitig. Adapt. Strateg. Glob. Change 2024, 29, 44. [Google Scholar] [CrossRef]
  86. Song, Z.; Ren, Y.; Li, J. Exploring Factors Affecting Millennial Tourists’ eWOM Behavior: A Lens of BRT Theory. Behav. Sci. 2024, 14, 1056. [Google Scholar] [CrossRef]
  87. Feng, X.; Zailani, S. The Antecedents of the Willingness to Adopt and Pay for Climate-Smart Agricultural Technology Among Cooperatives in China. Sustainability 2024, 17, 19. [Google Scholar] [CrossRef]
  88. Wakweya, R.B. Challenges and prospects of adopting climate-smart agricultural practices and technologies: Implications for food security. J. Agric. Food Res. 2023, 14, 100698. [Google Scholar] [CrossRef]
  89. Sanogo, K.; Touré, I.; Arinloye, D.-D.A.; Dossou-Yovo, E.R.; Bayala, J. Factors affecting the adoption of climate-smart agriculture technologies in rice farming systems in Mali, West Africa. Smart Agric. Technol. 2023, 5, 100283. [Google Scholar] [CrossRef]
  90. Autio, A.; Johansson, T.; Motaroki, L.; Minoia, P.; Pellikka, P. Constraints for adopting climate-smart agricultural practices among smallholder farmers in Southeast Kenya. Agric. Syst. 2021, 194, 103284. [Google Scholar] [CrossRef]
  91. Anwar, R.; Salehudin, I.; Mukhlish, B.M.; Ririh, K. Intention to Adopt and Willingness to Pay: Mass Rapid Transport System in Greater Jakarta, Indonesia. Soc. Sci. Res. Netw. 2015, 18. [Google Scholar] [CrossRef]
  92. Olum, S.; Gellynck, X.; Juvinal, J.; Ongeng, D.; De Steur, H. Farmers’ adoption of agricultural innovations: A systematic review on willingness to pay studies. Outlook Agric. 2020, 49, 187–203. [Google Scholar] [CrossRef]
  93. Barman, S.; Neog, P.K. Farmers’ Willingness to Pay for Climate Smart Agriculture in Flood Vulnerable Areas of Assam. Indian J. Ext. Educ. 2024, 60, 13–18. [Google Scholar] [CrossRef]
  94. Anugwa, I.Q.; Onwubuya, E.A.; Chah, J.M.; Abonyi, C.C.; Nduka, E.K. Farmers’ preferences and willingness to pay for climate-smart agricultural technologies on rice production in Nigeria. Clim. Policy 2022, 22, 112–131. [Google Scholar] [CrossRef]
  95. Akudugu, M.; Nkegbe, P.; Wongnaa, C.; Millar, K. Technology adoption behaviors of farmers during crises: What are the key factors to consider? J. Agric. Food Res. 2023, 14, 100694. [Google Scholar] [CrossRef]
  96. Peng, Y.; Sakai, Y.; Funabora, Y.; Yokoe, K.; Aoyama, T.; Doki, S. Funabot-Sleeve: A Wearable Device Employing McKibben Artificial Muscles for Haptic Sensation in the Forearm. IEEE Robot. Autom. Lett. 2025, 10, 1944–1951. [Google Scholar] [CrossRef]
  97. Oyetade, K.; Harmse, A.; Zuva, T. Internal organizational factors influencing ICT adoption for sustainable growth. Discov. Glob. Soc. 2024, 2, 108. [Google Scholar] [CrossRef]
  98. Zhang, C.; Chen, J.; Li, J.; Peng, Y.; Mao, Z. Large language models for human–robot interaction: A review. Biomim. Intell. Robot. 2023, 3, 100131. [Google Scholar] [CrossRef]
  99. Yokamo, S. Adoption of improved agricultural technologies in developing countries: Literature review. Int. J. Food Sci. Agric 2020, 4, 183–190. [Google Scholar] [CrossRef]
  100. Mao, Z.; Bai, X.; Shen, Y. Design, modeling, and characteristics of ring-shaped robot actuated by functional fluid. J. Intell. Mater. Syst. Struct. 2024, 35, 1459–1470. [Google Scholar] [CrossRef]
  101. Shi, Y.; Siddik, A.B.; Masukujjaman, M.; Zheng, G.; Hamayun, M.; Ibrahim, A.M. The antecedents of willingness to adopt and pay for the IoT in the agricultural industry: An application of the UTAUT 2 theory. Sustainability 2022, 14, 6640. [Google Scholar] [CrossRef]
  102. Wu, F. Adoption and income effects of new agricultural technology on family farms in China. PLoS ONE 2022, 17, e0267101. [Google Scholar] [CrossRef]
  103. Pillai, R.; Sivathanu, B. Adoption of internet of things (IoT) in the agriculture industry deploying the BRT framework. Benchmark. Int. J. 2020, 27, 1341–1368. [Google Scholar] [CrossRef]
  104. Cakirli Akyüz, N.; Theuvsen, L. The impact of behavioral drivers on adoption of sustainable agricultural practices: The case of organic farming in Turkey. Sustainability 2020, 12, 6875. [Google Scholar] [CrossRef]
  105. Li, W.; Clark, B.; Taylor, J.A.; Kendall, H.; Jones, G.; Li, Z.; Zhao, C.; Yang, G.; Shuai, C. A hybrid modelling approach to understanding adoption of precision agriculture technologies in Chinese cropping systems. Comput. Electron. Agric. 2020, 172, 105305. [Google Scholar] [CrossRef]
  106. Dhir, A.; Koshta, N.; Goyal, R.K.; Sakashita, M.; Almotairi, M. Behavioral reasoning theory (BRT) perspectives on E-waste recycling and management. J. Clean. Prod. 2021, 280, 124269. [Google Scholar] [CrossRef]
  107. Konuk, F.A. Consumers’ willingness to buy and willingness to pay for fair trade food: The influence of consciousness for fair consumption, environmental concern, trust and innovativeness. Food Res. Int. 2019, 120, 141–147. [Google Scholar] [CrossRef]
  108. DeMaio, T.J. Social desirability and survey. Surv. Subj. Phenom. 1984, 2, 257. [Google Scholar]
  109. Rouder, J.N.; Speckman, P.L.; Sun, D.; Morey, R.D.; Iverson, G. Bayesian t tests for accepting and rejecting the null hypothesis. Psychon. Bull. Rev. 2009, 16, 225–237. [Google Scholar] [CrossRef] [PubMed]
  110. Riley, M.R.; Mohr, D.C.; Waddimba, A.C. The reliability and validity of three-item screening measures for burnout: Evidence from group-employed health care practitioners in upstate New York. Stress Health 2018, 34, 187–193. [Google Scholar] [CrossRef]
  111. Purwanto, A.; Sudargini, Y. Partial least squares structural squation modeling (PLS-SEM) analysis for social and management research: A literature review. J. Ind. Eng. Manag. Res. 2021, 2, 114–123. [Google Scholar] [CrossRef]
  112. Lowry, P.B.; Gaskin, J. Partial least squares (PLS) structural equation modeling (SEM) for building and testing behavioral causal theory: When to choose it and how to use it. IEEE Trans. Prof. Commun. 2014, 57, 123–146. [Google Scholar] [CrossRef]
  113. Kumar, S.; Tyagi, V.K.; Kataria, Y.S. A review of PLS-SEM as statistical approach for business research. Pac. Bus. Rev. Int. 2020, 13, 64–74. [Google Scholar]
  114. Sukhov, A.; Friman, M.; Olsson, L.E. Unlocking potential: An integrated approach using PLS-SEM, NCA, and fsQCA for informed decision making. J. Retail. Consum. Serv. 2023, 74, 103424. [Google Scholar] [CrossRef]
  115. Kumar, S.; Talwar, S.; Murphy, M.; Kaur, P.; Dhir, A. A behavioural reasoning perspective on the consumption of local food. A study on REKO, a social media-based local food distribution system. Food Qual. Prefer. 2021, 93, 104264. [Google Scholar] [CrossRef]
  116. Şehrïbanoğlu, S.; Canayaz, M.; Cïhangi, E. Two-stage hybrid sem-neural network approach and Van city residents’ perception of brand. J. Stat. Manag. Syst. 2022, 25, 585–616. [Google Scholar] [CrossRef]
  117. Zhang, H.; Zhang, Y. Comparing fsQCA with PLS-SEM: Predicting intended car use by national park tourists. Tour. Geogr. 2019, 21, 706–730. [Google Scholar] [CrossRef]
  118. Avkiran, N.K. An in-depth discussion and illustration of partial least squares structural equation modeling in health care. Health Care Manag. Sci. 2018, 21, 401–408. [Google Scholar] [CrossRef]
  119. Li, W.; Lay, Y.F. Examining the Reliability and Validity of Measuring Scales related to Informatization Instructional Leadership Using PLS-SEM Approach. Din. J. Ilm. Pendidik. Dasar 2024, 16, 12–32. [Google Scholar] [CrossRef]
  120. Hair, J.; Hollingsworth, C.L.; Randolph, A.B.; Chong, A.Y.L. An updated and expanded assessment of PLS-SEM in information systems research. Ind. Manag. Data Syst. 2017, 117, 442–458. [Google Scholar] [CrossRef]
  121. Ab Hamid, M.R.; Sami, W.; Sidek, M.M. Discriminant validity assessment: Use of Fornell & Larcker criterion versus HTMT criterion. J. Phys. Conf. Ser. 2017, 890, 012163. [Google Scholar]
  122. Shmueli, G.; Sarstedt, M.; Hair, J.F.; Cheah, J.-H.; Ting, H.; Vaithilingam, S.; Ringle, C.M. Predictive model assessment in PLS-SEM: Guidelines for using PLSpredict. Eur. J. Mark. 2019, 53, 2322–2347. [Google Scholar] [CrossRef]
  123. Leong, L.-Y.; Hew, T.-S.; Ooi, K.-B.; Tan, G.W.-H.; Koohang, A. An SEM-ANN Approach-Guidelines in Information Systems Research. J. Comput. Inf. Syst. 2024, 1–32. [Google Scholar] [CrossRef]
  124. Cui, J. Comparative Analysis of PLS-SEM, SEM-ANN, and fsQCA in Modeling Complex Causal Relationships in Social Sciences and Business Research. Ph.D. Thesis, Solbridge International School of Business, Daejeon, Republic of Korea.
  125. Nikou, S.; Mezei, J.; Liguori, E.W.; El Tarabishy, A. FsQCA in entrepreneurship research: Opportunities and best practices. J. Small Bus. Manag. 2024, 62, 1531–1548. [Google Scholar] [CrossRef]
  126. Huarng, K.-H. Re-examining the consistency in fsQCA. in New Information and Communication Technologies for Knowledge Management in Organizations. In Lecture Notes in Business Information Processing, Proceedings of the 5th Global Innovation and Knowledge Academy Conference, GIKA 2015, Valencia, Spain, 14–16 July 2015; Springer: Berlin/Heidelberg, Germany, 2015; p. 5. [Google Scholar]
  127. Sreen, N.; Chatterjee, S.; Bhardwaj, S.; Chitnis, A. Reasons and intuitions: Extending behavioural reasoning theory to determine green purchase behavior. Int. Rev. Public Nonprofit Mark. 2023, 20, 447–475. [Google Scholar] [CrossRef]
  128. Ranjbar, F.; Karimi, M.; Zare, E.; Ghahremani, L. The effect of educational intervention based on the behavioral reasoning theory on self-management behaviors in type 2 diabetes patients: A randomized controlled trial. BMC Public Health 2024, 24, 1761. [Google Scholar] [CrossRef] [PubMed]
  129. Gould, R.K.; Soares, T.M.; Arias-Arevalo, P.; Cantu-Fernandez, M.; Baker, D.; Eyster, H.N.; Kwon, R.; Rode, J.; Suarez, A.; Vatn, A.; et al. The role of value(s) in theories of human behavior. Curr. Opin. Environ. Sustain. 2023, 64, 101355. [Google Scholar] [CrossRef]
  130. Lei, H.; Li, F.; Liu, C.; Liu, Y. Cognitive load and economic decision making of smallholder farmers in China: An experimental study. Curr. Psychol. 2024, 43, 465–480. [Google Scholar] [CrossRef]
  131. Smith, J.E.; Ulu, C. Technology Adoption with Uncertain Future Costs and Quality. Oper. Res. 2012, 60, 262–274. [Google Scholar] [CrossRef]
  132. Clegg, J. Rural cooperatives in China: Policy and practice. J. Small Bus. Enterp. Dev. 2006, 13, 219–234. [Google Scholar] [CrossRef]
Figure 1. Proposed research framework.
Agriculture 15 01005 g001
Figure 2. ANN model.
Agriculture 15 01005 g002
Table 1. Model’s reliability and validity.
FactorsCACRAVEFornell–Larcker’s Criterion
AEASBIHCLOAOLRPRPSVGECVOCWTP
AEAS0.8610.8930.5450.738
BI0.8670.8980.5570.5580.747
HC0.8860.9110.593−0.376−0.3610.770
LOA0.8880.9100.560−0.416−0.3500.4840.748
OLR0.8830.9090.5890.4370.490−0.458−0.4390.767
PR0.8630.8950.550−0.559−0.5160.3760.391−0.4630.741
PS0.8660.8970.5550.4240.438−0.387−0.3980.448−0.3740.745
VGEC0.9120.9270.5870.3650.342−0.296−0.3510.345−0.3680.3990.766
VOC0.8320.8770.5440.3850.368−0.272−0.3650.450−0.3960.4060.3050.737
WTP0.8780.9050.5770.4310.501−0.436−0.4300.517−0.3940.4890.4360.4380.760
CA = Cronbach’s alpha, CR = composite reliability (rho_c), AVE = average variance extracted.
Table 2. Model’s predictive relevance and HTMT.
Model’s Predictive RelevanceHeterotrait–Monotrait Ratio (HTMT)
FactorsAEASBIHCLOAOLRPRPSVGECVOCWTP
AEAS
FactorsR2BI0.640
AEAS0.2160.114 HC0.4230.407
BI0.4350.230 LOA0.4730.3860.542
HC0.1240.068 OLR0.4960.5570.5190.489
LOA0.1960.102 PR0.6450.5910.4310.4410.532
OLR0.2500.136 PS0.4880.4950.4390.4430.5100.430
PR0.2240.116 VGEC0.4070.3760.3250.3870.3810.4060.444
PS0.2480.128 VOC0.4540.4300.3120.4120.5200.4630.4720.352
WTP0.2510.142 WTP0.4920.5690.4920.4860.5870.4530.5600.4890.510
Table 3. Hypothesis testing results.
HypothesisPathβMSDT Valuep-ValueResults
H1aVGEC → PS0.3030.3060.0585.2410.000Supported
H1bVGEC → OLR0.2290.2290.0603.8420.000Supported
H1cVGEC → AEAS0.2730.2740.0644.2400.000Supported
H2VGEC → BI0.0390.0380.0490.7990.212Rejected
H3aVGEC → HC−0.235−0.2400.0643.6620.000Supported
H3bVGEC → PR−0.272−0.2750.0604.5130.000Supported
H3cVGEC → LOA−0.264−0.2670.0564.6780.000Supported
H4aVOC → PS0.3130.3140.0585.3800.000Supported
H4bVOC → OLR0.3800.3800.0616.2080.000Supported
H4cVOC → AEAS0.3020.3040.0605.0060.000Supported
H5VOC → BI0.0340.0310.0550.6060.272Rejected
H6aVOC → HC−0.200−0.2020.0692.8950.002Supported
H6bVOC → PR−0.313−0.3150.0605.1880.000Supported
H6cVOC → LOA−0.284−0.2870.0634.4930.000Supported
H7aPS → BI0.1280.1300.0592.1710.015Supported
H7bOLR → BI0.1820.1820.0662.7510.003Supported
H7cAEAS → BI0.2840.2810.0644.4630.000Supported
H8aHC → BI−0.038−0.0400.0630.6060.272Rejected
H8bPR → BI−0.190−0.1920.0603.1680.001Supported
H8cLOA → BI0.0180.0170.0650.2780.390Rejected
H9BI → WTP0.5010.5030.0559.0820.000Supported
M = sample mean, SD = standard deviation.
Table 4. ANN-RMSE and sensitivity analysis.
Predictive PowerImportance
Neural NetworkInput:AEAS,OLR,PR,PS; Output:BISensitivity Analysis
TrainingTestingNeural NetworkOutput:BI
NSSERMSENSSERMSEAEASOLRPRPS
ANN12723.6890.116 360.4110.107 ANN10.3040.2880.2540.154
ANN22802.7780.100 280.2540.095 ANN20.4380.2380.2310.093
ANN32813.0460.104 270.2810.102 ANN30.3840.2110.2150.19
ANN42743.0250.105 340.330.099 ANN40.3950.0780.3550.173
ANN52682.6180.099 400.4350.104 ANN50.3170.2790.3860.018
ANN62782.7140.099 300.3150.102 ANN60.4450.2390.2590.057
ANN72692.5860.098 390.2940.087 ANN70.5230.2390.1320.106
ANN82772.7560.100 310.1830.077 ANN80.4070.2210.220.152
ANN92732.7690.101 350.2720.088 ANN90.3730.2710.2620.094
ANN102792.6760.098 290.1810.079 ANN100.5720.1770.1020.149
Mean 0.102 0.094 Avg. Imp 0.416 0.224 0.242 0.119
SD 0.006 0.011Norm.Imp100%53.90%58.10%28.52%
N—sample size; SSE—sum of squares of errors; RMSE—root mean square of errors; SD—standard deviation; Norm.—normalized; Avg.—average; Imp—importance.
Table 5. Comparison between PLS-SEM and ANN result.
PLS PathOriginal Sample (O)/Path CoefficientANN Results: Normalized Relative Importance (%)Ranking (PLS-SEM) [Based on Path Coefficient]Ranking (ANN) [Based on Normalized Relative Importance (%)]Remark
AEAS → BI0.284 100.000 11Match
PR → BI−0.190 58.105 22Match
OLR → BI0.182 53.896 33Match
PS → BI0.128 28.523 44Match
Table 6. FsQCA solutions.
Solution12345
ValuesVGECZ
VOCZ
DeterminantsPSZ
OLRZ
AEASZ
BarriersHCZ
PRZ
LOAZ
Raw coverage0.3540.3450.3560.2950.306
Unique coverage0.0180.0080.0200.0340.037
Consistency0.9520.9460.9470.9480.968
Solution coverage0.453
Solution consistency0.914
represents ‘presence’ of the core factor, represents the ‘absence’ of core conditions, ● represents ‘presence’ of the marginal factor, ⊗ represents the ‘absence’ of marginal factor, and spaces indicate that the presence or absence of a condition has no effect on the results.
Disclaimer/Publisher’s Note: The statements, opinions and data contained in all publications are solely those of the individual author(s) and contributor(s) and not of MDPI and/or the editor(s). MDPI and/or the editor(s) disclaim responsibility for any injury to people or property resulting from any ideas, methods, instructions or products referred to in the content.

