Article

Identification of Interannual Variation Frequency of Cropland Cropping Intensity Based on Remote Sensing Spatiotemporal Fusion and Crop Phenological Rhythm: A Case Study of Zhenjiang, Jiangsu

1
School of Agricultural Engineering, Jiangsu University, Zhenjiang 212013, China
2
Key Laboratory of Modern Agricultural Equipment and Technology of Ministry of Education, Jiangsu University, Zhenjiang 212013, China
3
School of Information Science and Technology, Hebei Agricultural University, Baoding 071001, China
4
School of Electrical Engineering, Anhui Polytechnic University, Wuhu 241000, China
5
College of Information and Electrical Engineering, China Agricultural University, Beijing 100083, China
*
Author to whom correspondence should be addressed.
Agriculture 2025, 15(9), 1004; https://doi.org/10.3390/agriculture15091004
Submission received: 7 April 2025 / Revised: 28 April 2025 / Accepted: 2 May 2025 / Published: 6 May 2025

Abstract

:
The scientific evaluation of cropland resource utilization efficiency is crucial for ensuring food security and promoting sustainable agricultural development. At present, the research on the utilization of cropland resources primarily focuses on the multiple cropping index and cropping intensity, but these data are insufficient to reveal long-term trends and potential future changes in crop production. To fill this knowledge gap, this study took Zhenjiang City, Jiangsu Province, as a case study and proposed a method to determine the distribution and spatiotemporal change frequency of single- and double-season cropping patterns using spatiotemporal fusion and crop phenological rhythm. By combining Sentinel-2 NDVI and MOD13Q1 satellite data, a dataset with 10 m resolution was developed to show the interannual distribution frequency of the three cropping patterns in the study area. The accuracy evaluation revealed that the interannual cropping intensity distribution frequency of the three cropping patterns exhibited good verification accuracy, with an average overall accuracy and Kappa coefficient of 81.53% and 0.68, respectively. This study provides essential support for government agencies to assess future food production potential and develop policies for improving cropland use efficiency.

1. Introduction

As a populous nation, food security is a crucial foundation for China’s national security [1,2]. Between 2007 and 2015, China’s grain production grew rapidly, mainly due to a significant increase in cropland area [3]. According to the Third National Land Survey Report of China, by the end of 2019, the total cropland area had reached 1.918 billion acres, with an average of only 1.36 acres per capita, less than half of the global average. However, the total area suitable for crop cultivation in China has reached a historical high, and further expansion of cultivated land is constrained by topography and water resources [4], making it cost-prohibitive [5]. The fundamental national conditions—limited per capita cultivated land and insufficient backup resources—remain unchanged [6]. Additionally, the instability in global food prices, exacerbated by the Russia–Ukraine conflict, has further complicated challenges in importing food [7,8]. Therefore, improving output levels on the existing cultivated land is essential for ensuring food security [9], and increasing cropping intensity to achieve agricultural intensification is an effective way to boost grain production on limited cropland [10,11,12]. Accurately assessing regional cropping intensity is crucial for assisting government departments in evaluating potential increases in regional grain production and monitoring the intensive use of cropland resources [13,14].
Traditional methods of estimating cropping intensity for cropland rely on field sampling surveys, which suffer from low timeliness and significant spatial heterogeneity, making it difficult to meet the demand for fine-scale monitoring of cropping intensity over large areas. With the rapid development of remote sensing technology, satellite data have become an important source of information for large-scale crop fields, offering broad observational coverage and low acquisition costs [15,16]. This provides a valuable opportunity for mapping regional cropping intensity [17,18]. MODIS, with its 1-day revisit cycle and 250/500 m spatial resolution, allows for the acquisition of a greater number of cloud-free observations, leading to higher accuracy in estimating cropping intensity. In recent years, several studies have primarily utilized time-series vegetation index data derived from moderate-resolution MODIS imagery to generate cropping intensity maps on national and even global scales [19,20]. However, cropland parcels in the hilly and mountainous regions of southern China are often small and fragmented. As a result, these 250 m or 500 m spatial resolution cropping intensity products frequently mix different crop types within the same pixel, leading to significant heterogeneity in crop types and cropping intensity information at the sub-pixel level [21].
To address the mixed-pixel issue in MODIS imagery, recent studies have incorporated higher spatial resolution data from Landsat (30 m spatial resolution, 16-day revisit cycle) and Sentinel-2 (10 m spatial resolution, 5-day revisit cycle) to estimate cropland cropping intensity. By fusing MODIS and Landsat imagery, high-temporal-resolution 30 m fused images have been generated [22]. Alternatively, fusing Landsat and Sentinel-2 data results in high-spatial-resolution images with a 5-day temporal resolution, allowing for the creation of annual cropping intensity maps at 10 m or 30 m spatial resolution [17,23]. However, during key crop growth stages, cloud cover is often frequent, making it challenging to obtain high-quality, cloud-free Landsat images with a 16-day revisit cycle. This is a primary source of potential errors when estimating cropping intensity after fusion with Landsat data.
Existing research methods often focus on balancing the relationship between remote sensing data and different spatial and temporal resolutions at the regional scale to estimate cropping intensity [24]. These studies typically estimate cropping intensity using combinations of small-scale, high-resolution images [25,26] or large-scale, medium-resolution images [27,28], with most research relying on medium- and high-resolution remote sensing data to extract cropping intensity at a single time point, limiting the ability to capture dynamic changes over time [22]. However, different crop types exhibit varying levels of yield, and accurate crop type identification is crucial for yield estimation [29]. Many studies have concentrated more on the intensity of single-season or double-season cropping, without further exploring the crop types in single-season or double-season systems, hindering a more accurate assessment of food yield potential. Currently, there is a lack of studies that comprehensively consider both the crop types and interannual dynamic distribution characteristics of cropland when estimating regional food production potential and cropping intensity.
Therefore, to fill this knowledge gap, this study proposes a method for determining the spatial and temporal distribution frequency of single-season and double-season crops using spatiotemporal fusion and crop phenology rhythms, with Zhenjiang, Jiangsu Province, as a case study. A 10 m resolution dataset of interannual distribution frequencies for different cropping patterns was developed using Sentinel-2 NDVI and MOD13Q1 satellite data to enhance the accuracy of food yield potential estimation and support decision-making for efficient cropland resource utilization.

2. Materials and Methods
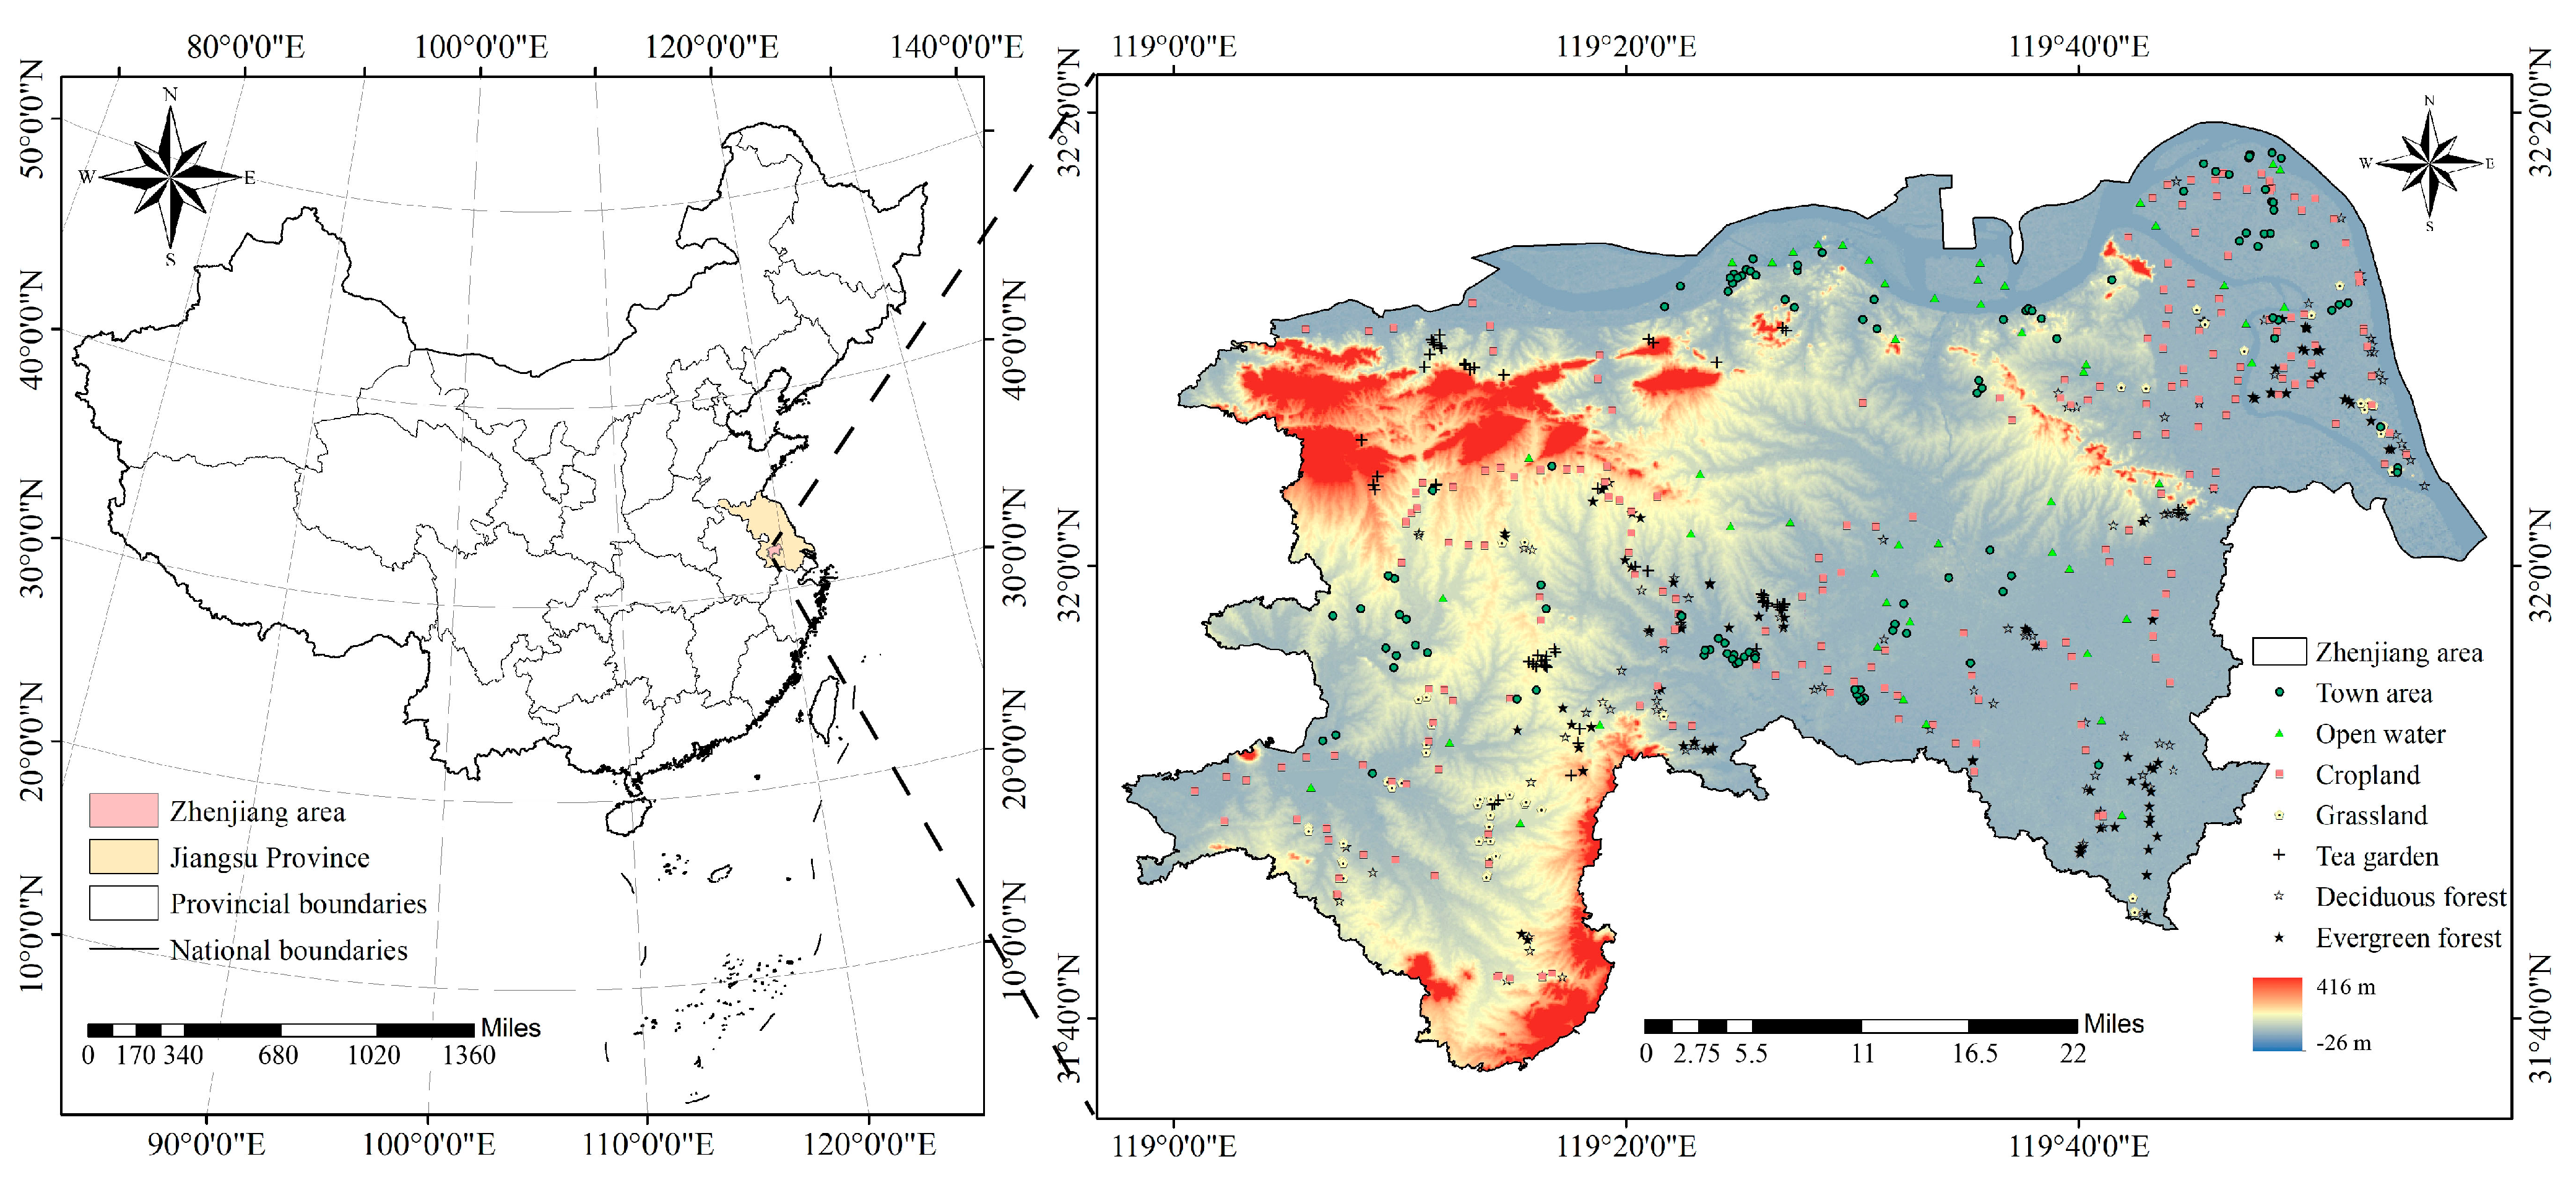
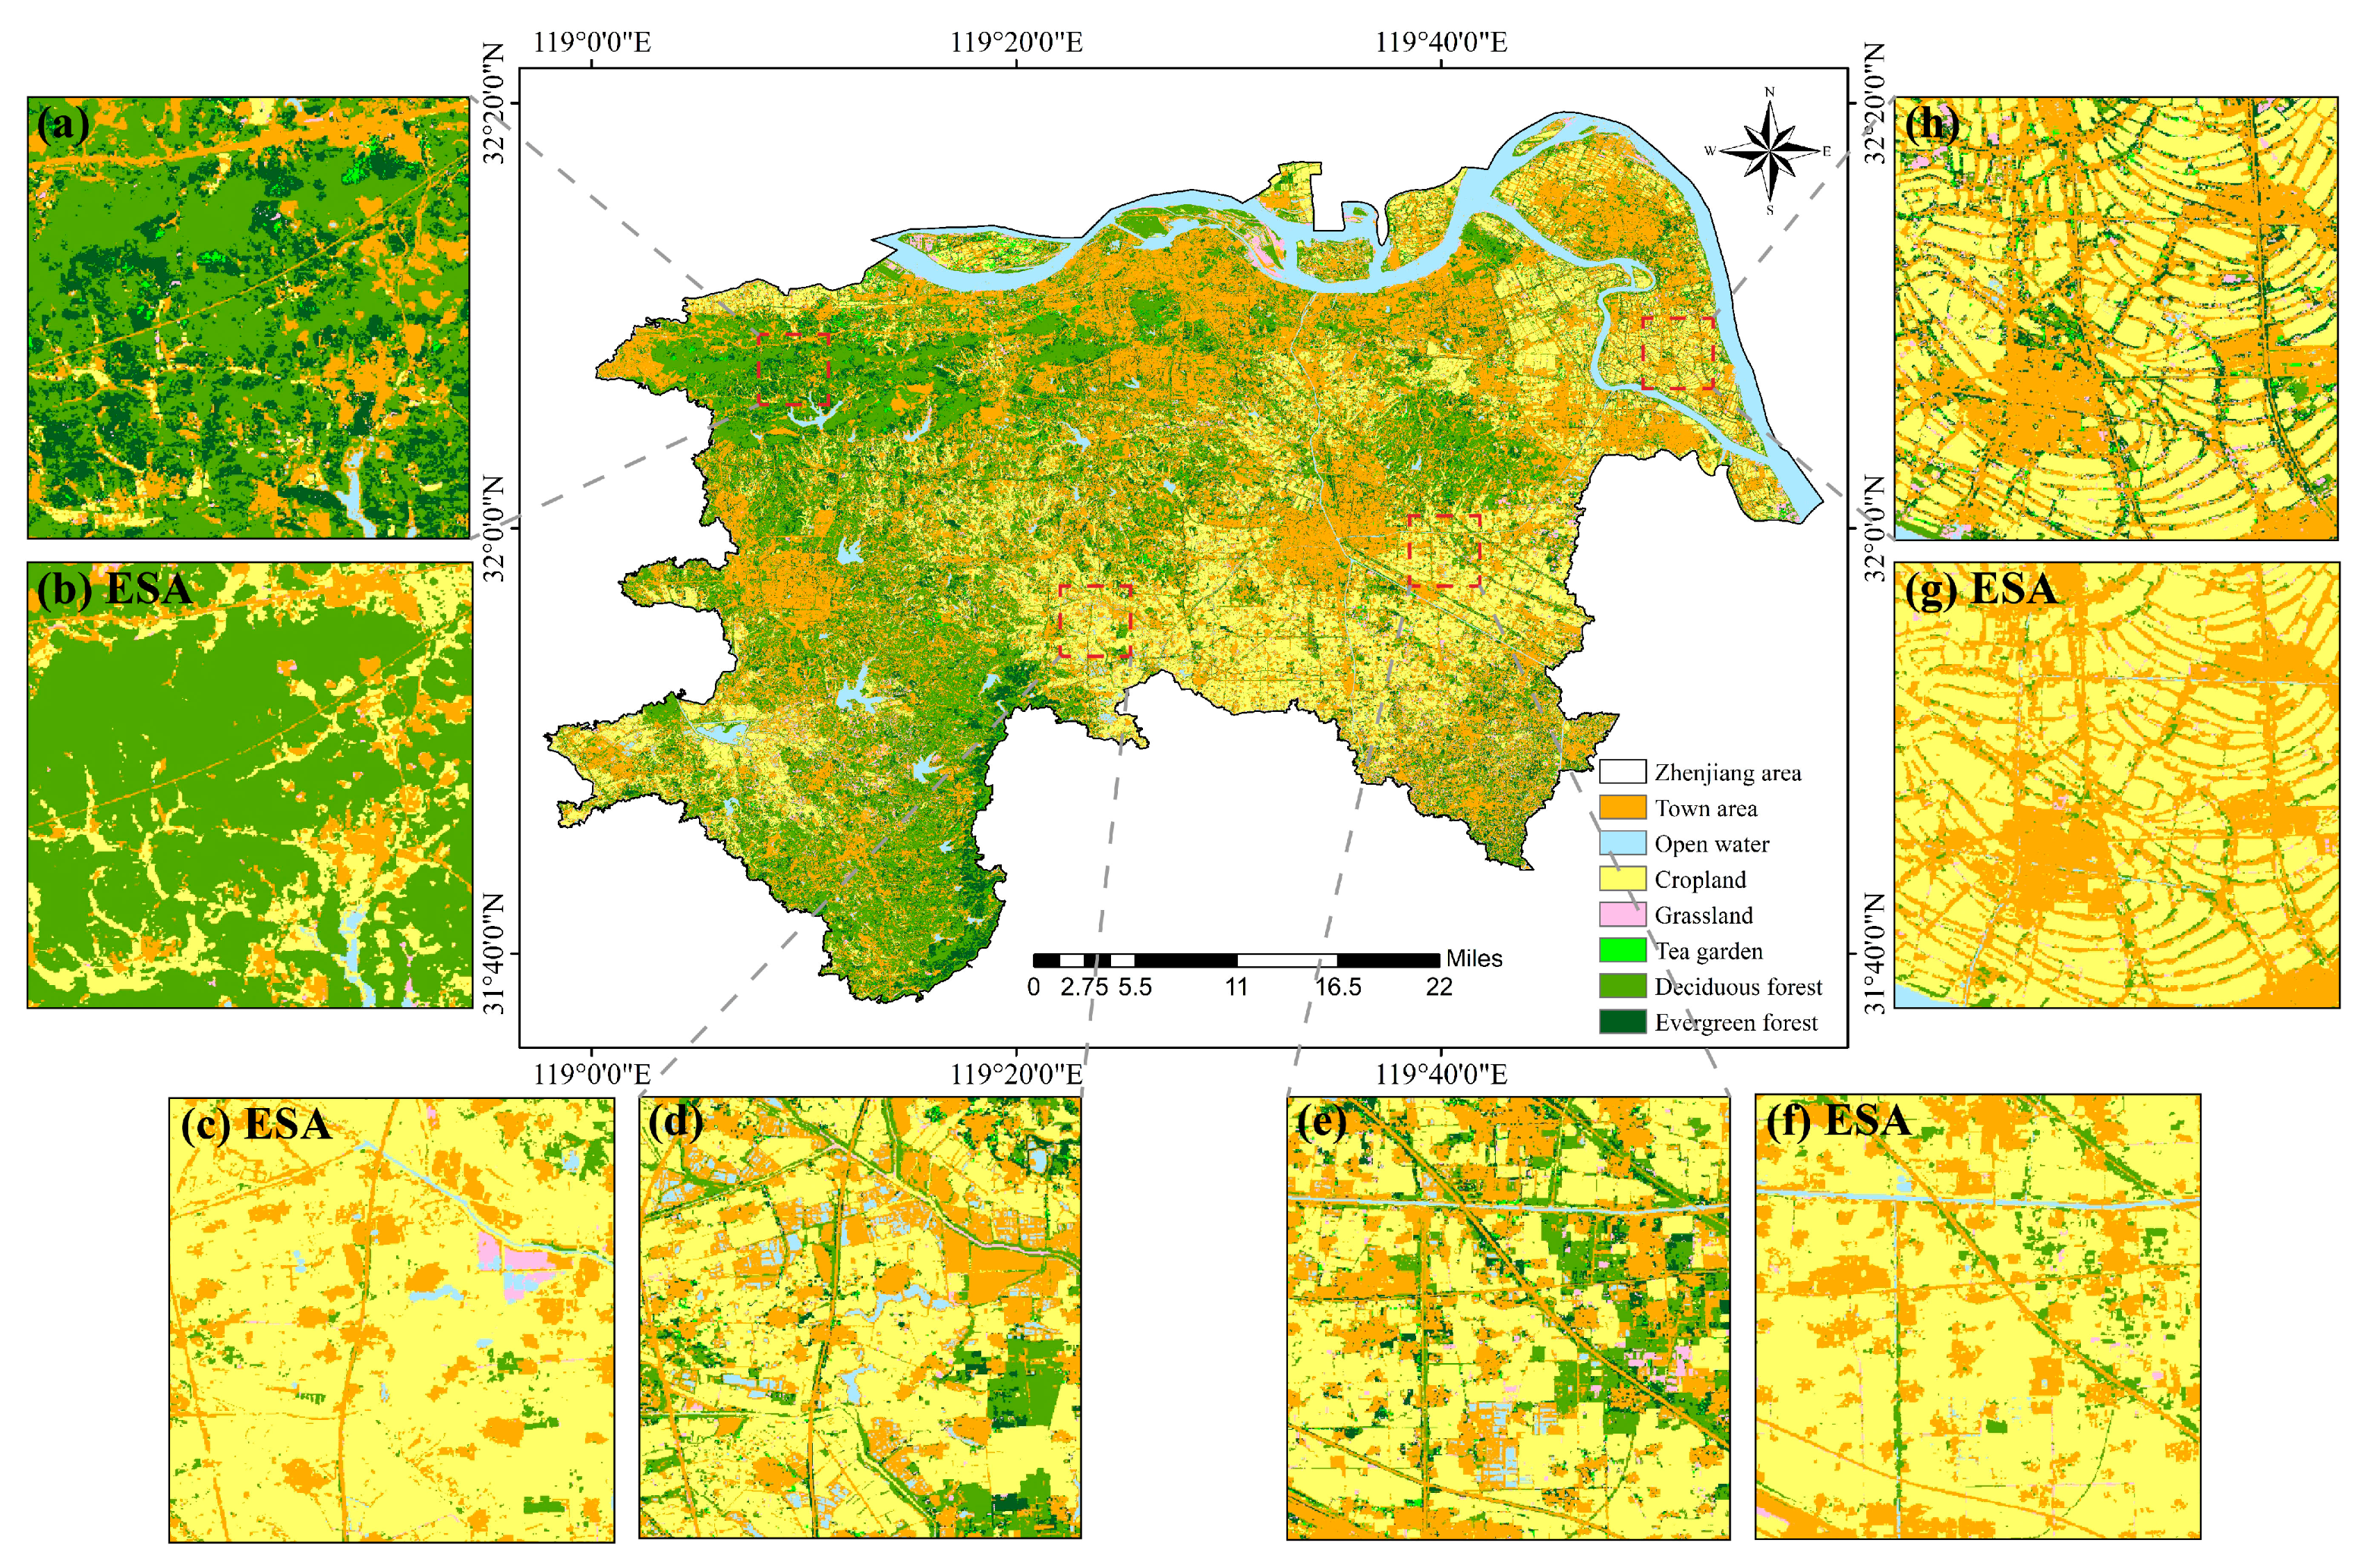
2.1. Study Area

To evaluate the accuracy of using the fusion of MODIS and Sentinel-2 data for estimating the interannual crop types and spatiotemporal dynamics of cropland in southern China, this study focuses on Zhenjiang City, Jiangsu Province, located on the southern bank of the Yangtze River in the central and lower reaches. The study area covers 3840 km2, positioned between 31°37′–32°19′ N and 118°58′–119°58′ E. The region has a subtropical monsoon climate, with a topography characterized by high western areas and low eastern plains, most of which lie within the Ningzhen–Maoshan low hill and mountainous region. The Yangtze River and Grand Canal intersect in this area, providing abundant water resources. The primary crops grown are wheat, rice, and other staple crops, with three cropping modes: single-season wheat, single-season rice, and rice–wheat rotation. Additionally, the region is also characterized by small and fragmented cropland parcels, making it an ideal location for this study.

2.2. Data Collection and Preprocessing

2.2.1. Field Survey Data

During the key crop growth period in 2022, a field survey was conducted in the Zhenjiang region using the Aowei Interactive Map application v10.1.1. For each survey point, geographic coordinates and land cover type data were recorded. To more accurately capture the distribution of cropland within the study area, this research further expanded the land cover sample dataset based on decimeter-level high-spatial-resolution satellite imagery from Google Earth in 2022. Through visual interpretation techniques, various land cover types were classified, including urban areas (110 samples), open water (50 samples), cropland (203 samples), grasslands (51 samples), tea gardens (64 samples), deciduous forests (90 samples), and evergreen forests (83 samples), as shown in Figure 1. Within the cropland category, the cropping patterns include single-season wheat, single-season rice, and rice–wheat rotation. Furthermore, in 2024, cropping intensity distribution frequency data were collected for selected cropland plots based on field survey data (such as records from farmers and farms).

2.2.2. Satellite Data Acquisition and Preprocessing
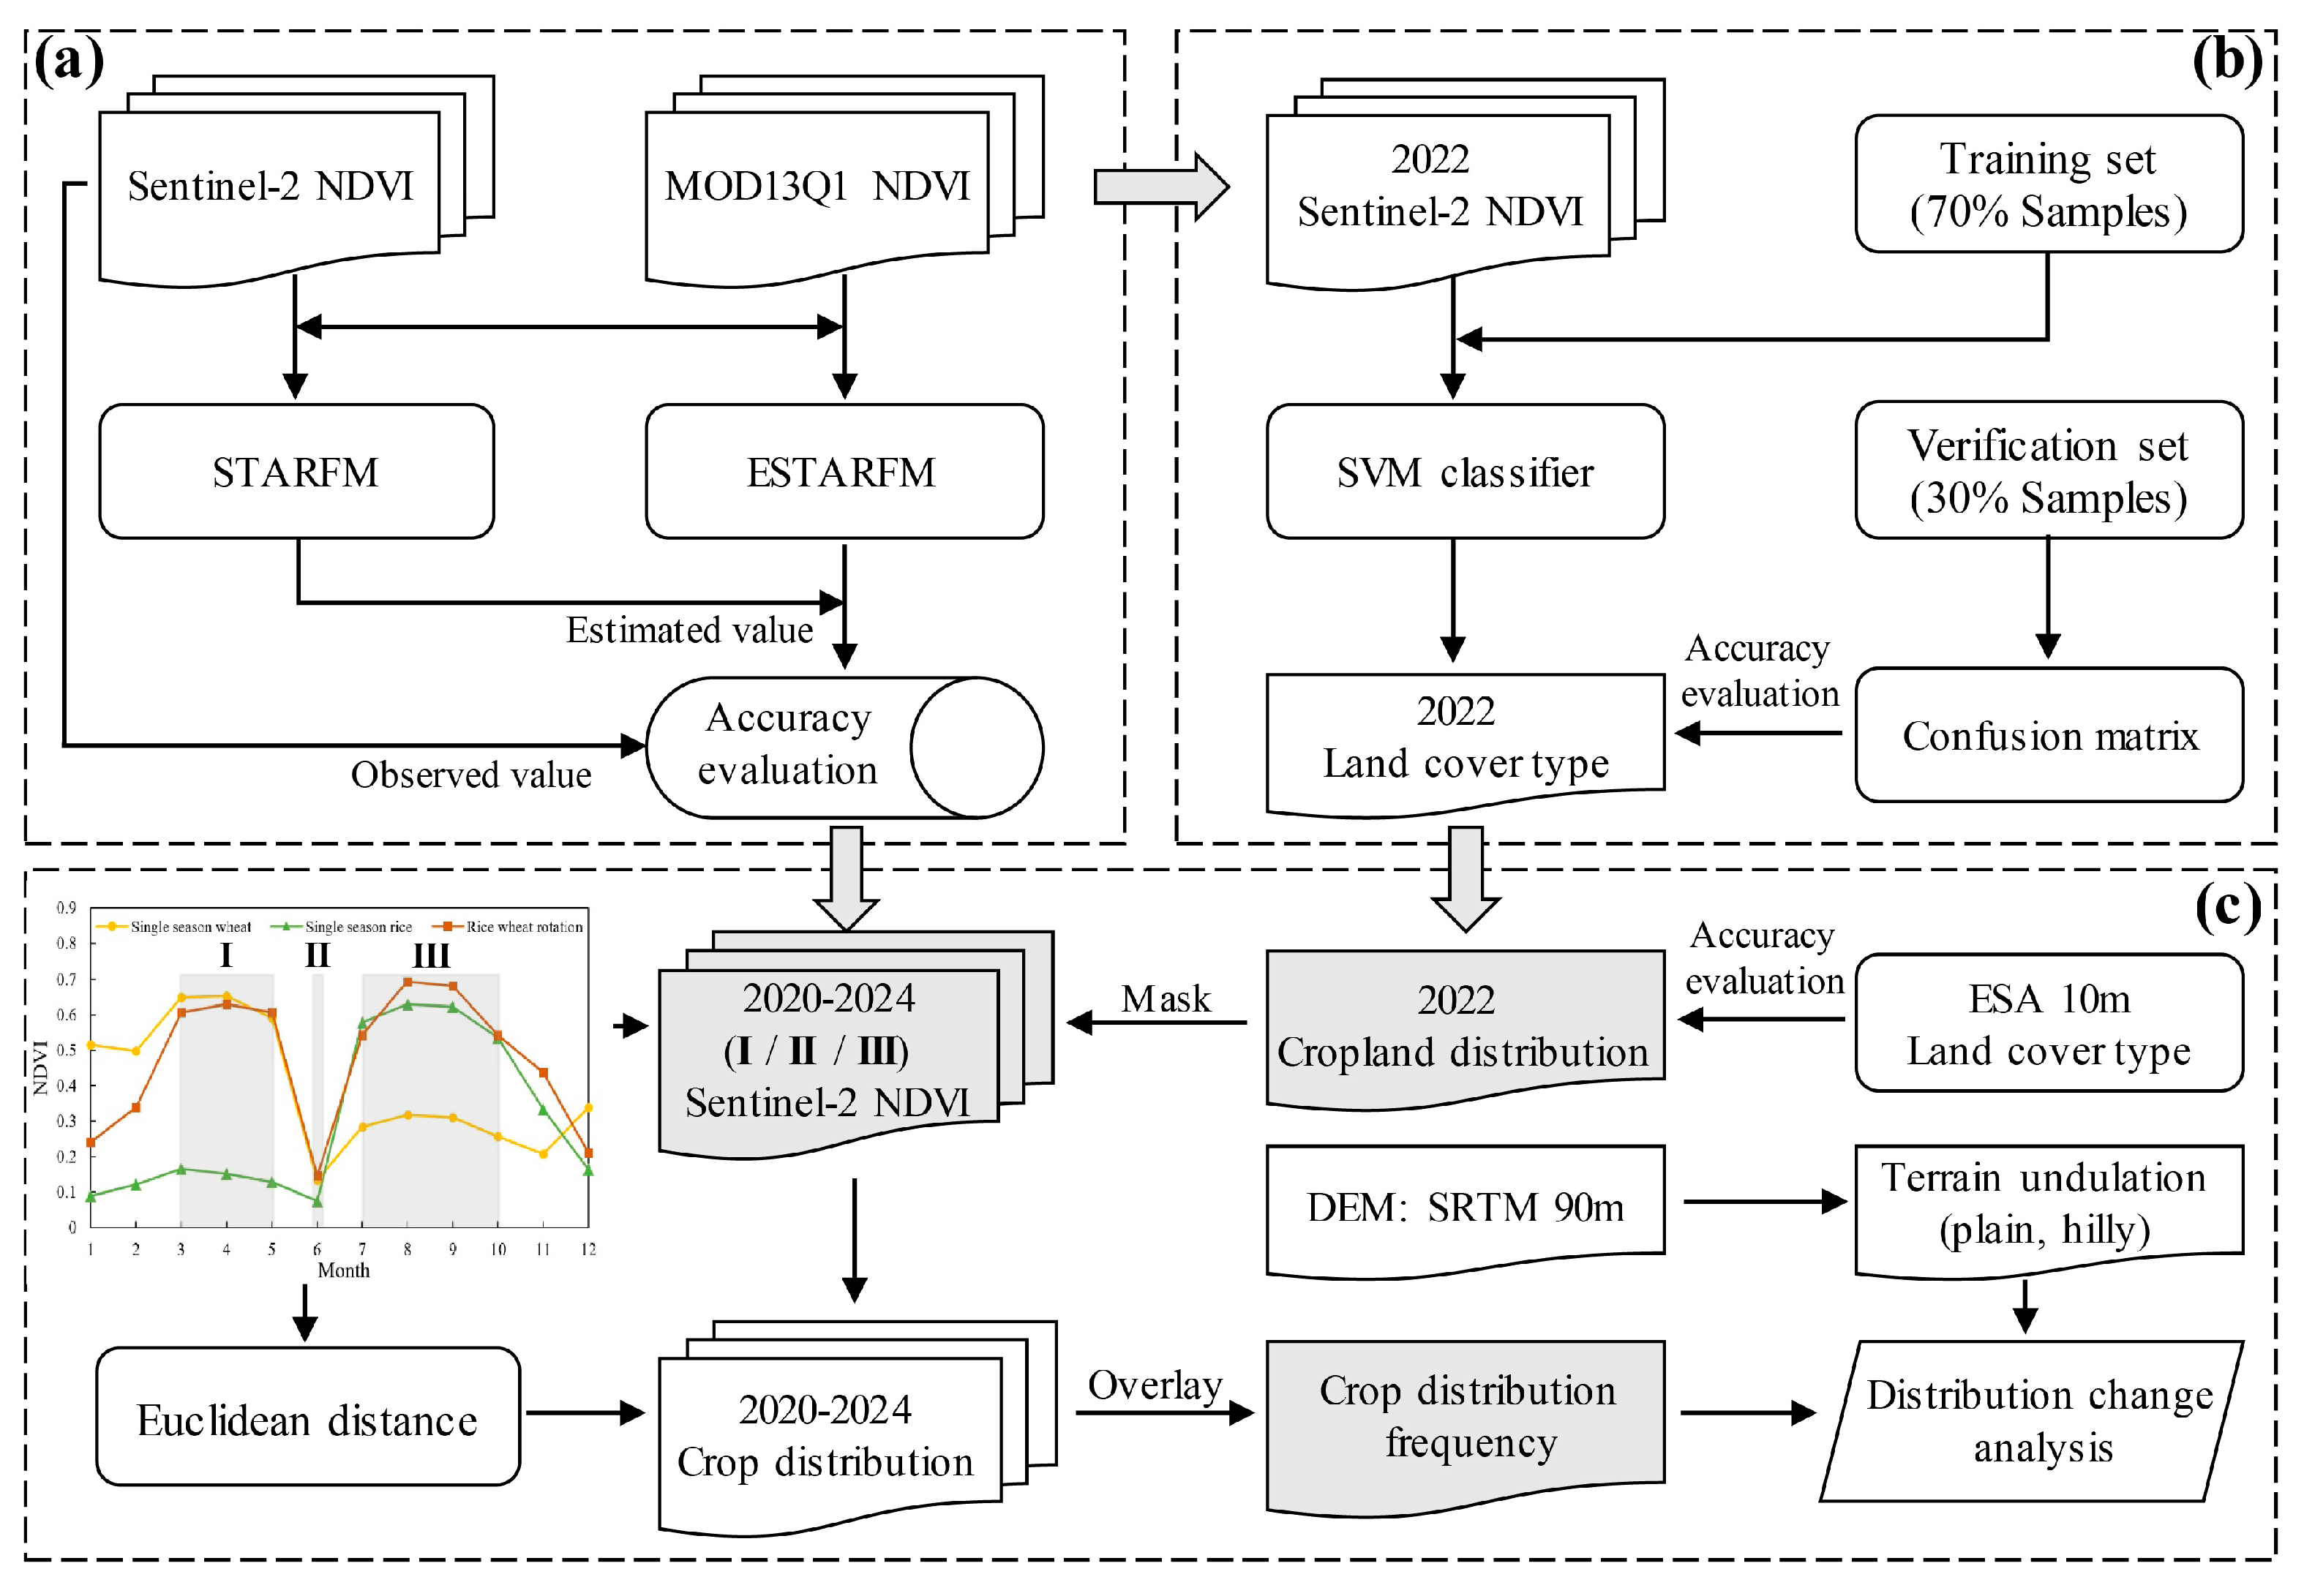
To accurately map the distribution of cropland and cropping patterns in the study area, we obtained a monthly maximum NDVI composite dataset for Sentinel-2 from 2020 to 2024 (spatial resolution: 10 m) and the MOD13Q1 vegetation index product NDVI dataset (spatial resolution: 250 m) through Google Earth Engine (GEE) (https://code.earthengine.google.com/, accessed on 15 January 2025). The Quality Assessment (QA) band was used to detect and mask out cloud cover and cirrus clouds, thereby eliminating low-quality pixels. The time period from 2020 to 2024 was selected because the cropland area in Zhenjiang has remained stable over the past five years, as reported in the Zhenjiang Statistical Yearbook (https://tjj.zhenjiang.gov.cn/, accessed on 7 January 2025). This stability ensured that cropping patterns had not undergone significant changes, allowing us to attribute any observed discrepancies in the interannual distribution frequency of cropping patterns solely to the research methodology. This also supported the effective evaluation of the method for analyzing interannual distribution frequency in cropping patterns based on cropland data.

2.3. Method

Accurate assessment of the interannual distribution frequency of cropping patterns at a regional scale is of significant importance for evaluating food production potential and cropland use efficiency in terms of cropping intensity. In previous studies, scholars have primarily focused on the intensity of cropland use, with limited attention given to the interannual distribution frequency of cropping intensity. To address this gap, this study proposes a method for accurately extracting the interannual distribution frequency of cropping patterns in cropland by integrating time-series remote sensing images and crop phenological rhythm characteristics. The specific implementation steps of this method are presented in the following sections (Figure 2).

2.3.1. Land Cover Classification Based on Spatiotemporal Fusion Algorithm

Obtaining continuous, high-quality, cloud-free observation images for a study area is a prerequisite for accurate land cover classification. Due to the varying regional applicability of different spatiotemporal fusion methods, this study employed the classic spatial and temporal adaptive reflectance fusion model (STARFM) [30] and enhanced spatial and temporal adaptive reflectance fusion model (ESTARFM) [31] to process the observed Sentinel-2 NDVI and MOD13Q1 NDVI images. The goal was to generate high spatiotemporal resolution fused images. Both fusion methods were evaluated based on their accuracy relative to actual Sentinel-2 NDVI observations to select the optimal spatiotemporal fusion algorithm. To ensure the spatial characteristics and quality of fused images from the STARFM and ESTARFM algorithms, we adopted the bilinear resampling technique, as recommended by their developers. This approach mitigated geo-referencing errors during image fusion, ensuring precise spatial alignment between high- and low-resolution images. Additionally, the technique calculated the target pixel value based on the weighted average of four adjacent pixels, minimizing distortion during the enhancement of spatial resolution and resulting in improved spatial and temporal consistency.
Furthermore, considering the homogeneity, fragmentation, and hilly distribution characteristics of croplands, the accuracy of the fused dataset obtained from the optimized spatiotemporal fusion algorithm was further verified for reliability. Subsequently, based on the sample set obtained from field surveys in 2022 (with 70% randomly selected as the training set and the remaining 30% as an independent validation set) and the time-series fused images, supervised classification was performed using the Support Vector Machine (SVM) method. This process generated the land cover type distribution map for the study area in 2022. The accuracy of the land cover classification results was validated using the independent validation sample set and confusion matrix. Additionally, the classification results were visually interpreted using the ESA 10 m spatial resolution global land cover dataset (with an overall accuracy of 74%) (https://viewer.esa-worldcover.org/worldcover/, accessed on 1 December 2024), providing an additional layer of assessment for the classification accuracy of the land cover types in the study area.

2.3.2. Estimation of Interannual Distribution Frequency of Cropping Types

Given that the cropland area in the study area has remained relatively stable over the past five years, this study used the cropland distribution area obtained in 2022 as the area of interest for estimating the interannual distribution frequency of crop types. The time-series remote sensing fusion images from 2020 to 2024 were masked according to the cropland distribution areas in 2022. Then, the 2022 field survey data for single-season wheat, single-season rice, and rice–wheat rotation crops were utilized to extract the time-series NDVI change curves, which served as the standard reference phenological curves. Considering that the study area is located in the middle and lower reaches of the Yangtze River, satellite observations are frequently affected by cloud and fog interference, making it difficult to obtain high-quality, cloud-free, time-series images. To reduce the limitations of long-term remote sensing monitoring data, this study incorporated the phenological rhythm characteristics of crop growth. Three key stages that can effectively distinguish different crop cropping patterns were selected: the vigorous growth period of wheat, the fallow period, and the vigorous growth period of rice. For each of these three stages, a fused image was obtained to extract crop type regions for each year. Subsequently, the cropping pattern distributions for each year were extracted using crop phenological rhythm characteristics and the Euclidean distance (ED) classification method. The equation is given as follows:
E D = i = 1 n ( X i X c ) 2 i ( 1,2 , , n )
where n represents the number of Sentinel-2 NDVI bands, i represents a particular band, c represents a particular land cover class, X i   represents the data file values of pixel (x,y) in band i , and ED represents the ED from pixel (x,y) to the mean of class c .
Finally, the interannual distribution frequency information for single-season wheat, single-season rice, and rice–wheat rotation regions was derived by combining the crop type distribution results from 2020 to 2024. Field survey results were then used for validation of the estimated distribution frequency. This study employed the coefficient of determination (R2), root mean square error (RMSE), and normalized root mean square error (NRMSE) as evaluation metrics to assess the discrepancies between the estimated and observed values. Specifically, R2 indicates the correlation between the estimated and observed values, with values closer to 1 indicating better estimation performance. The closer the RMSE value is to 0, the lower the estimation error. Since RMSE alone does not provide an acceptable threshold for the error between estimated and observed values, the NRMSE was introduced to quantify the relative difference level between the two. An NRMSE value within the range of 0–10% indicates high estimation accuracy, 10–20% indicates good accuracy, 20–30% indicates moderate accuracy, and values greater than 30% suggest poor estimation accuracy [32]. The equation is given as follows:
R 2 = t = 1 n y ^ t y ¯ 2 t = 1 n y t y ¯ 2
R M S E = t = 1 n y ^ t y t 2 n
N R M S E = R M S E y ¯
where n is the number of samples, y ^ t is the estimated value, y t is the observed value, and y ¯ is the mean of the observed values.
To provide a more comprehensive assessment of the fusion image accuracy, we introduced several widely accepted quantitative indices for evaluating image fusion quality in the field of remote sensing, including ERGAS (Erreur Relative Globale Adimensionnelle de Synthèse), UIQI (Universal Image Quality Index), and CC (Correlation Coefficient) [33]. Among these, ERGAS is specifically used for evaluating the quality of remote sensing images, with values less than 1 indicating a good fusion effect. UIQI and CC are used to assess the similarity between images, with values closer to 1 indicating smaller relative errors between the fused and original images, suggesting better fusion quality. The equation is given as follows:
E R G A S = 100 s t = 1 n y ^ t y t 2 n
U I Q I = 1 t = 1 n y ^ t y t 2 n × y m a x 2
C C = t = 1 n y ^ t y ¯ 2 t = 1 n y t y ¯ 2
where s is the resolution scaling factor, which is usually used to adjust the impact of different resolutions.

3. Results

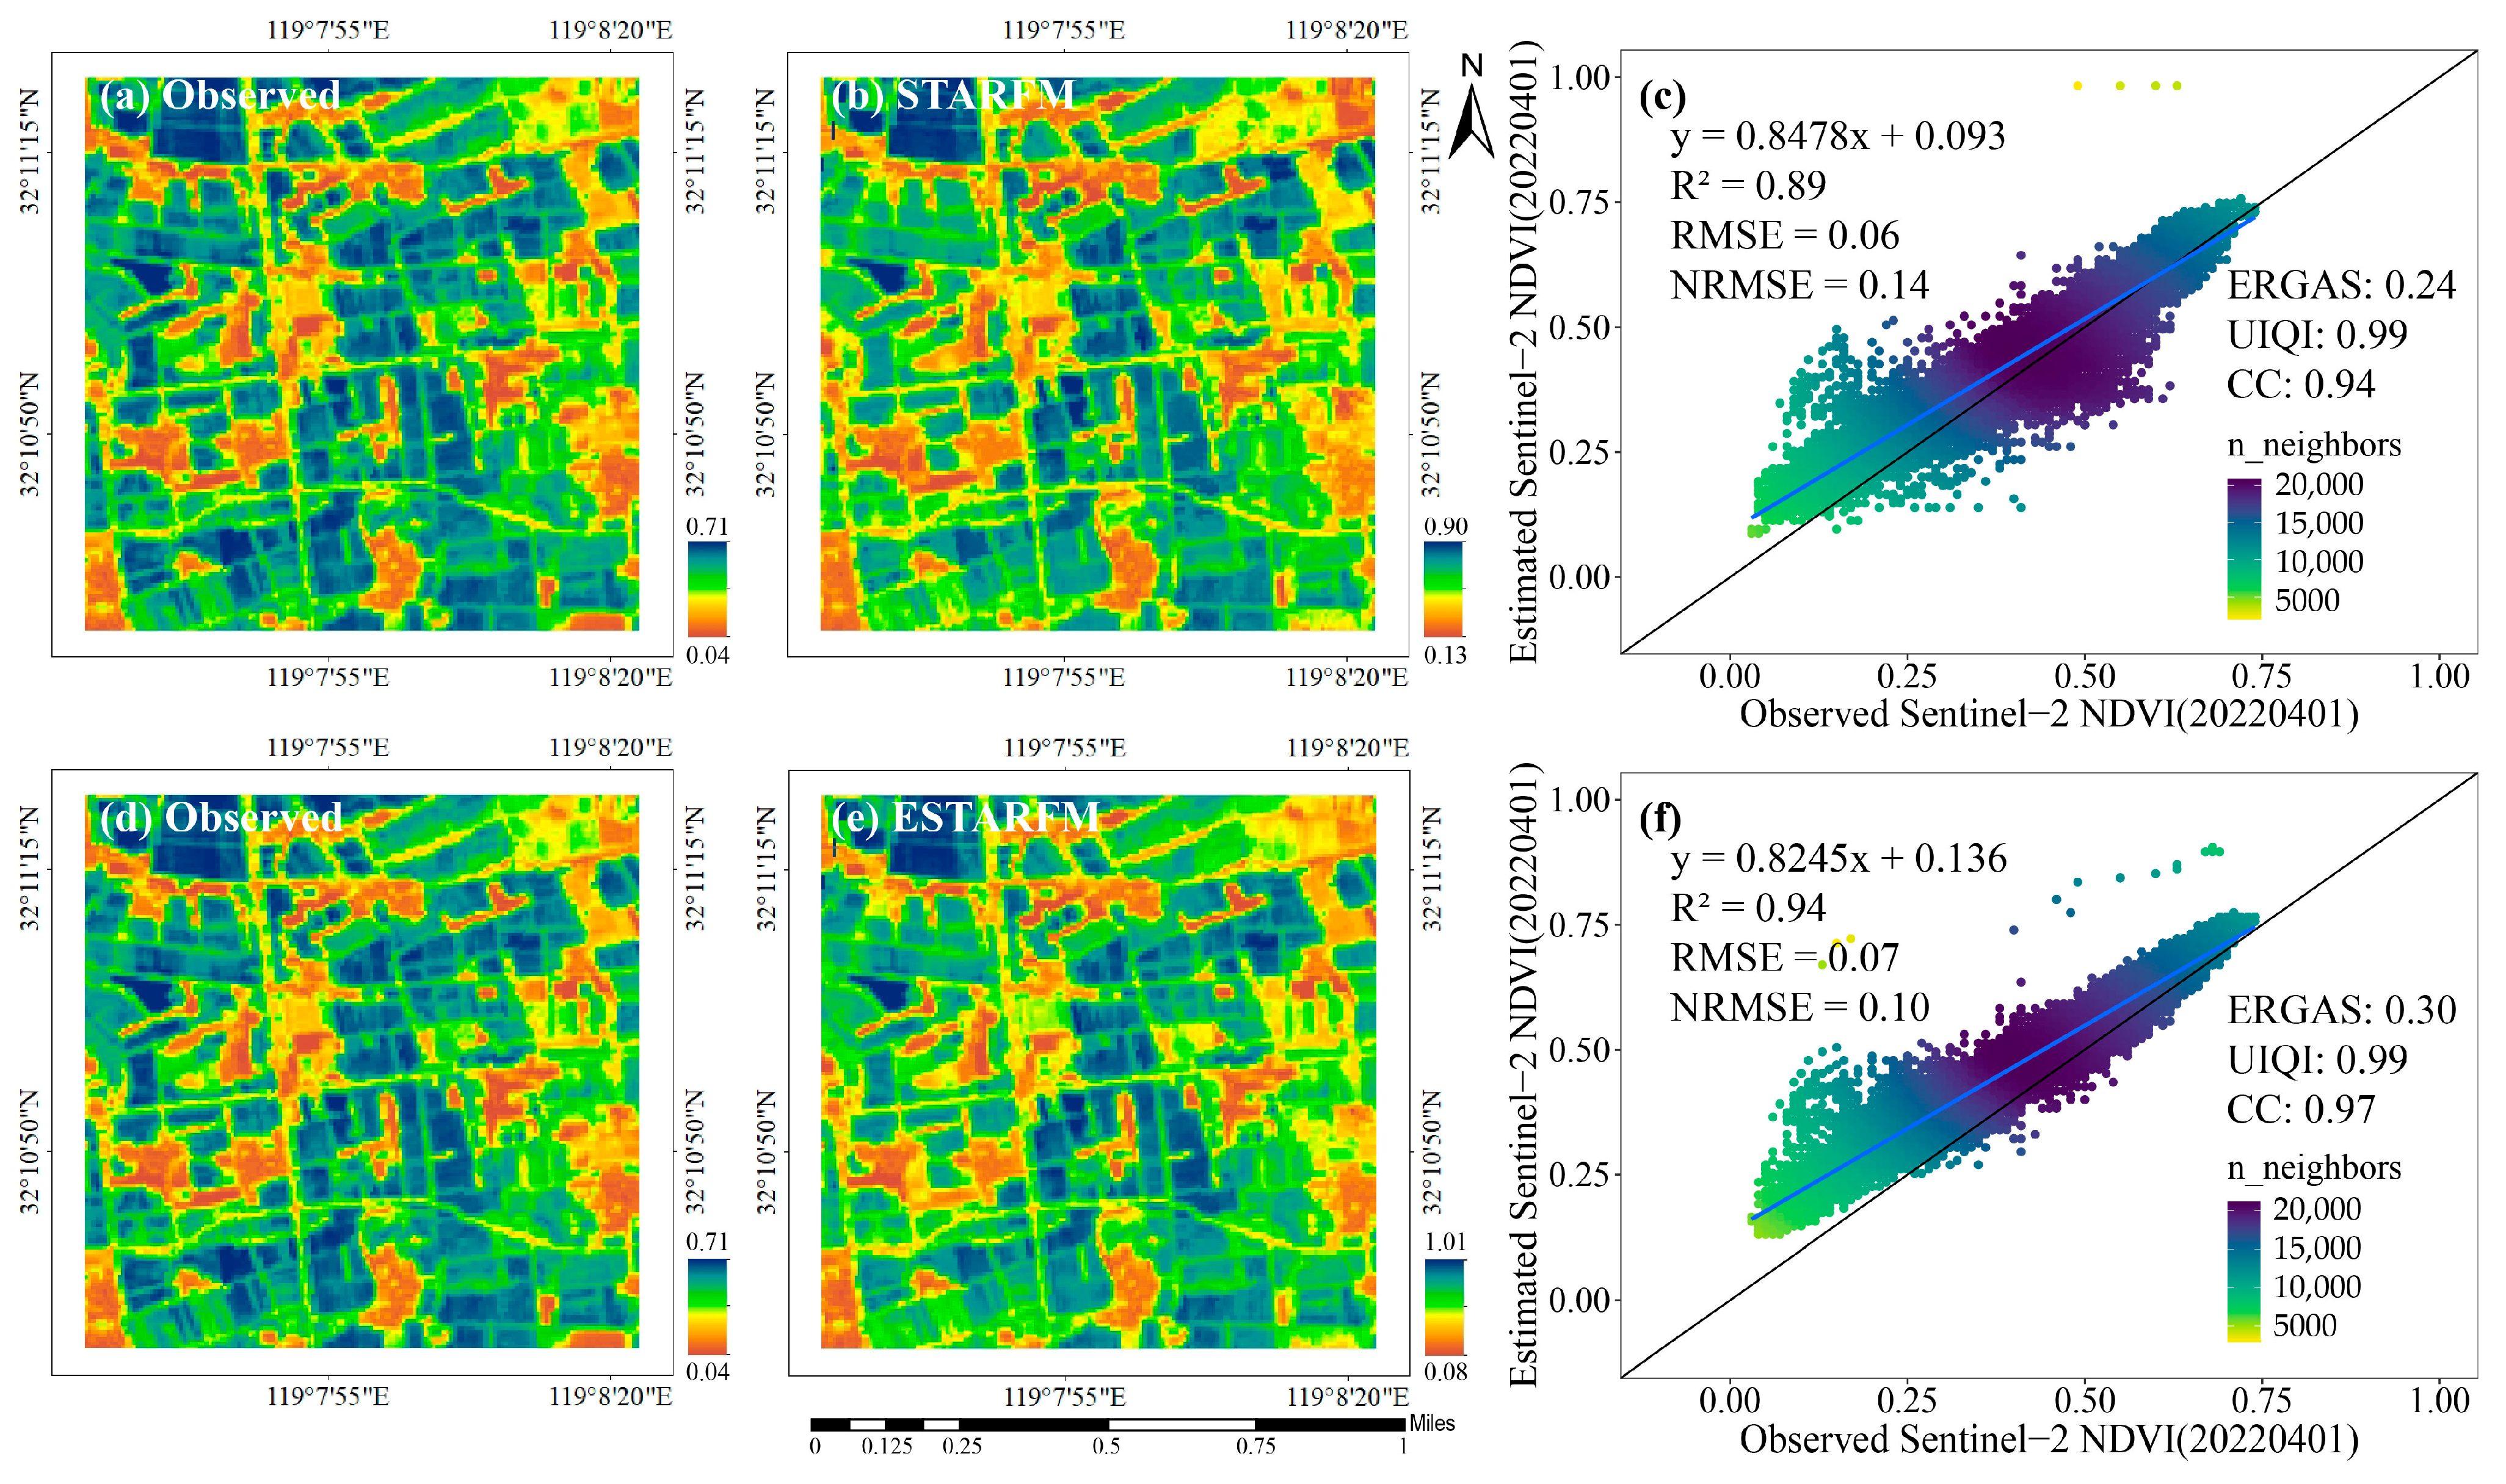
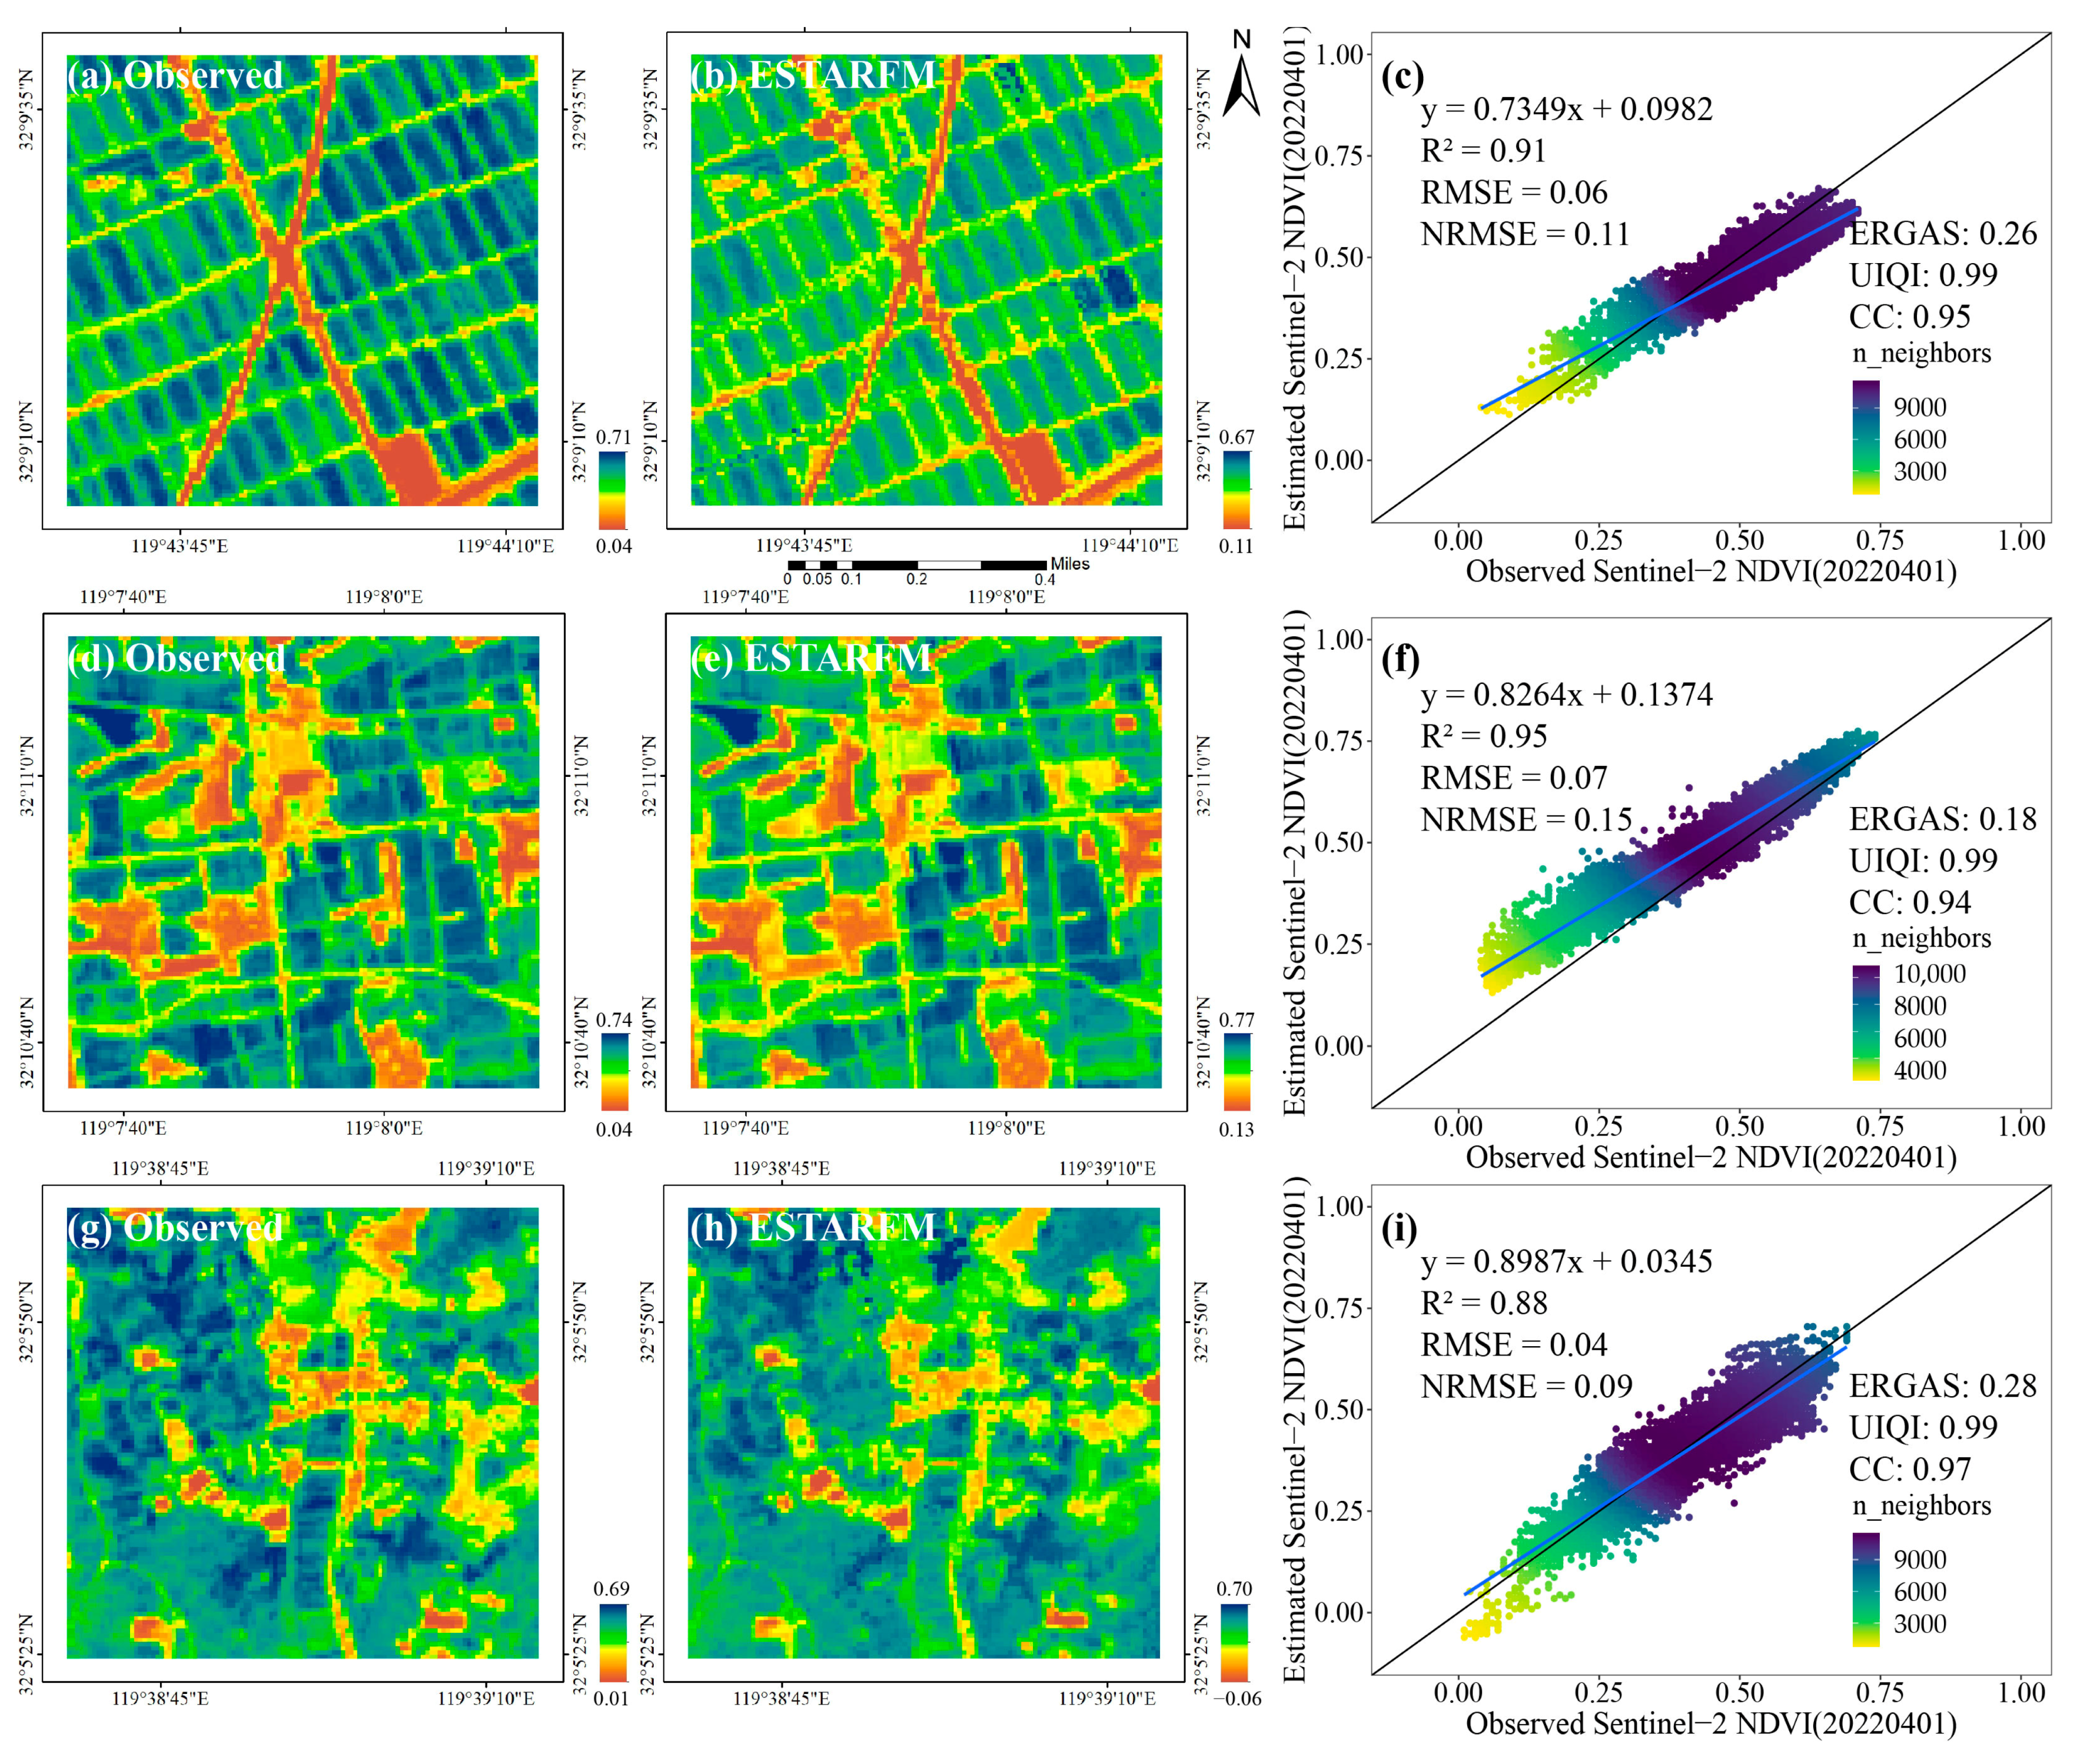
3.1. Performance Verification of Spatiotemporal Fusion Method

To obtain a high-quality, high-spatiotemporal-resolution Sentinel-2 NDVI dataset, we selected the classic STARFM and ESTARFM fusion models. Given that different spatiotemporal fusion methods exhibit varying regional applicability, and previous studies have shown that areas with high spatial heterogeneity during spring often demonstrate lower spatiotemporal fusion accuracy [34], we acquired Sentinel-2 imagery for the study area in spring and selected regions with significant spatial heterogeneity in agricultural fields as areas of interest for spatiotemporal fusion accuracy assessment. These regions were used to filter out the most suitable spatiotemporal fusion algorithms.
As shown in Figure 3, the fused NDVI images obtained using the STARFM and ESTARFM methods retained relatively consistent spatial detail features compared to the original observed images. Compared with STARFM, the R2 value of the Sentinel-2 NDVI image fused with ESTARFM is 0.05 higher, the RMSE is not significantly different, and the NRMSE is 0.04 lower. In addition, the ERGAS, UIQI, and CC values of the two fusion products show good image fusion quality. Based on the precision estimation strategy proposed by previous researchers [32], we conclude that ESTARFM offers superior performance for estimating Sentinel-2 NDVI fusion images. Furthermore, we observed that both spatiotemporal fusion methods tended to overestimate the NDVI values rather than approximating the observed NDVI. This overestimation is likely due to the MOD13Q1 NDVI data, which are based on a 16-day maximum value composite product, and the rapid changes in vegetation greenness during spring, leading to this overestimation.
To further evaluate the stability of the ESTARFM, we selected three typical scenes with different spatial distributions—homogeneity, heterogeneity, and hilly areas—as regions of interest for validation (Figure 4). The results indicated that the ESTARFM method produced good spatial detail consistency in the fusion results across all agricultural distribution scenarios, with R2 values exceeding 0.88, RMSE values below 0.07, and NRMSE values generally under 0.15. Furthermore, we found that the three scene remote sensing data fused using the ESTARFM method exhibit excellent image fusion performance, with ERGAS values all below 0.3 and both UIQI and CC values close to 1. Therefore, the spatiotemporal fusion image dataset for the study area from 2020 to 2024 generated by the ESTARFM method meets the requirements of this study.

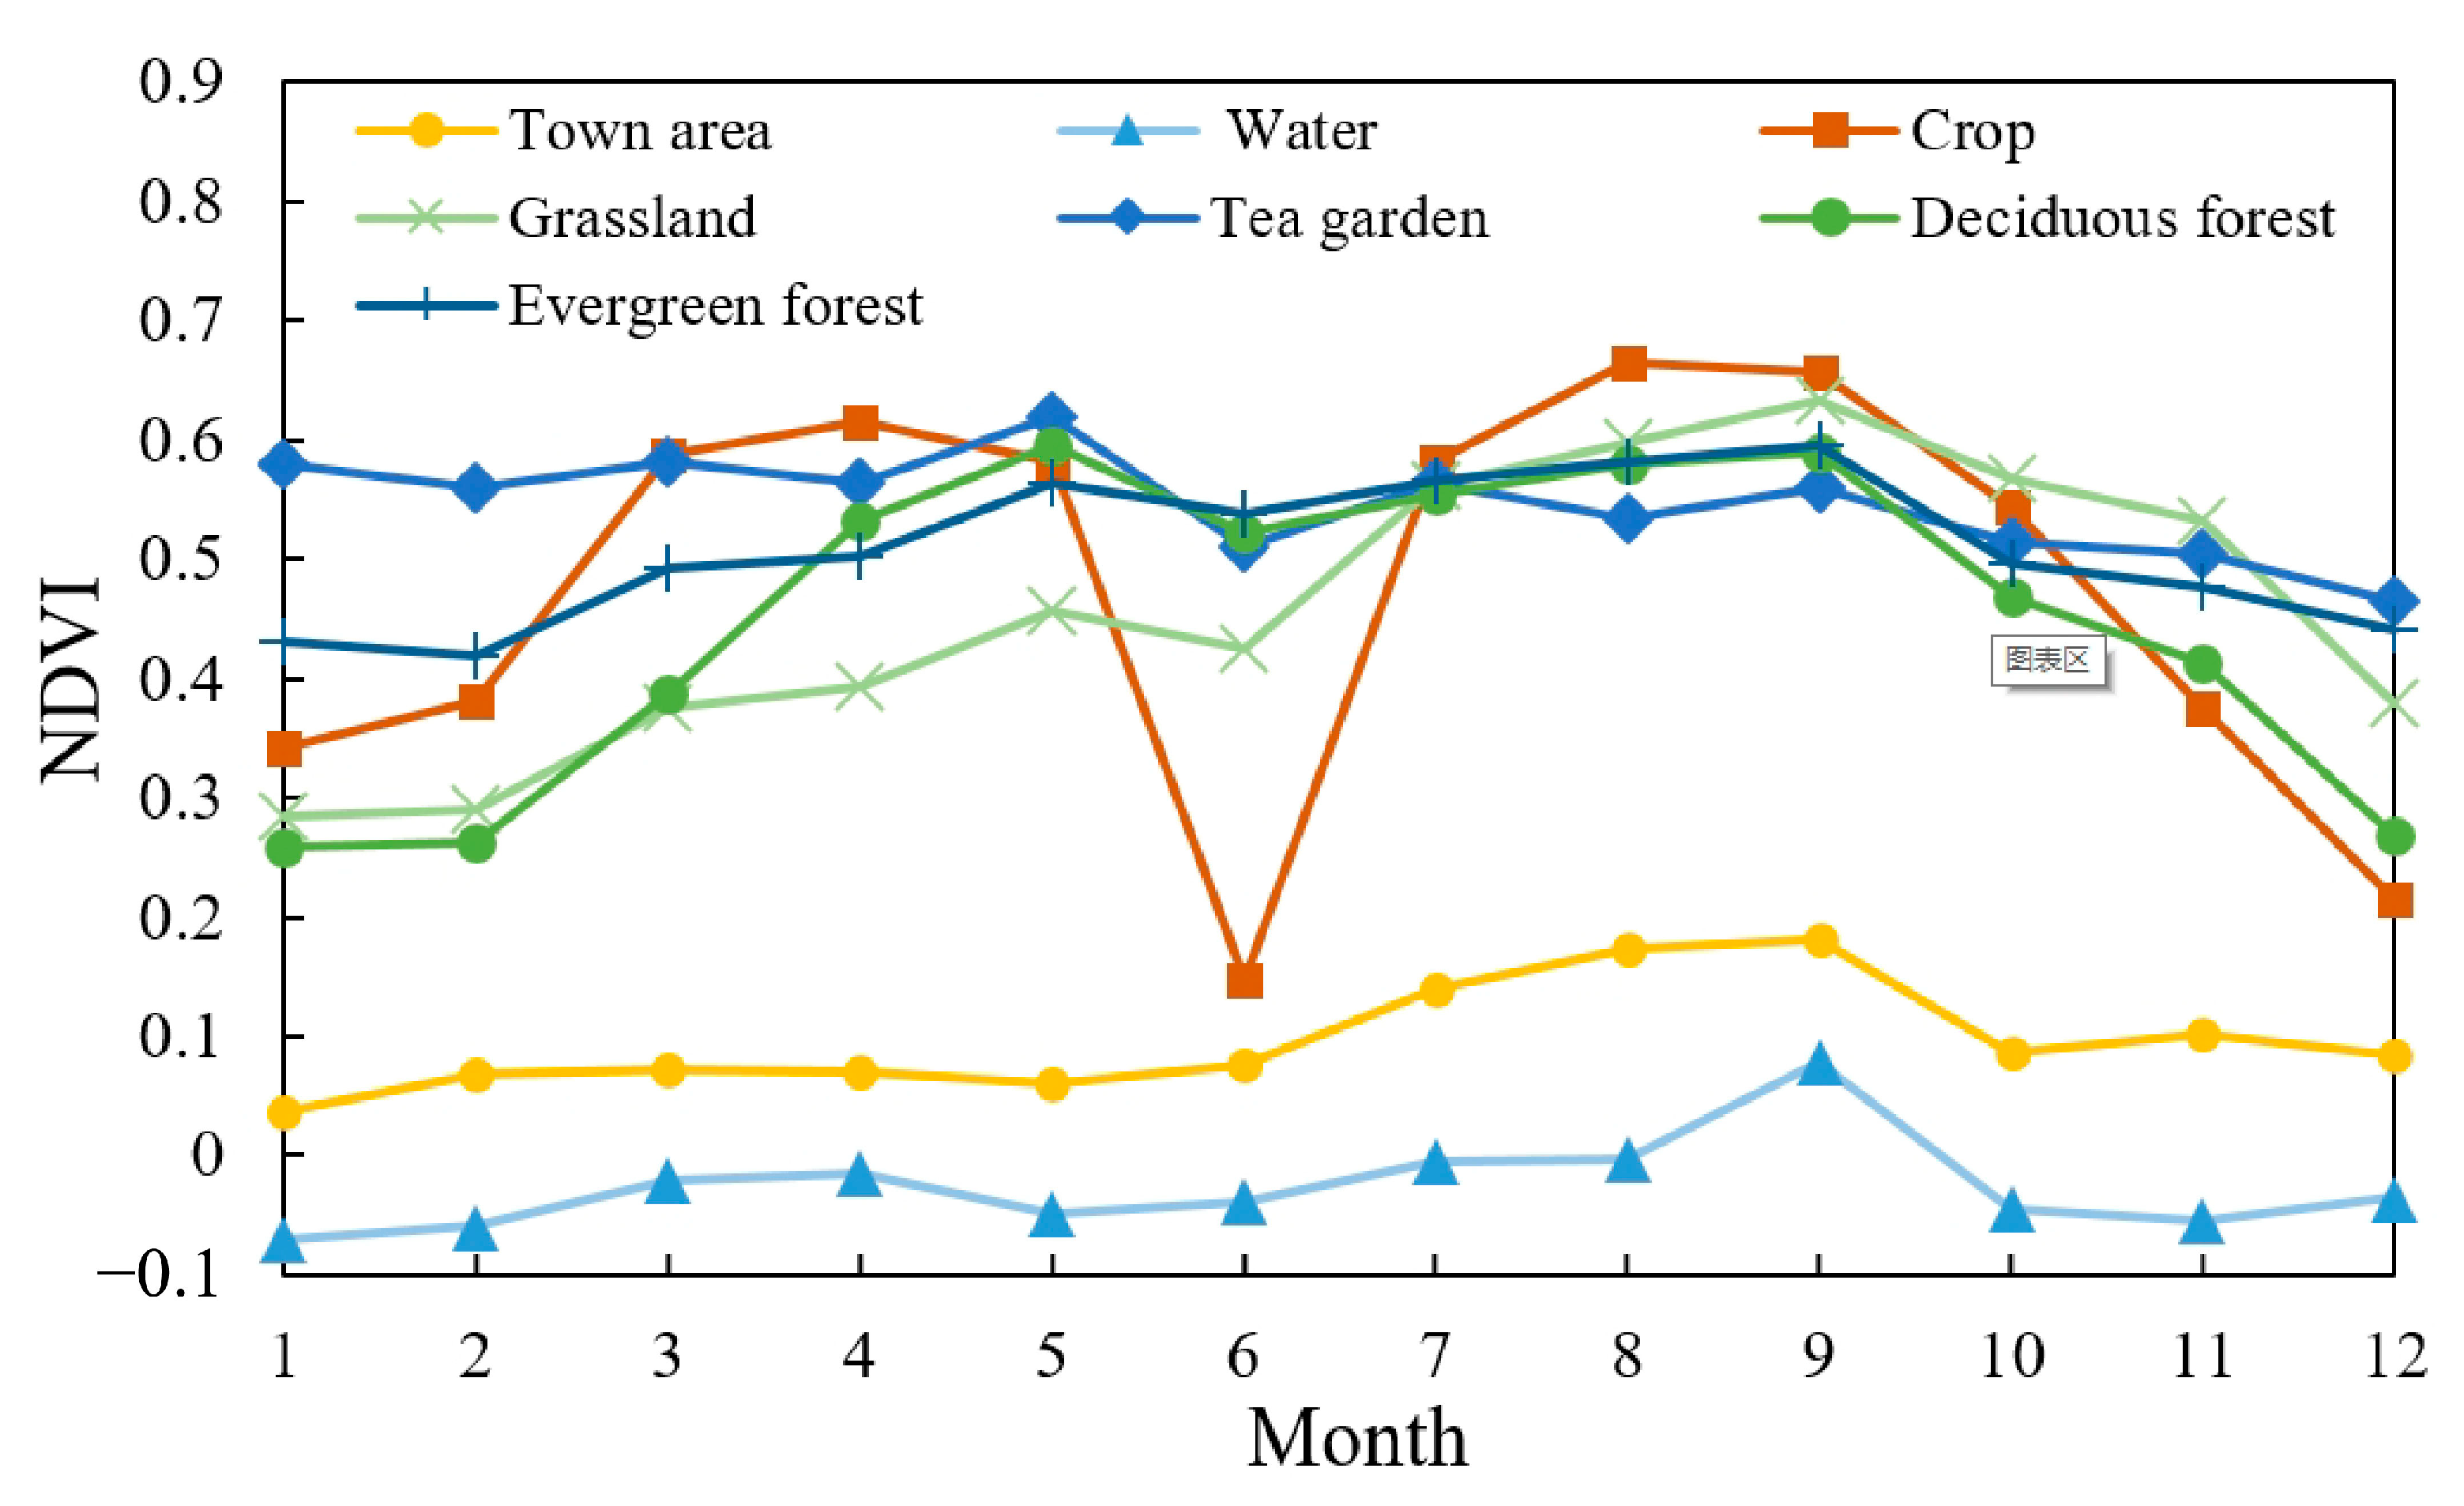
3.2. Land Cover Type Classification Based on Sentinel-2 NDVI Time-Series Fusion Images

The seasonal phenological rhythm characteristics of different vegetation types play a crucial role in determining the accuracy of land cover classification. This study is based on a fused 2022 Sentinel-2 NDVI spatiotemporal fusion imagery dataset and field-surveyed land cover type sample areas of interest. By analyzing the NDVI time-series change curves for seven land cover types in the study area (Figure 5), this study revealed that the NDVI values of evergreen forests and tea gardens remained high throughout the year, with minimal seasonal variation. However, compared to tea gardens, the NDVI values of evergreen forests were lower in winter and peaked in summer. The NDVI values of deciduous forests and grasslands exhibited broadly similar patterns, with grasslands showing a slower green-up in spring. Grasslands reached their peak growing season in July and did not significantly decline until November, indicating that the entire growth season lagged behind deciduous forests. The NDVI values of urban and open water areas remained low throughout the year, showing only a slight increase during the rainy season in summer. The seasonal pattern of NDVI values for croplands corresponds to the different stages of crop growth, including sowing, growth, maturation, and harvest. This pattern is characterized by two peaks in NDVI during the vigorous growth periods, exhibiting a clear distinction from other land cover types. These temporal phenological rhythm characteristics significantly contributed to the accurate classification of land cover types in the study area. Consequently, based on the 2022 Sentinel-2 NDVI time-series data and samples of the seven land cover types, an SVM supervised classification method was applied to generate the land cover classification map of the study area (Figure 6).
We then evaluated the accuracy of the land cover classification results using a confusion matrix and independent samples (Table 1). The results indicated that the overall accuracy and Kappa coefficient reached 97.32% and 0.96, respectively. Except for the misclassification between tea gardens and evergreen forests, the producer and user accuracies for the other land cover types exceeded 91%. Cropland, in particular, achieved relatively high classification accuracy, with both producer and user accuracies exceeding 99%. Additionally, we conducted further validation of the classification results through visual interpretation, using the 2021 WorldCover map published by ESA (with a spatial resolution of 10 m and overall classification accuracy of 74%). The validation focused on four areas of interest in plain, hilly, and mountainous terrains. The results demonstrated that the classification results from this study exhibited good spatial distribution consistency with the ESA WorldCover classification. In fragmented plots and hilly–mountainous regions, our results provided more detailed spatial information.

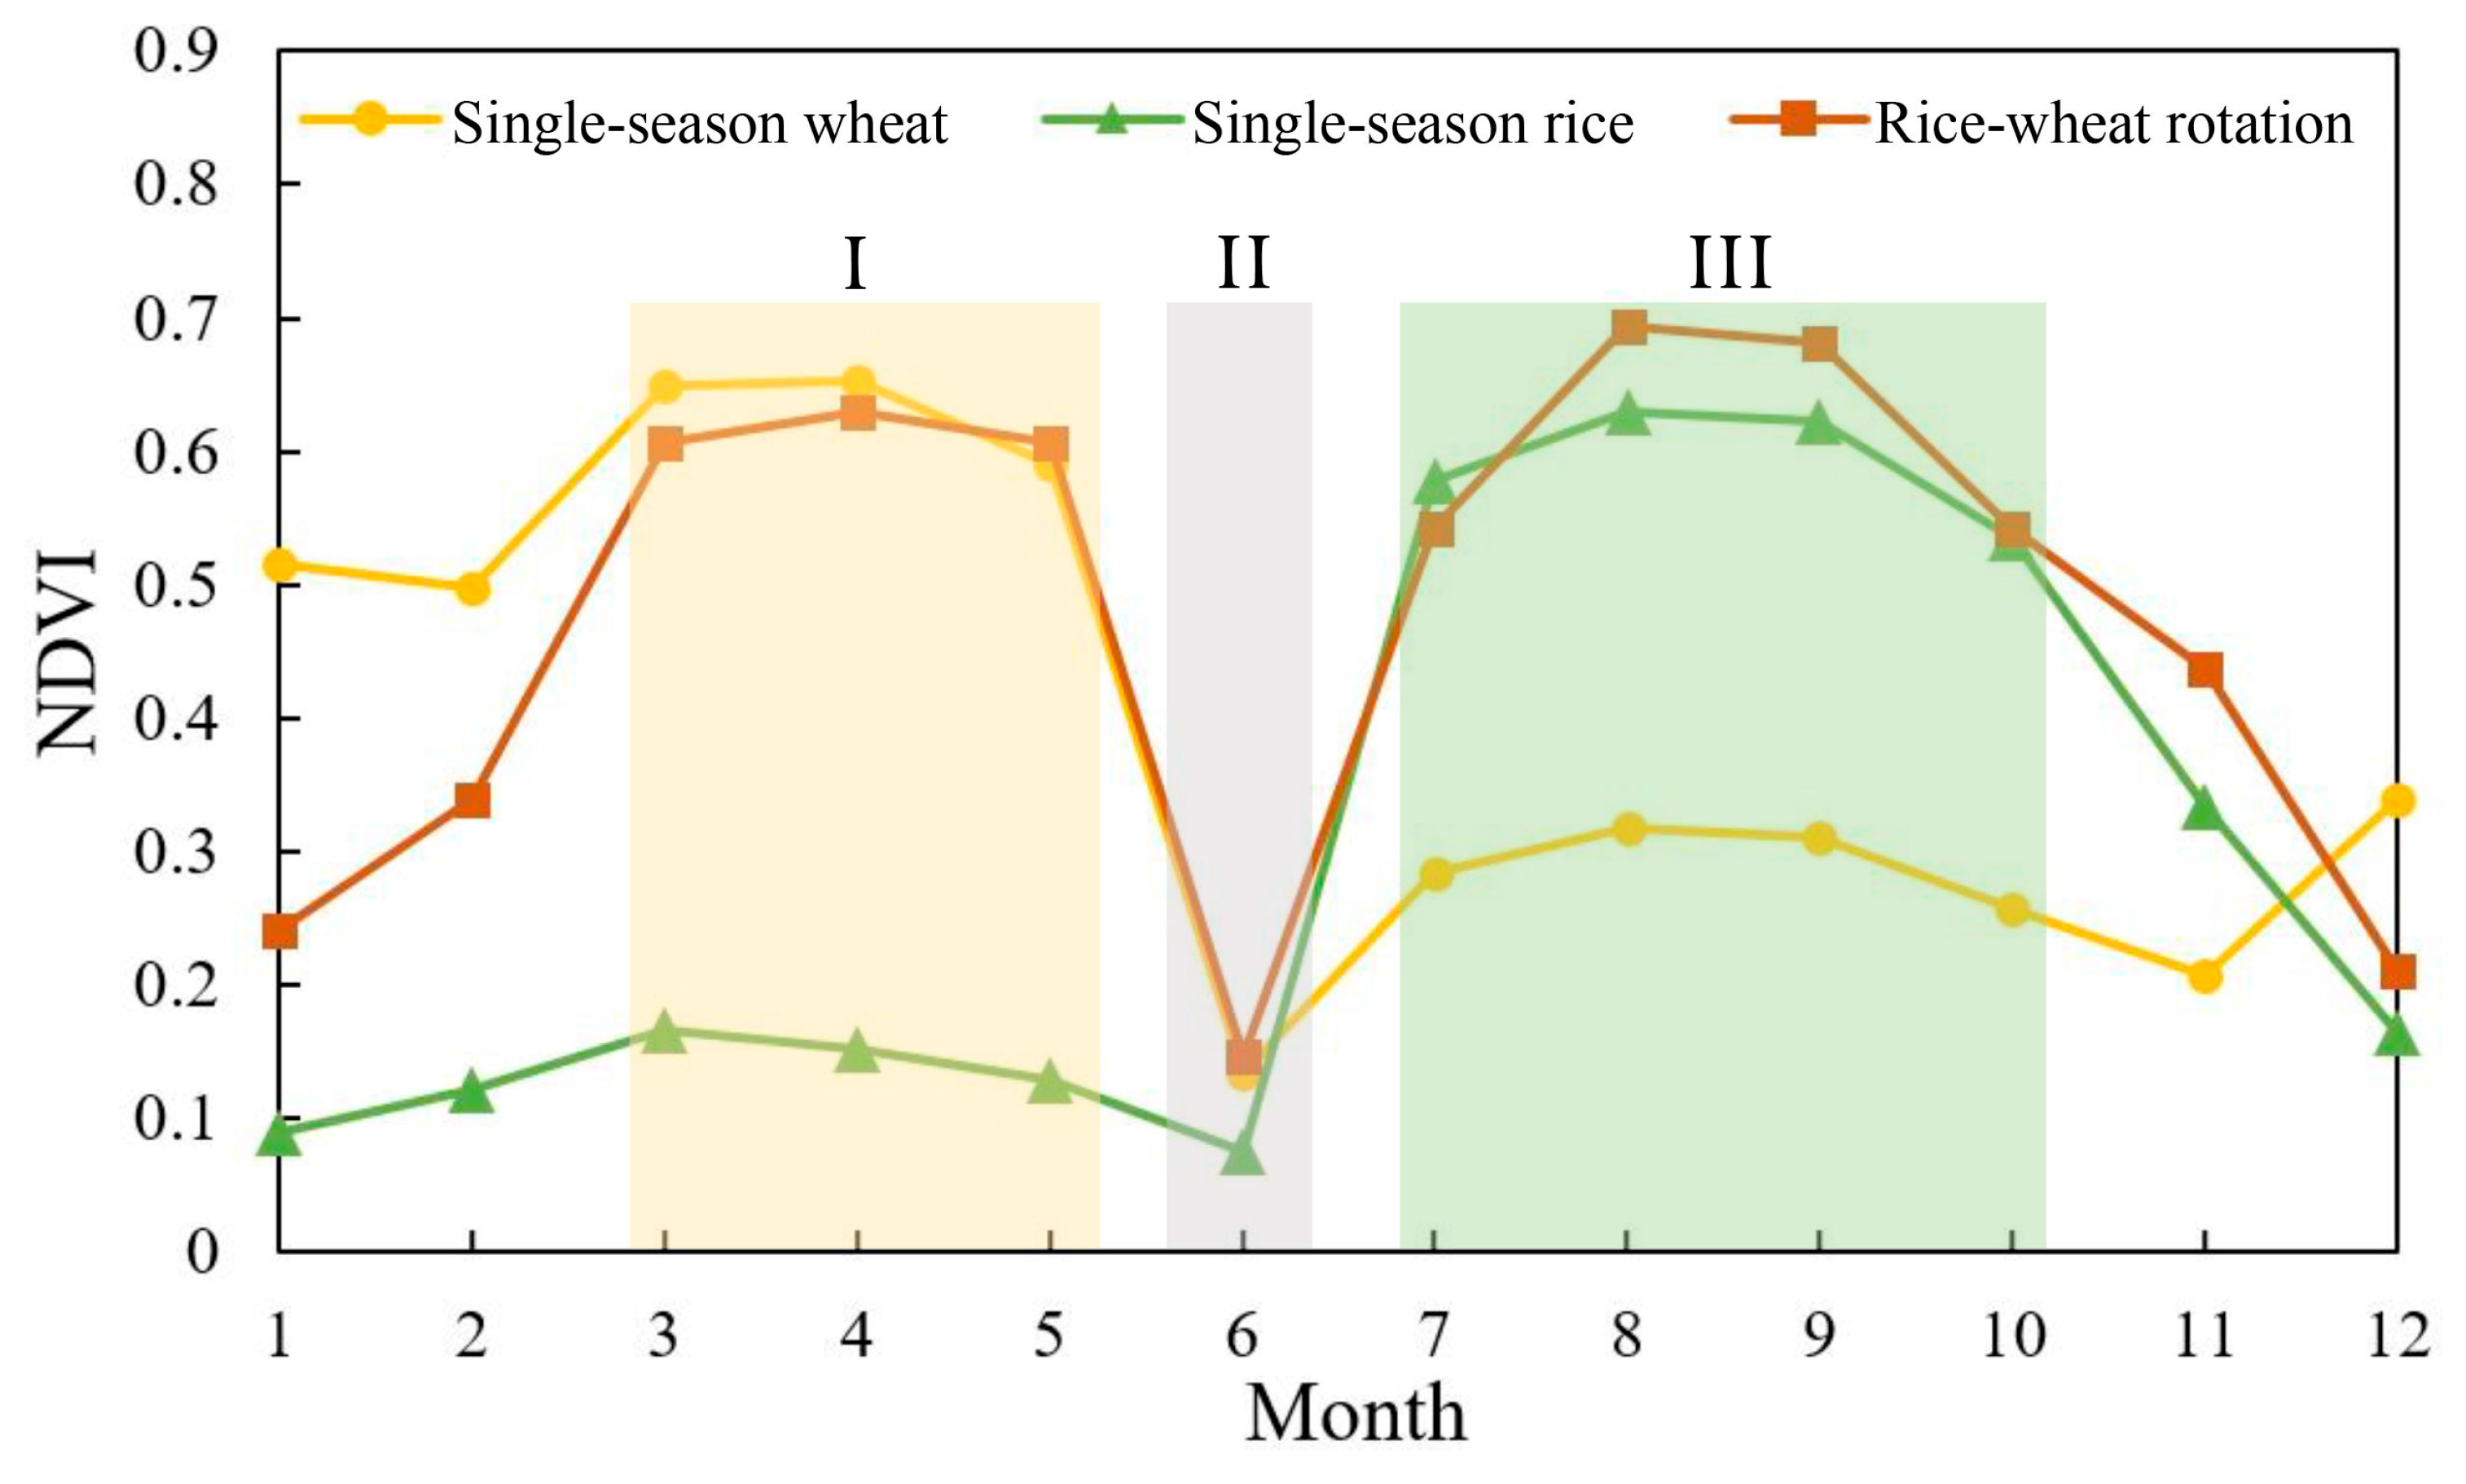
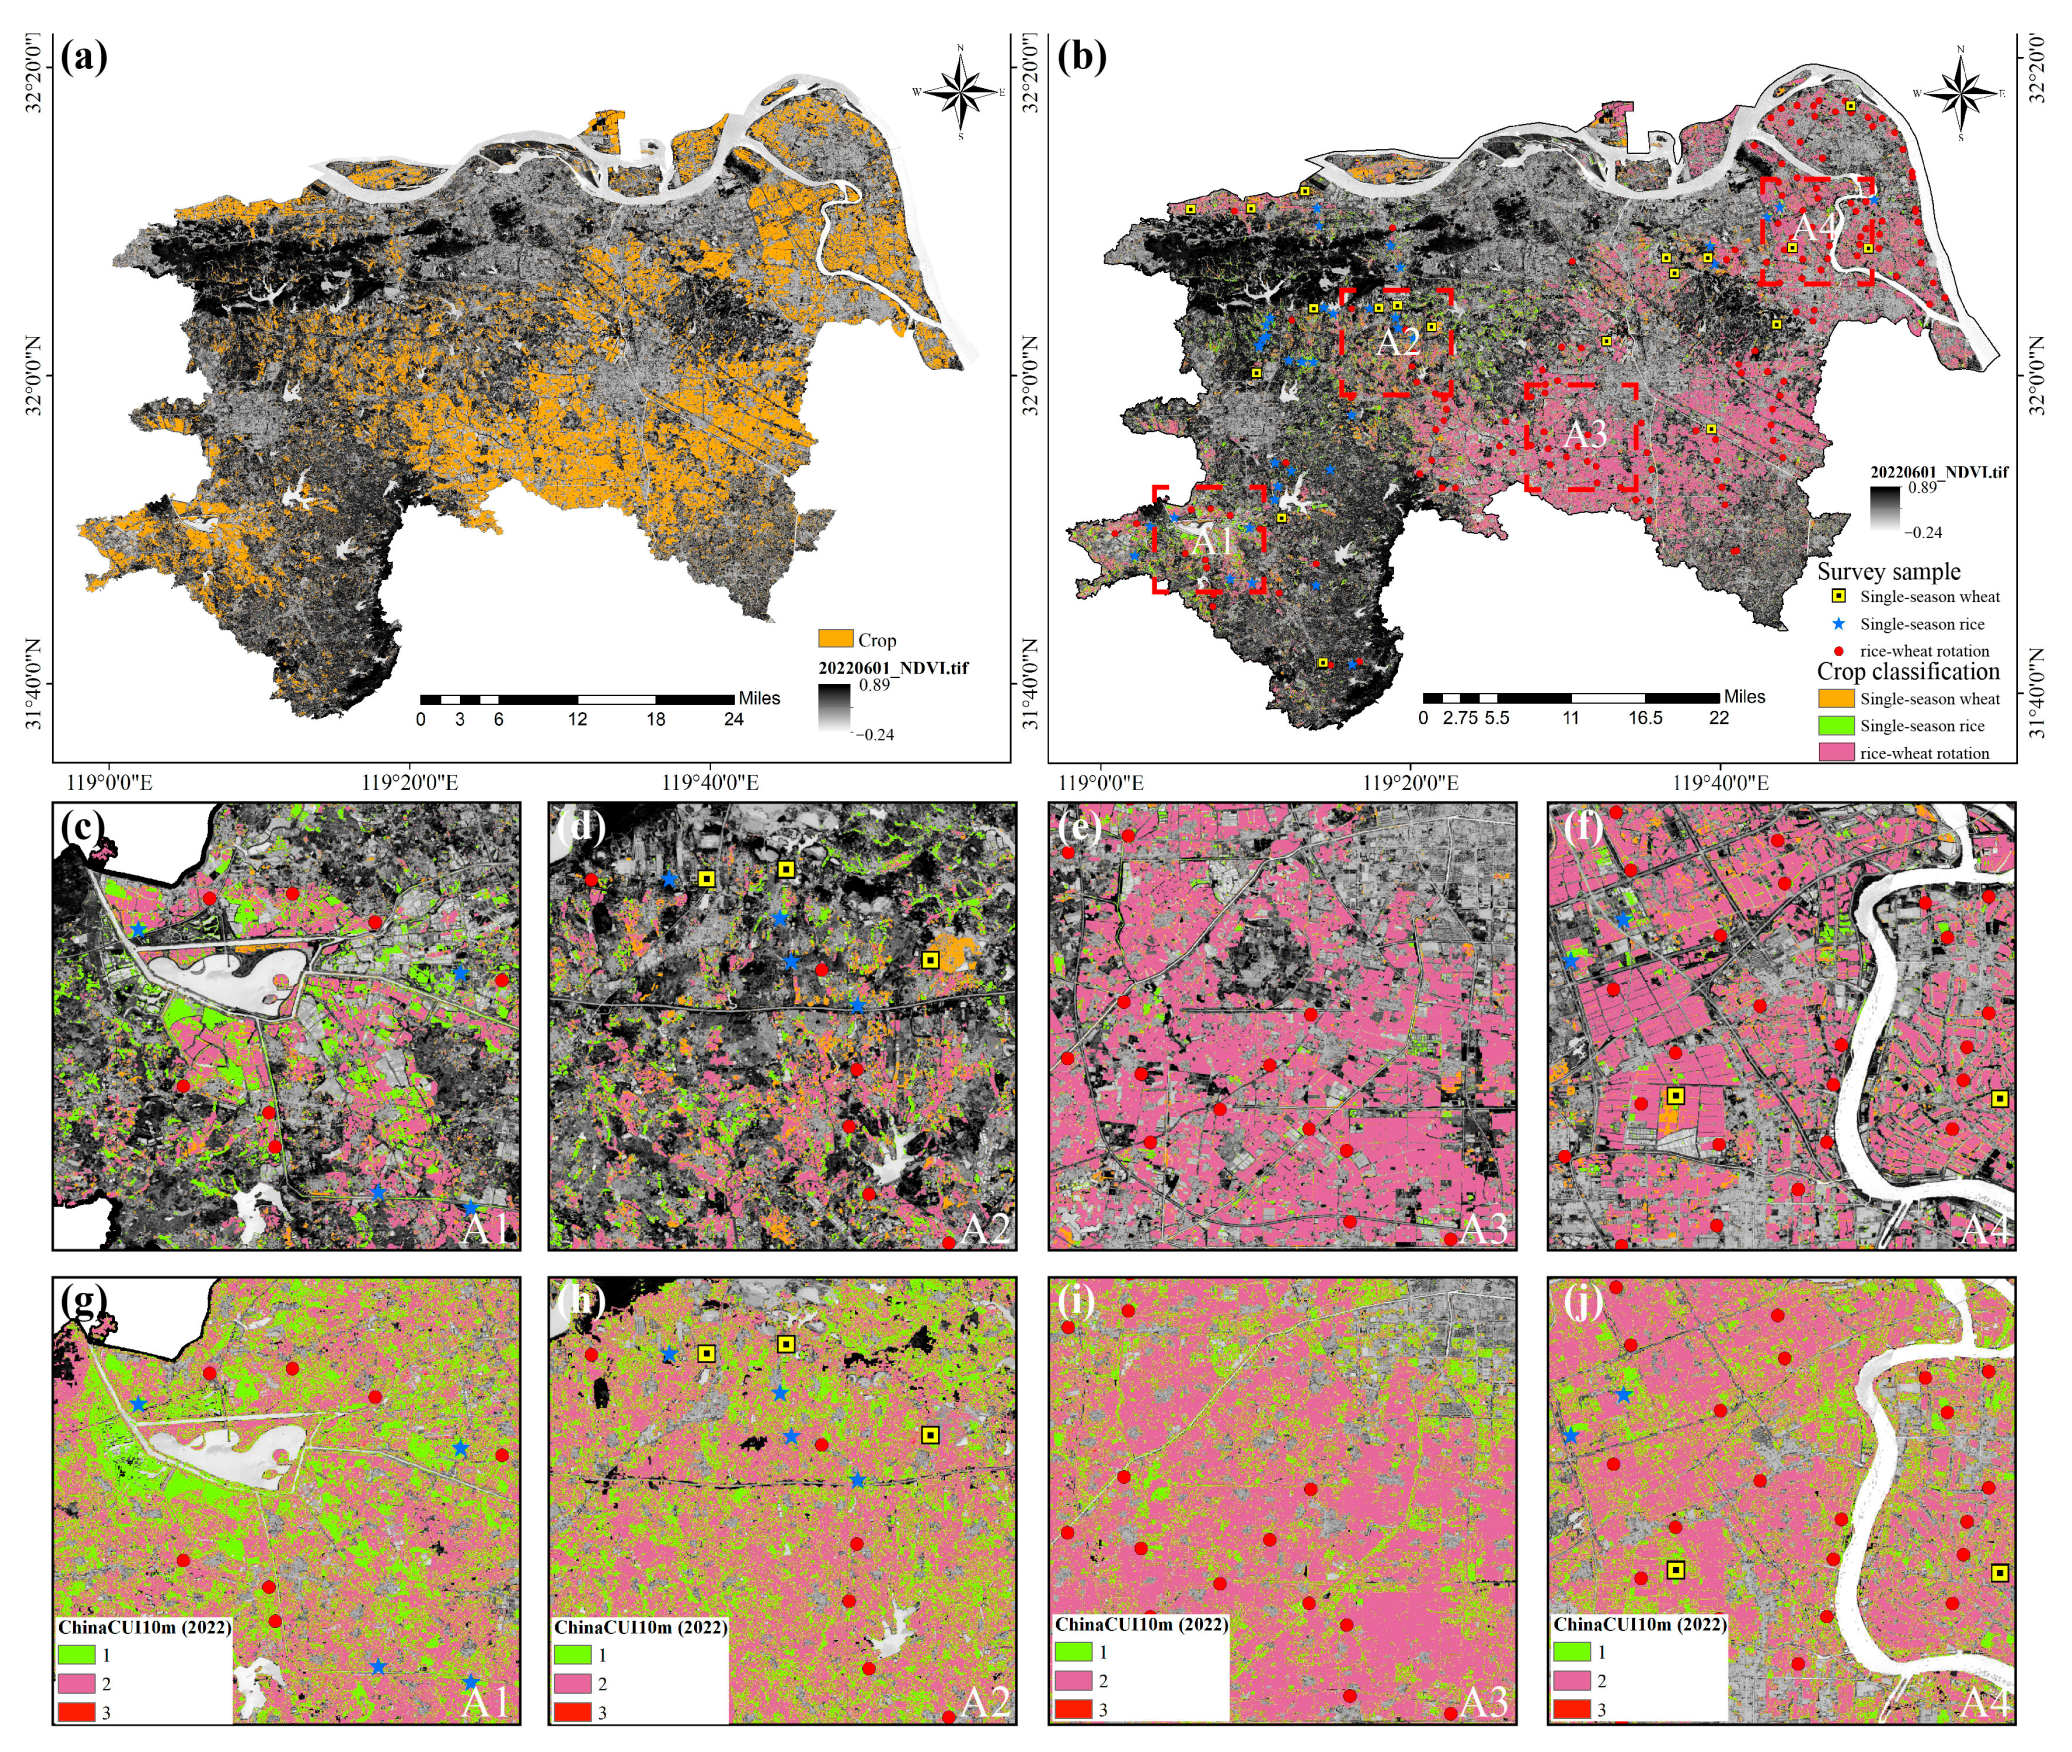
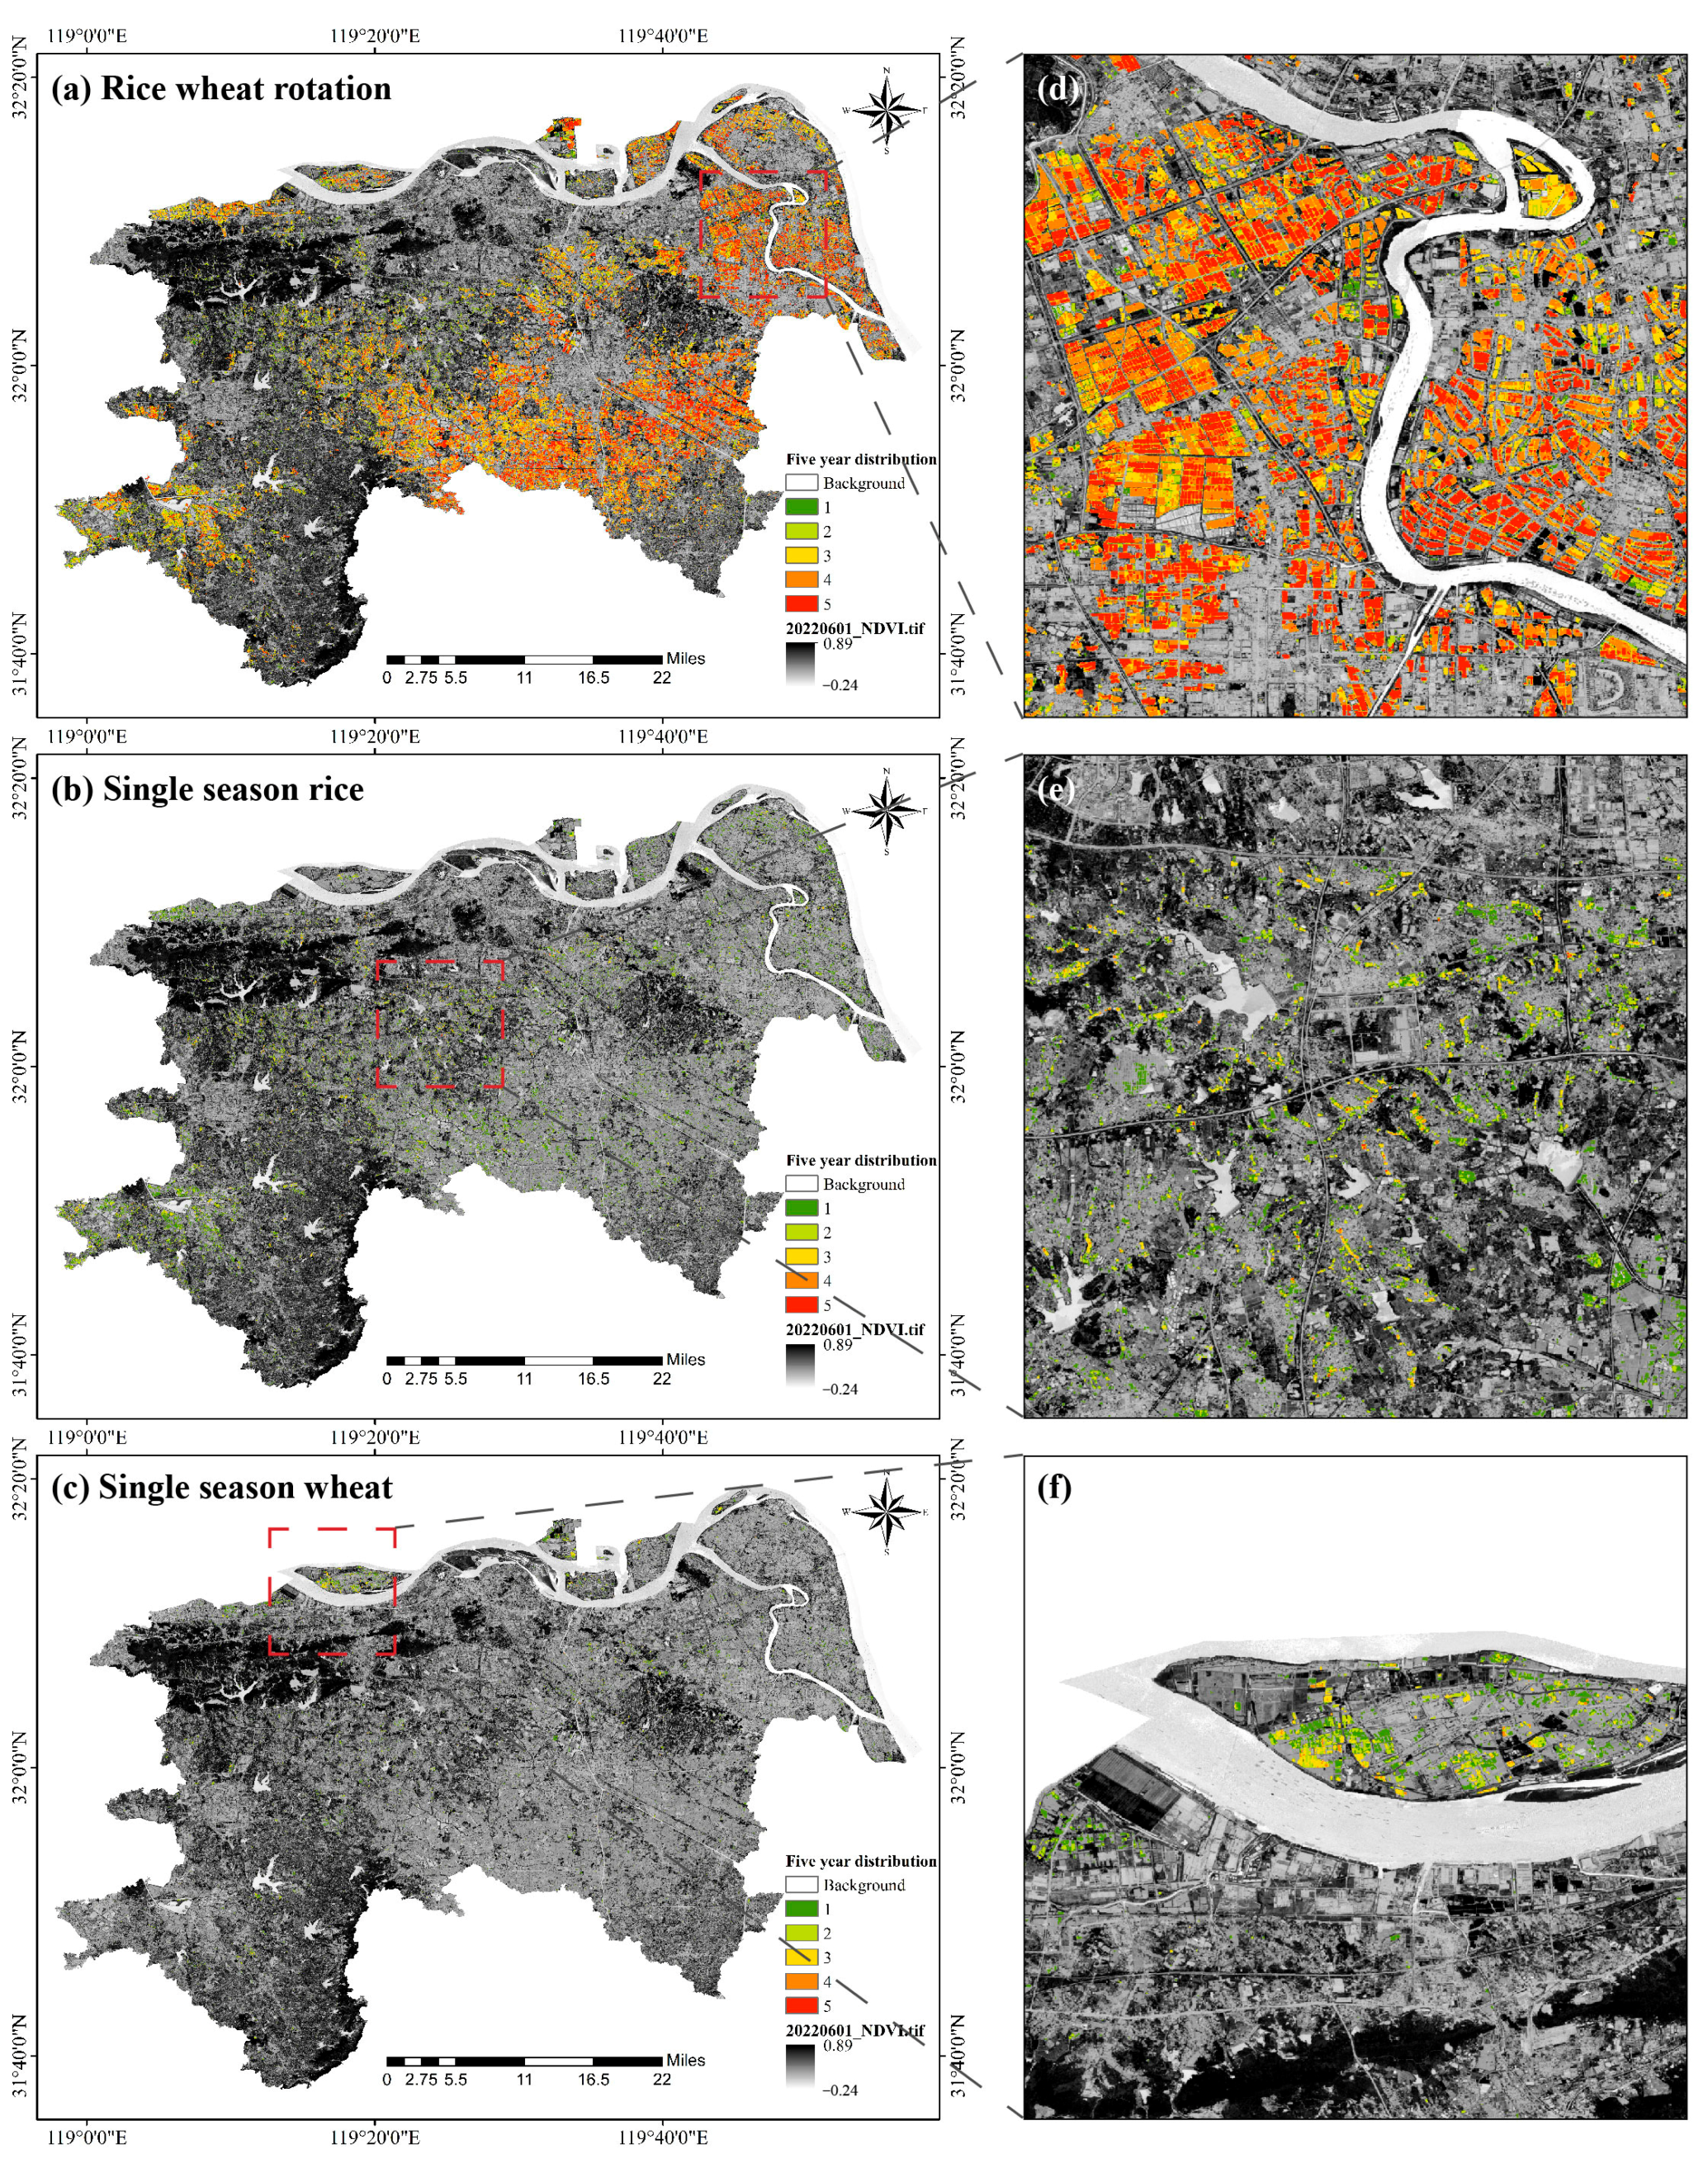
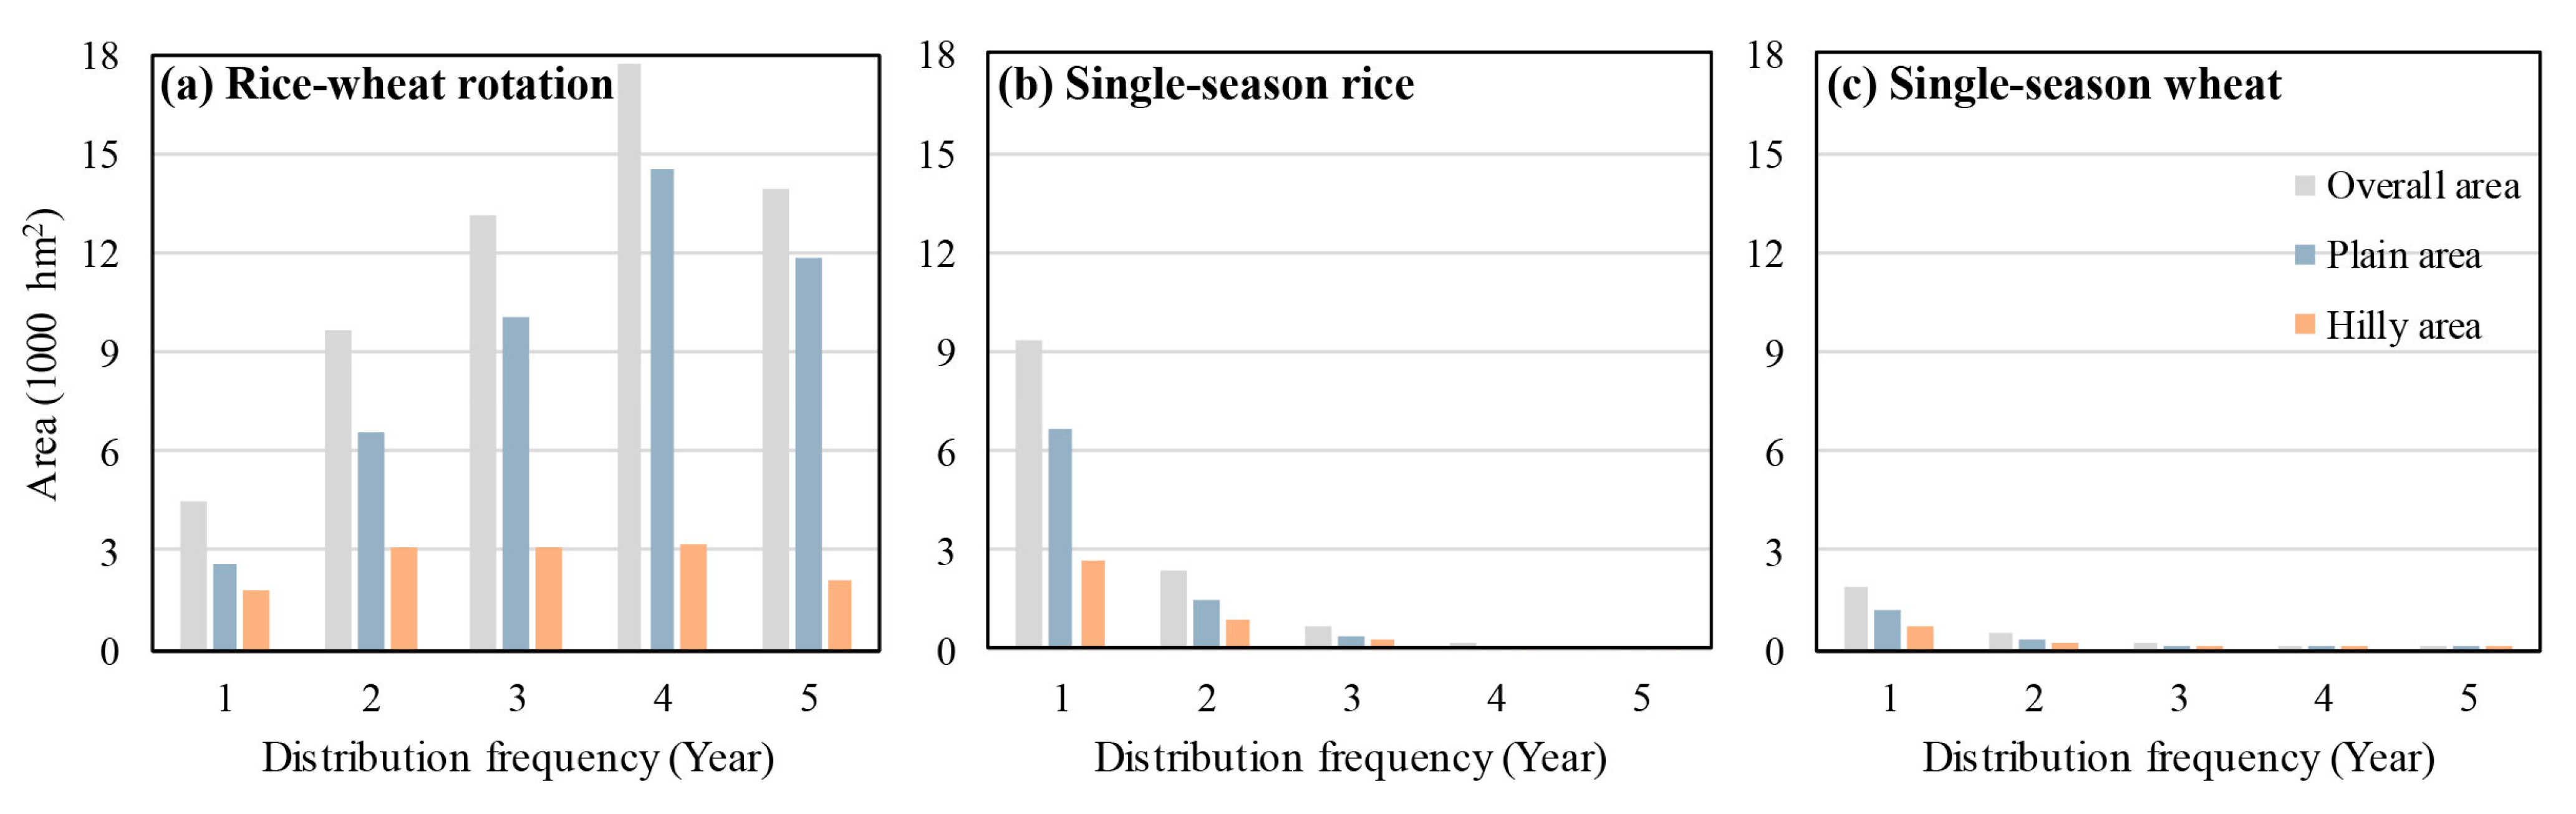
3.3. Estimation of Crop Distribution Frequency Based on Phenological Rhythm

To further identify the crop type corresponding to the cropland area, this study utilized the field survey samples of single-season wheat, single-season rice, and rice–wheat rotation collected in the study area in 2022, masked the 2022 Sentinel-2 NDVI time-series fusion image, and calculated the average NDVI time-series data of the three crop types (Figure 7). The results showed that the NDVI values for single-season wheat exhibited a high and stable growth phase from March to May, with a sharp decline after the harvest period in June. From July to November, the fields remained fallow, though the NDVI slightly rebounded due to the summer and autumn seasons. In contrast, the single-season rice fields remained fallow from January to June, with relatively stable and high NDVI values from July to October. A sharp decrease in the NDVI occurred at the end of October, marking the harvest period. The rice–wheat rotation fields exhibited the most distinct pattern, with two prominent peaks in the NDVI curve, corresponding to the vigorous growth phases of wheat and rice. In summary, these three crop types exhibited three significant temporal variations: the vigorous growth phase of wheat (March to May), the harvest period (June), and the vigorous growth phase of rice (July to October).
To address the challenges of acquiring high-quality remote sensing images over long time series, we extracted the NDVI time-series curves for the three key phenological phases of 2022, which served as the standard phenological reference curves. Based on previous studies [34], the ED method was employed to measure the similarity between the time-series data for different phenological phases and the reference data. This enabled accurate classification. Specifically, the ED data set for each pixel in the areas of interest for different crop types was calculated and compared with the standard phenological reference curve. The median ED value for each crop type was then used as the optimal segmentation threshold.
Additionally, considering that the cropland area in the study region has remained stable over the past five years (Zhenjiang Statistical Yearbook), we utilized the 2022 cropland distribution map to mask the Sentinel-2 NDVI fusion images for 2020 to 2024, which were composed of the three key phenological phases. Finally, classification was conducted based on the ED method and the time-series images for each year, resulting in crop type distribution maps for 2020 to 2024. Taking the 2022 cropland and crop type distribution as an example, we observed the spatial distribution characteristics of single-season rice, single-season wheat, and rice–wheat rotation areas. The rice–wheat rotation area was the largest, accounting for 73.1% of the total cropland area, and was primarily distributed in the eastern and southeastern plains. This was followed by single-season rice (15.8%) and single-season wheat (11.1%), which were mainly located in the western and northwestern hilly and mountainous regions (Figure 8). By comparing the crop distribution results of this study with the 2022 ChinaGUI10m cropland intensity dataset [35], it was found that the distribution of double-cropping crops generally aligns with the spatial patterns in the ChinaGUI10m dataset. However, significant differences were observed in the spatial distribution of single-cropping crops. This discrepancy can be attributed to the fact that the ChinaGUI10m dataset classifies most deciduous forests as single-cropping areas. In contrast, the ESTARFM spatiotemporal fusion dataset used in this study maintains relatively high classification accuracy for land cover distribution, effectively preventing the misidentification of single-cropping areas.
Subsequently, based on the spatial distribution results of three cropping patterns—rice–wheat rotation, single-season rice, and single-season wheat—from 2020 to 2024, a five-year distribution frequency map of the study area was generated (Figure 9). This study utilized distribution frequency data from areas of interest obtained through field surveys, integrated with the confusion matrix validation method, to assess the accuracy of distribution frequencies for three cropping patterns (Table 2). The results demonstrated that all three cropping patterns achieved acceptable recognition accuracy, with the average overall accuracy and Kappa coefficient reaching 81.53% and 0.68, respectively. Among them, the rice–wheat rotation pattern exhibited the highest estimation accuracy, with an overall accuracy of 86.11% and a Kappa coefficient of 0.78. The single-season rice pattern had the second-highest accuracy, with an overall accuracy of 82.53% and a Kappa coefficient of 0.66. The single-season wheat pattern had the lowest estimation accuracy, with an overall accuracy of 75.95% and a Kappa coefficient of 0.6. Additionally, all three patterns achieved higher recognition accuracy at the 1-year, 4-year, and 5-year distribution frequencies, while accuracy was lower for the 2-year and 3-year distribution frequencies. This lower accuracy for the 2-year and 3-year distribution frequencies may be attributed to the fact that single-season rice and single-season wheat fields are predominantly located in the fragmented landscape of the northwestern hilly–mountain regions, where fields with 2- to 3-year distribution frequencies are more susceptible to mixing, resulting in comparatively lower validation accuracy for these distribution frequencies.
To analyze the interannual distribution frequency of these three cropping patterns in the plain and hilly–mountain areas, the terrain undulation of the study area was calculated using the SRTM DEM (https://earthexplorer.usgs.gov/, accessed on 15 December 2024), and the plain and hilly–mountain terrain distributions in Zhenjiang were differentiated based on the 1:1 million scale digital geomorphological classification system of China. As shown in Figure 9 and Figure 10, among the three cropping patterns, rice–wheat rotation occupies the largest area and is distributed in the southeastern plain and western hilly–mountain regions of the study area. Areas with an interannual distribution frequency exceeding three years are primarily concentrated in the southeastern plain, while the northwestern hilly–mountain areas generally show frequencies below two years. The single-season rice pattern is the second most extensive, scattered across the northwestern hilly–mountain regions, with an interannual distribution frequency mostly below three years. The single-season wheat pattern occupies the smallest area, with a limited distribution along the northern banks of the Yangtze River in the Zhenjiang region, and its interannual distribution frequency is mostly below two years. The findings reveal that the rice–wheat rotation pattern, which is mainly located in the plain areas, is more stable compared to the single-season rice and single-season wheat patterns, which mostly fall within the 1–2-year frequency range. The rice–wheat rotation pattern in the plain region shows a lower frequency of change over the five years, with the majority of its distribution frequency falling within the 3–5-year range.

4. Discussion

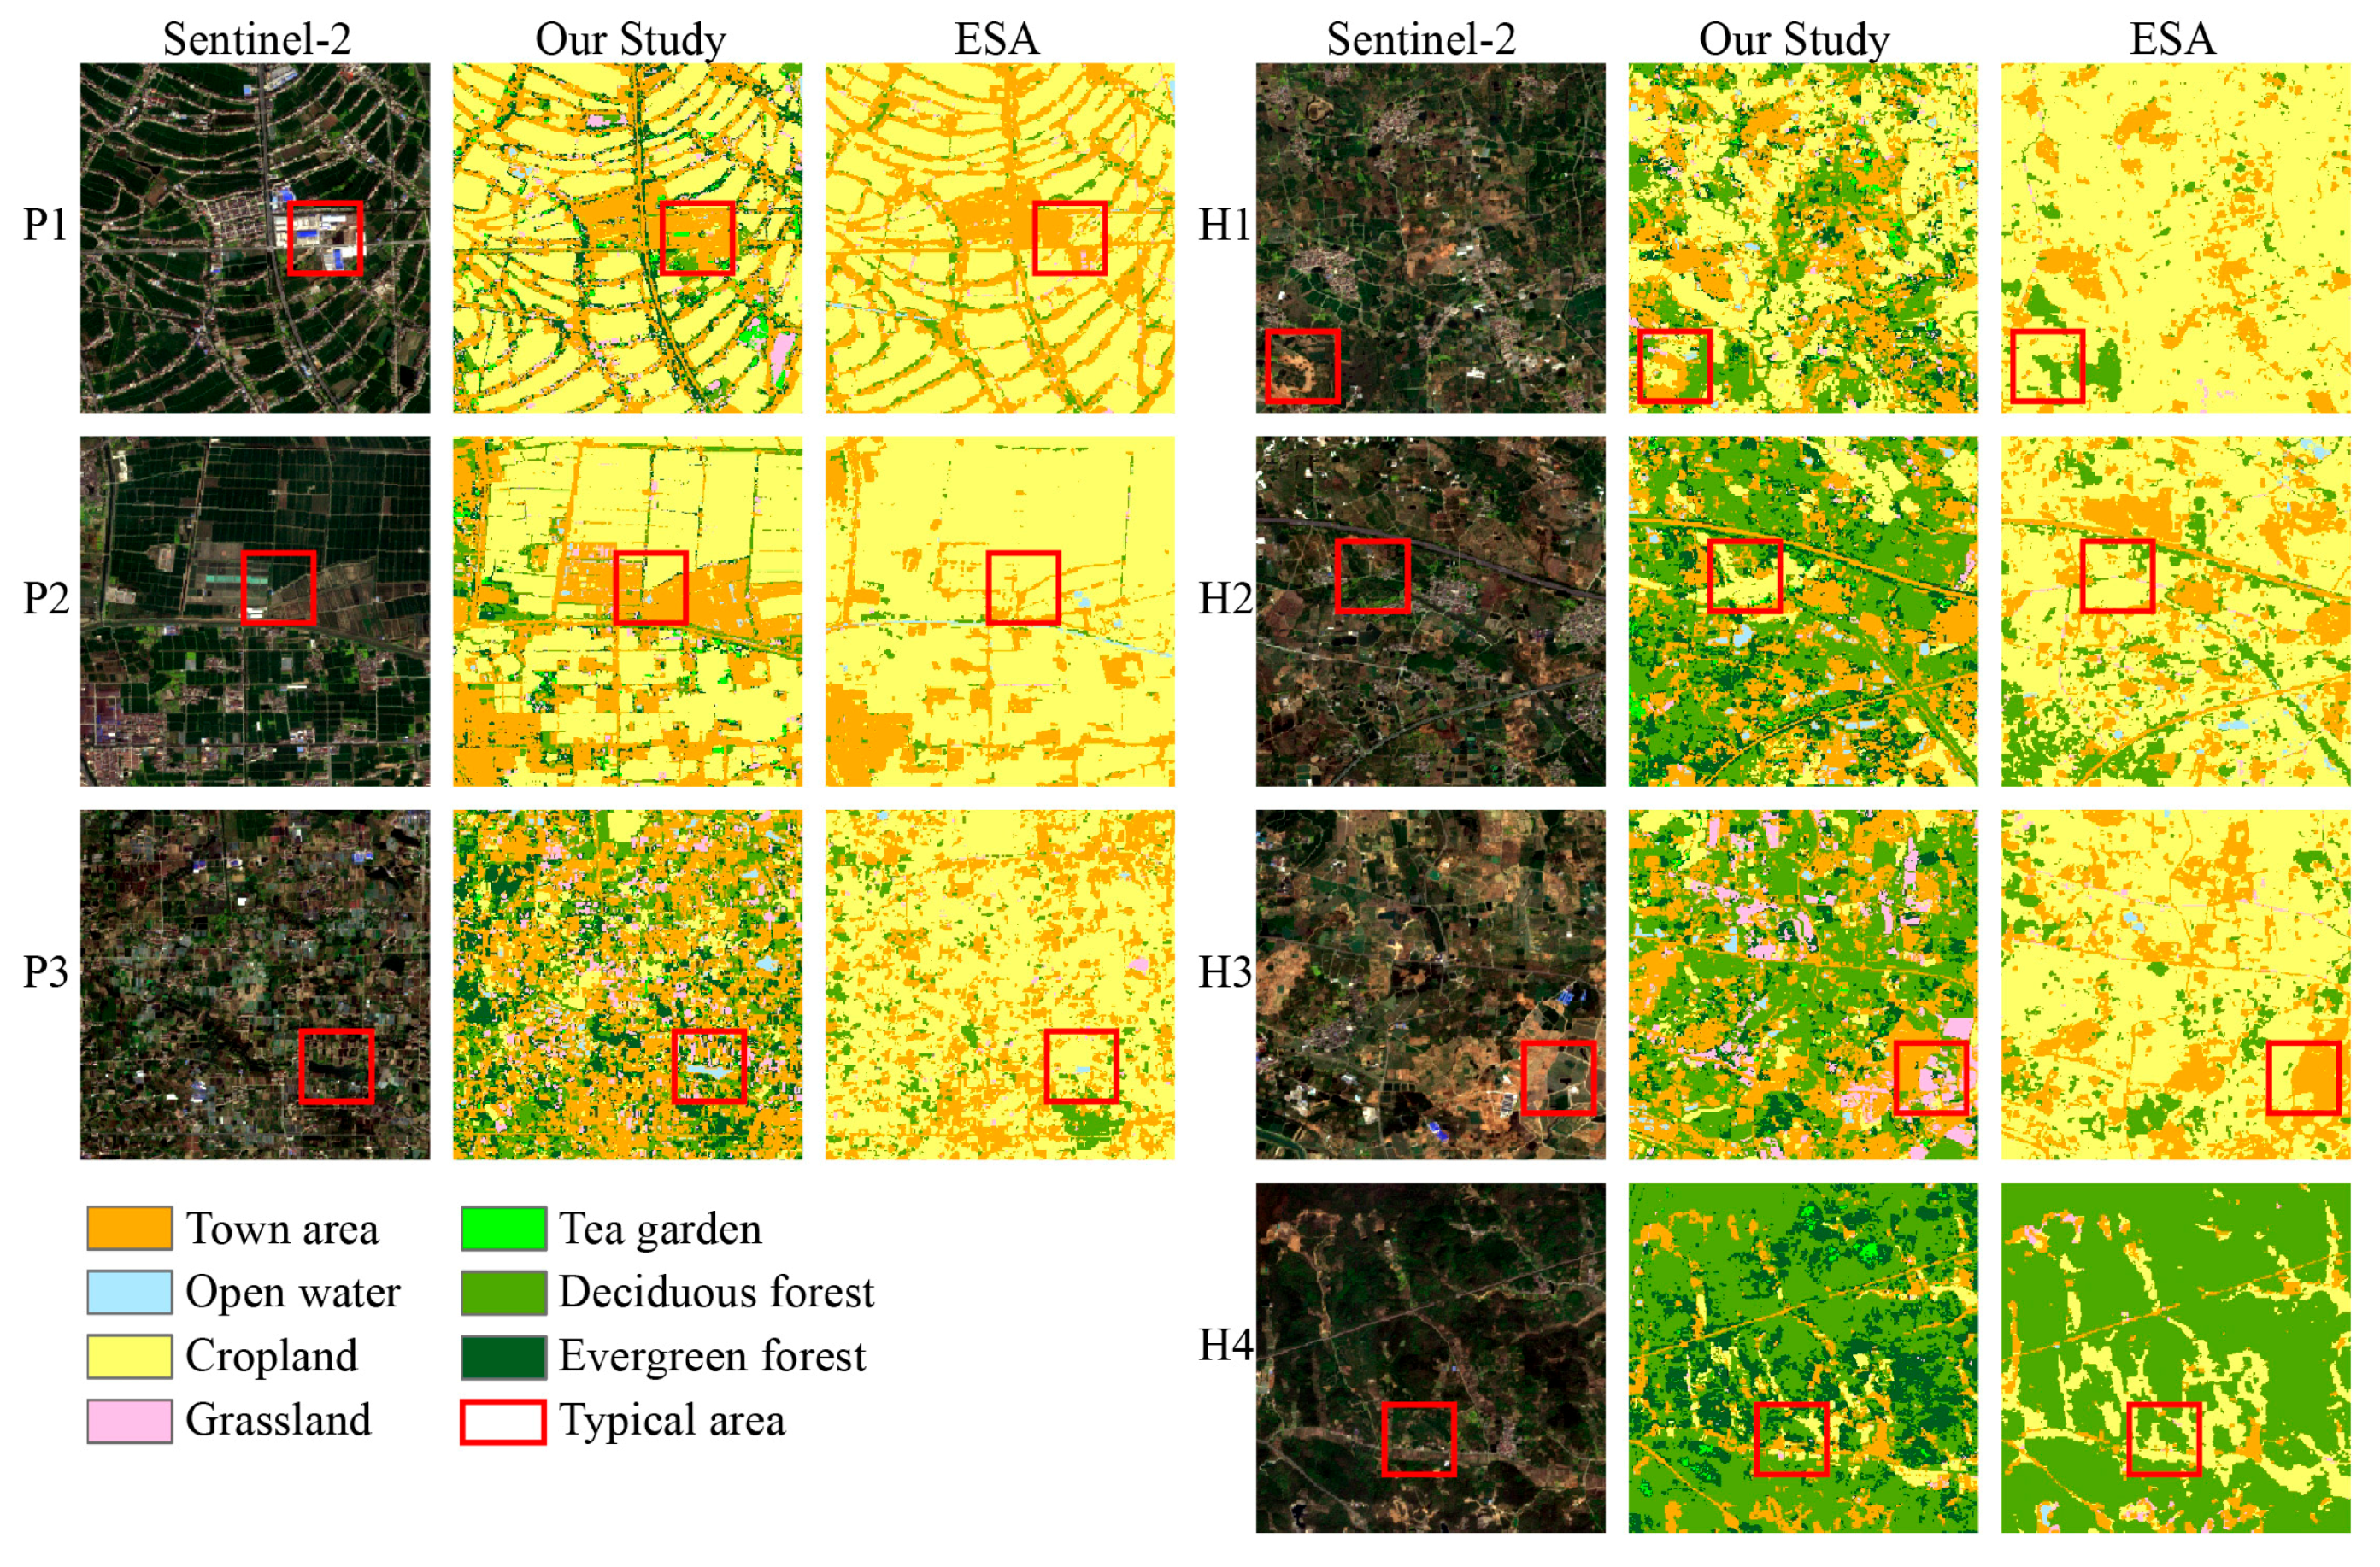
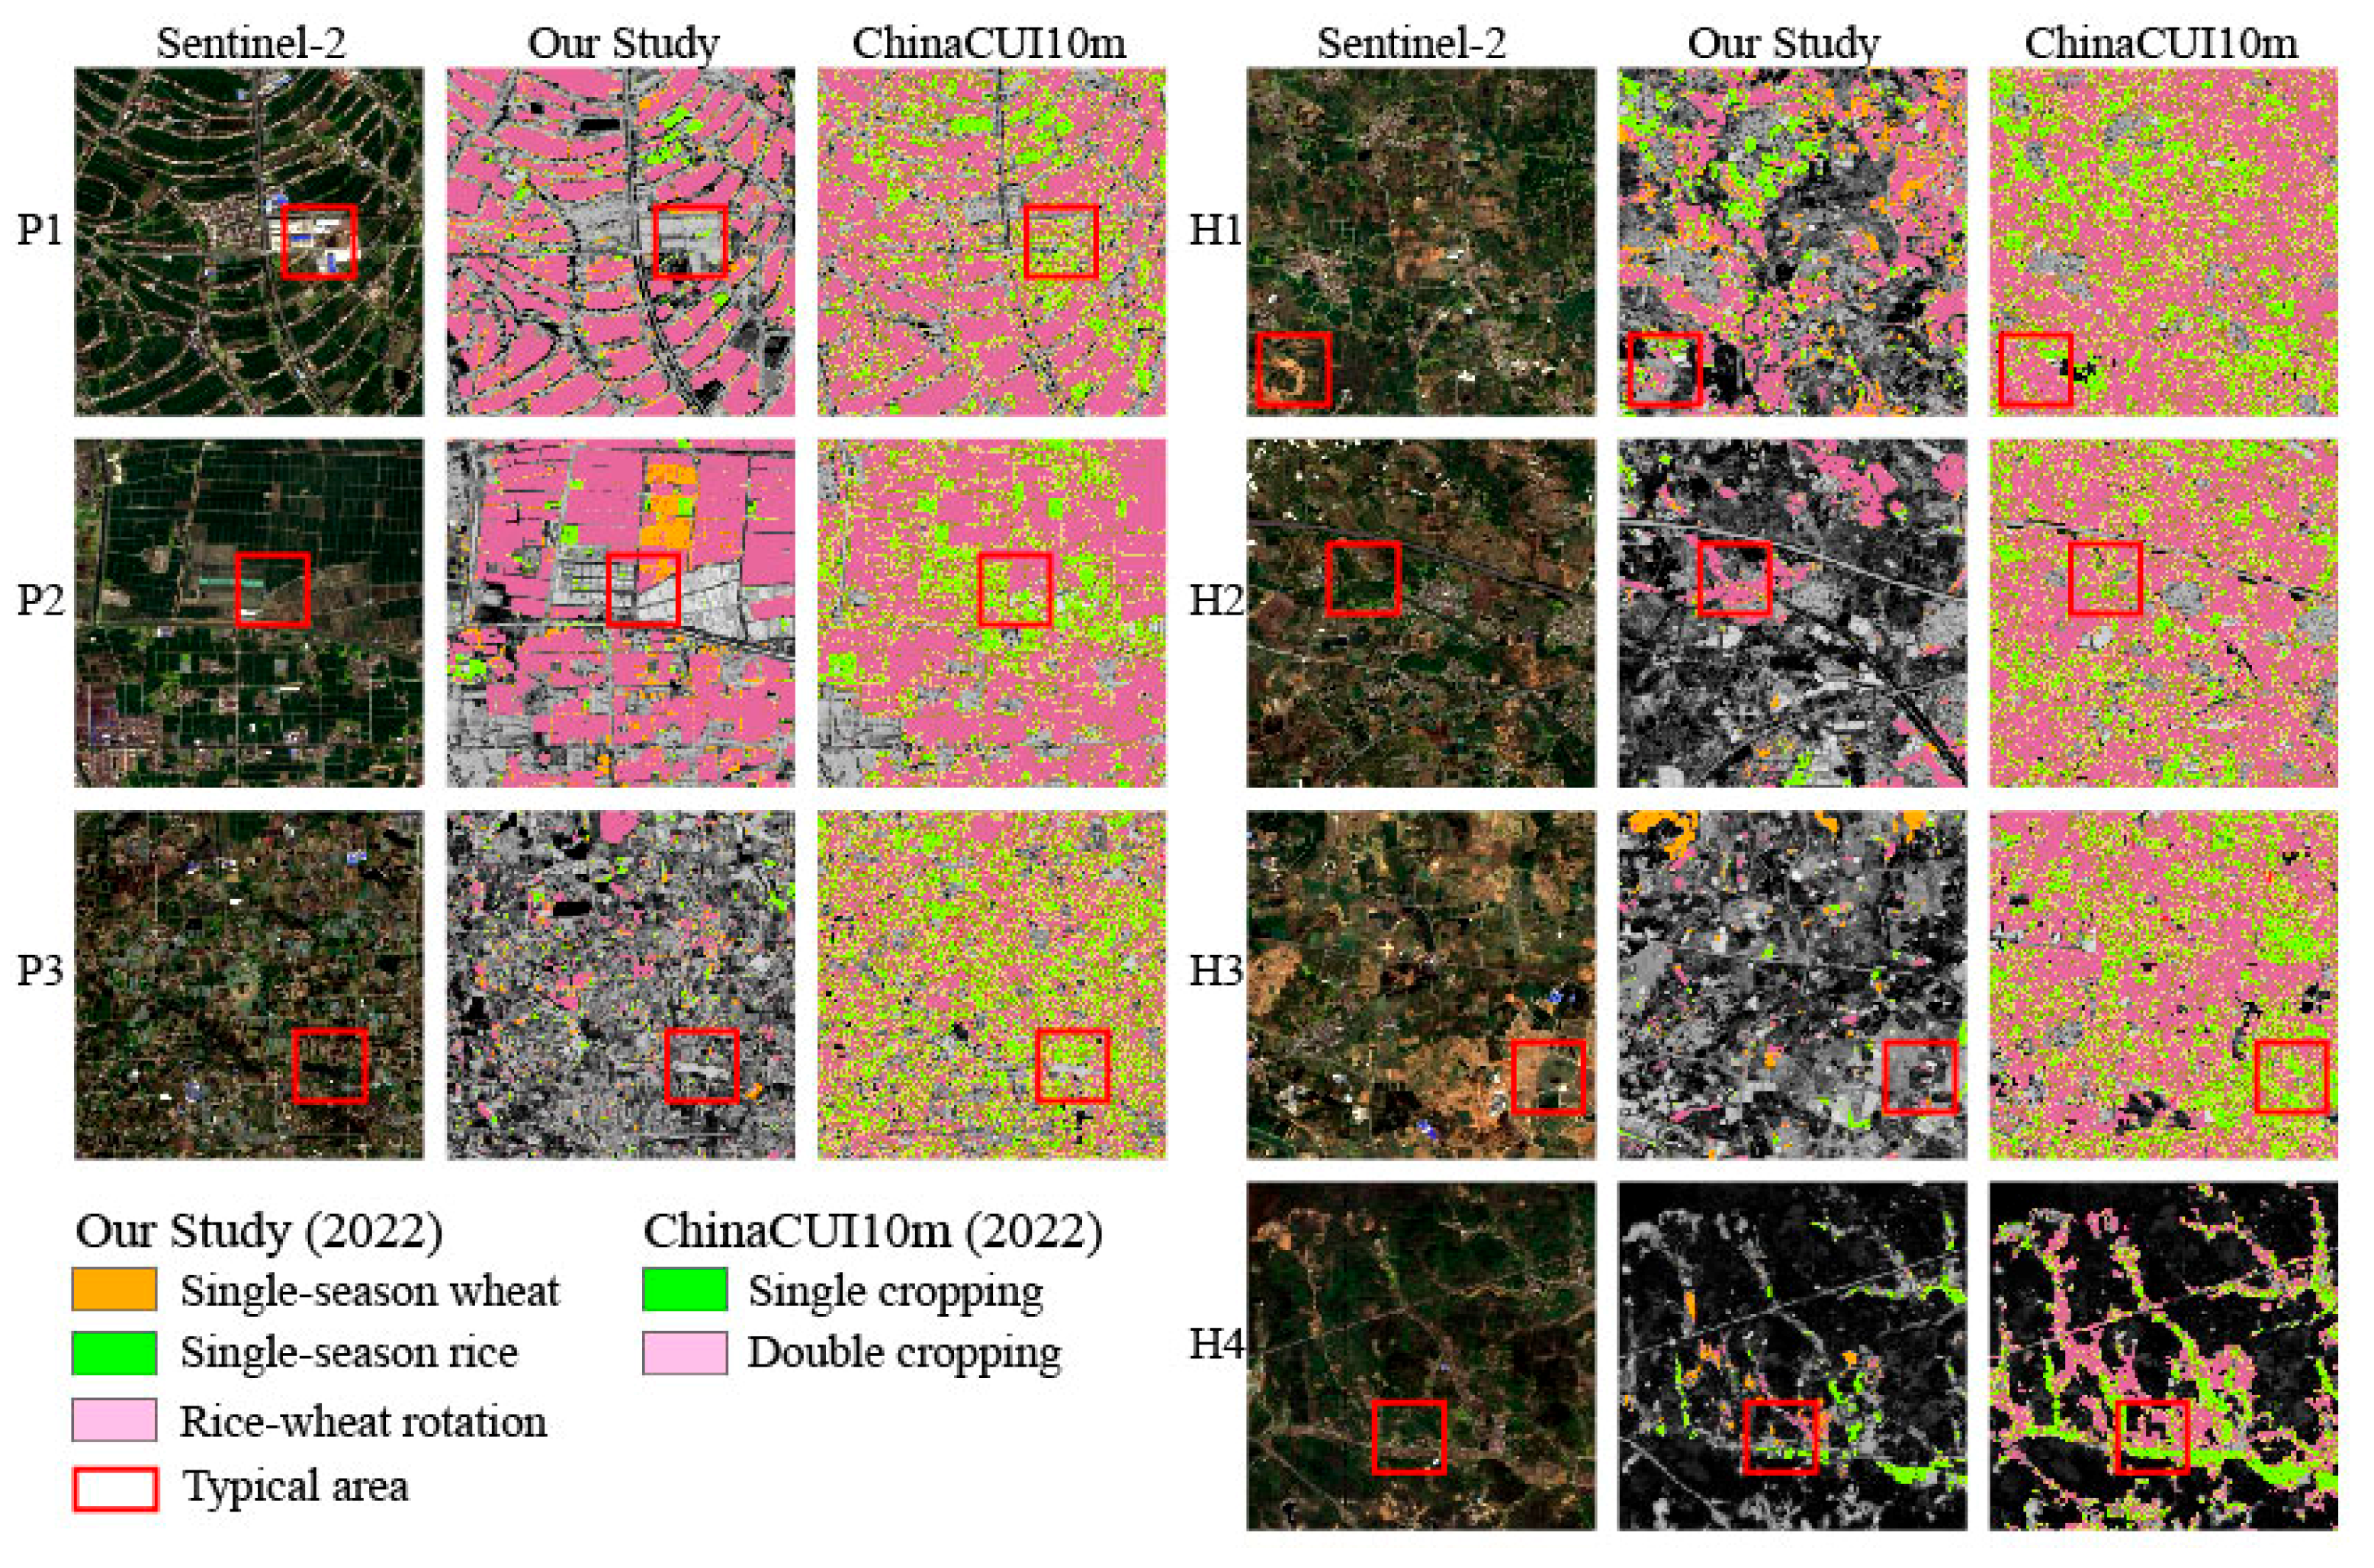
4.1. Comparison with Other Similar Products

In land cover classification, building upon previous work using the ESA WorldCover 10 m land cover product datasets, we further selected characteristic plots from the study area, specifically in the plains (P1 to P3) and hilly–mountainous regions (H1 to H4), for comparison and validation of the classification results (Figure 11). The results demonstrate that the land cover classification outcomes of this study are generally consistent with ESA’s overall findings. However, upon examining several typical regions, it was observed that ESA’s land cover classification often misclassified certain urban areas (such as bare soil and greenhouses), deciduous forests, and even open water bodies as cropland. This issue was particularly evident in fragmented plots and hilly–mountainous areas. One possible explanation for this discrepancy is that the ESA WorldCover product was generated using a dataset based on multitemporal Sentinel-1 SAR data, which was used to fill gaps in Sentinel-2 optical imagery, followed by data filtering and interpolation. In cloud- and fog-prone regions such as the middle and lower Yangtze River, this method inadvertently diminishes phenological distinctions between croplands and other land cover types, amplifying classification inaccuracies.
In terms of cropping intensity distribution, similarly, we referenced the ChinaCUI10m crop intensity product developed in previous studies and selected typical regions from it to compare with the spatial distribution results of the three cropping patterns—rice–wheat rotation, single-season rice, and single-season wheat—obtained in this study for 2022 (Figure 12). Our results demonstrate sharper and more contiguous field boundaries than ChinaCUI10m in both plains and hilly areas, closely matching real-world agricultural landscapes. In contrast, the cropping intensity results for single- and double-cropping fields in the ChinaCUI10m product are relatively fragmented, which is unrealistic in real-world scenarios. This product utilizes Sentinel-1 SAR and Sentinel-2 MSI time-series images, combined with the nutrient and growth stages data, to quantify the crop life cycle and quickly generate cropping intensity maps for different agricultural regions. However, it struggles with distinguishing between crop and non-crop land types, often misclassifying towns, deciduous forests, grasslands, and other non-crop regions as single or double cropping.
This study utilized the ESTARFM spatiotemporal fusion model to generate a high-spatiotemporal-resolution dataset of Sentinel-2 NDVI for different months throughout the entire crop growing season. This dataset effectively preserves the spatial texture and spectral characteristics of the original Sentinel-2 data. Therefore, compared to the ESA WorldCover and ChinaCUI10m products, it enables more accurate land cover classification and cropping intensity identification results. The precise extraction of land cover type spatial distribution provides a reliable basis for accurately identifying the three cropping patterns, i.e., rice–wheat rotation, single-season rice, and single-season wheat, based on cropland distribution areas.

4.2. Advantages and Limitations of Our Approaches

The annual cropping intensity results reflect the agricultural resource input and utilization efficiency for a given year, indirectly indicating the crop yield potential [36]. However, they are unable to reveal long-term trends or future potential changes in crop production. In contrast to previous studies, which primarily focused on single-year agricultural cropping intensity, this study presents the interannual distribution frequency maps of cropping intensity in the research area. These maps effectively illustrate the dynamic changes in agricultural cropping patterns over multiple years in the target region. Specifically, using time-series Sentinel-2 NDVI and MOD13Q1 remote sensing images from 2020 to 2024, and integrating the ESTARFM spatiotemporal fusion model to produce a high-resolution spatiotemporal dataset, this study applies crop phenology characteristics to develop five-year distribution frequency maps for three cropping patterns in the study area: rice–wheat rotation, single-season rice, and single-season wheat.
However, we found that in fragmented areas, such as hilly regions, the accuracy of the cropping intensity frequency mapping significantly decreases, particularly for croplands within the 2–3-year frequency range. The average producer and user accuracies in these areas fall below 80%. This decline may be attributed to factors such as the satellite’s viewing angle, orbit, and the undulating terrain of hilly regions, which can lead to geometric distortions in the images. These distortions cause pixel mismatches in the time-series Sentinel-2 data [37], resulting in the appearance of “salt-and-pepper” noise [23]. Compared to pixel-based recognition methods, object-oriented methods are more effective at extracting spatial information, such as the shapes of objects. This approach is particularly beneficial for analyzing croplands in regions with complex spatial structures [38]. Moving forward, we aim to adopt an object-oriented segmentation method. By grouping pixels in remote sensing images into distinct objects for analysis, we will segment cropland areas into field block objects, addressing the pixel mismatching issues caused by time-related changes in Sentinel-2 data. This will improve the mapping accuracy in fragmented areas such as hilly regions.

4.3. Application Prospects and Future Research

With the intensification of global climate change, fluctuations in crop yields and regional risks in agricultural production have increased, presenting significant challenges to food security [39]. By obtaining the interannual distribution frequency of cropping intensity, we can effectively identify trends in cropping pattern changes and assist in forecasting future food production. This is crucial for developing agricultural policies and food production strategies to address the impacts of climate change and ensure a stable food supply [40]. Additionally, obtaining the interannual distribution frequency of cropping intensity aids in identifying cyclical changes in cropping intensity for different crop types, supporting the optimized management of agricultural production activities across diverse regions.
Specifically, by utilizing the interannual variation frequency map of cultivated land planting intensity, regional planting intensity differences can be identified, which allows for the precise localization of high- and low-frequency planting areas, thus aiding in the rational allocation of agricultural resources. For high-frequency planting areas, which generally have greater agricultural production potential, infrastructure, such as irrigation systems and road networks, can be strengthened. In contrast, low-frequency planting areas typically undergo significant changes in planting patterns, often due to limitations in soil, topography, and irrigation conditions. In such cases, the focus should be on optimizing land management and guiding the cultivation of adaptive crop types to improve land use efficiency. Additionally, targeted subsidy policies can be formulated based on the interannual changes in farmland planting intensity. For example, financial subsidies can be provided for high-frequency planting areas, such as rice–wheat rotation systems, to encourage the promotion of efficient planting models, as well as the adoption of smart agricultural technologies, precision fertilization, or drone-based pesticide application, which will help reduce labor costs, improve crop yields, and enhance land resource utilization. This provides strong support for the sustainable development of crop production. Therefore, obtaining the interannual distribution frequency of cropping intensity is of profound significance and value in ensuring food security and formulating relevant agricultural policies.
In the context of the complex spatial structure of the cropland distribution in the middle and lower reaches of the Yangtze River, this study proposes a method based on spatiotemporal fusion and phenological rhythm features to identify cropping intensity distribution frequencies. However, to achieve more accurate monitoring of the interannual distribution frequency of cropping intensity, it is essential to address the challenge of insufficient accuracy in identifying interannual variation frequencies caused by the irregular distribution of cropland parcels. Our future research will explore integrating object-based methods and incorporating deep learning techniques to improve the mapping accuracy of interannual cropping intensity distribution frequencies, ultimately guiding the development of large-scale regional mapping.

5. Conclusions

Building on previous research focused on annual cropping intensity in cultivated land, we investigate the interannual distribution frequency of cropland cropping intensity across different crop types. This study proposes a method for identifying the interannual distribution frequency of cropland cropping intensity, leveraging spatiotemporal fusion and phenological rhythm characteristics. The Sentinel-2 NDVI high spatiotemporal fusion dataset generated by the ESTARFM model, combined with the SVM supervised classification method, achieved high-precision land cover classification in the study area, with an overall accuracy of 97.32% and a Kappa coefficient of 0.96. Using the precise spatial distribution of cropland as a foundation, we integrated the full-growth-cycle phenological rhythm characteristics of different cropping patterns and applied the ED algorithm to derive the spatial distribution results for rice–wheat rotation, single-season rice, and single-season wheat from 2020 to 2024. Subsequently, based on the spatial dynamic distribution characteristics of three cropping patterns over a five-year period, the interannual cropping intensity frequency distribution map of the study area was generated. Field validation of samples in the study area demonstrated that the interannual distribution frequency of cropping intensity for all three cropping patterns achieved good verification accuracy, with an average overall accuracy of 81.53% and an average Kappa coefficient of 0.68. This study offers critical insights to assist government departments in evaluating future food production potential and developing policies designed to enhance cropland use efficiency.

Author Contributions

Conceptualization, Y.Z. (Yaohui Zhu); methodology, Y.Z. (Yaohui Zhu), Q.Z. and Y.G.; software, F.Z.; validation, Y.G. and L.Z.; formal analysis, F.Z.; investigation, Q.Z., L.Z. and P.L.; resources, Q.Z. and Y.Z. (Yongyun Zhu); data curation, A.W.; writing—original draft, Y.Z. (Yaohui Zhu); writing—review and editing, A.W.; visualization, C.W. and B.L.; supervision, X.W. and Q.S.; project administration, X.W. and Q.S.; funding acquisition, Q.Z., L.Z. and X.W. All authors have read and agreed to the published version of the manuscript.

Funding

This study was supported by the Project of Faculty of Agricultural Engineering of Jiangsu University (NGXB20240105), the National Natural Science Foundation of China (52309051), and the Natural Science Foundation of Jiangsu Province (BK20230548).

Data Availability Statement

The original contributions presented in this study are included in this article; further inquiries can be directed to the corresponding author.

Conflicts of Interest

The authors declare no conflicts of interest.

References

  1. Lakhiar, I.A.; Gao, J.; Syed, T.N.; Chandio, F.A.; Tunio, M.H.; Ahmad, F.; Solangi, K.A. Overview of the aeroponic agriculture—An emerging technology for global food security. Int. J. Agric. Biol. Eng. 2020, 13, 1–10. [Google Scholar] [CrossRef]
  2. Dai, Z.-Z.; Chang, S.; Zhao, G.-R.; Duan, J.-J.; Liang, H.-Y.; Zhu, Z.-Y.; Liu, S.-L.; Feng, Y.-Z.; Wang, X. Unlocking China’s grain yield potential: Harnessing technological and spatial synergies in diverse cropping systems. Agric. Syst. 2025, 226, 104308. [Google Scholar] [CrossRef]
  3. Qiu, B.; Jian, Z.; Yang, P.; Tang, Z.; Zhu, X.; Duan, M.; Yu, Q.; Chen, X.; Zhang, M.; Tu, P.; et al. Unveiling grain production patterns in China (2005–2020) towards targeted sustainable intensification. Agric. Syst. 2024, 216, 103878. [Google Scholar] [CrossRef]
  4. Zhang, C.; Li, X.; Yan, H.; Ullah, I.; Zuo, Z.; Li, L.; Yu, J. Effects of irrigation quantity and biochar on soil physical properties, growth characteristics, yield and quality of greenhouse tomato. Agric. Water Manag. 2020, 241, 106263. [Google Scholar] [CrossRef]
  5. Li, X.; Wu, K.; Hao, S.; Yue, Z.; Ran, Z.; Ma, J. Mapping cropland suitability in China using optimized MaxEnt model. Field Crop Res. 2023, 302, 109064. [Google Scholar] [CrossRef]
  6. Huang, D.; Lu, Y.; Liu, Y.; Liu, Y.; Tong, Z.; Xing, L.; Dou, C. Multifunctional evaluation and multiscenario regulation of non-grain farmlands from the grain security perspective: Evidence from the Wuhan Metropolitan Area, China. Land Use Policy 2024, 146, 107322. [Google Scholar] [CrossRef]
  7. Abay, K.A.; Breisinger, C.; Glauber, J.; Kurdi, S.; Laborde, D.; Siddig, K. The Russia-Ukraine war: Implications for global and regional food security and potential policy responses. Glob. Food Secur. 2023, 36, 100675. [Google Scholar] [CrossRef]
  8. Alhussam, M.I.; Ren, J.; Yao, H.; Abu Risha, O. Food Trade Network and Food Security: From the Perspective of Belt and Road Initiative. Agriculture 2023, 13, 1571. [Google Scholar] [CrossRef]
  9. Zhang, L.; Zhang, H.; Zhu, Q.; Niu, Y. Further investigating the performance of crop water stress index for maize from baseline fluctuation, effects of environmental factors, and variation of critical value. Agric. Water Manag. 2023, 285, 108349. [Google Scholar] [CrossRef]
  10. Shen, G.; Yu, Q.; Zhou, Q.; Wang, C.; Wu, W. From multiple cropping frequency to multiple cropping system: A new perspective for the characterization of cropland use intensity. Agric. Syst. 2023, 204, 103535. [Google Scholar] [CrossRef]
  11. Massigoge, I.; Carcedo, A.; Reis, A.; Mitchell, C.; Day, S.; Oliverio, J.; Truong, S.; McCormick, R.; Rotundo, J.; Lira, S.; et al. Exploring avenues for agricultural intensification: A case study for maize-soybean in the Southern US region. Agric. Syst. 2023, 204, 103539. [Google Scholar] [CrossRef]
  12. Cai, Z.; Hu, Q.; Zhang, X.; Yang, J.; Wei, H.; Wang, J.; Zeng, Y.; Yin, G.; Li, W.; You, L.; et al. Improving agricultural field parcel delineation with a dual branch spatiotemporal fusion network by integrating multimodal satellite data. ISPRS J. Photogramm. 2023, 205, 34–49. [Google Scholar] [CrossRef]
  13. Sainte Fare Garnot, V.; Landrieu, L.; Chehata, N. Multi-modal temporal attention models for crop mapping from satellite time series. ISPRS J. Photogramm. 2022, 187, 294–305. [Google Scholar] [CrossRef]
  14. Tao, J.; Wang, Y.; Qiu, B.; Wu, W. Exploring cropping intensity dynamics by integrating crop phenology information using Bayesian networks. Comput. Electron. Agric. 2022, 193, 106667. [Google Scholar] [CrossRef]
  15. Memon, M.S.; Chen, S.; Niu, Y.; Zhou, W.; Elsherbiny, O.; Liang, R.; Du, Z.; Guo, X. Evaluating the Efficacy of Sentinel-2B and Landsat-8 for Estimating and Mapping Wheat Straw Cover in Rice–Wheat Fields. Agronomy 2023, 13, 2691. [Google Scholar] [CrossRef]
  16. Raza, A.; Hu, Y.; Lu, Y.; Ray, R.L. Comparison of Landsat-8 and Sentinel-2 Imagery for Modeling Gross Primary Productivity of Tea Ecosystem. J. Crop Health 2024, 76, 1585–1605. [Google Scholar] [CrossRef]
  17. Liu, L.; Xiao, X.; Qin, Y.; Wang, J.; Xu, X.; Hu, Y.; Qiao, Z. Mapping cropping intensity in China using time series Landsat and Sentinel-2 images and Google Earth Engine. Remote Sens. Environ. 2020, 239, 111624. [Google Scholar] [CrossRef]
  18. Awais, M.; Li, W.; Hussain, S.; Cheema, M.J.; Li, W.; Song, R.; Liu, C. Comparative Evaluation of Land Surface Temperature Images from Unmanned Aerial Vehicle and Satellite Observation for Agricultural Areas Using In Situ Data. Agriculture 2022, 12, 184. [Google Scholar] [CrossRef]
  19. Gray, J.; Friedl, M.; Frolking, S.; Ramankutty, N.; Nelson, A.; Gumma, M.K. Mapping Asian Cropping Intensity with MODIS. IEEE J.-Stars 2014, 7, 3373–3379. [Google Scholar] [CrossRef]
  20. Boschetti, M.; Busetto, L.; Manfron, G.; Laborte, A.; Asilo, S.; Pazhanivelan, S.; Nelson, A. PhenoRice: A method for automatic extraction of spatio-temporal information on rice crops using satellite data time series. Remote Sens. Environ. 2017, 194, 347–365. [Google Scholar] [CrossRef]
  21. Han, J.; Zhang, Z.; Luo, Y.; Cao, J.; Zhang, L.; Zhuang, H.; Cheng, F.; Zhang, J.; Tao, F. Annual paddy rice planting area and cropping intensity datasets and their dynamics in the Asian monsoon region from 2000 to 2020. Agric. Syst. 2022, 200, 103437. [Google Scholar] [CrossRef]
  22. He, T.; Zhang, M.; Xiao, W.; Zhai, G.; Fang, K.; Chen, Y.; Wu, C. Trend and potential enhancement of cropping intensity. Comput. Electron. Agric. 2025, 229, 109777. [Google Scholar] [CrossRef]
  23. Liu, L.; Kang, S.; Xiong, X.; Qin, Y.; Wang, J.; Liu, Z.; Xiao, X. Cropping intensity map of China with 10 m spatial resolution from analyses of time-series Landsat-7/8 and Sentinel-2 images. Int. J. Appl. Earth Obs. 2023, 124, 103504. [Google Scholar] [CrossRef]
  24. Qiu, B.; Hu, X.; Yang, P.; Tang, Z.; Wu, W.; Li, Z. A robust approach for large-scale cropping intensity mapping in smallholder farms from vegetation, brownness indices and SAR time series. ISPRS J. Photogramm. 2023, 203, 328–344. [Google Scholar] [CrossRef]
  25. Pan, L.; Xia, H.; Yang, J.; Niu, W.; Wang, R.; Song, H.; Guo, Y.; Qin, Y. Mapping cropping intensity in Huaihe basin using phenology algorithm, all Sentinel-2 and Landsat images in Google Earth Engine. Int. J. Appl. Earth Obs. 2021, 102, 102376. [Google Scholar] [CrossRef]
  26. Tao, J.; Zhang, X.; Liu, Y.; Jiang, Q.; Zhou, Y. Estimating Agricultural Cropping Intensity Using a New Temporal Mixture Analysis Method from Time Series MODIS. Remote Sens. 2023, 15, 4712. [Google Scholar] [CrossRef]
  27. Yan, H.; Liu, F.; Qin, Y.; Niu, Z.e.; Doughty, R.; Xiao, X. Tracking the spatio-temporal change of cropping intensity in China during 2000–2015. Environ. Res. Lett. 2019, 14, 035008. [Google Scholar] [CrossRef]
  28. Liu, X.; Zheng, J.; Yu, L.; Hao, P.; Chen, B.; Xin, Q.; Fu, H.; Gong, P. Annual dynamic dataset of global cropping intensity from 2001 to 2019. Sci. Data 2021, 8, 283. [Google Scholar] [CrossRef]
  29. Yu, W.; Li, D.; Zheng, H.; Yao, X.; Zhu, Y.; Cao, W.; Qiu, L.; Cheng, T.; Zhang, Y.; Zhou, Y. HIDYM: A high-resolution gross primary productivity and dynamic harvest index based crop yield mapper. Remote Sens. Environ. 2025, 318, 114548. [Google Scholar] [CrossRef]
  30. Gao, F.; Masek, J.; Schwaller, M.; Hall, F. On the blending of the Landsat and MODIS surface reflectance: Predicting daily Landsat surface reflectance. IEEE Trans. Geosci. Remote 2006, 44, 2207–2218. [Google Scholar] [CrossRef]
  31. Zhu, X.; Chen, J.; Gao, F.; Chen, X.; Masek, J.G. An enhanced spatial and temporal adaptive reflectance fusion model for complex heterogeneous regions. Remote Sens. Environ. 2010, 114, 2610–2623. [Google Scholar] [CrossRef]
  32. Ahmadi, S.H.; Mosallaeepour, E.; Kamgar-Haghighi, A.A.; Sepaskhah, A.R. Modeling Maize Yield and Soil Water Content with AquaCrop Under Full and Deficit Irrigation Managements. Water Resour. Manag. 2015, 29, 2837–2853. [Google Scholar] [CrossRef]
  33. Wang, Q.; Jin, X.; Jiang, Q.; Wu, L.; Zhang, Y.; Zhou, W. DBCT-Net: A dual branch hybrid CNN-transformer network for remote sensing image fusion. Expert Syst. Appl. 2023, 233, 120829. [Google Scholar] [CrossRef]
  34. Zhu, Y.; Yang, G.; Yang, H.; Wu, J.; Lei, L.; Zhao, F.; Fan, L.; Zhao, C. Identification of Apple Orchard Planting Year Based on Spatiotemporally Fused Satellite Images and Clustering Analysis of Foliage Phenophase. Remote Sens. 2020, 12, 1199. [Google Scholar] [CrossRef]
  35. Qiu, B.; Liu, B.; Tang, Z.; Dong, J.; Xu, W.; Liang, J.; Chen, N.; Chen, J.; Wang, L.; Zhang, C.; et al. National-scale 10-m maps of cropland use intensity in China during 2018–2023. Scientific Data 2024, 11, 691. [Google Scholar] [CrossRef]
  36. Zhang, M.; Wu, B.; Zeng, H.; He, G.; Liu, C.; Tao, S.; Zhang, Q.; Nabil, M.; Tian, F.; Bofana, J.; et al. GCI30: A global dataset of 30 m cropping intensity using multisource remote sensing imagery. Earth Syst. Sci. Data 2021, 13, 4799–4817. [Google Scholar] [CrossRef]
  37. Yan, L.; Roy, D.P.; Li, Z.; Zhang, H.K.; Huang, H. Sentinel-2A multi-temporal misregistration characterization and an orbit-based sub-pixel registration methodology. Remote Sens. Environ. 2018, 215, 495–506. [Google Scholar] [CrossRef]
  38. Ye, S.; Zhu, Z.; Cao, G. Object-based continuous monitoring of land disturbances from dense Landsat time series. Remote Sens. Environ. 2023, 287, 113462. [Google Scholar] [CrossRef]
  39. Wheeler, T.; von Braun, J. Climate Change Impacts on Global Food Security. Science 2013, 341, 508–513. [Google Scholar] [CrossRef]
  40. Wu, W.; Yu, Q.; You, L.; Chen, K.; Tang, H.; Liu, J. Global cropping intensity gaps: Increasing food production without cropland expansion. Land Use Policy 2018, 76, 515–525. [Google Scholar] [CrossRef]
Figure 1. Study area and survey samples.
Agriculture 15 01004 g001
Figure 2. Extraction method of interannual changes in cropland cropping types. (a) Selection of an appropriate spatiotemporal fusion algorithm; (b) classification of land cover types based on time-series fusion datasets; (c) identification and change analysis of interannual distribution frequency of cropland cropping types.
Agriculture 15 01004 g002
Figure 3. Accuracy evaluation of the Sentinel-2 NDVI spatiotemporal data fusion methods. In the figure, (a,d) represent the observed Sentinel-2 NDVI data; (b,e) and (c,f) represent the Sentinel-2 NDVI data and validation results estimated by STARFM and ESTARFM, respectively.
Agriculture 15 01004 g003
Figure 4. The Sentinel-2 NDVI data estimated by ESTARFM under different field distribution types. In the figure, (a), (d) and (g) represent the observed Sentinel-2 NDVI data of spatially homogeneous, heterogeneous, and hilly fields, respectively; (b,e,h) and (c,f,i) represent the Sentinel-2 NDVI data and validation results estimated by ESTARFM, respectively.
Agriculture 15 01004 g004
Figure 5. Time-series NDVI data of land cover types in the study area in 2022.
Agriculture 15 01004 g005
Figure 6. Land cover classification map. In the figure, (a,d,e,h) are partial enlargements of the land cover classification map; (b,c,f,g) are the ESA WorldCover 10 m land cover product datasets corresponding to (a,d,e,h).
Agriculture 15 01004 g006
Figure 7. Time-series NDVI data of single-season wheat, single-season rice, and rice–wheat rotation types in the study area in 2022. Among them, I, II, and III represent the three characteristic growth stages of different planting patterns in the study area.
Agriculture 15 01004 g007
Figure 8. (a) The spatial distribution of cropland in the study area. (b) The spatial distribution of single-season wheat, single-season rice, and rice–wheat rotation types in the cropland in 2022, obtained based on phenological rhythms and the ED method. (cf) are partial enlarged images of (b); (gj) are partial enlarged images of ChinaCUI10m.
Agriculture 15 01004 g008
Figure 9. (ac) are the annual distribution frequency maps of rice–wheat rotation, single-season rice, and single-season wheat from 2020 to 2024, respectively; (df) are partial enlargements of (ac), respectively.
Agriculture 15 01004 g009
Figure 10. (ac) are the coverage areas of rice–wheat rotation, single-season rice, and single-season wheat according to different annual distribution frequencies from 2020 to 2024, respectively.
Agriculture 15 01004 g010
Figure 11. Comparison of our land cover classification results with ESA WorldCover. P1 to P3 correspond to the plain areas, and H1 to H4 correspond to the hilly regions.
Agriculture 15 01004 g011
Figure 12. Comparison of our cropping intensity results with ChinaCUI10m [35]. P1 to P3 correspond to the plain areas, and H1 to H4 correspond to the hilly regions.
Agriculture 15 01004 g012
Table 1. Confusion matrix validation results for land cover classification.
ClassProd. Acc. 1
(%)
User. Acc. 2
(%)
Prod. Acc.
(Pixels)
User. Acc.
(Pixels)
Town area98.2698.963325/33843325/3360
Open water99.6391.17537/539537/589
Cropland99.4899.552848/28632848/2861
Grassland96.9196.04848/875848/883
Tea garden98.7888242/245242/275
Deciduous forest92.2897.271530/16581530/1573
Evergreen forest92.788.34432/466432/489
Overall accuracy97.32% (9762/10,030)
Kappa coefficient0.96
1 Prod. Acc. represents Producer’s Accuracy; 2 User. Acc. represents User’s Accuracy.
Table 2. Confusion matrix validation results for distribution frequency.
Distribution Frequency (Year)Rice–Wheat RotationSingle-Season RiceSingle-Season Wheat
Prod. Acc. (%)User. Acc. (%)Prod. Acc. (%)User. Acc. (%)Prod. Acc. (%)User. Acc. (%)
194.6681.0587.0491.2577.8488.80
261.3353.6261.0088.5586.6363.81
370.4678.7477.7868.8554.6679.88
483.0282.4292.6295.76//
593.6893.31////
Overall accuracy86.11% (5364/6229)82.53% (1115/1351)75.95% (1083/1426)
Kappa coefficient0.780.660.60
Disclaimer/Publisher’s Note: The statements, opinions and data contained in all publications are solely those of the individual author(s) and contributor(s) and not of MDPI and/or the editor(s). MDPI and/or the editor(s) disclaim responsibility for any injury to people or property resulting from any ideas, methods, instructions or products referred to in the content.

