Article

Stereo Visual Odometry and Real-Time Appearance-Based SLAM for Mapping and Localization in Indoor and Outdoor Orchard Environments

1
Interdisciplinary Program in Smart Agriculture, College of Agriculture and Life Sciences, Kangwon National University, Chuncheon 24341, Republic of Korea
2
Department of Biosystems Engineering, College of Agriculture and Life Sciences, Kangwon National University, Chuncheon 24341, Republic of Korea
3
HADA Co., Ltd., 329-34 Eungi-gil, Iksan-si 54569, Republic of Korea
*
Author to whom correspondence should be addressed.
Agriculture 2025, 15(8), 872; https://doi.org/10.3390/agriculture15080872
Submission received: 4 March 2025 / Revised: 20 March 2025 / Accepted: 15 April 2025 / Published: 16 April 2025

Abstract

:
Agricultural robots can mitigate labor shortages and advance precision farming. However, the dense vegetation canopies and uneven terrain in orchard environments reduce the reliability of traditional GPS-based localization, thereby reducing navigation accuracy and making autonomous navigation challenging. Moreover, inefficient path planning and an increased risk of collisions affect the robot’s ability to perform tasks such as fruit harvesting, spraying, and monitoring. To address these limitations, this study integrated stereo visual odometry with real-time appearance-based mapping (RTAB-Map)-based simultaneous localization and mapping (SLAM) to improve mapping and localization in both indoor and outdoor orchard settings. The proposed system leverages stereo image pairs for precise depth estimation while utilizing RTAB-Map’s graph-based SLAM framework with loop-closure detection to ensure global map consistency. In addition, an incorporated inertial measurement unit (IMU) enhances pose estimation, thereby improving localization accuracy. Substantial improvements in both mapping and localization performance over the traditional approach were demonstrated, with an average error of 0.018 m against the ground truth for outdoor mapping and a consistent average error of 0.03 m for indoor trails with a 20.7% reduction in visual odometry trajectory deviation compared to traditional methods. Localization performance remained robust across diverse conditions, with a low RMSE of 0.207 m. Our approach provides critical insights into developing more reliable autonomous navigation systems for agricultural robots.

1. Introduction

The integration of robotics in agriculture has introduced transformative solutions to address challenges such as labor shortages, resource management, and the growing demand for precision farming [1,2,3,4]. Autonomous robotic tasks such as spraying, harvesting, and monitoring require reliable navigation, which remains challenging due to the complexity of agricultural environments [5]. Uneven terrains, dynamic lighting conditions, dense vegetation, and environmental obstructions hinder precise localization and path planning. Moreover, traditional localization methods reliant on global positioning system (GPS) signals often fail in such environments due to signal loss caused by dense canopy coverage and structural interference [6,7,8]. As a result, robust real-time localization, mapping, path planning, and obstacle avoidance are crucial for agricultural robots to operate autonomously and efficiently [9]. Accurate localization and globally consistent mapping are both essential for improving system performance.
Simultaneous localization and mapping (SLAM) is a fundamental technology that enables robots to navigate and construct maps of unknown environments [10]. SLAM methods are classified based on sensor modality into LiDAR SLAM and visual SLAM. Extensively studied for over three decades, LiDAR SLAM has evolved from filter-based to optimization-based frameworks. However, LiDAR SLAM has inherent limitations, such as the 2D constraint of single-line LiDAR systems and the high cost of multi-line LiDAR systems [11,12]. In contrast, visual SLAM, which relies on cameras as primary sensors, has gained significant attention due to its ability to provide rich spatial and visual information at a lower cost. For example, visual SLAM utilizes inexpensive camera hardware, typically costing a few hundred dollars, compared to multi-line LiDAR systems that often exceed thousands of dollars. Additionally, visual SLAM reduces operational costs by eliminating the need for power-intensive laser scanning. Various visual SLAM techniques, including monocular, stereo, and RGB-D approaches, offer distinct advantages for autonomous navigation [13,14]. Recent advancements have focused on improving its adaptability to diverse environments. For instance, Wang et al. (2016) [15] proposed an efficient localization approach using oriented FAST and rotated BRIEF (ORB)-SLAM, which leverages ORB features for accurate pose estimation in indoor environments. Similarly, Xu et al. (2019) [16] introduced a framework capable of switching between SLAM and localization modes, making it particularly suitable for GPS-denied indoor environments. Despite these advancements, the utilization of visual SLAM remains challenged by illumination variations, and repetitive features. To mitigate these issues, Fang et al. (2021) [17] integrated semantic segmentation into the ORB-SLAM2 framework, which enabled the exclusion of dynamic objects, reduced feature mismatches, and improved pose estimation accuracy, particularly in dynamic settings such as healthcare facilities.
While traditional visual SLAM has shown significant potential across various environments, its performance depends on the operating conditions and the type of sensor data utilized [18]. Although monocular and RGB-D approaches perform reliably in indoor environments with controlled lighting and distinct features, they encounter difficulties in outdoor environments. Challenges such as varying illumination, low-textured surfaces, and occlusion caused by dense foliage can reduce both accuracy and stability [19]. Stereo SLAM, which incorporates depth information, offers a promising solution to these challenges. By leveraging triangulation between corresponding points in left and right images, stereo SLAM generates precise depth measurements, enabling scale-accurate pose estimation independent of lighting conditions. This depth information enhances feature tracking by maintaining geometric constraints even when appearance-based methods fail. Additionally, stereo depth improves feature matching by introducing spatial constraints that distinguish visually similar features at different depths, a crucial advantage in low-texture agricultural environments. Its robust depth estimation enhances performance in both indoor and outdoor environments [20]. Recent advancements such as DOT-SLAM further enhance stereo SLAM’s capabilities by incorporating graph optimization and dynamic object tracking [21]. In addition, integrating lightweight target detection modules into stereo SLAM has improved real-time performance in complex, unstructured settings [22]. These advancements make stereo SLAM especially well-suited to agricultural applications requiring accurate localization and mapping for targeted spraying, obstacle avoidance, and autonomous navigation in orchards.
Stereo SLAM effectively estimates depth and mitigates challenges posed by varying lighting conditions, dense vegetation, and unreliable GPS signals. Advances in feature extraction and adaptive imaging methods have further increased accuracy and stability in dynamic settings. For example, AGRI-SLAM integrates ORB and large-scale direct (LSD) features with image enhancement techniques for low-light agricultural scenarios [23]. Similarly, Zhang et al. (2023) [24] introduced a hawk-eye-inspired algorithm with dynamic range imaging to enhance mapping quality. Evaluations of ORB-SLAM2 and stereo direct sparse odometry (Stereo-DSO) have demonstrated the robustness and low computational complexity in low-textured environments [25]. Furthermore, integrating stereo vision with LiDAR and inertial sensors, coupled with extended Kalman filtering, has improved localization accuracy in unstructured terrains [26]. These developments highlight the potential of stereo SLAM for precise navigation in real-world conditions. Despite advancements in stereo SLAM for agriculture, a critical gap remains in the cost-effective integration of stereo odometry with single-camera SLAM systems. Most existing approaches predominantly rely on intricate visual-inertial solutions rather than streamlined IMU-constrained methods. Additionally, the evaluation of single-sensor mapping across diverse agricultural environments remains inadequate, hindering the development of accessible and practical navigation technologies.
Building on these advancements in visual SLAM, this study employs real-time appearance-based mapping (RTAB-Map), which is a graph-based SLAM approach that optimizes localization and mapping through loop-closure detection to produce a globally consistent map. The purpose of this research is to develop and evaluate an integrated system that combines stereo visual odometry, RTAB-Map SLAM, and inertial measurement unit (IMU) data to achieve accurate mapping and reliable localization for agricultural robots in orchard environments, where traditional GPS-based navigation methods are ineffective. The specific objectives of this study are as follows: (1) to integrate stereo visual odometry with RTAB-Map SLAM to improve mapping accuracy in both indoor and outdoor orchard environments; (2) to enhance pose estimation and reduce cumulative drift by incorporating IMU data as a gravity constraint within the SLAM framework; (3) to generate and evaluate dense 3D point cloud representations that enable precise localization; and (4) to evaluate the system’s mapping and localization accuracy, including its loop-closure detection and relocalization performance under varying operational conditions. Experiments conducted in controlled indoor and outdoor settings demonstrate the effectiveness of the proposed approach, supporting autonomous navigation in environments where traditional methods struggle. This research provides valuable insights into improving mapping and localization frameworks, thereby contributing to the development of autonomous systems for advanced agricultural robotics.

2. Materials and Methods

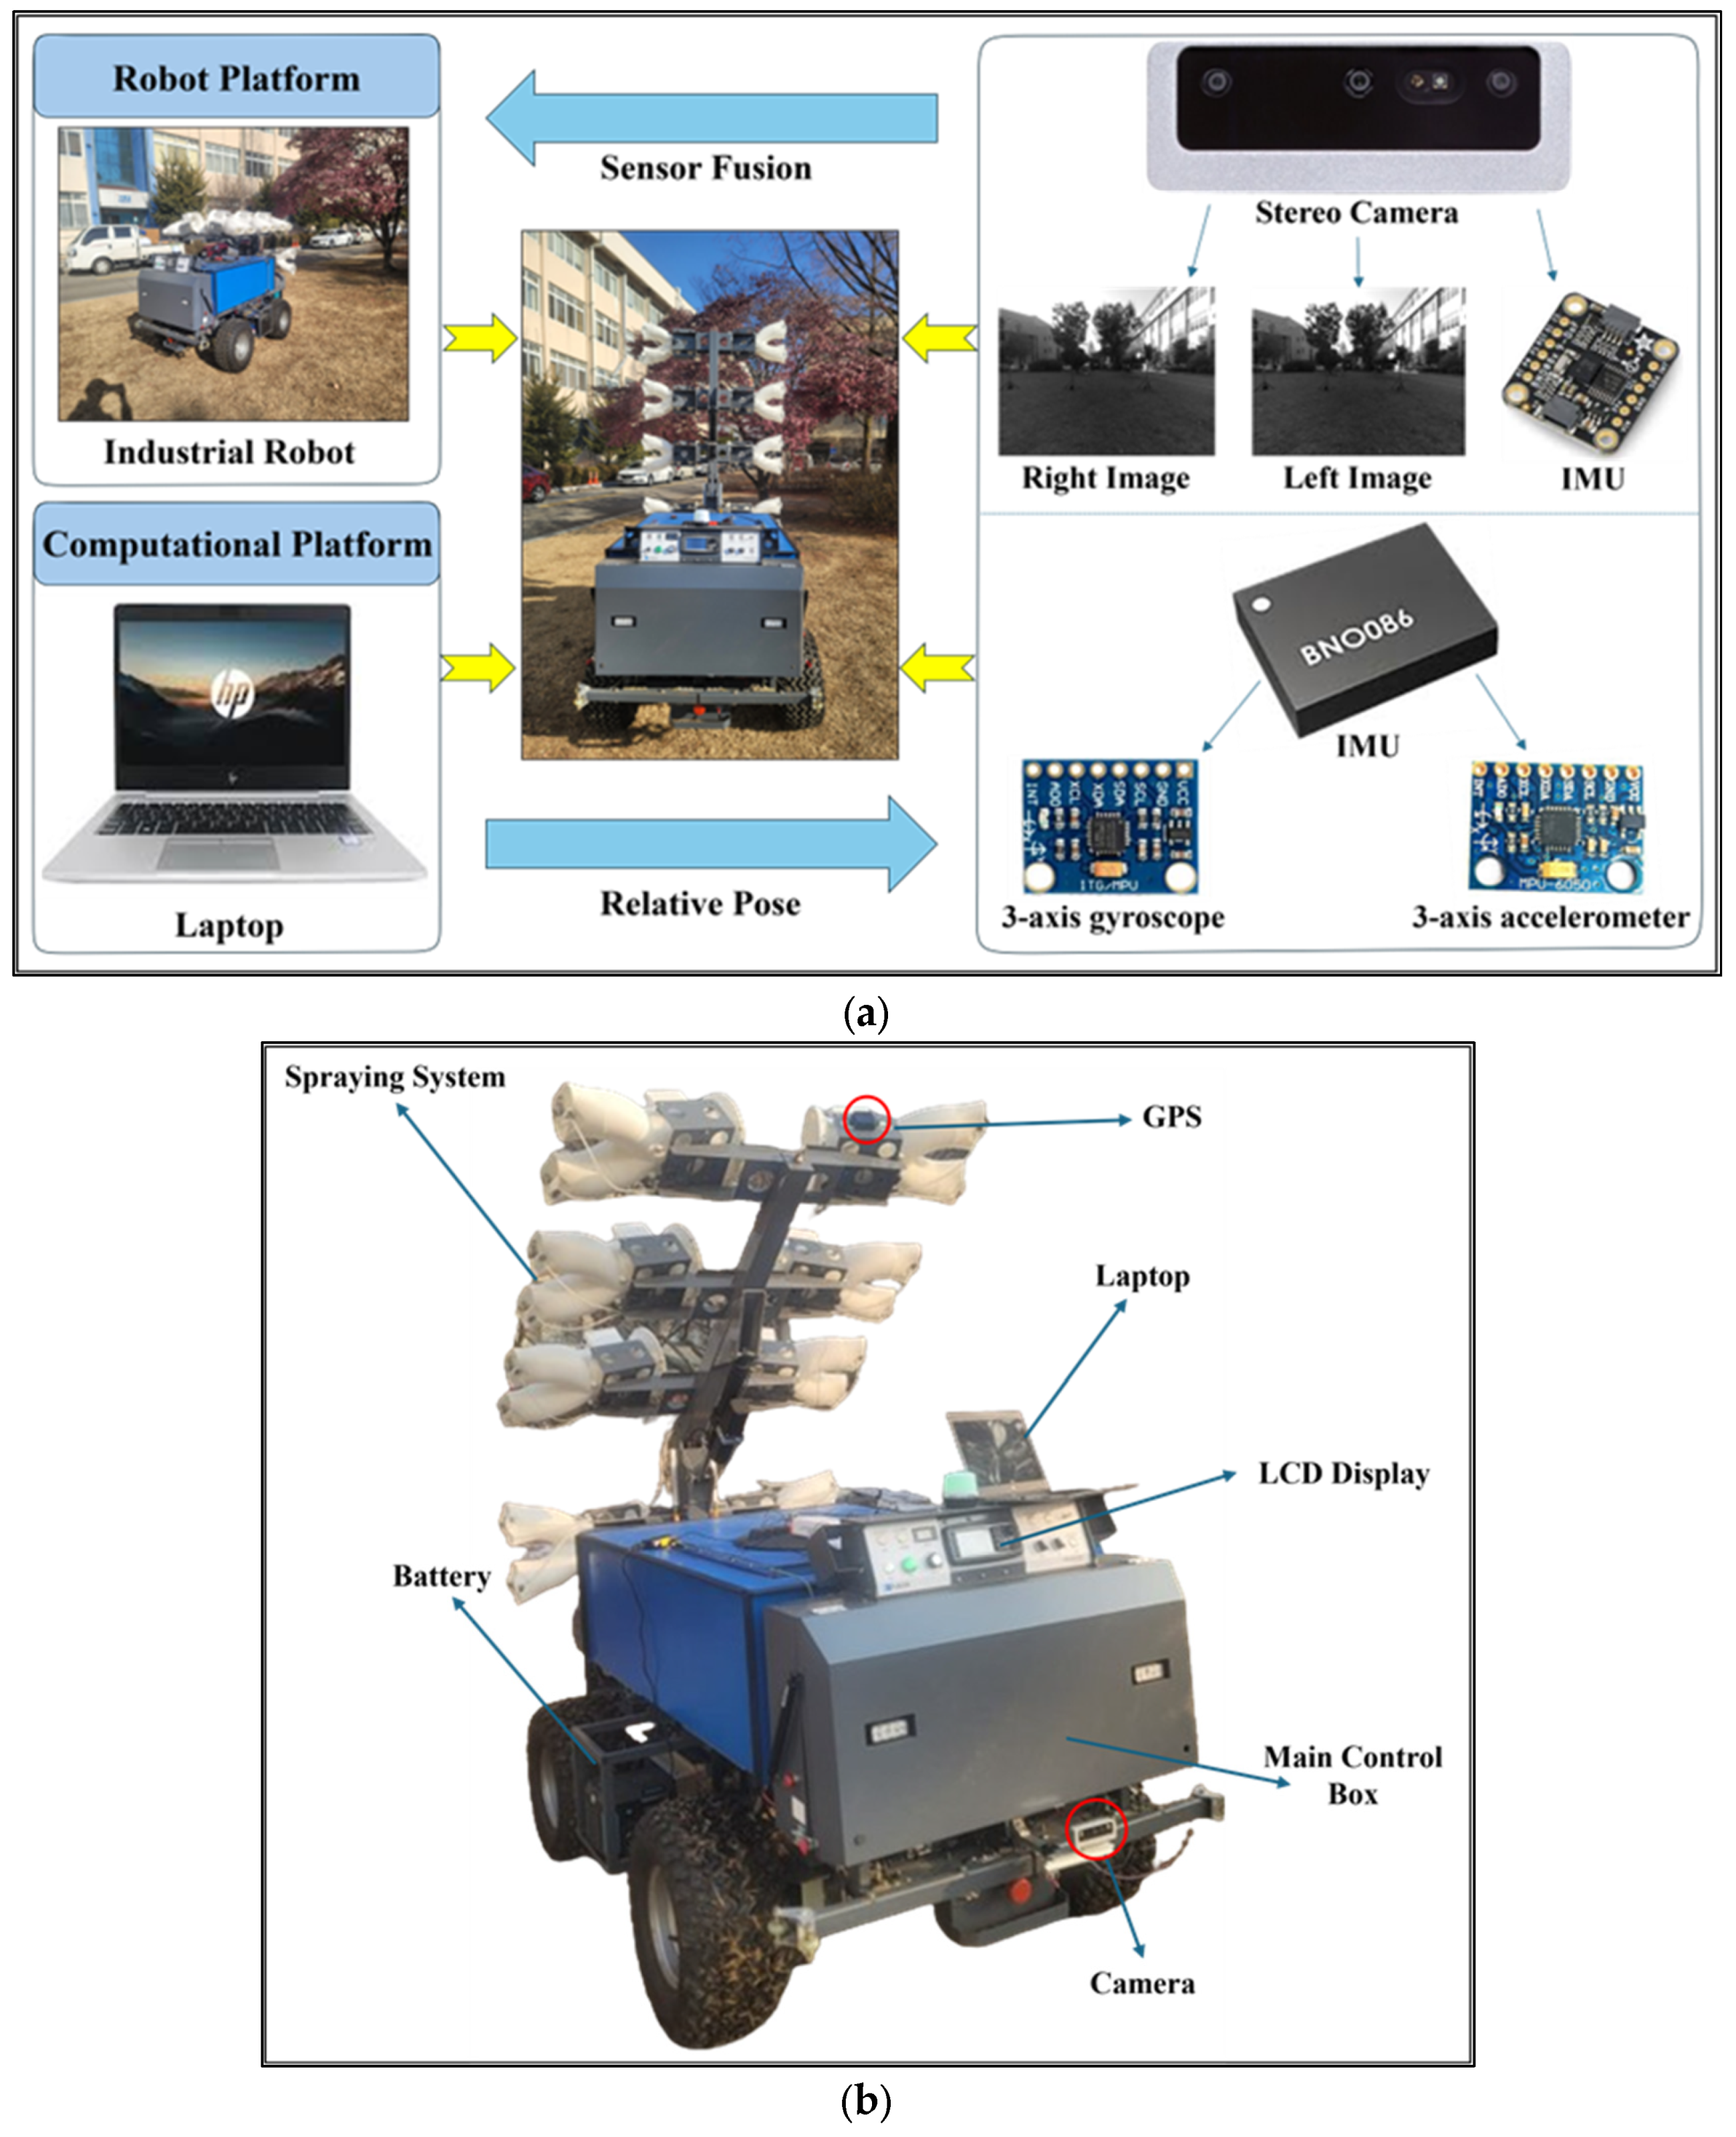
2.1. System Hardware Components

The proposed mapping and localization system was built on a hardware platform comprising the following three main subsystems: an industrial robotic platform, a sensing system, and a computational unit. The overall system architecture is illustrated in Figure 1a, while the actual experimental setup is depicted in Figure 1b. Key hardware components include a front-mounted stereo camera for depth perception, a display screen with control switches, a battery compartment, and the main control unit. A GPS unit was included solely for validation and did not contribute to the navigation system. The robot relied entirely on stereo visual odometry-based mapping for real-time localization. These components collectively enable autonomous navigation and real-time mapping in agricultural environments. In addition, a spraying system, though not utilized in this study, was integrated into the platform for future applications.
The industrial robot HADA-ES500 (HADA, Iksan, Republic of Korea) used in this study was originally designed for orchard-spraying applications. In the present research, its capabilities were extended to enable fully autonomous operation in both indoor and outdoor environments [27]. The robot features a four-wheel-drive system powered by a single motor driver and operates in two distinct modes; in pre-built mode, it is manually controlled using a manufacturer-supplied remote, while in development mode, autonomy is achieved via controller area network (CAN) control messages. The robot’s primary control box includes a CAN–bus interface to process these messages and send signals to the motor driver for movement control. This dual-mode functionality enables seamless testing and development while maintaining compatibility with the original hardware.
The sensing system was equipped with an OAK-D Pro W POE camera (Luxonis, Lafayette, LA, USA), an industrial-grade depth camera that was selected for its high depth accuracy, AI-driven processing capabilities, and strong performance in visual odometry tasks. The camera captures stereo frames at up to 90 fps, thereby providing real-time depth information essential for generating accurate 2D/3D maps [28]. To optimize the camera’s performance, a detailed calibration process was conducted to refine both its intrinsic and extrinsic parameters. A charuco board was displayed on a 24-inch screen, and images were captured from multiple angles to cover the entire field of view (FOV). This calibration process, summarized in Table 1, significantly reduces geometric distortions and enhances the precision of depth perception and motion estimations [29].
The computational unit is responsible for processing the sensor data and executing localization and mapping algorithms. To meet the demands for resource-intensive tasks such as stereo visual odometry, 3D mapping, and AI-based feature recognition, this system utilized an Intel® Core™ i5-8250U 1.60 GHz CPU with 16 GB of RAM. The computational unit was directly interfaced with both the sensing system and the robot’s CAN–bus, thereby enabling efficient data acquisition, processing, and actuation [30,31]. The software stack was implemented on Ubuntu 20.04 LTS, utilizing robot operating system (ROS) Noetic, while software development in C++ and Python (version 3.8) ensured the flexibility required for efficient implementation of the SLAM algorithms. The detailed specifications of the primary hardware components are summarized in Table 2.

2.2. Stereo Visual Odometry

To achieve precise and reliable localization, our stereo visual odometry system followed a structured workflow. It begins with stereo image rectification, which corrects geometric distortions and ensures proper alignment of image pairs, thereby facilitating accurate depth computation. Next, feature detection is performed using the ORB algorithm to efficiently extract and track distinctive key points across frames, thereby ensuring robustness in diverse environmental conditions. Integrated optical flow estimation and stereo matching enable motion tracking and depth computation. By leveraging disparity measurements, it can accurately reconstruct the 3D positions of detected features, thus enhancing spatial awareness and localization accuracy.

2.2.1. Stereo Image Rectification

The first step in the stereo visual odometry system is stereo image rectification, which corrects geometric distortions and ensures proper alignment of the stereo image pair [32]. This process guarantees that corresponding points in the left and right images lie along the same horizontal plane, a prerequisite for accurate disparity computation and depth estimation. Rectification is performed using the stereo camera system’s intrinsic and extrinsic calibration parameters, which include focal lengths, principal points, and the relative pose between the cameras [33]. By transforming the images into a unified rectified coordinate system, this step minimizes disparities caused by lens distortion and misalignment, thereby standardizing the stereo image geometry. The rectified images provide a well-structured foundation for subsequent feature detection, feature matching, and depth estimation, which significantly improves the overall accuracy and robustness of the stereo visual odometry system.

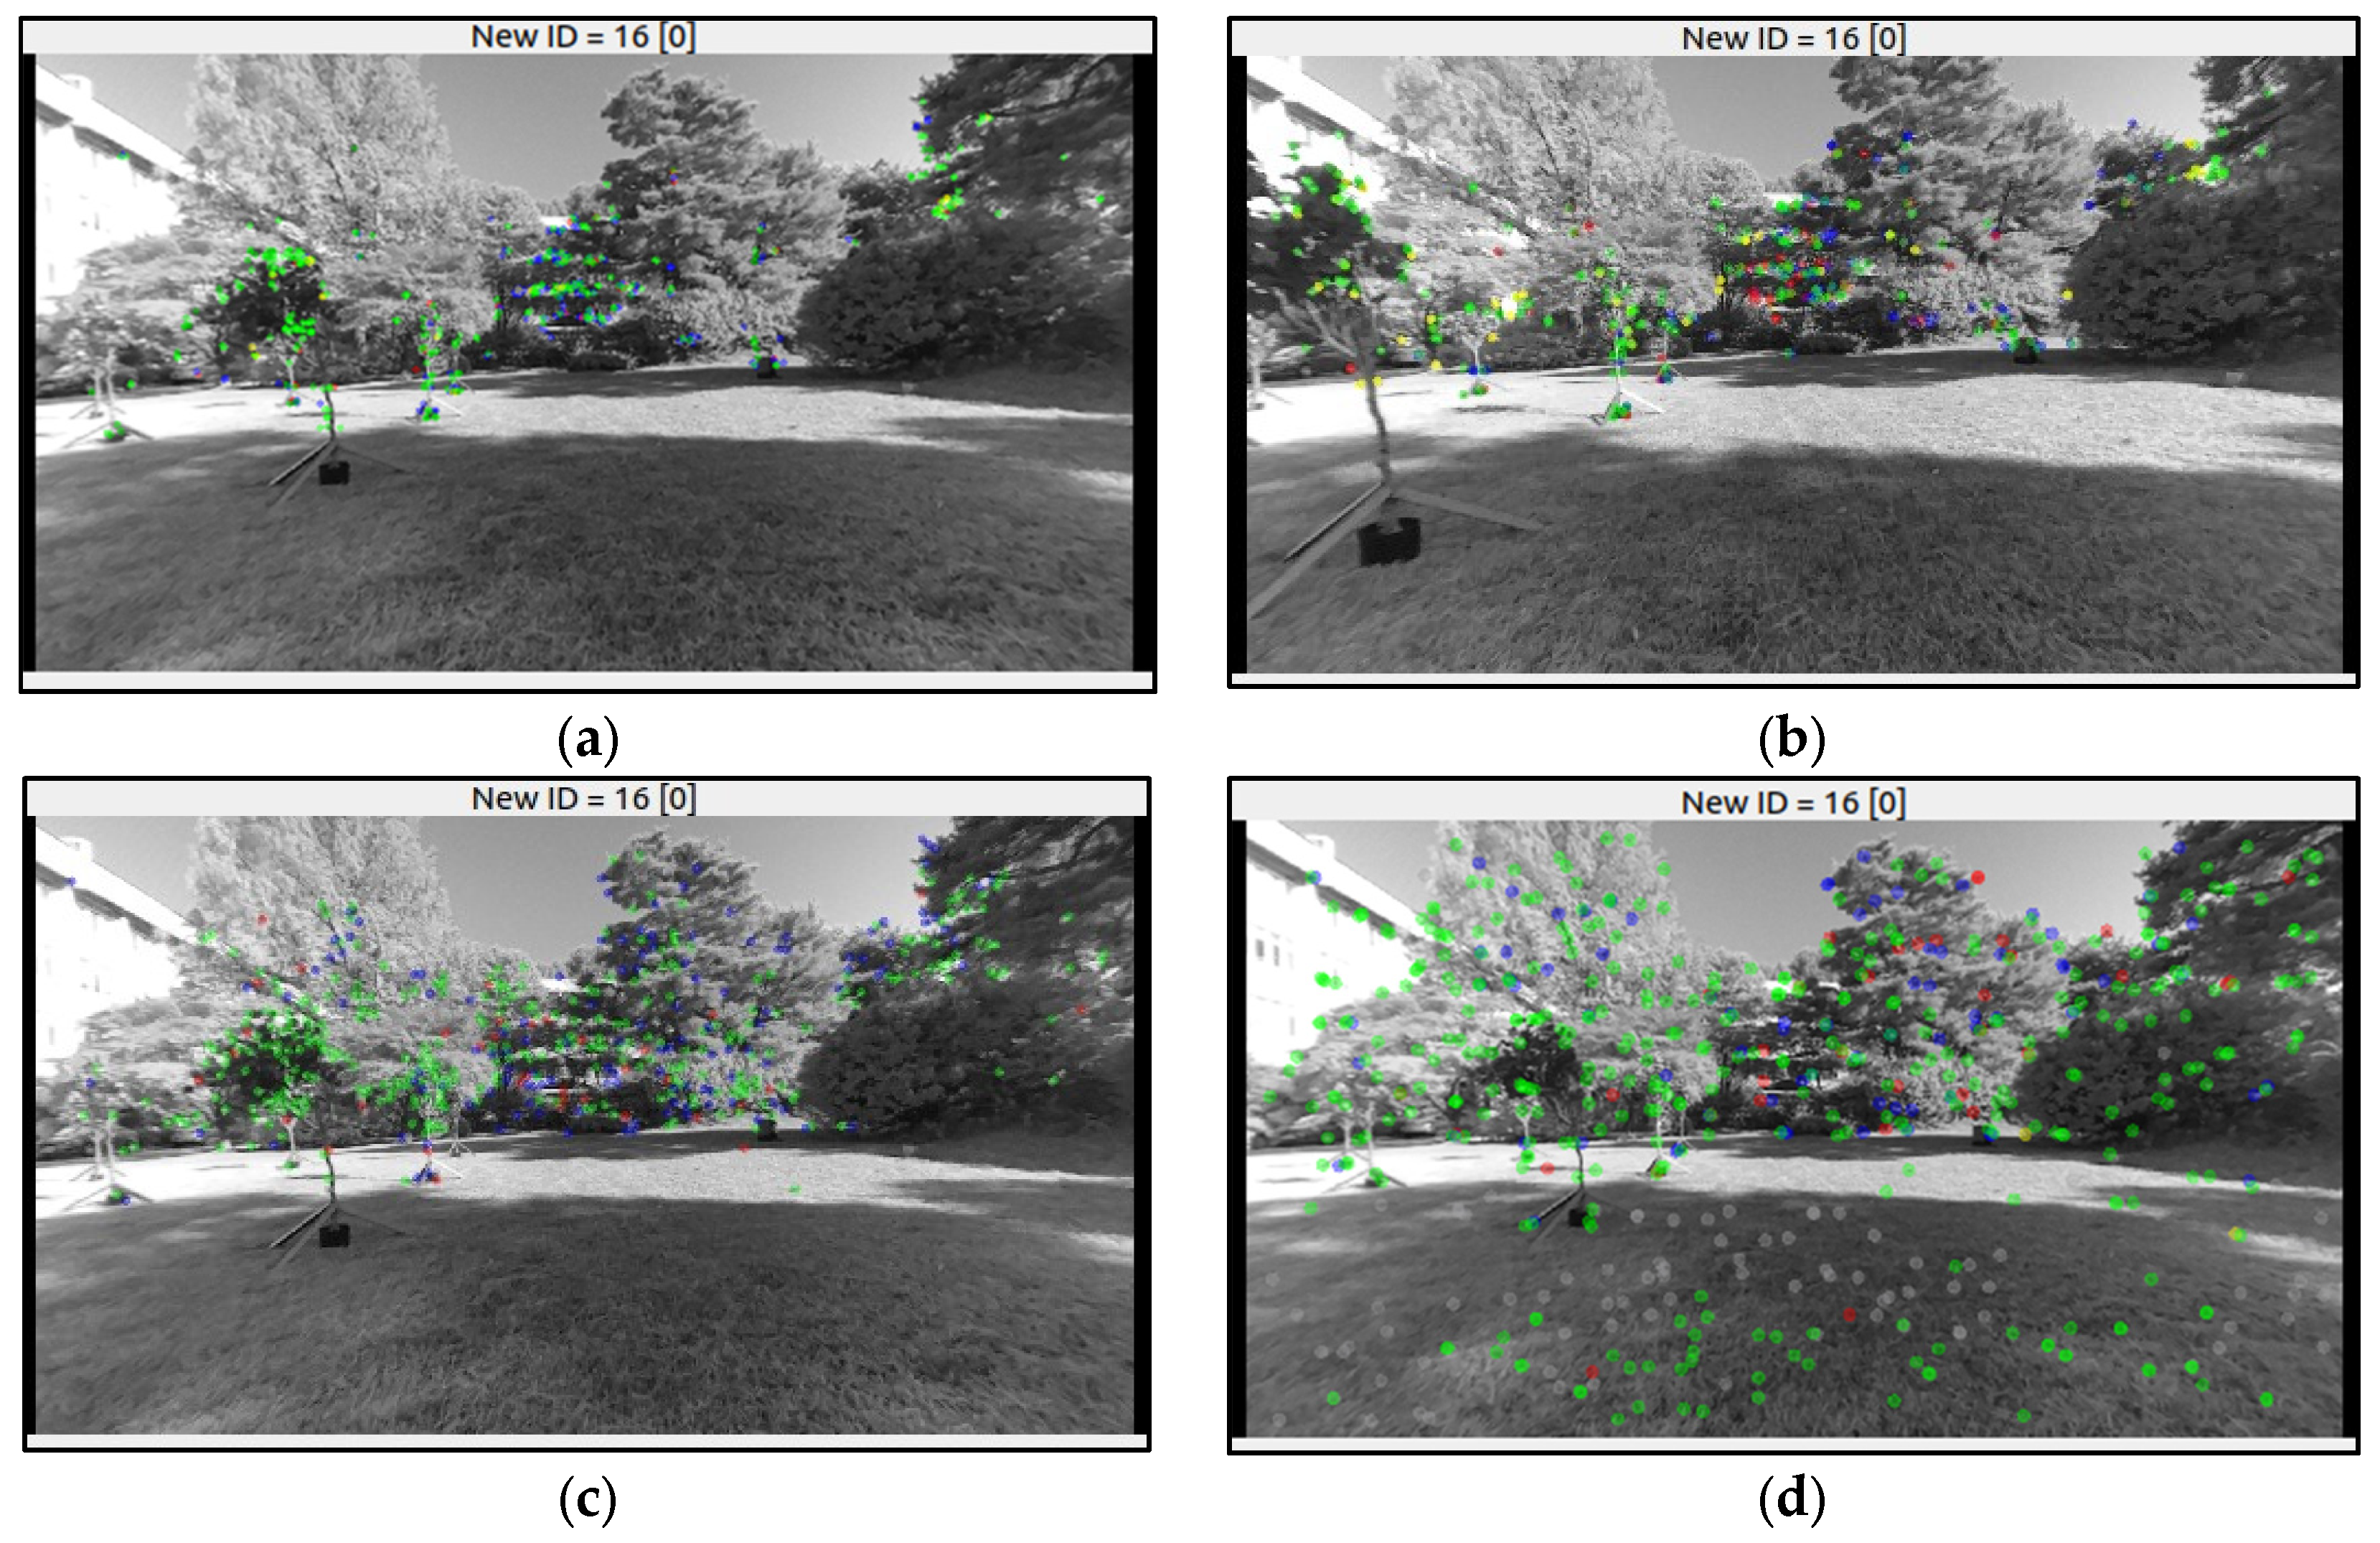
2.2.2. Feature Detection

The ORB algorithm was employed for feature detection due to its efficiency and robustness in extracting distinctive key points across stereo image pairs [34]. ORB leverages the FAST corner detector for keypoint detection and the rotationally invariant BRIEF descriptor for feature description, therefore ensuring reliability under varying environmental conditions. To enhance feature distribution, particularly in low-texture agricultural regions, an octree-based approach was integrated to maintain a more uniform spread of detected features [35]. Comparative testing among multiple detection methods (BRIEF, GFTT, standard ORB, and ORB-octree implementation) demonstrated that the octree-based approach significantly improves feature coverage across the entire frame in low-texture areas. This enhancement directly contributes to more robust feature matching and reduced trajectory drift. This improved uniformity in feature distribution ensures consistent correspondence across images, even in challenging environments (Figure 2). The detected features undergo two-stage matching: first, stereo matching establishes correspondences between the left and right images for disparity computation, enabling precise depth estimation, and second, temporal matching tracks features across consecutive frames to facilitate motion estimation. This integrated matching approach supports incremental camera pose estimation while simultaneously preserving depth accuracy, both of which are essential for achieving reliable and precise stereo visual odometry in real-world applications.

2.2.3. Optical Flow Estimation and Stereo Image Matching

In this work, optical flow estimation is performed using the Lucas–Kanade method, which tracks the displacement of key points between consecutive frames by analyzing intensity variations within a local window [36]. For depth estimation, stereo matching establishes correspondence between the key points in the left and right images. Disparity values are computed using the rectified stereo images. To ensure the accuracy of feature correspondences, the random sample consensus (RANSAC) algorithm is applied to effectively reject outliers and preserve only the most reliable matches. [37]. This step enhances the robustness of depth estimation by reducing errors due to mismatched features. The system continuously estimates the camera’s relative pose by integrating optical flow for motion tracking and stereo matching for depth computation, thereby facilitating real-time motion tracking [38]. The fusion of depth information with pose estimation enables precise 3D scene reconstruction and enhances the system’s ability to accurately track the camera’s trajectory.

2.3. IMU Integration

Integrating an IMU into the proposed SLAM system significantly enhances both visual odometry accuracy and global map optimization robustness. The IMU provides 6-degree-of-freedom (6DoF) pose estimation by measuring linear acceleration and angular velocity, which imposes a gravity constraint on the system. Unlike conventional visual-inertial methods that rely on full-state sensor fusion, this approach selectively utilizes the IMU to improve computational efficiency while maintaining accurate pose alignment and mitigating drift [39]. Our system implements a sequential initialization protocol to ensure accurate sensor alignment and robust SLAM performance. The initialization sequence begins with the stereo vision subsystem, which establishes the visual odometry framework. Next, the IMU subsystem is initialized to provide inertial measurements that enhance motion estimation. Finally, the stereo odometry and SLAM modules are activated, integrating both visual and inertial data for precise trajectory estimation and mapping. To maintain sensor synchronization and prevent initialization errors, the wait_imu_to_init = true parameter is set in the odometry and SLAM configuration. This enforces strict dependency on valid IMU data acquisition before visual odometry processing begins, thereby enhancing pose estimation accuracy and ensuring the stability and reliability of the system in real-world applications.

2.3.1. IMU Integration in Visual Odometry

In the visual odometry pipeline, the IMU serves as a gravity constraint during relative pose estimation. When estimating transformation T k 1 k between consecutive frames k 1 and k , gravity vector g provided by the IMU aligns the estimated pose with the real-world vertical axis, thus ensuring stability in feature-sparse or visually ambiguous environments. The transformation between frames is given by Equation (1) as follows:
T k 1 k = R k 1 k × t k 1 k ,
where R k 1 k is the rotation matrix and t k 1 k is the translation vector.
The IMU provides a reliable estimate of rotation component R k 1 k relative to gravity, thereby ensuring that pose estimates remain consistent with the vertical direction. This selective IMU integration corrects for accumulated drift and enhances robustness without the complexity of full sensor fusion, thereby maintaining a balance between accuracy and computational efficiency [40]. To address sensor synchronization challenges between the stereo camera (30 Hz) and IMU (400–500 Hz), a timestamp-based message buffer was implemented in ROS. Rather than relying on computationally expensive interpolation, our system retrieves the nearest IMU measurement for each stereo frame to refine orientation estimates efficiently. Additionally, ROS’s approximate time synchronization policy ensures stereo–IMU alignment within a 1 ms window, improving system stability and temporal accuracy.

2.3.2. IMU Integration in SLAM

In the SLAM framework, the IMU plays a critical role in global pose graph optimization. The pose graph consists of nodes representing key frames and edges encoding spatial relationships between consecutive frames or loop closures [41]. Over time, small accumulative pose estimation errors introduce drift, which misaligns the reconstructed map from the real-world orientation. To mitigate this, the IMU-derived gravity vector g acts as a prior constraint during optimization, thereby ensuring alignment with the true vertical axis. Our SLAM implementation employs a loosely coupled fusion strategy, treating IMU data as an auxiliary constraint rather than tightly integrating them. This approach prioritizes stereo visual features for translation estimation while leveraging IMU measurements exclusively for orientation correction. By striking a balance between computational efficiency and accuracy, it enhances system performance without introducing unnecessary complexity. The gravity constraint error term is defined in Equation (2) as follows:
E gravity = | | R e s t i m a t e d × g w o r l d g I M U | | 2 ,
where g w o r l d is the expected gravity vector in the world frame and g I M U is the measured gravity vector from the IMU.
This constraint is optimized using factor graph-based methods such as Georgia Tech smoothing and mapping (GTSAM) to refine pose estimates. The global optimization problem is formulated as shown in Equation (3):
i , j | | T i 1 T j z i j | | i j 2 + i E gravity ,
where T i and T j are the poses at frames i and j, respectively; z i j is the relative transformation between the nodes; and i j represents the covariance matrix for measurement uncertainty.
By incorporating the gravity constraint, the global optimization process ensures that the map remains aligned with the true vertical direction, thereby significantly improving long-term localization accuracy while minimizing drift.

2.4. Dense 3D Point Cloud Generation and Mapping

The mapping module utilizes RTAB-Map to generate a high-fidelity 3D point cloud map in real-time using a stereo-depth camera. This camera processes RGB and depth data onboard, ensuring precise depth estimation. RTAB-Map provides a versatile SLAM solution supporting both stereo and RGB-D inputs, offering key features such as loop-closure detection, map reuse, and re-localization [42]. The mapping process begins with the creation of a sparse point cloud using stereo image pairs captured by the camera. To enhance the map’s detail and accuracy, RTAB-Map fuses depth data with pose information from the tracking module and incrementally refines the 3D reconstruction. The result is a dense 3D point cloud that accurately represents the environment, thereby enabling the robot’s precise localization. To further enhance robustness, the system integrates IMU data, which assists in relocalization if the robot loses its position.
For both indoor and outdoor environments, a comprehensive point cloud processing pipeline enhances map accuracy and computational efficiency. The pipeline begins with the projection of disparity images into 3D space using camera calibration to align the point clouds with the robot’s base frame. The proposed processing framework consists of three primary stages. (1) Voxel grid filtering: A voxel grid filter [43] is applied to down-sample the point cloud, which reduces computational complexity while preserving essential structural features; this step enhances processing efficiency without significantly compromising spatial fidelity. (2) Ground segmentation and obstacle identification: Ground points are segmented using normal vector analysis; points exhibiting an upward normal orientation within a predefined angular threshold are classified as the ground while the remaining points are designated as obstacles, thereby precisely differentiating between navigable and non-navigable areas. (3) Two-dimension projection and occupancy grid generation: The refined 3D point cloud is projected onto the x-y plane, and 2D ray tracing is employed to interpolate gaps between detected obstacles within the sensor’s FOV. A 2D occupancy grid map is subsequently generated by projecting the 3D point cloud onto the ground plane. Cells containing obstacle points exceeding a height threshold of 2.5 m are marked as occupied, while those within the sensor’s detectable range but devoid of obstacles are classified as free space. This height-based thresholding effectively captures relevant obstacles while mitigating noise and ground point interference, thereby yielding an optimized 2D representation for autonomous navigation.

2.5. Overall SLAM Framework

The proposed SLAM system comprises stereo visual odometry, IMU data, and RTAB-Map to achieve precise and robust localization and mapping in both indoor and outdoor environments. Stereo visual odometry serves as the primary method for motion estimation to leverage depth and disparity information from stereo image pairs to incrementally compute the robot’s pose. In addition, IMU integration enhances localization by providing 6DoF pose estimation and acting as a gravity constraint, thereby aligning poses with the real-world vertical axis and mitigating drift, particularly in feature-deficient or visually ambiguous environments. To construct a globally consistent map, RTAB-Map organizes pose estimates from the stereo visual odometry output into a pose graph. Therein, nodes represent keyframes while edges define spatial relationships between them. Loop-closure detection in RTAB-Map enables the system to recognize previously visited locations, thereby introducing additional constraints to the pose graph that correct accumulated drift [44]. This ensures long-term global consistency, even in large-scale environments with repetitive features.
For global optimization, GTSAM is employed to further refine the pose graph to minimize errors in the spatial constraints by incorporating the stereo odometry results, loop-closure constraints, and IMU-based gravity priors [45]. This optimization aligns the map with the true vertical axis, thus effectively reducing drift and improving mapping accuracy. The mapping module utilizing RTAB-Map generates a dense 3D point cloud in real-time. Depth data from the stereo camera is continuously fused with pose information from the SLAM framework, resulting in a high-resolution 3D representation of the environment. This detailed map enhances essential autonomous navigation functions, including relocalization, path planning, and obstacle avoidance, which ensures that the system remains highly reliable and adaptable in dynamic settings. The complete SLAM workflow demonstrating the seamless integration of stereo odometry, IMU data, RTAB-Map, and graph-based optimization for precise and efficient mapping and localization is illustrated in Figure 3.

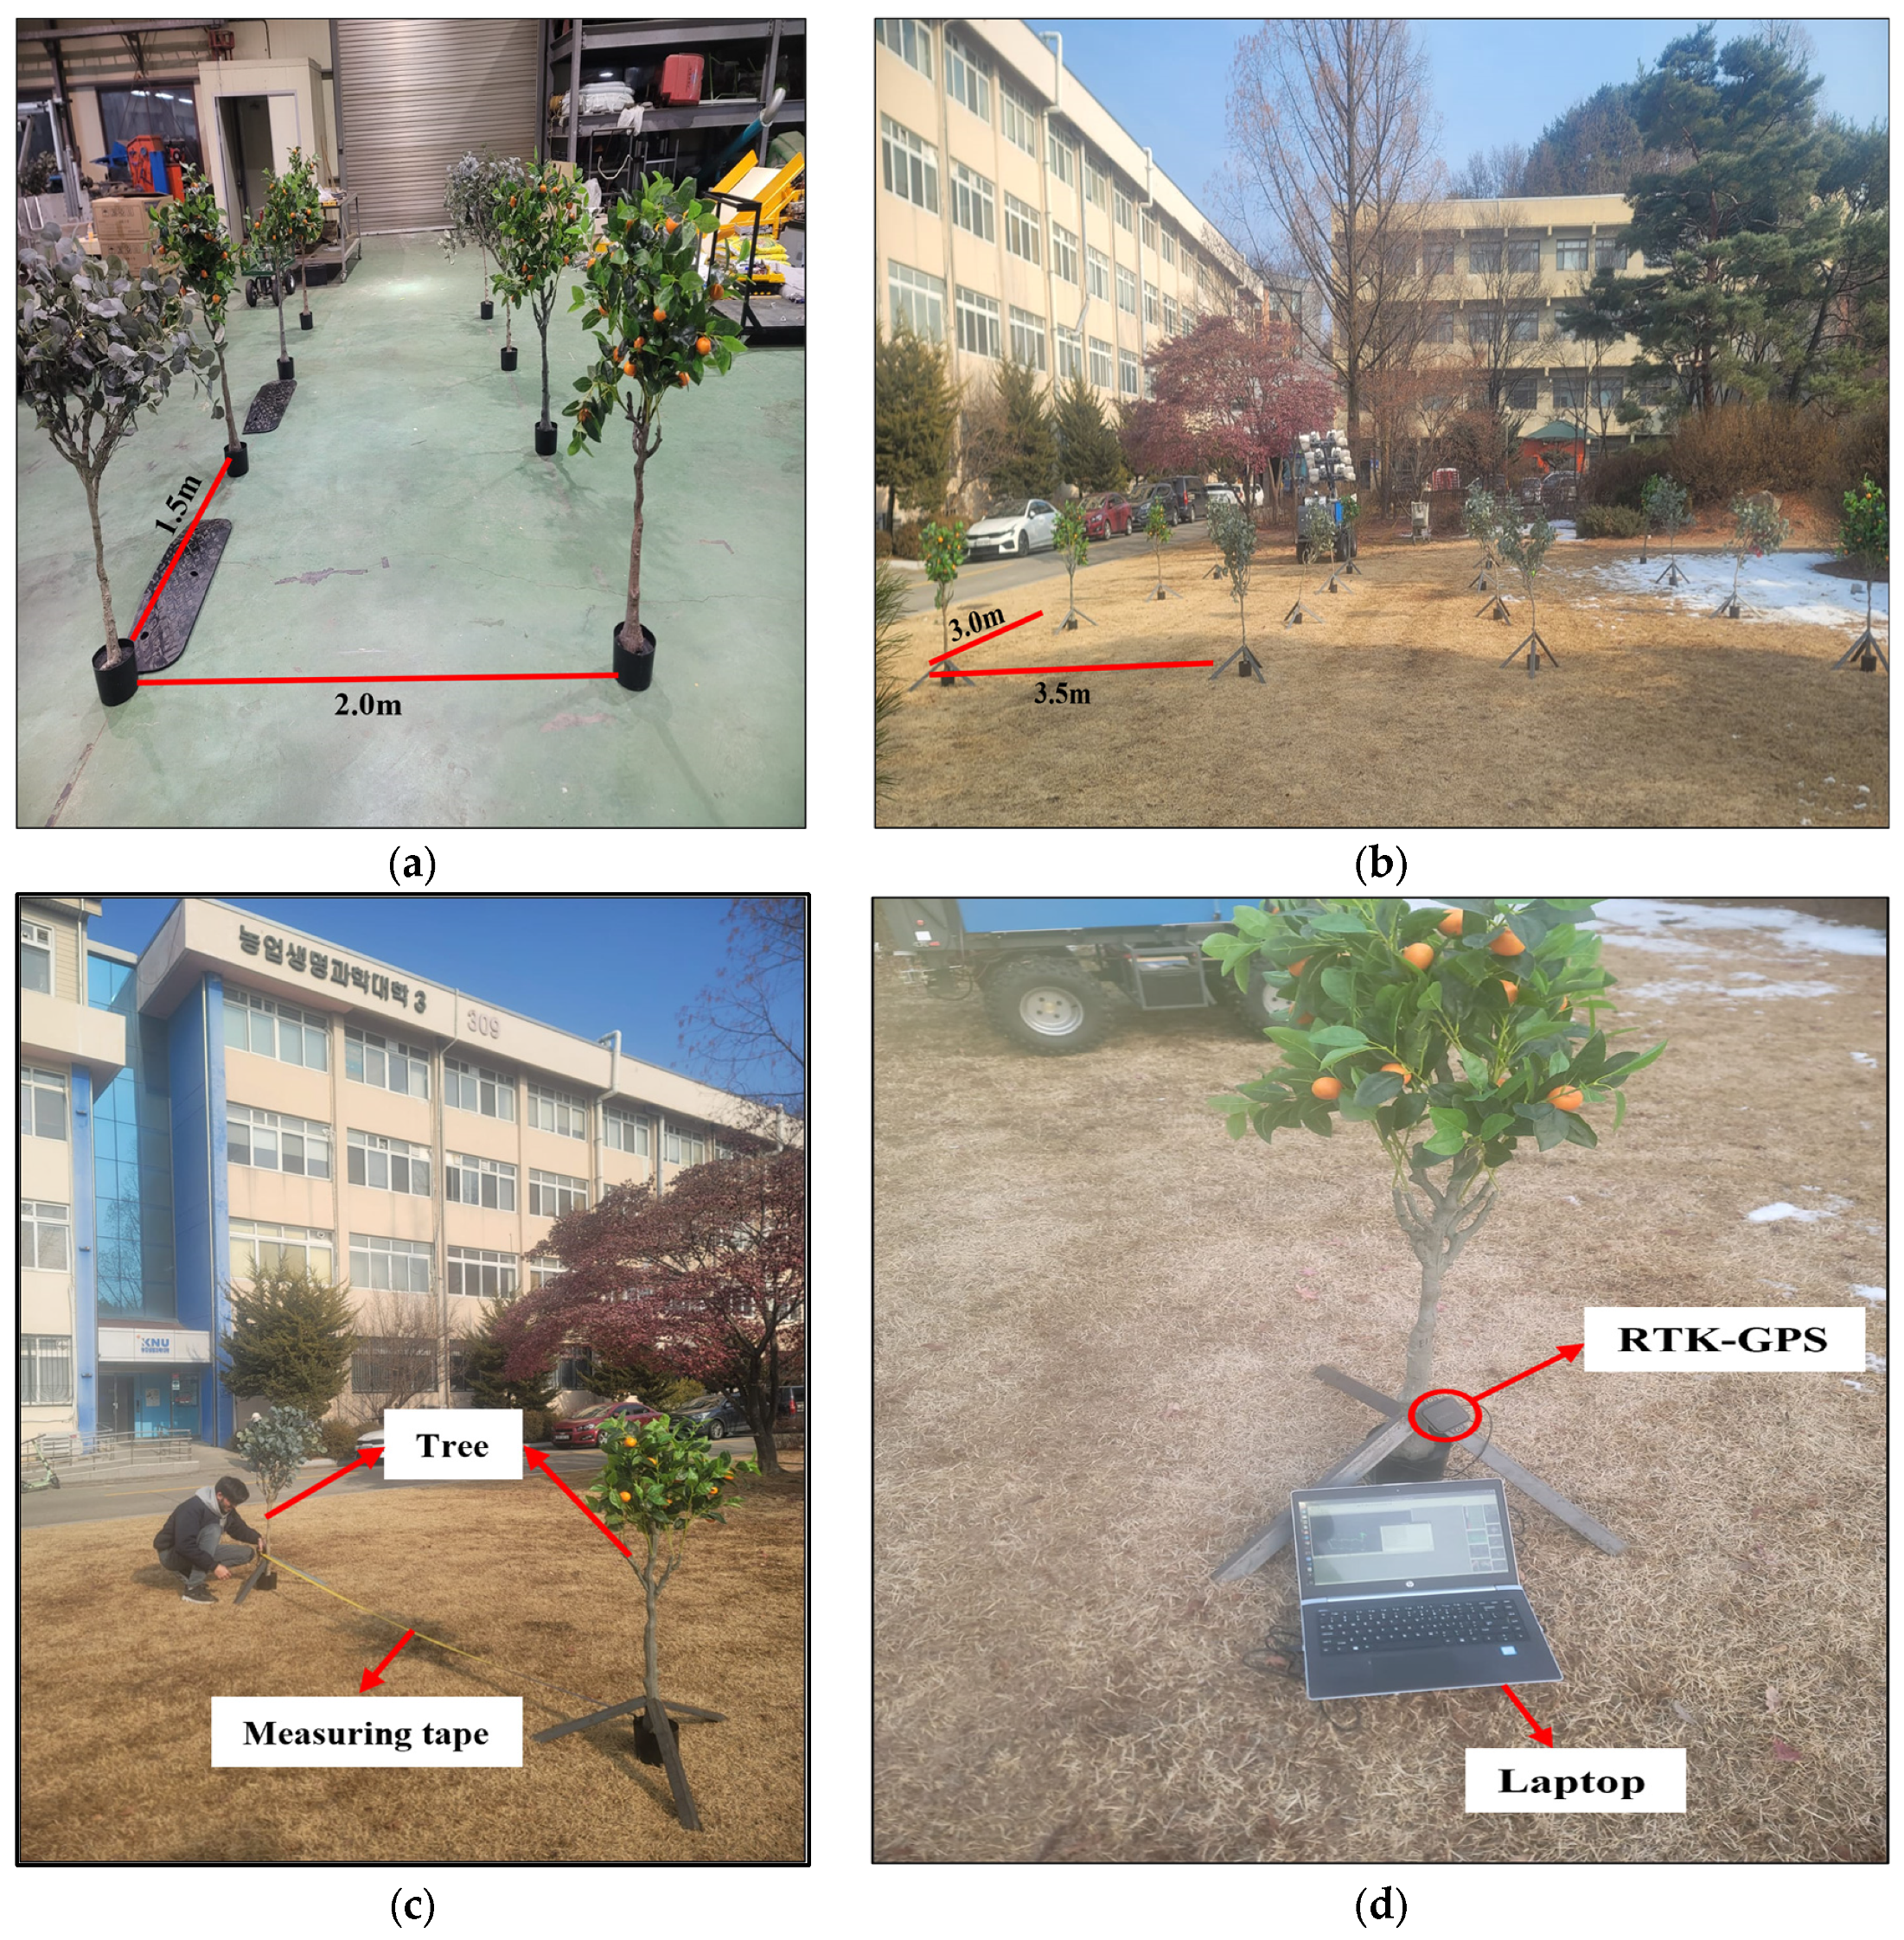
2.6. Experimental Setup

Experiments were conducted in both indoor and outdoor settings to evaluate the mapping and localization performance of the robot in diverse environments. These tests were designed to assess the system’s adaptability, robustness, and accuracy under varying conditions. The indoor experiment was conducted in October 2024, in a warehouse at Kangwon National University, Chuncheon, Republic of Korea: an environment characterized by cluttered surroundings and varying obstacle densities. To create a structured evaluation environment, eight artificial trees were strategically placed inside the warehouse, and the robot was tasked with generating a detailed map of the space (Figure 4a). For outdoor testing, the experiment was conducted in January 2025, in an open field featuring a structured 4 × 4 grid of artificial trees (Figure 4b). The rows were spaced 3 m apart while the columns were spaced 3.5 m apart, thus ensuring smooth navigation and unrestricted maneuverability for the robot.
To assess mapping accuracy, ground-truth measurements were established using environment-specific methodologies. For the outdoor environments, a real-time kinematic (RTK) GPS was employed alongside manual measurements to ensure high-precision ground-truth data. For the indoor environments, where GPS signals were unavailable, ground-truth data were obtained exclusively through manual measurements. Reference distances were recorded using a measuring tape to provide a direct and accurate basis for comparison. Figure 4c illustrates the manual measurement of ground-truth distances between trees using a measuring tape to ensure precise spatial referencing in the absence of GPS data. Meanwhile, Figure 4d presents the RTK-GPS-derived ground-truth positions of trees in the outdoor environment, thereby demonstrating the accuracy of the localization system under real-world conditions. This dual approach to ground-truth validation ensures robust accuracy assessment for both the indoor and outdoor settings to provide a comprehensive evaluation framework for the mapping process.
Mapping accuracy was quantitatively evaluated using multiple metrics. The mean absolute error (MAE) between the estimated and ground-truth positions was calculated to assess positional accuracy using Equation (4) as follows:
e m = 1 N i = 1 N ( x i x i G T ) 2 + ( y i y i G T ) 2 ,
where ( x i x i G T ) and ( y i y i G T ) represent the differences between the estimated coordinates and the ground-truth coordinates of the i t h tree. In addition to MAE, error consistency was evaluated using the standard deviation of mapping errors, while the maximum and minimum position errors were recorded to capture extreme deviations. The root mean square error (RMSE) was also calculated to provide a comprehensive assessment of overall accuracy.
To simulate possible environment-specific challenges, system parameters were dynamically adjusted to provide various experimental scenarios, leveraging validated configurations from prior studies tested on datasets such as KITTI, TUM RGB-D, EuRoC, and PR2 MIT Stata Center [42]. Feature detection thresholds were fine-tuned to enhance tracking performance under varying lighting conditions to ensure robust feature extraction. In addition, loop-closure settings were optimized to minimize cumulative drift, particularly in large open areas where fewer visual landmarks were available. These adjustments improved feature matching and ensured reliable mapping performance in both constrained indoor settings and expansive outdoor environments.

3. Results

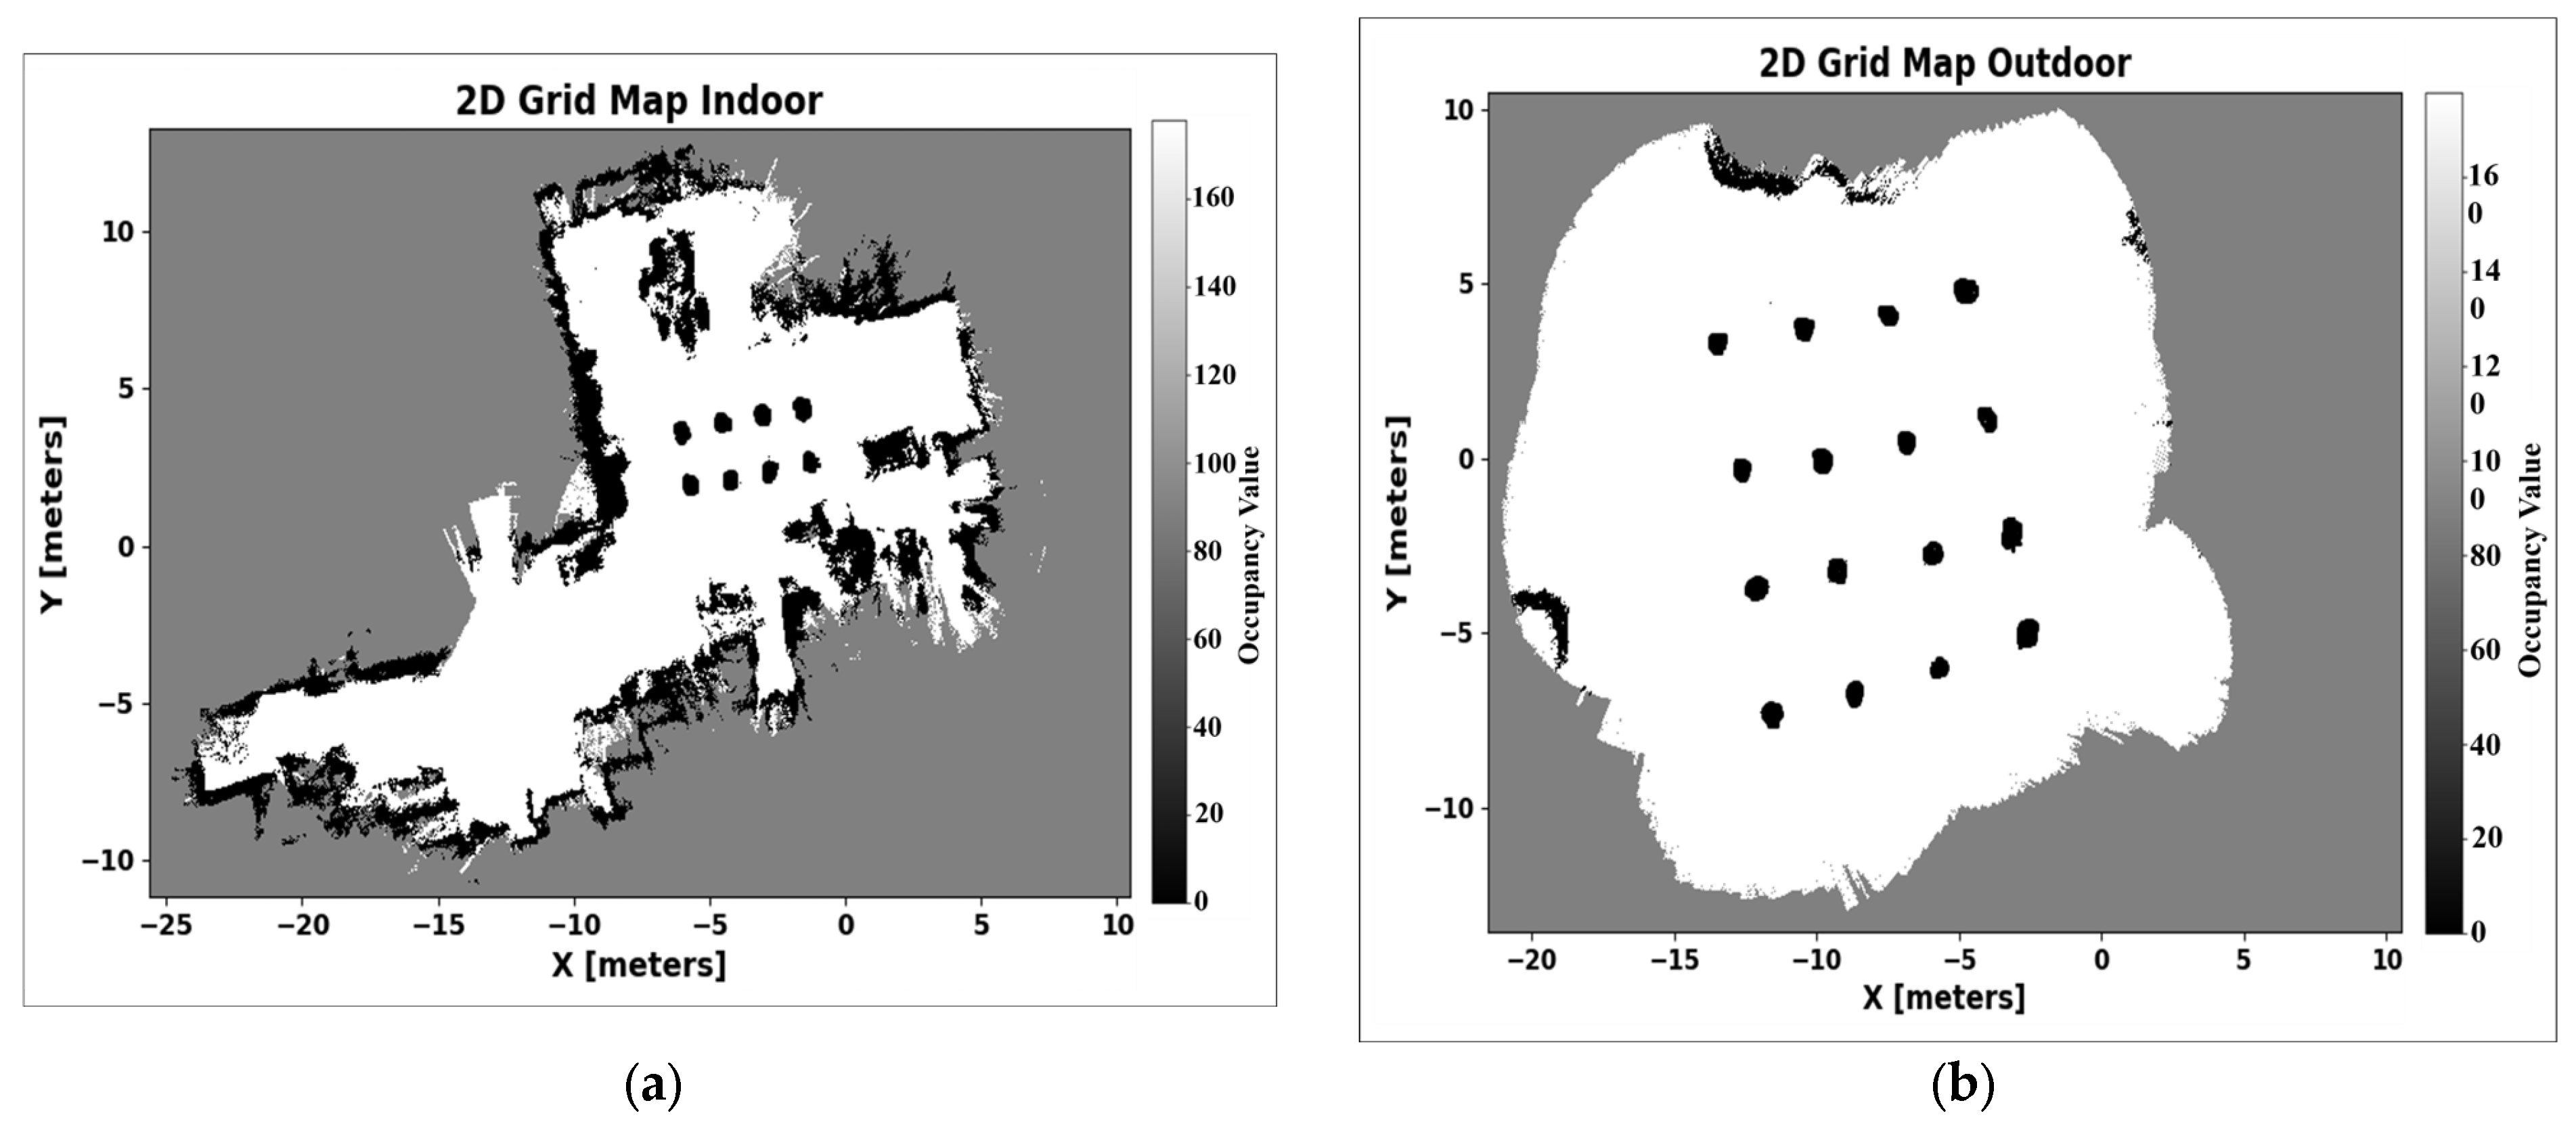
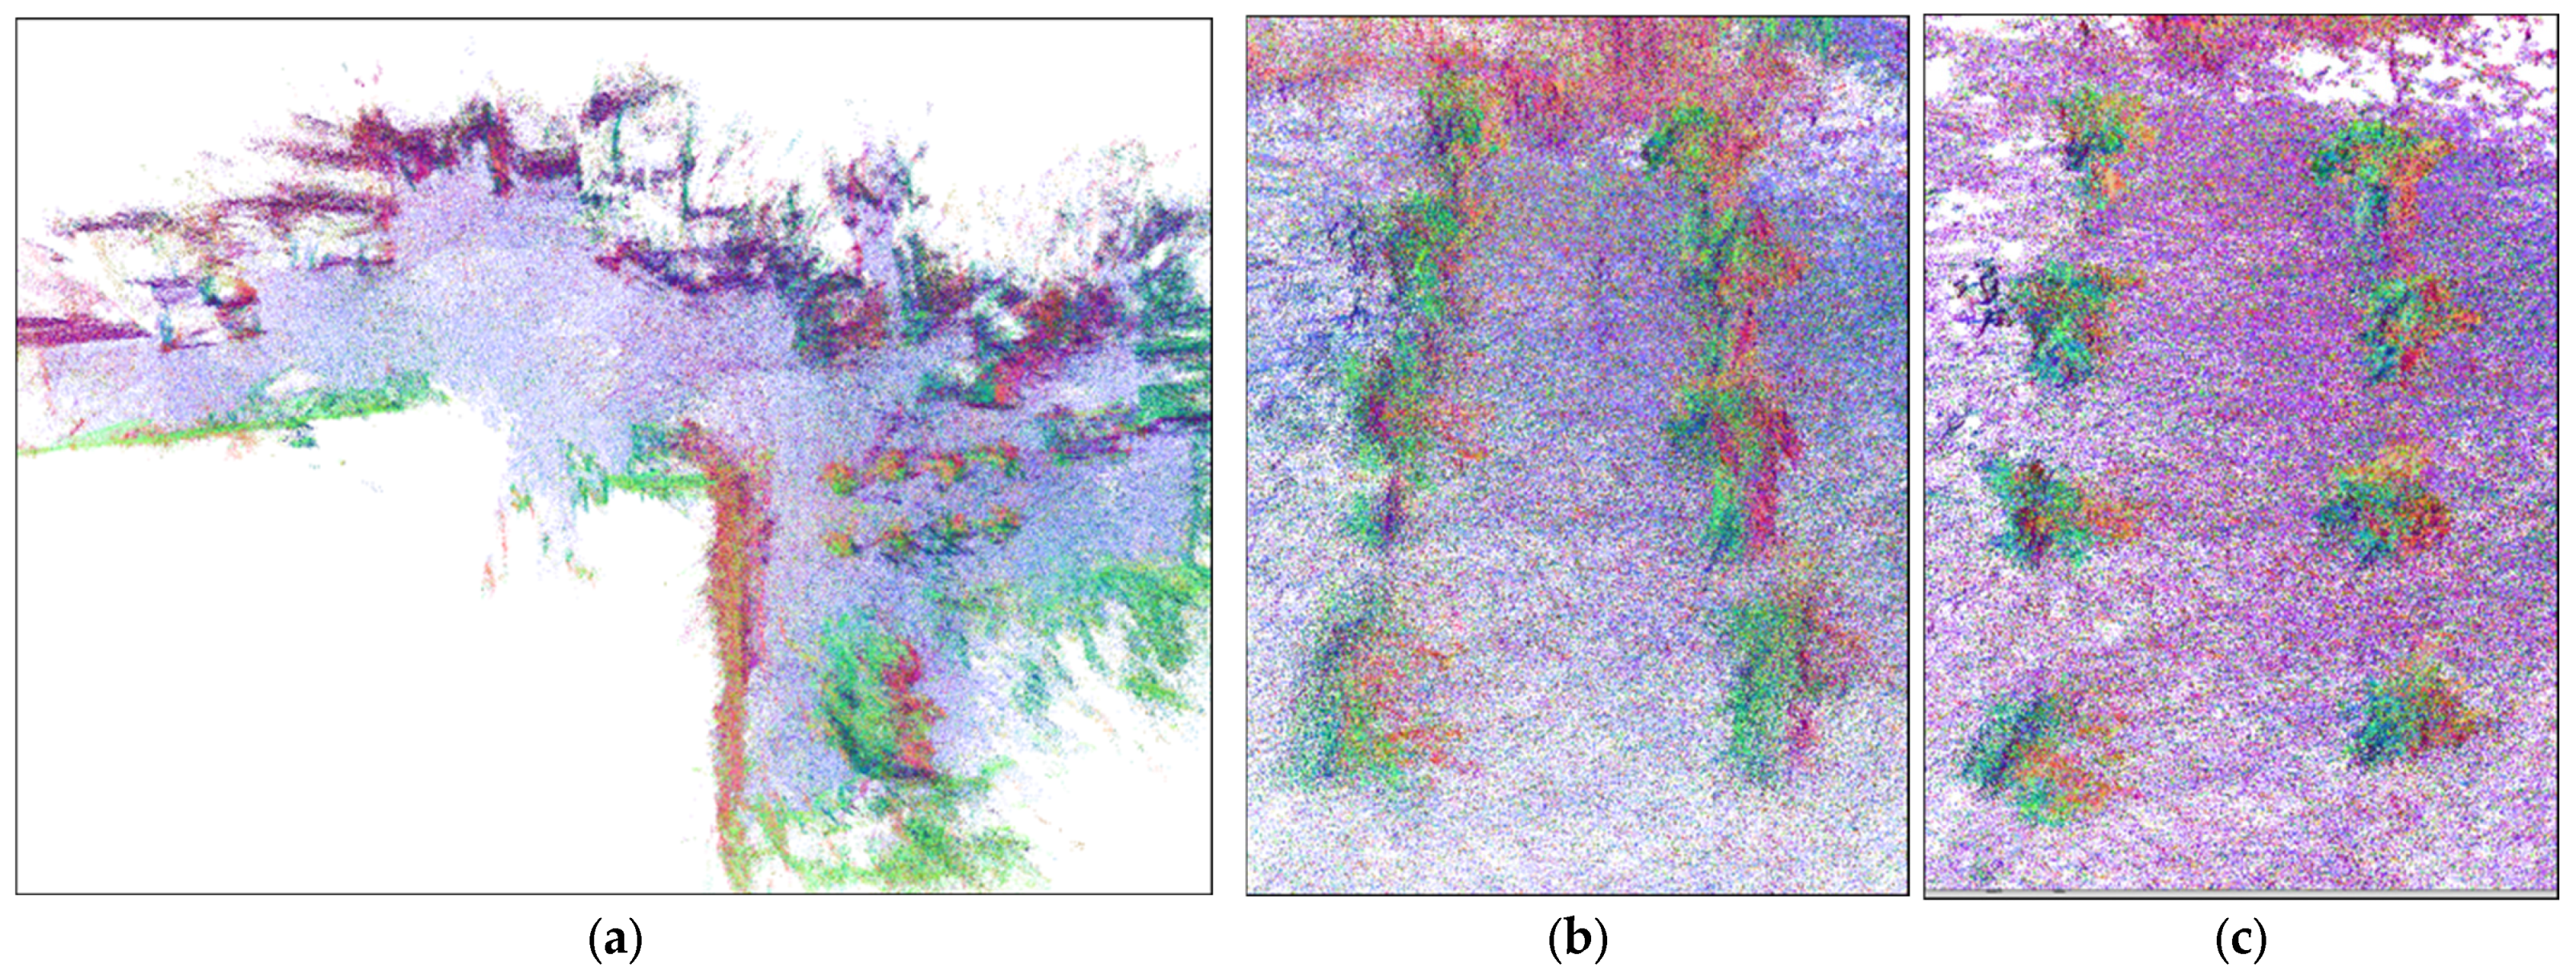
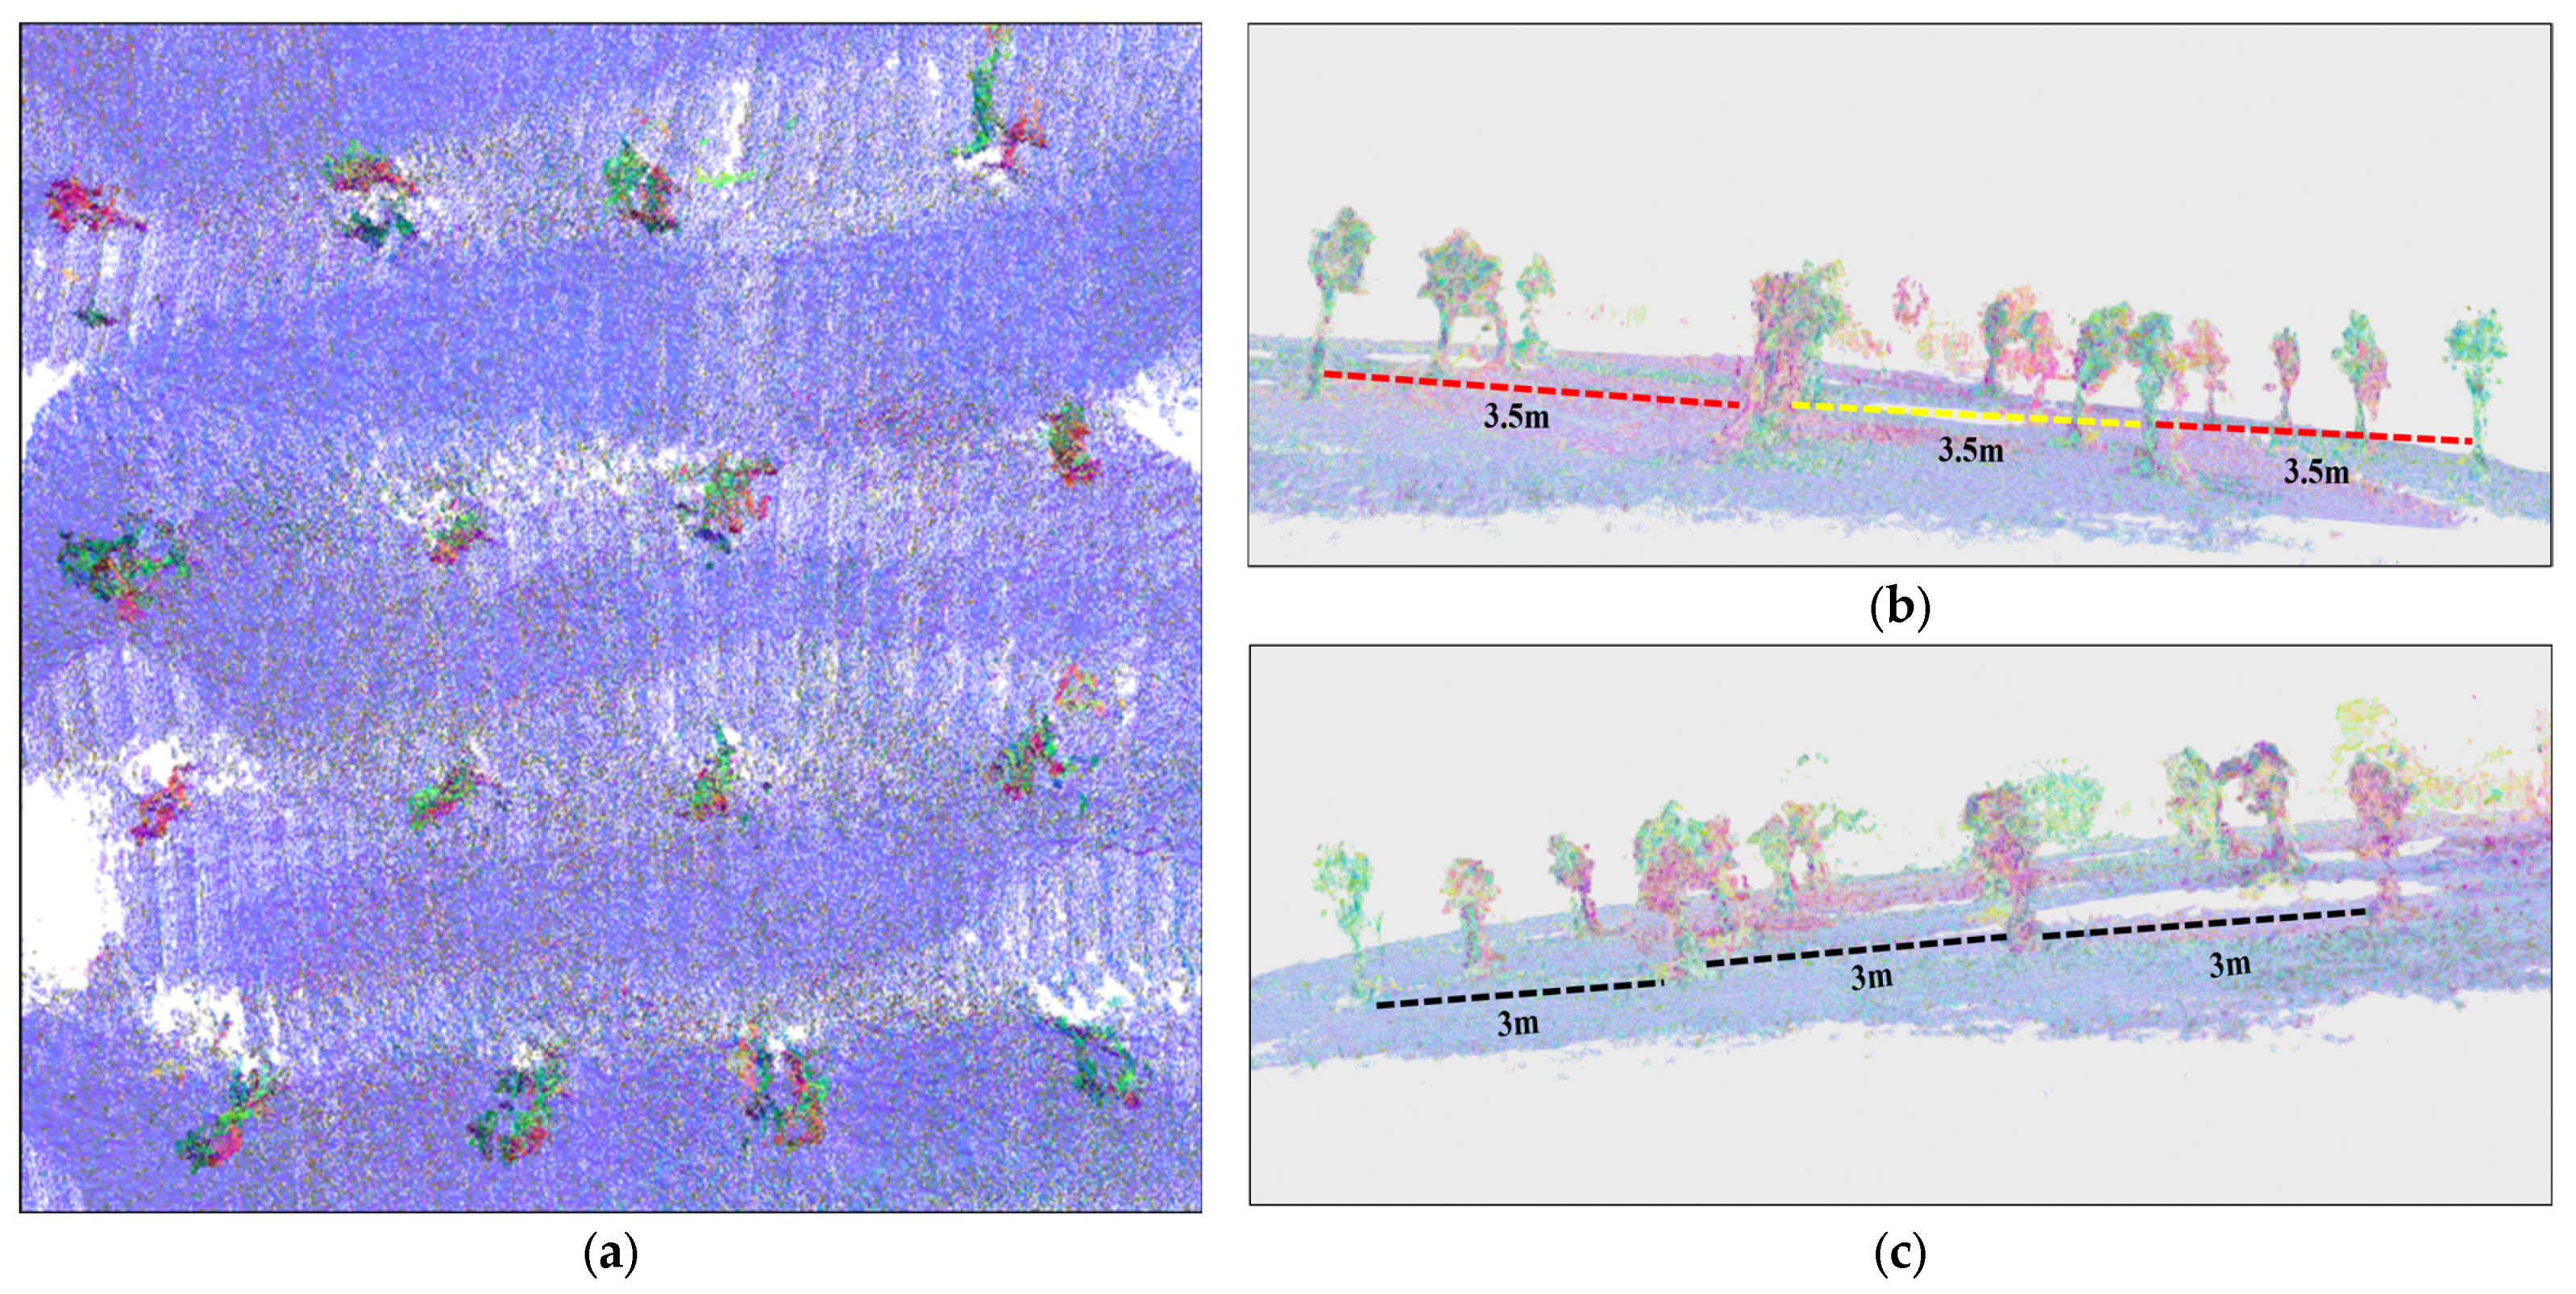
3.1. Mapping Results for the Indoor and Outdoor Environments

A detailed analysis was conducted to assess the effectiveness of stereo visual odometry under varying environmental conditions. In the indoor environment, mapping was performed within a 30 × 22 m hall in which eight trees had been strategically placed. The environment contained additional objects, including tractors, tables, and cupboards, which were mapped alongside the trees to evaluate the robustness and accuracy of the mapping process. As can be seen in Figure 5a, the resulting 2D occupancy grid map generated at a resolution of 0.05 m per cell successfully captured the spatial layout of the trees and surrounding objects. The eight trees exhibited an average occupancy value of 85% within their respective grid cells, while walls and other structural elements displayed occupancy values exceeding 90%, indicating high mapping fidelity (see https://youtu.be/kxO4KCS_LfE (accessed on 22 January 2025)). For the outdoor environment, mapping covered a 25 × 25 m area featuring 16 trees in a 4 × 4 grid pattern. As can be observed in Figure 5b, the occupancy grid at a resolution of 0.05 m effectively delineated the tree positions as occupied cells (black) and navigable areas as free space (white). The system successfully mapped all 16 trees, with an average occupancy value of 82% in the tree-occupied cells, thus demonstrating the accuracy of the mapping approach in larger unstructured environments (see https://youtu.be/BeTA_g8wmm8 (accessed on 22 January 2025)).
To enhance mapping precision, loop-closure detection, integrated with graph optimization techniques, was employed to refine the map structure by enforcing global consistency and mitigating accumulated drift. This correction mechanism was particularly beneficial in feature-scarce or visually ambiguous areas and could ensure accurate localization over extended trajectories. Overall, the results demonstrate the adaptability of stereo visual odometry across diverse environments, as well as its robustness in both structured indoor settings and expansive outdoor landscapes. The incorporation of loop-closure detection significantly improved mapping accuracy, which highlights its critical role in maintaining long-term spatial consistency.

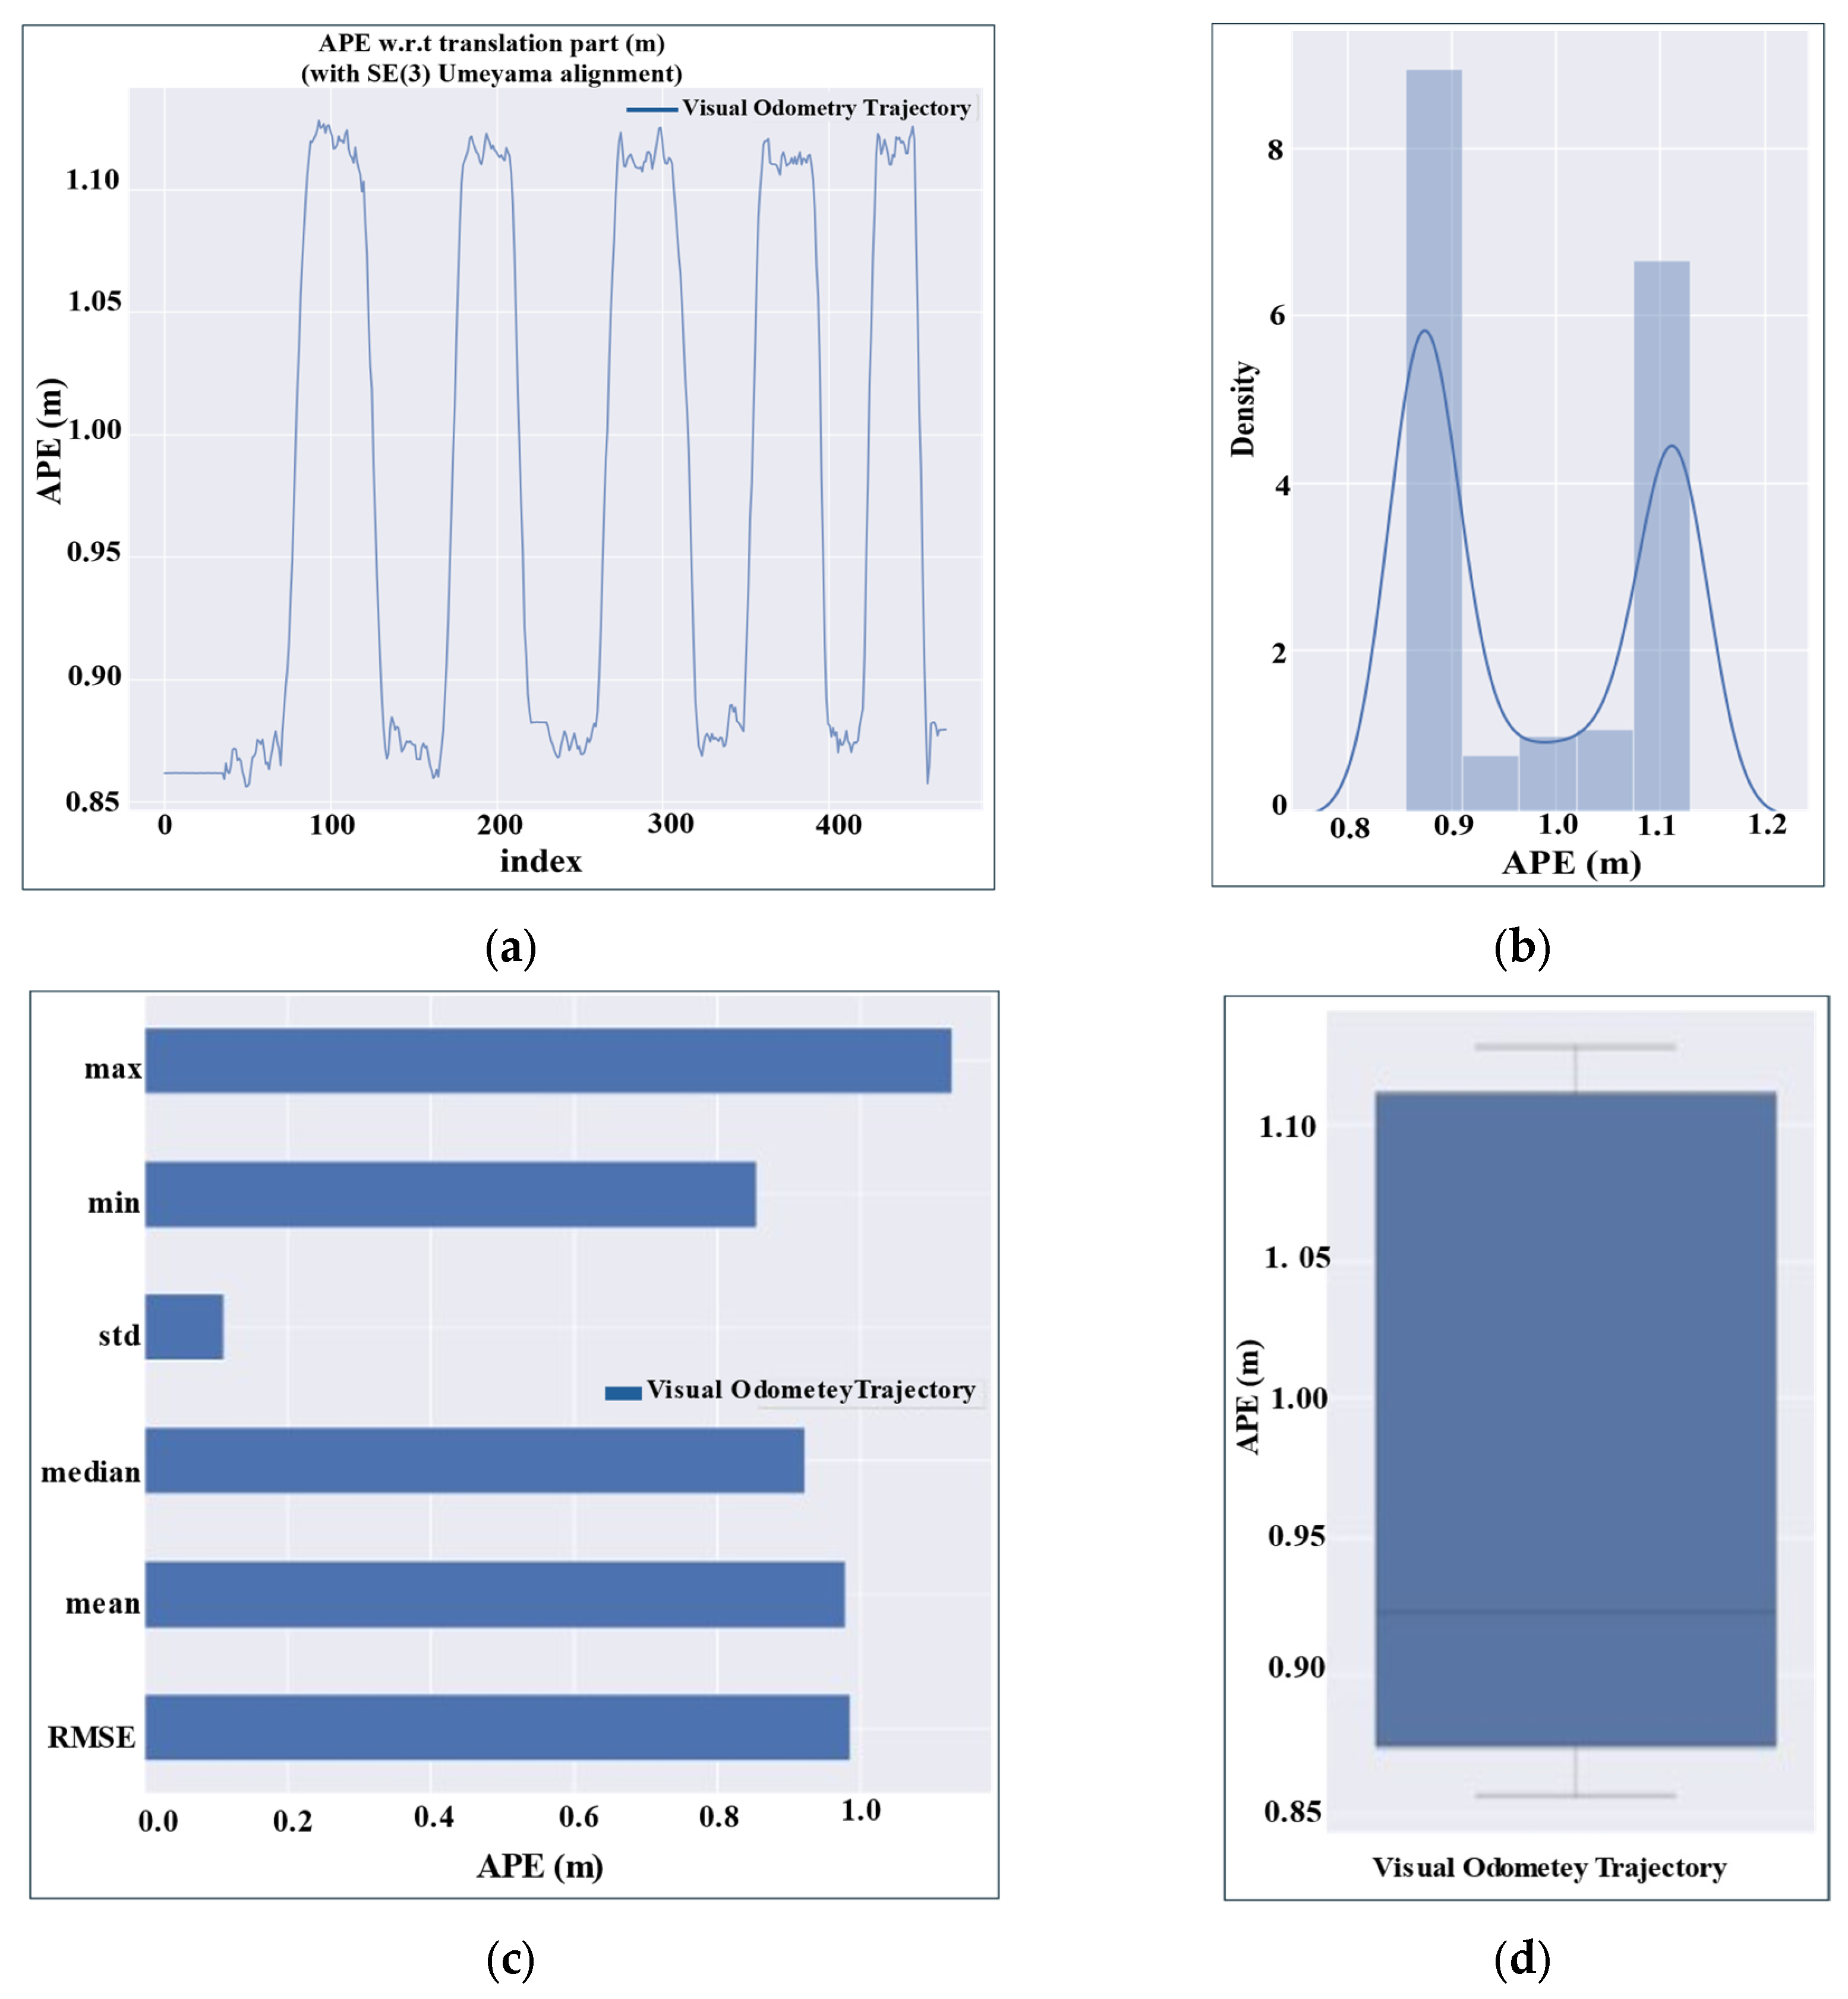
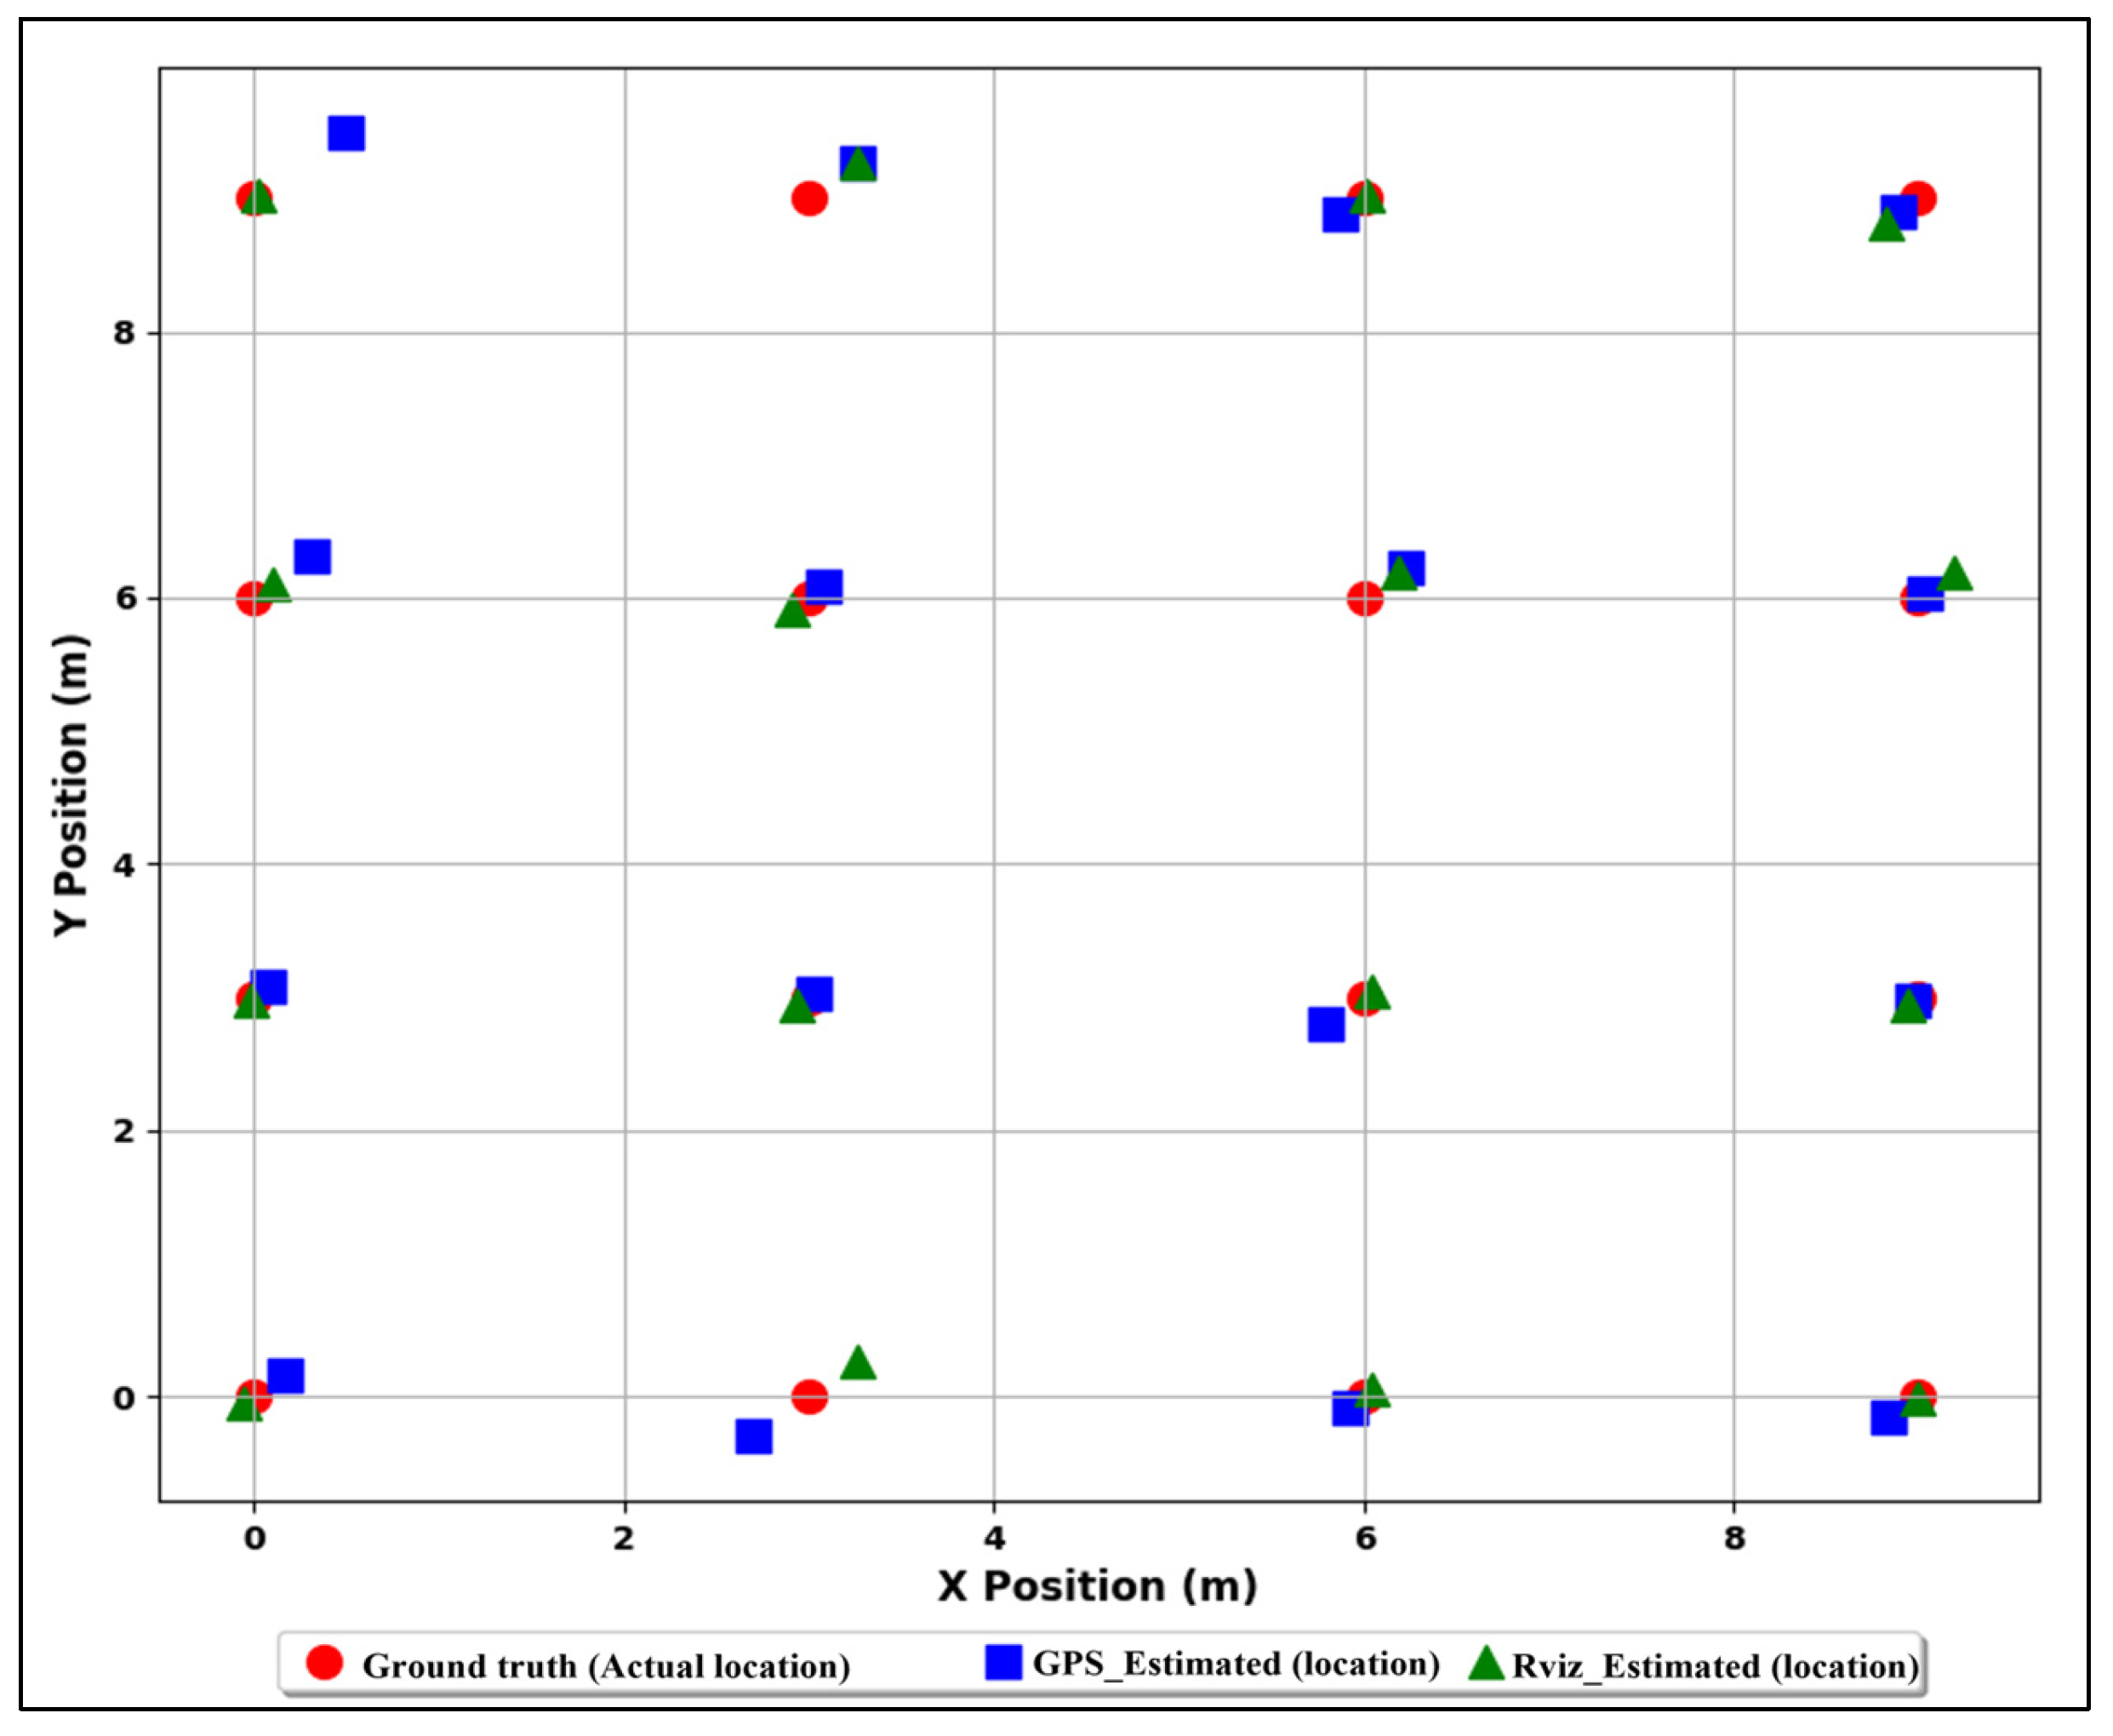
3.2. Mapping Accuracy Analysis

Mapping accuracy was evaluated by comparing the estimated tree positions with the corresponding ground-truth ones. For the indoor environment, manual measurements were used as the reference ground-truth data, while outdoor validation incorporated both RTK-GPS and manual distance measurements between trees to ensure high-precision ground-truth data. The mapping accuracy analysis revealed distinct performance characteristics across the different environments. After successfully generating the 2D occupancy map, the estimated tree positions were extracted using the Rviz visualization tool [46], and any deviations between these mapped positions and the corresponding ground-truth ones were analyzed. In the indoor environment, our ORB-octree implementation adaptively adjusted detection thresholds to compensate for low-texture surfaces and uniform lighting conditions. The proposed system achieved an average positional error of 0.03 m, with an error consistency of 0.15 m. The mapping errors ranged from −0.08 to 0.41 m, demonstrating the system’s ability to accurately reconstruct indoor environments by maintaining a well-distributed feature set across frames rather than clustering in highly textured regions.
For the outdoor environment, the algorithm dynamically adjusted feature detection parameters to accommodate varying illumination intensities while leveraging the natural texture richness of the scene. The system’s performance was evaluated against the RTK-GPS data and manual measurements. The RTK-GPS-based evaluation yielded an average positional error of 0.063 m, with an error consistency of 0.208 m, and error values ranging from −0.295 to 0.495 m. However, when the tree locations were estimated using Rviz-based measurements, which are our estimated tree’s locations, the system demonstrated higher accuracy, achieving an average error of 0.018 m with an improved consistency of 0.147 m and an error range of −0.18 to 0.34 m, thus indicating enhanced spatial accuracy. This improvement was achieved by leveraging both spatial and appearance-based feature constraints, enabling robust feature matching despite shadows and brightness variations throughout the day. Figure 6 provides a comparative visualization of mapping errors within the 4 × 4 tree grid environment, thereby illustrating deviations between the estimated and ground-truth tree positions. Table 3 summarizes the mapping error statistics across different environments and measurement approaches. These results highlight the robustness and accuracy of the proposed system across diverse environments, with Rviz-based estimation demonstrating superior consistency and lower average errors, particularly in the outdoor setting.

3.3. Three-Dimensional Dense Point Cloud Processing

In the indoor environment, the point cloud processing pipeline demonstrated effective environment reconstruction while maintaining structural fidelity. The initial raw point cloud consisted of 3,065,270 points. To enhance quality, a two-stage outlier removal approach was employed. First, RANSAC filtering was applied during the stereo matching phase to eliminate unreliable feature correspondences, significantly improving the initial point cloud quality. Then, voxel filtering reduced the dataset to 2,944,767 points, thus optimizing computational efficiency while preserving essential spatial features. Further statistical outlier removal, using a nearest-neighbor approach (k = 30, standard deviation threshold = 1.0), refined the dataset to 2,669,318 points, representing a 12.9% reduction while ensuring the preservation of critical structural elements. To isolate tree-related points from other obstacles, a threshold-based spatial segmentation approach was implemented. This involved height thresholding at 0.5 m to identify vertical structures and spatial filtering based on predefined regions where trees were positioned in our experimental setup. This method efficiently distinguishes tree structures from other environmental elements. Within this filtered dataset, 84,769 points were identified as corresponding to the trees while 449,376 points were attributed to other obstacles, including furniture and structural elements. The system captured an average of 11,995 points per tree, thereby providing a sufficiently high level of detail for precise modeling and structural analysis of indoor vegetation. Table 4 provides a comprehensive summary of the point cloud data processing pipeline for both the indoor and outdoor environments, highlighting the efficiency of the filtering and refinement techniques applied.
Figure 7a presents a detailed reconstruction of the indoor environment that captured structural features such as walls and furniture. While this dense mapping provides valuable spatial insights, further segmentation techniques could enhance clarity and reduce data redundancy. Figure 7b illustrates the initial high-density point clouds for the trees before voxel filtering; distinguishing individual trees was challenging due to noise and overlapping points. After voxel filtering, Figure 7c reveals significant improvements in clarity, with better-defined tree structures.
The outdoor environment mapping generated an initial point cloud consisting of 2,119,222 points. After voxel filtering, the dataset was reduced to 2,046,906 points, followed by outlier removal, which further refined the point cloud to 1,877,329 points, representing an 11.4% reduction while preserving critical structural details. A detailed analysis of individual trees revealed significant variability in point density, with an average of 4053 (±1396) points per tree. The point distribution ranged from 1227 to 6721 points per tree, reflecting variations in viewing angles and occlusions during data collection.
Figure 8 presents comprehensive visualization of the 3D point cloud results from multiple perspectives. Figure 8a provides a top-down view, illustrating the overall terrain structure and tree distribution across the test site, highlighting their spatial arrangement. Figure 8b shows an elevation perspective capturing the structural details of individual trees and their alignment within the landscape to facilitate the height and spatial consistency analysis. Figure 8c illustrates structural clarity by displaying the trees in a staggered formation, thereby showing the reinforcement of their relative positioning within the terrain for improved depth perception. These multiple viewpoints provide a detailed environmental representation that contributes to high-precision 3D mapping, terrain modeling, and autonomous navigation applications. In addition, advanced filtering techniques such as voxel downsampling and outlier removal can be applied to further enhance clarity and improve the computational efficiency for downstream processing.

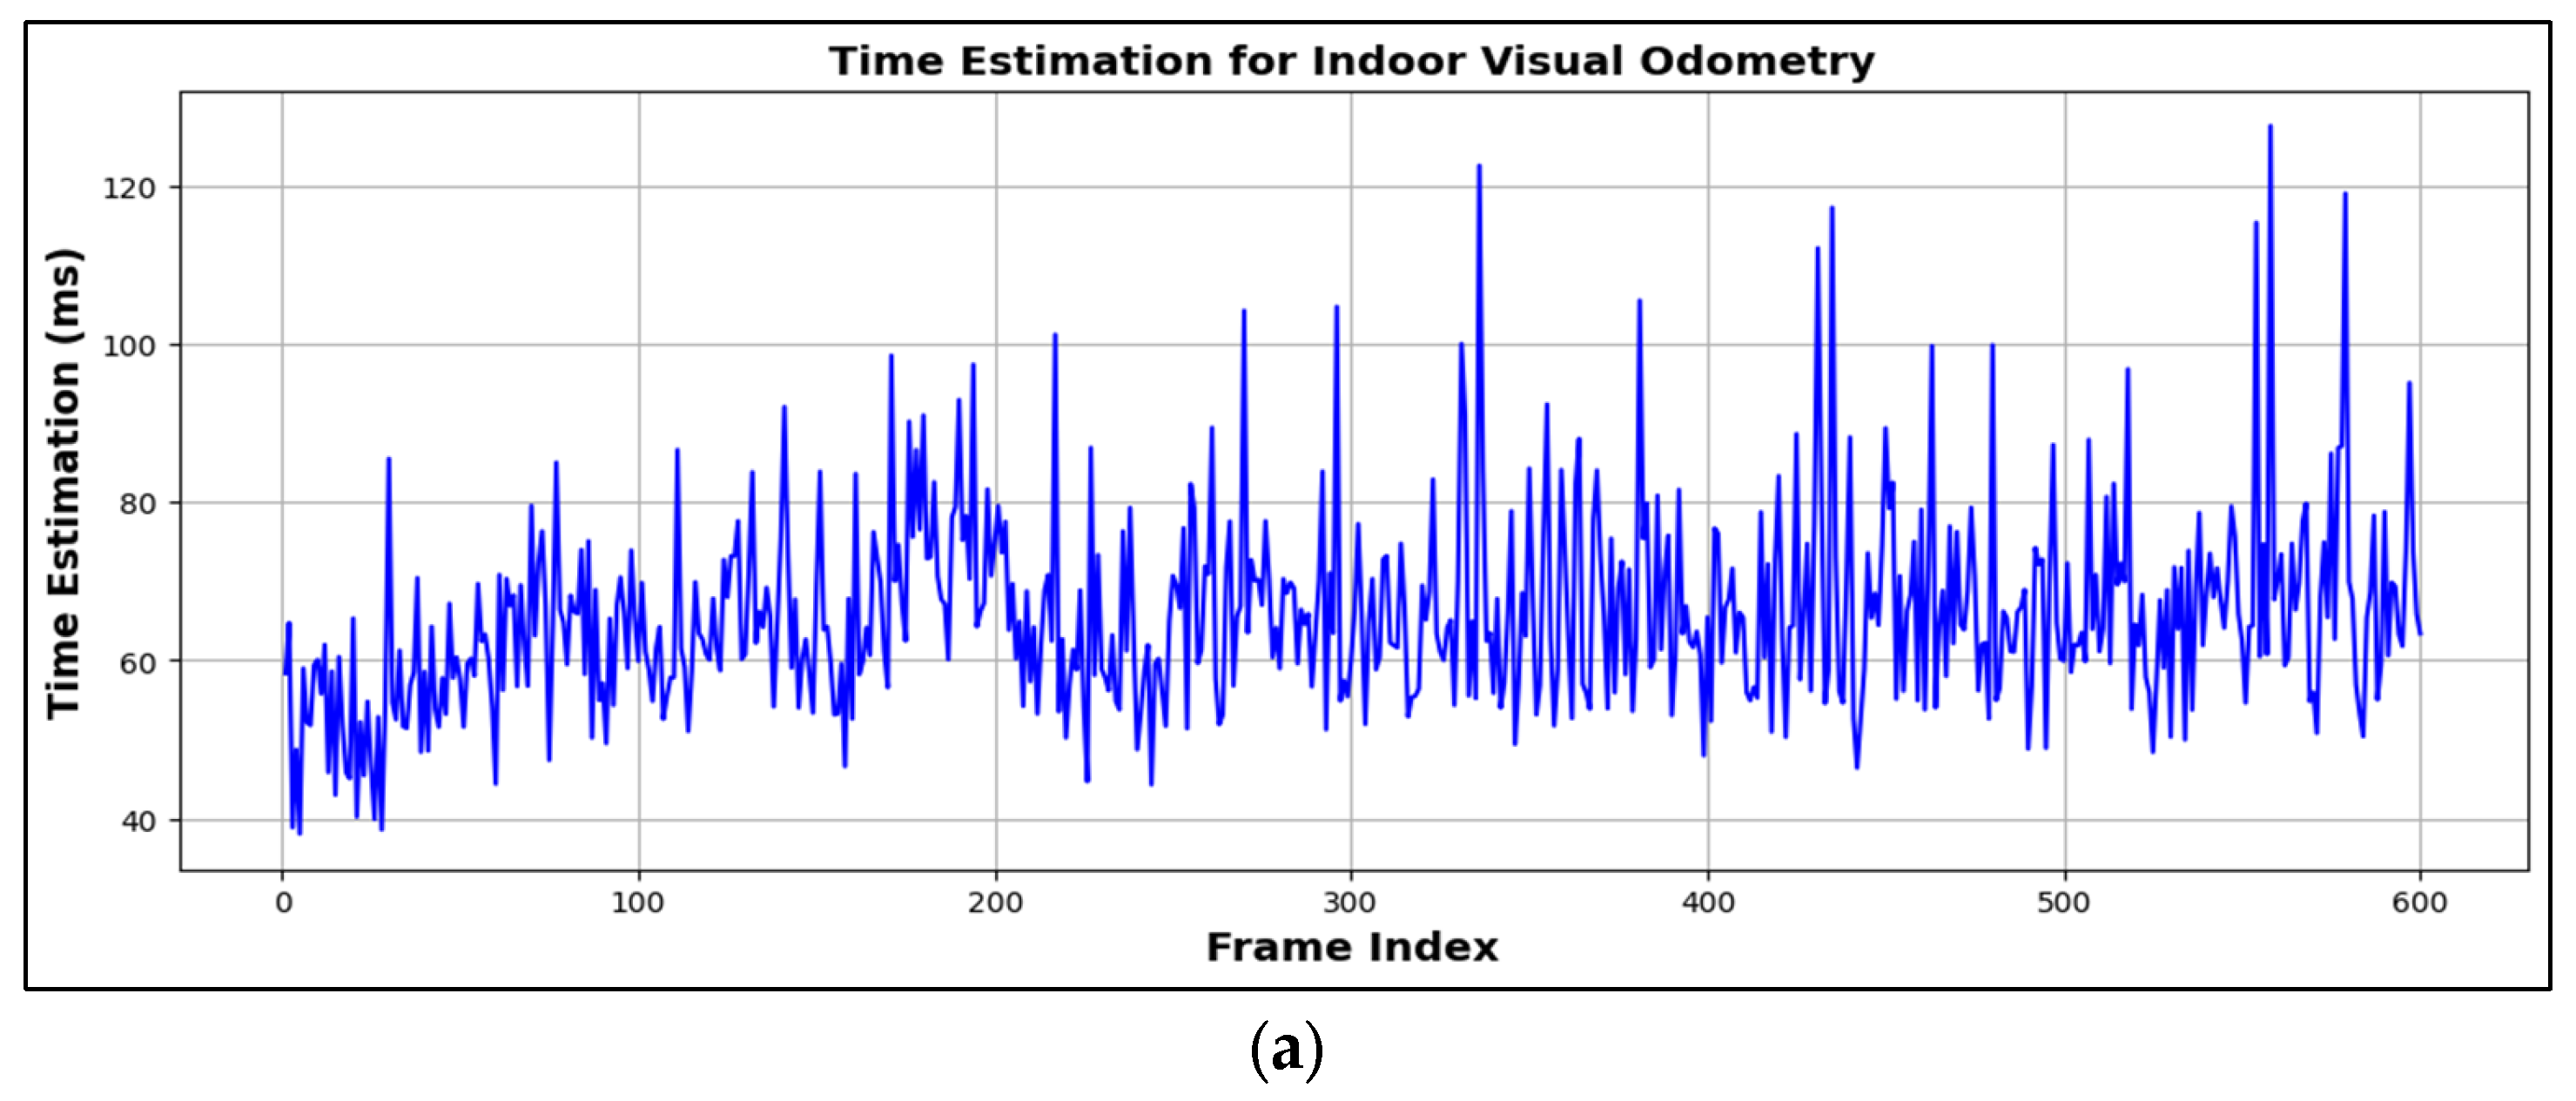
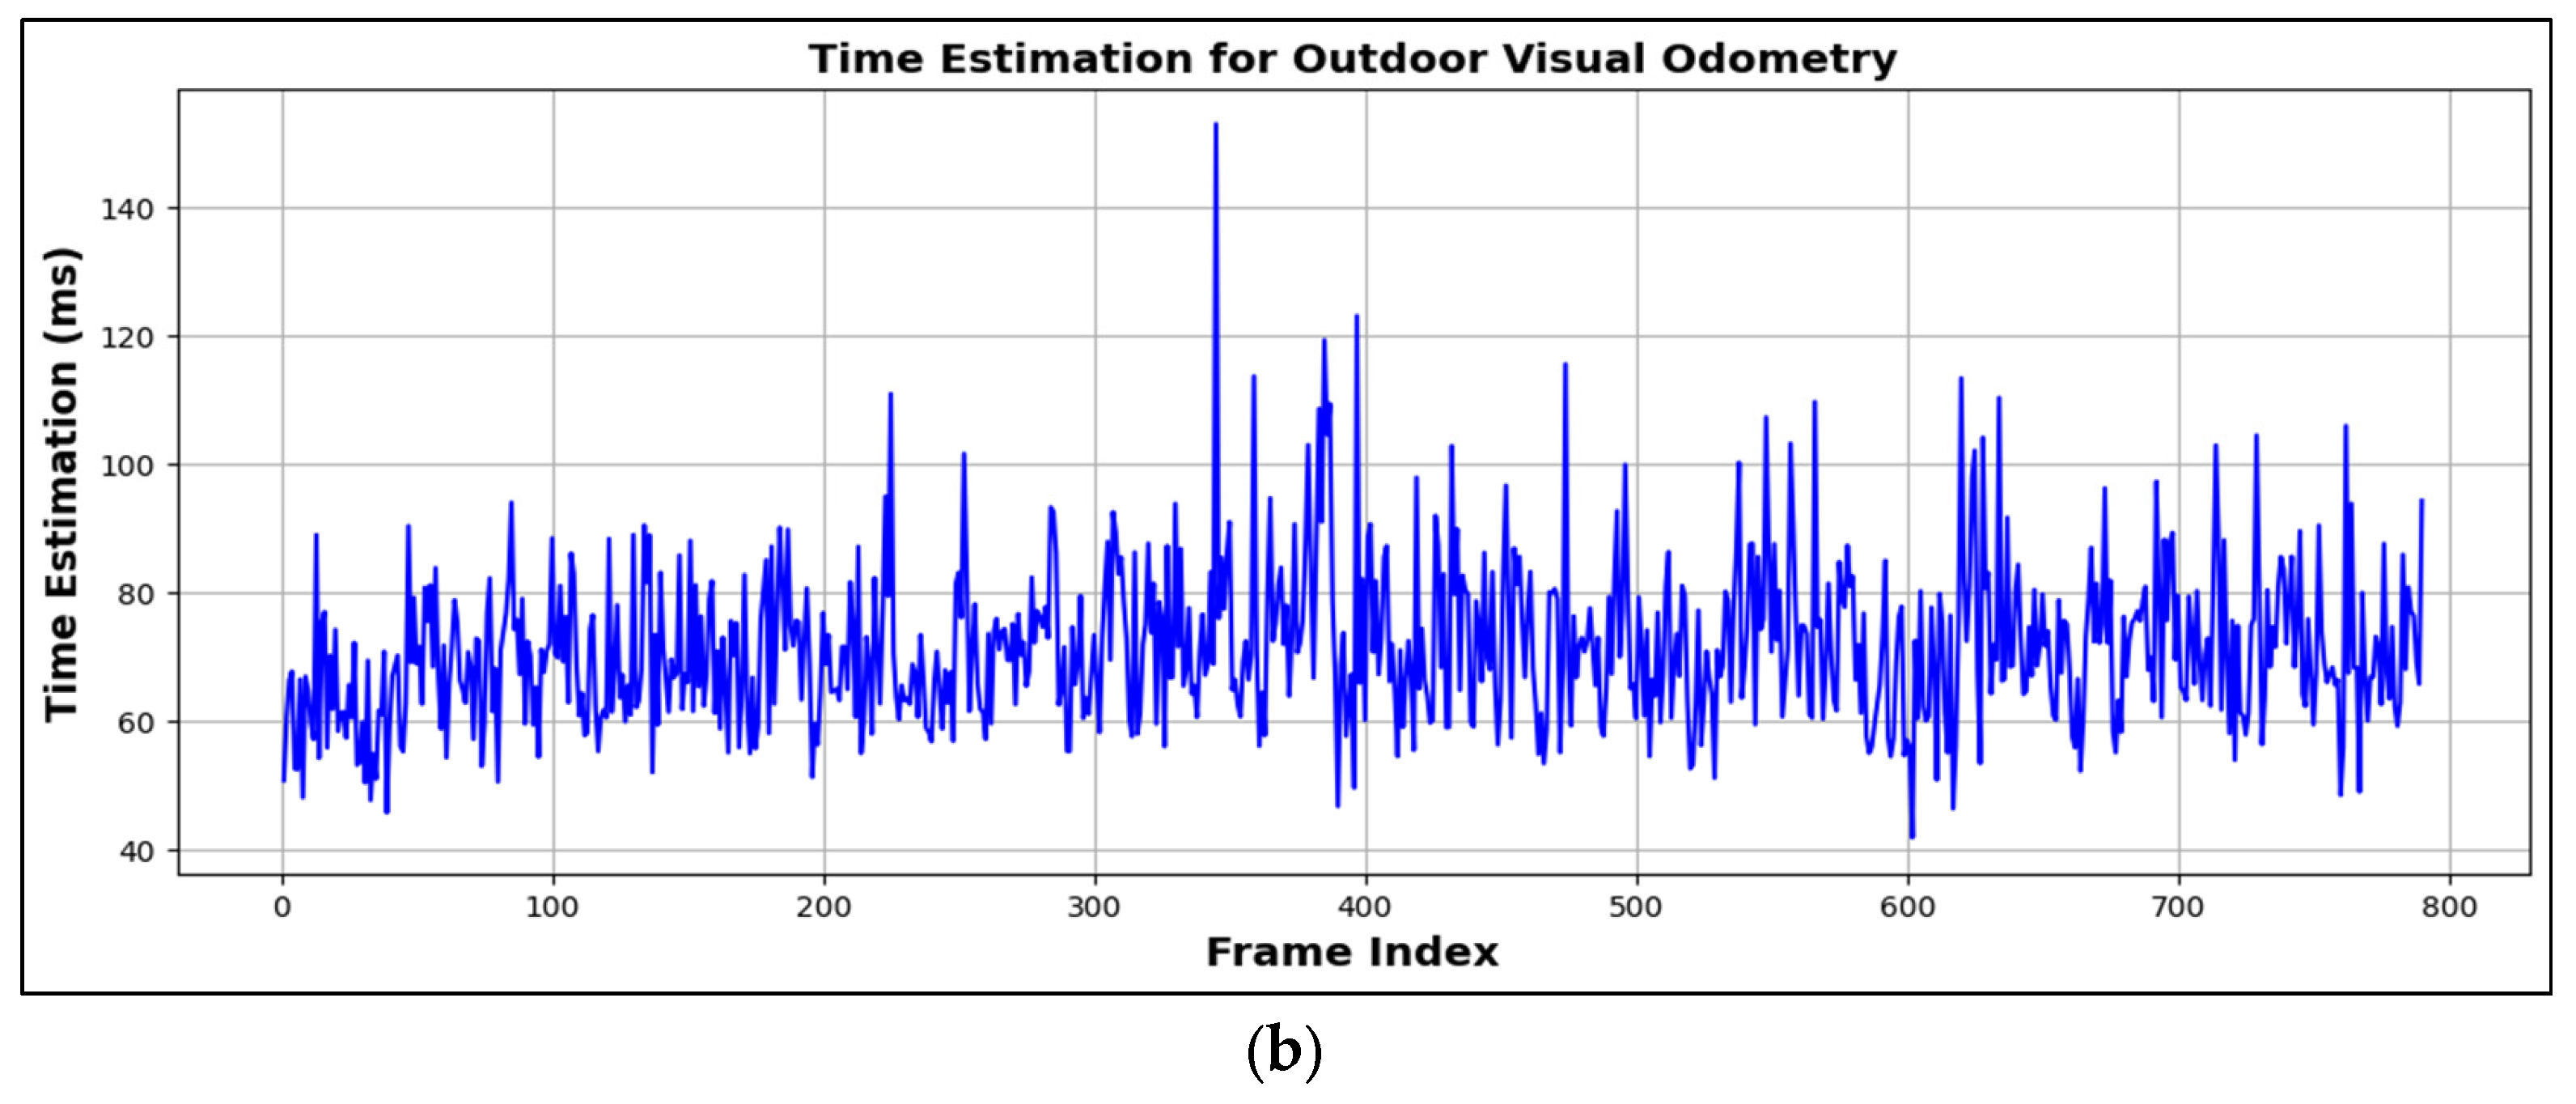
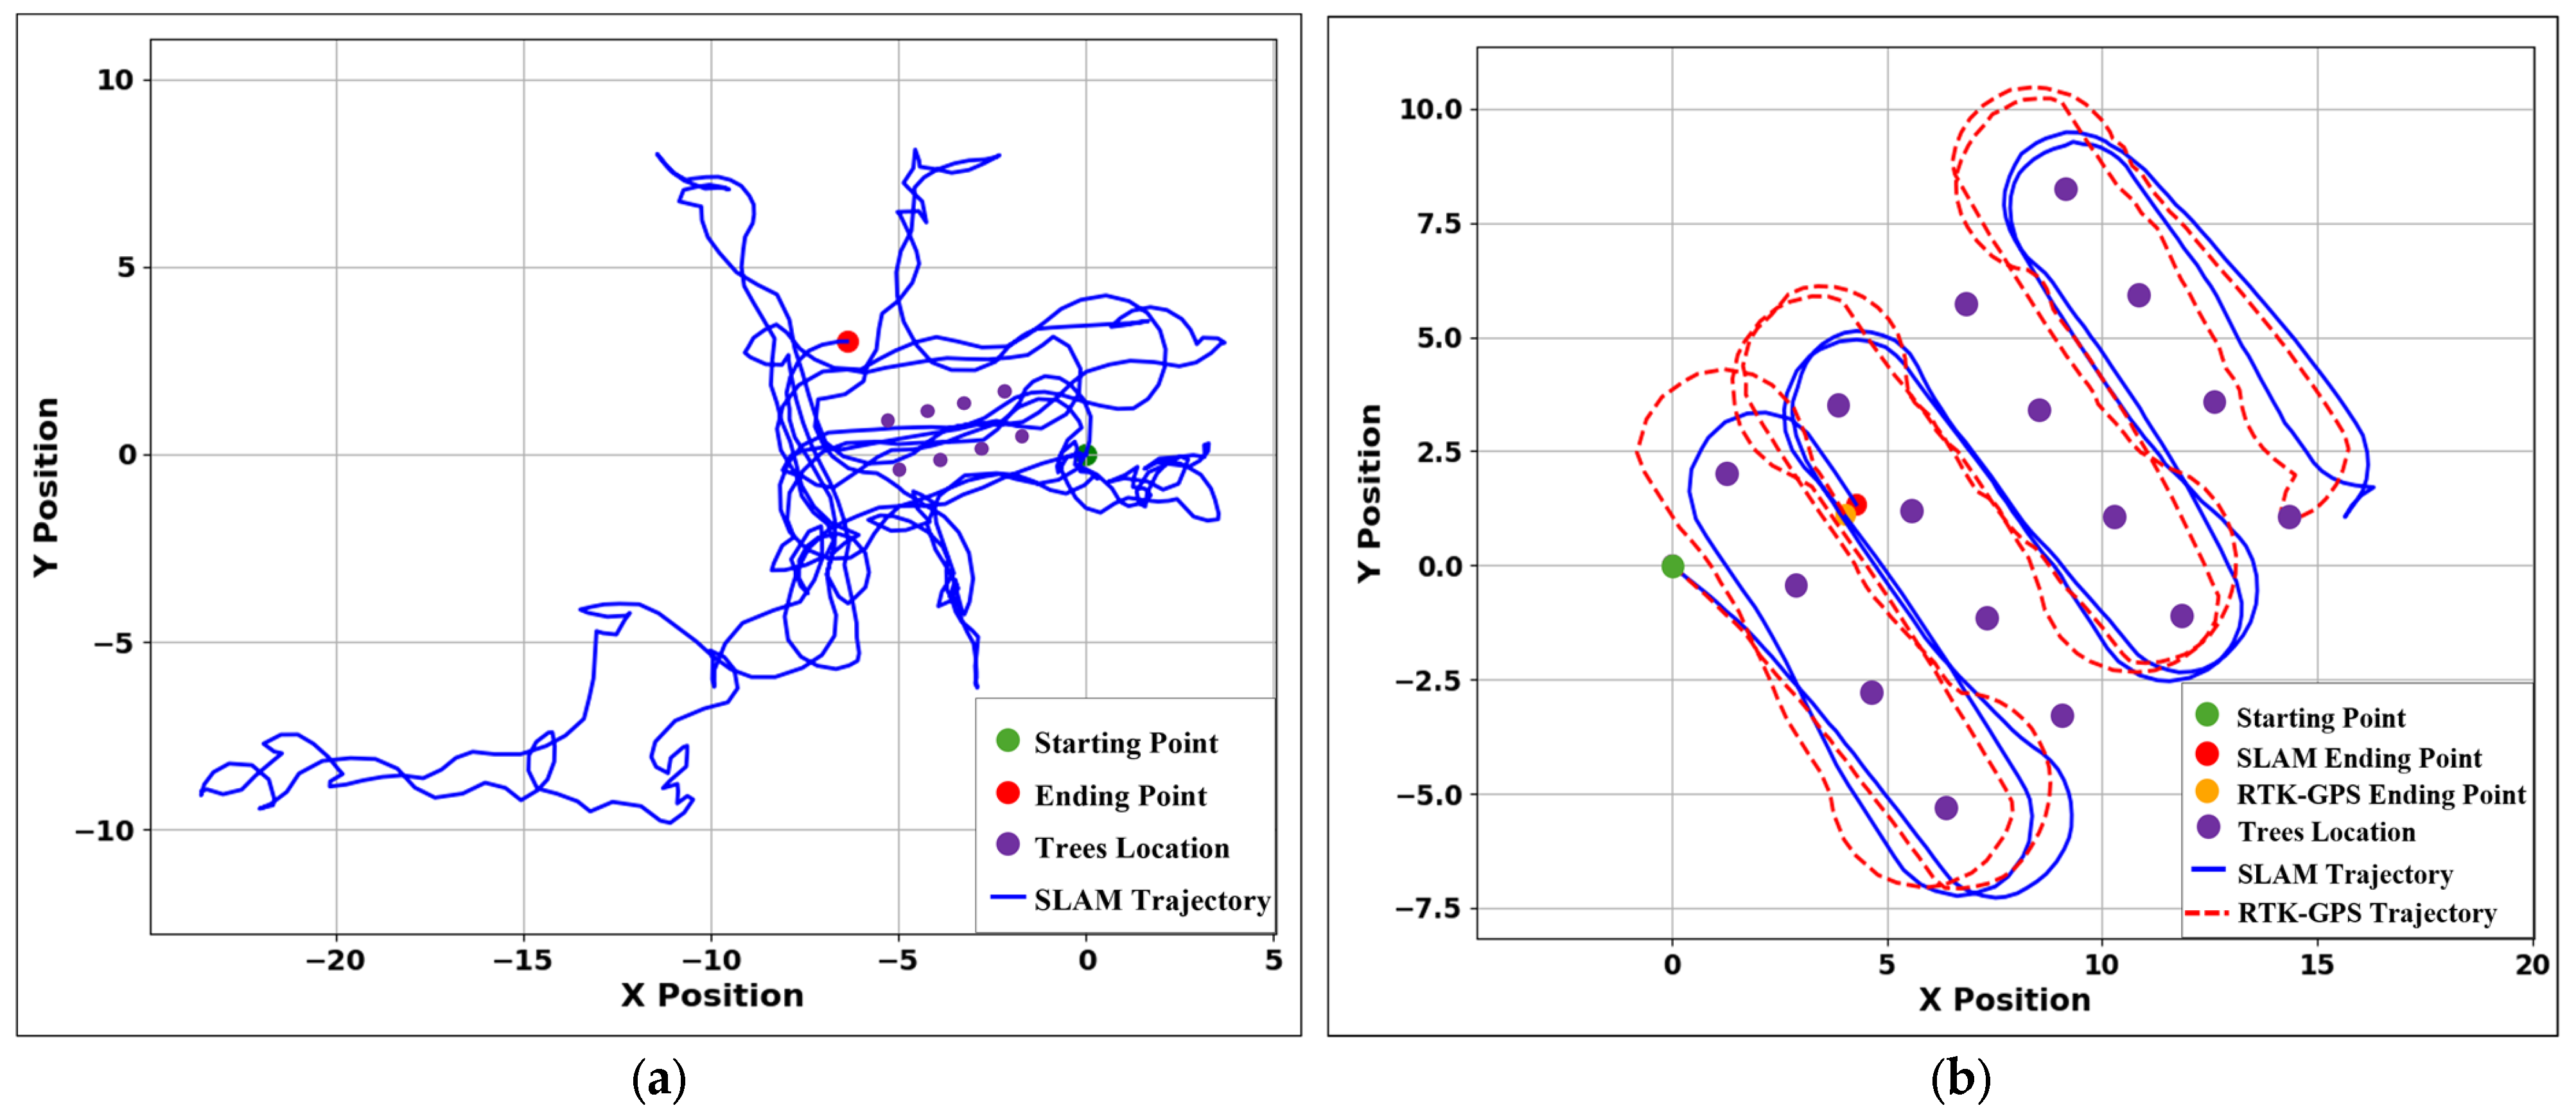
3.4. Visual Odometry Trajectory and Time Estimation

For indoor mapping, the stereo odometry-based SLAM system was deployed in a structured environment under controlled lighting conditions. The system utilizing RTAB-Map with a processing rate of 2 Hz was tested in an indoor area of 660 m2. The resulting indoor trajectory in Figure 9a depicts the estimated path, covering a total distance of 314.84 m and generating 679 poses during the mapping process. The optimization process was completed in 0.483 s, thus demonstrating efficient computational performance. However, odometry drift and localization errors were observed in regions with limited visual features, such as plain walls or textureless surfaces. To mitigate this issue, the robot was guided through feature-rich areas to ensure stable tracking and localization. For outdoor mapping, experiments were conducted in an environment comprising 4 × 4 artificial trees, with the RTK-GPS data serving as the ground truth for trajectory validation. The total mapped area was 625 m2, with the robot traversing a total distance of 136.233 m and generating 420 poses during the mapping process. The trajectory optimization was completed in 0.098 s, thereby indicating efficient performance under the outdoor environmental conditions. As shown in Figure 9b, the estimated SLAM trajectory was compared with the RTK-GPS trajectory; there were larger deviations in the outdoor results, likely influenced by environmental factors such as uneven terrain, lighting variations, and occlusions, which impacted feature extraction and tracking accuracy. These findings highlight the challenges of using visual odometry in unstructured environments and emphasize the need for robust SLAM algorithms, strategic feature selection, and sensor fusion to enhance localization accuracy and ensure reliable autonomous navigation.
The computational efficiency of the visual odometry system was evaluated by analyzing the processing time per frame for pose estimation across different environments. Figure A1a,b (see Appendix A) present the time estimation results for indoor and outdoor scenarios, respectively. In the indoor environment, the system exhibited consistent processing times, averaging 65.3 ms per frame, with 90% of frames processed within the 40–120 ms range. In contrast, the outdoor environment demonstrated greater temporal variability, with an average processing time of 73.8 ms per frame and a broader range of 30–150 ms. This increased variation was primarily attributed to the dynamic lighting conditions, feature-scarce terrain, and external disturbances, which imposed a higher computational overhead for feature extraction and matching. These findings underscore the impact of environmental complexity on visual odometry performance and emphasize the importance of robust feature selection, adaptive processing techniques, and efficient optimization strategies to maintain computational efficiency across diverse operating conditions. To assess the accuracy of the outdoor visual odometry system, multiple error metrics were analyzed, as illustrated in Figure A2 (see Appendix A). The absolute pose error (APE) was evaluated to quantify translational accuracy and provide insights into deviations between the estimated and ground-truth trajectories. The results of the APE analysis reveal a maximum deviation of 1.1281 m from the ground-truth trajectory, with a mean error of 0.0979 m. Moreover, an RMSE of 0.9854 m indicates consistent performance across the trajectory, while the standard deviation of 0.1113 m suggests minimal error distribution. In addition, the sum of squared errors (SSEs) computed at 458.3559 m2 provides a cumulative measure of system deviation over the entire trajectory. Notably, the APE distribution exhibits a bimodal pattern, with peaks at approximately 0.9 m and 1.1 m. This pattern arises primarily from row transition dynamics, where rapid heading changes create challenging conditions for visual feature tracking. These peaks correspond to sharp turns, where feature correspondence degrades, and motion estimation becomes less reliable due to the increased rate of visual change between consecutive frames. These metrics demonstrate that 85% of position estimates were accurate to within a meter, with larger deviations primarily occurring at sharp turns and in regions with rapidly changing environmental conditions. Furthermore, statistical metrics were computed to quantify the overall system performance, thereby providing a comprehensive error analysis and highlighting the system’s accuracy, consistency, and potential sources of deviation, a summary of which is provided in Table 5. These findings emphasize the importance of robust feature extraction, motion compensation, and adaptive error correction techniques to further enhance odometry accuracy in dynamic outdoor environments.

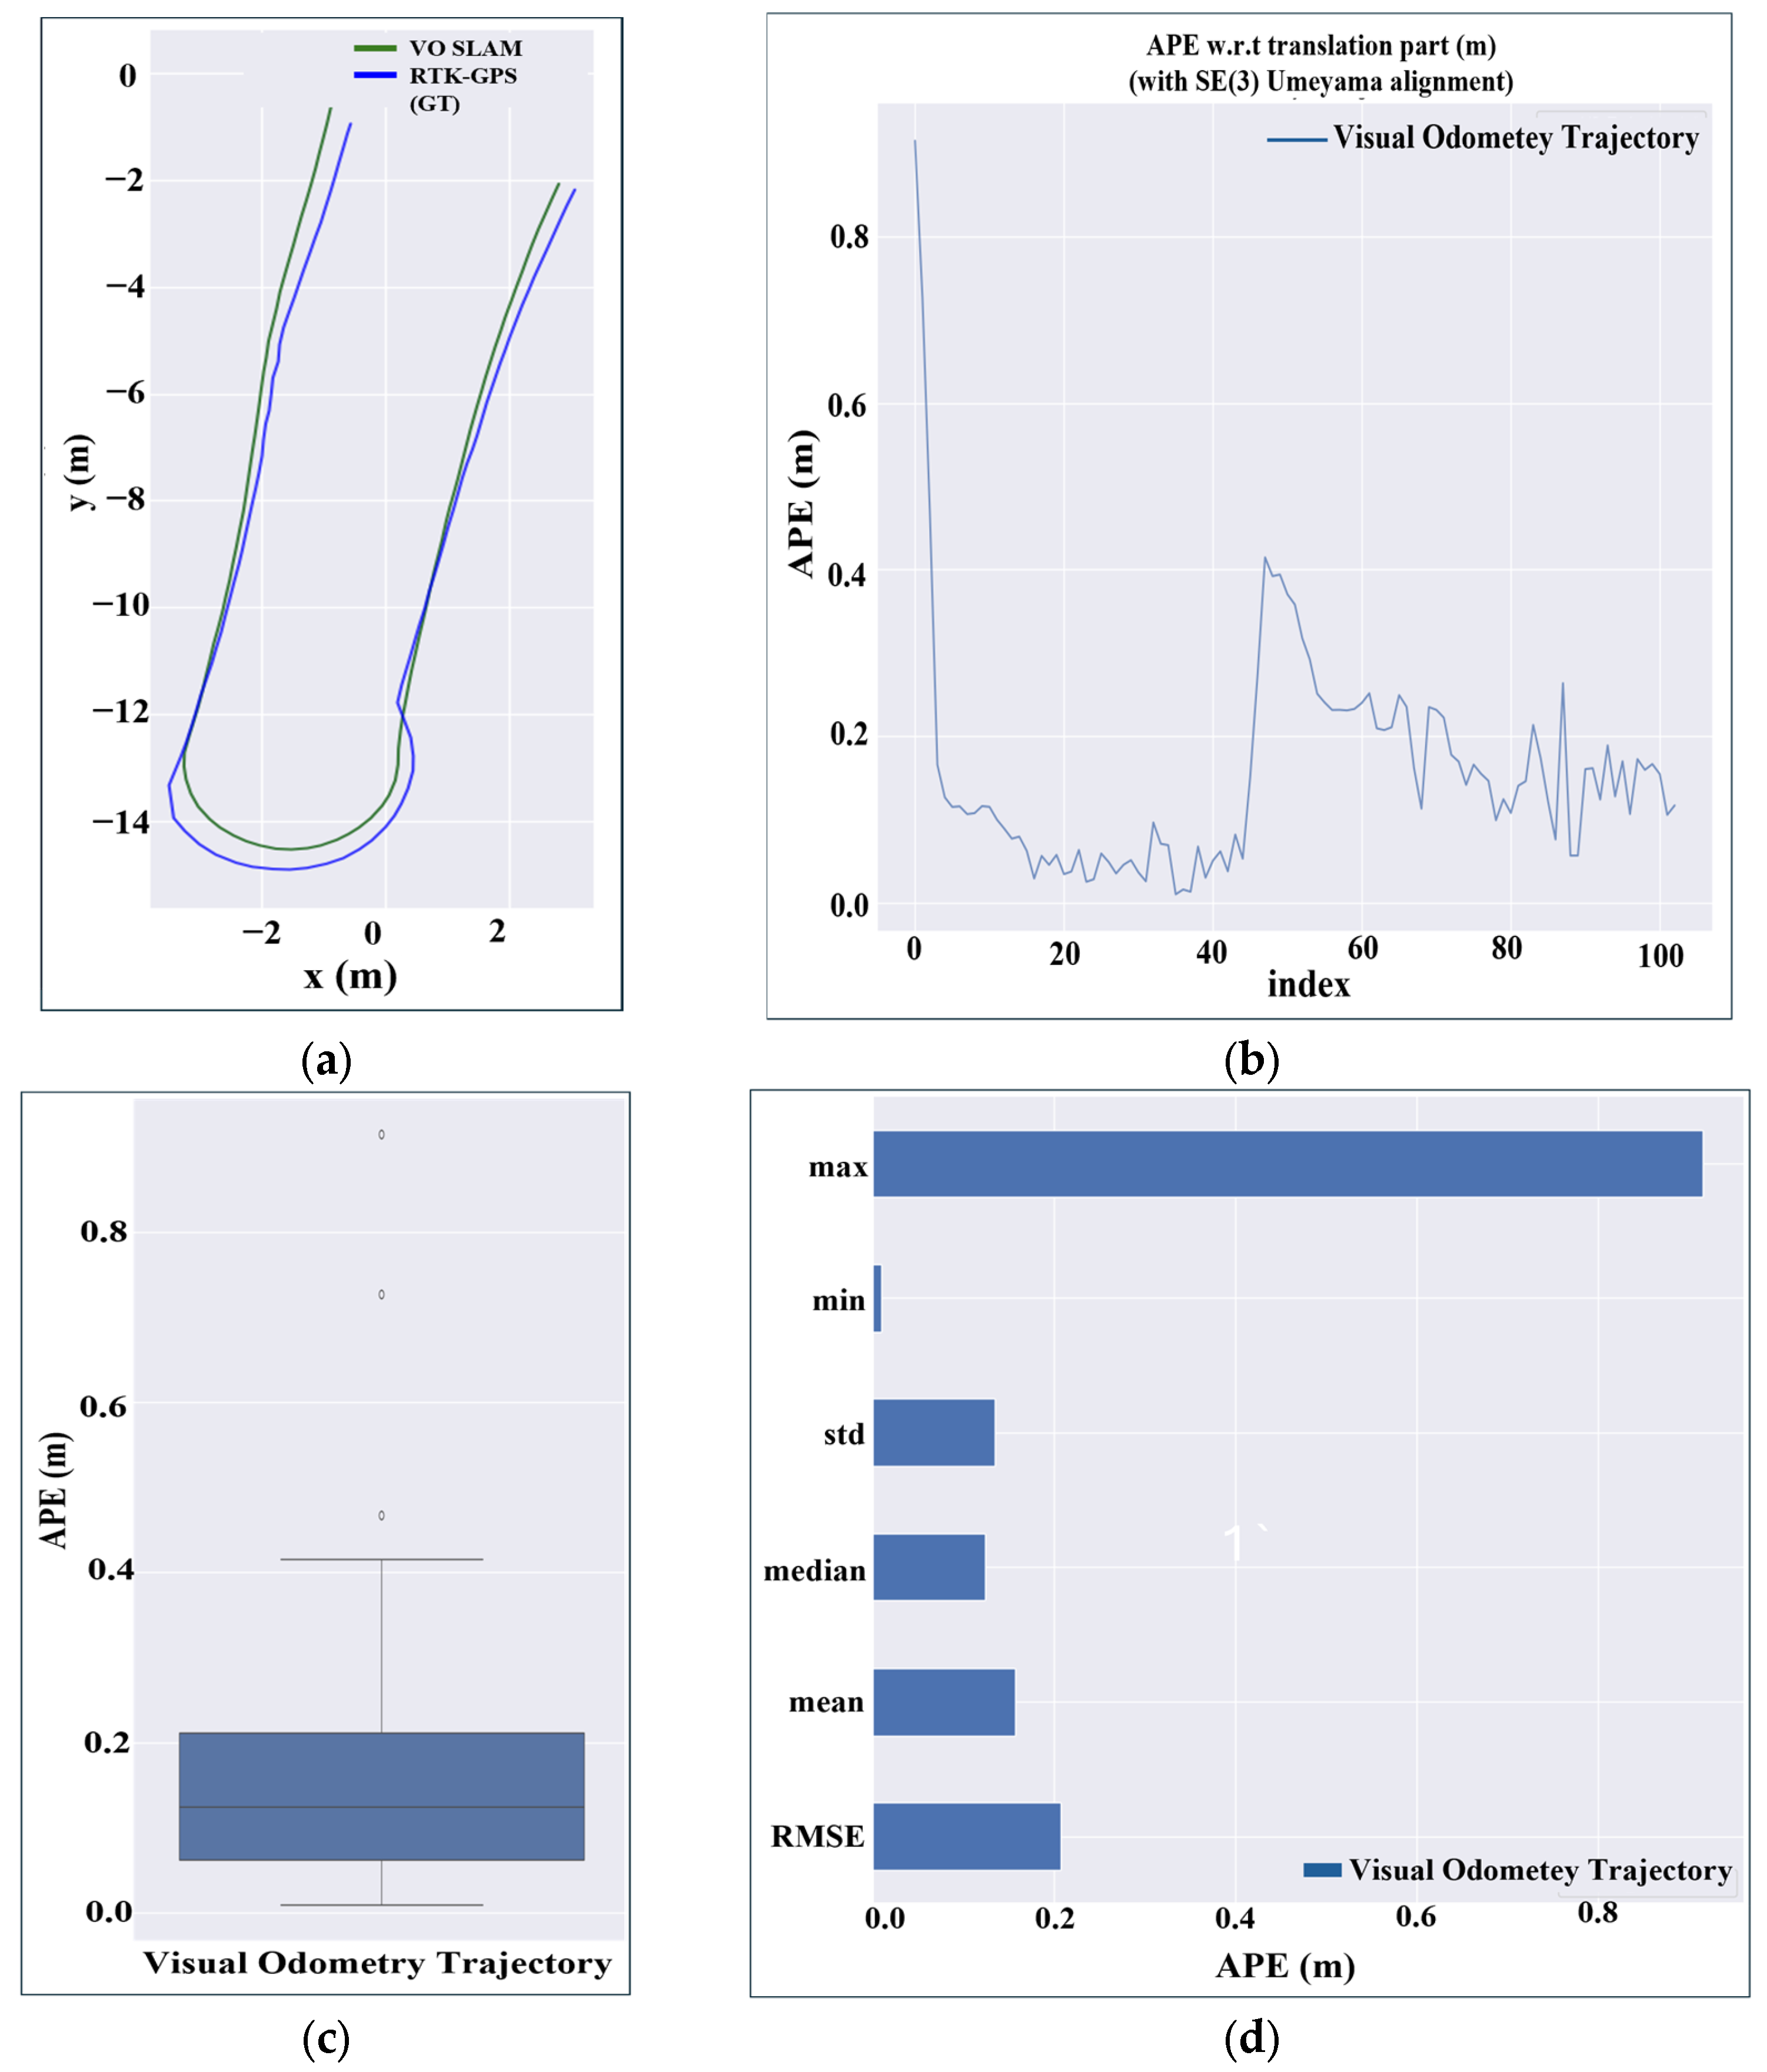
3.5. Localization Accuracy Test

In the present study, the system employed RTAB-Map for SLAM while focusing on three key reference points, as illustrated in Figure 10, which are the starting point, the turning point, and the path between trees.
Initially, the robot was positioned at an unknown location within the mapped environment. To enable loop closure, which verifies successful self-localization, the robot was prompted to perform small movements, thereby allowing the system to recognize and update its position within the map. Once localization had been established, the robot navigated between rows using a remote controller by following predefined paths. The initial mapping was conducted in the morning (around 11:00 a.m.) under optimal lighting conditions to maximize the capture of visual features at all critical points. Special attention was given to the turning point, where multiple viewing angles were recorded to enhance the feature database, thus ensuring reliable localization during turns (a known challenge in visual odometry).
To systematically evaluate the robustness of the system, nine trials were conducted in the morning and evening on the same and next days at various robot speeds (Table 6). During the morning trial, the system exhibited consistent localization accuracy across all three critical points and achieved a 100% success rate at speeds of up to 1.0 m/s. Performance variation was seen in the evening trial, particularly at the turning point. While localization remained stable at 0.3 m/s, it declined to 75% at 0.5 m/s and further dropped to 45% at 1.0 m/s (see morning trial at 0.5 m/s https://youtu.be/3N0YJS1Mdy0 (accessed on 23 January 2025)). In contrast, localization at the starting point and the path between the trees remained reliable (>95% success rate) across all tested speeds. In the next-day testing, the system demonstrated temporal stability, with successful localization at the starting point and the path between the trees across all tested speeds. Although the reliability at the turning point remained strong up to 0.5 m/s, this decreased by 40% at 1.0 m/s, thus suggesting sensitivity to environmental changes over time. These trials provided valuable insights into the capabilities and limitations of the system under varying operational conditions, thus emphasizing the importance of robust feature extraction, adaptive localization strategies, and environmental adaptability for reliable autonomous navigation in dynamic orchard environments.
To assess the accuracy of the proposed system, the estimated visual odometry trajectory was compared against the RTK-GPS ground-truth trajectory (Figure A3a, Appendix A). The close alignment of the two trajectories confirms the system’s effectiveness in maintaining accurate localization within the orchard environment. As presented in Figure A3b, the APE, used to provide a quantitative assessment of localization performance, initially peaked at approximately 0.91 m before gradually stabilizing; this indicates the system’s ability to refine its pose estimation over time through loop closure and map optimization. As depicted in Figure A3c, the statistical distribution of the APE values further validates the system’s accuracy, with most errors remaining below 0.2 m. A few outliers were observed, likely resulting from insufficient mapping of feature-scarce regions, temporary occlusions, and motion-induced uncertainties affecting the visual odometry. A summary of key error metrics presented in Figure A3d highlights a mean APE of 0.1574 m, a median of 0.1243 m, and an RMSE of 0.2075 m. The standard deviation of 0.14 m and a total SSE of 4.43 m2 further quantify both the variability and overall magnitude of errors, respectively, providing evidence for the system’s excellent stability across different conditions. These results demonstrate high localization accuracy, reinforcing the feasibility of SLAM-based localization as a viable alternative to RTK-GPS in structured agricultural environments. However, further refinements, such as IMU sensor fusion and adaptive feature selection, could enhance performance, particularly in feature-deprived areas or during highly dynamic maneuvers, thereby ensuring greater robustness for real-world deployment.

4. Discussion

Accurate mapping and localization for autonomous robots in orchard environments present significant challenges due to the complexity of natural surroundings. This study demonstrated the effectiveness of stereo visual odometry combined with RTAB-Map SLAM in generating globally consistent maps for autonomous navigation, emphasizing the importance of robust visual feature detection. The ORB algorithm was employed for keypoint extraction across stereo images, similar to the AGRI-SLAM system [23]. While previous implementations have been reported to struggle with uniform feature distribution in densely vegetated areas (with distribution inconsistencies reaching 28%), our octree-based structure significantly improved performance, particularly in fine-textured agricultural settings, challenging previous evaluations of ORB-SLAM2 and stereo-DSO [25]. However, repetitive patterns and sudden illumination changes occasionally disrupted feature matching, leading to localization errors. The integration of stereo depth information with optical flow estimation enhanced feature robustness, particularly by stabilizing tracking under sudden lighting variations. The depth measurements from stereo vision enabled more reliable feature matching compared to monocular approaches, contributing to improved pose estimation under diverse lighting conditions. In the present study, optical flow estimation and stereo matching, with tracking feature displacement using the Lucas–Kanade method, were integrated to enhance feature robustness. This approach refined incremental pose estimation to a level similar to that of the hawk-eye-inspired algorithm [24]. Furthermore, our implementation uniquely combined RANSAC outlier rejection with adaptive feature thresholding, ensuring that only reliably extracted features contributed to depth estimation. Unlike conventional static thresholding approaches, our method dynamically adjusted to changing environmental conditions, resulting in significantly improved localization stability.
Mapping in feature-scarce regions (e.g., smooth walls and repetitive textures) often leads to odometry failures. The implementation of loop-closure detection significantly improved localization accuracy by reinforcing map consistency, though minor drift persisted in finely textured areas. Previous studies have highlighted mapping challenges in fine-textured indoor settings [47], whereas our loop-closure detection approach improved localization accuracy to 0.03 m in structured environments. Outdoor mapping benefited from distinct natural features, which enhanced feature tracking and odometry stability. Unlike extended Kalman filter (EKF)-based localization [48], which relies on fixed laser sensors and wheel encoders for positioning without GPS, our system dynamically constructs real-time maps using stereo vison and SLAM, leveraging natural environmental features without requiring additional infrastructure. Furthermore, while EKF-based methods require additional sensor integration, our system operates with only a single camera, an IMU, and loop-closure detection, to ensure robust real-time localization while reducing reliance on manually mapped environments. Beyond technical advantages, our stereo SLAM approach offers significant cost benefits. The stereo camera setup is considerably more affordable than multi-line LiDAR systems while delivering comparable mapping performance. Additionally, stereo cameras consume less power, require minimal maintenance, and have lower long-term operational costs. Unlike geometric-only mapping approaches, which often struggle in repetitive environments, camera-based systems enable robust loop-closure detection through distinctive visual feature matching, ensuring superior map consistency. These economic and functional advantages make our approach particularly well-suited for agricultural deployments, where cost-effectiveness is a key factor in practical implementation.
The integration of an IMU sensor further improved mapping accuracy by incorporating gravity constraints, which aligned pose estimation with the vertical axis, reducing drift in regions with insufficient visual cues. Unlike tightly coupled sensor fusion approaches such as VINS-fusion and LIO-SAM [49,50,51], which increase computational complexity, our loosely coupled IMU integration with stereo visual odometry simplifies the fusion process while maintaining competitive mapping accuracy. This approach achieved 0.018 m accuracy outdoors and 0.03 m indoors, even in challenging, feature-sparse orchard environments. Previous research has shown that IMU-SLAM integration can reduce RMSE from 1.8 cm to 1.3 cm [52]. Our implementation also incorporated pose graph optimization using GTSAM, which ensured global consistency, further refining the SLAM trajectory. Outdoor mapping demonstrated exceptional accuracy, achieving an RMSE of 0.2075 m, representing a significant improvement over visual-only approaches. This study successfully demonstrated the effectiveness of stereo visual odometry and RTAB-Map SLAM for mapping and localization in both indoor and outdoor orchard environments. The results highlight the critical role of adaptive feature extraction, IMU constraints, and graph-based optimization in improving SLAM performance. Further advancements in semantic mapping, AI-driven feature detection, and multi-sensor fusion will further enhance autonomous navigation, making it more reliable and efficient for agricultural applications.

5. Conclusions

The findings of this study demonstrate the effectiveness of integrating stereo visual odometry and RTAB-Map SLAM for autonomous mapping and localization in both indoor and outdoor orchard environments. The fusion of stereo visual odometry with RTAB-Map SLAM significantly improved mapping accuracy, achieving average localization errors of 0.018 m outdoors and 0.03 m indoors. By incorporating IMU data as a gravity constraint within the SLAM framework, pose estimation was refined and drift was substantially reduced, resulting in a consistent RMSE of 0.2075 m across all trials. The system produced high-quality 3D point cloud representations, with filtered point clouds reduced by 12.9% indoors and 11.4% outdoors, while maintaining detailed tree structures for precise environmental modeling. The mapping and localization system exhibited robust performance in loop-closure detection and relocalization under varying speeds and environmental conditions. It performed optimally in morning trials, maintaining high reliability at starting points and along paths between trees. The implementation of ORB with advanced octree-based feature detection and Lucas–Kanade tracking ensured an efficient frame processing time of 65.3 ms indoors and 73.8 ms outdoors, effectively handling changing illumination and complex environmental features. This study provides critical insights into developing robust autonomous navigation systems for agricultural applications by addressing the unique challenges of orchard environments while advancing precision agriculture technologies. Future research should focus on extending this framework by integrating an autonomous navigation algorithm with a variable-rate spraying system. The enhancement would enable optimized pesticide and water usage based on tree proximity and size, further improving efficiency and sustainability in agricultural robotics.

Author Contributions

Supervision: X.H.; methodology: I.H. and X.H.; software: I.H.; resources: I.H., X.H. and J.-W.H.; validation: I.H.; conceptualization: I.H. and X.H.; formal analysis: I.H.; data curation: I.H.; writing—original draft: I.H.; writing—review and editing: X.H. and J.-W.H.; visualization: X.H.; project administration: X.H.; funding acquisition: X.H. All authors have read and agreed to the published version of the manuscript.

Funding

This work was supported by the Institute of Information & Communications Technology Planning & Evaluation (IITP)-Innovative Human Resource Development for Local Intellectualization program grant funded by the Korea government (MSIT) (IITP-2025-RS-2023-00260267).

Institutional Review Board Statement

Not applicable.

Data Availability Statement

The original contributions presented in this study are included in the article. Further inquiries can be directed to the corresponding author.

Conflicts of Interest

Author Jong-Woo Ha was employed by the company HADA Co., Ltd. The remaining authors declare that the research was conducted in the absence of any commercial or financial relationships that could be construed as a potential conflict of interest.

Abbreviations

The following abbreviations are used in this manuscript:
SLAMSimultaneous Localization and Mapping
GPSGlobal Positioning System
RTAB-MapReal-Time Appearance Based-Mapping
IMUInertial Measurement Unit
CANController Area Network
FOVField of View
DFOVDisplay Field of View
HFOVHorizontal Field of View
VFOVVertical Field of View
ORBOriented FAST and Rotated BRIEF
6-DOF6 Degree of Freedom
RTKReal-Time Kinematic
MAEMean Absolute Error
RMSERoot Mean Square Error
APEAbsolute Pose Error
SSESum of Squared Errors
RANSACRANdom SAmple Consensus
ROSRobot Operating System
GTSAMGeorgia Tech Smoothing and Mapping

Appendix A

Figure A1. Comparative analysis of visual odometry computation time in different environments. (a) Indoor setting and (b) outdoor setting, illustrating processing time variations across different conditions.
Agriculture 15 00872 g0a1aAgriculture 15 00872 g0a1b
Figure A2. Comparison of SLAM trajectory with ground-truth GPS data: (a) absolute pose error (APE) variation over time, (b) APE distribution represented as a density plot, (c) residual error (RES) illustrated as a bar plot, and (d) RES summarized in a box plot.
Agriculture 15 00872 g0a2
Figure A3. Comparison of localization accuracy between the proposed SLAM system and ground truth: (a) motion trajectory analysis in the X-Y plane, (b) APE variation over time, (c) RES represented as a box plot, and (d) RES illustrated as a bar plot.
Agriculture 15 00872 g0a3

References

  1. Karunathilake, E.M.B.M.; Le, A.T.; Heo, S.; Chung, Y.S.; Mansoor, S. The Path to Smart Farming: Innovations and Opportunities in Precision Agriculture. Agriculture 2023, 13, 1593. [Google Scholar] [CrossRef]
  2. Rehman, A.U.; Alamoudi, Y.; Khalid, H.M.; Morchid, A.; Muyeen, S.M.; Abdelaziz, A.Y. Smart Agriculture Technology: An Integrated Framework of Renewable Energy Resources, IoT-Based Energy Management, and Precision Robotics. Clean. Energy Syst. 2024, 9, 100132. [Google Scholar] [CrossRef]
  3. Vinod, C.S.S.; Anand, H.S.; Albaaji, G.F. Precision Farming for Sustainability: An Agricultural Intelligence Model. Comput. Electron. Agric. 2024, 226, 109386. [Google Scholar] [CrossRef]
  4. Yépez-Ponce, D.F.; Salcedo, J.V.; Rosero-Montalvo, P.D.; Sanchis, J. Mobile Robotics in Smart Farming: Current Trends and Applications. Front. Artif. Intell. 2023, 6, 1213330. [Google Scholar] [CrossRef]
  5. Bechar, A.; Vigneault, C. Agricultural Robots for Field Operations: Concepts and Components. Biosyst. Eng. 2016, 149, 94–111. [Google Scholar] [CrossRef]
  6. Keefe, R.F.; Wempe, A.M.; Becker, R.M.; Zimbelman, E.G.; Nagler, E.S.; Gilbert, S.L.; Caudill, C.C. Positioning Methods and the Use of Location and Activity Data in Forests. Forests 2019, 10, 458. [Google Scholar] [CrossRef]
  7. Ogunsina, M.; Efunniyi, C.P.; Osundare, O.S.; Folorunsho, S.O.; Akwawa, A.A. Advanced Sensor Fusion and Localization Techniques for Autonomous Systems: A Review and New Approaches. Int. J. Frontline Res. Eng. Technol. 2024, 2, 51–60. [Google Scholar] [CrossRef]
  8. Vélez, S.; Valente, J.; Bretzel, T.; Trommsdorff, M. Assessing the Impact of Overhead Agrivoltaic Systems on GNSS Signal Performance for Precision Agriculture. Smart Agric. Technol. 2024, 9, 100664. [Google Scholar] [CrossRef]
  9. Chakraborty, S.; Elangovan, D.; Govindarajan, P.L.; ELnaggar, M.F.; Alrashed, M.M.; Kamel, S. A Comprehensive Review of Path Planning for Agricultural Ground Robots. Sustainability 2022, 14, 9156. [Google Scholar] [CrossRef]
  10. Ding, H.; Zhang, B.; Zhou, J.; Yan, Y.; Tian, G.; Gu, B. Recent Developments and Applications of Simultaneous Localization and Mapping in Agriculture. J. Field Robot. 2022, 39, 956–983. [Google Scholar] [CrossRef]
  11. Jiang, X.; Yang, D.K.; Tian, Z.; Liu, G.; Lu, M. Single-Line LiDAR Localization via Contribution Sampling and Map Update Technology. Sensors 2024, 24, 3927. [Google Scholar] [CrossRef] [PubMed]
  12. Yue, X.; Zhang, Y.; Chen, J.; Chen, J.; Zhou, X.; He, M. LiDAR-Based SLAM for Robotic Mapping: State of the Art and New Frontiers. Ind. Robot. 2024, 51, 196–205. [Google Scholar] [CrossRef]
  13. Bala, J.A.; Adeshina, S.A.; Aibinu, A.M. Advances in Visual Simultaneous Localization and Mapping Techniques for Autonomous Vehicles: A Review. Sensors 2022, 22, 8943. [Google Scholar] [CrossRef] [PubMed]
  14. Cheng, J.; Zhang, L.; Chen, Q.; Hu, X.; Cai, J. A Review of Visual SLAM Methods for Autonomous Driving Vehicles. Eng. Appl. Artif. Intell. 2022, 114, 104992. [Google Scholar] [CrossRef]
  15. Wang, S.; Li, Y.; Sun, Y.; Li, X.; Sun, N.; Zhang, X.; Yu, N. A Localization and Navigation Method with ORB-SLAM for Indoor Service Mobile Robots. In Proceedings of the 2016 IEEE International Conference on Real-Time Computing and Robotics (RCAR), Angkor Wat, Cambodia, 6–10 June 2016; pp. 443–447. [Google Scholar]
  16. Xu, L.; Feng, C.; Kamat, V.R.; Menassa, C.C. An Occupancy Grid Mapping Enhanced Visual SLAM for Real-Time Locating Applications in Indoor GPS-Denied Environments. Autom. Constr. 2019, 104, 230–245. [Google Scholar] [CrossRef]
  17. Fang, B.; Mei, G.; Yuan, X.; Wang, L.; Wang, Z.; Wang, J. Visual SLAM for Robot Navigation in Healthcare Facility. Pattern Recognit. 2021, 113, 107822. [Google Scholar] [CrossRef]
  18. Yang, Y.; Tang, D.; Wang, D.; Song, W.; Wang, J.; Fu, M. Multi-Camera Visual SLAM for off-Road Navigation. Robot. Auton. Syst. 2020, 128, 103505. [Google Scholar] [CrossRef]
  19. Chen, W.; Shang, G.; Ji, A.; Zhou, C.; Wang, X.; Xu, C.; Li, Z.; Hu, K. An Overview on Visual SLAM: From Tradition to Semantic. Remote Sens. 2022, 14, 3010. [Google Scholar] [CrossRef]
  20. Wijayathunga, L.; Rassau, A.; Chai, D. Challenges and Solutions for Autonomous Ground Robot Scene Understanding and Navigation in Unstructured Outdoor Environments: A Review. Appl. Sci. 2023, 13, 9877. [Google Scholar] [CrossRef]
  21. Zhu, Y.; An, H.; Wang, H.; Xu, R.; Sun, Z.; Lu, K. DOT-SLAM: A Stereo Visual Simultaneous Localization and Mapping System with Dynamic Object Tracking Based on Graph Optimization. Sensors 2024, 24, 4676. [Google Scholar] [CrossRef]
  22. Ai, Y.; Sun, Q.; Xi, Z.; Li, N.; Dong, J.; Wang, X. Stereo SLAM in Dynamic Environments Using Semantic Segmentation. Electronics 2023, 12, 3112. [Google Scholar] [CrossRef]
  23. Islam, R.; Habibullah, H.; Hossain, T. AGRI-SLAM: A Real-Time Stereo Visual SLAM for Agricultural Environment. Auton. Robot. 2023, 47, 649–668. [Google Scholar] [CrossRef]
  24. Zhang, Z.; Chen, J.; Xu, X.; Liu, C.; Han, Y. Hawk-eye-inspired Perception Algorithm of Stereo Vision for Obtaining Orchard 3D Pointcloud Navigation Map. CAAI Trans. Intell. Technol. 2023, 8, 987–1001. [Google Scholar] [CrossRef]
  25. Li, W.; Chen, X.; Zeng, P.; Wen, Z.; Zhang, G.; Meng, W. Evaluation of ORB-SLAM2 and Stereo-DSO in Complex Indoor-Outdoor Scenes. In Proceedings of the 2023 IEEE 6th International Conference on Electronic Information and Communication Technology (ICEICT), Qingdao, China, 21 July 2023; pp. 1144–1148. [Google Scholar]
  26. Zhang, Y.; Sun, H.; Zhang, F.; Zhang, B.; Tao, S.; Li, H.; Qi, K.; Zhang, S.; Ninomiya, S.; Mu, Y. Real-Time Localization and Colorful Three-Dimensional Mapping of Orchards Based on Multi-Sensor Fusion Using Extended Kalman Filter. Agronomy 2023, 13, 2158. [Google Scholar] [CrossRef]
  27. Möller, R.; Furnari, A.; Battiato, S.; Härmä, A.; Farinella, G.M. A Survey on Human-Aware Robot Navigation. Robot. Auton. Syst. 2021, 145, 103837. [Google Scholar] [CrossRef]
  28. Argush, G.; Holincheck, W.; Krynitsky, J.; McGuire, B.; Scott, D.; Tolleson, C.; Behl, M. Explorer51—Indoor Mapping, Discovery, and Navigation for an Autonomous Mobile Robot. In Proceedings of the 2020 Systems and Information Engineering Design Symposium (SIEDS), Charlottesville, VA, USA, 24 April 2020; pp. 1–5. [Google Scholar]
  29. Yin, H.; Ma, Z.; Zhong, M.; Wu, K.; Wei, Y.; Guo, J.; Huang, B. SLAM-Based Self-Calibration of a Binocular Stereo Vision Rig in Real-Time. Sensors 2020, 20, 621. [Google Scholar] [CrossRef]
  30. Kumar, P.; Sunil, U. Autonomous System of Heavy Vehicle Using CAN Networking. In Proceedings of the First International Conference on Data Engineering and Machine Intelligence; Kumar, S.R., Kadry, S., Gayathri, N., Chelliah, P.R., Eds.; Lecture Notes in Electrical Engineering; Springer Nature: Singapore, 2024; Volume 1261, pp. 83–96. ISBN 978-981-97-7615-3. [Google Scholar]
  31. Spencer, G.; Mateus, F.; Torres, P.; Dionísio, R.; Martins, R. Design of CAN Bus Communication Interfaces for Forestry Machines. Computers 2021, 10, 144. [Google Scholar] [CrossRef]
  32. Zhong, F.; Quan, C. Stereo-Rectification and Homography-Transform-Based Stereo Matching Methods for Stereo Digital Image Correlation. Measurement 2021, 173, 108635. [Google Scholar] [CrossRef]
  33. Zhang, Z. Camera Parameters (Intrinsic, Extrinsic). In Computer Vision; Ikeuchi, K., Ed.; Springer International Publishing: Cham, Switzerland, 2021; pp. 135–140. ISBN 978-3-030-63416-2. [Google Scholar]
  34. Nusantika, N.R.; Xiao, J.; Hu, X. An Enhanced Multiscale Retinex, Oriented FAST and Rotated BRIEF (ORB), and Scale-Invariant Feature Transform (SIFT) Pipeline for Robust Key Matching in 3D Monitoring of Power Transmission Line Icing with Binocular Vision. Electronics 2024, 13, 4252. [Google Scholar] [CrossRef]
  35. Zhang, L.; Zhang, Y. Improved Feature Point Extraction Method of ORB-SLAM2 Dense Map. Assem. Autom. 2022, 42, 552–566. [Google Scholar] [CrossRef]
  36. Yedjour, H. Optical Flow Based on Lucas-Kanade Method for Motion Estimation. In Artificial Intelligence and Renewables Towards an Energy Transition; Hatti, M., Ed.; Lecture Notes in Networks and Systems; Springer International Publishing: Cham, Switzerland, 2021; Volume 174, pp. 937–945. ISBN 978-3-030-63846-7. [Google Scholar]
  37. Ebrahimi, A.; Czarnuch, S. Automatic Super-Surface Removal in Complex 3D Indoor Environments Using Iterative Region-Based RANSAC. Sensors 2021, 21, 3724. [Google Scholar] [CrossRef] [PubMed]
  38. Ghasemieh, A.; Kashef, R. Advanced Monocular Outdoor Pose Estimation in Autonomous Systems: Leveraging Optical Flow, Depth Estimation, and Semantic Segmentation with Dynamic Object Removal. Sensors 2024, 24, 8040. [Google Scholar] [CrossRef] [PubMed]
  39. Zeinali, B.; Zanddizari, H.; Chang, M.J. IMUNet: Efficient Regression Architecture for Inertial IMU Navigation and Positioning. IEEE Trans. Instrum. Meas. 2024, 73, 1–13. [Google Scholar] [CrossRef]
  40. Cai, Y.; Ou, Y.; Qin, T. Improving SLAM Techniques with Integrated Multi-Sensor Fusion for 3D Reconstruction. Sensors 2024, 24, 2033. [Google Scholar] [CrossRef]
  41. Zhu, J.; Zhou, H.; Wang, Z.; Yang, S. Improved Multi-Sensor Fusion Positioning System Based on GNSS/LiDAR/Vision/IMU with Semi-Tight Coupling and Graph Optimization in GNSS Challenging Environments. IEEE Access 2023, 11, 95711–95723. [Google Scholar] [CrossRef]
  42. Labbé, M.; Michaud, F. RTAB-Map as an Open-source Lidar and Visual Simultaneous Localization and Mapping Library for Large-scale and Long-term Online Operation. J. Field Robot. 2019, 36, 416–446. [Google Scholar] [CrossRef]
  43. Xiong, B.; Jiang, W.; Li, D.; Qi, M. Voxel Grid-Based Fast Registration of Terrestrial Pointcloud. Remote Sens. 2021, 13, 1905. [Google Scholar] [CrossRef]
  44. Labbe, M.; Michaud, F. Online Global Loop Closure Detection for Large-Scale Multi-Session Graph-Based SLAM. In Proceedings of the 2014 IEEE/RSJ International Conference on Intelligent Robots and Systems, Chicago, IL, USA, 14–18 September 2014; pp. 2661–2666. [Google Scholar]
  45. Zheng, T.; Wang, F.; Xu, Z. An Improved Gtsam-Based Nonlinear Optimization Algorithm in ORBSLAM3. In Proceedings of the 2022 International Conference on Intelligent Transportation, Big Data & Smart City (ICITBS), Hengyang, China, 26–27 March 2022; pp. 30–33. [Google Scholar]
  46. Kam, H.R.; Lee, S.-H.; Park, T.; Kim, C.-H. RViz: A Toolkit for Real Domain Data Visualization. Telecommun. Syst. 2015, 60, 337–345. [Google Scholar] [CrossRef]
  47. Shiran, W.; Ahamed, T. Navigation System for Autonomous Agricultural Vehicles for Indoor Farms. In IoT and AI in Agriculture; Ahamed, T., Ed.; Springer Nature: Singapore, 2024; pp. 123–147. ISBN 978-981-97-1263-2. [Google Scholar]
  48. Libby, J.; Kantor, G. Deployment of a Point and Line Feature Localization System for an Outdoor Agriculture Vehicle. In Proceedings of the 2011 IEEE International Conference on Robotics and Automation, Shanghai, China, 9–13 May 2011; pp. 1565–1570. [Google Scholar]
  49. Jamaludin, A.; Radzi, S.S.M.; Yatim, N.M.; Masuan, N.A.; Adam, N.M.; Suarin, N.A.S.; Sulong, P.M.; Radzi, S.S.M. SLAM Performance Evaluation on Uneven Terrain under Varying Illuminance Conditions and Trajectory Lengths. IEEE Access 2025, 13, 46426–46447. [Google Scholar] [CrossRef]
  50. Han, F.; Wei, Y.; Jiao, Y.; Zhang, Z.; Pan, Y.; Huang, W.; Tang, L.; Yin, H.; Ding, X.; Xiong, R.; et al. Multi-Cam Multi-Map Visual Inertial Localization: System, Validation and Dataset 2024. arXiv 2024, arXiv:2412.04287. [Google Scholar] [CrossRef]
  51. Qin, T.; Li, P.; Shen, S. VINS-Mono: A Robust and Versatile Monocular Visual-Inertial State Estimator. IEEE Trans. Robot. 2018, 34, 1004–1020. [Google Scholar] [CrossRef]
  52. Karam, S.; Lehtola, V.; Vosselman, G. Strategies to Integrate Imu and Lidar Slam for Indoor Mapping. ISPRS Ann. Photogramm. Remote Sens. Spat. Inf. Sci. 2020, 2020, 223–230. [Google Scholar] [CrossRef]
Figure 1. Hardware platform for real-time mapping and localization: (a) proposed system architecture illustrating integrated sensors and computational units, and (b) actual robotic setup featuring a stereo camera for mapping and tracking, a battery compartment for power supply, a display screen with control switches for mode selection, an unused spraying system, and a main control box housing the motor driver and controller area network (CAN)–bus communication system.
Agriculture 15 00872 g001
Figure 2. Comparative analysis of feature detection methods applied to the same image (ID = 16): (a) standard ORB, (b) BRIEF (c) GFTT and (d) the proposed ORB-octree implementation. Feature classifications are color coded as follows: blue—features matched from the previous frame; red—features retrieved from the dictionary; green—newly detected features; yellow—new features detected multiple times within the same image.
Agriculture 15 00872 g002
Figure 3. Overview of the proposed system, illustrating the integration of stereo visual odometry, simultaneous localization and mapping (SLAM), and inertial measurement unit (IMU) for real-time mapping and localization.
Agriculture 15 00872 g003
Figure 4. Experimental setup and ground-truth data collection: (a) indoor environment with a 4 × 2 tree arrangement within a controlled hall, (b) outdoor test site featuring a 4 × 4 tree configuration for field validation, (c) manual measurement of inter-tree distances for ground-truth, and (d) RTK-Fix GPS acquisition for precise tree location ground-truthing.
Agriculture 15 00872 g004
Figure 5. Two-dimensional grid map representation using stereo visual odometry and RTAB-Map SLAM for (a) the indoor environment with trees positioned at the center of the hall and (b) the outdoor environment featuring a 4 × 4 tree arrangement at the center of the test area.
Agriculture 15 00872 g005
Figure 6. Mapping error visualization using the mean absolute error (MAE) to compare the estimated tree positions using GPS and Rviz with the corresponding ground-truth (actual) tree locations.
Agriculture 15 00872 g006
Figure 7. Stereo point cloud mapping for the indoor environment: (a) complete 3D point cloud map representing all objects in the scene, (b) zoom-in view focusing on the trees, and (c) the refined point clouds after applying voxel filtering.
Agriculture 15 00872 g007
Figure 8. Stereo point cloud mapping in the outdoor environment: (a) a top-down view of the dense artificial orchard, (b) a front view of the tree columns, and (c) a side view along the tree rows. The dense, blue-colored points represent the ground surface, while the green and red points correspond to tree structures.
Agriculture 15 00872 g008
Figure 9. Stereo visual odometry trajectory: (a) the indoor environment with a 4 × 2 tree arrangement at the center and (b) the outdoor environment with a 4 × 4 tree configuration, mapped from both sides.
Agriculture 15 00872 g009
Figure 10. Illustration of key navigation points in the orchard localization study: A, the starting point; B, the turning point; and C, the path between the trees. These are critical waypoints for autonomous navigation.
Agriculture 15 00872 g010
Table 1. Camera system calibration parameters, including error metrics for the individual cameras and the stereo pair configuration.
Camera ModuleCalibration TypeError MetricError Value (cm)
RGBIntrinsic Parameter OptimizationReprojection Error1.589
Left CameraIntrinsic Parameter OptimizationReprojection Error0.157
Right CameraIntrinsic Parameter OptimizationReprojection Error0.175
Left–Right StereoExtrinsic Parameter RefinementAverage Epipolar Error0.246
Right–RGB StereoExtrinsic Parameter RefinementAverage Epipolar Error0.225
Table 2. Specifications of the key components used in the mapping and localization system.
Industrial RobotStereo-Depth Camera
ParameterValueParameterValue
Dimension2397 × 1383 × 2841 mmDimension111 × 31.3 × 40 mm
Weight700 kgRange0–10 m
Payload500 LDFOV/HFOV/VFOV150°/127°/79.5°
Maximum Speed5.3 km/hStereo Frame Resolution120 FPS at 1280 × 800 Pixels
Maximum Speed Rotation8000 rpmDepth Accuracy<2% at 4 m,
<4% at 6.5 m and
<6% at 9 m
Battery48 V RechargeableIntegrated IMU9-axis BNO085
Note: DFOV, display field of view; HFOV, horizontal field of view; VFOV, vertical field of view.
Table 3. Comparison of tree location errors in the indoor and outdoor experiments.
Measurement ToolEnvironmentAverage Error (m)Error Consistency (m)Smallest Error (m)Largest Error (m)
GPS_EstimatedOutdoor0.0630.208−0.2950.495
Rviz_EstimatedOutdoor0.0180.147−0.180.34
Rviz_EstimatedIndoor0.030.15−0.080.41
Table 4. Summary of point cloud data processing metrics for the indoor and outdoor environments.
EnvironmentTotal PointsPoints After Voxel FilteringPoints After Outlier RemovalPoints for TreesPoints for Other ObjectsAverage Points per Tree
Outdoor2,119,2222,046,9061,877,32963,66946304086
Indoor3,065,2702,944,7672,669,31884,769449,37611,995
Table 5. Comparison between the ground-truth and the visual SLAM trajectory using error metrics.
MetricMax. Error
(m)
Mean Error
(m)
Median Error
(m)
Min. Error
(m)
RMSE
(m)
SSEs
(m2)
Standard Deviation
(m)
Value1.12810.09790.92220.85610.9854458.35590.1113
RMSE, root mean square error; SSEs, sum of squared errors.
Table 6. Localization performance of RTAB-Map SLAM at various times of the day and speeds.
Testing DateTesting TimeSpeed (m/s)Localization Status
ABC
22 January 2025Morning0.3
22 January 2025Morning0.5
22 January 2025Morning1.0
22 January 2025Evening0.3
22 January 2025Evening0.5
22 January 2025Evening1.0
23 January 2025Morning0.3
23 January 2025Morning0.5
23 January 2025Morning1.0
Note: Symbols indicate robot localization performance with loop-closure detection under specific conditions: ‘✓’ denotes successful loop-closure detection while ‘✖’ indicates failure to detect loop-closure. A, the starting point; B, the turning point; C, the path between the trees.
Disclaimer/Publisher’s Note: The statements, opinions and data contained in all publications are solely those of the individual author(s) and contributor(s) and not of MDPI and/or the editor(s). MDPI and/or the editor(s) disclaim responsibility for any injury to people or property resulting from any ideas, methods, instructions or products referred to in the content.

