Article

Genetic Diversity Analysis and Construction of a Core Germplasm Resource Bank of Xinjiang’s Indigenous Cultivated Grapes

1
College of Life Sciences, Shihezi University, Shihezi 832003, China
2
State Key Laboratory of Desert and Oasis Ecology, Key Laboratory of Ecological Safety and Sustainable Development in Arid Lands, Xinjiang Institute of Ecology and Geography, Chinese Academy of Sciences, Urumqi 830011, China
3
Xinjiang Key Lab of Conservation and Utilization of Plant Gene Resources, Xinjiang Institute of Ecology and Geography, Chinese Academy of Sciences, Urumqi 830011, China
4
Turpan Eremophytes Botanical Garden, Chinese Academy of Sciences, Turpan 838008, China
5
College of Enology, College of Food Science and Engineering, Viti-Viniculture Engineering Technology Center of State Forestry and Grassland Administration, Shaanxi Engineering Research Center for Viti-Viniculture, Heyang Viti-Viniculture Station, Northwest A&F University, Yangling 712100, China
6
Institute of Horticulture Crops, Xinjiang Academy of Agricultural Sciences, Urumqi 830091, China
7
People’s Government of Lianmuqin Town, Shanshan County, Shanshan 838200, China
*
Author to whom correspondence should be addressed.
These authors contributed equally to this work.
Agriculture 2025, 15(8), 871; https://doi.org/10.3390/agriculture15080871
Submission received: 9 February 2025 / Revised: 12 April 2025 / Accepted: 14 April 2025 / Published: 16 April 2025
(This article belongs to the Section Crop Genetics, Genomics and Breeding)

Abstract

:
This study systematically investigated the genetic characteristics and germplasm conservation strategies of Xinjiang Thompson Seedless grapes (Vitis vinifera Thompson Seedless) and Munake grapes (Vitis vinifera L. cv. Munake) using SSR molecular markers and whole-genome resequencing technology. A genetic diversity analysis of 165 Thompson Seedless accessions with 16 SSR markers identified 442 alleles (27.63 alleles per locus on average), with the expected heterozygosity (He = 0.76) and observed heterozygosity (Ho = 0.83) indicating moderate-to-low genetic diversity. A molecular variance analysis (AMOVA) further revealed that 96% of the genetic variation originated within populations, with minimal inter-population differentiation (Fst = 0.04). Phylogenetic reconstruction using SSR markers demonstrated significant genealogical associations between the two cultivars, supporting the hypothesis that Thompson Seedless may have originated from a domesticated lineage of Munake. The selected SSR markers exhibited high discriminatory power (PIC = 0.92), enabling the precise differentiation of accessions with closely related genetic backgrounds. Whole-genome resequencing identified 20,074,046 and 69,214,080 high-quality SNPs in 100 Thompson Seedless and 141 Munake accessions, respectively. Core germplasm banks were subsequently established: the Thompson Seedless core collection (25 accessions) captured 94% of genetic variation, reflecting genetic homogenization driven by intensive clonal cultivation, while the Munake core collection (42 accessions) retained 95% of allelic diversity and resolved regional synonym issues through highly polymorphic SNP markers. A comparative analysis revealed that Munake maintains higher genetic diversity due to natural gene flow, whereas Thompson Seedless faces heightened risks of genetic erosion from prolonged asexual propagation. These findings provide a theoretical foundation and technical framework for precise conservation, varietal improvement, and sustainable utilization of grape germplasm resources in Xinjiang.

1. Introduction

Grapes (Vitis vinifera L., 2n = 38) belong to the genus Vitis of the Vitaceae family and are woody, climbing plants with a multitude of varieties distributed worldwide, and a genome size of around 500 Mbp [1]. In terms of their cultivation area and production volume, grapes are second only to citrus, making them the second most important fruit globally [2]. The northwestern region of China, particularly Xinjiang, has a geographical environment that is particularly suitable for grape cultivation. Xinjiang has a diverse range of local grape varieties [3]. These include Thompson Seedless and Munake, which have a long history of cultivation and exhibit large planting areas and yields in Xinjiang.
Thompson Seedless grapes were disseminated to West Asia and Central Asia via the Silk Road and were subsequently introduced to the Xinjiang region in China. Their cultivation dates back to the 3rd century AD, and they have been extensively adopted in the Hetian area of Southern Xinjiang [4,5]. Turpan, Xinjiang, is the primary production area for Thompson Seedless grapes in China. The total grape planting area in China spans 56.74 million mu (approximately 3.78 million hectares), with approximately 90% of the total output dedicated to drying [6]. However, the prolonged and intensive cultivation of Thompson Seedless grapes, along with their asexual reproduction, have significantly reduced the genetic diversity of this cultivar, jeopardizing germplasm resources. This reduction affects both their yields and quality, as well as weakens pest and disease resistance, threatening the sustainable development of the grape industry [7].
Munake is an ancient grape variety that has been grown for thousands of years in Xinjiang, China, and is renowned for its exceptional fruit characteristics. The origin of the Munake grape, an ancient variety endemic to southern Xinjiang, combines local natural selection with historical cultivation practice [8,9,10]. They have a narrow distribution, adapted only to Xinjiang’s arid areas, which feature high accumulated temperatures, and are mainly cultivated in southern Xinjiang such as in Atushi and partly along Gansu’s Hexi Corridor [11]. Attempts to grow Munake grapes in other Chinese provinces have failed due to the crop’s strict climatic requirements (220+ frost-free days, <120 mm annual rainfall, 12–13 °C average temperature, and 4200+ °C accumulated temperature) [12]. With its desirable qualities but strict habitat requirements, Munake is specifically endemic to Xinjiang, which poses transportation and storage difficulties [13]. Its strict ecological adaptation makes it a typical case for studying crop domestication in arid zones, while genetic diversity analysis provides a key basis for subsequent resource conservation and molecular breeding.
Molecular markers have revolutionized germplasm characterization through applications in DNA fingerprinting, genetic diversity assessment, and core collection development [14,15,16,17,18]. Based on the above technical advantages, the complementary combination of SNP and SSR markers was selected in this study to address the limitations of traditional methods in assessing the genetic diversity of grapevines in Xinjiang [19]. SNPs provide genome-wide coverage with high reproducibility for population structure analysis [20,21,22,23,24]. SSRs offer cost-effective polymorphism detection validated in grape varietal identification [25,26,27,28,29,30,31,32,33,34]. While previous studies have extensively applied these markers to Eurasian grapevines [35,36,37], their utilization in characterizing Xinjiang’s endemic cultivars remains limited. Our integrated approach addresses this gap by combining SNP-based genome scanning with SSR fingerprinting tailored to local germplasm traits.
The diversity of grape germplasm resources is essential for sustainable agricultural development. European and American countries are more advanced in collecting and using grape germplasms, while China is lagging behind, relying mainly on traditional breeding techniques [38,39,40]. Xinjiang is located in the western region of China and is a primary production area for high-quality grapes. A clear analysis of the population’s genetic structure is a primary prerequisite for germplasm safety and utilization, forming the foundation of germplasm innovation and serving as an essential guarantee for the sustainable development of both germplasm resources and the industry [41,42]. The core germplasm is an integral part of crop conservation and innovation, covering a wide range of morphological traits; reflecting the geographical, genetic, and genotypic details of the species; and playing a crucial role in the sharing, application, and maintenance of gene banks, which have both academic and practical value.
This study integrates whole-genome resequencing and molecular marker techniques to systematically evaluate the genetic diversity levels and genetic structure characteristics of Xinjiang’s widely cultivated Thompson Seedless grape and its local endemic counterpart, Munake, while establishing a core germplasm resource bank. By considering the dynamic changes in germplasm resources under long-term cultivation practices, we further explore the genetic relationships and evolutionary patterns between the two varieties. The findings aim to provide scientific evidence for the optimization of conservation strategies and the precise identification and genetic improvement of Xinjiang grape germplasms, ultimately supporting the sustainable development and utilization of local grape resources.

2. Materials and Methods

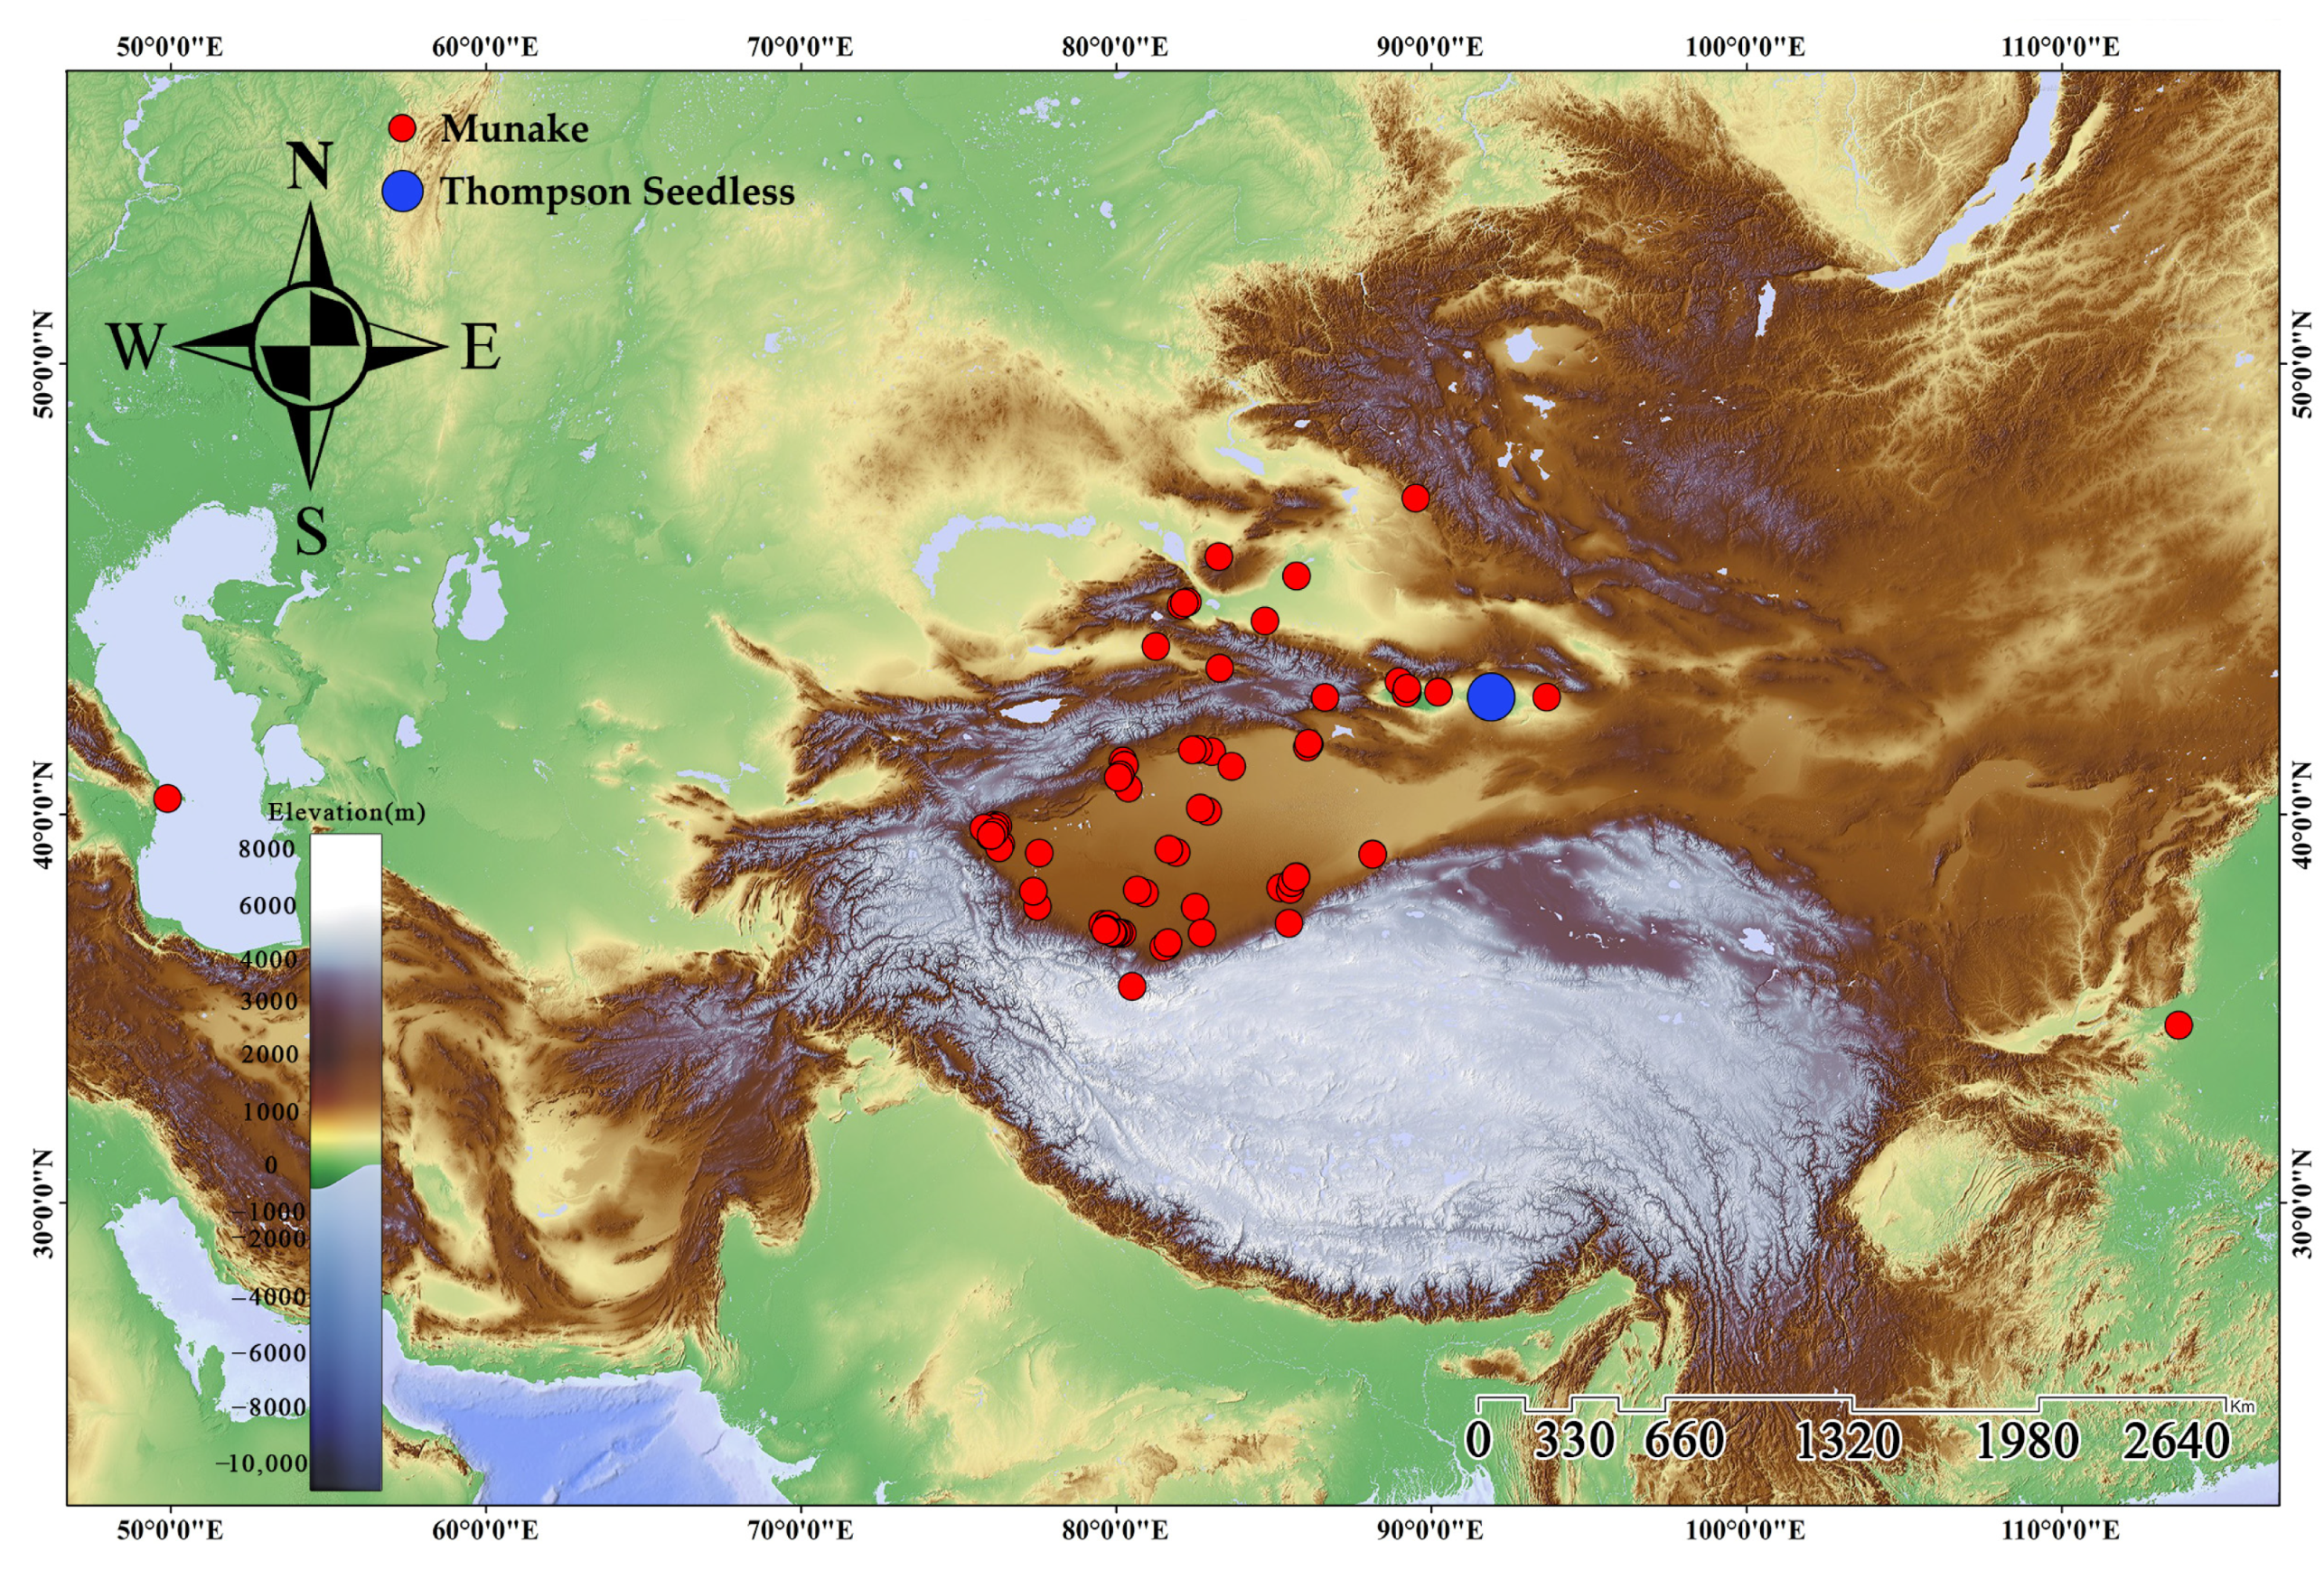
2.1. Plant Material and Sampling

This study focused on two grape cultivars: Thompson Seedless and Munake. The Thompson Seedless samples were systematically collected from three distinct plantation types in the Turpan Basin: (1) Turpan Desert Botanical Garden (ex situ conservation plot), (2) Turpan Grape Valley (traditional trellis cultivation vineyard), and (3) Shanshan region (farmers’ cultivation). A total of 165 Thompson Seedless grape samples were collected from three regions for SSR-based genetic structure and genetic diversity analysis. Subsequently, 100 high-quality samples were selected from the Thompson Seedless grape collection based on preservation quality for resequencing analysis. The Munake SSR analysis data were obtained from the research team’s previous study data [43]. A total of 141 Munake grape accessions were collected for resequencing analysis, comprising 134 accessions from Xinjiang, China, 6 accessions from Baku, Republic of Azerbaijan, and 1 accession from Henan Province, China (Figure 1 and Supplementary File S1). The primary sampling sites for Munake grapes were located in Artux, Kashgar, and Hetian in southern Xinjiang, China, supplemented by samples from the aforementioned international and domestic regions. These vines were free of pests and diseases and were cultivated under ideal growth conditions. At least 3 leaves were collected from each plant. We implemented a stratified random sampling design, with vineyard parcels stratified by 10–20 m inter-parcel distances, to collect representative accessions. It should be noted that the term “population” in this study refers to accessions grouped by geographic planting sites for analytical purposes, rather than naturally reproducing biological populations. This grouping strategy facilitates the application of population genetics models to cultivated germplasms.

2.2. Genetic Diversity Analysis Based on SSR Molecular Markers

2.2.1. Genotyping and DNA Extraction

The collected leaves were dried with silica gel and then ground in liquid nitrogen. Subsequently, DNA was extracted and used as a template for polymerase chain reaction (PCR) amplification. The 16 pairs of SSR primers selected for this study (Table 1) were chosen based on their widespread applicability and high polymorphism in grape genetic diversity studies. These markers have been extensively validated in prior studies for applications such as a population structure analysis, germplasm characterization, and phylogenetic investigations [44,45,46,47,48]. All primers were experimentally optimized for annealing conditions and polymorphism parameters to ensure compatibility with Xinjiang grape germplasms. Both the forward and reverse primers were commercially synthesized (Shanghai General Biotechnology, Shanghai, China). PCR amplification was performed in a 25 µL reaction mixture. The mixture contained 1 µL (20 ng/µL) of template DNA, 12.5 µL (5 U/µL) of Premix Taq™, 1 µL (10 µmol/L) of each forward and reverse primer, and 9.5 µL of dd H2O. An Applied Biosystems Verit96-Well thermal cycler was used to perform the PCR (Applied Biosystems VeritTM96-Well thermal cycler, Thermo Fisher Scientific, Waltham, MA, USA). For further details, refer to Table 1.
PCR was performed in a thermocycler. First, a single denaturation was performed at 93 °C for 5 min. This was followed by 30 cycles, each cycle including denaturation at 94 °C for 30 s, annealing for 30 s at temperatures determined by the specific Tm values of each primer set, and extension at 65 °C for 90 s. The PCR products were detected with 6-carboxyfluorescein (FAM) and an automated fluorescence sequencing analyzer (Applied Biosystems® 3130 Genetic Analyzers, Thermo Fisher Scientific, Waltham, MA, USA). The Genemapper version 3.0 software package was used to analyze the amplified fragment sizes of different samples at each SSR locus.

2.2.2. Genetic Structure and Genetic Diversity Analysis

We calculated genetic diversity indices such as the number of alleles (Na), effective number of alleles (Ne), Shannon’s information index (I), observed heterozygosity (Ho), and expected heterozygosity (He) using the GenAlEx 6.5 software package [49]. The polymorphic information content (PIC) was computed via the PowerMarker v3.25 [50] software program, and Nei’s genetic diversity index was determined using Popgene 32 [51]. A principal coordinate analysis (PCoA) was also conducted using GenAlEx 6.5. The genetic distance (GD) matrix for populations was generated through the distance-based module in GenAlEx 6.5. Subsequently, a molecular analysis of variance (AMOVA) was employed to assess the contributions of genetic variation both among and within populations. Bayesian assignment testing was performed using the STRUCTURE 2.3.4 software package [52]. Additionally, a cluster analysis was conducted via the unweighted pair group method with arithmetic mean (UPGMA) using the Mega 11 software program [53]. For the analysis in STRUCTURE 2.3.4, parameters were set with K values ranging from 1 to 10, and each K value was replicated 10 times. The burn-in period was set to 1 × 10⁴, the number of Markov Chain Monte Carlo (MCMC) replicates after the burn-in was 1 × 10⁵, and a mixed model was applied. Structure Harvester was utilized to identify the optimal ∆K value from the numerical results corresponding to each run (saved in the Results folder).

2.3. Construction of a Core Germplasm Bank Based on Whole-Genome Resequencing

2.3.1. Sequencing and Sequencing Quality Control

The DNA secure Plant Kit was employed to extract DNA from plant tissues (Tiangen Biotech (Beijing) Co., Ltd., Beijing, China, https://www.tiangen.com/content/details_40_21522.html (accessed on 10 November 2024)). The amplified products were separated by agarose gel electrophoresis, purified by using Universal DNA Purification Kit (Tiangen, https://www.tiangen.com/content/details_40_21348.html (accessed on 28 January 2025)). The qualified DNA samples were randomly fragmented into 350 bp segments using a Covaris crusher. We used either the TruSeq Library Construction Kit (Illumina, San Diego, CA, USA) or the MGI Easy FS DNA Prep kit (MGI Tech Co., Ltd., Guangdong, China) to construct the library. After library construction, we first conducted a preliminary quantification using Qubit2.0 [54]. The library was then diluted to a concentration of 1 ng/µL, and the insert size of the library was detected with an Agilent 2100. After the library passed the quality check, different libraries were pooled according to the requirements of effective concentration and target data volume. Finally, we performed sequencing in the PE150 mode using either the Illumina NovaSeq6000 or DNBSEQT7 sequencing platform [55]. The sequencing data were aligned to the respective reference genomes of the two grape cultivars for variant detection (Thompson Seedless: https://db.cngb.org/search/project/CNP0004225/ (accessed on 24 May 2024); Munake: http://ftp.ensemblgenomes.org/pub/plants/release-25/fasta/vitis_vinifera/ (accessed on 22 April 2022)).

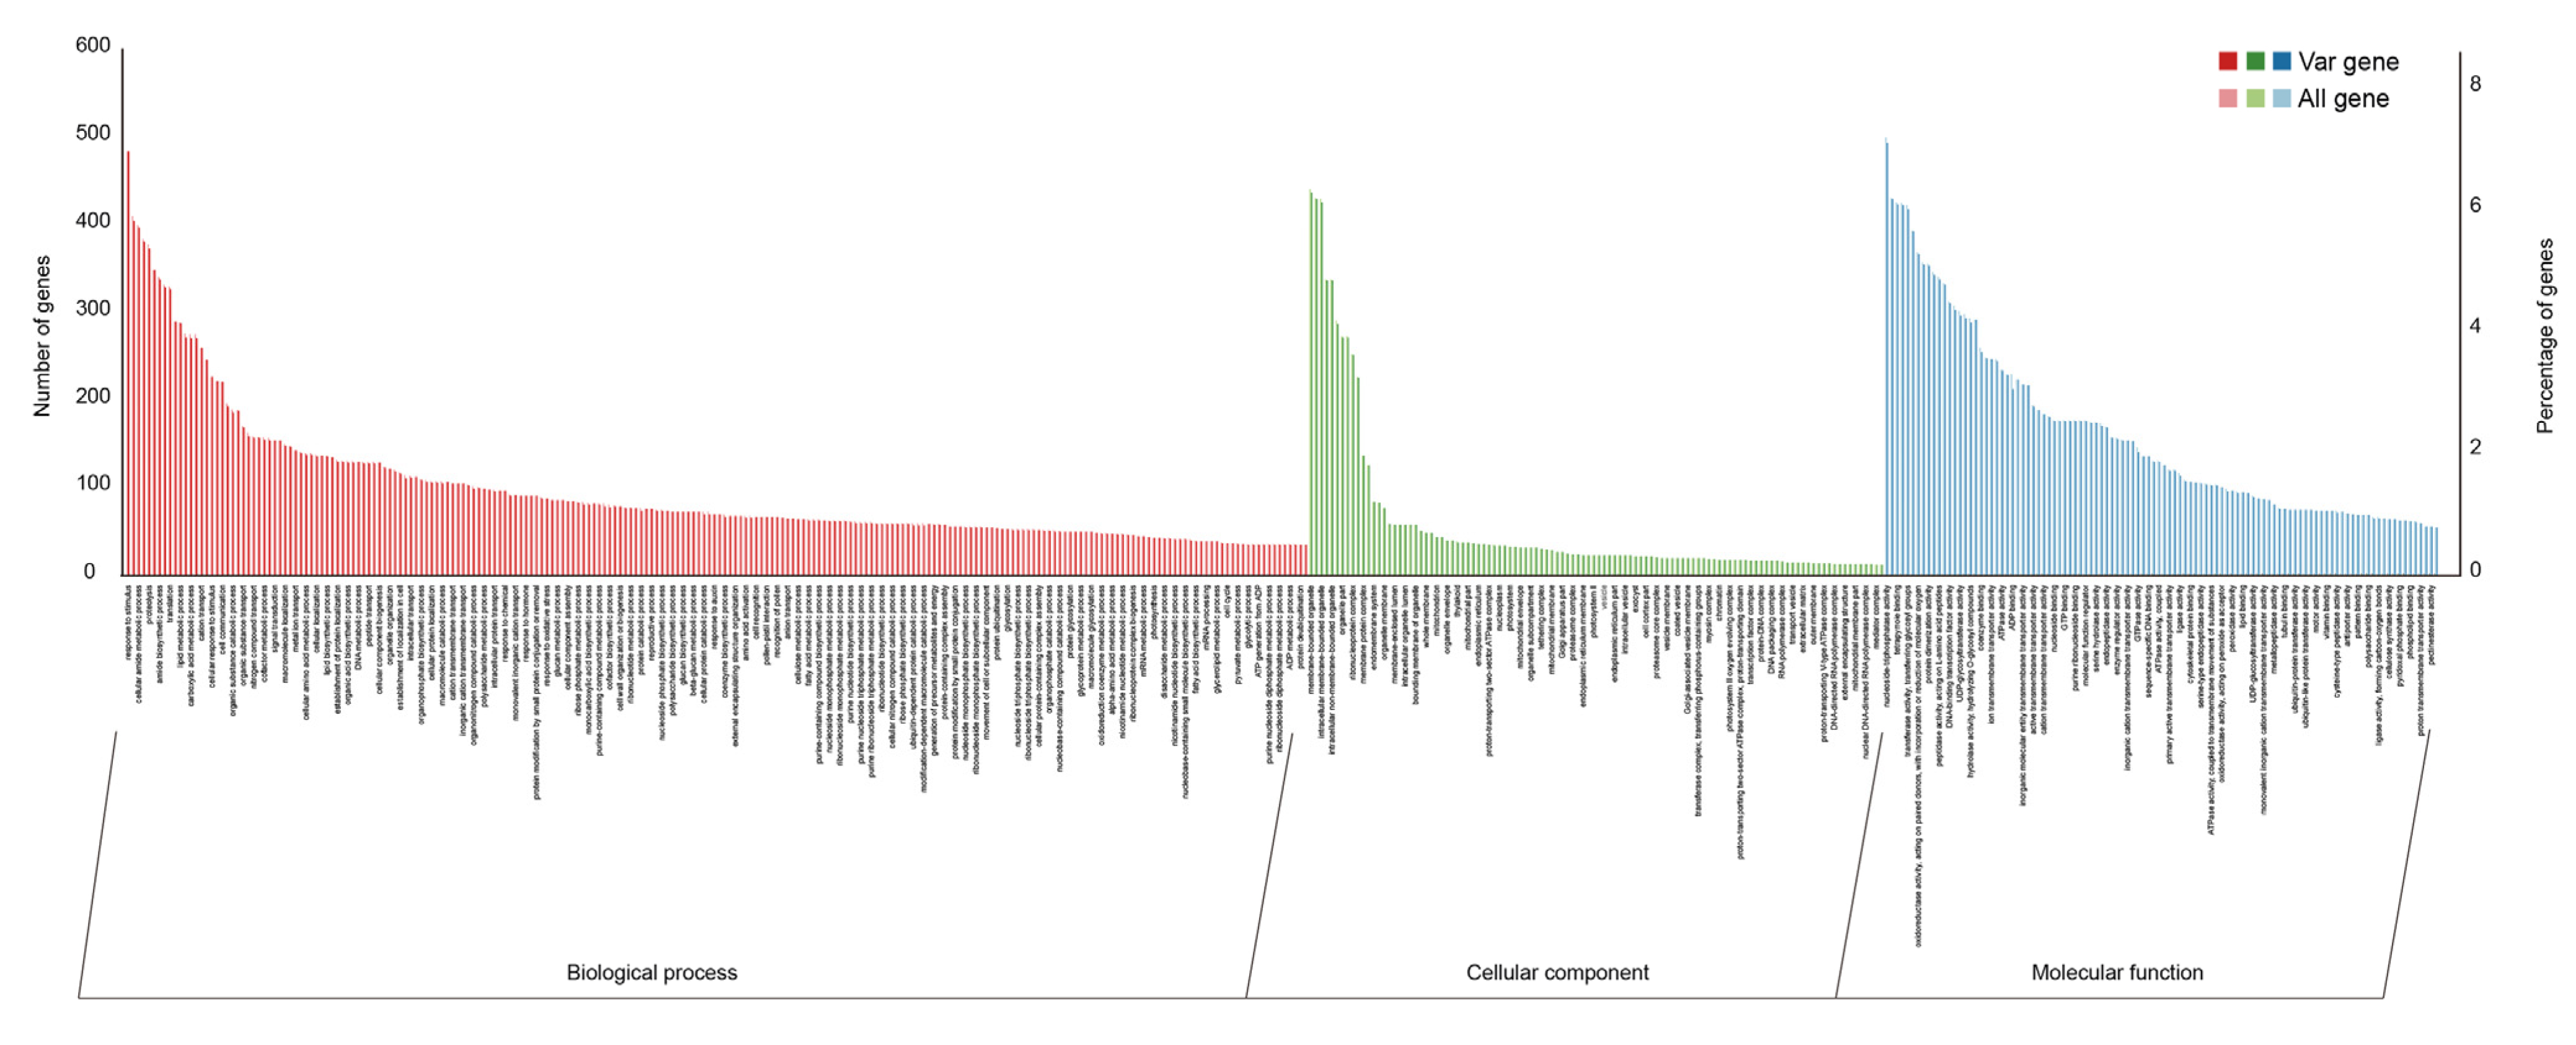
2.3.2. SNP/InDel Detection and Annotation

The SNP and InDel detection was performed using Sentieon (https://pubmed.ncbi.nlm.nih.gov/32698196/ (accessed on 24 May 2024) [56]. Subsequently, the SNP and InDel sites were annotated with the ANNOVAR (http://www.openbioinformatics.org/annovar/ (accessed on 24 May 2024)) [57] software to determine the genomic region of variant sites and their mutation types. To reduce the error rate of SNP/InDel detection, the following criteria were selected for filtering: (1) the number of reads supported by SNPs/InDels was not less than 4; (2) the RMS mapping quality (MQ) of site alignment must not be less than 40; and (3) the genotype quality (GQ) value should not be lower than 5. A gene ontology (GO) enrichment analysis was performed using the ShinyGO v0.61 tool. The frequency of query genes was compared with the complete reference genome for V. vinifera, searching for possible enrichment in biological processes [58].

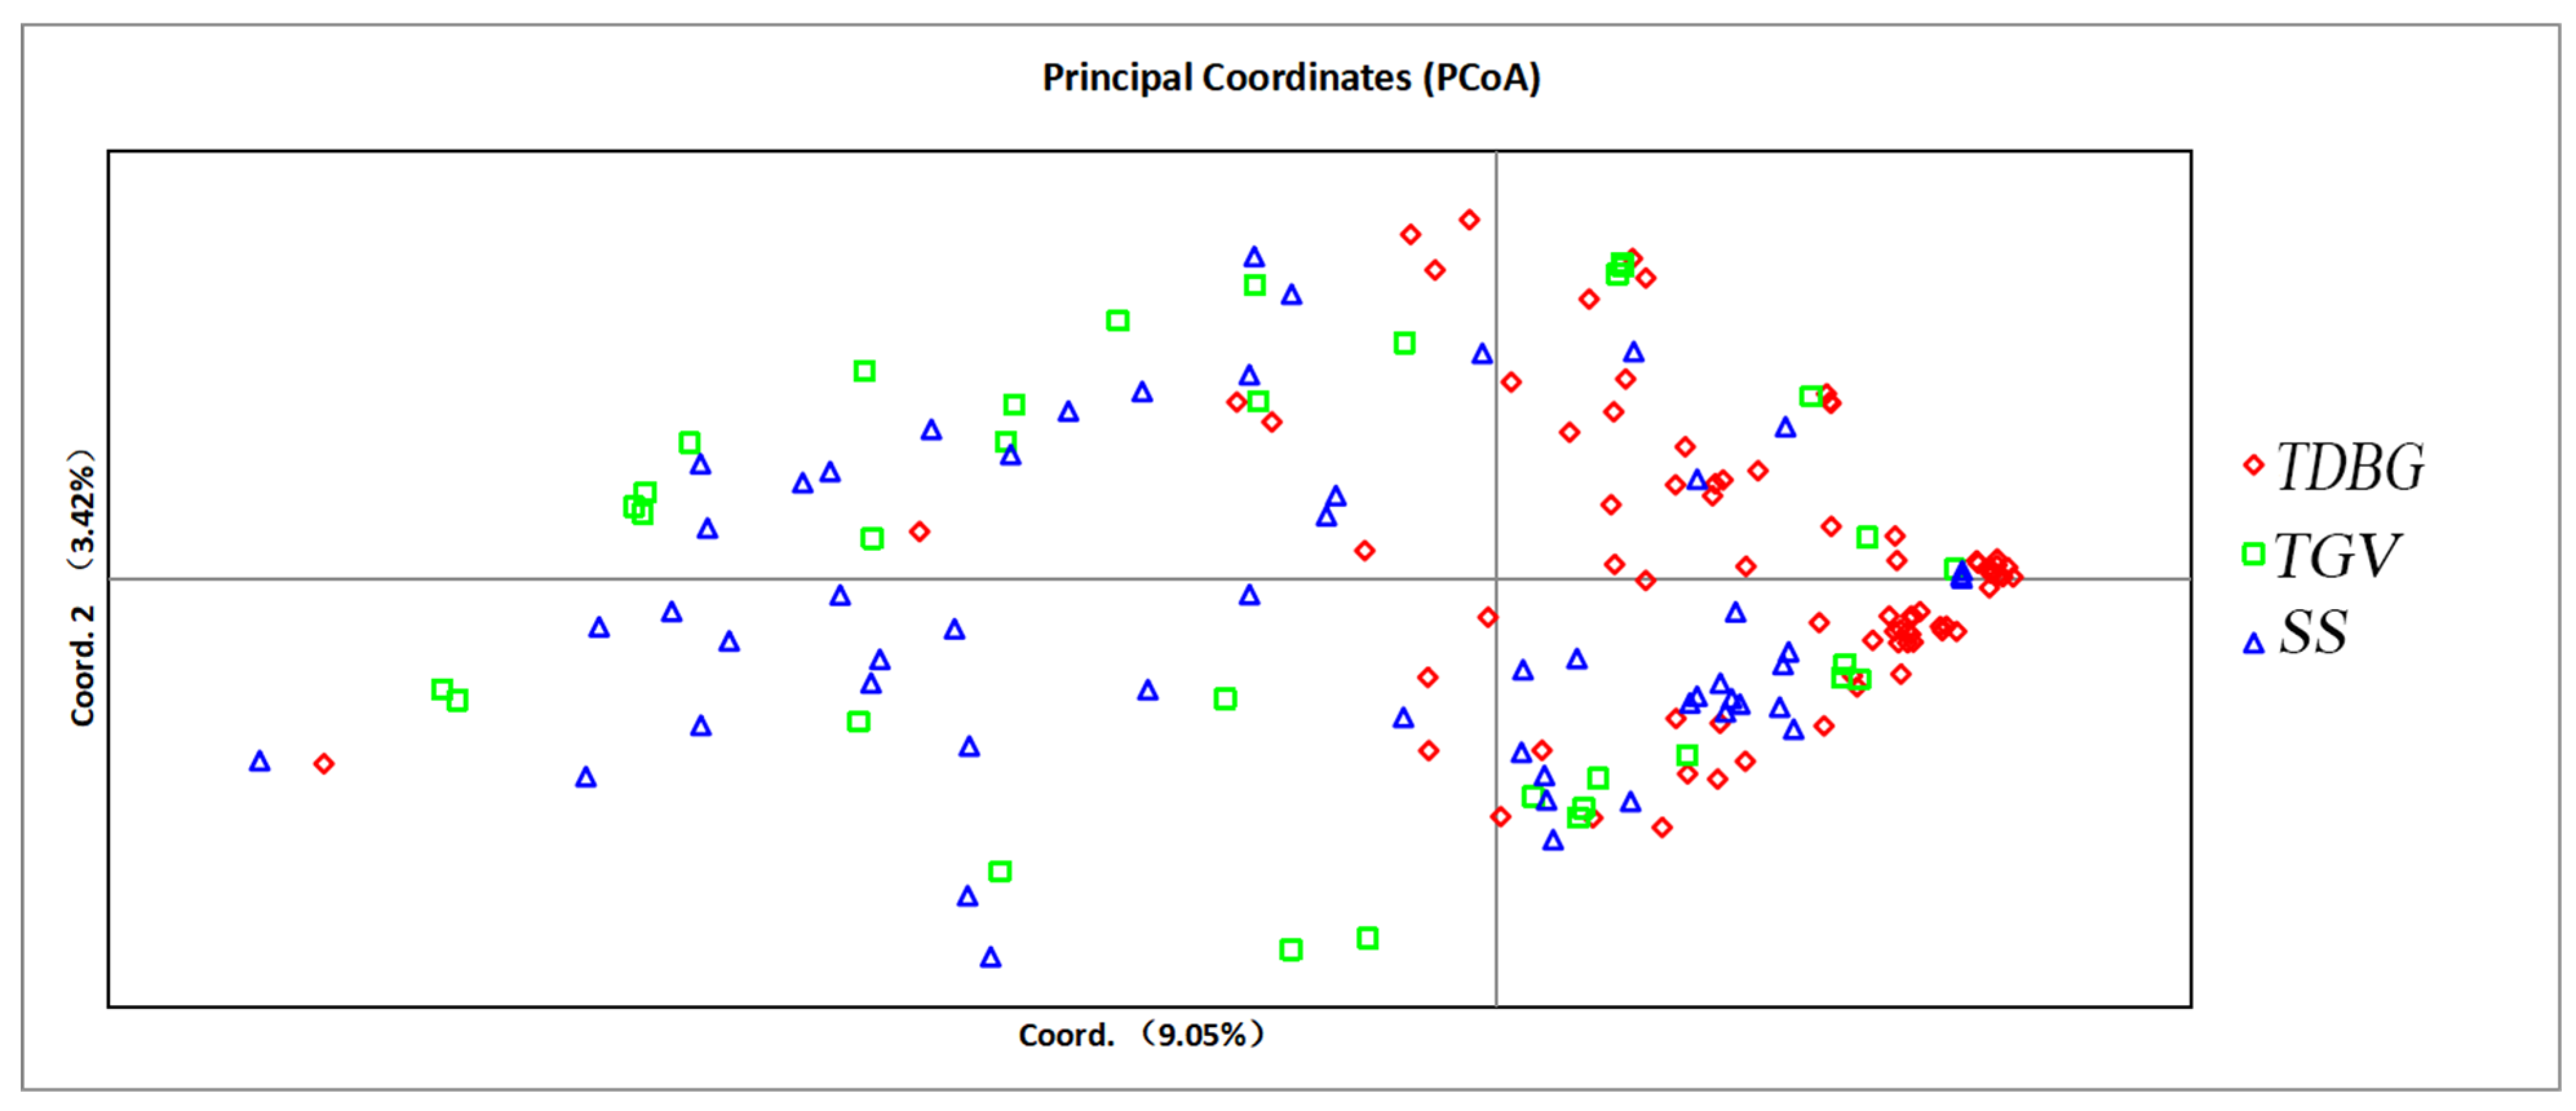
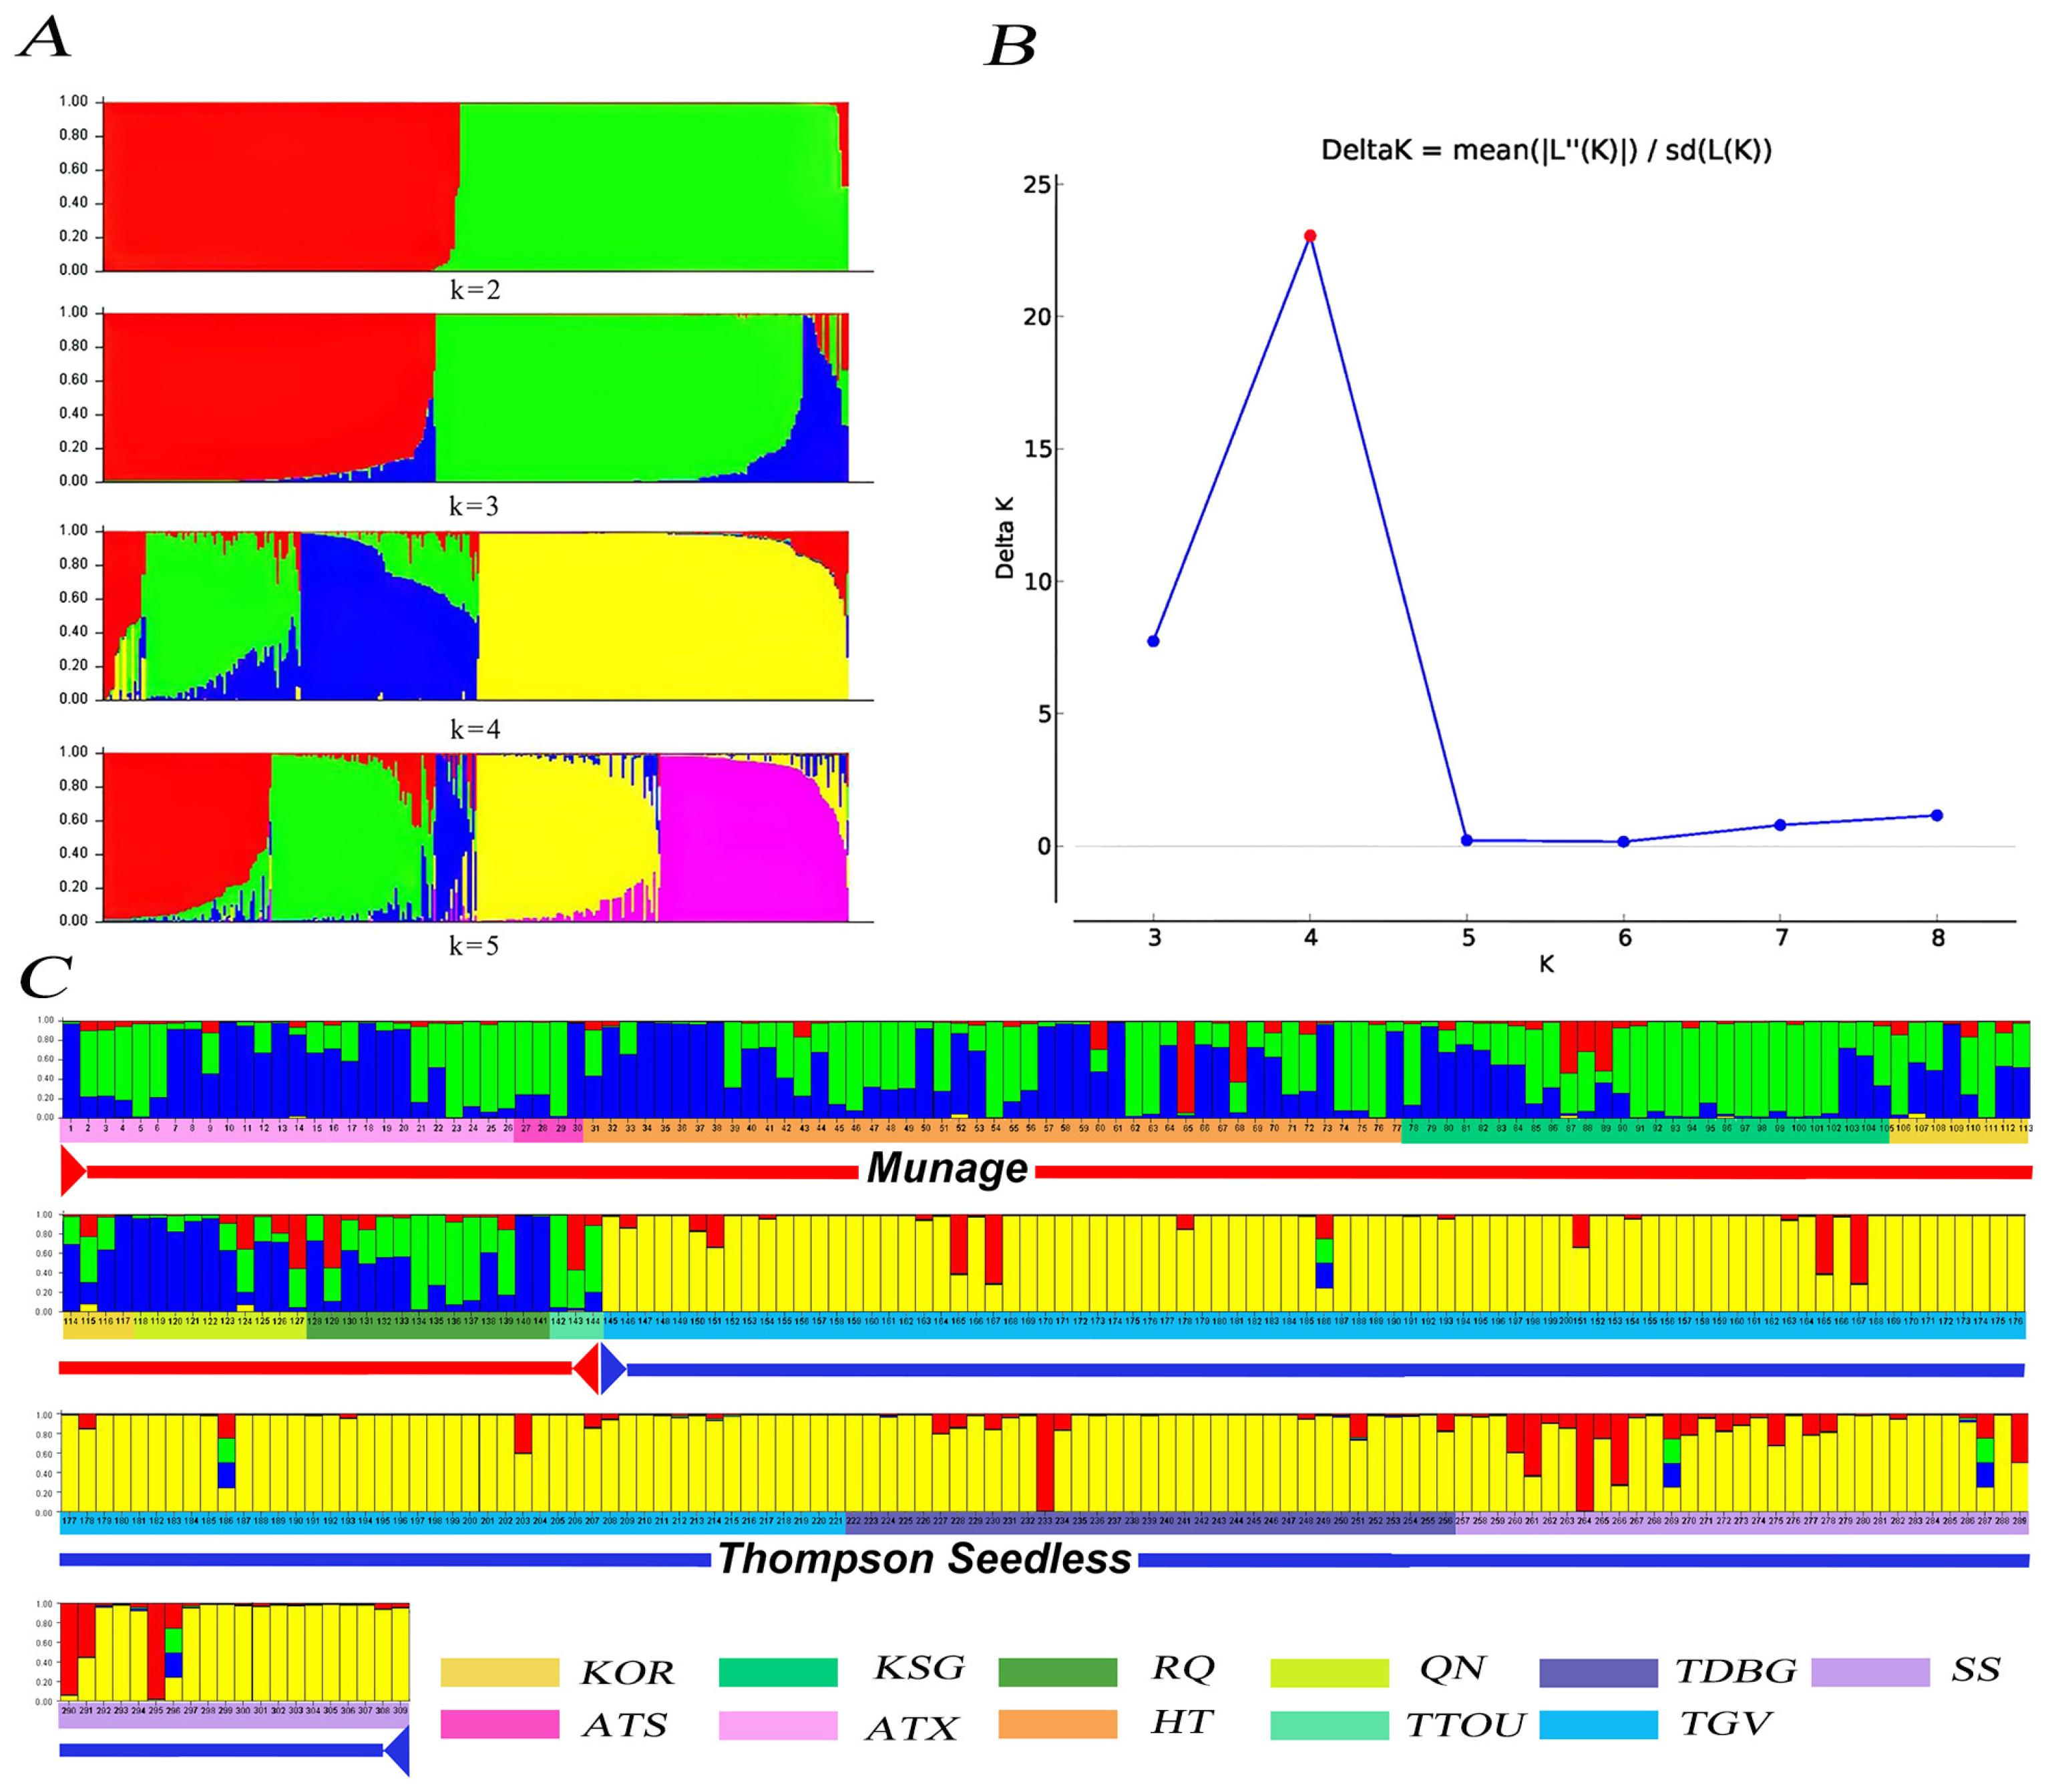
2.3.3. Genetic Diversity and Population Structure Analysis

Cross-validated unsupervised clustering was further conducted using ADMIXTURE v1.3.0 [59]. The consistency of genetic groupings was validated through a Discriminant Analysis of Principal Components (DAPC) implemented in the R package “adegenet” [60]. A principal component analysis (PCA) was performed on numerically encoded SNP data (e.g., T/C as 0/1) using TASSEL v5 [61]. Phylogenetic relationships were reconstructed via a neighbor-joining tree with 1000 bootstrap replicates in MEGA, visualized and annotated in iTOL v4. Finally, a core germplasm collection was established with Core Hunter II. The collection was validated for genetic diversity (Shannon’s I, Nei’s index) and uniqueness through QR-encoded SNP fingerprints derived from whole-genome SNP data.

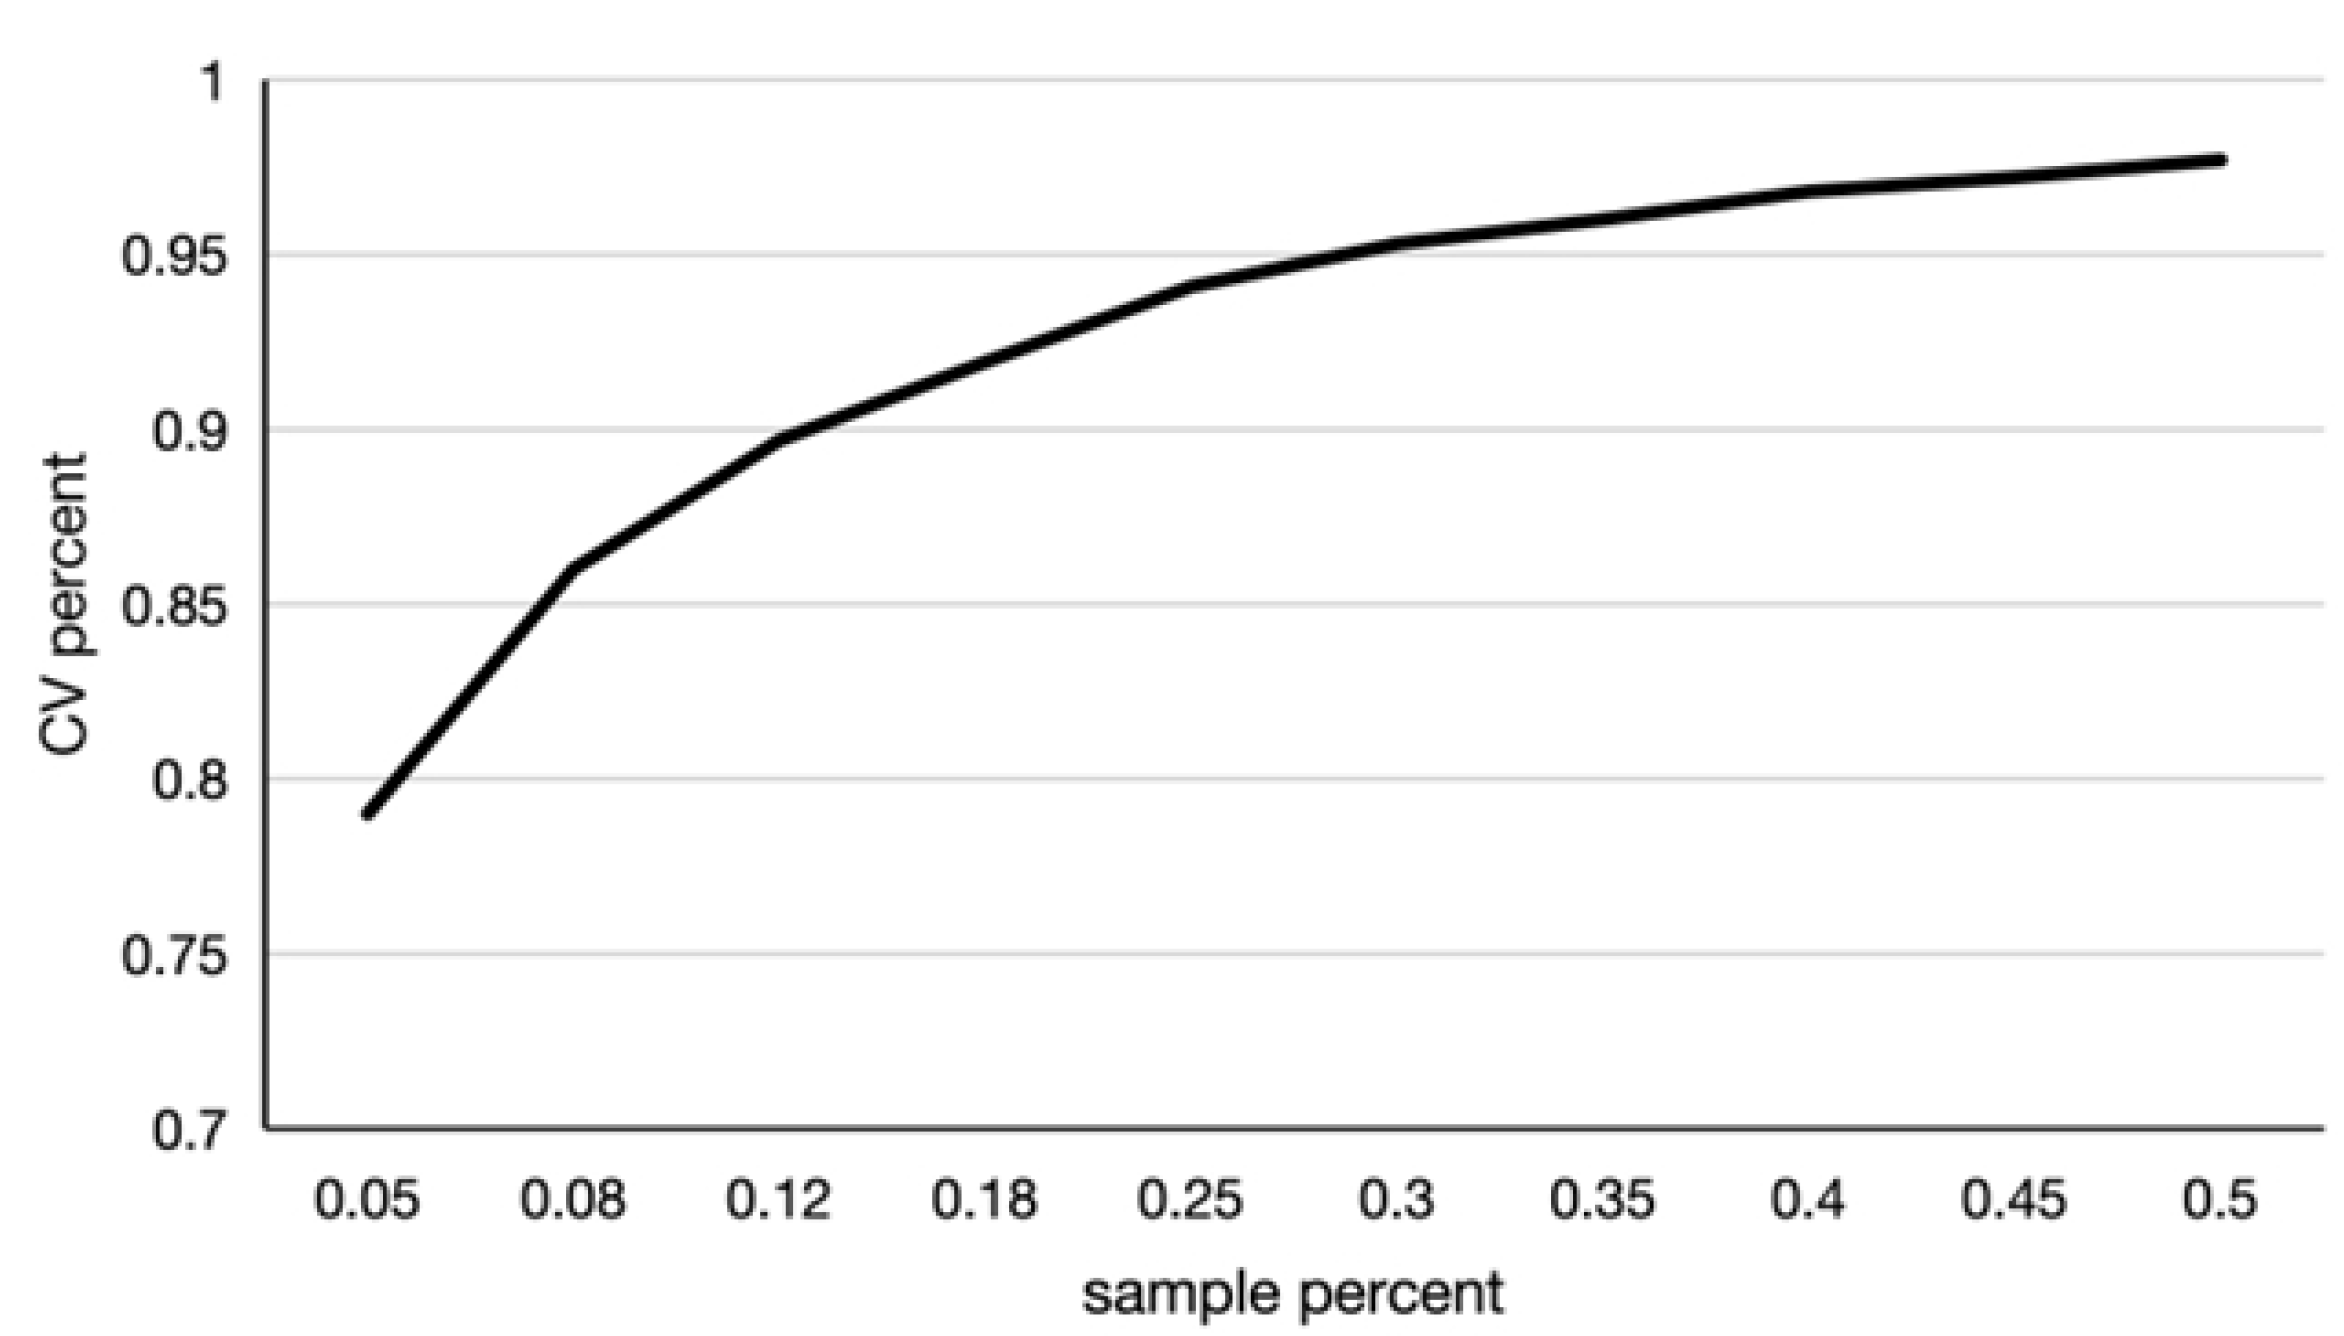
2.3.4. Core Germplasm Collection of Grapes

Based on the SNP markers’ co-consensuses [62], as well as their distribution across chromosomes, we selected a high-quality and discriminatory set of core SNP markers based on the even distribution of SNPs per chromosome and the principle of a minimum number of SNPs representing the maximum genetic diversity [63], and a total of 353 SNP markers were screened and used for the subsequent analysis. To encode all the genotypic data and supply a 2D barcode fingerprint for every core, we used the online software Caoliaoerweima (http://cli.im/ (accessed on 20 May 2024)). Each 2D fingerprint can supply a variety of information, including the variety name, type, and genotypical data, and can be accessed on both computers and mobile devices. Based on several genetic variables, we used the Core Hunter II software (http://www.corehunter.org (accessed on 20 October 2024)) to create a minimally repetitive core germplasm collection which is representative of the entire accession base.

3. Results

3.1. Mutation Detection in Thompson Seedless Grapes

We performed whole-genome resequencing on 100 Thompson seedless grape samples collected from three different regions. After thorough filtering of the sequencing data, we obtained high-quality clean data, covering various metrics such as sequencing data yield, sequencing error rate, Q20 and Q30 content, GC content, and others. This sequencing project, involving 100 samples, produced a significant amount of high-quality data, amounting to 454 Gb in total. The average effectiveness rate was 98.66%. The average percentage of bases with mass values ≥ 20 (Q20) was 97.99%, and the average percentage of bases with mass values ≥ 30 (Q30) was 94.83%. The average GC content was also determined to be 36.01% (for detailed data, see Supplementary Table S1). Regarding sequencing depth and coverage, the average depth across the 100 samples was 12.32. The average coverage at 1× was 96.94%, and the average coverage at 4× was 88.36%. It is worth noting that over 96.82% of the sequenced reads from the grape samples matched the reference genome (for more details, refer to Supplementary Table S2).
Our investigation into SNP detection identified a total of 20,074,046 SNP variant sites. Specifically, 811,303 SNPs were situated upstream, 744,937 SNPs were downstream, and 13,712,792 SNPs were intergenic. Moreover, 73,157 SNPs were detected within the 1 Kb regions flanking genes (both upstream and downstream). Within the exonic regions, there were 555,982 variants, comprising 10,355 stop gain, 1074 stop loss, 223,171 synonymous, and 321,382 non-synonymous variants. Additionally, 3,573,297 SNPs were intronic, 3889 were splicing-related, and 13,712,792 were intergenic. There were 13,892,353 SNP variant loci of the transitions type and 6,181,693 SNP variant loci of the transversions type (for detailed data, see Supplementary Table S3). The distribution of these SNP sites across the chromosomes is depicted in Figure 2A and Supplementary Figure S1, with denser regions shaded darker and less dense regions shaded lighter.
Our analysis of InDel detection uncovered a total of 3,043,093 InDel variant sites. Specifically, 203,638 InDels were identified in upstream regions, 175,996 in downstream regions, and 1,832,021 in intergenic regions. In addition, 17,757 InDels were detected within the 1 Kb flanking regions of genes (both upstream and downstream). Within the exonic regions, there were 533,460 variants, including 1437 stop gain, 99 stop loss, 12,244 frameshift deletions, and 5457 non-frameshift deletions. Furthermore, 576,103 InDels were found in intronic regions and 1036 in splicing regions (for detailed data, see Supplementary Table S4). The distribution of these InDel sites across the chromosomes is illustrated in Figure 2B and Supplementary Figure S2, with denser regions shaded darker and less dense regions shaded lighter. The findings indicate that the majority of InDels are concentrated in the upstream and downstream regions of genes, as well as in intronic regions.
To comprehensively understand gene functions, we performed a gene ontology (GO) analysis, categorizing genes according to three main aspects: biological processes, cellular components, and molecular functions (Figure 3). For biological processes, the GO analysis revealed that genes are engaged in a wide range of crucial biological activities. This encompasses basic cellular functions like metabolism, cell cycle control, and signal transduction, along with more specialized functions such as the immune response, development, and neuronal communication. Regarding cellular components, the GO analysis offered valuable insights into the location and arrangement of gene-derived products within cells. In terms of molecular function, the genes related to nucleoside-triphosphatase activity, hydrolase activity, and those acting on ester bonds are more frequent. In the cellular component, genes related to membrane-bounded organelle and the cytoplasmic part are more frequent. In the biological process, the genes related to the response to stimulus, small molecule metabolic process are more frequent.
To further optimize germplasm resource management and provide enhanced data support for grape breeding, we conducted core germplasm screening for Thompson Seedless grapes based on resequencing data, establishing a core germplasm bank for this cultivar. Five rounds of gradient sampling were performed randomly from the population, and the coverage value (CV) was calculated for each round. The relationship between the core germplasm size and allelic coverage rate was plotted. Using a CV threshold of 94%, 25 accessions were ultimately selected as the core germplasm, forming the core germplasm bank (Figure 4).

3.2. Genetic Diversity of Thompson Seedless

Using 16 SSR loci, the genetic variation in 165 grape samples was estimated. Ultimately, we identified 442 alleles across the 165 grape samples, with an average of 27.63 alleles per SSR marker.
The number of alleles (Na) ranged from 21 (for VVMD7, VMC4F3-1, and VVIb01) to 39 (for UDV-015). The average number of effective alleles (Ne) across the 16 SSR loci was 5.41, with the maximum value of 13.72 at the UDV-015F locus and a minimum of 1.95 at the VVMD7 locus. The observed heterozygosity (Ho) ranged from a maximum of 1 (for VVIP31 and Vchr8a) to a minimum of 0.24 (for VVS4), with an average of 0.83. The expected heterozygosity (He) ranged from a maximum of 0.93 (for UDV-015) to a minimum of 0.49 (for VVMD7), with an average of 0.76. Among the 16 primer pairs screened, the Ne, Ho, and He values showed good polymorphism. The polymorphic information content (PIC) varied between 0.83 and 0.98, with an average of 0.92. As many as 16 SSR markers had a PIC value greater than 0.50, indicating a high level of polymorphism. The Shannon information index (I) had a maximum value of 2.98 (for UDV-015F) and a minimum of 1.21 (for VVMD7F). The complete genetic diversity values are presented in Table 2.
The effective number of alleles (Ne) averaged 3.77, 6.07, and 4.31 for the three populations. The population from TGV exhibited the highest Shannon information index (I), with an average of 1.92, indicating the richest genetic diversity. Conversely, the TDBG showed the lowest I value of 1.48, suggesting potentially lower genetic diversity. This information is instrumental for researchers in guiding future germplasm protection efforts. The observed heterozygosity (Ho) and expected heterozygosity (He) confirmed the higher genetic diversity of the TGV population, while the lower Ho and He values in the TDBG implied lower genetic diversity and a higher level of inbreeding. The observed negative fixation (F) indices were consistent across the three regions. The values of the genetic diversity parameters among the three populations are shown in Table 3.
The quantitative analysis of genetic differentiation, conducted through fixation indices (FSTs) and gene flow (Nm) estimates, further illuminated the genetic connections between the populations. In particular, the high Nm values at the VMC4F3-1, VVIP31, VRZAG67, and VVIb01 loci indicated significant gene exchange, with these loci playing a pivotal role in genetic interchange.
Based on the genetic distance matrix, the principal coordinate analysis (PCoA) indicated that the first, second, and third axes accounted for 9.05%, 3.42%, and 3.08% of the SSR variation, respectively (Figure 5). An analysis of variance (ANOVA) of the molecular variance showed that 96% of the variance came from within populations and 4% from among populations. In the three Thompson Seedless populations in Xinjiang, it was observed that there was a similar genetic structure between populations 2 and 3, and there was a low level of similarity between the genetic structures of populations 1, 2, and 3.

3.3. Whole-Genome Resequencing Elucidates Genetic Diversity and Core Collection of Munake Grape Cultivars

For preliminary genome-wide SNP analysis, the 141 collected Munake grape accessions were resequenced. Many SNPs (69,214,080) were generated from the resequencing of 141 grape cultivar accessions, which were then subjected to stringent quality control to produce a set of clean reads. Quality scores were assigned to the data, with 89.03% of reads having a score of Q30, and 95.21% of reads having a score of Q20, with a base error rate of <1%. Overall, the clean data showed a normal GC distribution and a high sequencing quality.
An ADMIXTURE analysis showed that the cross-validation error rate was smallest at K = 4 (Figure 6A), indicating a tendency for the entire sample to cluster into four groups, independent of their origin or collection site (Figure 6B).
According to the distribution of SNP markers across the reference genome, we identified 353 SNP sites distributed. The minor allele frequency (MAF) of these SNPs ranged from 0.340 to 0.50 (average = 0.418), with observed heterozygosity (Ho) values between 0.459 and 0.621 (average = 0.568). Genetic diversity ranged from 0.454 to 0.502 (average = 0.485), and polymorphism information content (PIC) values between 0.350 and 0.375 accounted for over 75% of the loci (Table 4). Quality control confirmed that these SNP markers exhibited complete genotypic data, homozygosity dominance, and consistent identification across all 141 Munake accessions. Ultimately, 42 samples were identified for fingerprinting based on core germplasm selection (Supplementary Figure S4). A QR-encoded 2D barcode system was implemented to link genotypic data with individual accessions (Supplementary File S2).

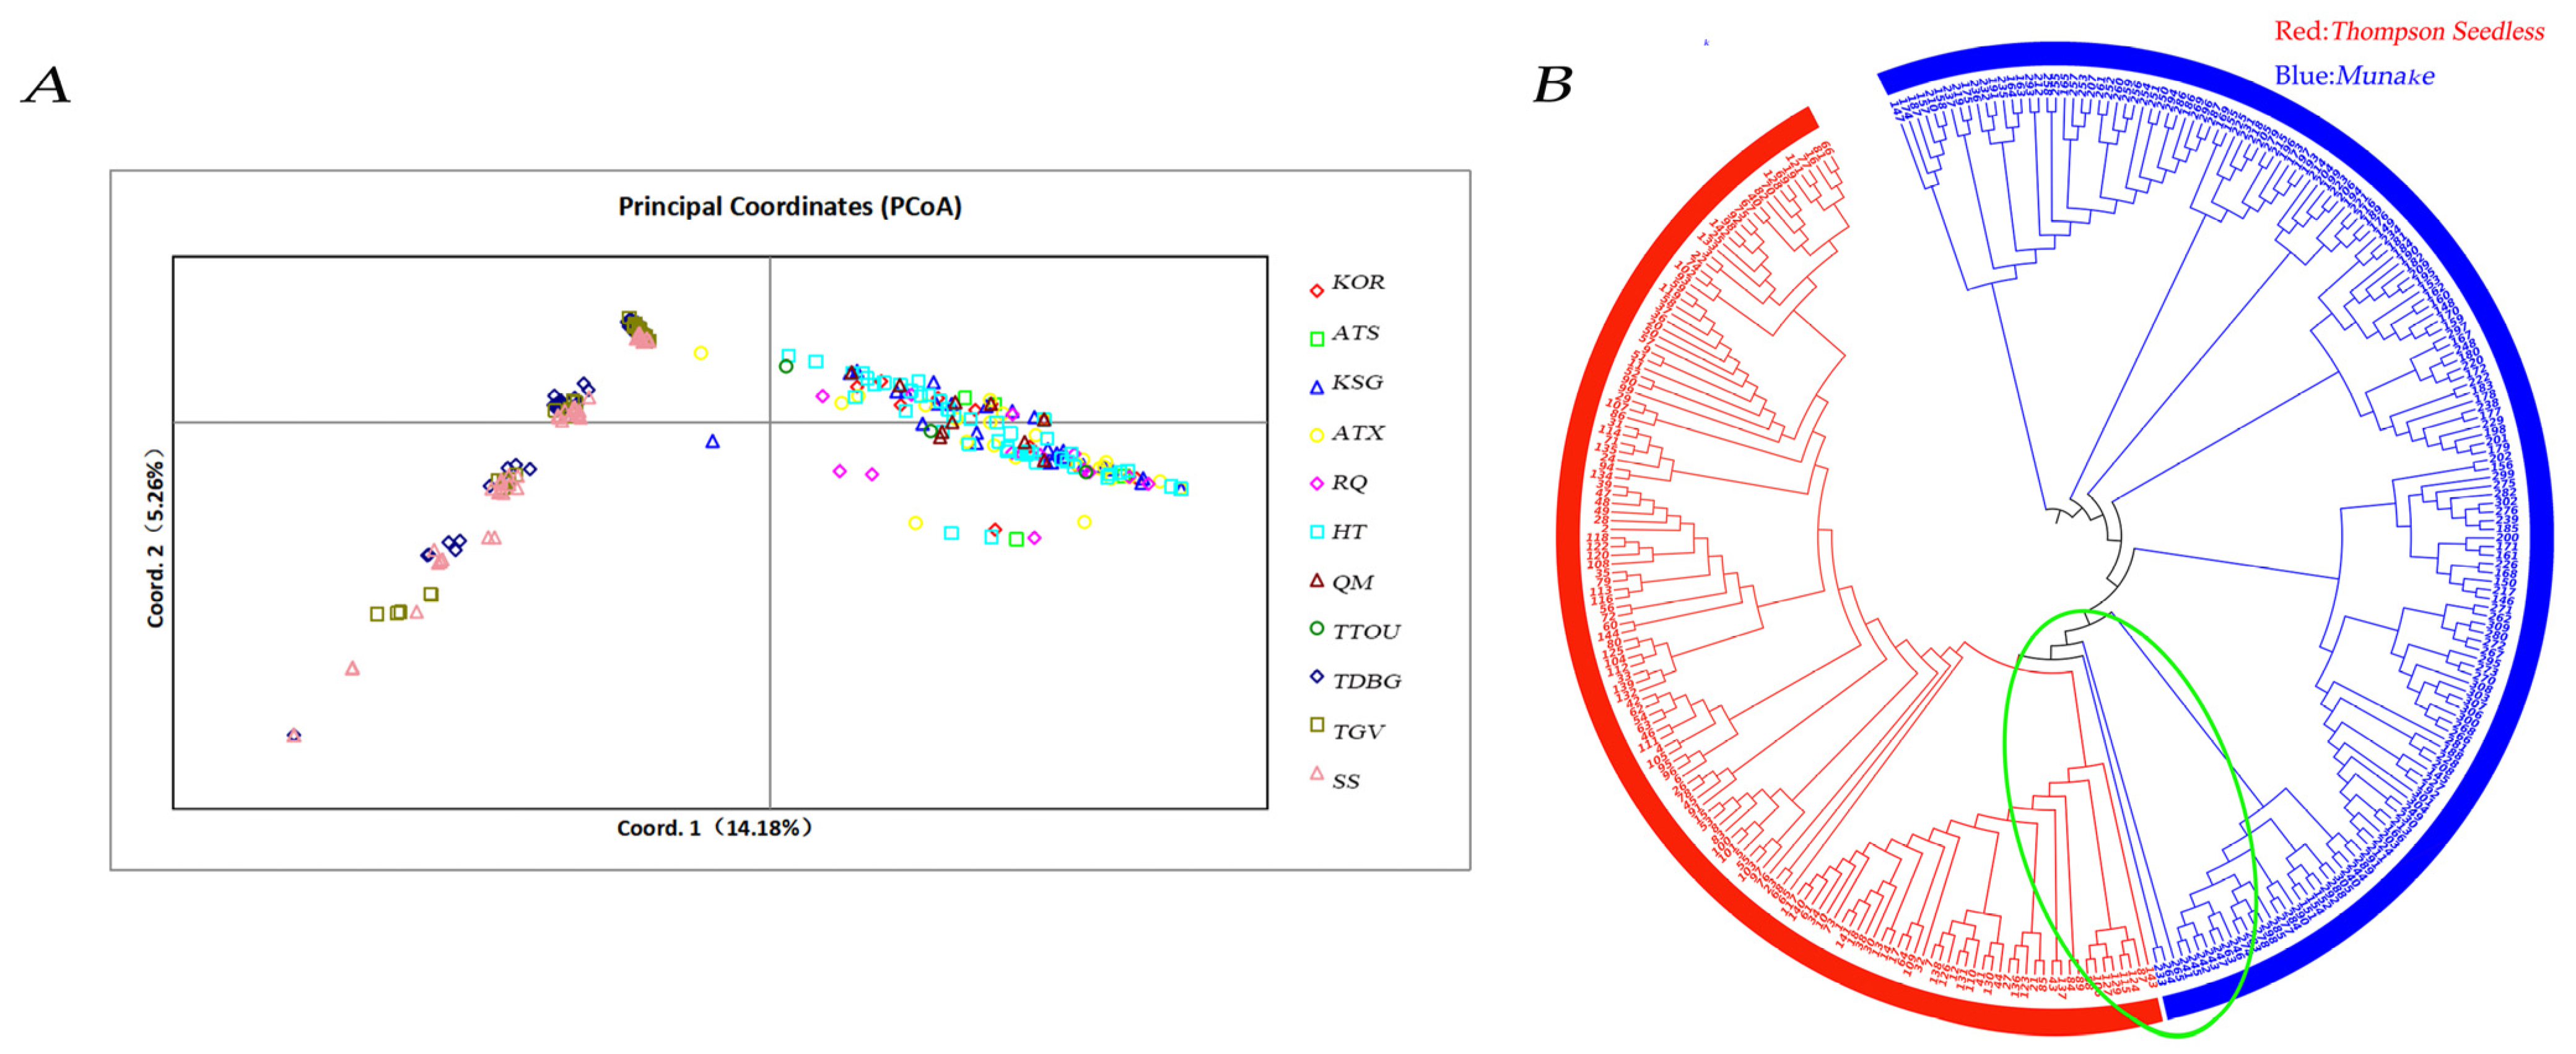
3.4. Analysis of the Relationship Between Thompson Seedless and Munake Grapes

We performed a joint analysis using the existing SSR labeling data for Munake, as well as the newly generated data for Thompson Seedless, and we analyzed the genetic diversity between these two varieties. The Shannon information index (I) for the populations in 11 regions ranged from 1.03 to 1.96; the average value between the Munake populations was 1.56, and the average value between the Thompson Seedless populations was 1.52. The observed heterozygosity (Ho) in these 11 regions ranged from 0.77 to 0.88; the average value between the Munake populations was 0.80 and the average value between the Thompson Seedless populations was 0.85. This may indicate that they have similar richness in terms of genetic diversity and a close genetic relationship. In this study, the genetic differentiation of the populations was also tested through each locus’s fixation indices (FIS, FST), and the F-statistic results for each locus were as follows. The inbreeding coefficient (FIS) for six microsatellite loci ranged from −0.37 to 0.36. The fixation index (FST) ranged from 0.11 to 0.21. There was a certain degree of genetic differentiation between the populations in different regions, but the overall degree of differentiation was not particularly high. The gene flow (Nm) value was between 0.93 and 2.01. Regarding the magnitude of gene flow, VVIP31 showed the highest degree of gene exchange, with 83.3% of the gene loci Nm values being greater than 1. Overall, the average extent of gene flow between the sites was 1.28. An analysis of the genetic differentiation and gene flow among the 11 different populations showed that the Dest values ranged from 0.37 to 0.56 and the Gst values ranged from 0.08 to 0.18. These differences in genetic differentiation among the populations in different regions are of great significance for the protection and utilization of grape germplasm resources. They reflect the genetic diversity and adaptability of populations and can help to formulate effective germplasm conservation strategies. For detailed results, see Table 5 and Table 6. However, the Munake populations Artux and Utuprague exhibited notably lower values for Na, Ne, I, and H. It is critical to acknowledge that the small sample sizes of these two populations (n = 4 and n = 3, respectively) may lead to an underestimation of genetic diversity and inflated statistical errors. For this reason, we performed a significant difference analysis to verify the effect of the sample size of the two populations on the results, which showed that Na is significantly affected by the number of samples, whereas Ne, I, and He show a non-significant effect (Supplementary Figure S5). Future studies with expanded sampling are required to validate these observations.
We performed a PCoA on the samples of the two varieties. In the PCoA diagram, it can clearly be seen that Thompson Seedless and Munake are divided into two large populations, and there is strong genetic differentiation between the Munake and the Thompson Seedless populations. In the PCoA plot, PC1 accounts for 14.18% and PC2 accounts for 5.26% of the variation (Figure 7A). The use of primers consistent with Munake can not only aid in the analysis of the genetic diversity of Thompson Seedless but also contribute to the identification of different varieties. In addition, the PCoA diagram shows that some individuals from the Munake grapes gathered near the Thompson Seedless grapes, which also reflected the correlation between them. Moreover, in the PCoA results, the Munake individuals showed a dispersed pattern, whereas the Thompson Seedless individuals were mostly clustered at three points, which may have resulted from the different planting styles implemented for the two grapes.
The clustering tree also explained the results of the PCoA. The developmental tree did not accurately separate the two varieties, and the Thompson Seedless individuals were more likely to serve as sub-branches of Munake (see the circled area in Figure 7B). This implies that there is a genetic relationship between the individuals in both grape varieties and that the Thompson Seedless grapes may be based on the Munake grapes bred for the purpose of this study.
Bayesian clustering revealed significant differences in the genetic structure between Thompson Seedless and Munake. ΔK indicated that the best classification result was at K = 4. The population structure analysis plots from K = 3 to K = 5 illustrate that Munake was the first to begin to show intra-population structural differentiation at K = 3, while Seedless White did not show intra-population structural differentiation until K = 5 (Figure 8A). The population structure analysis (Figure 8B) revealed the trends in the parameters corresponding to the K values and ΔK, showing a clear inflection point at K = 4, indicating that the sample individuals may have contained four genetic subgroups. When K = 4, populations 3, 5, 7, and 9 are clustered together. At K = 4, the genetic structure of the Munake populations shows slight differences between some regions, while the Thompson Seedless populations do not differ in their genetic structure according to the planting location (Figure 8C).

4. Discussion

In crop breeding systems, the characterization and application of genetic diversity hold particular significance. Molecular markers capable of detecting DNA-level polymorphisms have been widely adopted as robust tools for diversity assessment [64,65]. Among these, simple sequence repeat (SSR) markers have emerged as particularly valuable for genetic fingerprinting due to their high abundance, polymorphism, codominant inheritance patterns, technical reproducibility, and adaptability to automated platforms [66,67,68,69,70]. Our analyses substantiated the efficacy of SSR markers, revealing substantial polymorphism across 16 loci [71]. Through genotyping 165 samples, we identified 442 alleles with an average of 27.63 alleles per locus. Genetic diversity parameters showed expected heterozygosity (He) = 0.76 and observed heterozygosity (Ho) = 0.83. An analysis of molecular variance (AMOVA) indicated that 96% of genetic variation occurred within populations, with limited inter-population differentiation (Fst = 0.04). A further population genetic analysis indicated that materials were not strictly grouped by geographic origin, findings consistent with the reproductive characteristics of Thompson Seedless. These findings collectively highlight the genetic vulnerability inherent to clonally propagated crops and underscore the imperative to develop dynamic conservation frameworks incorporating wild germplasms [72]. Phylogenetic reconstruction using SSR markers suggested that Thompson Seedless may represent a domesticated derivative of Munake grapes. Population structure analysis (K = 4) revealed subtle differentiation within Munake populations, likely attributable to gene flow from sympatric varieties. This observation aligns with Munake’s reproductive biology characterized by natural outcrossing and seed-based propagation. Conversely, Thompson Seedless exhibited genetic homogeneity across populations, reflecting constrained variation under intensive clonal cultivation. Notably, this study has limitations, including the potential underestimation of genetic diversity parameters in the Artux (n = 4) and Utuprague (n = 3) populations due to small sample sizes. A significant difference analysis confirmed that the Na (allele number) correlated significantly with sample size (Supplementary Figure S1). Future research should expand sampling, integrate epigenetics to quantify clonal variation from cultivation practices, and apply these insights to molecular breeding.
The establishment of a core collection will significantly enhance the efficiency of germplasm management and utilization [73,74]. Core collections built using molecular markers are less susceptible to environmental or external factors. In this study, using a high-throughput SNP genotyping platform, we selected and developed a set of core SNP markers from the initial SNP dataset of Thompson Seedless, achieving 94% variant coverage. A total of 25 accessions were identified as representative of the core germplasm bank for Thompson Seedless. The low variation level in Thompson Seedless is closely tied to its propagation traits, as clonal propagation restricts new variation generation. The Munake core germplasm bank established in this study (42 accessions, 353 SNP markers) captured 95% of allelic diversity. Its high polymorphism (PIC = 0.36–0.37) and homozygosity consistency effectively resolved synonym issues (e.g., regionally synonymous cultivars). The integration of KASP (Kompetitive Allele-Specific PCR) technology and a QR-encoded barcoding system enabled rapid genotype validation and portable data access, providing a model for digital germplasm management. As a vital cultivated crop, the genetic variations in grapes are primarily concentrated in structural variations (SVs). Performing an SNP (single-nucleotide polymorphism) analysis effectively complements the limitations of SSR (simple sequence repeat) studies, enabling the exploration of more extensive genetic variation. Munake grapes, representing small-scale farmer cultivation, exhibit higher genetic diversity compared to Thompson Seedless grapes. The latter, due to clonal propagation and intensive cultivation practices, suffer from severe genetic homogenization, resulting in significant loss of genetic information. Our core germplasm results demonstrate that to achieve the same variant coverage, the number of core accessions required for Munake grapes (29%) exceeds that for Thompson Seedless (25%). This validates the critical impact of different cultivation modes on grape genetic diversity.
The Xinjiang region plays a pivotal role in grape domestication and dissemination, and studies on the genetic diversity of its grape cultivars hold significant reference value for genetic breeding [5]. Among these, Thompson Seedless and Munake grapes, two major Eurasian cultivars cultivated in China for nearly a millennium, represent distinct agricultural practices: dispersed cultivation and intensive cultivation. This study marks the first investigation into the genetic diversity and phylogenetic relationships of these two cultivars using SSR and SNP molecular markers, contributing substantially to germplasm conservation, varietal identification, and marker-assisted breeding. Through screening their core germplasm collections, we explored the critical impact of different cultivation practices on grape genetic diversity, revealing that Thompson Seedless faces more urgent conservation challenges due to severe genetic homogenization caused by clonal propagation. Our findings demonstrate that introducing natural gene flow (e.g., seed propagation and hybridization with wild germplasms) into clonal propagation-dominated systems is a vital strategy to mitigate genetic erosion and enhance varietal adaptability. Future research must integrate functional genomics and phenotypic data to design targeted conservation and breeding strategies, balancing the sustainability and stress resilience of Xinjiang’s grape industry [9,75].

5. Conclusions

This study employed SSR molecular markers and whole-genome resequencing technologies to reveal significant genetic homogenization in Thompson Seedless grapes (96% of genetic variation originating within populations, Fst = 0.04) caused by long-term clonal propagation and intensive cultivation, sharply contrasting with Munake grapes, which maintained high genetic diversity through natural gene flow. Based on whole-genome data, 25 core germplasm accessions of Thompson Seedless (retaining 94% allelic diversity) and 42 core accessions of Munake (retaining 95% allelic diversity) were identified. A QR code-based genotypic fingerprint database was constructed using highly polymorphic SNP markers, effectively resolving synonym issues caused by homonymous naming. A phylogenetic analysis supported the origin of Thompson Seedless from a domesticated branch of Munake. For germplasm conservation, introducing gene flow is critical for Thompson Seedless to mitigate genetic erosion. Limitations in sample size and mechanisms underlying clonal variation warrant further investigation. Future research should integrate multi-omics approaches to optimize stress-resilient breeding strategies for Xinjiang’s viticulture industry.

Supplementary Materials

The following supporting information can be downloaded at: https://www.mdpi.com/article/10.3390/agriculture15080871/s1. Table S1: The Nei genetic distances between the nine populations; Table S2: The pairwise population Fst values between the nine populations; Table S3: The pairwise population matrix of the Dest values for the total population; Table S4: The probabilities of the G-statistics for the total population. Table S5: all_gene_GOenrich; Table S6: var_gene_GOenrich; Supplementary Table S1: Results of the data filtering statistical table for Thompson Seedless grapes. Supplementary Table S2: Mapping rate. Supplementary Table S3: SNP annotation statistics. Supplementary Table S4: InDeL annotation statistics. Supplementary File S1: Statistics of the 141 Munake resequencing samples. Supplementary File S2: Two-dimensional barcode generated from the resequencing data of Munake grapes. Supplementary Figure S1: Distribution of SNP loci; Supplementary Figure S2: Distribution of indel loci; Supplementary Figure S3: A saturation curve of the 42-core collection identified in 141 Munake cultivated grape germplasm collections; Supplementary Figure S4: Population structure of the 141 Munake cultivated grapes’ accessions at different values of K; Supplementary Figure S5: Significance analysis of sample size on genetic diversity parameters.

Author Contributions

S.L.: Formal analysis, Investigation, Validation, Visualization, Writing—original draft; J.W.: Conceptualization, Data curation, Funding acquisition, Project administration, Writing—original draft; X.L.: Formal analysis, Investigation, Resources, Visualization; X.W. (Xianhang Wang): Data curation, Validation, Visualization, Resources; X.W. (Xiyong Wang): Investigation, Resources; H.Z.: Investigation, Resources; I.A.: Investigation, Data curation; F.S.: Investigation, Data curation; H.L.: Conceptualization, Methodology, Supervision, Writing—review and editing; W.S.: Conceptualization, Funding acquisition, Methodology, Supervision, Writing—review and editing, Data curation. All authors have read and agreed to the published version of the manuscript.

Funding

This study was supported by the Chinese Academy of Science (Project No. 2021-XBQNXZ-013) and Xinjiang Uygur Autonomous Region Science and Technology Department, (Project No. 2023TSYCCXO024).

Institutional Review Board Statement

Not applicable.

Data Availability Statement

The data presented in this study are available on request from the corresponding author.

Acknowledgments

We would like to express our gratitude to Tianjin JiZhi Gene Technology Co.

Conflicts of Interest

The authors declare no conflicts of interest.

References

  1. Wei, L.Q.; Lu, S.X.; Ma, Z.H.; Guo, R.; Mao, J. Quality Evaluation of 10 Wine Grape Cultivars in Jia yu guan Based on Principal Component Analysis. J. Gansu Agric. Univ. 2020, 55, 90–96. [Google Scholar] [CrossRef]
  2. Estrada, J.L.; Arboleda, M.D.M.; Dionisio-Sese, M.L. Current status of sea grapes (Caulerpa spp.) farming and wild harvesting in the Philippines. J. Appl. Phycol. 2021, 33, 3215–3223. [Google Scholar] [CrossRef]
  3. Ye, Q.T.; Li, Y.M.; Zhou, Y.Y.; Li, X.H.; Zhang, W.; Sun, Q.; Han, C.P.; Yan, J.Y. Occurrence and Harm of Grape Trunk Diseases and Pathogen Types at Home and Abroad. Acta Hortic. Sin. 2021, 38, 278–292. [Google Scholar] [CrossRef]
  4. Swarup, S.; Cargill, E.J.; Crosby, K.; Flagel, L.; Kniskern, J.; Glenn, K.C. Genetic diversity is indispensable for plant breeding to improve crops. Crop Sci. 2021, 61, 839–852. [Google Scholar] [CrossRef]
  5. Yang, D.; Duan, S.C.; Xia, Q.J.; Liang, Z.; Dong, X.; Margaryan, K.; Musayev, M.; Goryslavets, S.; Zdunić, G.; Bert, P.-F.; et al. Dual domestications and origin of traits in grapevine evolution. Science 2023, 379, 892–901. [Google Scholar] [CrossRef]
  6. Sousa, B.; Araújo, S.d.S.; Sales, H.; Pontes, R.; Nunes, J. Douro Vineyards: A Perspective for the Valorization and Conservation of Grapevine Genetic Resources. Agronomy 2024, 14, 245. [Google Scholar] [CrossRef]
  7. Guo, D.-L.; Zhang, J.-Y.; Liu, C.-H. Genetic diversity in some grape varieties revealed by SCoT analyses. Mol. Biol. Rep. 2012, 39, 5307–5313. [Google Scholar] [CrossRef]
  8. Abudu, M.; Abudukelimu, A.; Liu, Y.S. Challenges and Strategies in the Production of Atush Munake Grapes. Mod. Agric. 2019, 2019, 70–72. [Google Scholar] [CrossRef]
  9. Zhong, H.X.; Zhang, F.C.; Zhou, X.M.; Pan, M.Q.; Xu, J.; Hao, J.Z.; Han, S.A.; Mei, C.; Xian, H.; Wang, M.; et al. Genome-Wide Identification of Sequence Variations and SSR Marker Development in the Munake Grape Cultivar. Front. Ecol. Evol. 2021, 9, 664835. [Google Scholar] [CrossRef]
  10. Xi, Z.Y.; Zhang, J.W.; Tang, D.M.; Zhang, Z.Q.; Ping, W.X. Research status and development of grape production around Tarim Basin. Sino-Overseas Grapevine Wine 2008, 50–53. [Google Scholar]
  11. Luo, Q.W.; Wu, G.H.; Sun, F.; Li, Y.L.; Wang, Y. Innovation and utilization of Grape germplasm resources in Xinjiang. Sino-Overseas Grapevine Wine 2015, 61–63. [Google Scholar]
  12. Liu, A.H.; Yue, C.Y.; Kong, T.T.; Jiao, S.P.; Zhang, J.W.; Zang, X.P.; Yang, J. Analysis of soil nutrient status of Munake vineyards in Atux city of Xinjiang. Chin. Agric. Sci. Bull. 2015, 31, 199–202. [Google Scholar]
  13. Yang, C.S. The beginning and evolution of viticulture in China. Sino-Overseas Grapevine Wine 2003, 4–7. [Google Scholar]
  14. Barnaud, A.; Lacombe, T.; Doligez, A. Linkage disequilibrium in cultivated grapevine, Vitis vinifera L. Theor. Appl. Genet. 2006, 112, 708–716. [Google Scholar] [CrossRef] [PubMed]
  15. Belaj, A.; de la Rosa, R.; Lorite, I.J.; Mariotti, R.; Cultrera, N.G.M.; Beuzón, C.R.; González-Plaza, J.J.; Muñoz-Mérida, A.; Trelles, O.; Baldoni, L. Usefulness of a New Large Set of High Throughput EST-SNP Markers as a Tool for Olive Germplasm Collection Management. Front. Plant Sci. 2018, 9, 215. [Google Scholar] [CrossRef]
  16. Palumbo, F.; Galvao, A.C.; Nicoletto, C.; Sambo, P.; Barcaccia, G. Diversity Analysis of Sweet Potato Genetic Resources Using Morphological and Qualitative Traits and Molecular Markers. Genes 2019, 10, 840. [Google Scholar] [CrossRef]
  17. Chikh-Rouhou, H.; Mezghani, N.; Mnasri, S.; Mezghani, N.; Garcés-Claver, A. Assessing the Genetic Diversity and Population Structure of a Tunisian Melon (Cucumis melo L.) Collection Using Phenotypic Traits and SSR Molecular Markers. Agronomy 2021, 11, 1121. [Google Scholar] [CrossRef]
  18. Kant, R.; Meena, R.K.; Garg, R.; Vikas; Yadav, A.; Bhandari, M.S. De Novo SSR markers development and genetic diversity assessment in Ailanthus excelsa in India. Physiol. Mol. Biol. Plants 2025, 1–17. [Google Scholar] [CrossRef]
  19. Emanuelli, F.; Lorenzi, S.; Grzeskowiak, L.; Catalano, V.; Stefanini, M.; Troggio, M.; Myles, S.; Martinez-Zapater, J.M.; Zyprian, E.; Moreira, F.M.; et al. Genetic diversity and population structure assessed by SSR and SNP markers in a large germplasm collection of grapes. BMC Plant Biol. 2013, 13, 39. [Google Scholar] [CrossRef]
  20. Song, X.F.; Wei, H.C.; Cheng, W.; Yang, S.X.; Zhao, Y.X.; Li, X.; Luo, D.; Zhang, H.; Feng, X.Z. Development of INDEL Markers for Genetic Mapping Based on Whole Genome Resequencing in Soybean. G3-Genes Genomes Genet. 2015, 5, 2793–2799. [Google Scholar] [CrossRef]
  21. Doligez, A.; Bertrand, Y.; Farnos, M.; Grolier, M.; Romieu, C.; Esnault, F.; Dias, S.; Berger, G.; François, P.; Pons, T.; et al. New stable QTLs for berry weight do not colocalize with QTLs for seed traits in cultivated grapevine (Vitis vinifera L.). BMC Plant Biol. 2013, 13, 217. [Google Scholar] [CrossRef]
  22. Lijavetzky, D.; Cabezas, J.A.; Ibáñez, A.; Rodríguez, V.; Martínez-Zapater, J.M. High throughput SNP discovery and genotyping in grapevine (Vitis vinifera L.) by combining a re-sequencing approach and SNPlex technology. BMC Genom. 2007, 8, 424. [Google Scholar] [CrossRef] [PubMed]
  23. Cabezas, J.A.; Ibáñez, J.; Lijavetzky, D.; Vélez, D.; Bravo, G.; Rodríguez, V.; Carreño, I.; Jermakow, A.M.; Carreño, J.; Ruiz-García, L.; et al. A 48 SNP set for grapevine cultivar identification. BMC Plant Biol. 2011, 11, 153. [Google Scholar] [CrossRef]
  24. Lambert, P.; Campoy, J.A.; Pacheco, I.; Mauroux, J.-B.; Da Silva Linge, C.; Micheletti, D.; Bassi, D.; Rossini, L.; Dirlewanger, E.; Pascal, T.; et al. Identifying SNP markers tightly associated with six major genes in peach [Prunus persica (L.) Batsch] using a high-density SNP array with an objective of marker-assisted selection (MAS). Tree Genet. Genomes 2016, 12, 121. [Google Scholar] [CrossRef]
  25. Chalbi, A.; Chikh-Rouhou, H.; Mezghani, N.; Slim, A.; Fayos, O.; Bel-Kadhi, M.S.; Garcés-Claver, A. Genetic Diversity Analysis of Onion (Allium cepa L.) from the Arid Region of Tunisia Using Phenotypic Traits and SSR Markers. Horticulturae 2023, 9, 1098. [Google Scholar] [CrossRef]
  26. Li, S.S.; Sun, C.Y.; Jiang, S.C.; Wang, K.Y.; Wang, Y.; Zhang, M.P. SSR molecular markers and their application in plant genetics and breeding. Jilin Shucai (Jilin Veg.) 2014, 33–38. [Google Scholar]
  27. Thomas, M.R.; Scott, N.S. Microsatellite repeats in grapevine reveal DNA polymorphisms when analysed as sequence-tagged sites (STSs). Theor. Appl. Genet. 1993, 86, 985–990. [Google Scholar] [CrossRef]
  28. Wang, Y.L.; Jiang, Y.S.; Qu, Z.C.; Shan, L. Application of SSR Markers in Crop Germplasm Identification. Shandong Nong Ye Ke Xue (Shandong Agric. Sci.) 2012, 44, 11–18. [Google Scholar] [CrossRef]
  29. Wang, C.X. Application of SSR Molecular Marker Technology in Maize Variety Identification and Protection. Master’s Thesis, Xinjiang Agricultural University, Ürümqi, China, 2007; pp. 1–2. [Google Scholar]
  30. Bowers, J.E.; Dangl, G.S.; Vignani, R.; Meredith, C.P. Isolation and characterization of new polymorphic simple sequence repeat loci in grape (Vitis vinifera L.). Genome 1996, 39, 628–633. [Google Scholar] [CrossRef]
  31. Zhang, S.; Li, Y.; Li, Y.; Zhang, Y.; Hao, Y.; Hou, Z.; Qi, J. Development of SSR Markers for and Fingerprinting of Walnut Genetic Resources. Forests 2024, 15, 405. [Google Scholar] [CrossRef]
  32. Lu, X.; Adedze, Y.M.N.; Chofong, G.N.; Gandeka, M.; Deng, Z.; Teng, L.; Zhang, X.; Sun, G.; Si, L.; Li, W. Identification of high-efficiency SSR markers for assessing watermelon genetic purity. J. Genet. 2018, 97, 1295–1306. [Google Scholar] [CrossRef] [PubMed]
  33. Chen, D.D.; Guan, L.P.; He, L.L. Universality Identification of Molecular Markers for Grape Seedlessness Genes. Chin. J. Agric. Sci. 2021. [Google Scholar] [CrossRef]
  34. Boz, Y.; Bakir, M.; Çelikkol, B.P.; Kazan, K.; Yilmaz, F.; Çakir, B.; Aslantas¸, S.¸.; Söylemezoğlu, G.; Yaşasin, A.S.; Özer, C.; et al. Genetic characterization of grape (Vitis vinifera L.) germplasm from Southeast Anatolia by SSR markers. Vitis 2011, 50, 99–106. [Google Scholar] [CrossRef]
  35. Yang, M.T.; Huang, Z.; Gan, J.P.; Xu, J.C.; Pang, J.L. Research progress of SSR molecular markers. Hangzhou Shifan Da Xue Xue Bao (J. Hangzhou Norm. Univ. Nat. Sci. Ed.) 2019, 18, 429–436. [Google Scholar]
  36. D’Onofrio, C.; de Lorenzis, G.; Giordani, T.; Natali, L.; Cavallini, A.; Scalabrelli, G. Retrotransposon-based molecular markers for grapevine species and cultivars identification. Tree Genet. Genomes 2010, 6, 451–466. [Google Scholar] [CrossRef]
  37. Villano, C.; Aiese Cigliano, R.; Esposito, S.; D’Amelia, V.; Iovene, M.; Carputo, D.; Aversano, R. DNA-Based Technologies for Grapevine Biodiversity Exploitation: State of the Art and Future Perspectives. Agronomy 2022, 12, 491. [Google Scholar] [CrossRef]
  38. Li, J. Current Status of Grape Germplasm Resources Research. Grape Cultiv. Wine Brew. 1998, 61–62. [Google Scholar]
  39. Zhao, Q.F.; Huang, L.P.; Liu, X.T.; Wang, M.; Xun, Z.L.; Ma, X.H. Advances in the Collection, Preservation, and Research Utilization of Grape Germplasm Resources in China. J. Fruit Resour. 2021, 2, 1–4. [Google Scholar] [CrossRef]
  40. Wang, Y.; Sun, F.; Li, Y.L.; Sulaiman, A.; Wu, G.; Guo, P. Identification of Xinjiang Local Grape Variety Resources and Their Phylogenetic Relationships Using SSR Markers. Northwestern Hortic. 2023, 40–44. [Google Scholar]
  41. Li, Z.B.; Ren, T.; Deng, J.J.; Chen, J.; Zhou, S.; Zeng, X.; Ma, J.; Li, F. Comparative Analysis of Chloroplast Genomes Among Three Varieties of Hibiscus mutabilis and Their Close Relatives. Guangxi Plants 2022, 42, 2007–2020. [Google Scholar]
  42. Aradhya, M.K.; Dangl, G.S.; Prins, B.H.; Boursiquot, J.-M.; Walker, M.A.; Meredith, C.P.; Simon, C.J. Genetic Structure and Differentiation in Cultivated Grape, Vitis vinifera L. Genet. Res. 2003, 81, 179–192. [Google Scholar] [CrossRef] [PubMed]
  43. Liu, S.; Zhong, H.; Zhang, F.; Wang, X.; Wu, X.; Wang, J.; Shi, W. Genetic Diversity and Core Germplasm Research of 144 Munake Grape Resources Using 22 Pairs of SSR Markers. Horticulturae 2023, 9, 917. [Google Scholar] [CrossRef]
  44. Riaz, S.; De Lorenzis, G.; Velasco, D.; Koehmstedt, A.; Maghradze, D.; Bobokashvili, Z.; Musayev, M.; Zdunic, G.; Laucou, V.; Walker, M.A.; et al. Genetic diversity analysis of cultivated and wild grapevine (Vitis vinifera L.) accessions around the Mediterranean basin and Central Asia. BMC Plant Biol. 2018, 18, 137. [Google Scholar] [CrossRef] [PubMed]
  45. Sabir, A.; Ikten, H.; Mutlu, N.; Sari, D. Genetic Identification and Conservation of Local Turkish Grapevine (Vitis vinifera L.) Genotypes on the Edge of Extinction. Erwerbs-Obstbau 2018, 60, 31–38. [Google Scholar] [CrossRef]
  46. Di Gaspero, G.; Peterlunger, E.; Testolin, R.; Edwards, K.J.; Cipriani, G. Conservation of microsatellite loci within the genus Vitis. Theor. Appl. Genet. 2000, 101, 301–308. [Google Scholar] [CrossRef]
  47. Adam-Blondon, A.F.; Roux, C.; Claux, D.; Butterlin, G.; Merdinoglu, D.; This, P. Mapping 245 SSR markers on the Vitis vinifera genome: A tool for grape genetics. Theor. Appl. Genet. 2004, 109, 1017–1027. [Google Scholar] [CrossRef]
  48. Sefc, K.M.; Regner, F.; Turetschek, E.; Glössl, J.; Steinkellner, H. Identification of microsatellite sequences in Vitis riparia and their applicability for genotyping of different Vitis species. Genome 1999, 42, 367–373. [Google Scholar] [CrossRef]
  49. Peakall, R.; Smouse, P.E. GENALEX 6.5: Genetic analysis in Excel. Population genetic software for teaching and research. Bioinformatics 2012, 28, 2537–2539. [Google Scholar] [CrossRef]
  50. Gil, J.; Um, Y.; Kim, S.; Kim, O.T.; Koo, S.C.; Reddy, C.S.; Kim, S.-C.; Hong, C.P.; Park, S.-G.; Kim, H.B.; et al. Development of Genome-Wide SSR Markers from Angelica gigas Nakai Using Next Generation Sequencing. Genes 2017, 8, 238. [Google Scholar] [CrossRef]
  51. Liu, F.; Hong, Z.; Xu, D.; Jia, H.; Zhang, N.; Liu, X.; Yang, Z.; Lu, M. Genetic Diversity of the Endangered Dalbergia odorifera Revealed by SSR Markers. Forests 2019, 10, 225. [Google Scholar] [CrossRef]
  52. Sonstebo, J.H.; Tollefsrud, M.M.; Myking, T.; Steffenrem, A.; Nilsen, A.E.; Edvardsen, O.M.; Johnskas, O.R.; El-Kassaby, Y.A. Genetic diversity of Norway spruce (Picea abies (L.) Karst.) seed orchard crops: Effects of number of parents, seed year, and pollen contamination. For. Ecol. Manag 2018, 411, 132–141. [Google Scholar] [CrossRef]
  53. Tamura, K.; Dudley, J.; Nei, M.; Kumar, S. MEGA4: Molecular evolutionary genetics analysis (MEGA) software version 4.0. Mol. Biol. Evol. 2007, 24, 1596–1599. [Google Scholar] [CrossRef] [PubMed]
  54. Li, H.; Handsaker, B.; Wysoker, A.; Fennell, T.; Ruan, J.; Homer, N.; Marth, G.; Abecasis, G.; Durbin, R.; Genome Project Data, P. The Sequence Alignment/Map format and SAMtools. Bioinformatics 2009, 25, 2078–2079. [Google Scholar] [CrossRef]
  55. Donald, F.; Pan, R.; Chen, H.; Li, Z.; Hu, J.; Aldana, R. Dnascope: High Accuracy Small Variant Calling Using Machine Learning. bioRxiv 2022. bioRxiv:2022.05.20.492556. [Google Scholar]
  56. Pei, S.; Liu, T.; Ren, X.; Li, W.; Chen, C.; Xie, Z. Benchmarking variant callers in next-generation and third-generation sequencing analysis. Brief. Bioinform. 2020, 22, bbaa148. [Google Scholar] [CrossRef]
  57. Wang, K.; Li, M.; Hakonarson, H. ANNOVAR: Functional annotation of genetic variants from high-throughput sequencing data. Nucleic Acids Res. 2010, 38, e164. [Google Scholar] [CrossRef]
  58. Alexander, D.H.; Novembre, J.; Lange, K. Fast model-based estimation of ancestry in unrelated individuals. Genome Res. 2009, 19, 1655–1664. [Google Scholar] [CrossRef] [PubMed]
  59. Francis, R.M. POPHELPER: An R package and web app to analyse and visualize population structure. Mol. Ecol. Resour. 2017, 17, 27–32. [Google Scholar] [CrossRef]
  60. Jombart, T.; Ahmed, I. adegenet 1.3-1: New tools for the analysis of genome-wide SNP data. Bioinformatics 2011, 27, 3070–3071. [Google Scholar] [CrossRef]
  61. Bradbury, P.J.; Zhang, Z.; Kroon, D.E.; Casstevens, T.M.; Ramdoss, Y.; Buckler, E.S. TASSEL: Software for association mapping of complex traits in diverse samples. Bioinformatics 2007, 23, 2633–2635. [Google Scholar] [CrossRef]
  62. Wang, Y.; Wu, X.H.; Li, Y.W.; Feng, Z.S.; Mu, Z.H.; Wang, J.; Wu, X.Y.; Wang, B.G.; Lu, Z.F.; Li, G.J. Identification and Validation of a Core Single-Nucleotide Polymorphism Marker Set for Genetic Diversity Assessment, Fingerprinting Identification, and Core Collection Development in Bottle Gourd. Front. Plant Sci. 2021, 12, 747940. [Google Scholar] [CrossRef] [PubMed]
  63. Thachuk, C.; Crossa, J.; Franco, J.; Dreisigacker, S.; Warburton, M.; Davenport, G.F. Core Hunter: An algorithm for sampling genetic resources based on multiple genetic measures. BMC Bioinform. 2009, 10, 243. [Google Scholar] [CrossRef] [PubMed]
  64. Varshney, R.K.; Graner, A.; Sorrells, M.E. Genic microsatellite markers in plants: Features and applications. Trends Biotechnol. 2005, 23, 48–55. [Google Scholar] [CrossRef] [PubMed]
  65. Grover, A.; Sharma, P.C. Development and use of molecular markers: Past and present. Crit. Rev. Biotechnol. 2016, 36, 290–302. [Google Scholar] [CrossRef]
  66. Kantartzi, S.K. Microsatellites: Methods and Protocols; Springer: New York, NY, USA, 2013; pp. 1–13. [Google Scholar]
  67. O’Hanlon, P.C.; Peakall, R.; Briese, D.T. A review of new PCR-based genetic markers and their utility to weed ecology. Weed Res. 2000, 40, 40–239. [Google Scholar] [CrossRef]
  68. Powell, W.; Machray, G.C.; Provan, J. Polymorphism revealed by simple sequence repeats. Trends Plant Sci. 1996, 1, 215–222. [Google Scholar] [CrossRef]
  69. Schlötterer, C. The evolution of molecular markers-just a matter of fashion. Nat. Rev. Genet. 2004, 5, 63–69. [Google Scholar] [CrossRef] [PubMed]
  70. Cheng, L.; Wang, N.; Bao, Z.G.; Zhou, Q.; Guarracino, A.; Yang, Y.T.; Wang, P.; Zhang, Z.Y.; Tang, D.; Zhang, P.X.; et al. Leveraging a phased pangenome for haplotype design of hybrid potato. Nature 2025, 640, 408–417. [Google Scholar] [CrossRef]
  71. Liang, Z.C.; Duan, S.C.; Sheng, J.; Zhu, S.S.; Ni, X.M.; Shao, J.H.; Liu, C.H.; Nick, P.; Du, F.; Fan, P.G.; et al. Whole-genome resequencing of 472 Vitis accessions for grapevine diversity and demographic history analyses. Nat. Commun. 2019, 10, 1190. [Google Scholar] [CrossRef]
  72. Balfourier, F.; Roussel, V.; Strelchenko, P.; Exbrayat-Vinson, F.; Sourdille, P.; Boutet, G.; Koenig, J.; Ravel, C.; Mitrofanova, O.; Beckert, M.; et al. A worldwide bread wheat core collection arrayed in a 384-well plate. Theor. Appl. Genet. 2007, 114, 1265–1275. [Google Scholar] [CrossRef]
  73. Zhang, H.; Zhang, D.; Wang, M.; Sun, J.; Qi, Y.; Li, J.; Wei, X.; Han, L.; Qiu, Z.; Tang, S.; et al. A core collection, and mini core collection of Oryza sativa L. in China. Theor. Appl. Genet. 2011, 122, 49–61. [Google Scholar] [CrossRef] [PubMed]
  74. Muñoz-Amatriaín, M.; Cuesta-Marcos, A.; Endelman, J.B.; Comadran, J.; Bonman, J.M.; Bockelman, H.E.; Chao, S.; Russell, J.; Waugh, R.; Hayes, P.M.; et al. The USDA barley core collection: Genetic diversity, population structure, and potential for genome-wide association Studies. PLoS ONE 2014, 9, e94688. [Google Scholar] [CrossRef] [PubMed]
  75. Allen, A.R.; Taylor, M.; McKeown, B.; Curry, A.I.; Lavery, J.F.; Mitchell, A.; Hartshorne, D.; Fries, R.; Skuce, R.A. Compilation of a panel of informative single nucleotide polymorphisms for bovine identification in the Northern Irish cattle population. BMC Genet. 2010, 11, 5. [Google Scholar] [CrossRef] [PubMed]
Figure 1. The geographic distribution of Munake grape and Thompson Seedless grape accessions. Red dots indicate sampling locations of Munake grapes, while blue dots represent sampling locations of Thompson Seedless grapes.
Agriculture 15 00871 g001
Figure 2. (A) Location of SNP loci on chromosomes. (B) Location of InDel loci on chromosomes.
Agriculture 15 00871 g002
Figure 3. Cluster analysis of GO annotations for all genes and genes with mutations.
Agriculture 15 00871 g003
Figure 4. Core germplasm screening of Thompson Seedless grapes based on resequencing data.
Agriculture 15 00871 g004
Figure 5. Genetic distance analysis among three populations of Thompson Seedless grapes (PCoA). TDBG corresponds to the Turpan Desert Botanical Garden population, TGV to the Turpan Grape Valley population, and SS to the ShanShan population.
Agriculture 15 00871 g005
Figure 6. (A) The cross-validation error rates corresponding to different K values based on the population genetic analysis of the Munake cultivated grape (42 core collection accessions). (B) Neighbor-joining tree based on Nei’s standard genetic distance showing a dendrogram of the 141 Munake cultivated grape germplasm collections, the four different colors represent the branches of the clusters formed, in which samples of grapes from different regions are mixed.
Agriculture 15 00871 g006
Figure 7. (A) Genetic distance analysis among 11 populations of grapes (PCoA). KOR—Korla population; ATS—Artoush population; KSG—Kashgar population; ATX—Artux population; RQ—Ruoqiang population; HT—Hetian population; QN—Qiemo population; TTOU—Utuprague population; TDBG—Turpan Desert Botanical Garden population; TGV—Turpan grape valley population; and SS—Shanshan area population. (B) Phylogenetic tree analysis of 309 grapevine germplasm resources. Note: The number represents the sample number of the sample being matched. For the population information corresponding to the sample numbers, please refer to Table 1. The red color represents Thompson Seedless, and the blue color represents Munake. The green-labeled region indicates the nodes within the branch of Munake grapes where Thompson Seedless grape individuals cluster.
Agriculture 15 00871 g007
Figure 8. (A) Analysis of the genetic structures of eleven populations based on Bayesian modeling, with red dots representing appropriate K values. (B) Structural map showing the genetic structures of the nine populations between K = 2 and K = 5. (C) Structural diagram of the genetic structures of eleven populations when K = 4. Note: Thompson Seedless individuals numbered 145–309, Munake 1–144. The vertical bars represent the membership coefficients (qi) of each individual. KOR—Korla population; ATS—Artoush population; KSG—Kashgar population; ATX—Artux population; RQ—Ruoqiang population; HT—Hetian population; QN—Qiemo population; TTOU—Utuprague population; TDBG—Turpan Desert Botanical Garden population; TGV—Turpan grape valley population; and SS—Shanshan area population.
Agriculture 15 00871 g008
Table 1. The 16 grape SSR primer pairs and base sequences.
NumNamePrimer Sequence (F) (5′-3′)Primer Sequence (R) (5′-3′)MW (Dalton)TM (°C)
1VRZAG67ACCTGGCCCGACTCCTCTTGTATGCTCCTGCCGGCGATAACCAAGCTATG762765
2VCHR13aTGGCAGAGCAAATGAATCAATTGGATGGATTGGAATGACC621255
3VVIP31TATCCAAGAGACAAATTCCCACTTCTCTTGTTTCCTGCAAATGG668256
4VVMD7AGAGTTGCGGAGAACAGGATCGAACCTTCACACGCTTGAT603757
5VMC4F3-1AAAGCACTATGGTGGGTGTAAATAACCAATACATGCATCAAGGA672056
6Vchr8aACCCACTGCCACTCTCTCATAAATCTCCGGGATCCTTTTG608359
7VrZAG29ATAACCAGGACAAGTTATTCAAGCCACCCAATTGACCATCTTTTATGCTG756856
8VrZAG25CTCCACTTCACATCACATGGCATGCCGGCCAACATTTACTCATCTCTCCC747460
9VVIb66CCACTAGTGGTCAGAAAAGAAGTTGTATTGTGTGCCTCTTCTCA667453
10VVIb01TGACCCTCGACCTTAAATCTTTGGTGAGTGCAATGATAGTAGA687952
11VVMD36TAAAATAATAATAGGGGGACACGGGCAACTGTAAAGGTAAGACACAGTCC776956
12VVS4CCATCAGTGATAAAACCTAATGCCCCCACCTTGCCCTTAGATGTTA662255
13VMC4C6CTCCATCCCTATCTCATCAGCTCTAACACCCAATCTCACA595150
14VVIi51ATCCCAAGAGAACCAAGAAACTGCTGATCTCAGTGCATATGTTG675753
15UDV-015TGCACATTTCCCTCCTTAGCGGGTTACTGGGAAGGGTAT625454
16VMC4H6GTATAGAACCACGCATCCAACACCCTTAGTTTCCTCGTGCTTTT661054
Note: The table provides the primer names and sequences for both the forward (F) and reverse (R) primers, as well as the temperature conditions and molecular weight sizes.
Table 2. Genetic data of 16 SSR loci from 165 Thompson Seedless individuals. This table encompasses the names, Na and Ne values, Shannon’s I, Ho, and other polymorphic information for 16 SSR loci.
LocusNaNeIHoHeuHeFFisFstNm
VVIb01233.461.700.970.710.71−0.36−0.400.046.55
VVIb66316.032.250.830.830.840.010.170.121.87
VVMD36346.482.380.900.850.85−0.07−0.170.112.04
VVS4312.831.630.240.650.650.620.410.240.78
VrZAG29323.801.940.850.740.74−0.16−0.150.092.43
VrZAG25256.292.290.950.840.85−0.13−0.170.092.59
VMC4C6264.772.070.880.790.79−0.11−0.100.073.14
VVIi51308.112.430.920.880.88−0.05−0.220.161.36
UDV-0153913.722.980.850.930.930.080.040.082.77
VMC4H6F286.982.320.900.860.86−0.05−0.260.161.32
VRZAG67192.581.290.770.610.61−0.26−0.310.038.68
VCHR13a232.991.440.990.670.67−0.49−0.530.054.71
VVIP31265.251.991.000.810.81−0.24−0.260.0210.19
VVMD7211.951.210.280.490.490.430.370.037.55
VMC4F3-1223.501.670.990.710.72−0.39−0.430.0715.39
Vchr8a327.752.451.000.870.87−0.15−0.190.046.62
Mean27.65.412.000.830.760.77−0.08−0.140.081.01
Note: Na = number of different alleles; Ne = effective number of alleles; Ho = observed heterozygosity; He = expected heterozygosity; uHe = unbiased expected heterozygosity; I = Shannon’s information index; F (Null) = null allele; Fis = inbreeding coefficient; and Fst = proportion of differentiation.
Table 3. Data on genetic diversity parameters for three populations.
Pop NNaNeIHoHeuHeF
TDBGMean65.5610.433.771.480.840.680.68−0.20
SE1.931.080.380.120.070.040.040.10
TGVMean23.3813.256.071.920.840.770.78−0.13
SE1.561.790.890.180.050.040.040.09
SSMean3612.314.311.670.790.710.72−0.11
SE2.271.220.610.120.060.030.030.08
Note: This table includes the names of three populations of Thompson Seedless grapes, along with their polymorphism data. Na = number of different alleles; N = number of individuals sampled; Ne = effective number of alleles; I = Shannon’s information index; and HO = observed heterozygosity. Pop stands for the name of the three populations: TDBG corresponds to the Turpan Desert Botanical Garden population, TGV to the Turpan Grape Valley population, and SS to the ShanShan population.
Table 4. The evolution of genetic diversity based on the 353 core SNPs selected.
IndexTotalMin/Max (Ave)
Observed allele number706.0002.000–2.000(2.000)
Expected allele number682.9801.828–2.000(1.935)
Observed heterozygous number200.3890.459–0.621(0.568)
Expected heterozygous number170.4200.453–0.500(0.483)
Nei diversity index171.0680.454–0.502(0.485)
Shannon–Wiener index238.5420.645–0.693(0.676)
Polymorphism information content129.2490.350–0.375(0.366)
Table 5. Genetic parameters derived from 6 SSR loci in 144 samples of Munake grapes and 165 samples of Thompson Seedless grapes.
PopGrape Varieties NNaNeIHoHe
KORMunakeMean11.8337.5004.6351.6380.8470.741
SE0.1671.5000.8210.2250.1370.054
ATSMunakeMean3.8333.3333.1881.0290.8330.599
SE0.1670.9550.9690.2190.1670.060
KSGMunakeMean27.8339.8334.2041.6720.7860.737
SE0.1670.7490.6100.1180.1530.036
ATXMunakeMean25.66710.1673.7751.6240.8010.705
SE0.2111.4000.4430.1530.1120.054
RQMunakeMean13.5007.6674.2991.5800.7710.707
SE0.2240.9890.9690.1880.1450.064
HTMunakeMean46.66715.6674.9461.9600.8150.768
SE0.3330.9550.7130.1390.0950.042
QNMunakeMean10.0007.0004.4371.6460.7830.759
SE0.0000.7750.5170.1190.1010.027
TTOUMunakeMean3.0004.1673.6831.3300.7780.704
SE0.0000.4010.4210.1190.1110.045
TDBGThompson SeedlessMean67.3339.6673.3361.3040.8060.629
SE2.6542.7530.7110.2400.1470.070
TGVThompson SeedlessMean28.6678.8333.9531.4760.8560.688
SE1.1451.9221.0200.2120.1210.049
SSThompson SeedlessMean39.50014.6674.5231.7750.8820.724
SE2.5661.4981.0710.1930.0730.053
Note: Pop stands for Population Name. KOR—Korla population; ATS—Artoush population; KSG—Kashgar population; ATX—Artux population; RQ—Ruoqiang population; HT—Hetian population; QN—Qiemo population; TTOU—Utuprague population; TDBG—Turpan Desert Botanical Garden population; TGV—Turpan grape valley population; and SS—Shanshan area population. Na = number of different alleles; N = number of individuals sampled; Ne = effective number of alleles; I = Shannon’s information index; and HO = observed heterozygosity.
Table 6. Genetic distance data according to regional distribution.
All Pops.FisFstGisGstNm
VVIP31−0.200.11−0.150.082.01
VVMD7−0.190.21−0.140.180.93
Vchr8a0.360.180.400.131.13
VMC4F3−0.310.16−0.260.131.37
VrZAG67−0.180.17−0.130.141.22
VCHR13a−0.370.20−0.330.181.01
Note: Fis = inbreeding coefficient within individuals; Fst = inbreeding coefficient within subpopulations; Gis = inbreeding coefficient within individuals; Gst = analog of Fst; and Nm = gene flow.
Disclaimer/Publisher’s Note: The statements, opinions and data contained in all publications are solely those of the individual author(s) and contributor(s) and not of MDPI and/or the editor(s). MDPI and/or the editor(s) disclaim responsibility for any injury to people or property resulting from any ideas, methods, instructions or products referred to in the content.

