Article

Study on Predicting Blueberry Hardness from Images for Adjusting Mechanical Gripper Force

by
Hao Yin
1,2,
Wenxin Li
1,
Han Wang
3,
Yuhuan Li
1,
Jiang Liu
1 and
Baogang Li
1,4,*
1
School of Mechanical and Automotive Engineering, Qingdao University of Technology, Qingdao 266520, China
2
Guangxi Key Laboratory of Automobile Components and Vehicle Technology, Guangxi University of Science and Technology, Liuzhou 545006, China
3
College of Mechanical and Vehicle Engineering, Taiyuan University of Technology, Taiyuan 030024, China
4
State Key Laboratory of Mechanical Transmission, Chongqing University, Chongqing 400044, China
*
Author to whom correspondence should be addressed.
Agriculture 2025, 15(6), 603; https://doi.org/10.3390/agriculture15060603
Submission received: 22 February 2025 / Revised: 5 March 2025 / Accepted: 10 March 2025 / Published: 11 March 2025

Abstract

:
Precision and non-damaging harvesting is a key direction for the development of mechanized fruit harvesting technologies. Blueberries, with their soft texture and delicate skin, present significant challenges for achieving precise and non-damaging mechanical harvesting. This paper proposes an intelligent recognition and prediction method based on machine vision. The method uses image recognition technology to extract the physical characteristics of blueberries, such as diameter and thickness, and estimates fruit hardness in real-time through a predictive model. The gripping force of the mechanical claw is dynamically adjusted to ensure non-destructive harvesting. Firstly, a chimpanzee optimization algorithm (ChOA) was used to optimize a prediction model that established a mapping relationship between fruit diameter, thickness, weight, and fruit hardness. The radial basis network optimized by the chimpanzee optimization algorithm (ChOA-RBF) model was compared with a non-optimized model, and the results showed that the ChOA-RBF prediction model has significant advantages in predicting fruit hardness. Next, an orthogonal experiment further verified the model, showing that the prediction error between the model’s values and actual values was less than 5%. Additionally, considering practical applications, a simple and efficient two-parameter method was proposed, removing the weight parameter and predicting fruit hardness using only diameter and thickness. Although the two-parameter method increases the prediction error by 0.36% compared to the three-parameter method, it reduces the number of convergence steps by 71 and shortens the computation time by one-third, significantly improving iteration speed. Finally, further crushing experiments showed that using the two-parameter method for hardness prediction through parameter extraction via visual recognition resulted in a relative error of less than 8%, with an average relative error of 3.91%. The error falls within the acceptable range for the safety factor design. This method provides a novel solution for the non-damaging mechanized harvesting of soft fruits.

1. Introduction

Blueberries, with their delightful taste and rich nutritional value, are highly favored by consumers [1]. According to the 2024 report by the International Blueberry Organization, China’s blueberry cultivation area reached 84,420 hectares, with a production of 563.46 kilotons, ranking first in the world [2]. Traditional manual picking methods have disadvantages such as high costs, low efficiency, fruit loss, and reliance on seasonal labor. These factors increase the cost of blueberry harvesting [3] and severely limit the development of the blueberry industry [4]. In response to these challenges, mechanical automation technology has begun to show promise in the agricultural sector, bringing new hope to the blueberry industry. However, blueberries, being cluster-bearing crops, require selective individual harvesting. Their soft texture and fragile skin make them susceptible to damage, and conventional mechanical grippers cannot meet these requirements, necessitating a flexible and precise design for the mechanical claws.
To achieve a rapid, non-destructive mechanical harvesting of blueberries, both domestic and international researchers have extensively studied blueberry growth, fruit characteristics [5], stem mechanical properties [6], and the connection characteristics between berries and stems [7,8]. Currently, inertial vibration harvesting devices, which use inertial forces to separate fruits from the stems, are the most widely used harvesting equipment abroad. This method is more suitable for high-growing, tree-like blueberry varieties, such as those in North America. However, in China, where blueberries are primarily grown as low shrubs in greenhouses, differences in temperature, lighting, pruning, fertilization, and irrigation lead to staggered, multi-batch maturation. As a result, sorting and selectively harvesting mature fruits while preserving immature ones [9] has become a critical challenge for blueberry harvesting robots.
With the rapid development of artificial intelligence, robotic technologies for harvesting fruits such as apples and pears have matured. From fruit recognition [10] to end-effector design [11] and path planning [12,13], automation has been largely achieved. These fruits, with their harder texture and resistant skin, do not require consideration of the gripping force between the mechanical claw and the fruit. However, the soft texture of blueberries presents a major hurdle, making intelligent recognition, non-destructive harvesting, and selective picking the key challenges in the development of blueberry harvesting robots. Notably, designing a non-destructive method for harvesting blueberries remains unresolved. In blueberry hardness research, Hu et al. correlated the mechanical properties of the fruit using texture profile and puncture analysis [14], while spectral data from randomly selected frogs were used to estimate the mechanical properties of blueberries, providing a reference for predicting their mechanical characteristics. More recently, Oh et al. integrated sensory attributes with tool measurements to identify and predict blueberry hardness [15], enhancing the selection of desired blueberry textures through mechanical parameter estimation. These methods offer valuable insights for predicting blueberry hardness, yet they have not addressed pre-harvest, non-destructive harvesting applications, and relatively little research has been conducted in this area, both domestically and internationally.
In blueberry maturity recognition, Yang et al. proposed a lightweight blueberry fruit detection algorithm for multi-scale targets based on an improved YOLOv5, incorporating a new attention mechanism [16]. Experiments on a self-made blueberry dataset achieved a mean average precision (mAP) of 83.2%. MacEachern et al. applied YOLOv4 for blueberry maturity detection and demonstrated its high accuracy [17]. However, due to the considerable computational load of the YOLOv4 model, its performance significantly decreases when migrated to smaller embedded devices. Zhai et al. proposed an automatic blueberry recognition method based on YOLOv5 and CIE saturation enhancement [18]. By enhancing the image dataset for training, recognition accuracy, recall, and mAP improved by 3.0%, 2.0%, and 2.6%, respectively. However, the similarity in color features between immature blueberries and leaves, along with fruit occlusion by leaves, led to lower real-time detection accuracy. In response, Gai et al. introduced an improved multi-coordinate attention (MPCA) mechanism based on YOLOv8, which enhanced feature extraction during the training process [19], achieving an accuracy of 84.6%, a recall rate of 91.3%, and an mAP of 94.1%. In addition, deep learning models have achieved remarkable results in image correction and object detection. Xu et al. proposed a specular highlight removal method based on the generative adversarial network (GAN). The method uses an attention mechanism to generate highlight intensity masks, which remove highlights while preserving image details, providing an effective preprocessing method for feature extraction and analysis [20]. Zhuang et al. developed a dual-image and dual-local contrast measure (DDLCM) algorithm, which enhances target saliency through local feature enhancement, significantly improving the recognition accuracy of small and weak targets in complex backgrounds [21]. These studies highlight that visual algorithms are effective for blueberry maturity recognition. However, the ability to directly determine the gripping force for harvesting based on image data remains a crucial factor in improving operational efficiency and fruit preservation. Thus, understanding the relationship between fruit color and the gripping force is essential, a concept not yet explored in the aforementioned algorithms.
The intelligent recognition of fruit characteristics such as size and maturity can drive the development of precision agriculture by enabling the evaluation of various crop traits using computational intelligence methods. Gholipoor et al. quantified the influence of plant height [22], canopy width, and the number of fruits per plant on pepper yield using a neural network with a pepper image database and analyzed the contribution of each trait to yield prediction. Nagnath et al. [23] compared different deep learning algorithms for banana maturity and quality detection, concluding that the CNN model is the most suitable for classifying banana fruit maturity and quality. Qiao et al. utilized a backpropagation (BP) neural network to predict the quality of strawberries during cold-chain transportation based on environmental parameters such as temperature [24], humidity, oxygen, and carbon dioxide, providing decision support for management. Lin et al. developed a machine learning model (MLM) to predict the hardness of corn seeds, aiming to improve grinding efficiency [25], reduce seed breakage during transportation, and select high-quality crops. H. Rocha et al. used a radial basis function (RBF) model to predict the yield of hard wheat based on planting area and various climate variables [26]. The model’s input parameters included soil moisture, temperature, organic matter, total carbon, nitrogen, air temperature, solar radiation, and potential evapotranspiration, while the output was field-measured CO2 emissions. Different regression methods each have their advantages; the RBF network offers strong nonlinear mapping capabilities [27], making it suitable for various predictive models, while BP’s backpropagation algorithm is rigorous and offers strong generalization ability [28]. Random Forest (RF), an ensemble learning technique, is known for its robustness and ease of implementation [29]. Therefore, selecting the appropriate predictive model for different applications is crucial.
Machine learning techniques can establish nonlinear mapping relationships between multiple parameters, showing high flexibility and accuracy in prediction tasks. In recent years, the deep integration of visual recognition and machine learning has promoted the development of intelligent perception. These two technologies complement each other in feature extraction and prediction modeling. Ma et al. combined the canopy reflectance model of row crops with backward propagation neural networks (BPNNs) to estimate fractional vegetation cover (FVC), demonstrating the effectiveness of visual recognition and machine learning algorithms in agricultural parameter estimation [30]. Cai et al. used the YOLACT model to identify ice block images and applied image processing algorithms to estimate fracture features, proving that deep learning combined with image analysis can effectively extract physical features of objects [31]. Ma et al. proposed a pixel dichotomy coupled with a linear kernel-driven model (PDKDM) to estimate FVC in drought areas through random sampling, verifying the feasibility of non-contact biological parameter estimation based on visual feature extraction and modeling [32]. Based on the aforementioned research, challenges such as low detection accuracy in blueberry maturity recognition and the difficulty of non-destructive harvesting due to the fruit’s soft texture remain significant barriers to the efficient automation of blueberry harvesting. Therefore, this paper proposes a novel approach that uses visual recognition to precisely extract the physical characteristics of blueberries and employs regression prediction algorithms to quickly estimate fruit hardness. By integrating fruit hardness with a safety factor to adjust the gripping force of the mechanical claw in real-time, non-destructive harvesting is achieved. This study applies the chimp optimization algorithm (ChOA) to optimize the RBF, BP, and RF models for estimating fruit hardness. For comparison, non-optimized versions of the RBF, BP, and RF models were also evaluated. Using actual measurements of blueberry fruit diameter, thickness, and weight, the study investigates the performance differences in the models and compares the detection accuracy of various neural networks for blueberry maturity. The optimal model for hardness prediction is determined. Based on these findings, blueberries were categorized into three size classes (large, medium, and small) according to their diameter, and an orthogonal experiment was conducted to validate the radial basis network optimized by the chimpanzee optimization algorithm (ChOA-RBF) model. In practical harvesting, fruit weight, which must be either manually assigned or predicted, can present a challenge. To simplify the model structure, improve prediction speed, and eliminate the weight parameter that cannot be directly obtained from images, a more efficient two-parameter method is proposed. This method is experimentally verified and evaluated. The proposed method effectively resolves the conflict between gripping force and skin damage, ensuring fruit integrity during harvesting. It offers a new approach for the non-destructive harvesting of soft fruits and lays the theoretical foundation for dynamically adjusting the mechanical claw’s gripping force in harvesting robots.

2. Materials and Methods

The research process of this study is outlined in Figure 1, which includes four key steps: feature extraction, model construction, model evaluation, and recognition/application. Data analysis and model construction were performed using MATLAB R2023b software.

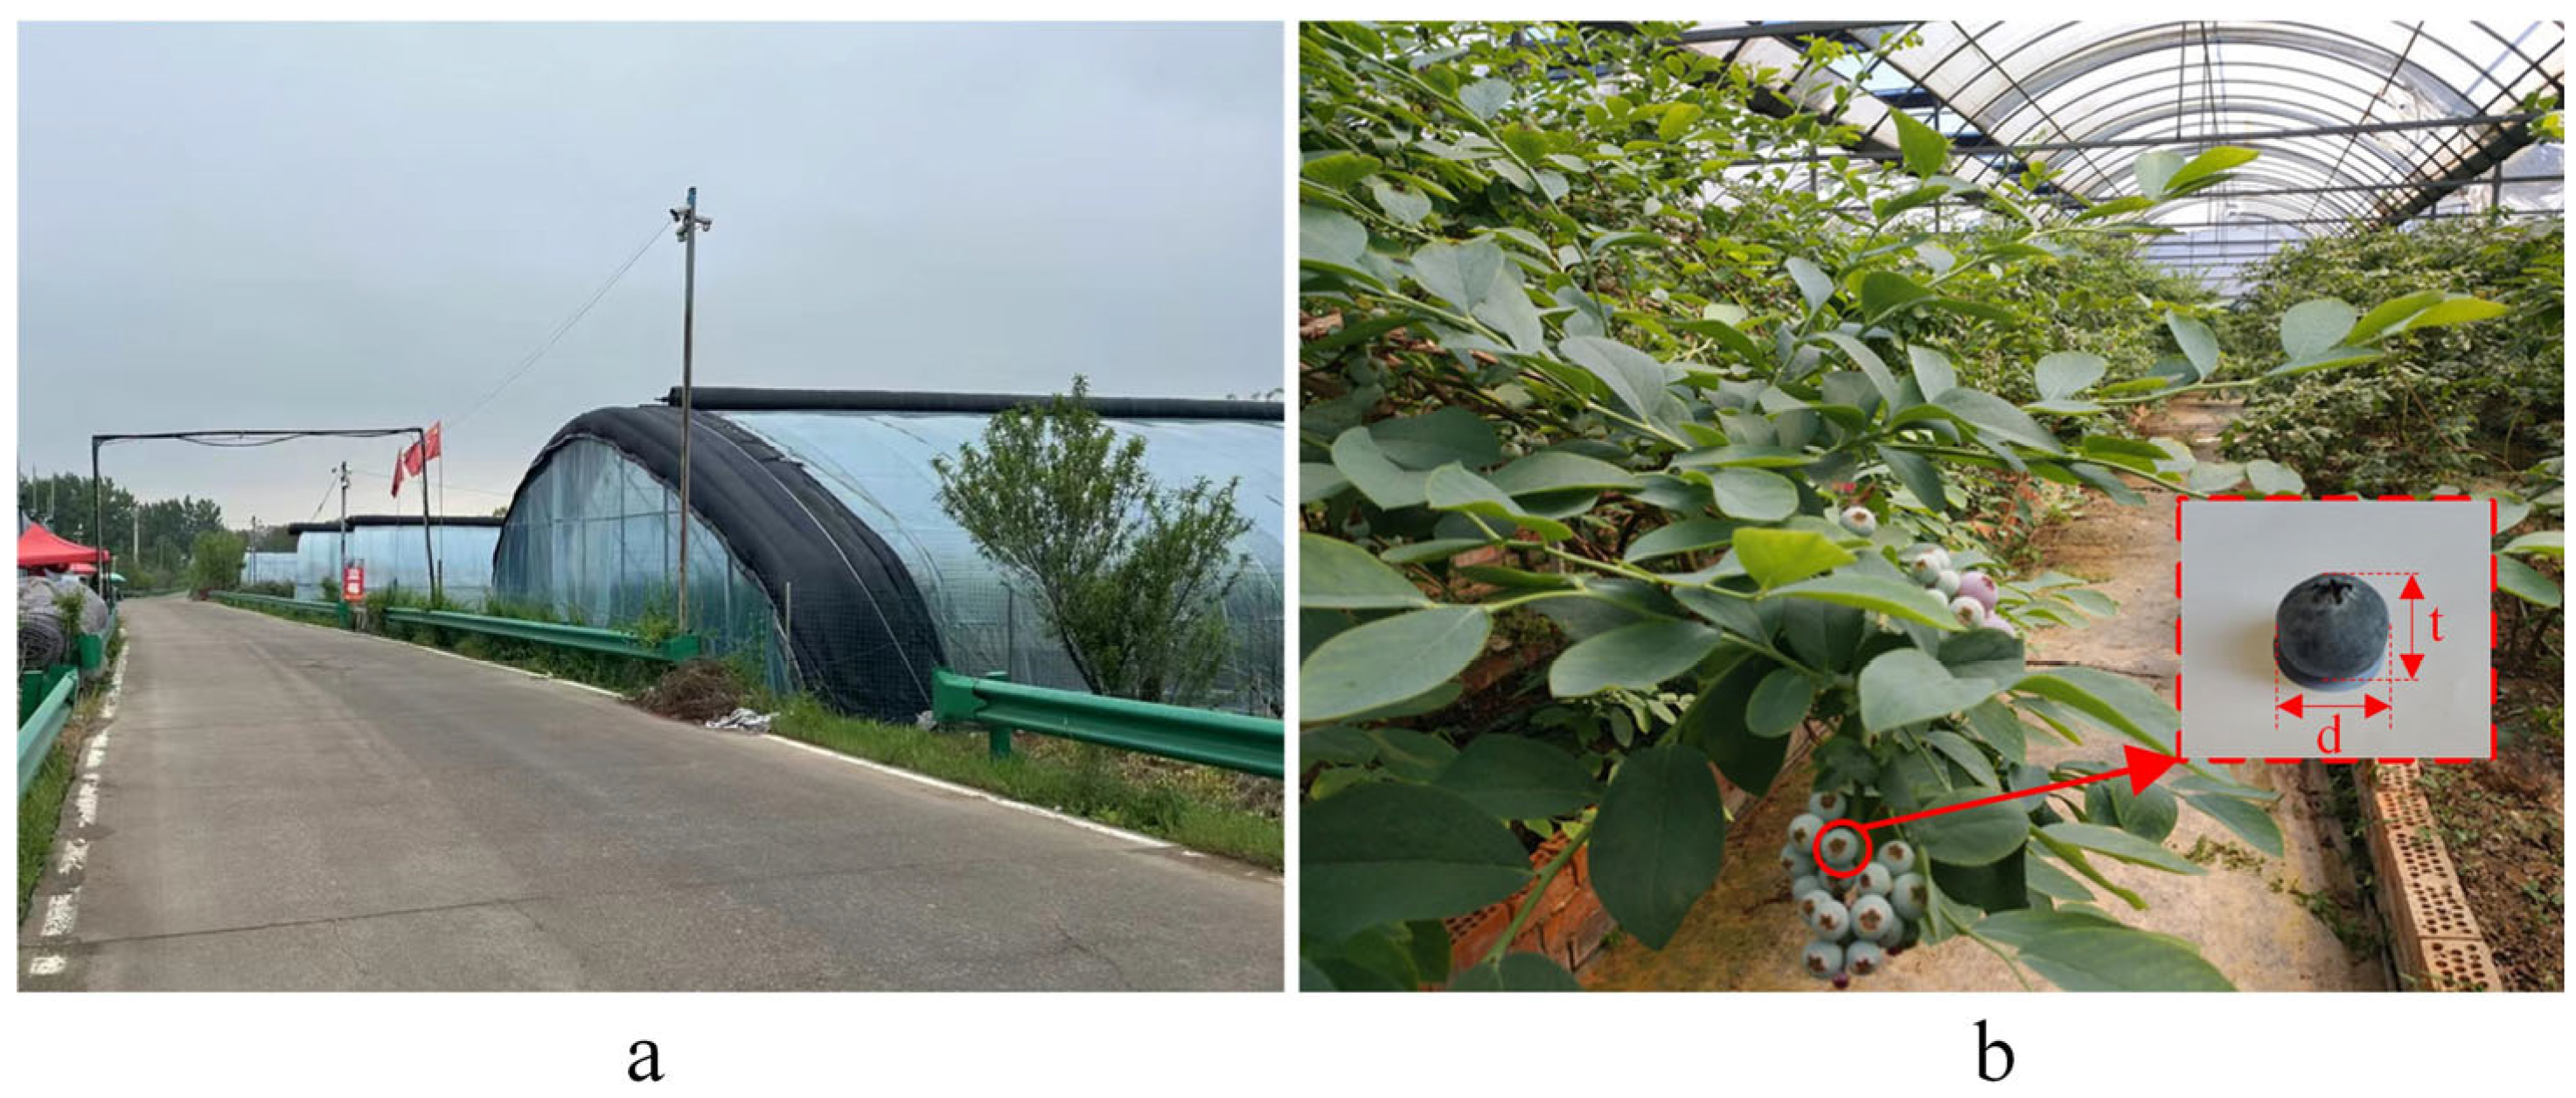
2.1. Experimental Field

China’s blueberry cultivation is mainly distributed in Shandong, Jilin, Liaoning, and Yunnan provinces. In northern China, blueberries are primarily grown in greenhouses, while in southern regions, they are cultivated in open fields. With the advancement of greenhouse technology and its constant temperature advantages, greenhouses have become an increasingly common cultivation method. Consistent with previous studies [33], we selected greenhouse-grown blueberries in northern China for our study, choosing the rabbit-eye blueberry variety, which is widely grown across both northern and southern China, as the research subject. The experiments and data collection were conducted at Qingdao Wolin Blueberry Agricultural Co., Ltd. (Qingdao, China) (latitude 119°89′, longitude 35°75′). The experimental greenhouse is shown in Figure 2a, with a width of approximately 7.5 m, a length of approximately 105 m, and a center height of 2.2 m. Figure 2b illustrates the greenhouse plants and fruit, with each greenhouse containing 2–3 rows of blueberry plants and corridors 1.6 m wide. Each greenhouse can accommodate 8000–10,000 blueberry plants. As shown, the blueberries are low-growing shrubs with spherical shaped fruit. The diameter (d) of mature fruits ranges from 13 to 24 mm (measured at the equator), and the thickness (t) ranges from 8 to 15 mm (from stem to fruit flower-end). Based on the fruit’s morphological characteristics and size variations, fruit hardness also differs accordingly, as shown in the sample fruit in Figure 2b. During the harvesting process, only fruits of the same maturity were considered for picking, while immature fruits, overripe fruits, and spoiled fruits were excluded. Hence, the study and experiments focus on blueberries with the same maturity level.

2.2. Design Plan

2.2.1. Analysis of Method Rationality

Several post-harvest studies indicate that genotype, maturity, calcium content, and post-harvest management are the primary factors influencing blueberry hardness [34]. Variations in genetic traits, maturity, and post-harvest moisture loss [35] can directly affect the hardness of blueberry fruit. However, during the pre-harvest phase, blueberries within the same area and of the same variety typically share similar farming practices and environmental conditions. As a result, factors such as genotype, maturity, calcium content, and post-harvest management can be considered consistent. In the study of pre-harvest fruit hardness, this research employs a compression testing method to measure blueberry hardness and analyzes the correlation between the hardness and physical characteristics of the same variety. Specifically, the study investigates the relationship between physical features such as diameter, thickness, and weight, and fruit hardness, further validating the proposed method’s rationality. First, statistical methods were used to quantify the relationship between the diameter, thickness, weight, and hardness of blueberries. For 400 blueberry samples from different greenhouses, the diameter and thickness were measured with calipers, while the fruit hardness and weight were recorded using a fruit testing platform. The data were then analyzed, and the Spearman correlation coefficient was used to evaluate the linear relationship between the physical features and fruit hardness. A correlation heatmap was created to illustrate these relationships. Figure 3 displays the correlation heatmaps between diameter and hardness, thickness and hardness, and weight and hardness. The correlation coefficients clearly indicate the degree to which each physical feature influences hardness. Generally, a correlation coefficient |r| ≥ 0.8 suggests a high correlation between two variables, while 0.5 ≤ |r| < 0.8 indicates a moderate correlation, and |r| < 0.3 suggests no significant correlation [36]. The results reveal that there is a positive correlation between the diameter, thickness, and weight of blueberries and their hardness. Notably, the correlation between diameter and thickness with hardness is stronger, while the correlation between weight and hardness is 0.72, the weakest among the three parameters. This indicates that fruit hardness is more closely related to size. This finding provides a reliable basis for subsequent hardness prediction.
Based on these analyses, the proposed method for hardness prediction, which integrates machine vision technology, is scientifically sound. By accurately identifying the diameter, thickness, and weight of the fruit, the hardness can be effectively estimated, enabling the adjustment of the mechanical claw’s gripping force and ensuring that fruit damage is avoided during the harvesting process.

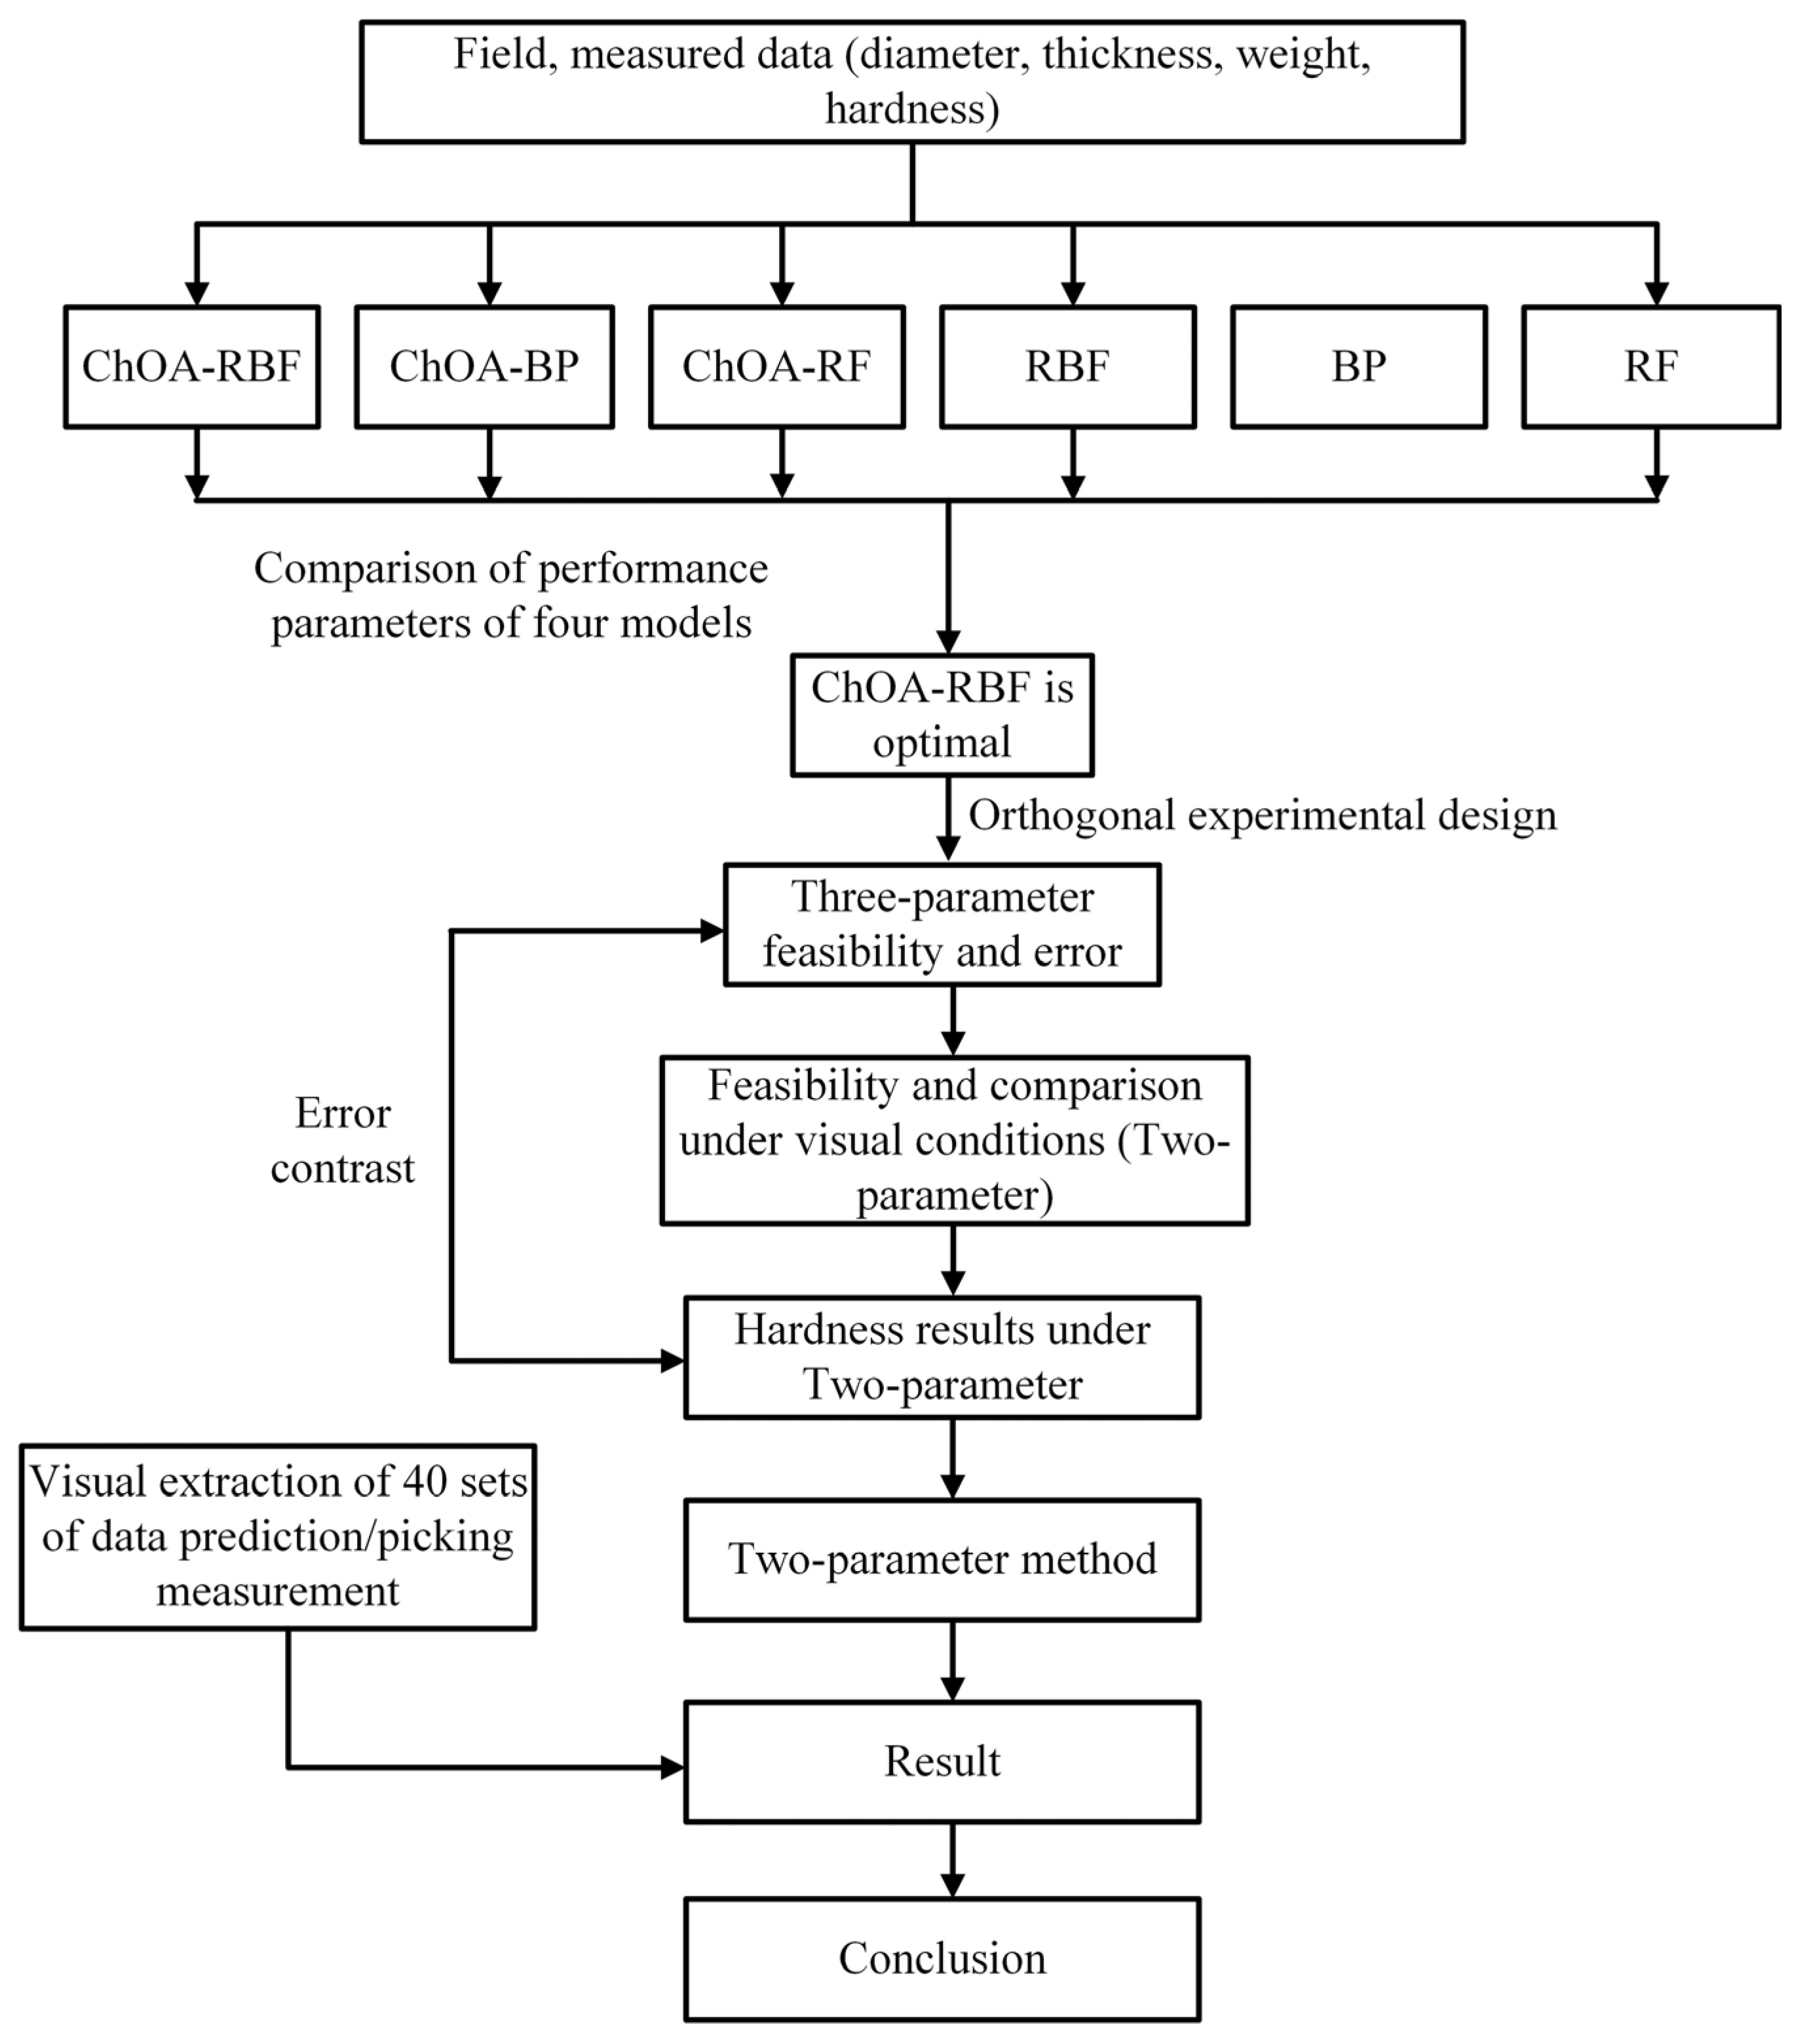
2.2.2. Research Process

In the harvesting process of small berries, the gripping force of the robotic arm is approximately proportional to the fruit’s hardness. That is, the gripping force must be large enough to ensure the fruit is securely held but not too large to avoid damaging the fruit. Therefore, the design of the robotic arm’s gripping force must carefully consider the fruit’s hardness to ensure that excessive pressure is not applied during gripping, thus maintaining the fruit’s integrity.
Due to the thin skin of blueberries, rapid recognition of fruit hardness is a key factor influencing the dynamic adjustment of the robotic claw’s gripping force for the precise, non-destructive harvesting of small berries. This paper provides a detailed analysis of the physical properties of blueberries, using computational intelligence methods to establish a mapping relationship between characteristics such as diameter, thickness, and weight, and the mechanical properties of the fruit. This allows for the determination of the optimal fruit hardness prediction model, which serves as the technical foundation for determining the optimal gripping force of the mechanical claw. As shown in Figure 4, 400 blueberries of different shapes were selected for this study. Using relevant experimental equipment (vernier calipers and fruit testing machines), the diameter, thickness, weight, and maximum pressure that would not damage the fruit were measured. The fruits were then categorized into three size groups based on their diameter: large, medium, and small. Four different computational intelligence methods were employed to model the functional relationships between the physical characteristics of the fruit and its hardness. The detection accuracy and error of the different prediction models were compared to identify the best model. An orthogonal experiment was then conducted to validate the optimal model. Finally, based on the optimal model, the weight parameter cannot be directly obtained through the image recognition system during the harvesting process and must be assigned and predicted. To enable a faster and more convenient estimation of fruit hardness, this study employs a two-parameter method, where the fruit hardness is estimated using only the fruit’s diameter and thickness. This method has been experimentally verified and evaluated, improving both accuracy and efficiency. It provides a new approach for non-destructive harvesting of soft fruits and enables the real-time control of the mechanical claw’s gripping force (Fc).

2.3. Analytical Methods

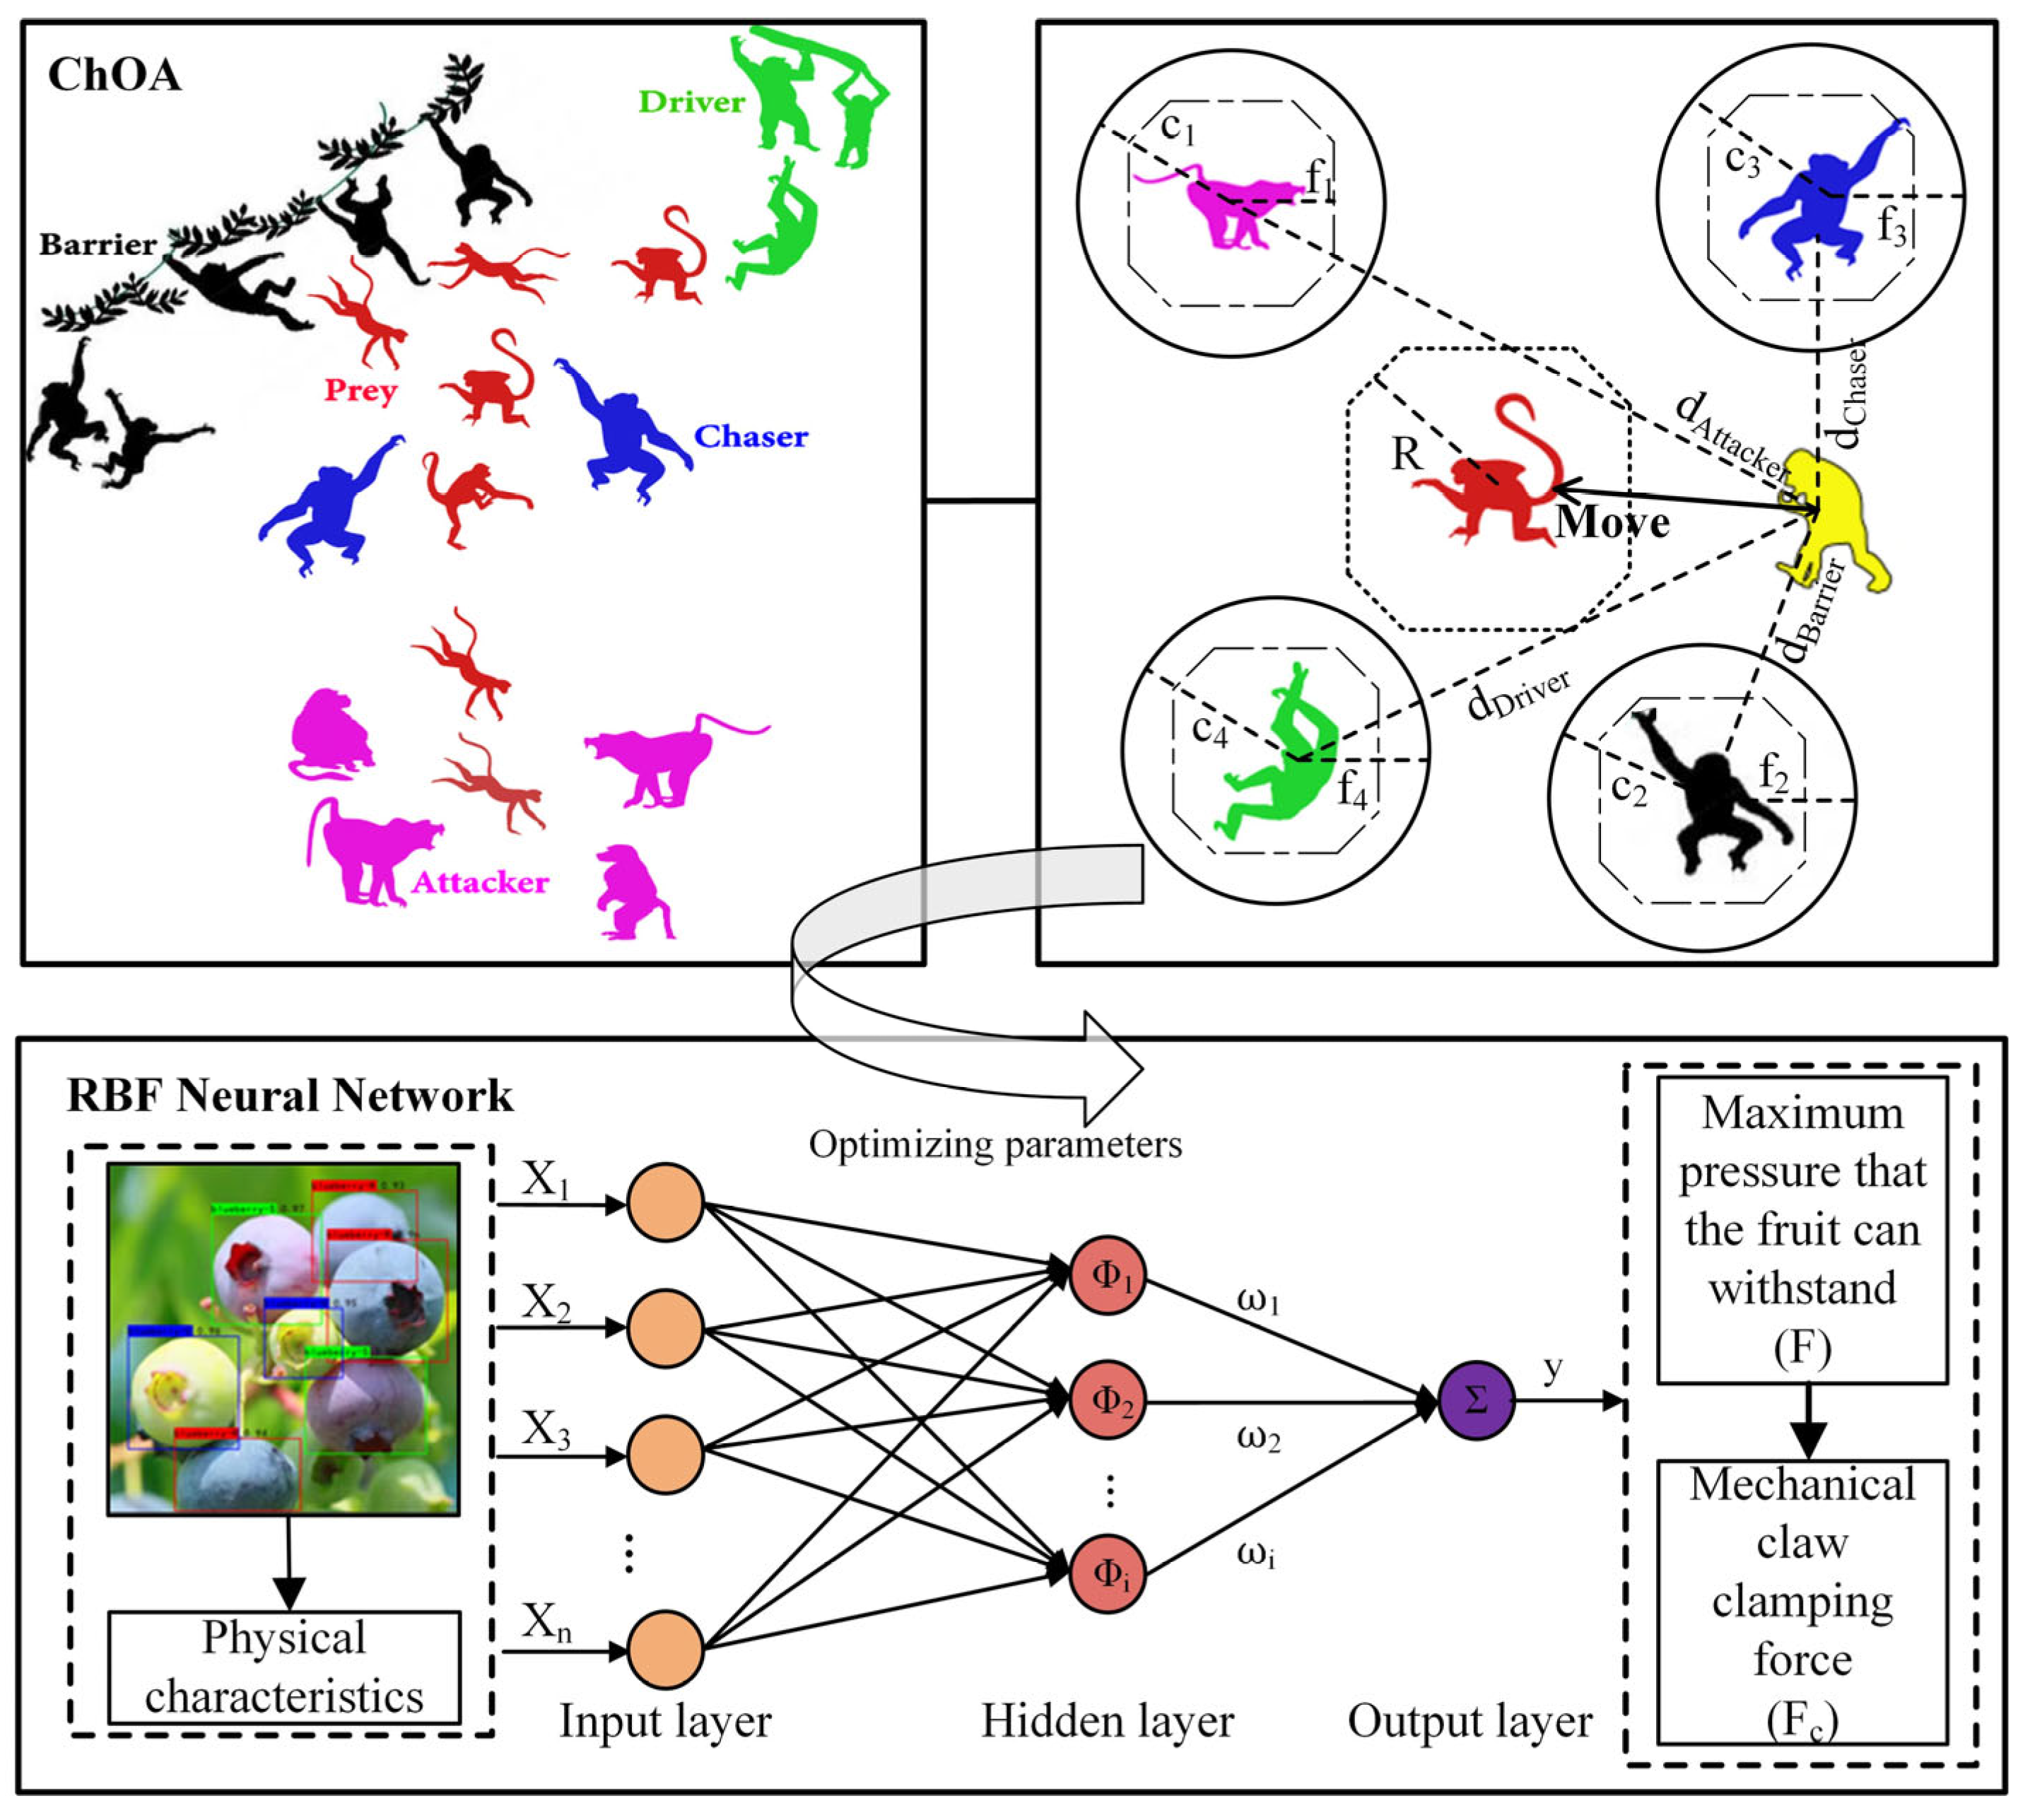
2.3.1. Prediction Model

As illustrated in Figure 5, the ChOA algorithm, inspired by chimpanzee hunting behaviors [37], includes two main phases: exploration and exploitation. In the exploration phase, chimpanzees drive, block, and chase prey to locate targets. In the exploitation phase, they engage in active attack. ChOA assumes that the best solution, driver, blocker, and chaser can identify the prey’s location, while other chimpanzees update their positions based on the optimal chimpanzee’s location to achieve exploration and exploitation for optimization. This process helps identify optimal model parameters for precise predictions [38].
1.
Driving and Chasing the Prey
d ( t ) = c × X prey   t m × X chimp ( t )
X chimp   ( t + 1 ) = X prey   ( t ) a × d
In Equation (1), d ( t ) represents the distance between the prey and the chimpanzee, t is the current iteration count, a and c are coefficient vectors, and m is a chaotic vector generated by chaotic mapping.   X prey is the position vector of the prey, and X chimp is the position vector of the chimpanzee. The parameters a and c are defined as follows:
a = f 2 r 1 1
m = Chaotic v a l u e
c = 2 r 2
In Equation (3), f is a linear decay factor that decreases linearly from 2.5 to 0 as the iterations increase. r 1 and r 2 are random numbers between [ 0 , 1 ] . The parameter a is a random variable within the range [ 2 f , 2 f ] . When a is within [ 1 , 1 ] , the prey stops moving, requiring the chimpanzee to attack to end the hunt. By reducing f , the chimpanzee is forced to finish the hunt, with its next position located randomly between its current position and the prey’s position.
2.
Attack
d A = c 1 X A m 1 X d B = c 2 X B m 2 X d C = c 3 X C m 3 X d D = c 4 X D m 4 X
X 1 = X A a 1 × d A X 2 = X B a 2 × d B X 3 = X C a 3 × d C X 4 = X D a 4 × d D
X ( t + 1 ) = X 1 + X 2 + X 3 + X 4 / 4
The chimpanzee’s final position is randomly distributed within a circle defined by the positions of attacking, obstructing, chasing, and driving chimpanzees. In other words, the prey’s position is estimated based on the four best individuals, while the other chimpanzees update their positions randomly nearby.
3.
Social Motivation
Once a certain amount of food is obtained, some chimpanzees abandon their duties and fall into a chaotic feeding state. Similarly to the dragonfly optimization algorithm, this chaotic behavior helps the ChOA algorithm avoid becoming stuck in a local optimum during the final iterations. The original study assumes that chimpanzees have an equal probability of selecting either a normal position or a position generated by a chaotic model:
X chimp ( t + 1 ) = X prey ( t ) a × d μ 0.5 Chaotic v a l u e μ > 0.5
Here, μ is a random value within [ 0,1 ] . Notably, if μ < 0.5 and | a | < 1 , the current chimpanzee position is updated using Equation (2). If μ < 0.5 and a > 1 , a random chimpanzee’s position is selected for the update. If μ > 0.5 , the current chimpanzee position is updated using Equation (5). This iterative update method resembles the whale optimization algorithm.
4.
RBF Prediction Model
The RBF neural network is trained using a backpropagation algorithm, adjusting weights and biases iteratively to reduce error. Unlike BP networks, the RBF network requires optimization of parameters such as the center, width, and offset of its basis functions. RBF networks typically train faster than BP networks since they only adjust a limited number of parameters in a localized approach, avoiding BP’s global optimization requirement. BP networks may become stuck in local minima, while the RBF model, due to its basis function properties, effectively achieves global optimization. The RBF model is also more robust with noisy data due to its distance-based local response function, providing stable outputs. RBF excels in handling complex nonlinear relationships, especially in high-dimensional spaces, whereas RF primarily relies on ensemble decision trees, while RBF directly tackles nonlinearity through its radial basis functions.
As shown in Figure 5, the RBF neural network is a three-layer feedforward network with a single hidden layer, structured as depicted in Figure 5. The input layer parameters Xi are called design variables, while the hidden layer functions Φ i are nonlinear mappings of these variables, known as basis functions. The output layer is a linear combination of these basis functions. The output function is expressed as follows [39]:
y = ω i Φ i
In this Equation (10), y represents the output response, and ω i represents the i -th linear weight. Commonly used basis functions for neural networks include multiquadratic functions, Cauchy functions, and Gaussian functions. In this study, the Gaussian activation function is applied to the neural network. The Gaussian radial basis function is defined as follows:
Φ i = φ ( r ) = e x p r 2 2 σ 2 = e x p x c i 2 2 σ 2
· is the Euclidean norm, and c i represents the i -th fixed center point. When the input data deviates from the center point, the value of the radial basis function rapidly decreases to zero. σ represents the rate of reduction and is symmetric radially around the center. The unknown parameters c i in Equation (11) are determined through training. The RBF neural network structure can be designed using various algorithms, but selecting the RBF network’s centers is critical to the design. This study uses the k-means clustering method to determine center points iteratively, after which the size of all Gaussian RBF kernels can be calculated accordingly.
σ = c m a x 2 n c
c m a x represents the maximum distance between any two center points, and n c represents the number of center points. The linear weights ω i between the hidden layer and the output layer can be obtained using the pseudoinverse matrix method:
ω = G + y ~
In this Equation (13), y ~ is the expected response vector, and G + is obtained by solving the pseudoinverse of matrix G , defined as follows:
G = g q i g q i = e x p n c c m a x 2 x q c i , q = 1,2 , L , n ; i = 1,2 , n c
x q represents the input parameters.

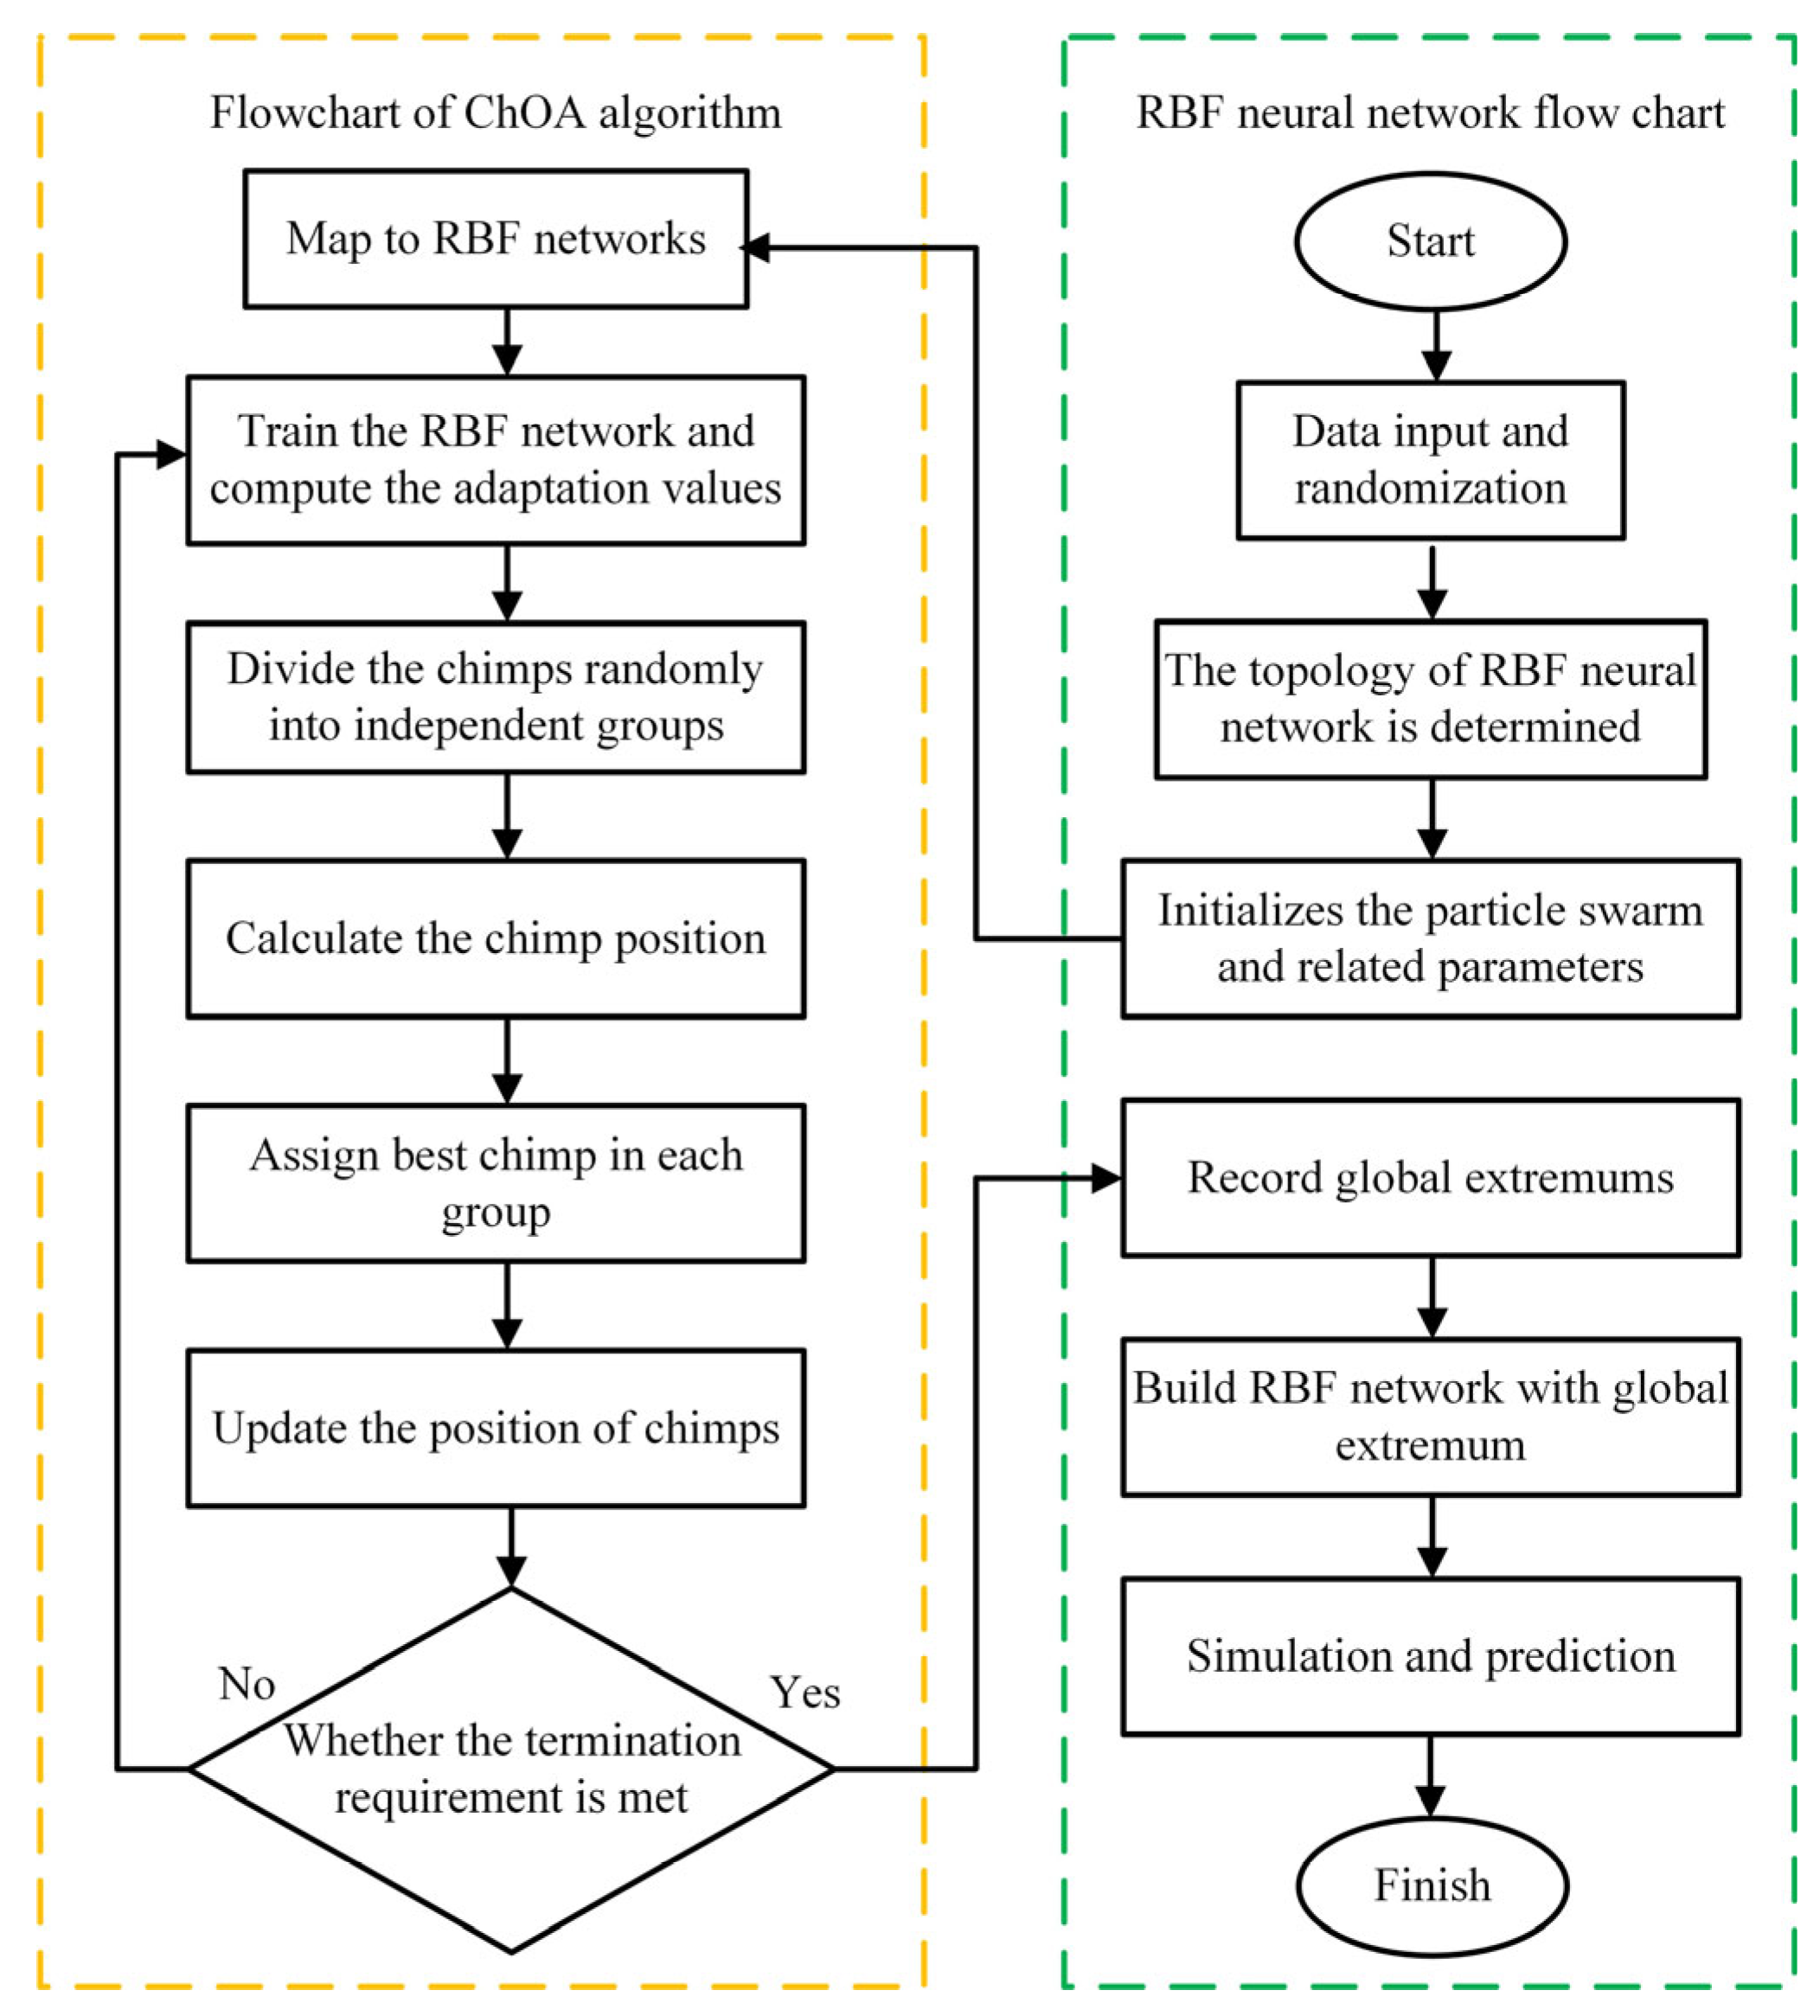
2.3.2. Algorithm Flow

As shown in Figure 6, in the ChOA algorithm, each potential solution to the optimization problem is represented by a group of “chimpanzees”, with each chimpanzee corresponding to a position in the search space. The ChOA-optimized model was set with a maximum iteration step of 300, population size of 50, default aggressiveness factor of 1.0, and repulsion factor of 2.0. First, the parameters of the ChOA algorithm (such as position) are mapped to the RBF neural network, where the RBF network is trained to compute each chimpanzee’s fitness value. The chimpanzees are then randomly divided into independent groups, with the position of each chimpanzee calculated accordingly. In each iteration, the best-performing chimpanzee from each group is selected, and all chimpanzee positions are updated. This process repeats until a termination condition is met (e.g., minimum error or maximum number of iterations). Once the condition is met, the algorithm outputs the global optimal position of the best chimpanzee. For the RBF neural network optimization, data are first input and randomized, and the RBF network’s topology is determined. Then, the chimpanzees and associated parameters are initialized, and the global extremum is recorded. With each ChOA algorithm iteration, the global optimal position is ultimately mapped to the RBF neural network, forming an optimized model based on the global optimal solution. This model, once trained, can predict the output vector.

2.3.3. Model Construction and Evaluation

Root mean square error (RMSE) is a commonly used metric for measuring prediction accuracy in continuous data models. It reflects the root mean square difference between predicted values and actual values, indicating the average deviation of the predictions from the true values. RMSE is one of the most commonly used performance evaluation metrics in regression prediction tasks. A smaller RMSE indicates lower prediction error and higher prediction accuracy. An RMSE of zero means the model’s predictions were completely accurate. Additionally, when comparing the predictive performance of different models or datasets, RMSE is advantageous because it is in the same units as the original data, allowing for a fair comparison of actual error sizes. Therefore, RMSE is selected as the primary evaluation metric for the prediction model in this study. The mathematical expression of the RMSE loss function is shown in Equation (15), where n is the number of samples, y i is the true value, and y ^ i is the predicted value. In addition to RMSE, Mean Absolute Error (MAE), Mean Bias Error (MBE), and the coefficient of determination (R2) were also used to comprehensively evaluate the model’s predictive performance.
RMSE   = 1 n i = 1 n y i y ^ i 2

2.3.4. Modeling the Relationship Between Fruit Hardness and Mechanical Gripper Force

After obtaining the fruit’s hardness using the prediction model, the gripping force of the mechanical claw is adjusted according to the real-time prediction of the fruit’s hardness. A key challenge in this relationship is that the fruit hardness and the gripping force of the mechanical claw are not directly proportional. Using the predicted hardness value to set the gripping force could potentially lead to fruit damage or unstable gripping. Therefore, we introduce a safety coefficient to refine this relationship.
In this model, the fruit’s hardness is predicted in real-time using machine vision, while the gripping force of the mechanical claw is adjusted through the safety coefficient. Specifically, the relationship between the gripping force and fruit hardness is expressed as
F c = F s
where Fc is the gripping force of the mechanical claw, F is the real-time predicted fruit hardness, and s is the safety coefficient, set at 1.3 in this study. The selection of the safety coefficient depends on various factors, including the fruit’s physical properties, the prediction error in hardness, and the need to avoid fruit damage. By appropriately adjusting the safety coefficient, the gripping force can be optimized, ensuring the integrity of the fruit while improving the efficiency and accuracy of the mechanical harvesting process.

2.4. Visual Recognition and Experimental Design

After determining the model, we need to perform recognition and experimentation. The data were collected at the Wolin Blueberry Base in Qingdao, using a Canon camera for shooting. The recognition device was the Canon camera from Canon Corporation in Tokyo, Japan (R6 MARK II) used by the research institute. During the experimental validation process, we used visual recognition equipment to collect blueberry fruit data from different greenhouses and seasons. Under consistent lighting conditions, images of mature fruits were captured from different angles (front view, side view, and bottom view), as shown in Figure 7.
To ensure the richness of the dataset, we applied data augmentation methods such as rotation, scaling, contrast enhancement, and noise addition in random combinations to the collected images. Through data augmentation, we obtained 4210 images, which were used as training images for maturity model recognition and for parameter extraction. In this study, we classified blueberries into three categories: mature, semi-mature, and immature. Mature blueberries are dark purple, large in size, and have a deep overall color. Considering real harvesting situations (taste, sales, transportation, texture), we selected fruits with a maturity score of 0.9–0.95 (fully ripe fruits have a score of 1.0) for image recognition. Fruit diameter, thickness, and other relevant parameters were extracted from the images and used as inputs for real-time fruit hardness prediction. The model’s prediction data were recorded after operation. After the recognition, the fruits were harvested and tested using a test machine, as shown on the right side of Figure 7. The test machine measured the maximum hardness the fruit could withstand through a pressure test, with an accuracy of 0.01 N. The recognition, harvesting, and testing processes for fruits of the same maturity were carried out simultaneously to avoid fruit spoilage due to storage.

3. Results and Discussion

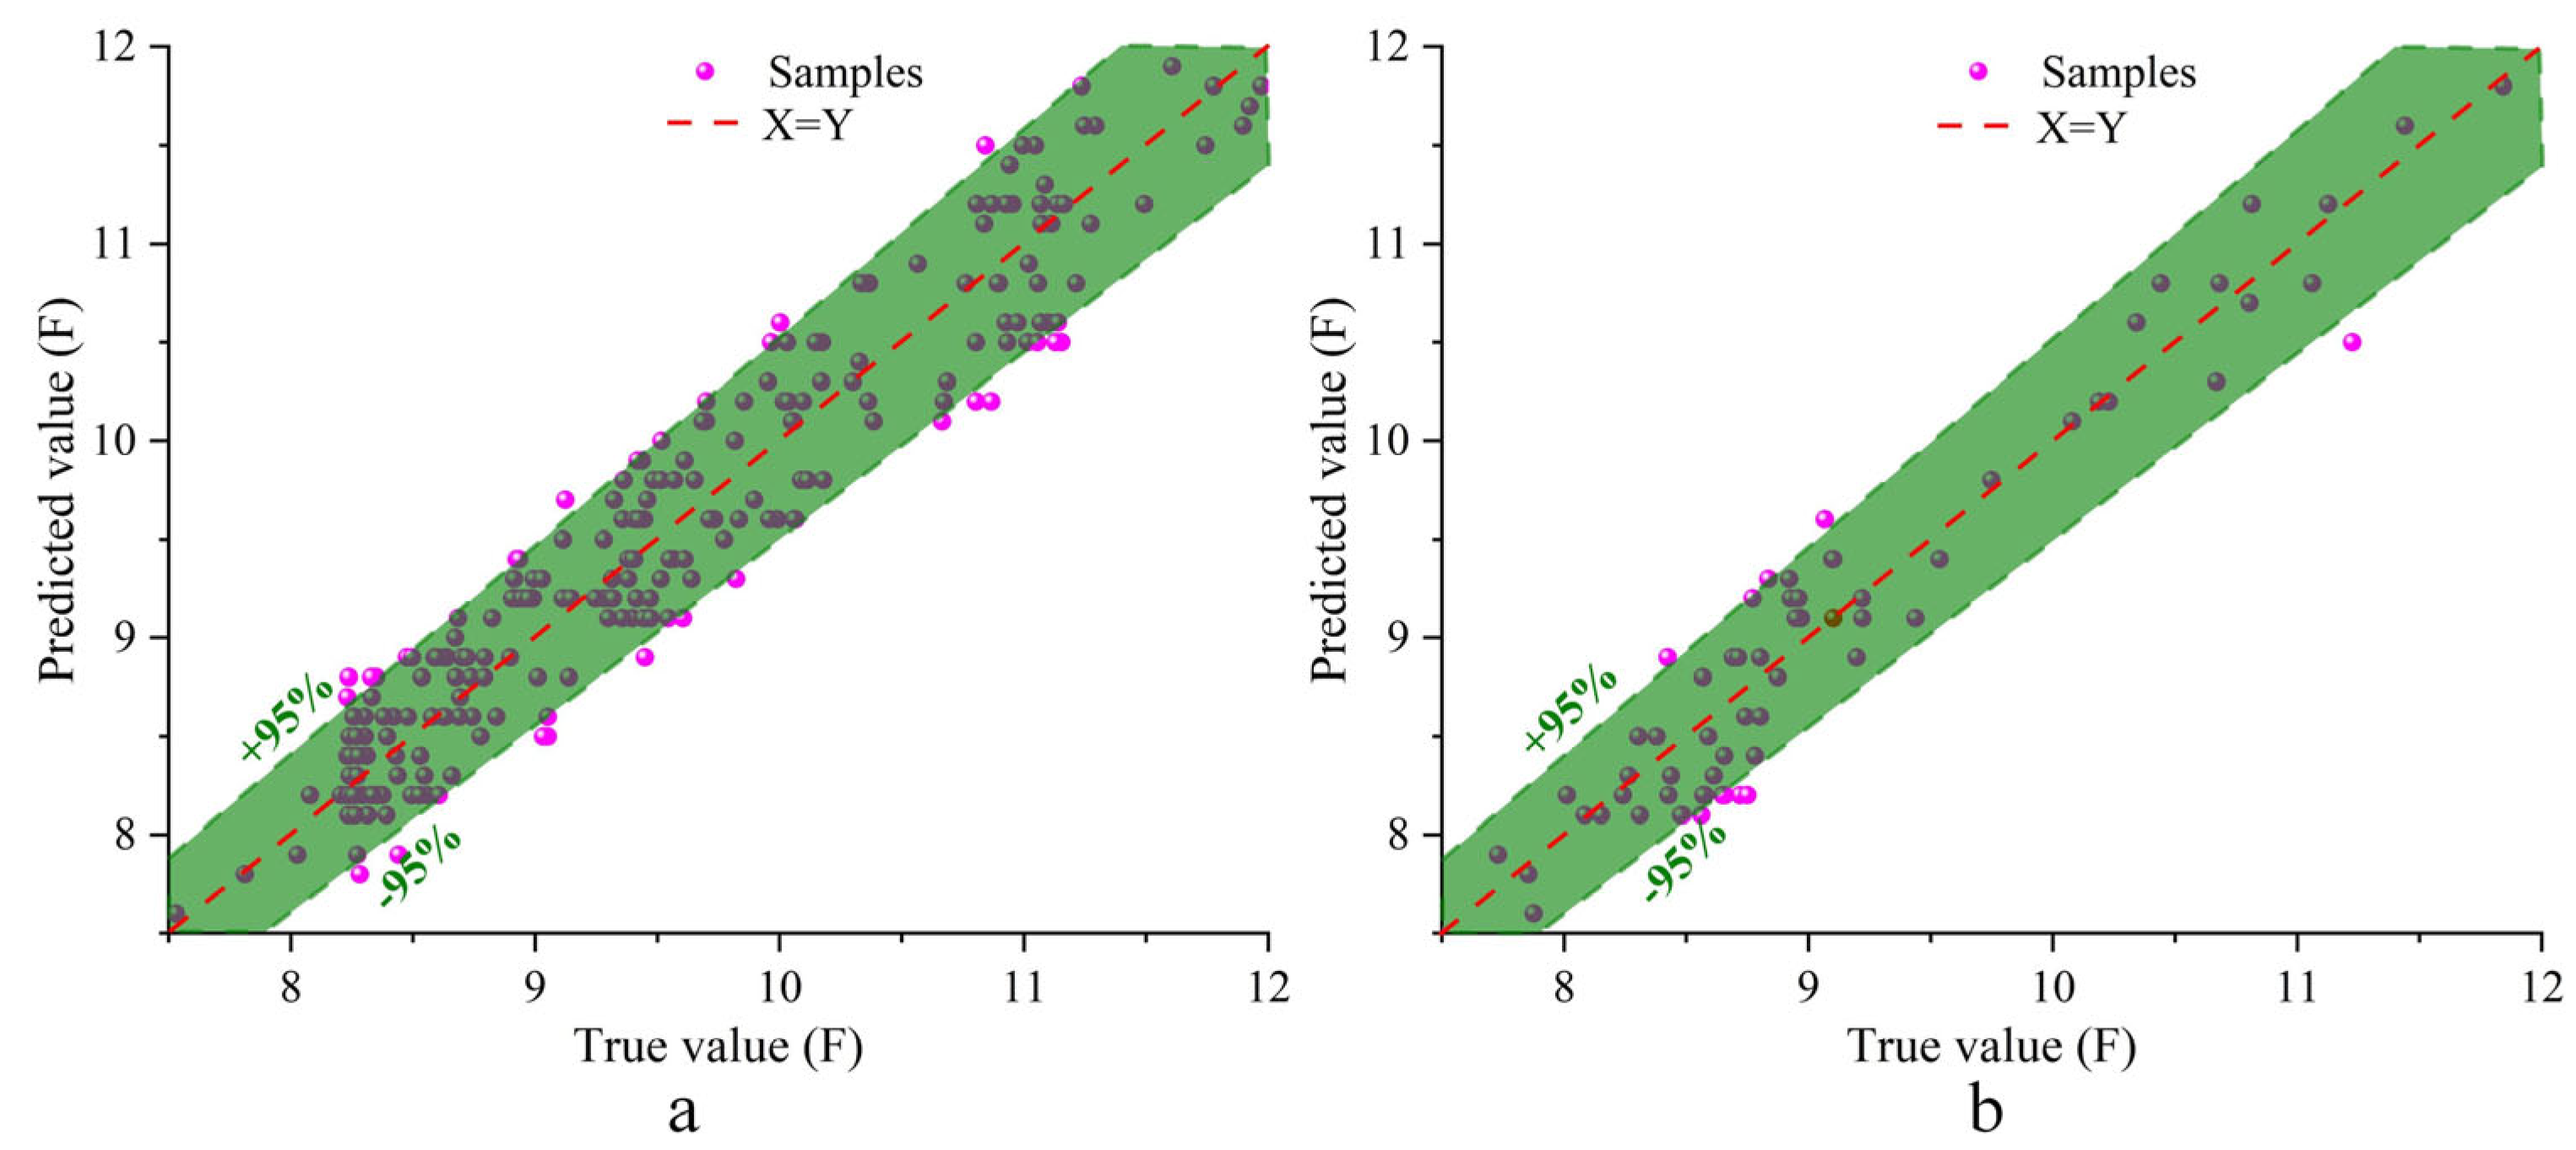
3.1. Model Prediction Results

3.1.1. Results and Analysis

In this study, the 400 experimental data points were randomly shuffled and divided into a training set and a testing set at a 4:1 ratio. During model prediction, the fruit diameter, thickness, and weight from the training set were used as input samples and fed into the prediction model. The output was the predicted fruit hardness. The model’s prediction results are shown in Figure 8, with the X-axis representing the true values and the Y-axis representing the predicted values. The closer the data points are to the center line, the more accurate the prediction. The green range indicates that the results are within a 5% error margin. From Figure 8a, it can be observed that the ChOA-RBF model consistently produces errors within 5% for the predicted samples, significantly outperforming other models. The ChOA-RBF model shows the best overall performance. As model accuracy decreases, the data points with larger errors fall outside the green range, and the number of data points outside the 5% error range indicates lower accuracy, with the BP model showing the lowest accuracy.
After the model training was completed, the testing set data were input into the model to test the accuracy of the predicted fruit hardness. The results, shown in Figure 9, indicate that the ChOA-RBF model’s predicted values are closer to the real measured values, with smaller errors. In contrast, the other five models exhibit poor fitting for individual data points.
The evaluation metric calculation results for the model are shown in Table 1. It can be seen that the ChOA-RBF prediction model performs the best across all indicators. The root mean square error (RMSE) values for the training and testing sets are 0.5963 and 0.549, respectively, while the measured hardness values range between 8.3 and 12 N, meeting the precision requirements of this study. Additionally, the MAE and MBE values for the ChOA-RBF model are both less than 1, significantly outperforming the other five prediction models. Regarding the coefficient of determination (R2), a value greater than 0.7 is typically considered indicative of a good fit. The R2 value for the ChOA-RBF prediction model in the training set is 0.8313, with the deviation between the testing and training sets being less than 10%, indicating that the model has good generalization ability. From the comparison of performance parameters, the model performance ranking is as follows: ChOA-RBF > ChOA-RF > RBF > ChOA-BP > RF > BP. Furthermore, by comparing the performance parameters with and without ChOA optimization, it is clear that the optimization process improves the accuracy of the model.
Finally, an additional 40 sets of measured blueberry physical property data (note: these 40 sets of data include fruits from greenhouses in May and August) were input into four different prediction models to obtain the predicted fruit hardness values. The predicted values were compared with the real measured values, and the relative errors are shown in Figure 10. The ChOA-RBF model exhibited the smallest error. Among the 40 real data points, the maximum error was 8.3%, with the overall performance being the best. Therefore, in the following studies, the ChOA-RBF model is adopted, using blueberry parameters such as diameter, thickness, and weight as inputs to perform real-time prediction of fruit hardness, providing data support for the precise control of the mechanical claw’s gripping force.

3.1.2. Orthogonal Test Validation

To verify the validity of the ChOA-RBF model, an orthogonal experiment was conducted [40]. In the experiment, the blueberry fruit had a diameter range of 13–25 mm, a thickness range of 8–15 mm, and a weight range of 1–5 g. The orthogonal experimental design generated 27 data points, which were input into the ChOA-RBF training model for prediction. The output results are shown in Table 2. To ensure the consistency of data accuracy, all values are rounded to two decimal places. By comparing the predicted values from the orthogonal experiment ChOA-RBF model with the actual measured values, the maximum relative error was found to be 3.68%, the minimum absolute error was −0.31 N, and the maximum absolute error was 0.44 N. Under the previously defined safety factor, the error range is acceptable. It can be observed that when the absolute error is positive, the model predicts a higher maximum pressure tolerance than the actual measured value. This means the predicted value exceeds the fruit’s rupture pressure, and using this value directly as the gripping force for the mechanical claw would risk fruit rupture. If the error is too large, the fruit could be crushed. When the absolute error is negative, it indicates that the model predicts a lower maximum pressure tolerance than the actual value. In this case, the gripping force of the mechanical claw would be less than the rupture pressure of the fruit, making the harvesting process relatively safe. Although the fruit is less likely to be crushed, if the error is too large, the gripping force might be insufficient, resulting in failed harvesting. Therefore, the safety factor is critical in the relationship between fruit hardness and the mechanical claw’s gripping force. Moreover, to address potential issues from positive or negative errors, the incorporation of flexible materials and curved surface designs in the mechanical claw structure to improve gripping efficiency and safety is recommended. Experimental validation showed that the relative errors between the actual measured results and the orthogonal table predictions were all less than 5%. This outcome indicates that the prediction accuracy of the model is within an acceptable range, confirming the effectiveness and reliability of the ChOA-RBF model in predicting blueberry fruit hardness.

3.2. Two-Parameter Method

3.2.1. Design Principles

In the blueberry harvesting process, a visual recognition device can quickly determine the fruit’s diameter and thickness, but the fruit’s weight cannot be directly obtained through image recognition. This requires either manual input or a comparative prediction to estimate the weight. This step adds an additional computational process, increasing the operational complexity and time cost. Furthermore, as identified in Section 2.2.1, the weight of the fruit is most strongly correlated with its diameter and thickness—the larger the fruit, the heavier it tends to be. However, the correlation between weight and hardness is relatively weak, with a correlation coefficient of 0.72. Similarly, in rows 2, 7, 22, and 26 of the data, it was found that fruits with similar weights had different diameters and thicknesses, yet the hardness of the fruits varied significantly. This further confirms that fruit hardness is closely related to its diameter and thickness, while the correlation with weight is weaker.
Therefore, this study adopts the “two-parameter method”, which uses only the fruit’s diameter and thickness to predict and verify blueberry hardness. This reduction in the number of parameters not only improves work efficiency and simplifies the harvesting robot’s operation process but also maintains the accuracy and reliability of the prediction.

3.2.2. Prediction Results and Validation

The two-parameter method was used to re-establish the mapping relationship between fruit diameter, thickness, and fruit hardness. The 400 data points were input into the ChOA-RBF training model. After training with the same model parameters, the prediction results for the training and testing sets are shown in Figure 11a and Figure 11b, respectively. It can be observed that the data points are mainly concentrated on the lower side of the X = Y-axis, with a few points slightly outside the range. The predictions made using the two-parameter method are more conservative, with predicted fruit hardness values slightly lower than the actual measured values. The error, when compared to the three-parameter method, has decreased, but the error range remains within 6%.
Table 3 compares the evaluation metrics of the two-parameter method with the three-parameter method. It can be seen that after removing the “weight” parameter, the R2 of the two-parameter method decreased by about 0.13, and the RMSE value increased by about 0.1, resulting in a slight decrease in the accuracy of the evaluation metrics. The results show that the MAE and MBE increased by 0.1 and 0.01, respectively, indicating a slight decline in the performance of the two-parameter model compared to the three-parameter model.
To further compare the differences between the two-parameter method and the three-parameter method, we compared the iteration process and actual prediction results of the models. The iteration results are shown in Figure 12a.
Due to the removal of the “weight” parameter, the two-parameter method had a faster convergence rate, reaching convergence in 107 steps with an optimal fitness value of 0.10213. The three-parameter method, on the other hand, reached convergence in 188 steps with a fitness value of 0.10207. Although the three-parameter method had a slight advantage in accuracy, it required more time and computational resources. Additionally, we selected 20 other blueberry samples for prediction and experimental comparison, with results shown in Figure 12b. The results show that the prediction error of the two-parameter method remains within 8%. Although it is higher than that of the three-parameter method, the impact on practical applications is negligible, while the speed improvement of the algorithm significantly outweighs the slight increase in error. Moreover, considering the actual working efficiency, the three-parameter method requires calculations and predictions for weight, whereas the two-parameter method simplifies the computation steps, reducing recognition time and providing faster execution speed. Therefore, despite a slight decrease in prediction accuracy, the two-parameter method remains a feasible and effective solution, offering higher practicality in real-world blueberry harvesting robot applications. While the evaluation metrics in Table 3 show a slight increase in error for the two-parameter method, the actual predictions reveal that the difference between the two methods is not significant.

3.3. Model Recognition and Application

After confirming the ChOA-RBF prediction model and applying the two-parameter method, further experimental validation was conducted. As described in Section 2.4, we selected fruits with a maturity index of 0.95 and extracted parameters (diameter and thickness) from the recognition images for real-time prediction. These fruits were then harvested, and a pressure test was conducted using a test machine. The predicted results were compared with the actual measured values. The results for 40 blueberry samples, collected from different perspectives and different greenhouses, are shown in Table 4. It can be observed that the prediction errors between the predicted values and actual values are all within 1 N, with relative errors under 8%. Compared to the experimental errors conducted earlier, these data variables were obtained through visual recognition, and there is some discrepancy when compared to the actual data measured with a caliper. The final result’s hardness value error is likely caused by the measurement errors in the fruit diameter and thickness extracted through recognition. Although there are a few data points with relatively large errors, the maximum relative error was 7.37%, and the average relative error was 3.91%. This error range is acceptable in practical applications when the safety factor is applied.
It is important to note that the subject of this study is soft-textured blueberries, which are small fruits that are highly prone to damage due to their soft texture, thus increasing the difficulty of harvesting. Therefore, the applicability of this research to larger, harder fruits like pears or apples may be limited. However, this study provides a unique approach to solving the issue of mechanical claw damage during fruit harvesting.
Additionally, this research did not further consider the impact of factors such as leaf obstruction, recognition from different positions, and errors in feature extraction. Other factors like time-domain variations, pests, and different varieties’ effects on fruit hardness were also not addressed. In future optimizations of harvesting robot designs, these factors may need further investigation and consideration to improve the accuracy and reliability of the system.

4. Discussion

With the rise in labor costs and the advancement of agricultural technology, mechanized crop harvesting is bound to become the future trend of agriculture. However, the development of blueberry harvesting robots has been slow due to the fruit’s clustered growth and soft texture. Additionally, blueberries have low fruit hardness and fragile skin, making them easily damaged by conventional mechanical claws. This necessitates the flexible design and precise control of mechanical claws. This study addresses the challenge of non-destructive harvesting for soft fruits by proposing a method that extracts blueberry features through a visual recognition device and predicts fruit hardness. Based on the predicted hardness, the mechanical claw’s gripping force is dynamically adjusted to prevent fruit damage and achieve precise, non-destructive harvesting. We first trained and simulated ChOA optimized RBF, BP, and RF models to compare their differences and detection accuracy. To further verify the simulation’s accuracy, we conducted orthogonal experiments. The results revealed the low correlation of the weight parameter and its complexity in extraction, prompting us to propose the simpler and faster two-parameter model, which estimates fruit hardness using only diameter and thickness.
Subsequent experimental validation and evaluation demonstrated that the two-parameter model improves execution speed while maintaining prediction accuracy compared to the three-parameter model. However, we also observed that the recognition device and prediction accuracy still require further optimization. As visual algorithms advance, recognition efficiency and accuracy can be continuously improved. Moreover, large amounts of data revealed the presence of positive and negative prediction errors. Positive errors indicate that the gripping force may crush the fruit, while negative errors suggest insufficient gripping force, potentially causing fruit slippage. We addressed this issue by introducing a safety factor in our study. In practical applications, the use of flexible materials and curved mechanical claw designs could further enhance harvesting efficiency and accuracy. These aspects will be considered in our future design and development.
In this study, we focused on rabbit-eye blueberries, a representative variety widely grown in northern greenhouses and southern open fields. In future extensions, we plan to incorporate different varieties and planting environments as parameters to optimize our model. This will enable the model to automatically adjust to various harvesting conditions across different varieties and regions. The proposed method could also be applied to other soft fruits with fragile skins, such as waxberries and peaches. By simulating human decision-making, the mechanical claw dynamically adjusts gripping force based on external features and image details, preventing damage. This image-based fruit hardness prediction method provides a new approach to non-destructive harvesting and offers a theoretical foundation for the dynamic adjustment of gripping force in harvesting robots.

5. Conclusions

The automatic harvesting of blueberries faces challenges due to the soft texture and fragility of the fruit. Therefore, this paper proposes a method that extracts blueberry features through a visual recognition device and predicts fruit hardness. Based on the predicted blueberry hardness, the gripping force of the mechanical claw is preset to prevent fruit damage and achieve precise, non-destructive harvesting. This method effectively solves the problem of damage between the harvesting device and the fruit. The main research conclusions of this paper are summarized as follows:
1.
A New Approach for Predicting Fruit Hardness: A novel method is proposed to directly extract the fruit’s pressure resistance from the blueberry image, identifying the correlation between fruit color and hardness. By predicting the hardness, the gripping force of the mechanical claw can be adjusted. Calculations and experiments demonstrate that this design is feasible and can improve harvesting efficiency while preventing fruit damage.
2.
Mapping Physical Properties to Hardness Using the ChOA-RBF Model: The ChOA-RBF model is applied to establish the mapping relationship between physical properties and hardness, compared with RBF, BP, and RF models from different angles. Evaluation metrics and error plots indicate that the ChOA-RBF model has significant advantages in fruit hardness prediction. Orthogonal experiments confirm that the maximum error of this model does not exceed 5%.
3.
Two-Parameter Method as a Practical Solution: Considering the limitations of the visual recognition device and practical operational applications, a two-parameter method is proposed as an alternative. Though the R2 value and some parameters slightly decrease, the actual prediction error remains under 8%. Furthermore, the method results in faster execution speed and higher harvesting efficiency in practical applications.
4.
By comparing the model recognition results with the actual test results, it was found that there is some discrepancy, which is caused by slight errors in the parameters extracted by the recognition device. However, the final result shows that the maximum relative error is less than 8%, with an average relative error of 3.91%, which is acceptable within the error range considering the safety factor of 1.3.

Author Contributions

Conceptualization, J.L. and H.Y.; methodology, B.L. and H.Y.; software, W.L.; validation, J.L. and W.L.; formal analysis, Y.L.; investigation, Y.L.; resources, J.L. and B.L.; data curation, W.L.; writing—original draft preparation, W.L.; writing—review and editing, J.L. and H.Y.; visualization, H.W.; supervision, H.W. and B.L.; project administration, H.Y.; funding acquisition, H.Y., B.L. and Y.L. All authors have read and agreed to the published version of the manuscript.

Funding

This research was supported by the Opening Project of Guangxi Key Laboratory of Automobile Components and Vehicle Technology, Guangxi University of Science and Technology (No. 2024GKLACVTKF01); the National Natural Science Foundation of China (No. 52202508); the Postdoctoral Innovation Project of Shandong Province (No. SDCX-ZG-202400208); and the Youth Project of Shandong Provincial Natural Science Foundation (No. ZR2022QE231).

Institutional Review Board Statement

Not applicable.

Data Availability Statement

The data presented in this study are available on request from the corresponding author.

Acknowledgments

The author thanks the Acoustics and Intelligent Control Laboratory of Qingdao University of Technology for the experimental equipment and Wallen Agriculture (Qingdao) for the experimental site.

Conflicts of Interest

The authors declare no conflicts of interest.

References

  1. Silva, S.; Costa, E.M.; Veiga, M.; Morais, R.M.; Calhau, C.; Pintado, M. Health promoting properties of blueberries: A review. Crit. Rev. Food Sci. Nutr. 2020, 60, 181–200. [Google Scholar] [CrossRef] [PubMed]
  2. Zhang, Q.; Zang, H.; Guo, X.; Li, S.; Xin, X.; Li, Y. A systematic study on composition and antioxidant of 6 varieties of highbush blueberries by 3 soil matrixes in China. Food Chem. 2025, 472, 142974. [Google Scholar] [CrossRef]
  3. DeVetter, L.W.; Yang, W.Q.; Takeda, F.; Chen, J. Harvesting Blueberries: A Guide to Machine Pick Blueberries for Fresh Market; Washington State University: Spokane, WA, USA, 2022. [Google Scholar] [CrossRef]
  4. Takeda, F.; Yang, W.Q.; Li, C.; Freivalds, A.; Sung, K.; Xu, R.; Hu, B.; Williamson, J.; Sargent, S. Applying New Technologies to Transform Blueberry Harvesting. Agronomy 2017, 7, 33. [Google Scholar] [CrossRef]
  5. Cappai, F.; Amadeu, R.R.; Benevenuto, J.; Cullen, R.; Garcia, A.; Grossman, A.; Ferrao, L.F.V.; Munoz, P. High-Resolution Linkage Map and QTL Analyses of Fruit Firmness in Autotetraploid Blueberry. Front. Plant Sci. 2020, 11, 562171. [Google Scholar] [CrossRef]
  6. Arak, M.; Soots, K.; Starast, M.; Olt, J. Mechanical properties of blueberry stems. Res. Agric. Eng. 2018, 64, 202–208. [Google Scholar] [CrossRef]
  7. Zhou, J.; Xu, L.; Zhao, J.; Hang, X.; Zhou, H. Effective excitation conditions for the intense motion of the ginkgo seed-stem system during mechanical vibration harvesting. Biosyst. Eng. 2022, 215, 239–248. [Google Scholar] [CrossRef]
  8. Freitas Grupioni, C.M.; Santos, F.L.; Velloso, N.S.; Magalhães Valente, D.S.; Assis de Carvalho Pinto, F. Macaw palm supply chain: Evaluation of a semi-mechanized fruit harvesting system. Ind. Crops Prod. 2020, 151, 112444. [Google Scholar] [CrossRef]
  9. Liu, Y.; Zheng, H.; Zhang, Y.; Zhang, Q.; Chen, H.; Xu, X.; Wang, G. “Is this blueberry ripe?”: A blueberry ripeness detection algorithm for use on picking robots. Front. Plant Sci. 2023, 14, 1198650. [Google Scholar] [CrossRef]
  10. Sun, Y.; Zhang, D.; Guo, X.; Yang, H. Lightweight Algorithm for Apple Detection Based on an Improved YOLOv5 Model. Plants 2023, 12, 3032. [Google Scholar] [CrossRef]
  11. Shi, Y.; Zhu, K.; Zhai, S.; Zhang, D.; Liu, L.; Zhao, J.; Long, Y.; Cui, Y. Design of an Apple-Picking End Effector. J. Mech. Eng./Stroj. Vestn. 2018, 64, 216. [Google Scholar] [CrossRef]
  12. Zhou, Q.; Gao, R.; Ma, Z.; Cao, G.; Chen, J. Research on system integration and control methods of an apple-picking robot in unstructured environment. Ind. Robot. Int. J. Robot. Res. Appl. 2024, 51, 369–379. [Google Scholar] [CrossRef]
  13. Bu, L.; Chen, C.; Hu, G.; Sugirbay, A.; Sun, H.; Chen, J. Design and evaluation of a robotic apple harvester using optimized picking patterns. Comput. Electron. Agric. 2022, 198, 107092. [Google Scholar] [CrossRef]
  14. Hu, M.-H.; Dong, Q.-L.; Liu, B.-L.; Opara, U.L.; Chen, L. Estimating blueberry mechanical properties based on random frog selected hyperspectral data. Postharvest Biol. Technol. 2015, 106, 1–10. [Google Scholar] [CrossRef]
  15. Oh, H.; Stapleton, L.; Giongo, L.; Johanningsmeier, S.; Mollinari, M.; Mainland, C.M.; Perkins-Veazie, P.; Iorizzo, M. Prediction of blueberry sensory texture attributes by integrating multiple instrumental measurements. Postharvest Biol. Technol. 2024, 218, 113160. [Google Scholar] [CrossRef]
  16. Yang, W.; Ma, X.; Hu, W.; Tang, P. Lightweight Blueberry Fruit Recognition Based on Multi-Scale and Attention Fusion NCBAM. Agronomy 2022, 12, 2354. [Google Scholar] [CrossRef]
  17. Montanaro, G.; Dichio, B.; Xiloyannis, C.; Lang, A. Fruit transpiration in kiwifruit: Environmental drivers and predictive model. AoB Plants 2012, 2012, pls036. [Google Scholar] [CrossRef]
  18. Zhai, Y.; Liang, Z.; Xu, S.; Huang, C.; Zhou, X.; Li, M.; Huang, Y. Machine learning based blueberry detection method by CIE-YOLOv5. Proc. SPIE 2024, 13105, 131051U. [Google Scholar] [CrossRef]
  19. Gai, R.; Liu, Y.; Xu, G. TL-YOLOv8: A Blueberry Fruit Detection Algorithm Based on Improved YOLOv8 and Transfer Learning. IEEE Access 2024, 12, 86378–86390. [Google Scholar] [CrossRef]
  20. Xu, H.; Li, Q.; Chen, J. Highlight Removal from A Single Grayscale Image Using Attentive GAN. Appl. Artif. Intell. 2022, 36, 1988441. [Google Scholar] [CrossRef]
  21. Zhuang, J.; Chen, W.; Guo, B.; Yan, Y. Infrared Weak Target Detection in Dual Images and Dual Areas. Remote Sens. 2024, 16, 3608. [Google Scholar] [CrossRef]
  22. Gholipoor, M.; Nadali, F. Fruit yield prediction of pepper using artificial neural network. Sci. Hortic. 2019, 250, 249–253. [Google Scholar] [CrossRef]
  23. Aherwadi, N.; Mittal, U.; Singla, J.; Jhanjhi, N.Z.; Yassine, A.; Hossain, M.S. Prediction of Fruit Maturity, Quality, and Its Life Using Deep Learning Algorithms. Electronics 2022, 11, 4100. [Google Scholar] [CrossRef]
  24. Qiao, J.; Guo, M.; Wu, Y.; Gao, J.; Yue, Z. Research on Strawberry Cold Chain Transportation Quality Perception Method Based on BP Neural Network. Appl. Sci. 2022, 12, 8872. [Google Scholar] [CrossRef]
  25. Lin, H.; Song, X.; Dai, F.; Zhang, F.; Xie, Q.; Chen, H. Research on Machine Learning Models for Maize Hardness Prediction Based on Indentation Test. Agriculture 2024, 14, 224. [Google Scholar] [CrossRef]
  26. Rocha, H.; Dias, J.M. Early prediction of durum wheat yield in Spain using radial basis functions interpolation models based on agroclimatic data. Comput. Electron. Agric. 2019, 157, 427–435. [Google Scholar] [CrossRef]
  27. Chen, H.; Liang, Y.; Huang, H.; Huang, Q.; Gu, W.; Liang, H. Live Pig-Weight Learning and Prediction Method Based on a Multilayer RBF Network. Agriculture 2023, 13, 253. [Google Scholar] [CrossRef]
  28. Li, J.; Cheng, J.-H.; Shi, J.-Y.; Huang, F. Brief Introduction of Back Propagation (BP) Neural Network Algorithm and Its Improvement. In Advances in Computer Science and Information Engineering; Springer: Berlin/Heidelberg, Germany, 2012; pp. 553–558. [Google Scholar] [CrossRef]
  29. Pang, A.; Chang, M.W.; Chen, Y. Evaluation of Random Forests (RF) for Regional and Local-Scale Wheat Yield Prediction in Southeast Australia. Sensors 2022, 22, 717. [Google Scholar] [CrossRef] [PubMed]
  30. Ma, X.; Lu, L.; Ding, J.; Zhang, F.; He, B. Estimating Fractional Vegetation Cover of Row Crops from High Spatial Resolution Image. Remote Sens. 2021, 13, 3874. [Google Scholar] [CrossRef]
  31. Cai, J.; Ding, S.; Zhang, Q.; Liu, R.; Zeng, D.; Zhou, L. Broken ice circumferential crack estimation via image techniques. Ocean. Eng. 2022, 259, 111735. [Google Scholar] [CrossRef]
  32. Ma, X.; Ding, J.; Wang, T.; Lu, L.; Sun, H.; Zhang, F.; Cheng, X.; Nurmemet, I. A Pixel Dichotomy Coupled Linear Kernel-Driven Model for Estimating Fractional Vegetation Cover in Arid Areas From High-Spatial-Resolution Images. IEEE Trans. Geosci. Remote Sens. 2023, 61, 1–15. [Google Scholar] [CrossRef]
  33. Li, W.; Yin, H.; Li, Y.; Liu, X.; Liu, J.; Wang, H. Research on the Jet Distance Enhancement Device for Blueberry Harvesting Robots Based on the Dual-Ring Model. Agriculture 2024, 14, 1563. [Google Scholar] [CrossRef]
  34. Rivera, S.; Giongo, L.; Cappai, F.; Kerckhoffs, H.; Sofkova-Bobcheva, S.; Hutchins, D.; East, A. Blueberry firmness-A review of the textural and mechanical properties used in quality evaluations. Postharvest Biol. Technol. 2022, 192, 112016. [Google Scholar] [CrossRef]
  35. Rivera, S.; Hort, J.; Sofkova-Bobcheva, S.; Kerckhoffs, H.; Hutchins, D.; East, A. Instrumental mechanical parameters related to hand-feel touch firmness of blueberries. Postharvest Biol. Technol. 2023, 205, 112530. [Google Scholar] [CrossRef]
  36. Ban, S.; Tian, M.; Hu, D.; Xu, M.; Yuan, T.; Zheng, X.; Li, L.; Wei, S. Evaluation and Early Detection of Downy Mildew of Lettuce Using Hyperspectral Imagery. Agriculture 2025, 15, 444. [Google Scholar] [CrossRef]
  37. Khishe, M.; Mosavi, M.R. Chimp optimization algorithm. Expert Syst. Appl. 2020, 149, 113338. [Google Scholar] [CrossRef]
  38. Daoud, M.S.; Shehab, M.; Abualigah, L.; Alshinwan, M.; Elaziz, M.A.; Shambour, M.K.Y.; Oliva, D.; Alia, M.A.; Zitar, R.A. Recent Advances of Chimp Optimization Algorithm: Variants and Applications. J. Bionic Eng. 2023, 20, 2840–2862. [Google Scholar] [CrossRef]
  39. Strumiłło, P.; Kamiński, W. Radial Basis Function Neural Networks: Theory and Applications. Neural Netw. Soft Comput. 2003, 19, 107–119. [Google Scholar] [CrossRef]
  40. Wang, Z.; Yin, H.; Li, W.; Li, Y.; Liu, J. Research on the Design Method of Blueberry Automatic Harvesting Clamp Force Based on Neural Networks. Appl. Eng. Agric. 2024, 40, 327–338. [Google Scholar] [CrossRef]
Figure 1. Workflow diagram of the study.
Agriculture 15 00603 g001
Figure 2. Experimental field and fruit information. (a) Image of the experimental greenhouse; (b) plants and sample fruits inside the greenhouse.
Agriculture 15 00603 g002
Figure 3. Correlation heatmap between fruit diameter, thickness, weight, and hardness.
Agriculture 15 00603 g003
Figure 4. Detailed design process flowchart.
Agriculture 15 00603 g004
Figure 5. Using the ChOA algorithm to optimize the RBF prediction model for fruit hardness prediction and adjusting the gripper force.
Agriculture 15 00603 g005
Figure 6. Flowchart of the ChOA-RBF algorithm.
Agriculture 15 00603 g006
Figure 7. Visual recognition of mature blueberries and fruit testing rig during the experimental process.
Agriculture 15 00603 g007
Figure 8. Comparison of simulation results for different prediction models on the training set, with X-axis representing true values and Y-axis representing predicted values. (a) ChOA-RBF model; (b) ChOA-RF model; (c) RBF model; (d) ChOA-BP model; (e) RF model; and (f) BP model.
Agriculture 15 00603 g008
Figure 9. Comparison of simulation results for different prediction models on the testing set, with X-axis representing true values and Y-axis representing predicted values. (a) ChOA-RBF model; (b) ChOA-RF model; (c) RBF model; (d) ChOA-BP model; (e) RF model; and (f) BP model.
Agriculture 15 00603 g009
Figure 10. Comparison of relative errors for 40 data points predicted by six models.
Agriculture 15 00603 g010
Figure 11. Comparison of simulation results for the two-parameter ChOA-RBF model, with X-axis representing true values and Y-axis representing predicted values. (a) Training set comparison; (b) testing set comparison.
Agriculture 15 00603 g011
Figure 12. Comparison of the two-parameter method and three-parameter method. (a) Model iteration results comparison; (b) comparison of relative error for 20 experimental predictions.
Agriculture 15 00603 g012
Table 1. Comparison of different evaluation metrics for six prediction models on the training and testing sets.
ModelsEvaluation Index
Training SetTesting Set
RMSEMAEMBER2RMSEMAEMBER2
ChOA-RBF0.59630.41240.01840.83130.5490 0.4123−0.01200.7910
ChOA-BP0.72380.51140.04870.69920.72060.49310.06510.6233
ChOA-RF0.62230.47290.02010.79520.55730.5211−0.01460.7655
RBF0.71170.4908−0.02830.71750.67090.5501−0.01530.5845
BP0.75040.5963−0.06240.66930.81350.63840.05650.5778
RF0.72650.52870.05170.67760.76370.48260.06340.7134
Table 2. Orthogonal experiment table, comparison between actual values and model prediction results.
No.Diameter (mm)Thickness (mm)Weight (g)Predicted Data
(N)
Actual Data (N)Absolute Error (N)Relative Error (%)
113.078.021.218.358.44−0.09−1.02
213.199.451.258.898.810.080.89
313.319.561.288.378.280.091.03
413.549.561.318.768.630.131.47
514.5211.021.589.008.940.060.68
614.199.561.728.678.620.050.62
714.7710.241.918.818.780.030.33
815.259.571.959.189.160.020.27
915.2810.191.989.789.610.171.76
1016.4610.172.159.529.73−0.21−2.19
1116.6512.012.2510.069.840.222.23
1216.8111.732.2410.5210.190.333.21
1317.7410.742.7610.1710.080.090.85
1418.0311.153.1710.4810.51−0.03−0.27
1518.6512.10 3.249.769.630.131.35
1619.0513.143.839.879.8700
1719.9712.243.199.739.630.11.03
1820.0713.433.909.539.390.141.47
1920.3612.613.5710.3510.240.111.03
2020.3812.193.6112.0711.640.433.68
2121.10 11.193.9211.0711.26−0.19−1.69
2221.3612.784.2311.5211.83−0.31−2.62
2321.4412.713.9811.4311.240.191.66
2422.9614.734.3412.4512.170.282.34
2523.0114.014.2111.8911.730.161.38
2623.8914.834.8811.7111.620.090.75
2724.7714.165.4612.9512.510.443.54
Table 3. Comparison of evaluation metrics for the ChOA-RBF model using the two-parameter and three-parameter methods on the training and testing sets.
MethodsEvaluation Index
Training SetTesting Set
RMSEMAEMBER2RMSEMAEMBER2
Three-parameter0.59630.41240.01840.83130.5490 0.41230.05650.7910
Two-parameter0.70130.51380.01940.70760.63280.52610.05710.6534
Table 4. Comparison between predicted results from the ChOA-RBF model using the two-parameter method and actual measurements from the test machine based on the recognition images.
No.Diameter (mm)Thickness (mm)Actual Result (N)Predicted Value (N)Error (N)Relative Error (%)
115.2710.739.408.720.687.23
222.6812.2411.5411.130.413.55
315.6113.1610.6310.930.302.82
419.3214.139.319.210.101.07
514.269.398.488.620.141.66
618.8414.9110.2310.450.222.15
713.719.588.518.320.191.98
813.1512.389.9810.500.525.21
915.2812.969.8110.120.313.16
1016.6712.418.808.180.627.05
1119.3812.1310.8210.580.242.22
1218.5212.6911.2310.960.272.40
1315.1310.3710.0110.730.727.19
1418.1413.3110.539.920.615.79
1519.5314.4411.4010.820.585.09
1613.419.368.258.430.182.18
1715.319.919.368.740.626.62
1816.6511.928.809.180.384.32
1913.5910.979.019.320.313.44
2018.2512.1410.089.870.211.73
2113.959.698.208.610.415.00
2214.7111.0412.2511.650.604.90
2314.2512.1510.329.910.413.97
2418.7311.98.548.530.010.12
2517.7912.499.9010.390.494.95
2615.319.968.719.240.536.08
2715.3811.879.179.080.090.98
2817.5411.8612.2011.360.846.89
2920.6513.9211.8611.450.594.97
3013.1810.337.868.120.263.31
3112.9110.108.828.170.657.37
3215.8312.489.449.910.474.98
3317.3812.779.329.810.495.26
3412.839.608.208.160.040.49
3516.7410.8910.149.870.272.66
3615.2412.158.438.910.485.69
3722.7614.4312.2611.660.604.89
3822.5914.4611.9911.570.423.50
3913.019.868.218.220.010.12
4018.2413.1510.5810.970.393.69
AVG16.5411.869.819.760.393.91
Disclaimer/Publisher’s Note: The statements, opinions and data contained in all publications are solely those of the individual author(s) and contributor(s) and not of MDPI and/or the editor(s). MDPI and/or the editor(s) disclaim responsibility for any injury to people or property resulting from any ideas, methods, instructions or products referred to in the content.

