
Evaluating the Dynamic Response of Cultivated Land Expansion and Fallow Urgency in Arid Regions Using Remote Sensing and Multi-Source Data Fusion Methods

 , ,
, ,
Abstract
1. Introduction
2. Study Area and Data Sources
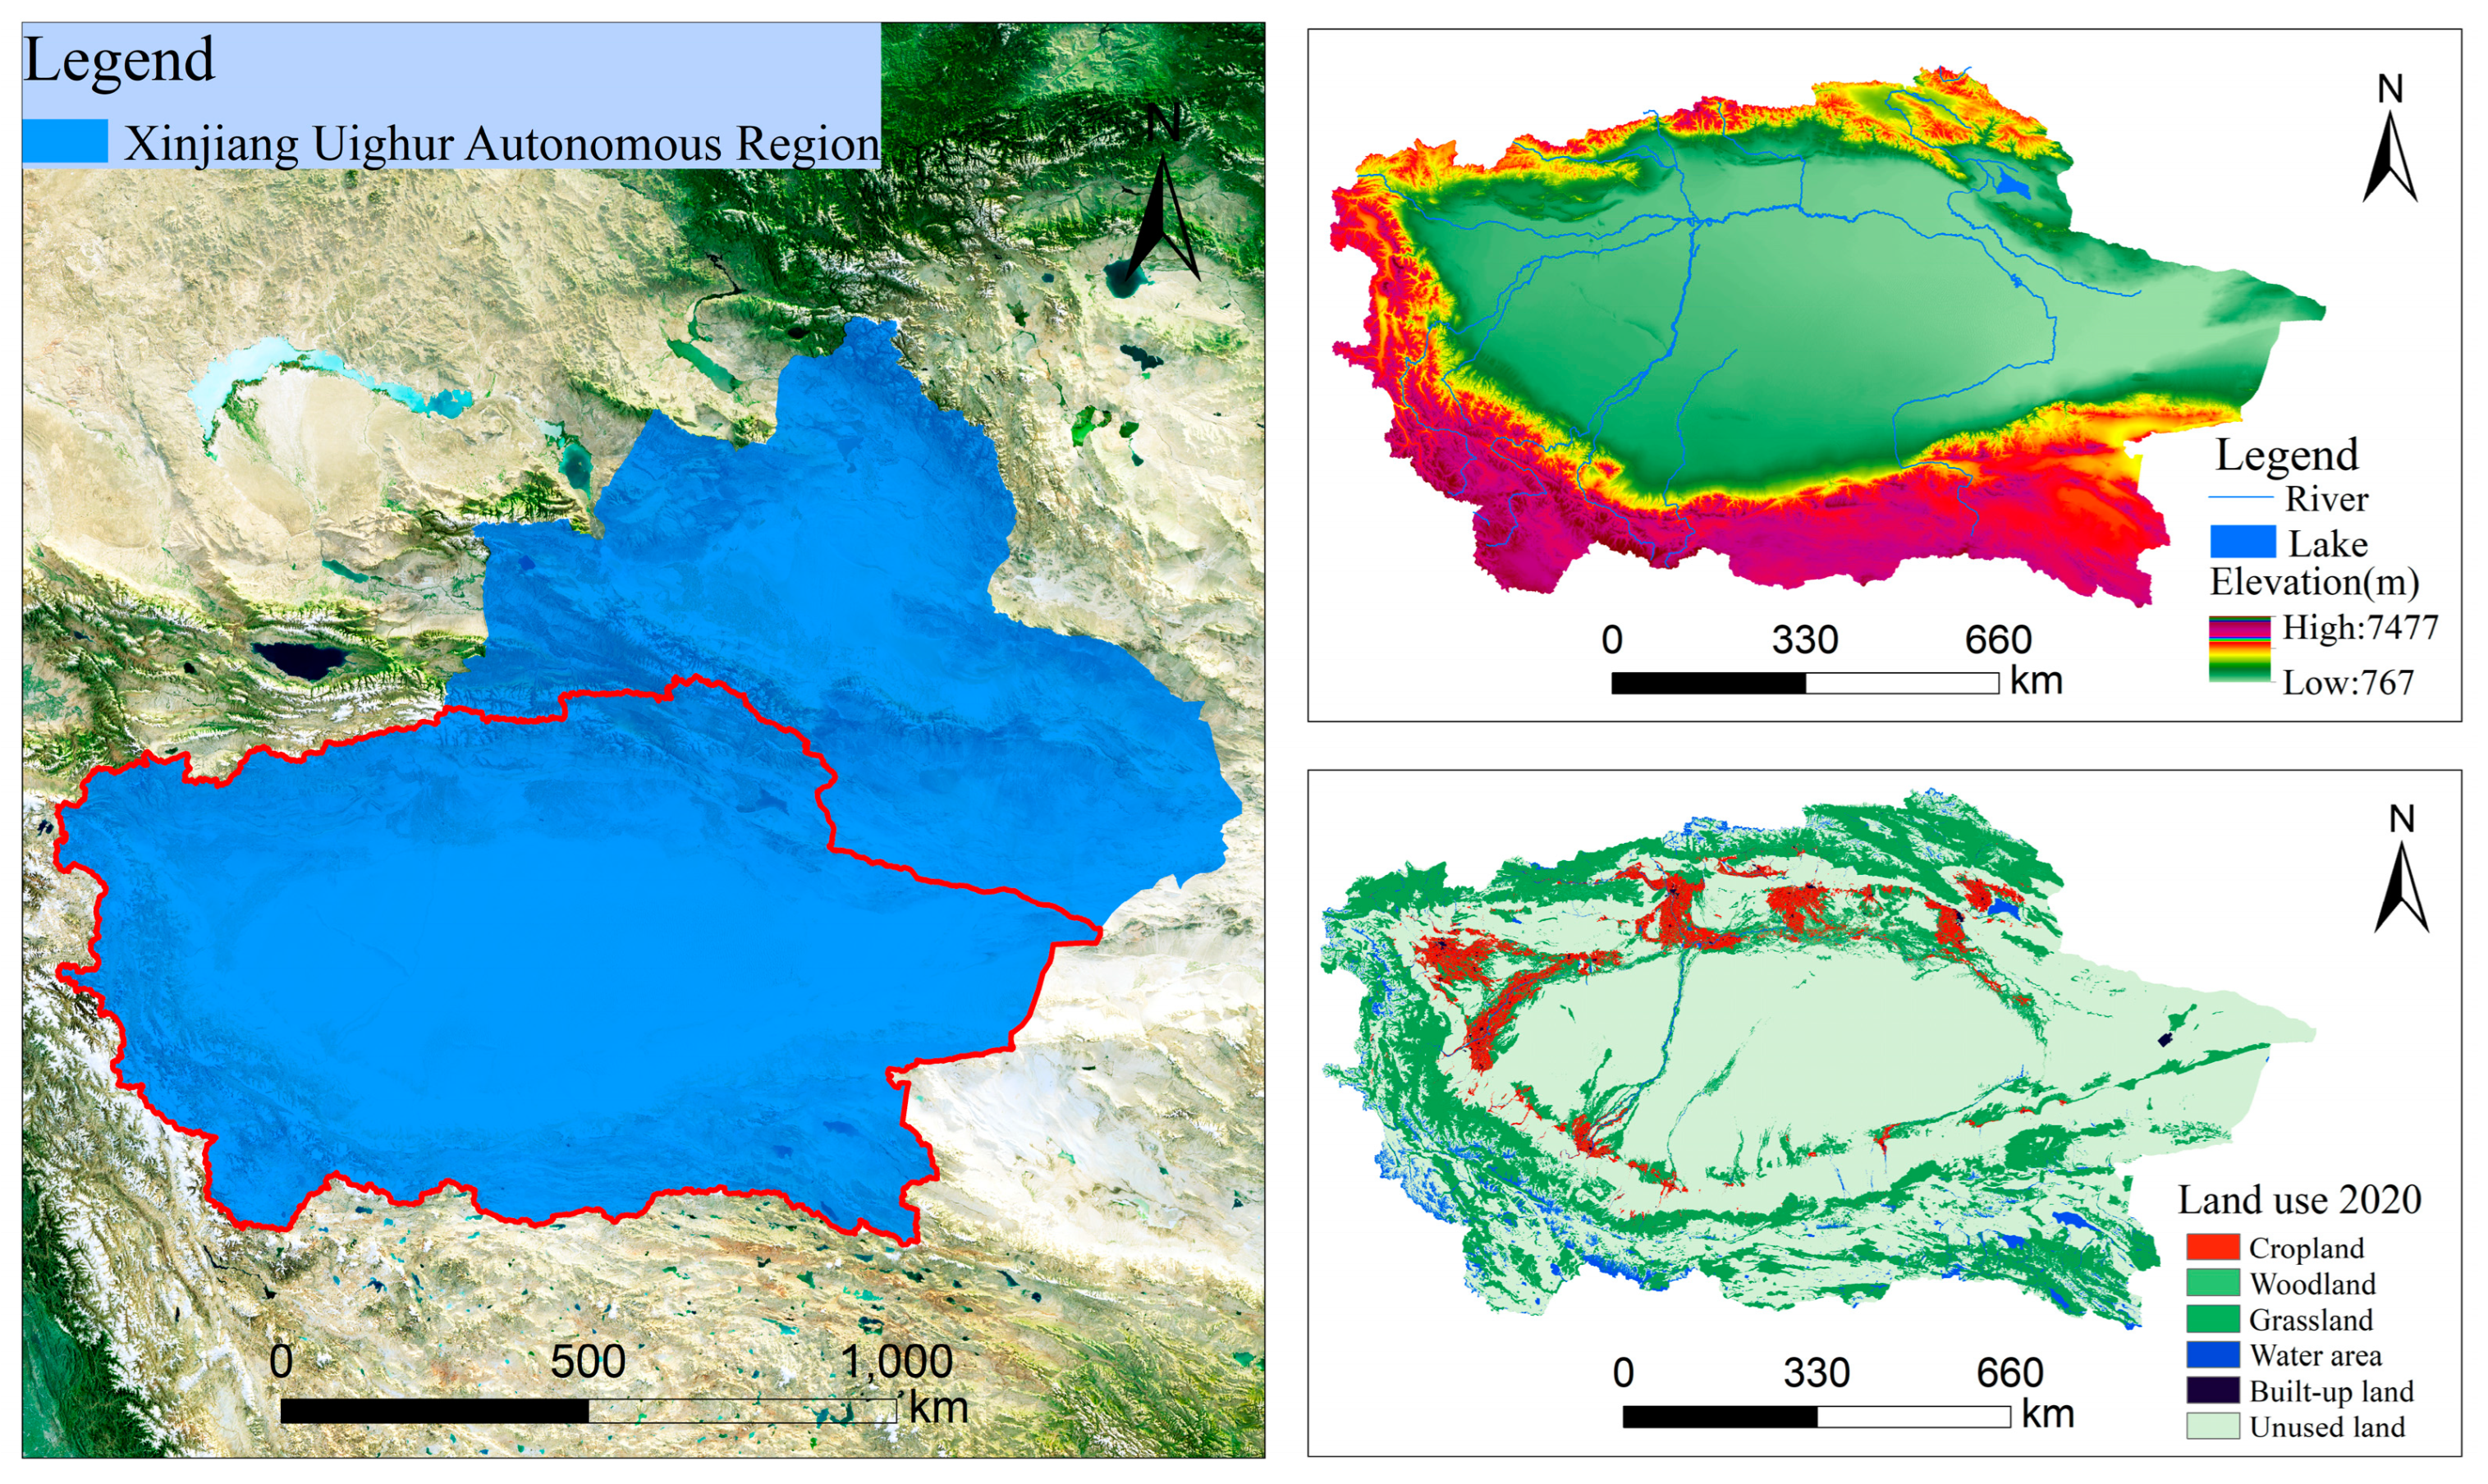
2.1. Overview of the Research Area
2.2. Data Sources
3. Research Methodology
3.1. Land Use Transfer Matrix
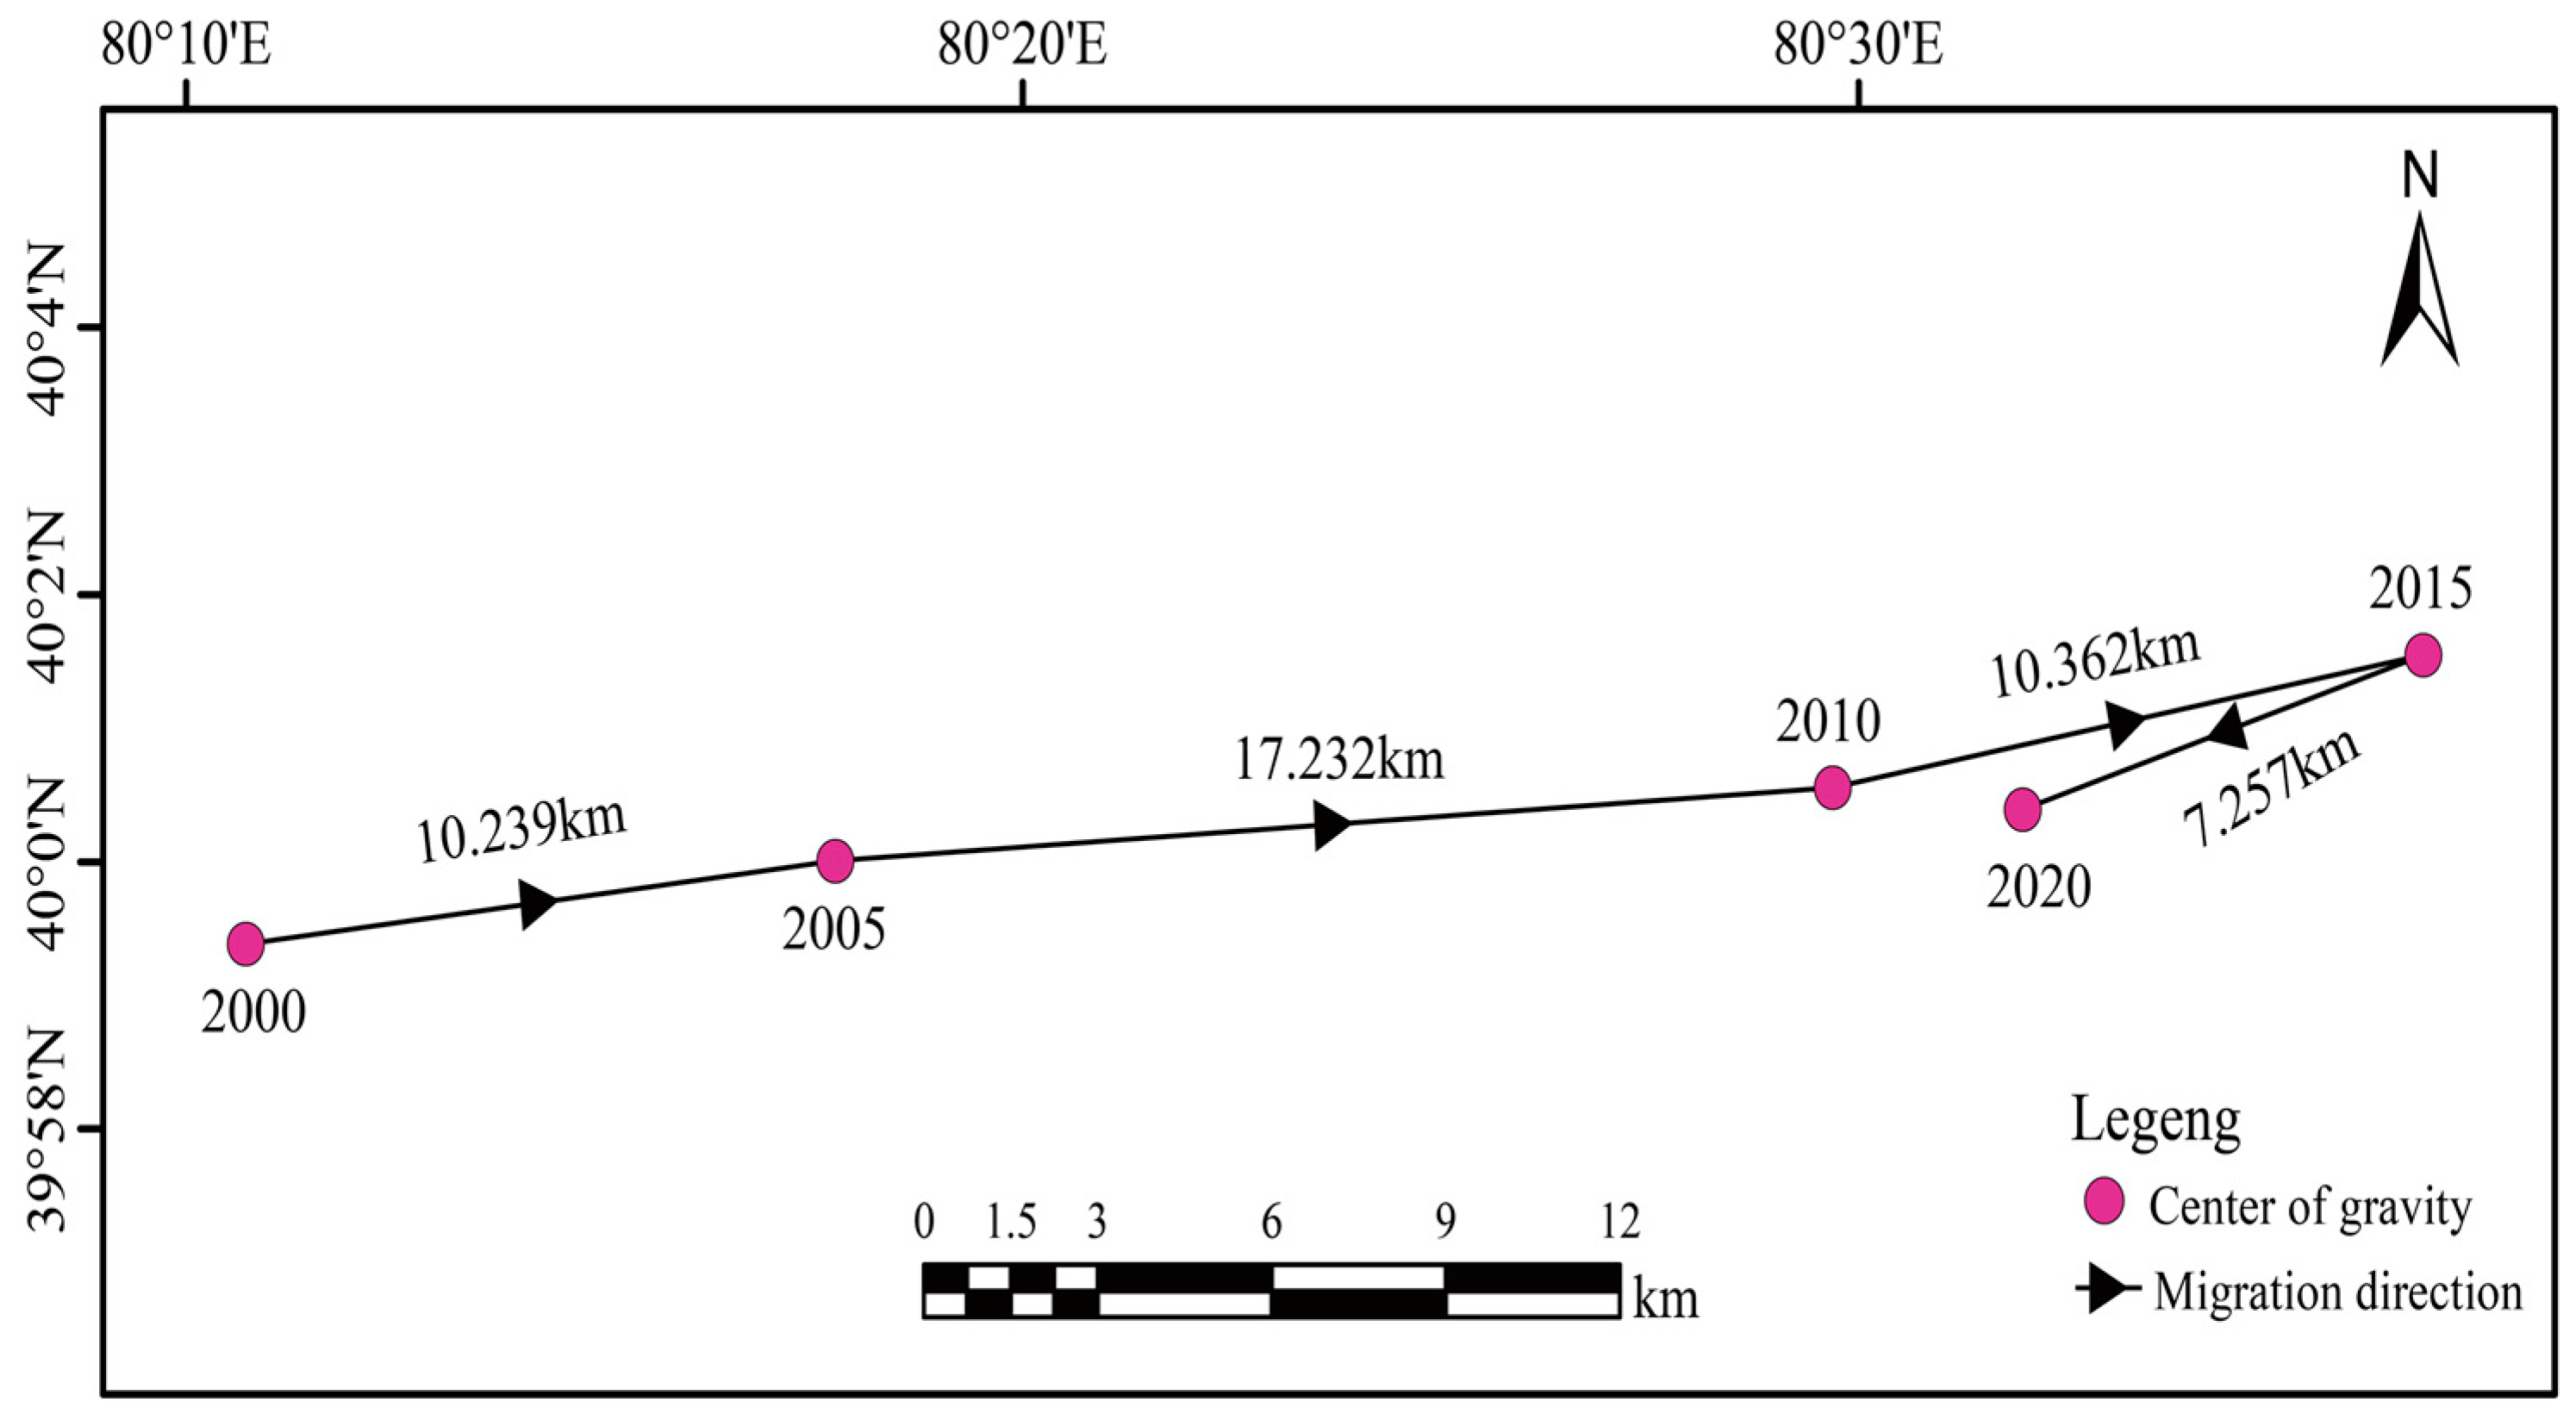
3.2. Centroid Migration Model
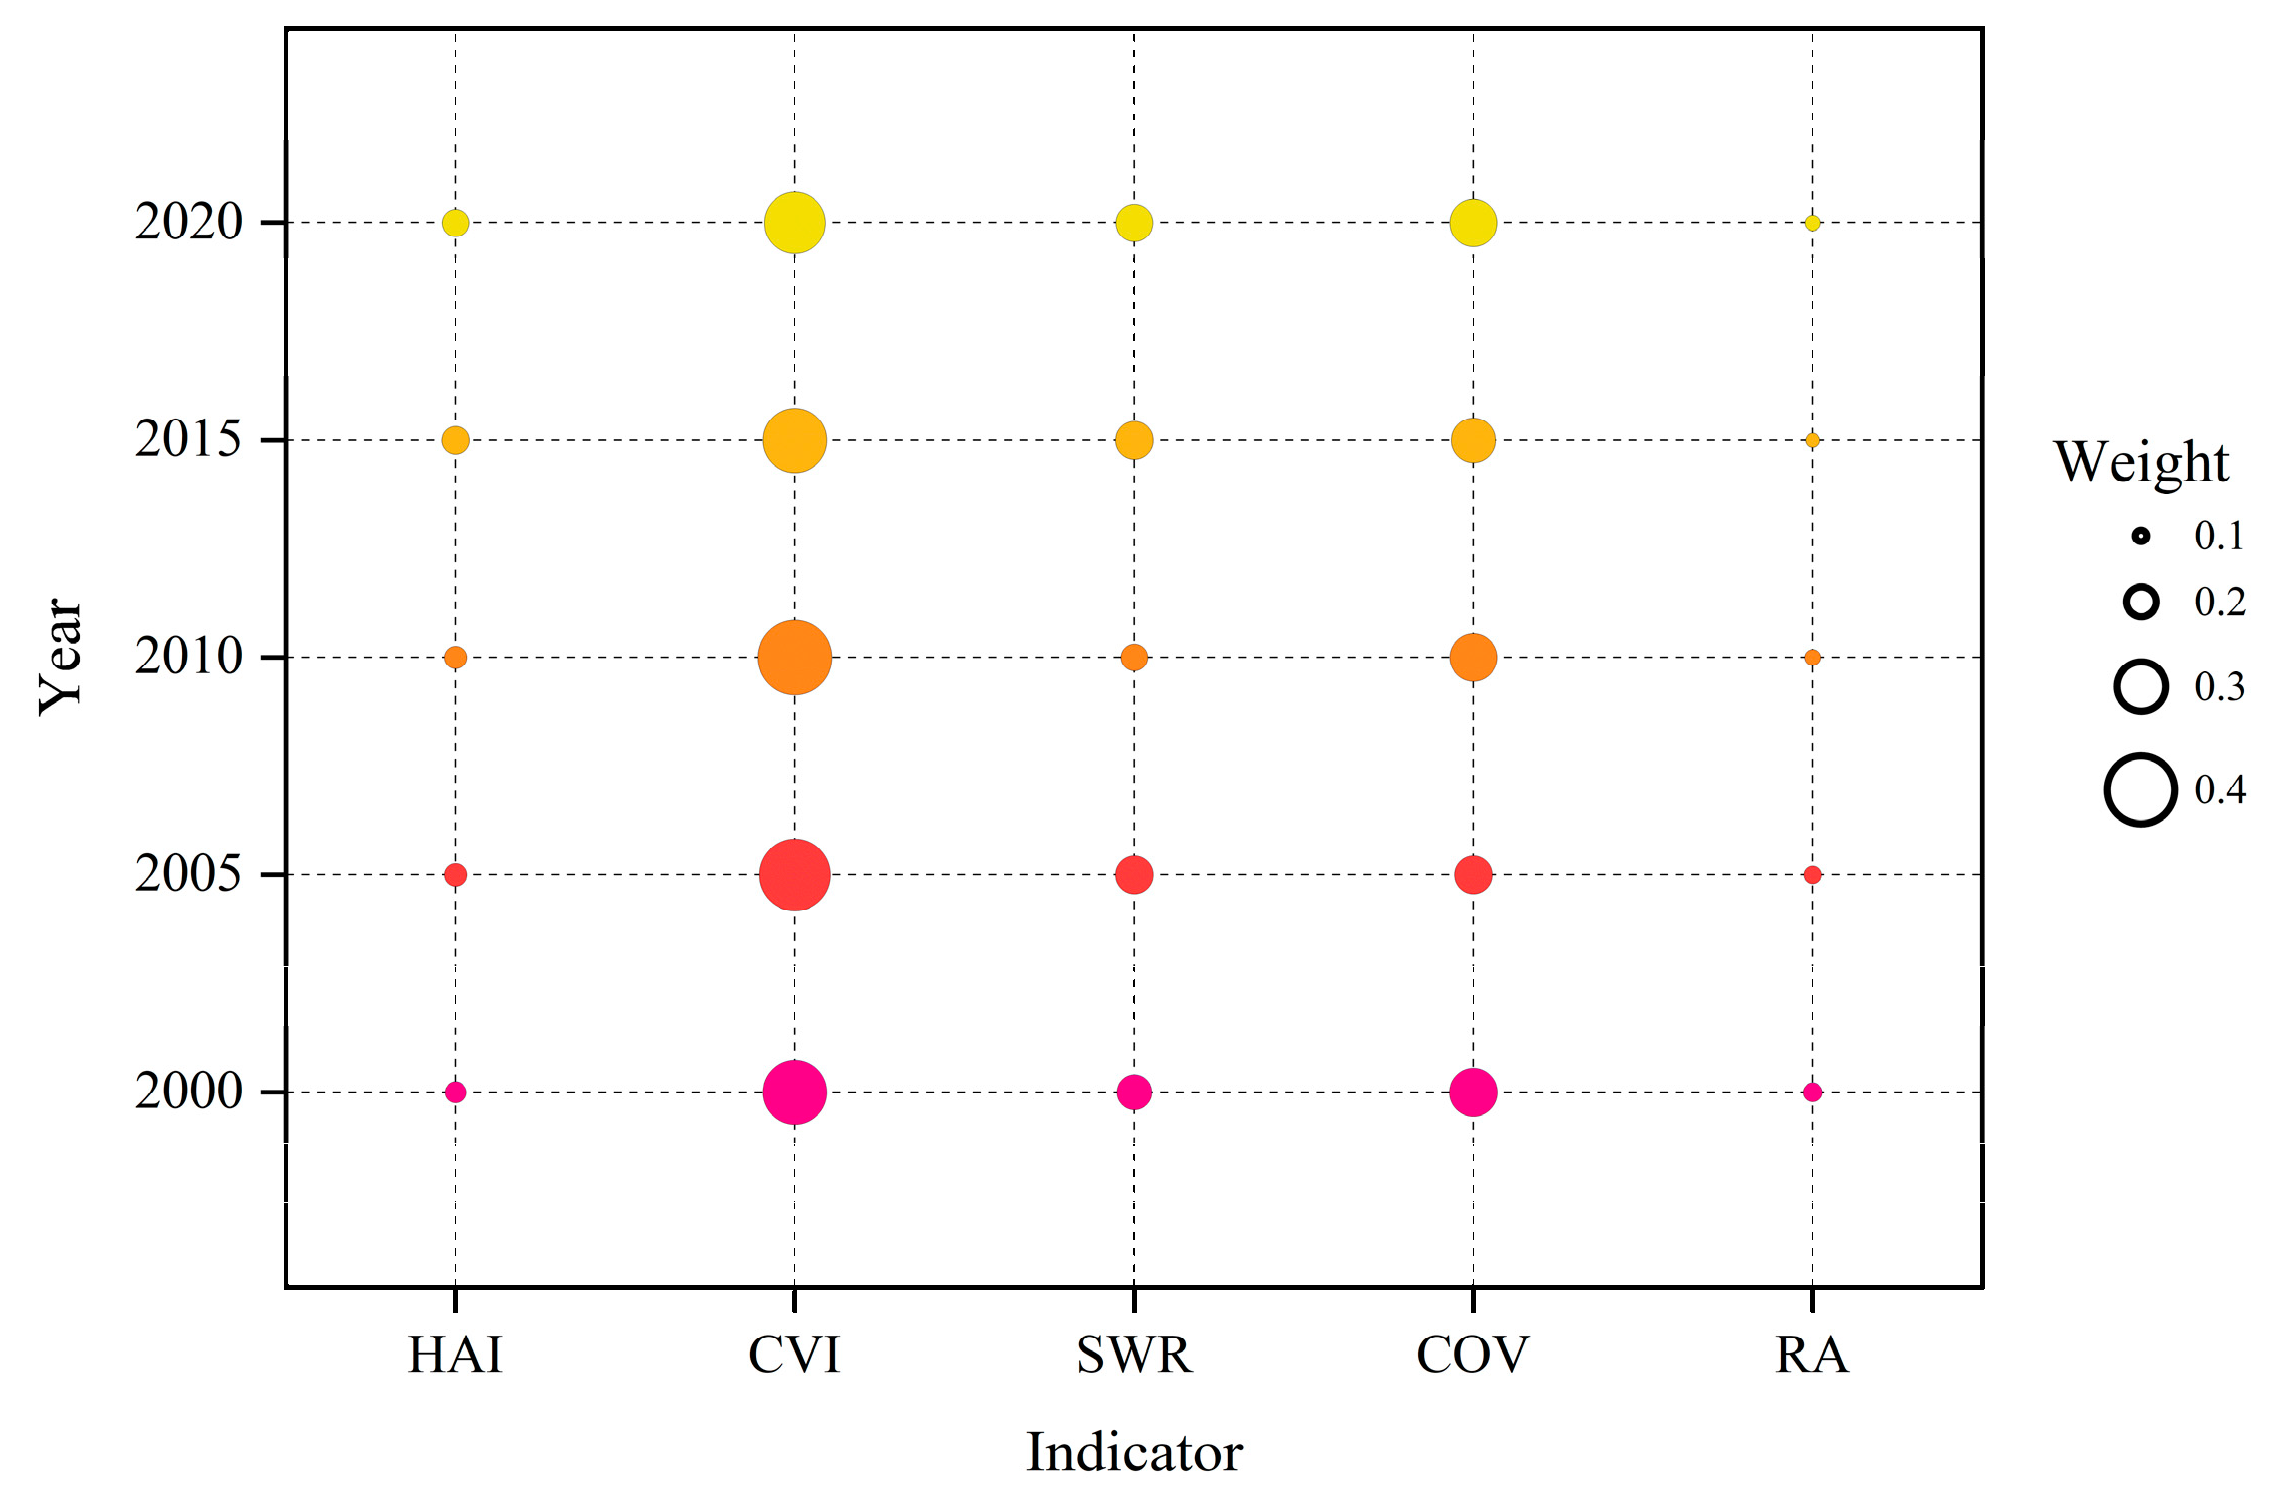
3.3. Entropy Weight Method
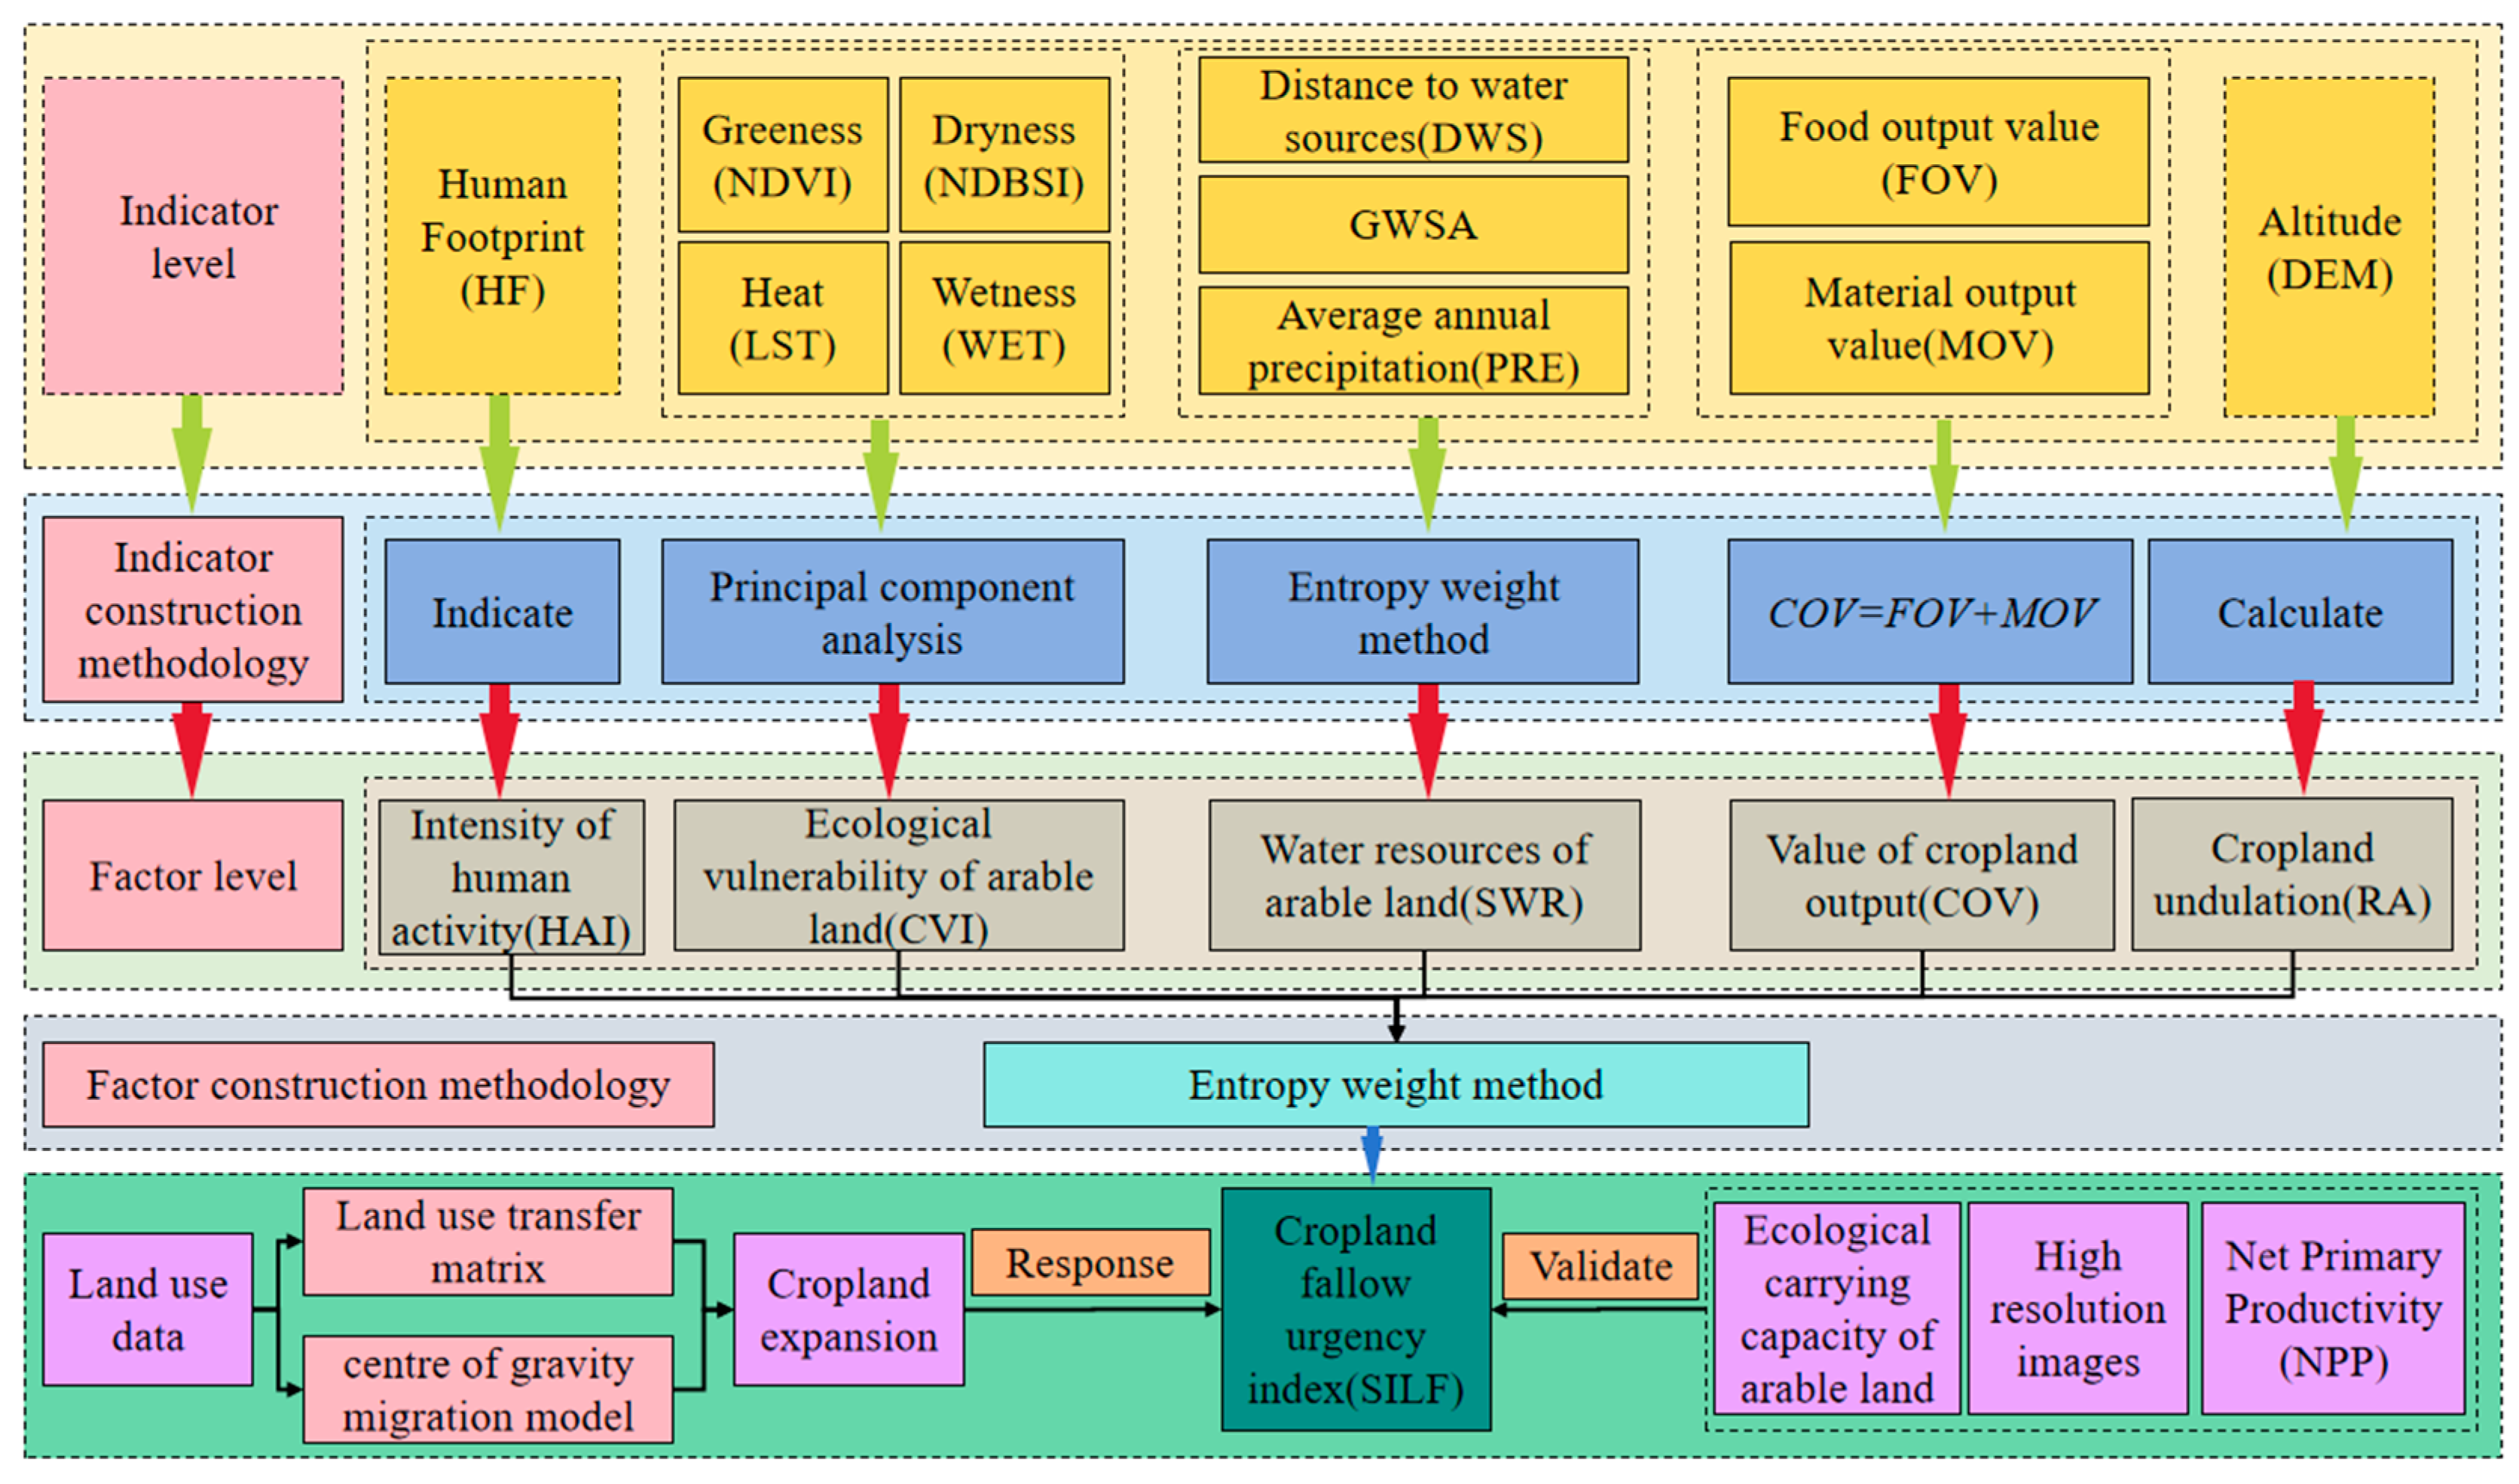
3.4. Indicator Construction of the Cultivated Land Fallow Urgency Index
3.4.1. Human Activity Intensity
3.4.2. Ecological Vulnerability
3.4.3. Water Resource Status
3.4.4. Value of Outputs
3.4.5. Topographic Conditions
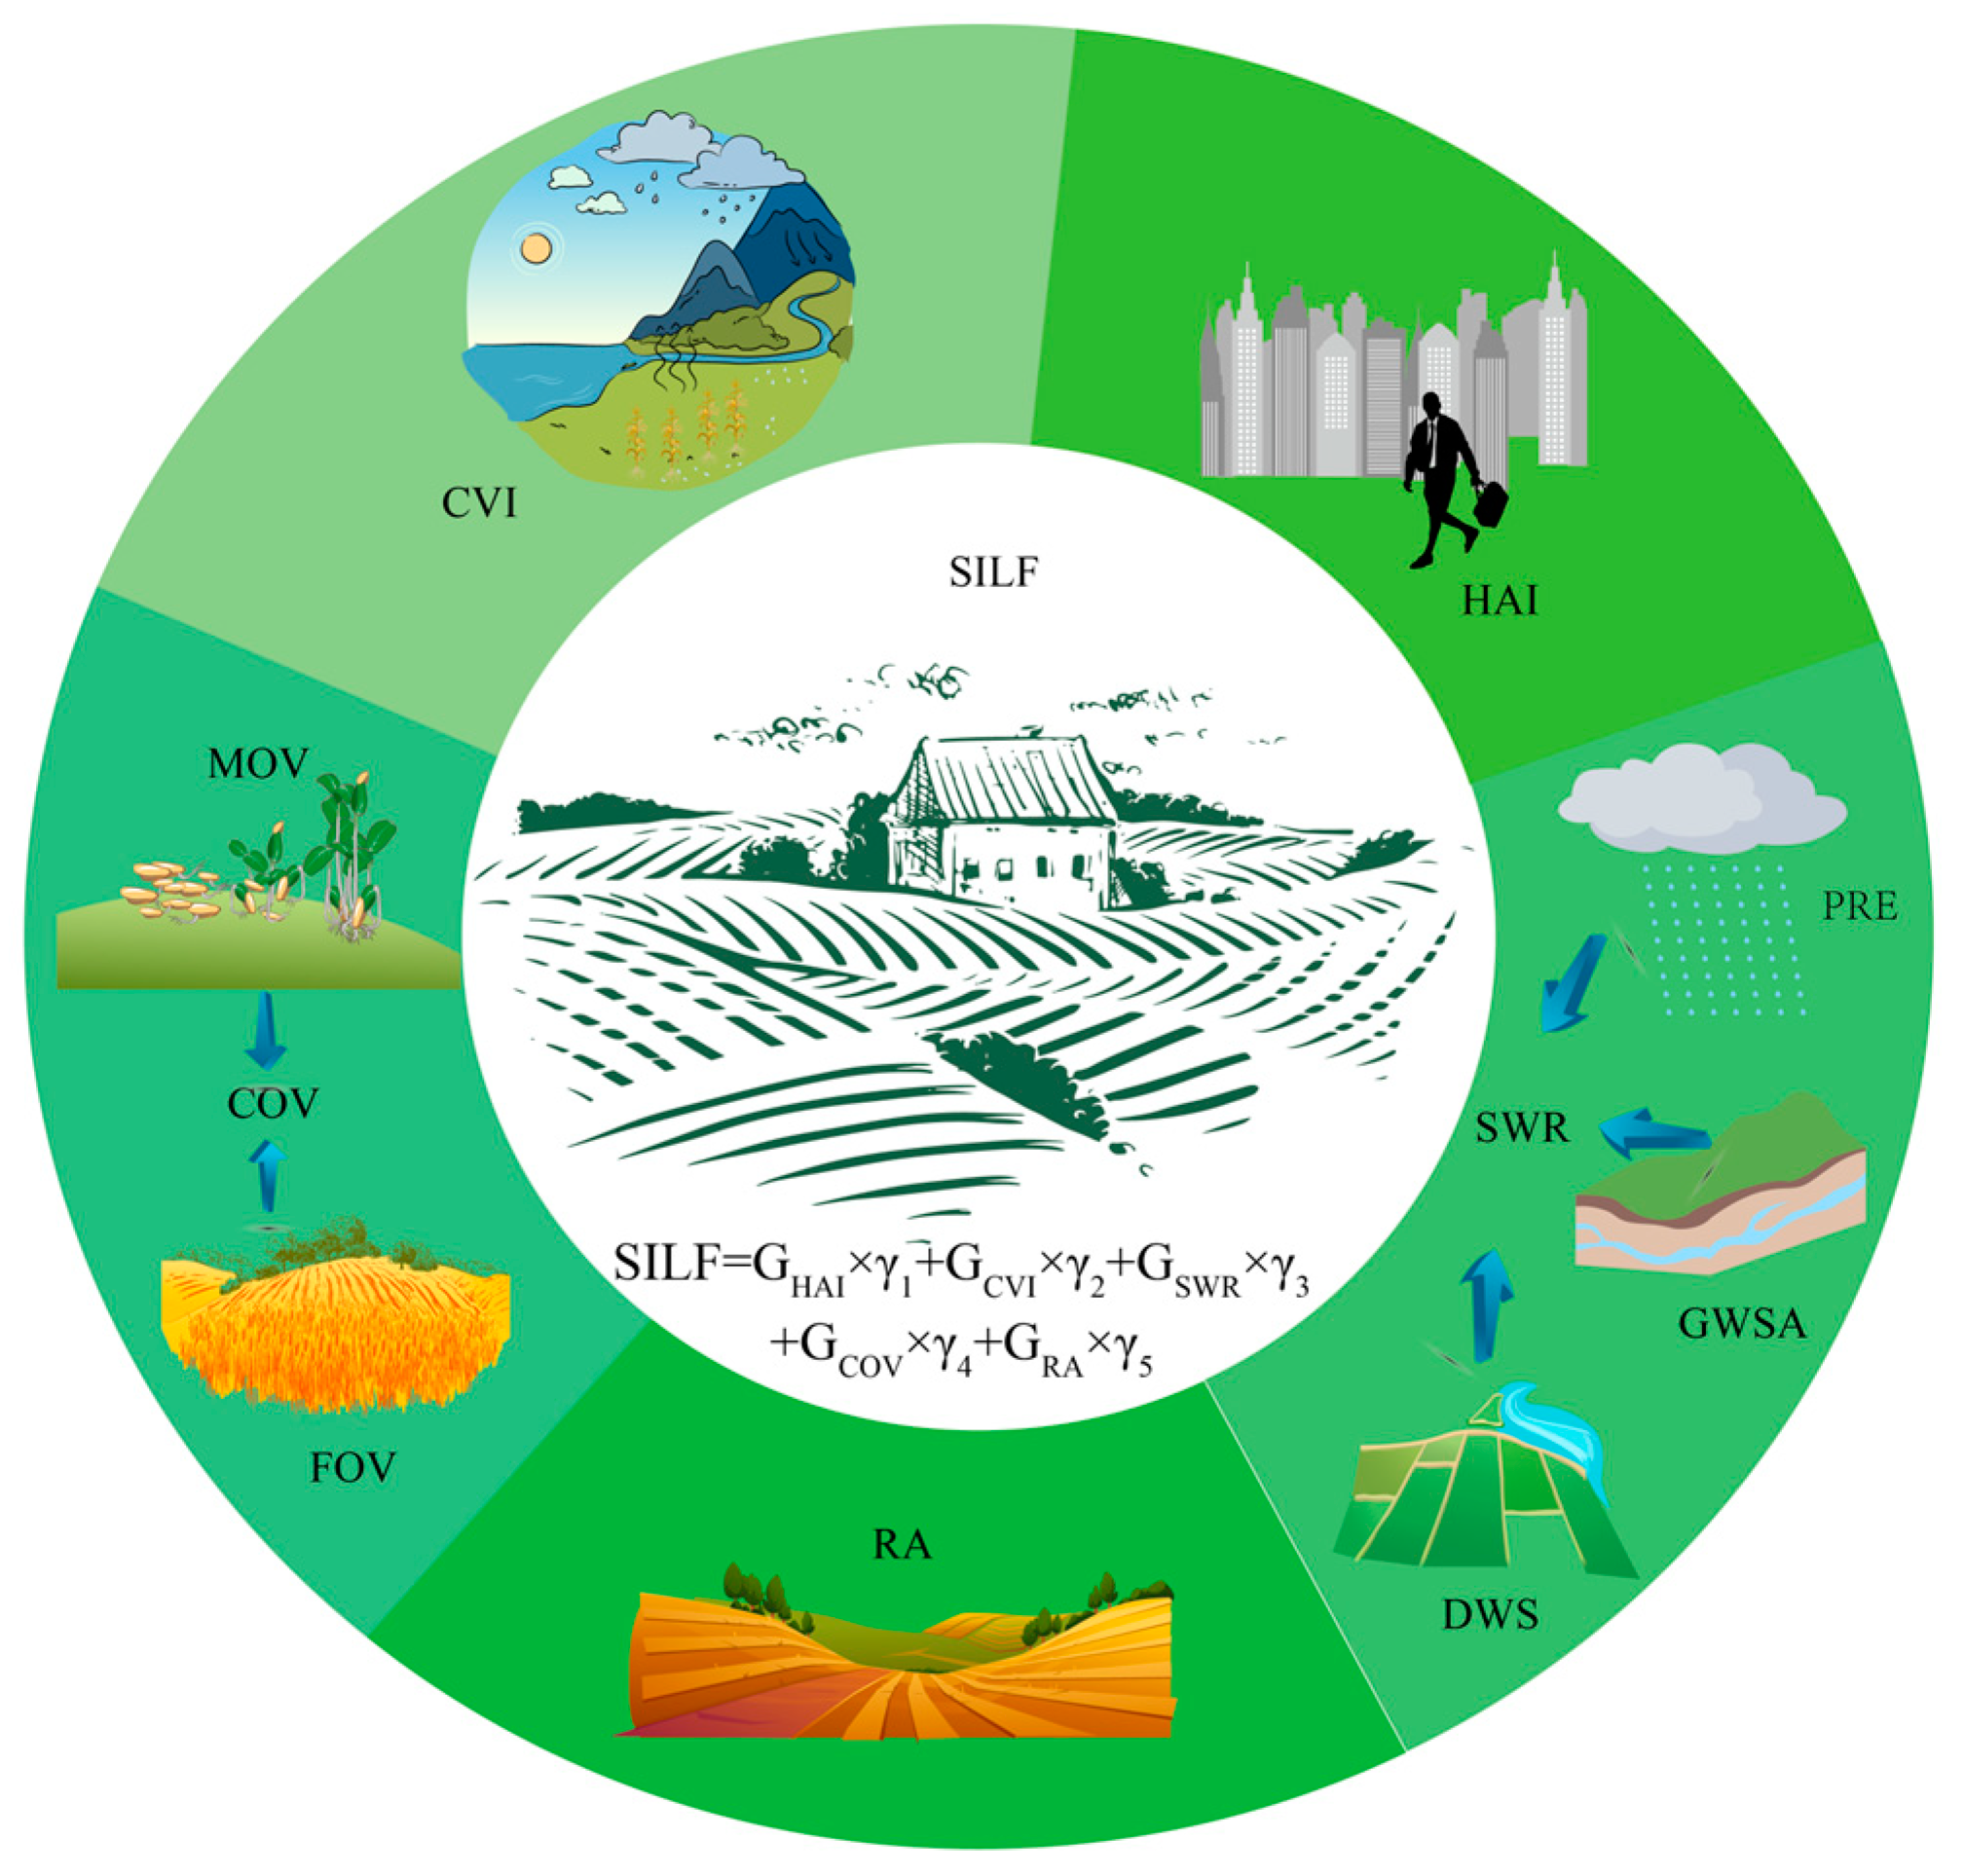
3.4.6. Construction of the Suitability Index for Land Fallow Urgency
3.5. Ecological Carrying Capacity Model for Cultivated Land
4. Results
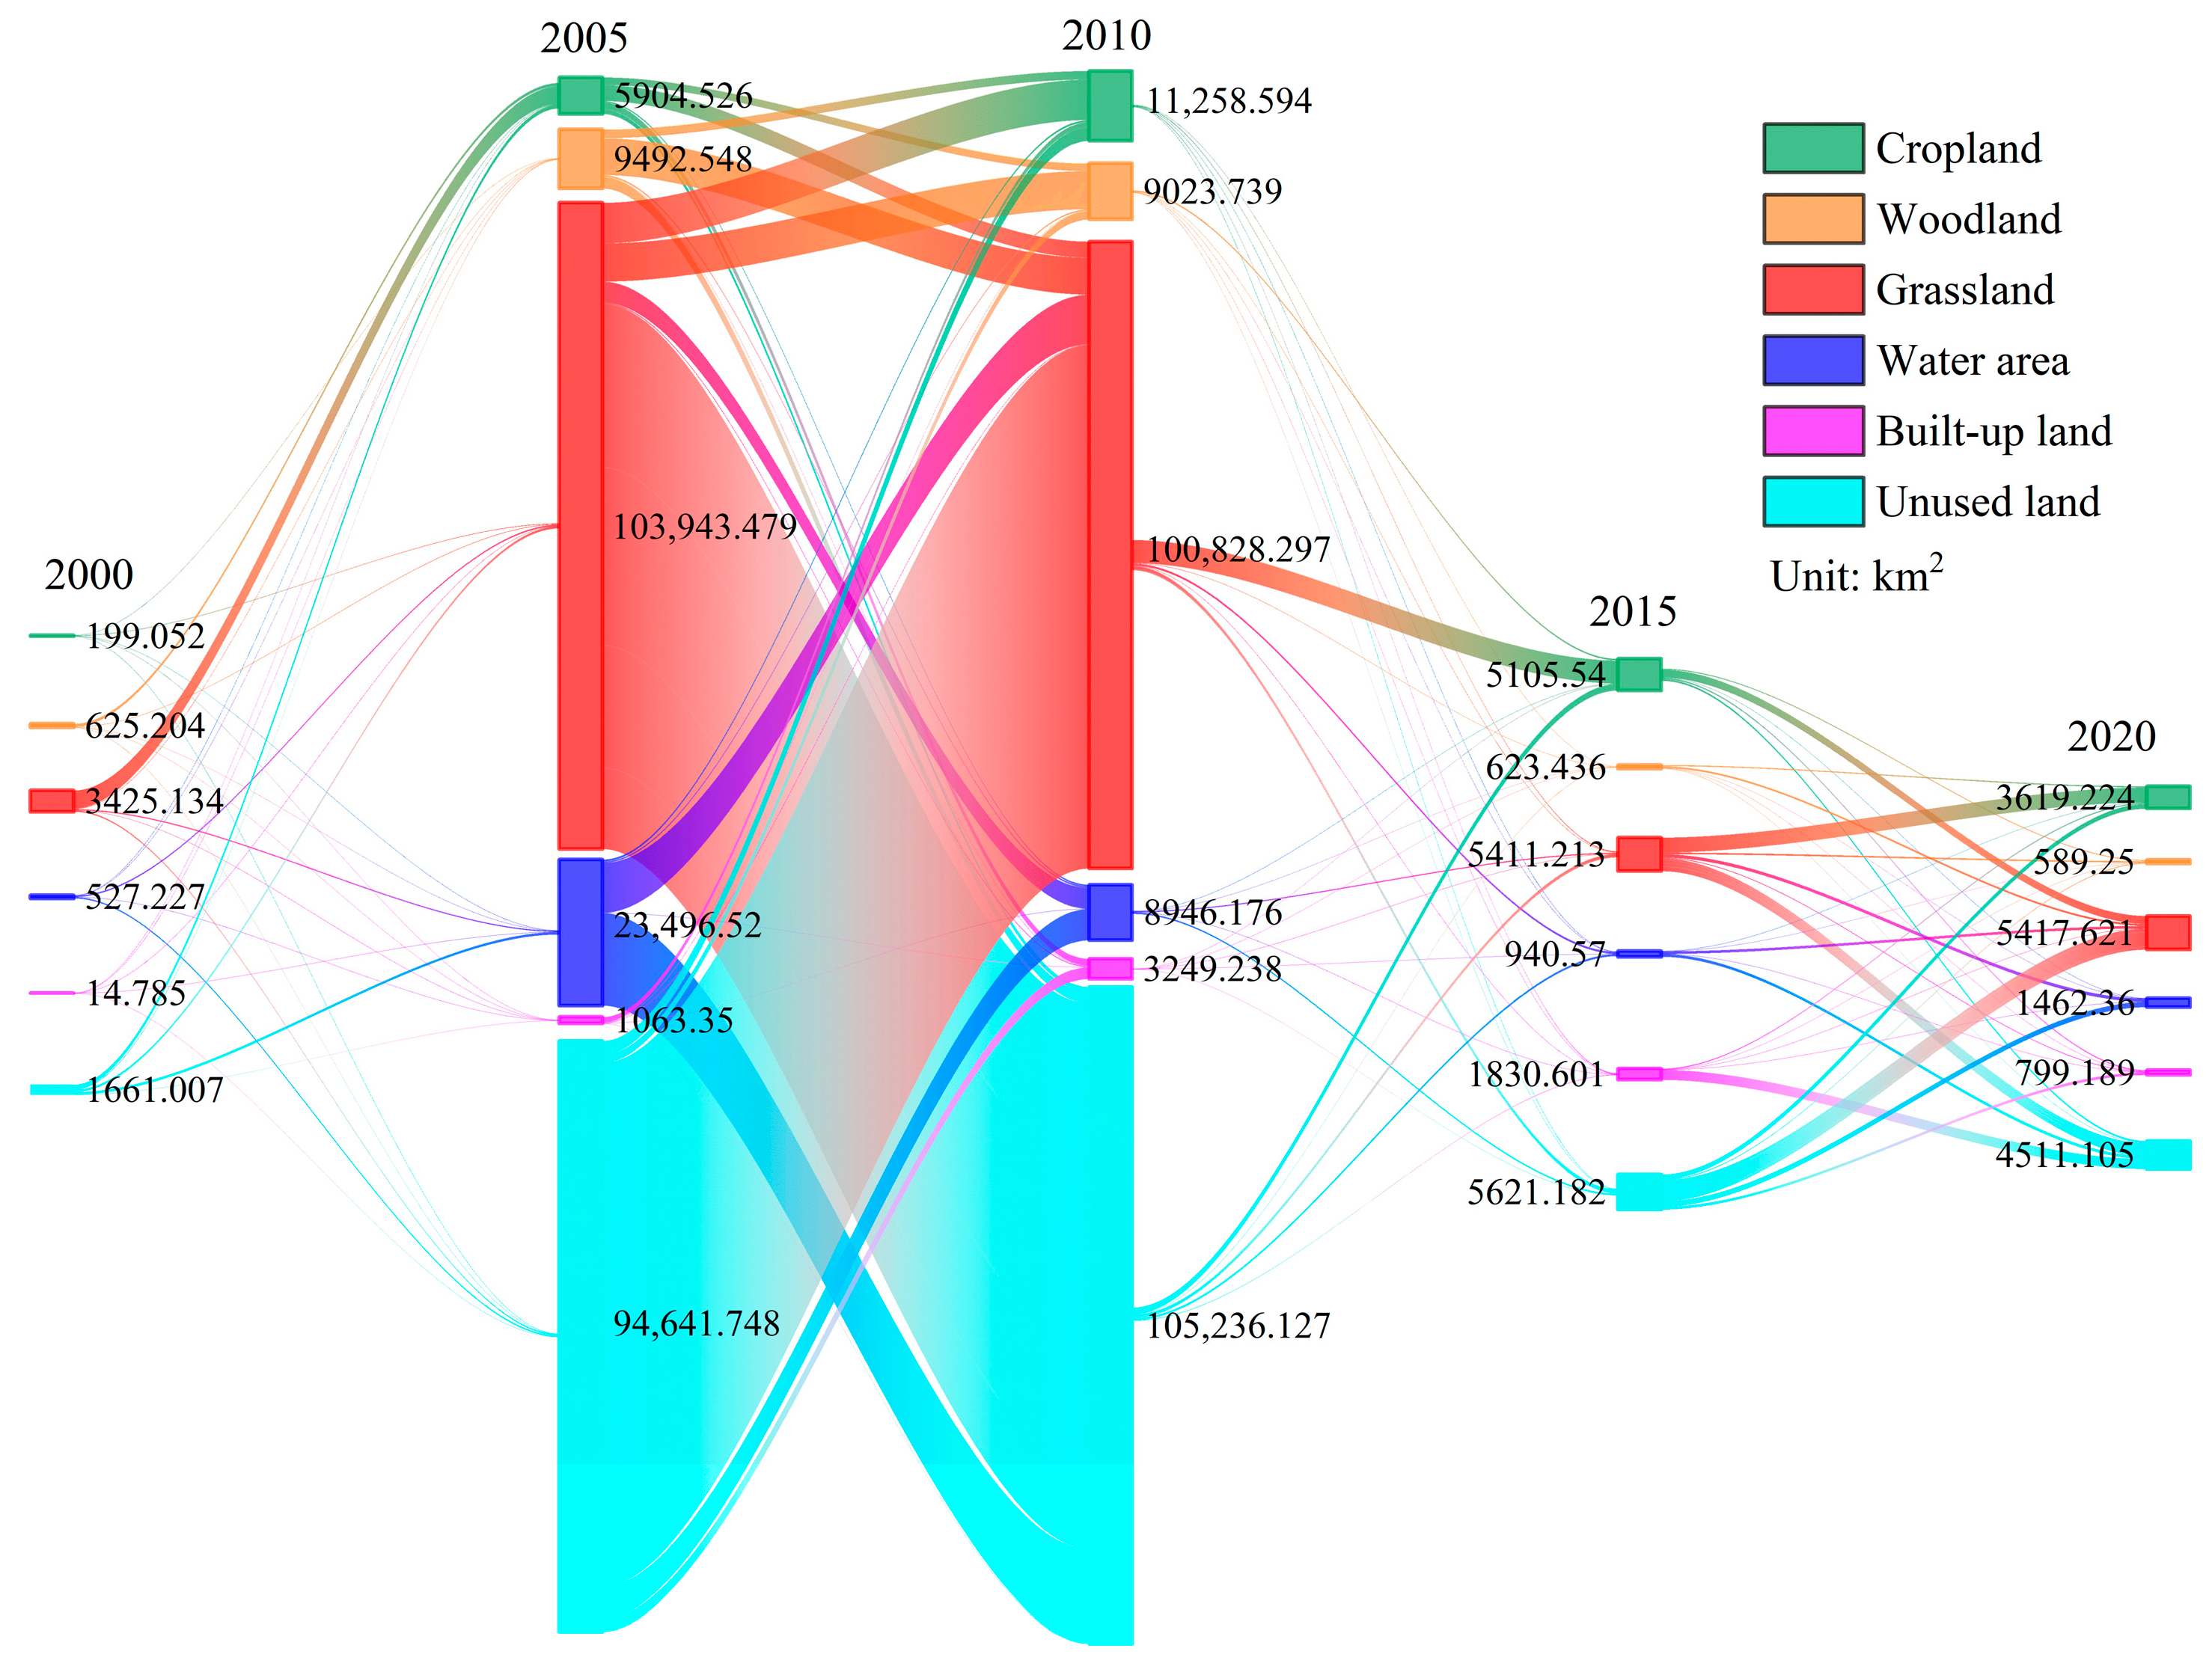
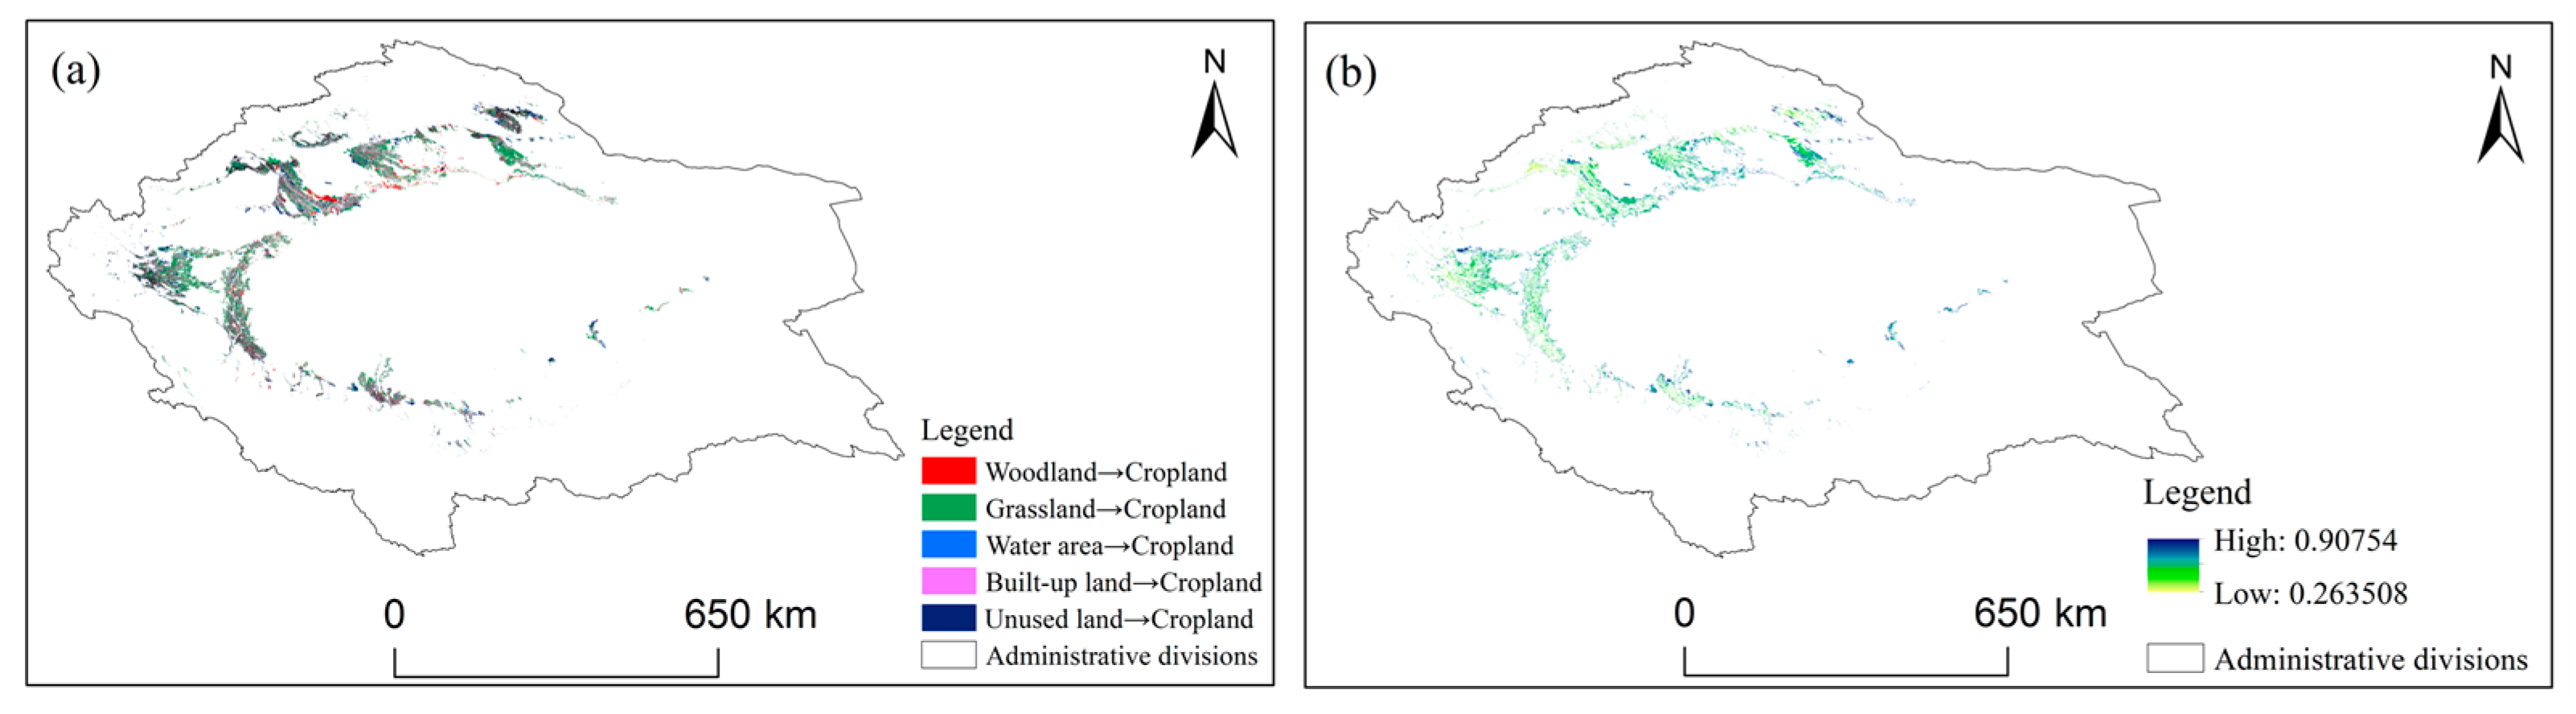
4.1. Characteristics of Land Use Change
4.2. Spatiotemporal Variation Characteristics of Cultivated Land Fallow Urgency
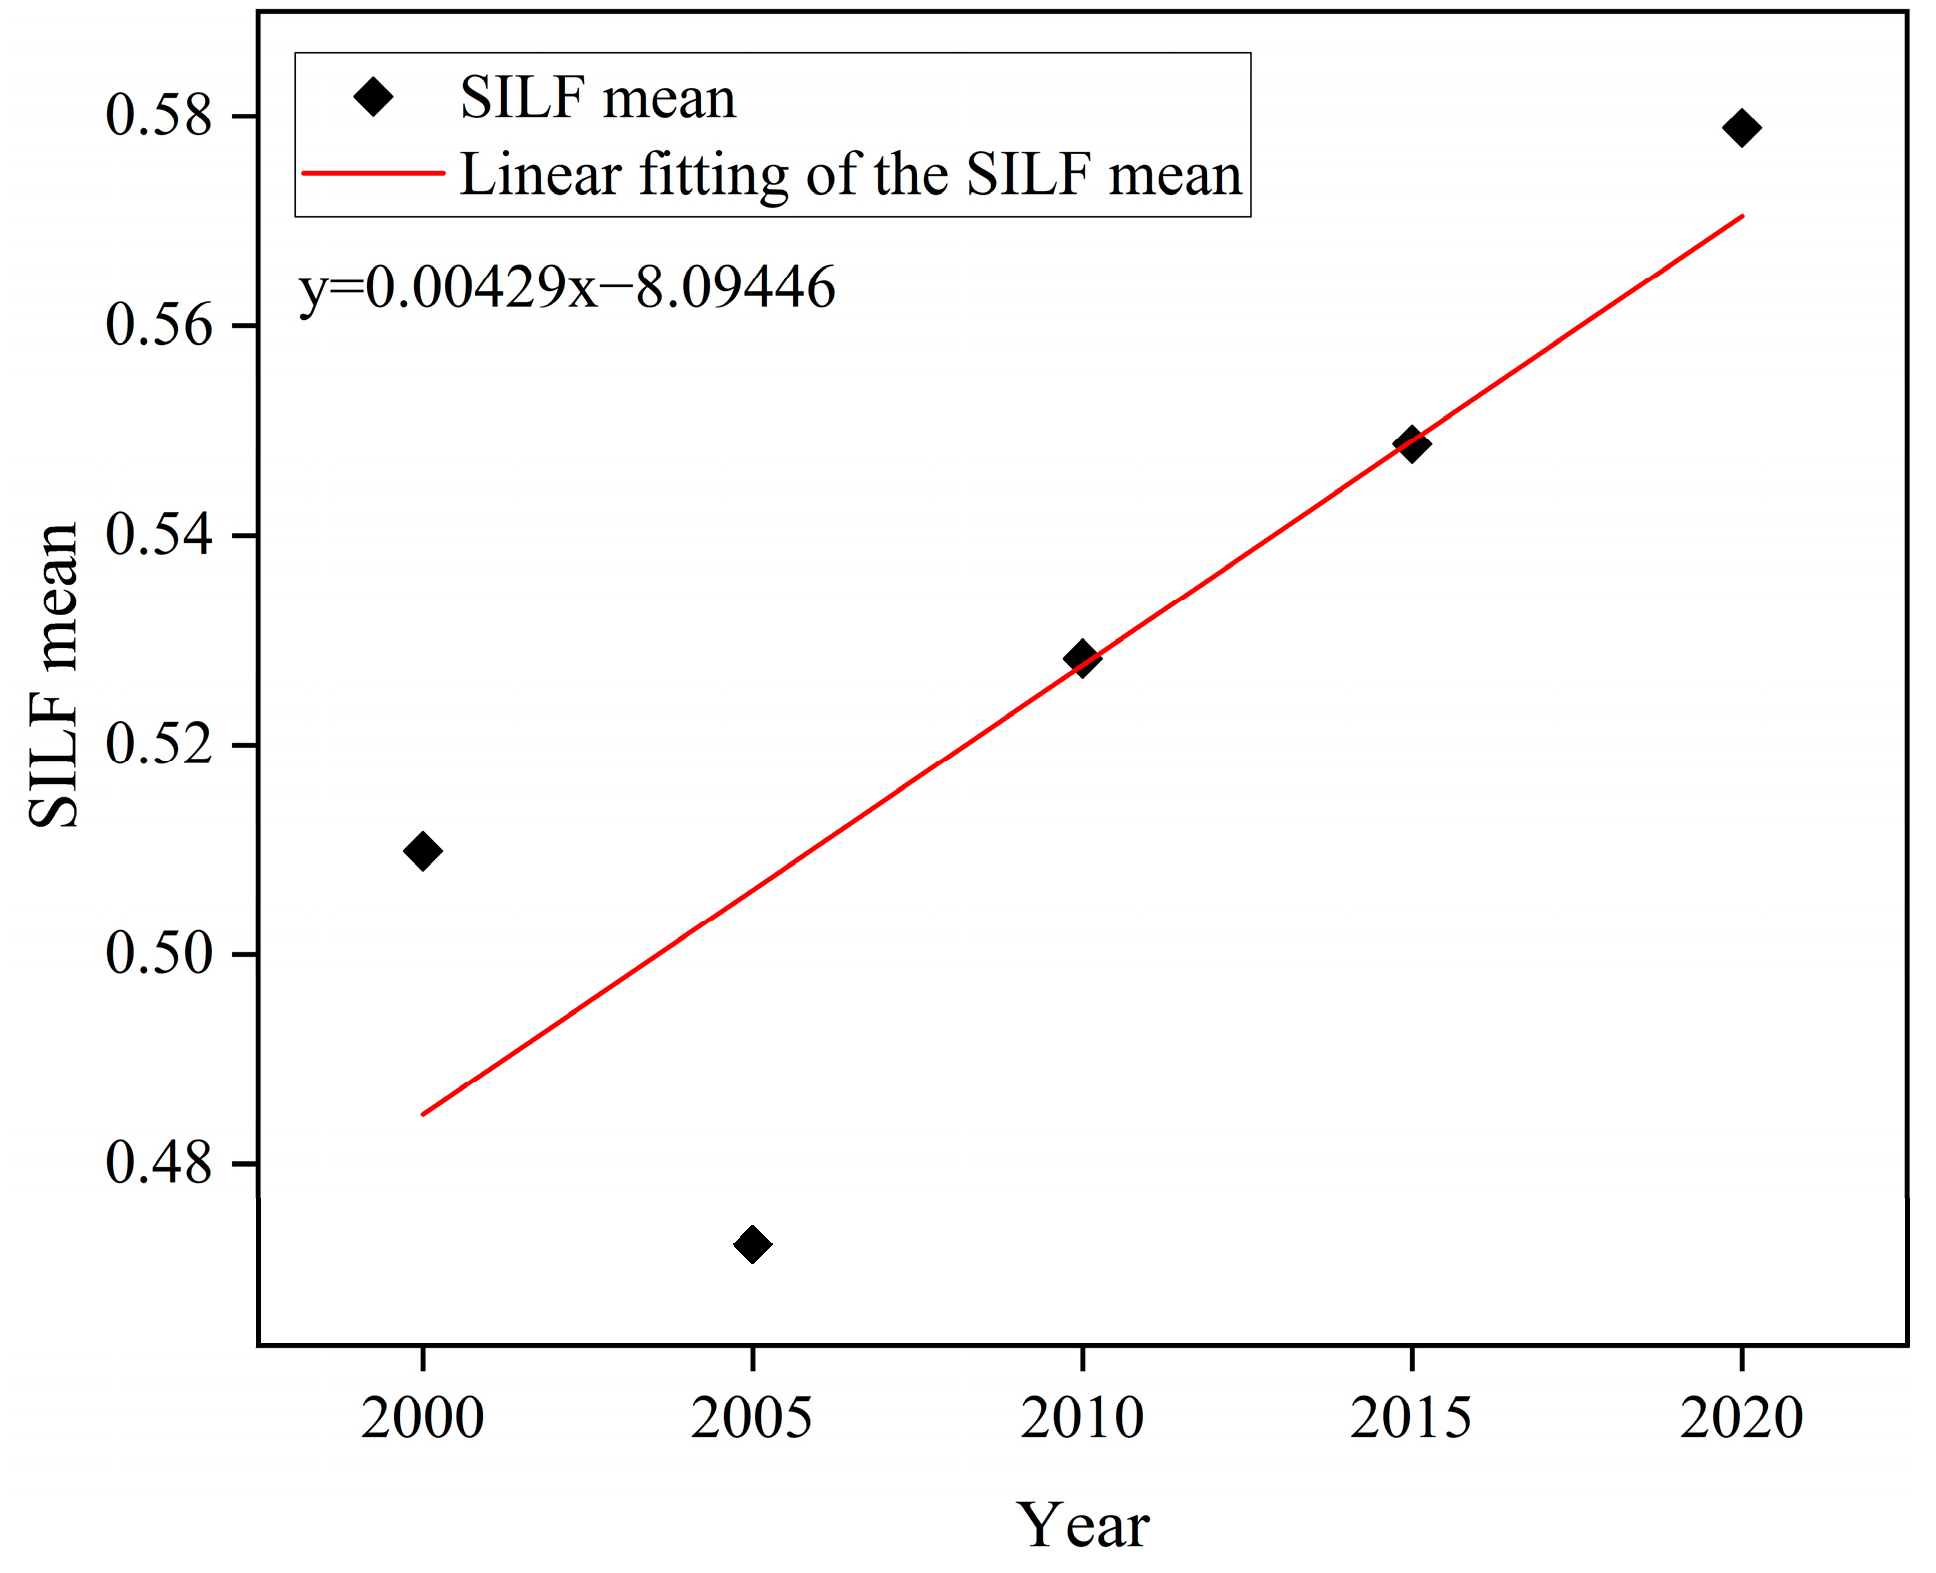
4.2.1. Construction of SILF
4.2.2. Spatiotemporal Variation Trends of Cultivated Land Fallow Urgency
5. Discussion
5.1. Evaluation of SILF
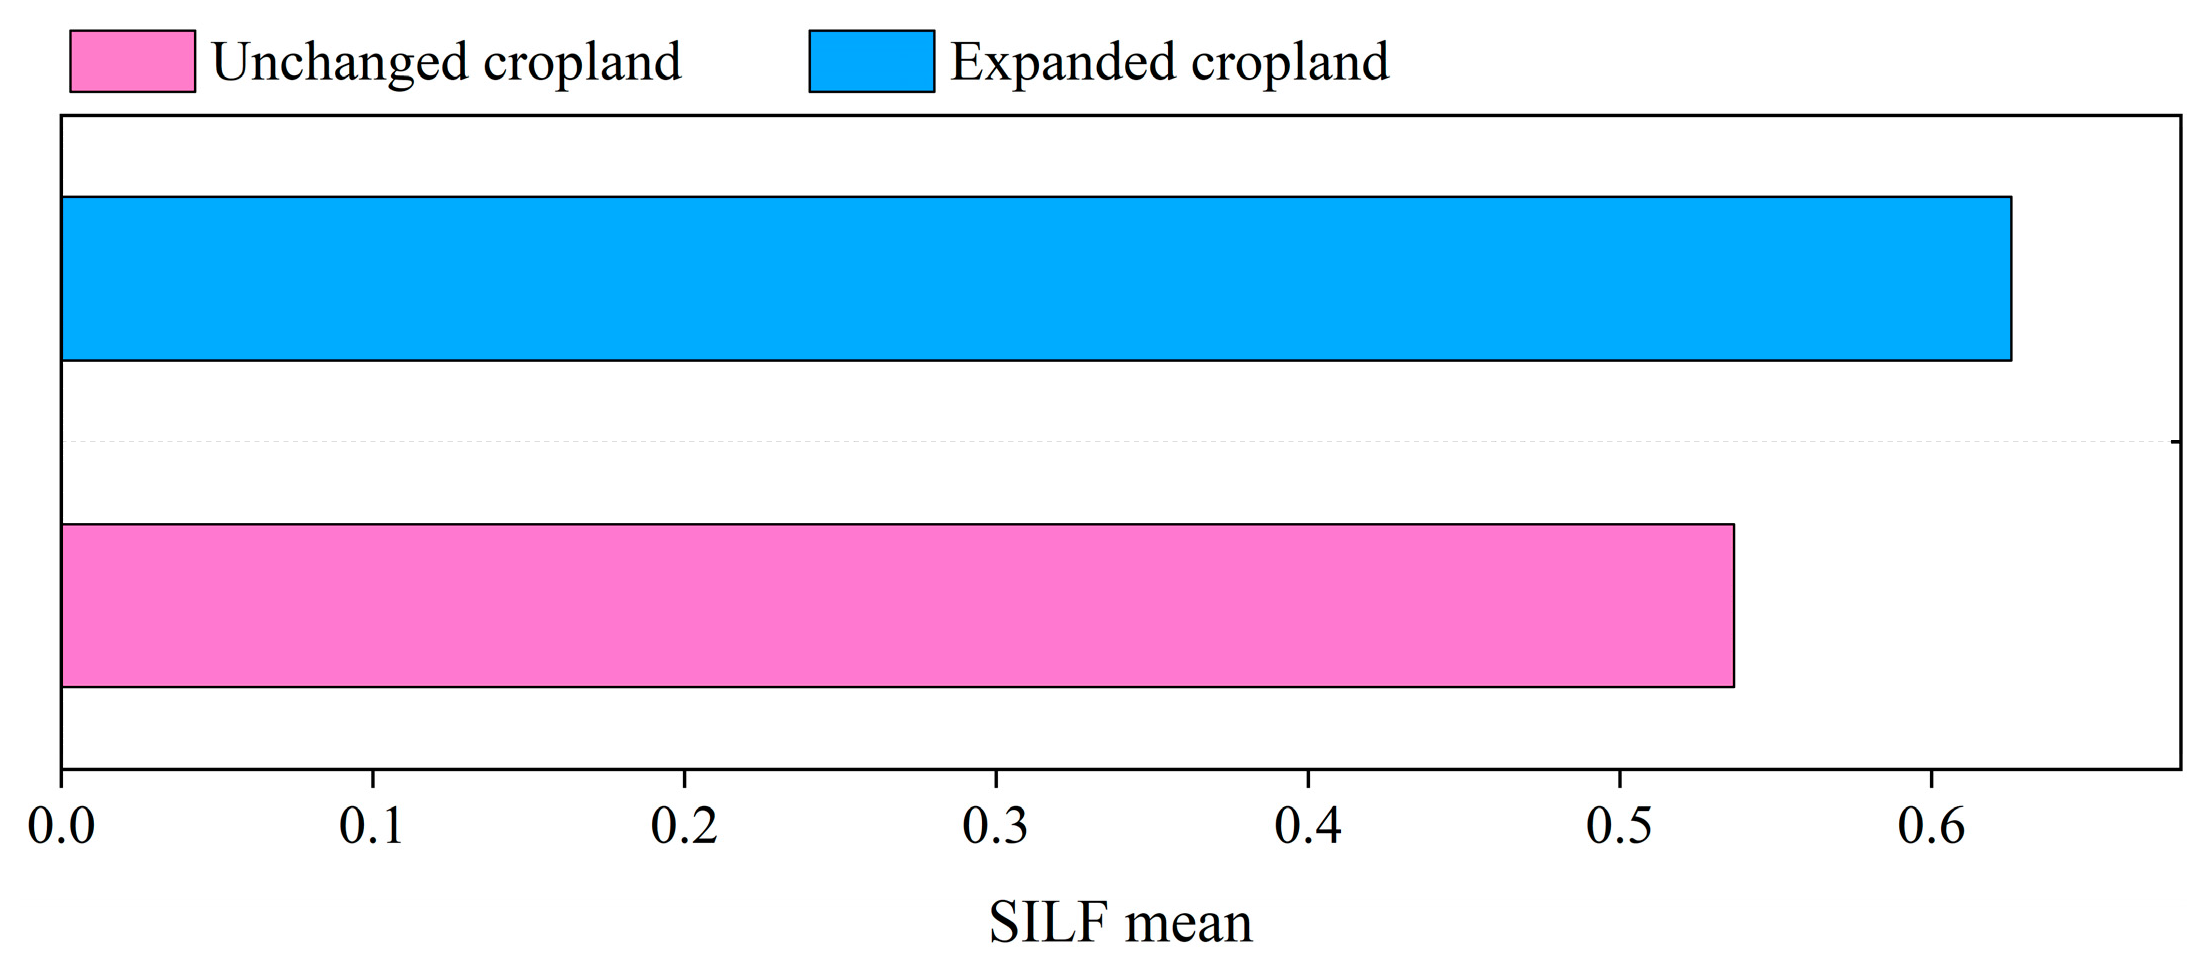
5.2. Response of Cropland Fallow Urgency to Cropland Expansion
5.3. Recommendations for Fallowing Cropland in Arid Zones
5.4. Limitations and Prospects
6. Conclusions
Author Contributions
Funding
Institutional Review Board Statement
Data Availability Statement
Conflicts of Interest
References
- Taylor, C.A.; Rising, J. Tipping point dynamics in global land use. Environ. Res. Lett. 2021, 16, 125012. [Google Scholar] [CrossRef]
- Davison, C.W.; Rahbek, C.; Morueta-Holme, N. Land-use change and biodiversity: Challenges for assembling evidence on the greatest threat to nature. Glob. Change Biol. 2021, 27, 5414–5429. [Google Scholar] [CrossRef]
- Tian, S.Q.; Wang, S.J.; Bai, X.Y.; Luo, G.J.; Li, Q.; Yang, Y.J.; Hu, Z.Y.; Li, C.J.; Deng, Y.H. Global patterns and changes of carbon emissions from land use during 1992–2015. Environ. Sci. Ecotechnol. 2021, 7, 100108. [Google Scholar] [CrossRef] [PubMed]
- Li, H.; Song, W. Spatial transformation of changes in global cultivated land. Sci. Total Environ. 2023, 859, 160194. [Google Scholar] [CrossRef]
- Vijay, V.; Armsworth, P.R. Pervasive cropland in protected areas highlight trade-offs between conservation and food security. Proc. Natl. Acad. Sci. USA 2021, 118, e2010121118. [Google Scholar] [CrossRef]
- Zhao, T.T.; Zhang, X.; Liu, W.D.; Wang, J.Q.; Li, Z.H.; Liu, L.Y. Increase in global per capita cropland imbalance across countries from 1985 to 2022: A threat to achieving Sustainable Development Goals. Geogr. Sustain. 2025, 6, 100239. [Google Scholar] [CrossRef]
- Schneider, J.M.; Delzeit, R.; Neumann, C.; Heimann, T.; Seppelt, R.; Schuenemann, F.; Söder, M.; Mauser, W.; Zabel, F. Effects of profit-driven cropland expansion and conservation policies. Nat. Sustain. 2024, 7, 1335–1347. [Google Scholar] [CrossRef]
- Potapov, P.; Turubanova, S.; Hansen, M.C.; Tyukavina, A.; Zalles, V.; Khan, A.; Song, X.P.; Pickens, A.; Shen, Q.; Cortez, J. Global maps of cropland extent and change show accelerated cropland expansion in the twenty-first century. Nat. Food 2022, 3, 19–28. [Google Scholar] [CrossRef]
- Zaveri, E.; Russ, J.; Damania, R. Rainfall anomalies are a significant driver of cropland expansion. Proc. Natl. Acad. Sci. USA 2020, 117, 10225–10233. [Google Scholar] [CrossRef]
- Durán, A.P.; Green, J.M.; West, C.D.; Visconti, P.; Burgess, N.D.; Virah-Sawmy, M.; Balmford, A. A practical approach to measuring the biodiversity impacts of land conversion. Methods Ecol. Evol. 2020, 11, 910–921. [Google Scholar] [CrossRef]
- Song, F.; Wang, S.; Bai, X.; Wu, L.; Wang, J.; Li, C.; Chen, H.; Luo, X.; Xi, H.; Zhang, S. A new indicator for global food security assessment: Harvested area rather than cropland area. Chin. Geogr. Sci. 2022, 32, 204–217. [Google Scholar] [CrossRef]
- Li, Y.Y.; Tan, M.H.; Hao, H.G. The impact of global cropland changes on terrestrial ecosystem services value, 1992–2015. J. Geogr. Sci. 2019, 29, 323–333. [Google Scholar] [CrossRef]
- Li, C.; Kandel, M.; Anghileri, D.; Oloo, F.; Kambombe, O.; Chibarabada, T.P.; Ngongondo, C.; Sheffield, J.; Dash, J. Recent changes in cropland area and productivity indicate unsustainable cropland expansion in Malawi. Environ. Res. Lett. 2021, 16, 084052. [Google Scholar] [CrossRef]
- Liu, Z.; Liu, Y.; Wang, J. A global analysis of agricultural productivity and water resource consumption changes over cropland expansion regions. Agric. Ecosyst. Environ. 2021, 321, 107630. [Google Scholar] [CrossRef]
- Tang, L.; Ke, X.; Chen, Y.; Wang, L.; Zhou, Q.; Zheng, W.; Xiao, B. Which impacts more seriously on natural habitat loss and degradation? Cropland expansion or urban expansion? Land Degrad. Dev. 2021, 32, 946–964. [Google Scholar] [CrossRef]
- Leng, X.; Feng, X.; Fu, B. Driving forces of agricultural expansion and land degradation indicated by Vegetation Continuous Fields (VCF) data in drylands from 2000 to 2015. Glob. Ecol. Conserv. 2020, 23, e01087. [Google Scholar] [CrossRef]
- Li, S.; Li, X.; Sun, L.; Cao, G.; Fischer, G.; Tramberend, S. An estimation of the extent of cropland abandonment in mountainous regions of China. Land Degrad. Dev. 2018, 29, 1327–1342. [Google Scholar] [CrossRef]
- Prăvălie, R.; Patriche, C.; Borrelli, P.; Panagos, P.; Roșca, B.; Dumitraşcu, M.; Nita, I.-A.; Săvulescu, I.; Birsan, M.-V.; Bandoc, G. Arable lands under the pressure of multiple land degradation processes. A global perspective. Environ. Res. Lett. 2021, 194, 110697. [Google Scholar] [CrossRef]
- Du, L.; Dong, C.; Kang, X.; Qian, X.; Gu, L. Spatiotemporal evolution of land cover changes and landscape ecological risk assessment in the Yellow River Basin, 2015–2020. J. Environ. Manag. 2023, 332, 117149. [Google Scholar] [CrossRef]
- Zabel, F.; Delzeit, R.; Schneider, J.M.; Seppelt, R.; Mauser, W.; Václavík, T. Global impacts of future cropland expansion and intensification on agricultural markets and biodiversity. Nat. Commun. 2019, 10, 2844. [Google Scholar] [CrossRef]
- Wang, S.; Jin, X.; Han, B.; Liu, J.; Song, J.; Zhou, Y. Understanding the process and mechanism of agricultural land transition in China: Based on the interactive conversion of cropland and natural ecological land. J. Environ. Manag. 2025, 376, 124585. [Google Scholar] [CrossRef] [PubMed]
- Wu, W.; Yu, Q.; You, L.; Chen, K.; Tang, H.; Liu, J. Global cropping intensity gaps: Increasing food production without cropland expansion. Land Use Policy 2018, 76, 515–525. [Google Scholar] [CrossRef]
- Rehman, A.; Farooq, M.; Lee, D.-J.; Siddique, K.H. Sustainable agricultural practices for food security and ecosystem services. Environ. Sci. Pollut. Res. 2022, 29, 84076–84095. [Google Scholar] [CrossRef] [PubMed]
- Aramburu-Merlos, F.; Tenorio, F.A.; Mashingaidze, N.; Sananka, A.; Aston, S.; Ojeda, J.J.; Grassini, P. Adopting yield-improving practices to meet maize demand in Sub-Saharan Africa without cropland expansion. Nat. Commun. 2024, 15, 4492. [Google Scholar] [CrossRef] [PubMed]
- Chen, H.; Chen, S.; Yang, R.; Shan, L.; Hao, J.; Ye, Y. Optimizing the Cropland Fallow for Water Resource Security in the Groundwater Funnel Area of China. Land 2023, 12, 462. [Google Scholar] [CrossRef]
- Mendoza-Vega, J.; Messing, I. The influence of land use and fallow period on the properties of two calcareous soils in the humid tropics of southern Mexico. Catena 2005, 60, 279–292. [Google Scholar] [CrossRef]
- Borges, A.; Kato, O.R.; Pinheiro, H.A.; Shimizu, M.K.; Rangel-Vasconcelos, L.G.T.; de Oliveira, M.C.M. Growth and phytomass production of maize varieties in different fallow management. Pesqui. Agropecu. Bras. 2011, 46, 143–151. [Google Scholar] [CrossRef]
- Burdukovskii, V.L.; Perepelkina, P.A.; Kiseleva, I.V. Dynamics of vegetation and soil properties of fallow ecosystems. Theor. Appl. Ecol. 2020, 3, 78–83. [Google Scholar] [CrossRef]
- Adil, M.; Zhang, S.H.; Wang, J.; Shah, A.N.; Tanveer, M.; Fiaz, S. Effects of Fallow Management Practices on Soil Water, Crop Yield and Water Use Efficiency in Winter Wheat Monoculture System: A Meta-Analysis. Front. Plant Sci. 2022, 13, 825309. [Google Scholar] [CrossRef]
- Ghosh, S.M.; Saraf, S.; Behera, M.D.; Biradar, C. Estimating Agricultural Crop Types and Fallow Lands Using Multi Temporal Sentinel-2A Imageries. Proc. Natl. Acad. Sci. India Sect. A-Phys. Sci. 2017, 87, 769–779. [Google Scholar] [CrossRef]
- Szott, L.T.; Palm, C.A. Nutrient stocks in managed and natural humid tropical fallows. Plant Soil 1996, 186, 293–309. [Google Scholar] [CrossRef]
- Tang, L.P.; Shen, G.; Cheng, M.; Zuo, C.C.; Li, F.Y.; Liu, H.; Wu, S.H. Spillover Impacts of the Utilization of Winter Fallow Fields on Grain Production and Carbon Emissions. Land 2024, 13, 1300. [Google Scholar] [CrossRef]
- Chen, K.H.; Wen, S.H.; Zhang, W.; Feng, J.; Liu, Y.R. Increased simulated precipitation frequency promotes greenhouse gas fluxes from the soils of seasonal fallow croplands. J. Sustain. Agric. Environ. 2023, 2, 112–121. [Google Scholar] [CrossRef]
- Wuyun, D.J.; Sun, L.; Sun, Z.; Chen, Z.X.; Hou, A.H.; Crusiol, L.G.T.; Reymondin, L.; Chen, R.Q.; Zhao, H.W. Mapping fallow fields using Sentinel-1 and Sentinel-2 archives over farming-pastoral ecotone of Northern China with Google Earth Engine. Giscience Remote Sens. 2022, 59, 333–353. [Google Scholar] [CrossRef]
- Li, X.; Wang, H.S. Study of Ecological Compensation and Practice of Farmland Fallow Rotation. J. Environ. Prot. Ecol. 2019, 20, S391–S396. [Google Scholar]
- Xie, H.L.; Wu, Q. Farmers’ willingness to leave land fallow from the perspective of heterogeneity: A case-study in ecologically vulnerable areas of Guizhou, China. Land Degrad. Dev. 2020, 31, 1749–1760. [Google Scholar] [CrossRef]
- Zeng, S.Y.; Chen, F.; Ma, J.; Liu, G.J.; Wanger, T.C. Multiscenario simulation of fallow schemes in China and their impact on food security. Land Degrad. Dev. 2024, 35, 4972–4984. [Google Scholar] [CrossRef]
- Spor Leal, L.B.; Roy, T.; Uden, D.R.; Schoengold, K. Hydrological impacts of the conservation reserve program—A mini review. Front. Water 2024, 6, 1506255. [Google Scholar] [CrossRef]
- Marton, J.M.; Fennessy, M.S.; Craft, C. USDA conservation practices increase carbon storage and water quality improvement functions: An example from Ohio. Restor. Ecol. 2014, 22, 117–124. [Google Scholar] [CrossRef]
- Dobbs, T.L.; Pretty, J. Case study of agri-environmental payments: The United Kingdom. Ecol. Econ. 2008, 65, 765–775. [Google Scholar] [CrossRef]
- Sanz-Pérez, A.; Sardà-Palomera, F.; Bota, G.; Sollmann, R.; Pou, N.; Giralt, D. The potential of fallow management to promote steppe bird conservation within the next EU Common Agricultural Policy reform. J. Appl. Ecol. 2021, 58, 1545–1556. [Google Scholar] [CrossRef]
- Sasaki, H. Relationships between agricultural policies and environmental effects in Japan: An environmental-economic integrated model approach. Food Econ. 2012, 9, 36–52. [Google Scholar] [CrossRef]
- Lu, H.; Xie, H.; Lv, T.; Yao, G. Determinants of cultivated land recuperation in ecologically damaged areas in China. Land Use Policy 2019, 81, 160–166. [Google Scholar] [CrossRef]
- Gaiser, T.; Judex, M.; Igué, A.M.; Paeth, H.; Hiepe, C. Future productivity of fallow systems in Sub-Saharan Africa: Is the effect of demographic pressure and fallow reduction more significant than climate change? Agric. For. Meteorol. 2011, 151, 1120–1130. [Google Scholar] [CrossRef]
- Zhao, Y.-T.; Peng, J.-W.; Huang, X.-J.; Zhong, T.-Y. Research on scale and spatial distribution of regional virtual land retirement. In Proceedings of the 2011 International Conference on Business Management and Electronic Information, Guangzhou, China, 13–15 May 2011; pp. 648–651. [Google Scholar]
- Oliphant, A.J.; Thenkabail, P.S.; Teluguntla, P.G.; Aneece, I.P.; Foley, D.J.; McCormick, R.L. Automated Cropland Fallow Algorithm (ACFA) for the Northern Great Plains of USA. Int. J. Digit. Earth 2024, 17, 2337221. [Google Scholar] [CrossRef]
- Tong, X.; Brandt, M.; Hiernaux, P.; Herrmann, S.; Rasmussen, L.V.; Rasmussen, K.; Tian, F.; Tagesson, T.; Zhang, W.; Fensholt, R. The forgotten land use class: Mapping of fallow fields across the Sahel using Sentinel-2. Remote Sens. Environ. 2020, 239, 111598. [Google Scholar] [CrossRef]
- Song, W.; Prishchepov, A.V.; Song, W. Mapping the spatial and temporal patterns of fallow land in mountainous regions of China. Int. J. Digit. Earth 2022, 15, 2148–2167. [Google Scholar] [CrossRef]
- Xie, Z.; Zhao, Y.; Jiang, R.; Zhang, M.; Hammer, G.; Chapman, S.; Brider, J.; Potgieter, A.B. Seasonal dynamics of fallow and cropping lands in the broadacre cropping region of Australia. Remote Sens. Environ. 2024, 305, 114070. [Google Scholar] [CrossRef]
- Shi, K.; Yang, Q.; Li, Y.; Sun, X. Mapping and evaluating cultivated land fallow in Southwest China using multisource data. Sci. Total Environ. 2019, 654, 987–999. [Google Scholar] [CrossRef]
- Li, Y.; Shi, K.; Wang, Y.; Yang, Q. Quantifying and Evaluating the Cultivated Areas Suitable for Fallow in Chongqing of China Using Multisource Data. Land 2021, 10, 74. [Google Scholar] [CrossRef]
- Bai, J.; Li, J.; Bao, A.; Chang, C. Spatial-temporal variations of ecological vulnerability in the Tarim River Basin, Northwest China. J. Arid. Land 2021, 13, 814–834. [Google Scholar] [CrossRef]
- Yi, X.; Zhang, Y.; He, J.; Wang, Y.; Dai, Q.; Hu, Z.; Zhou, H.; Lu, Y. Characteristics and influencing factors of farmland abandonment in the karst rocky desertification area of Southwest China. Ecol. Indic. 2024, 160, 111802. [Google Scholar] [CrossRef]
- Lu, Y.; Dai, Q.; Yi, X.; Li, H.; Peng, H.; Tan, J. Impacts of abandoned sloping farmland on soil aggregates and aggregate-associated organic carbon in karst rocky desertification areas. Environ. Monit. Assess. 2023, 195, 1404. [Google Scholar] [CrossRef]
- Shi, F.; Yang, Q.-Y.; Wang, C.; Jiang, J.-L.; Hu, R. Research on the management and protection modes of the cultivated land in fallow in the ecologically-degraded areas from the actor-network perspective: A case study in Songtao county, Guizhou province, China. J. Nat. Resour. 2021, 36, 2892–2912. [Google Scholar] [CrossRef]
- Xu, E.; Zhang, H.; Xu, Y. Effect of large-scale cultivated land expansion on the balance of soil carbon and nitrogen in the Tarim Basin. Agronomy 2019, 9, 86. [Google Scholar] [CrossRef]
- Xue, D.; Gui, D.; Ci, M.; Liu, Q.; Wei, G.; Liu, Y. Spatial and temporal downscaling schemes to reconstruct high-resolution GRACE data: A case study in the Tarim River Basin, Northwest China. Sci. Total Environ. 2024, 907, 167908. [Google Scholar] [CrossRef] [PubMed]
- Zhang, G.; Xu, T.; Yin, W.; Bateni, S.M.; Jun, C.; Kim, D.; Liu, S.; Xu, Z.; Ming, W.; Wang, J. A machine learning downscaling framework based on a physically constrained sliding window technique for improving resolution of global water storage anomaly. Remote Sens. Environ. 2024, 313, 114359. [Google Scholar] [CrossRef]
- Hou, Y.; Chen, Y.; Ding, J.; Li, Z.; Li, Y.; Sun, F. Ecological Impacts of Land Use Change in the Arid Tarim River Basin of China. Remote Sens. 2022, 14, 1894. [Google Scholar] [CrossRef]
- Zhang, X.; Zhang, L.; He, C.; Li, J.; Jiang, Y.; Ma, L. Quantifying the impacts of land use/land cover change on groundwater depletion in Northwestern China—A case study of the Dunhuang oasis. Agric. Water Manag. 2014, 146, 270–279. [Google Scholar] [CrossRef]
- Liu, Q.; Liu, Y.; Niu, J.; Gui, D.; Hu, B.X. Prediction of the Irrigation Area Carrying Capacity in the Tarim River Basin under Climate Change. Agriculture 2022, 12, 657. [Google Scholar] [CrossRef]
- Zhou, Y.; Zou, S.; Duan, W.; Chen, Y.; Takara, K.; Di, Y. Analysis of energy carbon emissions from agroecosystems in Tarim River Basin, China: A pathway to achieve carbon neutrality. Appl. Energy 2022, 325, 119842. [Google Scholar] [CrossRef]
- Zhang, X.-Y.; Zuo, Q.-T.; Yang, Q.-X. Calculation of the water resources dynamic carrying capacity of Tarim River Basin under climate change. Desalination Water Treat. 2018, 119, 243–252. [Google Scholar] [CrossRef]
- Wu, H.; Xu, M.; Peng, Z.; Chen, X. Quantifying the potential impacts of meltwater on cotton yields in the Tarim River Basin, Central Asia. Agric. Water Manag. 2022, 269, 107639. [Google Scholar] [CrossRef]
- Huang, S.; Wortmann, M.; Duethmann, D.; Menz, C.; Shi, F.; Zhao, C.; Su, B.; Krysanova, V. Adaptation strategies of agriculture and water management to climate change in the Upper Tarim River basin, NW China. Agric. Water Manag. 2018, 203, 207–224. [Google Scholar] [CrossRef]
- Meng, L.; Liu, Y.; Ma, W.; Wang, Q.; Mo, X.; Tian, J. Variable fuzzy evaluation model for water resources carrying capacity in the Tarim River Basin, China. Water Supply 2022, 22, 1445–1458. [Google Scholar] [CrossRef]
- Cao, X.; Cui, M.; Xi, L.; Feng, Y. Spatial-Temporal Process of Land Use/Land Cover and Desertification in the Circum-Tarim Basin during 1990–2020. Land 2024, 13, 735. [Google Scholar] [CrossRef]
- Yu, W.; Ma, X.; Wang, Y.; Yan, W.; Luo, C.; Han, Y.; Fan, B. Simulating wind prevention and sand fixation service flow in arid Inland River basins: Insights from the Tarim River basin, China. Sci. Total Environ. 2025, 959, 178241. [Google Scholar] [CrossRef]
- Sheng, Y.; Liu, W.; Xu, H. Study on Spatial Differentiation Characteristics and Driving Mechanism of Sustainable Utilization of Cultivated Land in Tarim River Basin. Land 2024, 13, 2122. [Google Scholar] [CrossRef]
- Li, M.; Xu, J.; Chen, R.; Al-Ghamdi, A.A. Assessing the Coordination Degree of Coupled Human–Water–Ecosystem in the Tarim River Basin of China. Water 2024, 16, 2365. [Google Scholar] [CrossRef]
- Aishan, T.; Song, J.; Halik, Ü.; Betz, F.; Yusup, A. Predicting Land-Use Change Trends and Habitat Quality in the Tarim River Basin: A Perspective with Climate Change Scenarios and Multiple Scales. Land 2024, 13, 1146. [Google Scholar] [CrossRef]
- Mu, H.; Li, X.; Wen, Y.; Huang, J.; Du, P.; Su, W.; Miao, S.; Geng, M. A global record of annual terrestrial Human Footprint dataset from 2000 to 2018. Sci. Data 2022, 9, 176. [Google Scholar] [CrossRef]
- Gao, Y.; Zhou, F.; Ciais, P.; Miao, C.; Yang, T.; Jia, Y.; Zhou, X.; Klaus, B.-B.; Yang, T.; Yu, G. Human activities aggravate nitrogen-deposition pollution to inland water over China. Natl. Sci. Rev. 2020, 7, 430–440. [Google Scholar] [CrossRef]
- Zhang, S.; Guan, Z.; Liu, Y.; Zheng, F. Land Use/Cover Change and Its Relationship with Regional Development in Xixian New Area, China. Sustainability 2022, 14, 6889. [Google Scholar] [CrossRef]
- Fang, Z.; Ding, T.; Chen, J.; Xue, S.; Zhou, Q.; Wang, Y.; Wang, Y.; Huang, Z.; Yang, S. Impacts of land use/land cover changes on ecosystem services in ecologically fragile regions. Sci. Total Environ. 2022, 831, 154967. [Google Scholar] [CrossRef]
- He, N.; Zhou, Y.; Wang, L.; Li, Q.; Zuo, Q.; Liu, J. Spatiotemporal differentiation and the coupling analysis of ecosystem service value with land use change in Hubei Province, China. Ecol. Indic. 2022, 145, 109693. [Google Scholar] [CrossRef]
- Wang, C.; Zhang, D. The super-environmental effect of the westward shift of China’s cultivated land patterns. Environ. Earth Sci. 2023, 82, 572. [Google Scholar] [CrossRef]
- Chen, W.; Yang, L.; Zeng, J.; Yuan, J.; Gu, T.; Liu, Z. Untangling the increasing elevation of cropland in China from 1980 to 2020. Geogr. Sustain. 2023, 4, 281–293. [Google Scholar] [CrossRef]
- Hou, Y.; Chen, Y.; Li, Z.; Wang, Y. Changes in Land Use Pattern and Structure under the Rapid Urbanization of the Tarim River Basin. Land 2023, 12, 693. [Google Scholar] [CrossRef]
- Li, Y.; Sun, M.; Yuan, G.; Zhou, Q.; Liu, J. Study on Development Sustainability of Atmospheric Environment in Northeast China by Rough Set and Entropy Weight Method. Sustainability 2019, 11, 3793. [Google Scholar] [CrossRef]
- Wu, R.M.; Zhang, Z.; Yan, W.; Fan, J.; Gou, J.; Liu, B.; Gide, E.; Soar, J.; Shen, B.; Fazal-e-Hasan, S. A comparative analysis of the principal component analysis and entropy weight methods to establish the indexing measurement. PLoS ONE 2022, 17, e0262261. [Google Scholar] [CrossRef]
- Sun, B.; Yang, X.; Zhang, Y.; Chen, X. Evaluation of Water Use Efficiency of 31 Provinces and Municipalities in China Using Multi-Level Entropy Weight Method Synthesized Indexes and Data Envelopment Analysis. Sustainability 2019, 11, 4556. [Google Scholar] [CrossRef]
- Yao, C.; Li, Z.; Wang, Y.; Zhang, F.; Xia, B.; Wang, L. Redefining the modified water benefit-based ecological index to evaluate the impact of cropland expansion on the ecological environment in an arid area. J. Clean. Prod. 2024, 477, 143730. [Google Scholar] [CrossRef]
- Xu, L.; Sang, K.; Li, G.; Lin, G.; Luo, Q.; Giordano, A. Heritage evaluation and analysis based on entropy weight method: The study of Wengji ancient village in China. J. Hous. Built Environ. 2023, 38, 1843–1868. [Google Scholar] [CrossRef]
- Li, X.; Wu, K.; Yang, Q.; Hao, S.; Feng, Z.; Ma, J. Quantitative assessment of cultivated land use intensity in Heilongjiang Province, China, 2001–2015. Land Use Policy 2023, 125, 106505. [Google Scholar] [CrossRef]
- Xue, L.; Wang, J.; Zhang, L.; Wei, G.; Zhu, B. Spatiotemporal analysis of ecological vulnerability and management in the Tarim River Basin, China. Sci. Total Environ. 2019, 649, 876–888. [Google Scholar] [CrossRef] [PubMed]
- Gao, P.; Kasimu, A.; Zhao, Y.; Lin, B.; Chai, J.; Ruzi, T.; Zhao, H. Evaluation of the Temporal and Spatial Changes of Ecological Quality in the Hami Oasis Based on RSEI. Sustainability 2020, 12, 7716. [Google Scholar] [CrossRef]
- Maimaitituersun, A.; Yang, H.; Aobuliaisan, N.; Maimaitiaili, K.; Chenyu, O. Assessing subtle changes in arid land river basin ecological quality: A study utilizing the PIE engine platform and RSEI. Ecol. Indic. 2025, 170, 113035. [Google Scholar] [CrossRef]
- Yuan, B.; Fu, L.; Zou, Y.; Zhang, S.; Chen, X.; Li, F.; Deng, Z.; Xie, Y. Spatiotemporal change detection of ecological quality and the associated affecting factors in Dongting Lake Basin, based on RSEI. J. Clean. Prod. 2021, 302, 126995. [Google Scholar] [CrossRef]
- Ning, L.; Jiayao, W.; Fen, Q. The improvement of ecological environment index model RSEI. Arab. J. Geosci. 2020, 13, 403. [Google Scholar] [CrossRef]
- Wang, Y.; Li, X.; He, H.; Xin, L.; Tan, M. How reliable are cultivated land assets as social security for Chinese farmers? Land Use Policy 2020, 90, 104318. [Google Scholar] [CrossRef]
- Zhang, L.; Lin, X.; Qiu, B.; Ou, G.; Zhang, Z.; Han, S. Impact of Value Perception on Farmers’ Willingness to Participate in Farmland Fallow: A Case-Study in Major Grain-Producing Areas of Hubei and Hunan, China. Sustainability 2022, 14, 724. [Google Scholar] [CrossRef]
- Wang, X.; Hu, H.; Ning, A.; Li, G.; Wang, X. The Impact of Farmers’ Perception on Their Cultivated Land Quality Protection Behavior: A Case Study of Ningbo, China. Sustainability 2022, 14, 6357. [Google Scholar] [CrossRef]
- Liu, Y.; Yuan, X.; Li, J.; Qian, K.; Yan, W.; Yang, X.; Ma, X. Trade-offs and synergistic relationships of ecosystem services under land use change in Xinjiang from 1990 to 2020: A Bayesian network analysis. Sci. Total Environ. 2023, 858, 160015. [Google Scholar] [CrossRef] [PubMed]
- Clarke, M.L.; Rendell, H.M. The impact of the farming practice of remodelling hillslope topography on badland morphology and soil erosion processes. Catena 2000, 40, 229–250. [Google Scholar] [CrossRef]
- Sun, W.; Shao, Q.; Liu, J.; Zhai, J. Assessing the effects of land use and topography on soil erosion on the Loess Plateau in China. Catena 2014, 121, 151–163. [Google Scholar] [CrossRef]
- Zhou, Z.; Zhang, Z.; Zou, X.; Zhang, K.; Zhang, W. Quantifying wind erosion at landscape scale in a temperate grassland: Nonignorable influence of topography. Geomorphology 2020, 370, 107401. [Google Scholar] [CrossRef]
- Kehoe, M.; Harding, A.; Pagdilao, S.J.; Appels, W.M. Effect of topographical and soil complexity on potato yields in irrigated fields. Agric. Water Manag. 2025, 307, 109216. [Google Scholar] [CrossRef]
- Zhang, Q.; Gu, F.; Zhang, S.; Chen, X.; Ding, X.; Xu, Z. Spatiotemporal Variation in Wind Erosion in Tarim River Basin from 2010 to 2018. Land 2024, 13, 330. [Google Scholar] [CrossRef]
- Li, H.; Zhang, X.; Zhang, X.; Wu, Y. Utilization benefit of cultivated land and land institution reforms: Economy, society and ecology. Habitat Int. 2018, 77, 64–70. [Google Scholar] [CrossRef]
- Song, W.; Zhang, H.; Zhao, R.; Wu, K.; Li, X.; Niu, B.; Li, J. Study on cultivated land quality evaluation from the perspective of farmland ecosystems. Ecol. Indic. 2022, 139, 108959. [Google Scholar] [CrossRef]
- Xu, H.; Yang, J.; Xia, G.; Lin, T. Spatio-temporal Differentiation of Coupling Coordination between Ecological Footprint and Ecosystem Service Functions in the Aksu Region, Xinjiang, China. Sustainability 2022, 14, 3483. [Google Scholar] [CrossRef]
- Li, Y.; Yang, X.; Cai, H.; Xiao, L.; Xu, X.; Liu, L. Topographical Characteristics of Agricultural Potential Productivity during Cropland Transformation in China. Sustainability 2015, 7, 96–110. [Google Scholar] [CrossRef]
- Chen, X.; Jiang, L.; Zhang, G.; Meng, L.; Pan, Z.; Lun, F.; An, P. Green-depressing cropping system: A referential land use practice for fallow to ensure a harmonious human-land relationship in the farming-pastoral ecotone of northern China. Land Use Policy 2021, 100, 104917. [Google Scholar] [CrossRef]
- Lieskovský, J.; Bezák, P.; Špulerová, J.; Lieskovský, T.; Koleda, P.; Dobrovodská, M.; Bürgi, M.; Gimmi, U. The abandonment of traditional agricultural landscape in Slovakia—Analysis of extent and driving forces. J. Rural Stud. 2015, 37, 75–84. [Google Scholar] [CrossRef]
- Ojha, H.R.; Shrestha, K.K.; Subedi, Y.R.; Shah, R.; Nuberg, I.; Heyojoo, B.; Cedamon, E.; Rigg, J.; Tamang, S.; Paudel, K.P.; et al. Agricultural land underutilisation in the hills of Nepal: Investigating socio-environmental pathways of change. J. Rural Stud. 2017, 53, 156–172. [Google Scholar] [CrossRef]
- Chen, X.; Lin, C.; Hou, X.; Wu, Z.; Yan, G.; Zhu, C. The impact of land consolidation on arable land productivity: A differentiated view of soil and vegetation productivity. Agric. Ecosyst. Environ. 2022, 326, 107781. [Google Scholar] [CrossRef]
- Yan, H.; Liu, J.; Huang, H.Q.; Tao, B.; Cao, M. Assessing the consequence of land use change on agricultural productivity in China. Glob. Planet. Change 2009, 67, 13–19. [Google Scholar] [CrossRef]
- Wang, Y.; Xia, T.; Shataer, R.; Zhang, S.; Li, Z. Analysis of Characteristics and Driving Factors of Land-Use Changes in the Tarim River Basin from 1990 to 2018. Sustainability 2021, 13, 10263. [Google Scholar] [CrossRef]
- Zhao, R.; Chen, Y.; Shi, P.; Zhang, L.; Pan, J.; Zhao, H. Land use and land cover change and driving mechanism in the arid inland river basin: A case study of Tarim River, Xinjiang, China. Environ. Earth Sci. 2013, 68, 591–604. [Google Scholar] [CrossRef]
- Feng, M.; Chen, Y.; Duan, W.; Fang, G.; Jiao, L.; Sun, F.; Li, Y.; Hou, Y. Comprehensive evaluation of the water-energy-food nexus in the agricultural management of the Tarim River Basin, Northwest China. Agric. Water Manag. 2022, 271, 107811. [Google Scholar] [CrossRef]
- Sun, F.; Wang, Y.; Chen, Y.; Li, Y.; Zhang, Q.; Qin, J.; Kayumba, P.M. Historic and simulated desert-oasis ecotone changes in the arid Tarim River Basin, China. Remote Sens. 2021, 13, 647. [Google Scholar] [CrossRef]
- Zhang, J.; Bai, M.; Zhou, S.; Zhao, M. Agricultural Water Use Sustainability Assessment in the Tarim River Basin under Climatic Risks. Water 2018, 10, 170. [Google Scholar] [CrossRef]
- Zhang, S.; Wang, Y.; Wang, Y.; Li, Z.; Hou, Y. Spatiotemporal evolution and influencing mechanisms of ecosystem service value in the Tarim River Basin, Northwest China. Remote Sens. 2023, 15, 591. [Google Scholar] [CrossRef]
- Wang, M.; Sun, X.; Fan, Z.; Yue, T. Investigation of Future Land Use Change and Implications for Cropland Quality: The Case of China. Sustainability 2019, 11, 3327. [Google Scholar] [CrossRef]
- Cai, T.; Zhang, X.; Xia, F.; Zhang, Z.; Yin, J.; Wu, S. The Process-Mode-Driving Force of Cropland Expansion in Arid Regions of China Based on the Land Use Remote Sensing Monitoring Data. Remote Sens. 2021, 13, 2949. [Google Scholar] [CrossRef]


| Data Types | Time | Spatial Resolution | Purpose of the Data | Data Sources |
|---|---|---|---|---|
| MOD13A1 | 2000, 2005, 2010, 2015, 2020 | 500 m | Measuring the cropland ecological vulnerability | National Aeronautics and Space Administration (https://www.nasa.gov/) (accessed on 13 July 2024) |
| MOD11A2 | 2000, 2005, 2010, 2015, 2020 | 1000 m | Measuring the cropland ecological vulnerability | National Aeronautics and Space Administration (https://www.nasa.gov/) (accessed on 13 July 2024) |
| MOD09A1 | 2000, 2005, 2010, 2015, 2020 | 500 m | Measuring the cropland ecological vulnerability | National Aeronautics and Space Administration (https://www.nasa.gov/) (accessed on 13 July 2024) |
| FOV | 2000, 2005, 2010, 2015, 2020 | 1000 m | Measuring the output value of arable land | DCRES (http://www.resdc.cn/) (accessed on 25 July 2024) |
| MOV | 2000, 2005, 2010, 2015, 2020 | 1000 m | Measuring the output value of arable land | DCRES (http://www.resdc.cn/) (accessed on 25 July 2024) |
| CNLUCC | 2000, 2005, 2010, 2015, 2020 | 30 m | Measured cropland area | DCRES (http://www.resdc.cn/) (accessed on 25 July 2024) |
| Water body | 2005 | / | Measuring the water resources status of arable land | DCRES (http://www.resdc.cn/) (accessed on 25 July 2024) |
| PRE | 2000, 2010, 2020 | 1000 m | Measuring the water resources status of arable land | DCRES (http://www.resdc.cn/) (accessed on 25 July 2024) |
| DEM | / | 250 m | Measuring the topographic relief of arable land | DCRES (http://www.resdc.cn/) (accessed on 25 July 2024) |
| NPP | 2001, 2005, 2010, 2015, 2020 | 1000 m | Validation of the SILF | DCRES (http://www.resdc.cn/) (accessed on 25 July 2024) |
| HF | 2000, 2005, 2010, 2015, 2020 | 1000 m | Characterizing the intensity of human activity | Figshare (https://figshare.com/) (accessed on 3 August 2024) |
| PRE | 2005, 2015 | 1000 m | Measuring the water resources status of arable land | TRDCAC (https://data.tpdc.ac.cn/) (accessed on 27 July 2024) |
| GWSA | 2002, 2005, 2010, 2015, 2020 | 0.05° | Measuring the water resources status of arable land | TRDCAC (https://data.tpdc.ac.cn/) (accessed on 27 July 2024) |
| Water body | 2000 | / | Measuring the water resources status of arable land | TRDCAC (https://data.tpdc.ac.cn/) (accessed on 27 July 2024) |
| Water body | 2015, 2020 | Measuring the water resources status of arable land | OSM (http://www.openstreetmap.org/) (accessed on 9 August 2024) | |
| Water body | 2008 | / | Measuring the water resources status of arable land | NESDC (http://www.nesdc.org.cn) (accessed on 6 August 2024) |
| Population data | 2020 | / | Measuring the ecological carrying capacity of arable land | China Population and Employment Statistics Yearbook |
| Administrative division data | / | / | Determination of the extent of the study area | NPCGIS (https://www.tianditu.gov.cn/) (accessed on 9 August 2024) |
| SILF Changes Category | 2000–2005 | 2005–2010 | 2010–2015 | 2015–2020 | ||||
|---|---|---|---|---|---|---|---|---|
| Area (km2) | Ratio (%) | Area (km2) | Ratio (%) | Area (km2) | Ratio (%) | Area (km2) | Ratio (%) | |
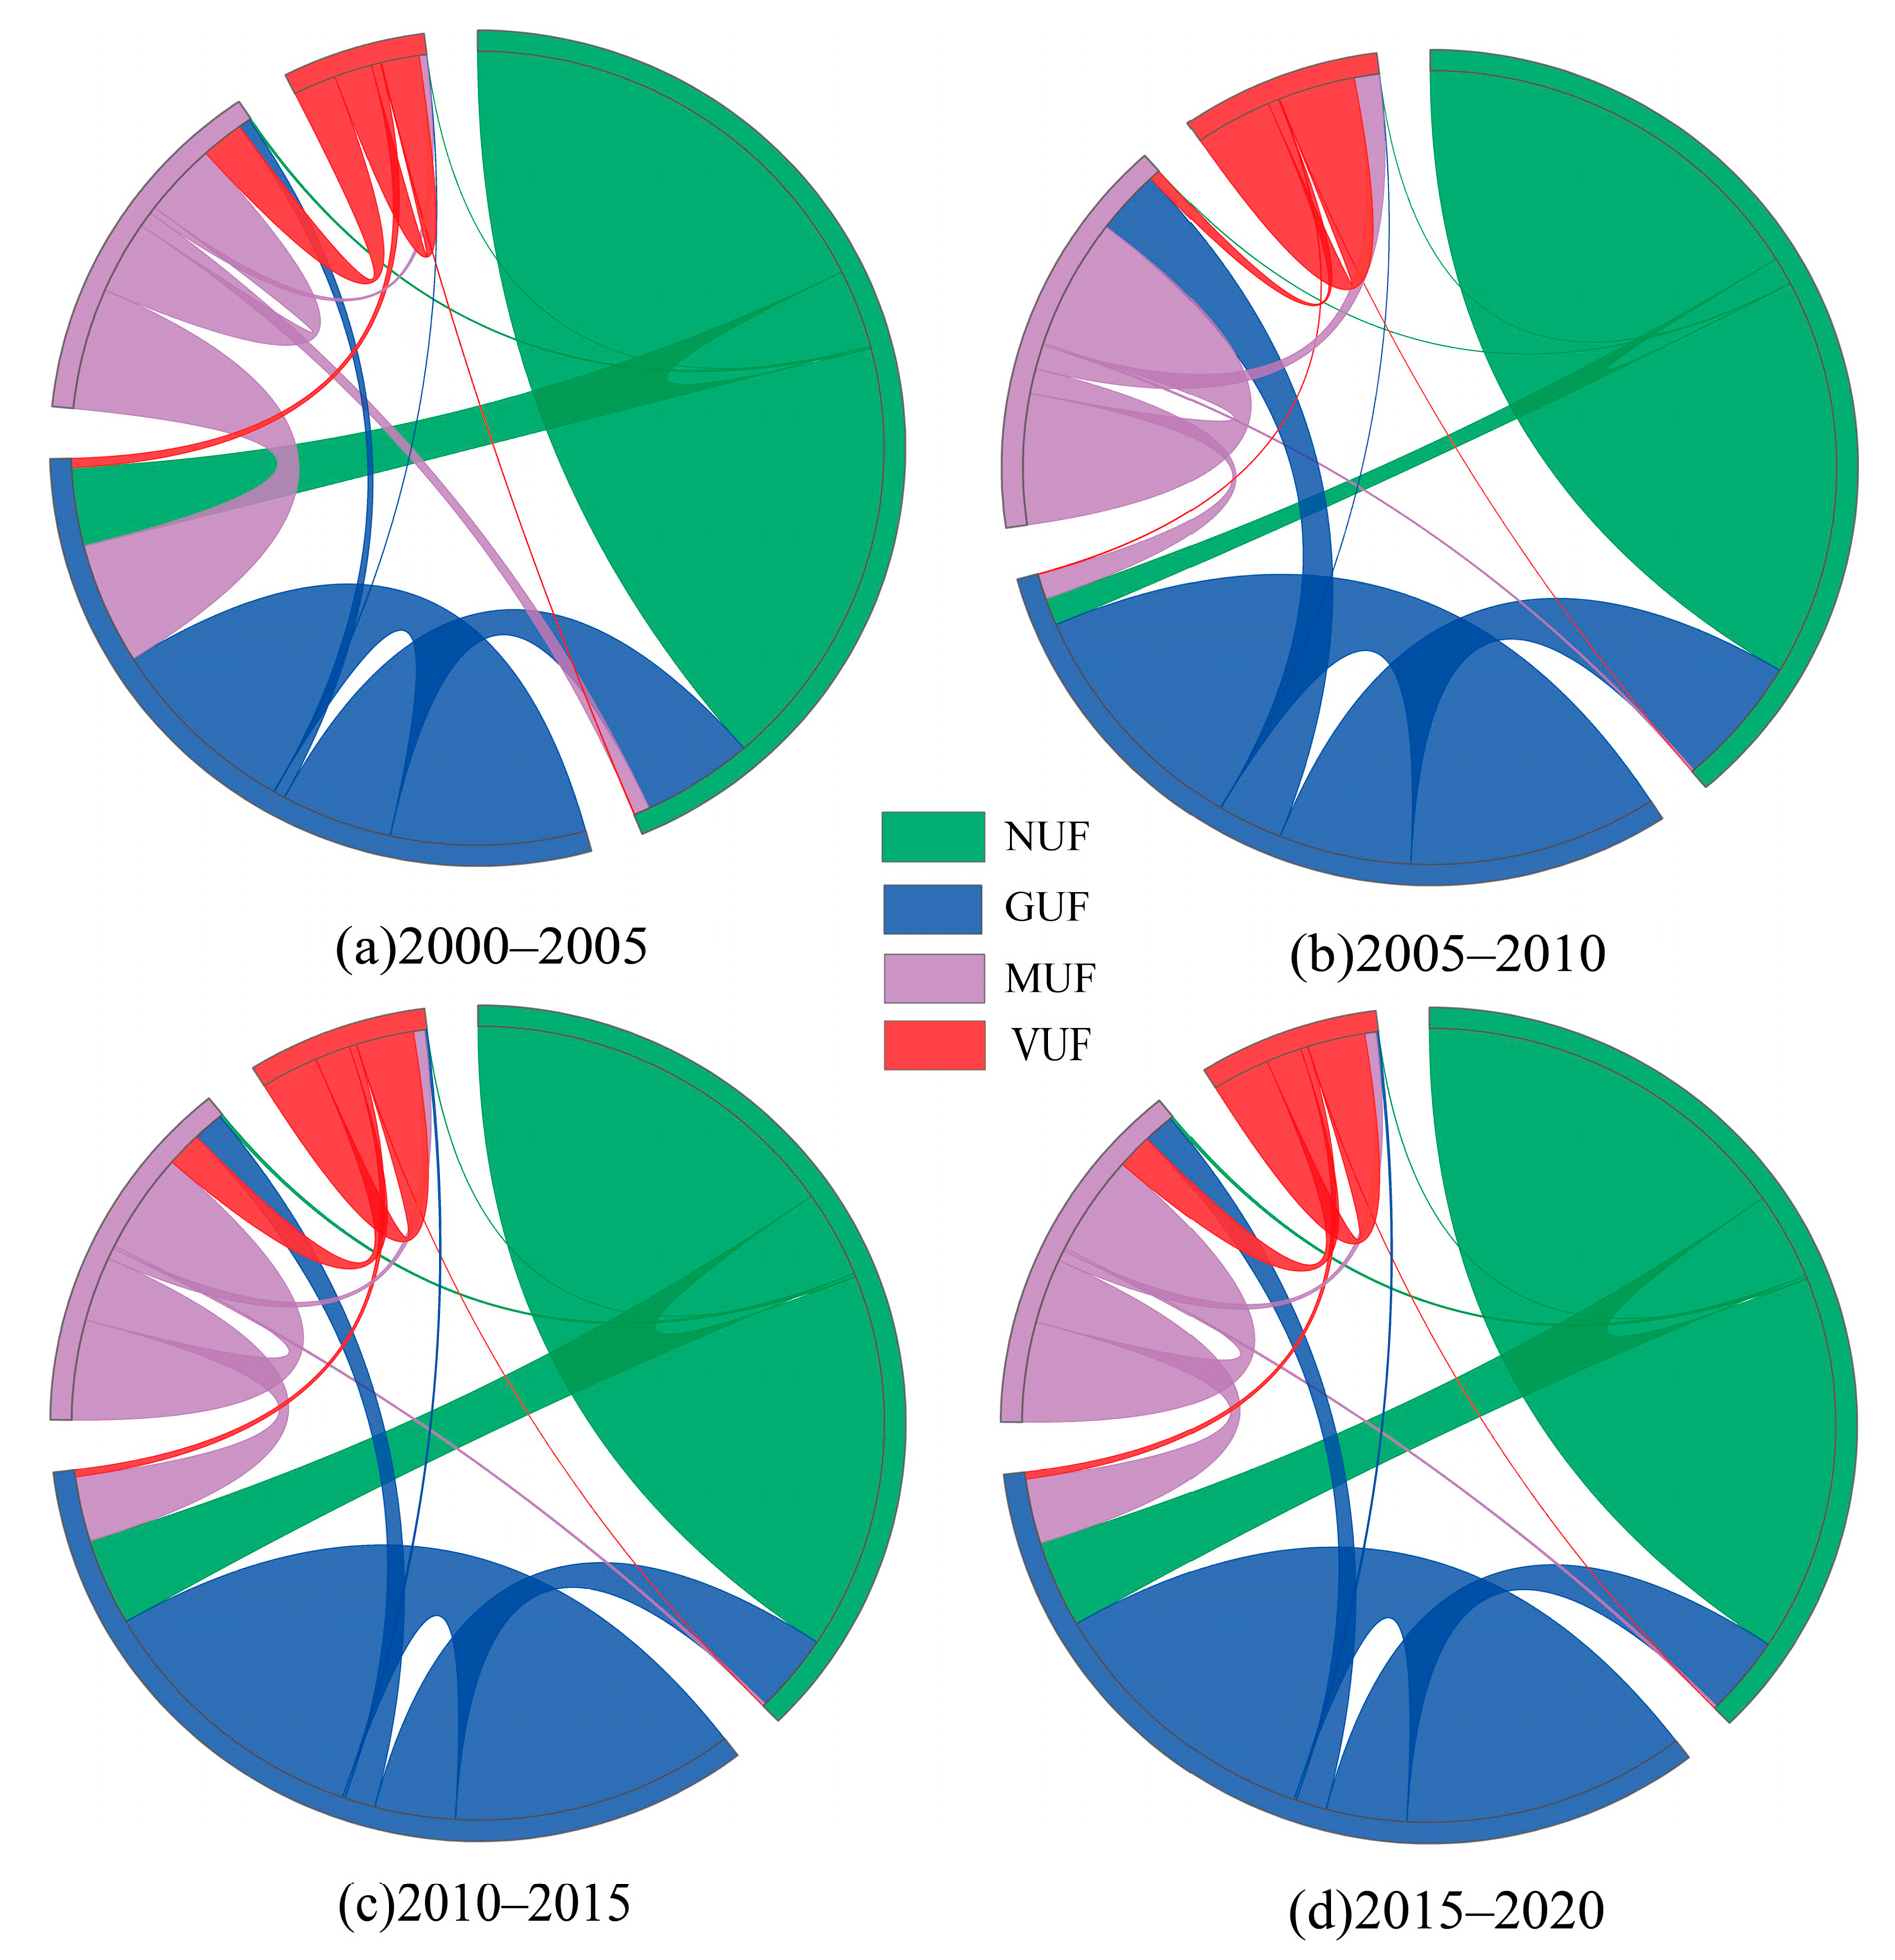
| NUF to NUF | 9130.59 | 35.21 | 9554.74 | 38.43 | 11,226.65 | 33.28 | 9565.87 | 25.83 |
| NUF to GUF | 628.54 | 2.42 | 1725.51 | 6.94 | 2594.89 | 7.69 | 3944.22 | 10.65 |
| NUF to MUF | 9.17 | 0.04 | 43.53 | 0.18 | 91.16 | 0.27 | 291.35 | 0.79 |
| NUF to VUF | 1.13 | 0.00 | 2.62 | 0.01 | 10.47 | 0.03 | 47.47 | 0.13 |
| GUF to NUF | 2963.17 | 11.43 | 2396.15 | 9.64 | 2350.23 | 6.97 | 1323.34 | 3.57 |
| GUF to GUF | 5577.56 | 21.51 | 4183.97 | 16.83 | 8256.92 | 24.48 | 6924.38 | 18.70 |
| GUF to MUF | 1464.81 | 5.65 | 249.99 | 1.01 | 898.39 | 2.66 | 5007.23 | 13.52 |
| GUF to VUF | 7.31 | 0.03 | 10.05 | 0.04 | 69.44 | 0.21 | 742.63 | 2.01 |
| MUF to NUF | 46.54 | 0.18 | 334.81 | 1.35 | 79.96 | 0.24 | 58.58 | 0.16 |
| MUF to GUF | 570.46 | 2.20 | 2660.48 | 10.70 | 1924.02 | 5.70 | 337.37 | 0.91 |
| MUF to MUF | 2988.39 | 11.52 | 1599.59 | 6.43 | 2979.93 | 8.83 | 2169.91 | 5.86 |
| MUF to VUF | 554.41 | 2.14 | 150.22 | 0.60 | 319.60 | 0.95 | 3493.89 | 9.44 |
| VUF to NUF | 1.86 | 0.01 | 16.32 | 0.07 | 7.45 | 0.02 | 5.92 | 0.02 |
| VUF to GUF | 19.54 | 0.08 | 201.06 | 0.81 | 210.58 | 0.62 | 23.22 | 0.06 |
| VUF to MUF | 244.52 | 0.94 | 919.78 | 3.70 | 1030.42 | 3.05 | 125.25 | 0.34 |
| VUF to VUF | 1723.13 | 6.65 | 815.80 | 3.28 | 1678.92 | 4.98 | 2967.27 | 8.01 |
Disclaimer/Publisher’s Note: The statements, opinions and data contained in all publications are solely those of the individual author(s) and contributor(s) and not of MDPI and/or the editor(s). MDPI and/or the editor(s) disclaim responsibility for any injury to people or property resulting from any ideas, methods, instructions or products referred to in the content. |
© 2025 by the authors. Licensee MDPI, Basel, Switzerland. This article is an open access article distributed under the terms and conditions of the Creative Commons Attribution (CC BY) license (https://creativecommons.org/licenses/by/4.0/).
Share and Cite
Shen, L.; Li, Z.; Hao, J.; Wang, L.; Chen, H.; Wang, Y.; Xia, B. Evaluating the Dynamic Response of Cultivated Land Expansion and Fallow Urgency in Arid Regions Using Remote Sensing and Multi-Source Data Fusion Methods. Agriculture 2025, 15, 839. https://doi.org/10.3390/agriculture15080839
Shen L, Li Z, Hao J, Wang L, Chen H, Wang Y, Xia B. Evaluating the Dynamic Response of Cultivated Land Expansion and Fallow Urgency in Arid Regions Using Remote Sensing and Multi-Source Data Fusion Methods. Agriculture. 2025; 15(8):839. https://doi.org/10.3390/agriculture15080839
Chicago/Turabian StyleShen, Liqiang, Zexian Li, Jiaxin Hao, Lei Wang, Huanhuan Chen, Yuejian Wang, and Baofei Xia. 2025. "Evaluating the Dynamic Response of Cultivated Land Expansion and Fallow Urgency in Arid Regions Using Remote Sensing and Multi-Source Data Fusion Methods" Agriculture 15, no. 8: 839. https://doi.org/10.3390/agriculture15080839
APA StyleShen, L., Li, Z., Hao, J., Wang, L., Chen, H., Wang, Y., & Xia, B. (2025). Evaluating the Dynamic Response of Cultivated Land Expansion and Fallow Urgency in Arid Regions Using Remote Sensing and Multi-Source Data Fusion Methods. Agriculture, 15(8), 839. https://doi.org/10.3390/agriculture15080839