1. Introduction
Allium L. germplasm resources exhibit significant diversity and are characterized by rich genetic variation. These resources are primarily collected and preserved as seeds, playing essential roles in breeding programs and industrial development [
1]. Seeds of Chinese chives, Welsh onions, and onions share a black appearance and strikingly similar morphology, complicating their differentiation [
2]. In practical seed production, fraudulent practices such as adulterating Chinese chives seeds with cheaper onion grains for illicit profits remain prevalent, resulting in artificial seed mixture issues [
3]. Counterfeit seeds not only damage farmers’ income but also severely threaten agricultural safety [
4]. To address seed adulteration impacts, Wei Ying [
5] proposed distinguishing onion and Chinese chives grains through the examination of the microscopic characteristics of surface textures and cross-sectional structures; however, this method proves impractical for large-scale agricultural operations. Currently, China’s reliance on manual seed identification risks operational inaccuracies and insufficient precision, failing to meet modern agriculture’s stringent requirements for seed production quality control [
6]. Thus, it is crucial to overcome the limitations of these conventional approaches by developing nondestructive and precise seed classification techniques. These advancements are vital for evaluating seed quality and improving agricultural productivity [
7].
Hyperspectral imaging technology, as an emerging detection method, offers advantages including numerous spectral bands and high resolution and has found extensive applications in geographic remote sensing, optoelectronics, and biomedical sciences. With technological advancements, it has gained increasing research attention in agricultural applications, particularly for crop variety identification, component quantification, and early disease diagnosis [
8,
9,
10]. This technology uniquely captures both the surface characteristics and internal chemical structures of samples while extracting relevant information without sample damage. This characteristic ideally aligns with the requirements for rapid and nondestructive detection methodologies.
Wei developed a robust and precise method for nondestructive soybean classification using hyperspectral imaging and an integrated machine learning algorithm. The study employed 155 data features to classify 15 soybean varieties, achieving a remarkable classification accuracy of 99.2% using the Random Subspace Linear Discrimination (RSLD) method [
11]. Similarly, Xu acquired hyperspectral images of four rice varieties at various aging stages. By implementing a multiple scattering correction and feature band selection through a continuous projection algorithm, a Partial Least Squares Discriminant Analysis (PLS-DA) model was established, yielding a prediction accuracy exceeding 98.75% [
12]. Furthermore, Ansari used an RGB camera to capture images of three rice seed varieties. Feature extraction from these images was used to construct a classification model, wherein the Support Vector Machine (SVM) demonstrated the highest classification accuracy of 93.9% [
13].
Hyperspectral imaging technology has demonstrated significant potential in seed classification research. Song successfully classified waxy corn varieties using RF algorithms, achieving 89.6% accuracy with full-spectrum input and 91.9% accuracy using optimized spectral features [
14]. Yang developed an SPA-PSO-BP model for the nondestructive, high-accuracy detection (98.7%) of peanut varieties [
15]. Huang established an efficient classification system for rice seeds through LDA preprocessing combined with KNN classifiers [
16].
While hyperspectral imaging has matured in agricultural variety classification, current research predominantly focuses on staple crops like rice and corn. There are few studies on the classification of Allium L. seeds by hyperspectral imaging at home and abroad, and the research methods are still to be determined. This study investigates 1050 Allium L. seeds (Welsh onion, onion, and Chinese chives) through hyperspectral analysis. In this study, Standard Normal Variable (SNV), Multivariate Scattering Correction (MSC), Second-Order Differential (SD), and First-Order Differential (FD) were applied to denoise the original data. Additionally, Principal Component Analysis (PCA) was employed to reduce the dimensionality of the hyperspectral data. Based on these five preprocessing algorithms, four classification models, namely, Partial Least Squares (PLS-DA), Support Vector Machine (SVM), Random Forest (RF), and k-Nearest Neighbor (KNN), were developed. These models were designed to facilitate the rapid and accurate identification of seeds through nondestructive prediction methods.
This study aims to establish a reliable model for the rapid nondestructive detection of Welsh onion, onion, and Chinese chives seeds by integrating hyperspectral imaging with machine learning algorithms. In actual agricultural production, the approach can help identify different Allium L. seeds, maintaining market-level seed varietal integrity to mitigate risks of varietal adulteration and commercial counterfeiting. These capabilities directly safeguard farmer livelihoods while enhancing agricultural biosecurity across production systems. Concurrently, it provides theoretical references and technical support for the development of efficient nondestructive detection methods for germplasm resources, thereby contributing to advancements in agricultural science and seed quality assessment.
2. Materials and Methods
2.1. Plant Materials
A total of 1050 samples were collected, comprising 350 grains of Welsh onion (
Allium fistulosum L.), 350 grains of onion (
Allium cepa L.), and 350 grains of Chinese chives (
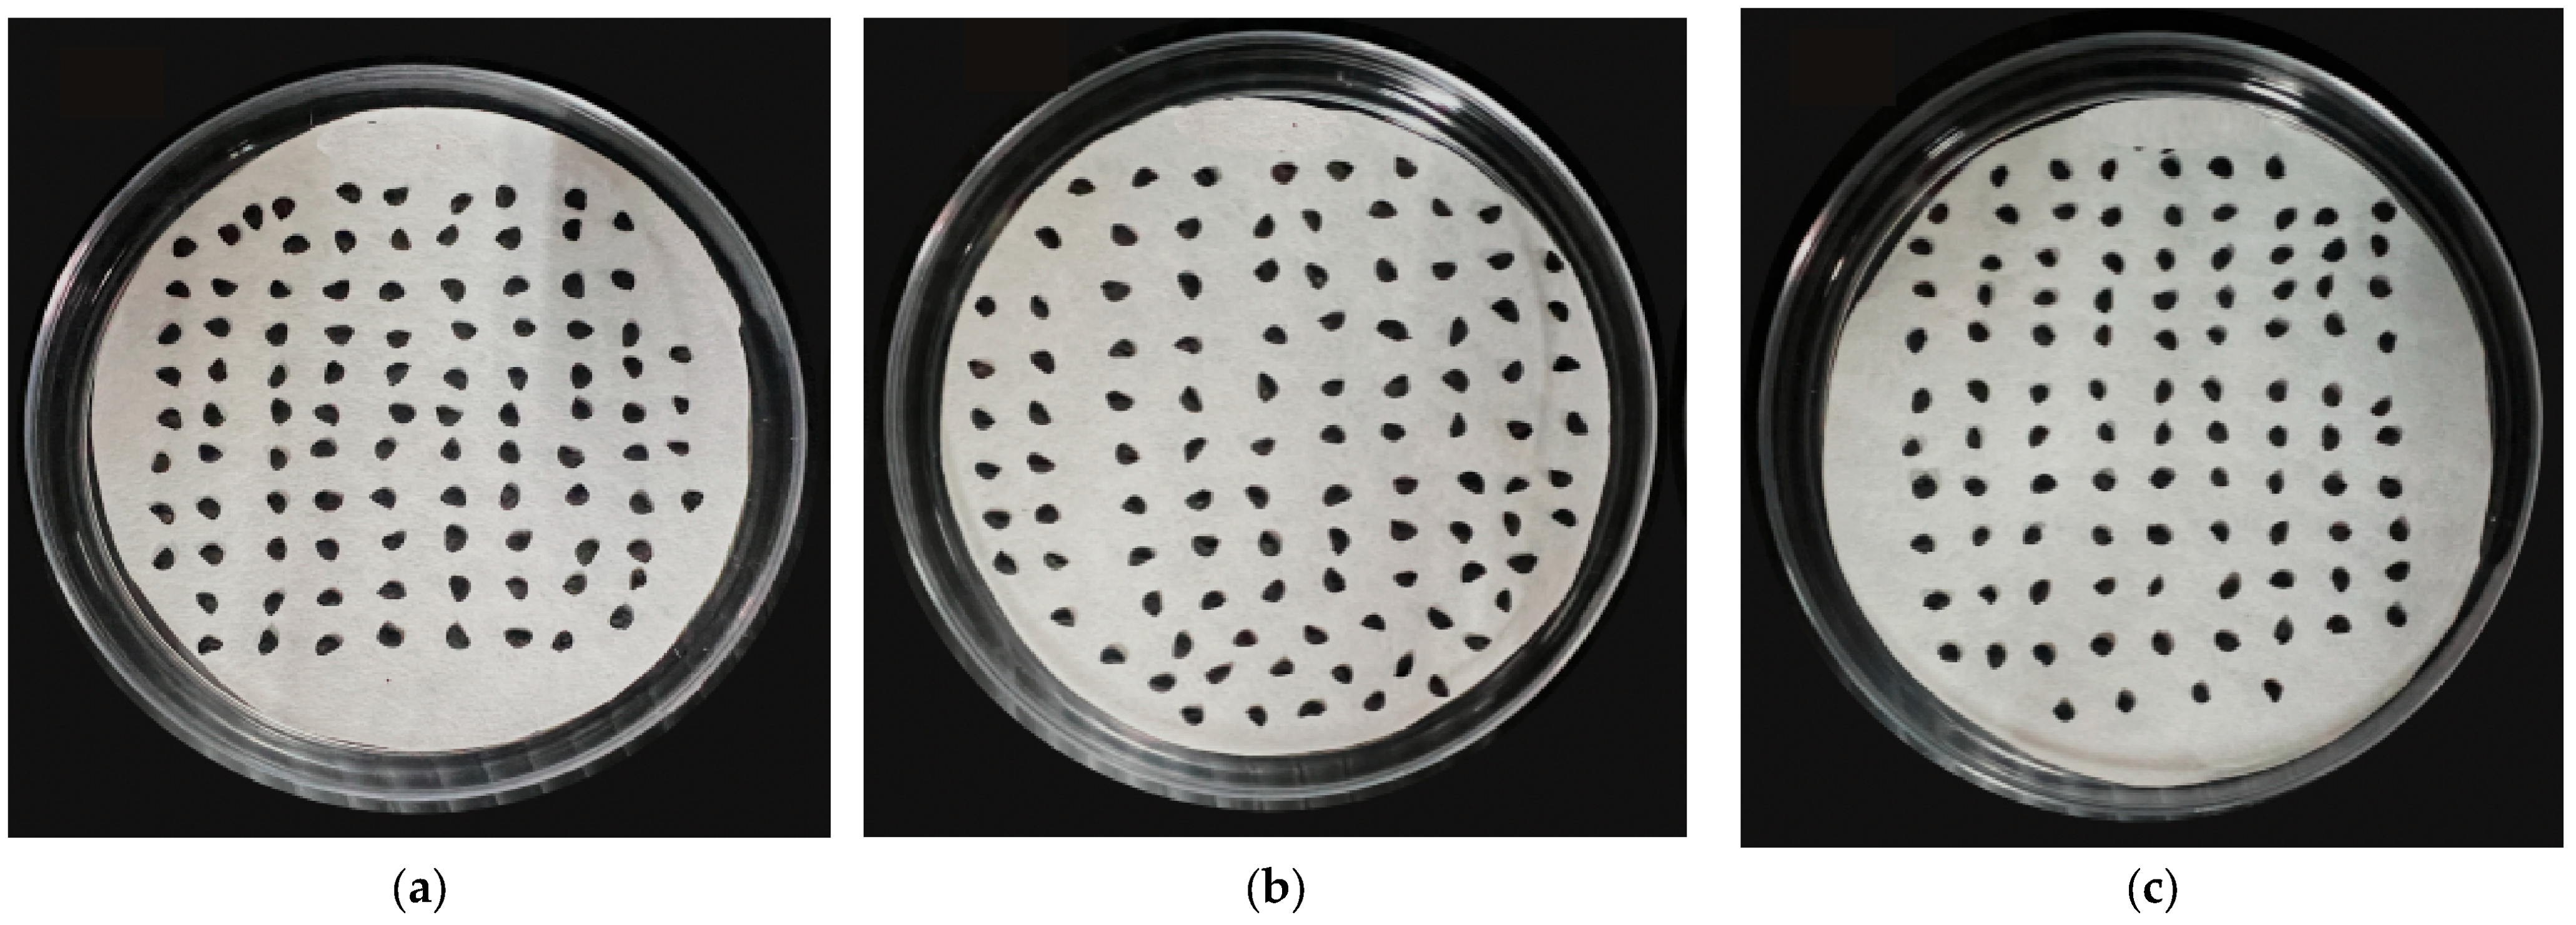
Allium tuberosum Rottler. ex Spr.). The seeds were cleaned and dried after collection and then stored in sealed bags in a cool, dry, and ventilated environment at a temperature of 4 °C. The seeds of these three species exhibit remarkable morphological similarity, making it challenging to directly identify their species (
Figure 1).
The three types of seeds have black or dark brown epidermis. Among them, Chinese chives seeds are smaller, flat in shape, and have a relatively smooth surface; Welsh onion seeds are larger, round or slightly flattened, with a rougher surface; onion seeds are similar in size to Welsh onion seeds, almost round, and smoother than Welsh onion seeds. In traditional methods of differentiation, apart from visually observing the seeds and their characteristics after planting, the thousand-grain weight is also used for distinction. Welsh onion seeds have the smallest thousand-grain weight, around 2.8 grams; Chinese chives seeds can reach 4 grams, and onion seeds have the largest thousand-grain weight, around 4.6 grams [
17].
2.2. Methods
2.2.1. Hyperspectral Data Collection
The spectral data were collected using a Specim PFD4k hyperspectral imaging system (supplied by Specim, Spectral Imaging Ltd., Oulu, Finland) with a wavelength range of 400–1000 nm. The instrument was securely mounted on a tabletop, with the camera lens positioned 15 cm vertically from the sample. The sample was illuminated at a 20° angle by a tungsten halogen lamp, placed 11 cm away in a straight line. To ensure adequate lighting for image acquisition, a band fusion setting of 4 was selected.
In order to reduce the noise caused by the environment and equipment, the original hyperspectral images were subjected to black-and-white correction. The correction can be mathematically represented by the following Equation (1):
where R
0 denotes the original hyperspectral image. R
B represents the black reference image utilized during the correction process, characterized by a reflectance value close to 0%. Conversely, R
W signifies the white reference image, which exhibits a reflectance value near 100%. The white reference image R
W was obtained using a homogeneous whiteboard composed of tetrafluoroethylene. R is the corrected hyperspectral image.
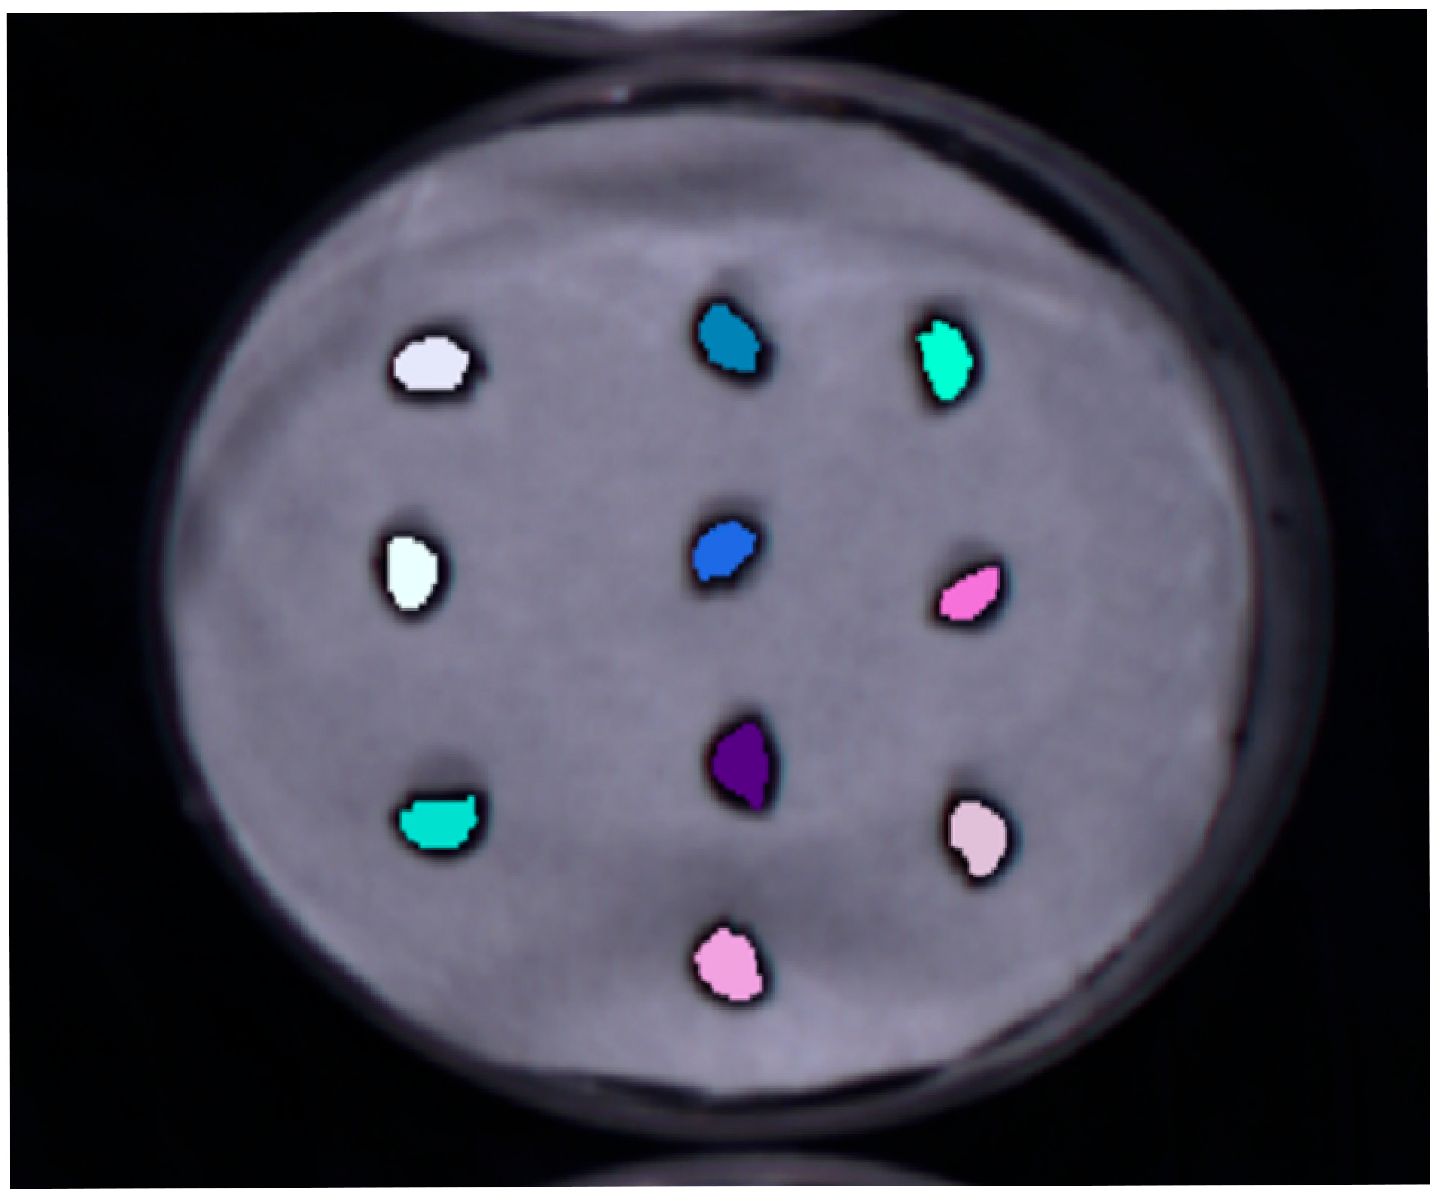
Ten seeds were grouped together and evenly placed on a petri dish lined with filter paper (
Figure 2) for image acquisition, resulting in Vis-NIR (visible–near infrared) hyperspectral images of the seeds captured in reflectance mode.
2.2.2. Dataset Creation
The extraction of reflectance data, which is essential for dataset creation, was performed using ENVI 5.3 software, which enables direct manipulation of spectral reflectance curves. Initially, the hyperspectral data obtained from scanning the samples with the hyperspectral imaging instrument were imported into ENVI software. Subsequently, regions of interest (ROIs) for each sample were manually delineated (
Figure 2). The average spectral reflectance value within each selected ROI was calculated and used as the representative spectral reflectance data for that region. Finally, all spectral reflectance data for each sample were stored in Excel for systematic analysis.
A total of 1050 samples were used, which were divided into 105 samples to collect and generate hyperspectral images. The spectral reflectance data for the samples were extracted using ENVI software. The data spanned from 400 to 1000 nm across 600 bands; however, due to the large volume of data and information redundancy, band fusion was performed using the Lumo Scanner 1.3, reducing the 600 bands to 194. The collected raw spectral data, comprising 194 bands in the 400–1000 nm range and 97 bands in the 700–1000 nm range, along with the spectral data processed using five different preprocessing methods, were saved in CSV format in Excel. The seed labels for Chinese chives, Welsh onion, and onion were assigned as 0, 1, and 2, respectively. A dataset was created by matching the seed samples with their respective labels for subsequent use in species identification model development. The dataset was randomly divided into a training set and a testing set in a 70:30 ratio. The training set was used to train the model, while the testing set was used to assess the model’s performance. In total, 12 distinct datasets were created to develop a three-class classification model for species identification.
2.2.3. Data Preprocessing Methods
During hyperspectral information extraction, the acquired data can be significantly affected by environmental factors, such as light source stability, system noise, and background clutter. Therefore, removing irrelevant information is essential for effective data extraction. Data preprocessing aims to reduce interference caused by noise, illumination fluctuations, and other extraneous variables inherent in the original conditions [
18]. Currently, various preprocessing methods are used to perform essential tasks, including baseline correction, scattering correction, smoothing, and scaling of spectral information [
19,
20]. This study applied the Multiple Scattering Correction (MSC), Standard Normal Variation (SNV), First-Order Differential (FD), Second-Order Differential (SD), and Principal Component Analysis (PCA) methods to preprocess the data.
MSC employs a mathematical algorithm to separate the scattered light signal from the chemical absorption information in spectral data [
21]. Initially, the “prospectr” data package was loaded into R 4.4.2 to input the original spectral data, consisting of 194 bands in the 400–1000 nm range. Subsequently, the average spectral reflectance (S) of all seeds was calculated using Equation (2):
The spectrum of each sample, along with the average spectrum, was determined using a linear regression Equation (3), yielding the baseline translation (b
i) and offset (k
i) for each sample.
The baseline translation (b
i) was then subtracted using Equation (4), and the resulting value was divided by the offset (k
i). This process produced the corrected spectral data, from which an MSC preprocessing dataset was created, corresponding to the classification labels.
- 2.
Standard Normal Variation
SNV preprocessing can mitigate the effects of scattering phenomena, sample particle size, and variations in optical signal intensity distribution [
22,
23]. The “prospectr” data package was imported into RStudio, where the original spectral data for the seeds was processed. Calculations were performed according to Equation (5), where m represents the total number of bands in the hyperspectral data of the seeds, with m = 194. Here, k ∈ {1, 2, 3, …, m} designates the individual bands. The matrix X corresponds to the original spectral data of the seeds, while X
k denotes the kth band of X.
- 3.
First-Order Differential
FD represents the derivative of the original function to address the baseline translation issue in the spectral data acquisition process. After processing, the characteristic peaks and valleys in the spectrum provide a more comprehensive explanation of the sample information contained within. A total of 194 bands from the original spectral data were used as input, and the preprocessed data were derived from the calculations outlined in Equation (6). Here, X
i represents the original spectrum of the i-th seed, where i ∈ {1, 2, 3, …, 194}, and
G denotes the wavelength width.
- 4.
Second-Order Differential
SD is the second derivative of the original function, enhancing resolution. A total of 194 bands from the original spectral data were used as input, and the preprocessed data were derived from the calculations outlined in Formula (7). Here, X
i represents the original spectrum data, where i ∈ {1, 2, 3, …, 194}, and G denotes the wavelength width.
- 5.
Principal Component Analysis
PCA is a data processing technique used to address the multicollinearity problem. It aims to apply dimensionality reduction to represent the original data of multiple indicators by combining several Principal Components (PCs), minimizing information loss. PCA has become an accepted technique for dimensionality reduction and variable selection in hyperspectral imaging (HSI) [
24].
2.2.4. Hyperspectral Classification Model
The primary data modeling techniques employed in this study were k-Nearest Neighbors (KNN), Random Forest (RF), Partial Least Squares Discriminant Analysis (PLS-DA), and Support Vector Machine (SVM).
KNN classifies samples based on the nearest training examples in the feature space, with predictions determined by majority voting. If a sample is most similar to k instances of a given class in the feature space, it is classified as belonging to that class. Adjusting the parameter k within a range of 0 to 30 can improve the performance of the classification model. This tuning process aims to identify the optimal value of k for optimal classification performance.
- 2.
Random Forest Model
Random Forest (RF) is an ensemble learning method that constructs multiple decision trees based on random training samples from the dataset. As a classifier composed of multiple decision trees, RF combines these trees during the training phase, and the class of its output is determined by the majority vote among the decision trees [
25].
- 3.
Partial Least Squares Discriminant Analysis Model
PLS-DA is an optimization technique based on a mathematical algorithm. It identifies the best functional match for a dataset by minimizing the sum of squared errors and derives a linear regression model by projecting the samples into a new space. PLS-DA is well-suited for classification and descriptive modeling of high-dimensional datasets [
26].
- 4.
Support Vector Machine Model
The SVM classification method offers several unique advantages in addressing problems involving small sample sets, nonlinearity, and high-dimensional pattern recognition. The key objective is to identify the hyperplane wx + b = 0, which maximizes the geometrically largest margin between the samples in the feature space. The samples are then divided into two classes, separated by the hyperplanes [
27]. The experiment utilizes four distinct kernel functions, namely, Linear, Polynomial, Radial Basis Function (RBF), and Sigmoid kernels, to construct the SVM model.
The Support Vector Machine (SVM) algorithm was originally developed for binary classification tasks. With further research, SVM has evolved to handle multi-class classification by combining multiple binary classifiers. The principle of the three-class classification model developed in this study is as follows: binary classifiers are constructed for every possible pair of different classes, and the results of these binary classifiers are then integrated to obtain the final multi-class classification output [
28].
In this study, four classification methods are representative of classical algorithms of machine learning. The k-Nearest Neighbors (KNN) algorithm imposes minimal assumptions on data distribution and achieves rapid training, though it suffers from high computational demands during testing, slower inference speeds, and challenges in selecting the optimal k-value [
29]. The Random Forest (RF) algorithm, as an ensemble classification technique, demonstrates superior accuracy and higher computational efficiency compared to the Decision Tree algorithm, having been successfully applied across diverse domains [
30,
31]. Partial Least Squares Discriminant Analysis (PLS-DA) integrates dimensionality reduction preprocessing with conventional Linear Discriminant Analysis (LDA), offering multifunctional capabilities for both classification and variable selection with greater flexibility [
32]. The Support Vector Machine (SVM) algorithm delivers robust performance with limited training samples and requires lower computational resources, while recent advancements have extended its utility to multi-class classification scenarios. Despite their conceptual simplicity, these classical algorithms form the foundational core of machine learning development and retain critical research significance [
33].
2.2.5. Model Evaluation Indicators
This study primarily employs the confusion matrix to assess the predictive performance of the model. In this matrix, the rows correspond to the predicted outcomes, while the columns represent the actual values of the data. In the identification models of Welsh onion, onion, and Chinese chives, established using hyperspectral technology, the confusion matrix (
Table 1) provides an intuitive evaluation of the classification model results. For instance, in the binary classification model, the model determines whether the sample result is 0 or 1. In this context, a result of 0 is designated as Positive, and a result of 1 is classified as Negative. By comparing the actual outcomes with those predicted by the model, we can obtain the True Positive, False Positive, True Negative, and False Negative results.
Four evaluation metrics were employed: Accuracy, Precision, Recall, and the F1 score. Accuracy is defined as the ratio of correctly predicted samples to the total number of samples in the dataset. Precision is the proportion of positive predicted samples whose true values are also positive. Recall is the proportion of samples with positive true values that are also correctly predicted as positive. Precision and Recall are inversely related and cannot both be maximized simultaneously. Therefore, the F1 score is introduced as a trade-off between Precision and Recall, serving as their harmonic mean. It reflects the model’s robustness, with a higher F1 score indicating better performance.
3. Results and Discussion
3.1. Average Spectral Characteristics
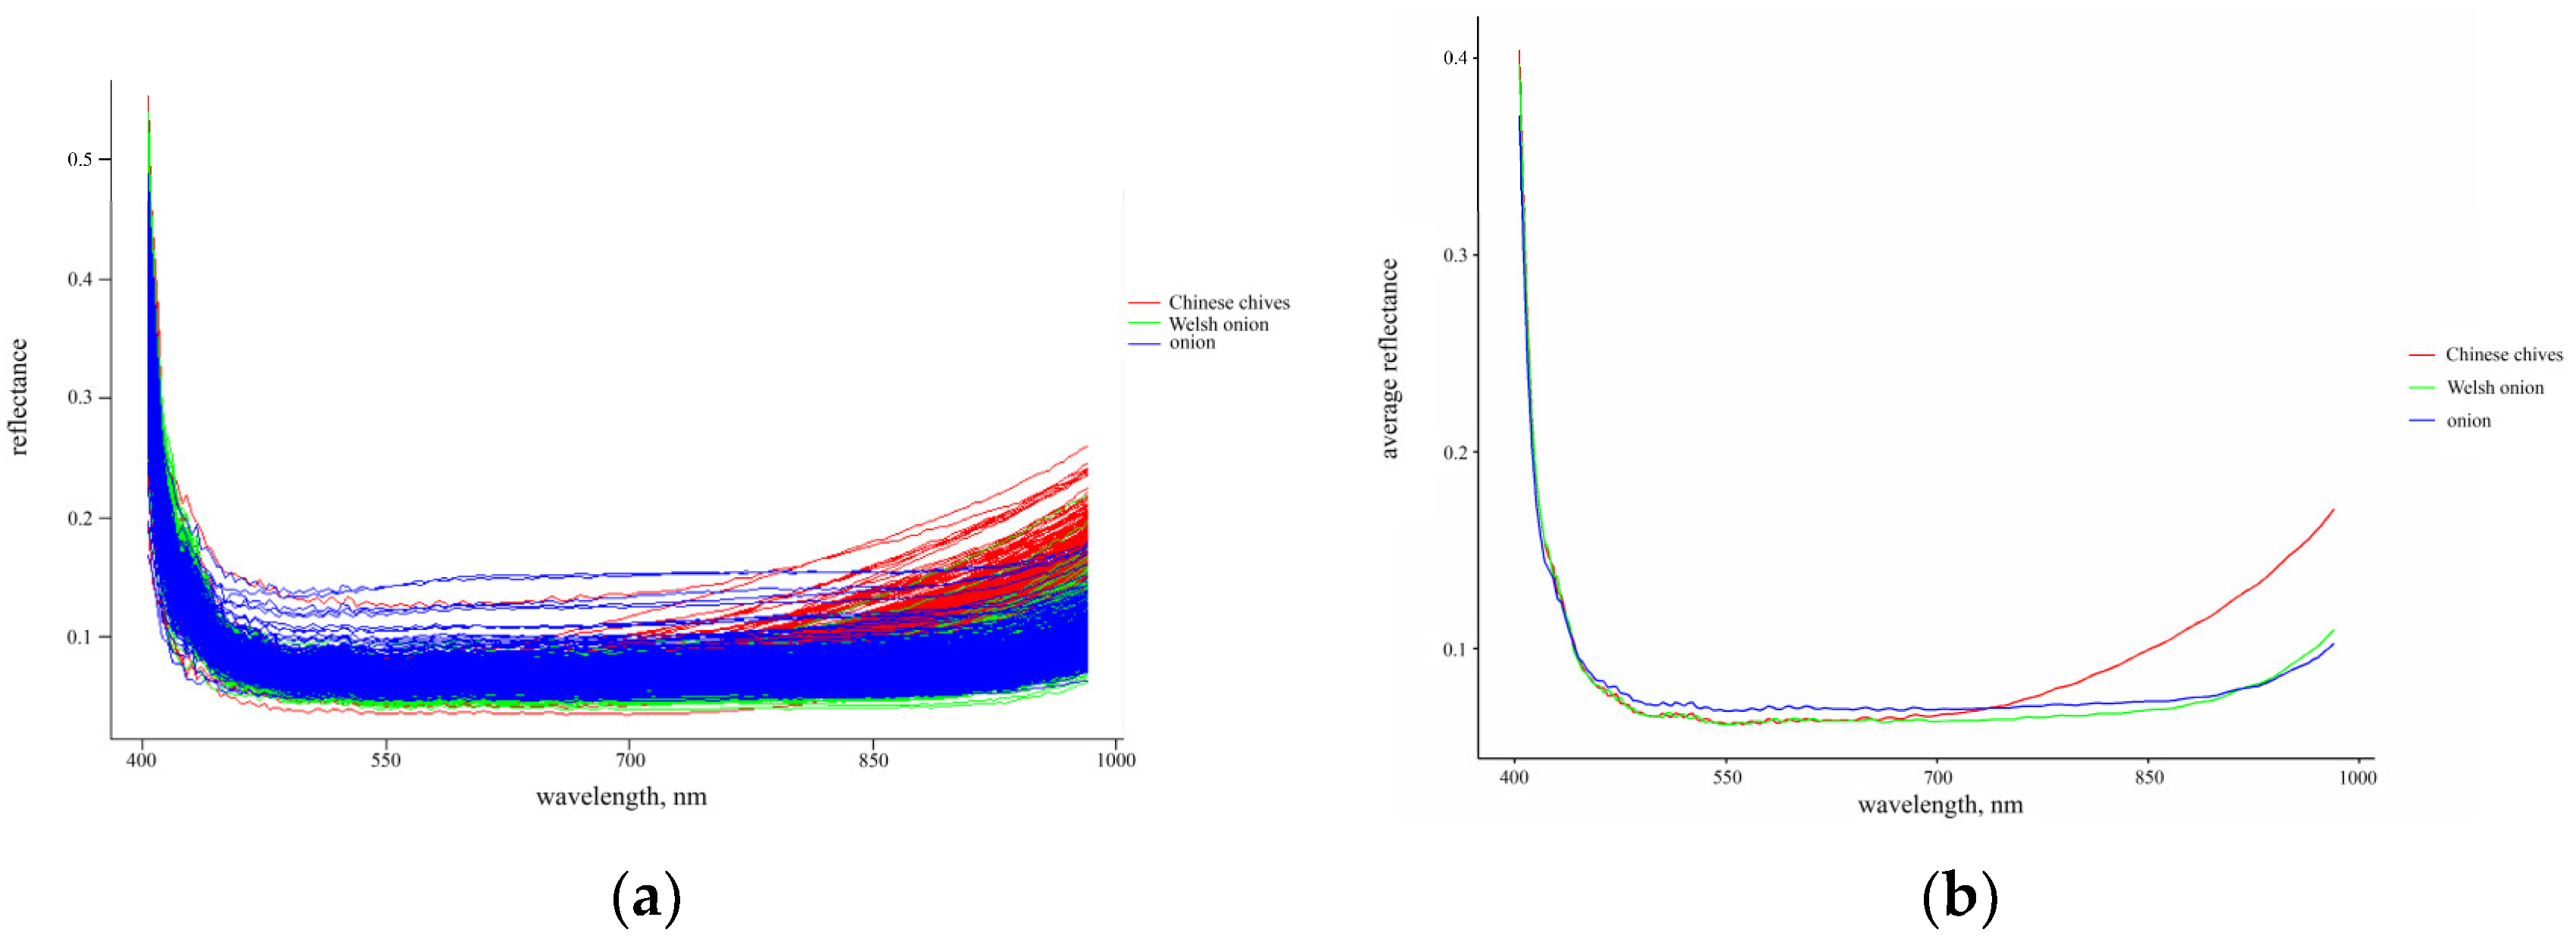
Figure 3a presents the original spectral reflectance images of 1050 distinct samples. The red curve is Chinese chives, the green curve is Welsh onion, and the blue curve is onion. The vertical axis is spectral reflectance, and the horizontal axis is spectral wavelength, ranging from 400 to 1000 nm. The figure reveals that the spectral reflectance curves of all unprocessed data exhibit a similar trend between 400 and 1000 nm. At 700 nm, the curve begins to rise gradually, and the rising trend of Chinese chives is much higher than that of the other two categories. The trend of Welsh onion and onion is the same, but the spectral reflectance distribution of Welsh onion is more extensive, and the overall distribution range is larger than that of onion.
The average spectral curves (
Figure 3b) and the curves of all samples showed a similar trend, but they could better reflect the differences of the three germplasm curves. Between 400 and 700 nm, the spectral curves of Chinese chives and Welsh onion seeds almost overlapped, while the onion seed spectral curve was higher than both. Furthermore, significant differences are observed in the seed curves within the 700 to 1000 nm wavelength range. Between 700 and 1000 nm, the spectral curve of Chinese chives seeds remained consistently higher than those of onion and Welsh onion seeds. Within the 700 to 925 nm range, the onion seed spectral curve was higher than that of Welsh onion seeds; whereas, between 925 and 1000 nm, the spectral curve of Welsh onion seeds surpassed that of onion seeds.
During seed spectral data acquisition, the light source irradiates the seed samples, and various chemical bonds in the seed’s internal tissues absorb a portion of the photon energy. The amount and type of energy absorbed vary depending on the chemical composition [
25]. The fourth overtone absorption region of the C-H bond lies between 720 and 780 nm, while the third overtone absorption region of the C-H bond and the second overtone region of the O-H bond are between 900 and 1000 nm. These spectral intervals may correlate with the content of proteins, starch, and other organic matter in the seed [
26]. Therefore, the 481 to 1000 nm range highlights changes in spectral reflectance caused by variations in pigment and organic matter content. According to the results above, differences are observed in the seed curves of Chinese chives, Welsh onion, and onion between 400 and 1000 nm, particularly in the 700 to 1000 nm range. This suggests that the current experiments, which utilized hyperspectral imaging technology and the 400–1000 nm and 700–1000 nm wavelength ranges, are feasible for nondestructive seed detection.
3.2. Raw Data Preprocessing
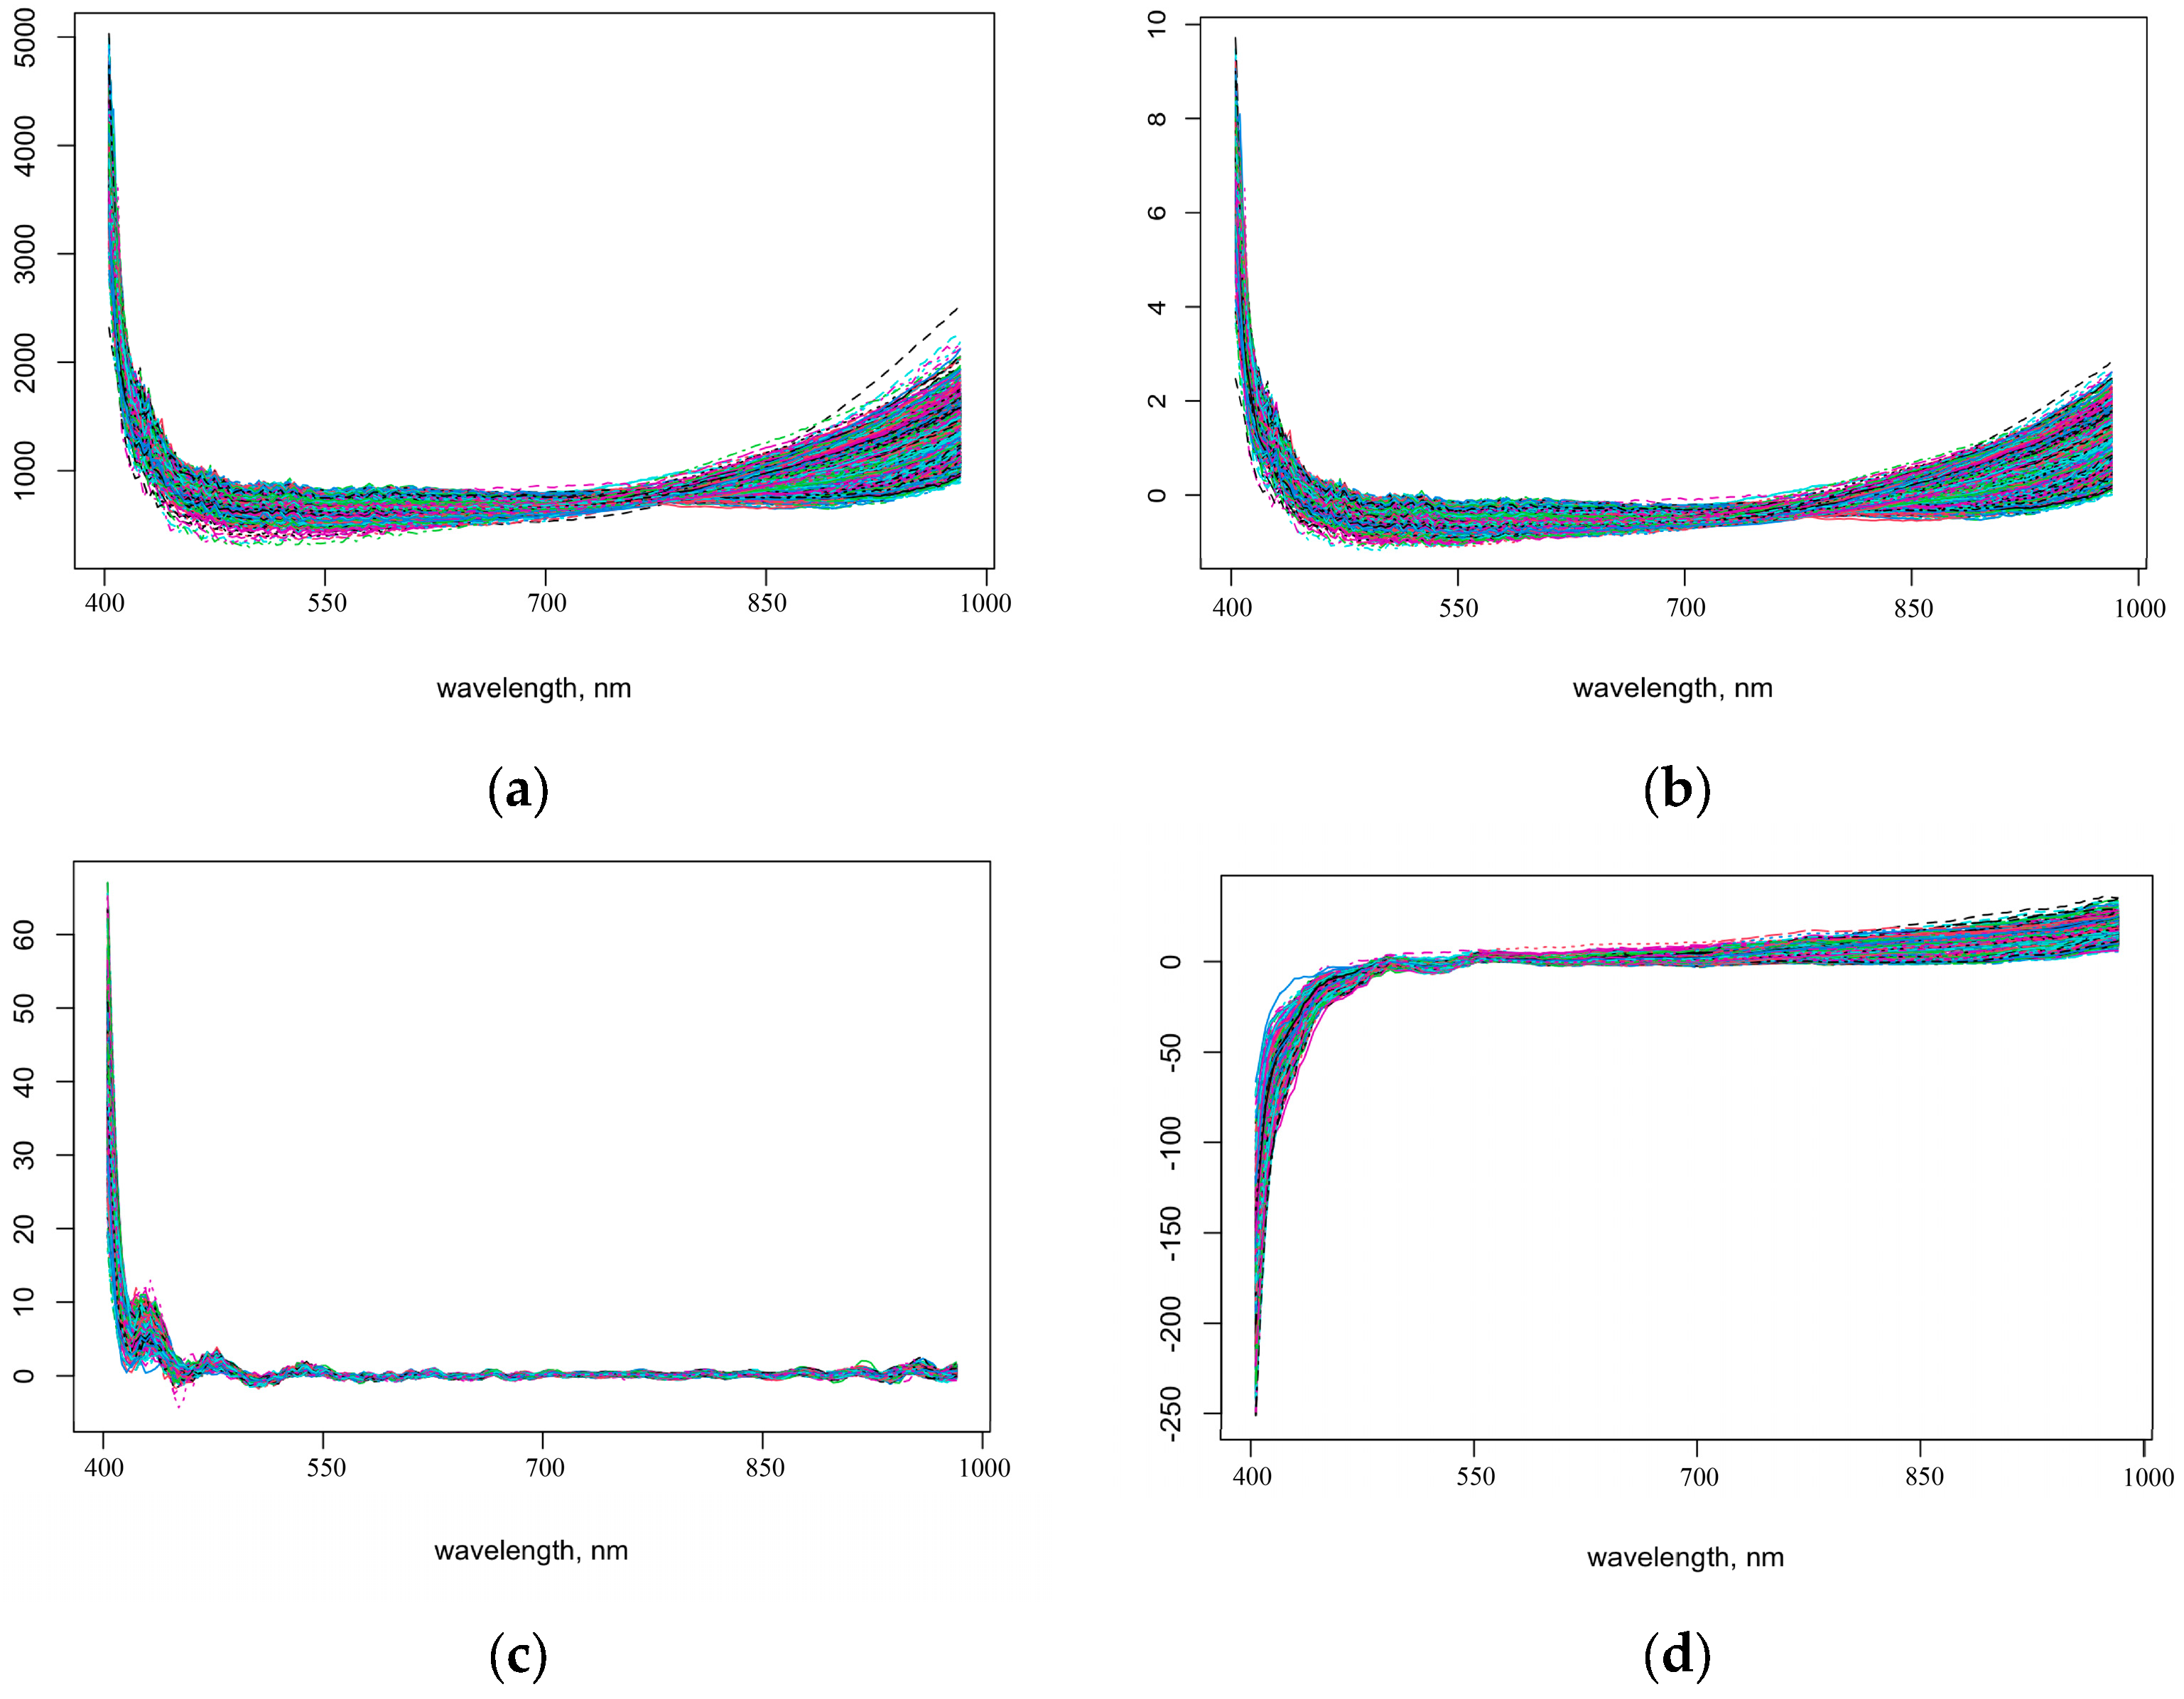
Figure 4a displays the spectral curve of the original spectral reflectance data after MSC. The seed spectral curve exhibits a crossover phenomenon between 700 and 850 nm. Compared to the original spectral curve, it exhibits smoother edges, enhanced smoothing characteristics, and reduced data noise. Increasing the signal-to-noise ratio can improve the model’s performance. The overall trend of the spectral curve after SNV (
Figure 4b) closely resembles that of the MSC spectra. Additionally, it effectively masks smaller peaks caused by noise and varying degrees of reflection from the seed surface. After SD preprocessing of the raw spectral reflectance data, most spectral curves blended in an intermixing phenomenon. However, absorption peaks and valleys in the 400 to 550 nm band remain visible (
Figure 4c). This eliminates baseline skewing during data acquisition and the shifting caused by scattered light when obtaining reflectance values. The image of the spectral curve after FD preprocessing is significantly altered (
Figure 4d). The figure shows that the spectral curve exhibits a significant upward trend in the 400 to 550 nm band, while the curve in the 550 to 1000 nm range is relatively flat. Notably, the curve aggregation phenomenon is more pronounced in the 550 to 700 nm range.
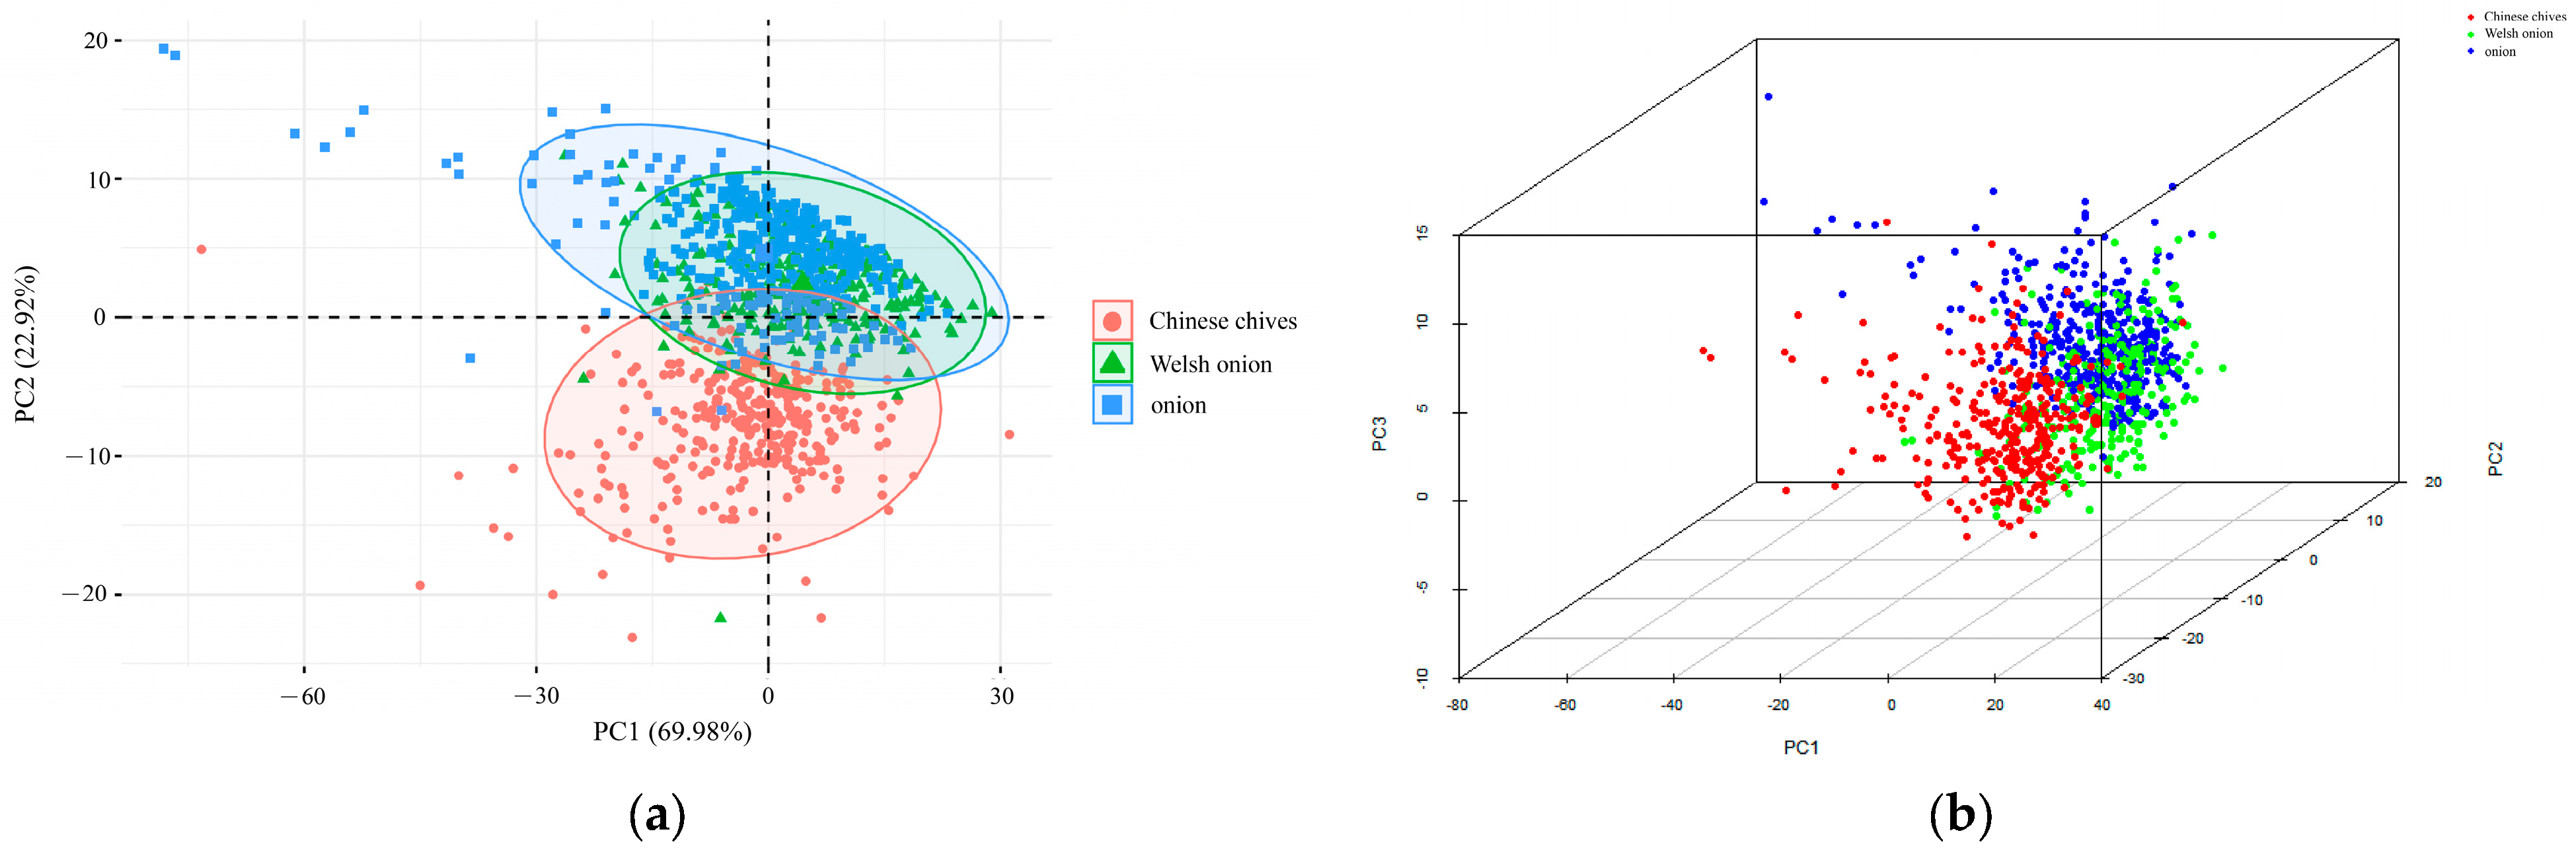
3.3. The Results of Principal Component Analysis
Figure 5a shows the two-dimensional scatter plots of the first two principal components derived from the seed spectral data. PCA results show that the cumulative contribution of PC1 and PC2 to the spectral data exceeds 90%, indicating that PC1 and PC2 account for the majority of the variables. The scatter plot displays varying degrees of clustering based on PC1 and PC2. However, some overlap is observed. Through the three-dimensional plot (
Figure 5b), it becomes evident that despite the overlap between Welsh onion and onion, there are discernible distinctions along the PC3 dimension. These nuances allow for the differentiation of the three seed types based on their unique characteristics within this multi-dimensional space.
3.4. Classification Model Results Based on the 400–1000 nm Region Data
In this experiment, the original spectral data ranging from 400 to 1000 nm, along with five different pretreatment datasets, were used as input for the models. KNN, RF, PLS-DA, and SVM classification models were employed to train models for identifying Welsh onion, onion, and Chinese chives.
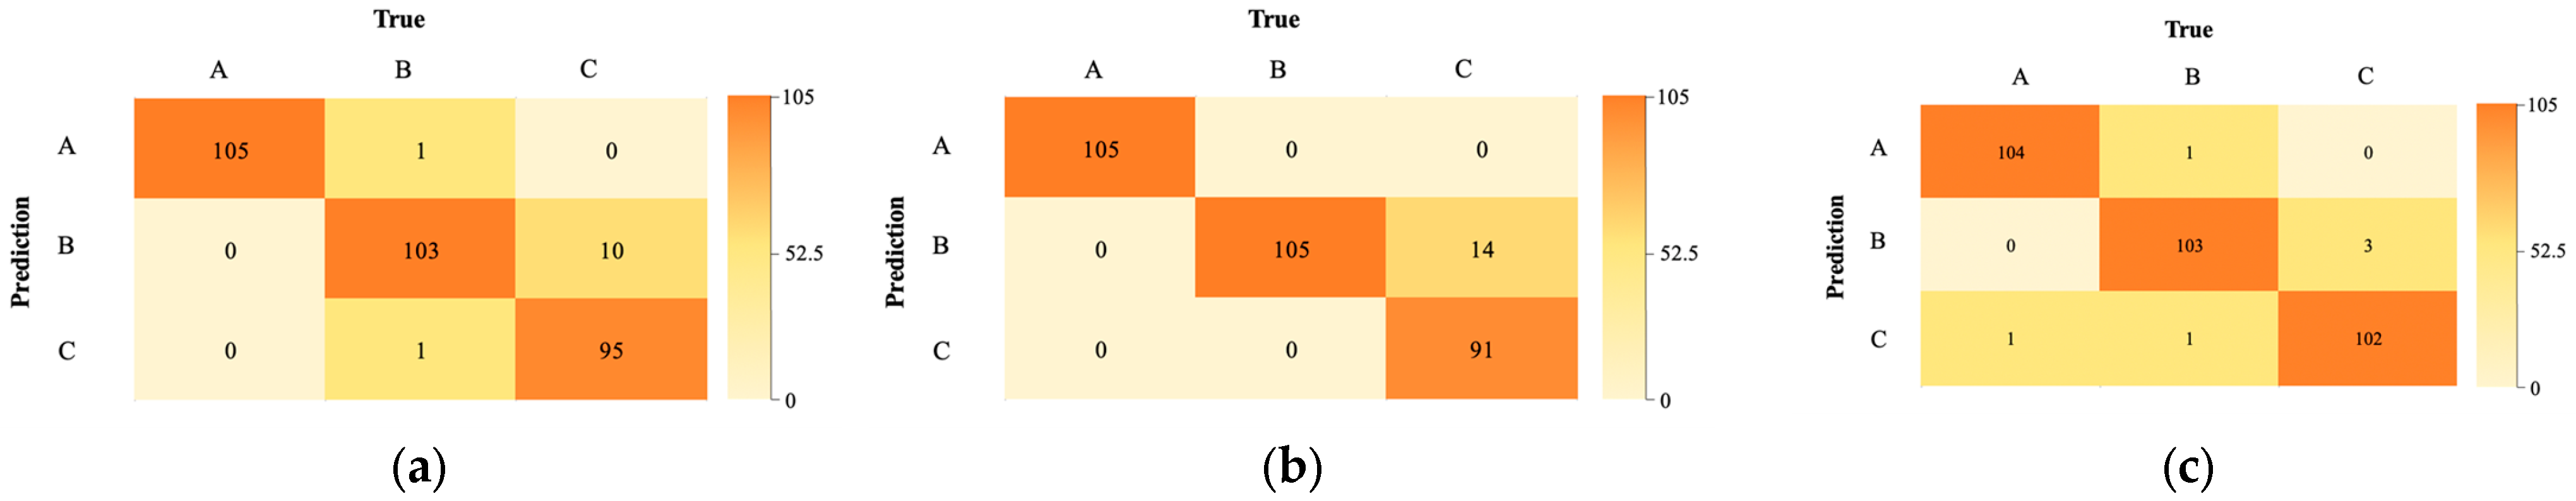
Among the KNN models, the one after SD preprocessing exhibited the highest accuracy (
Table 2), achieving a prediction accuracy of 96% and an F1 coefficient of 0.96. The model’s confusion matrix results (
Figure 6a) indicate that it can accurately identify Chinese chives seeds, with a prediction precision of 98% for Welsh onion seeds and 90% for onion seeds. The results also indicated that, unlike PCA preprocessing, the other four preprocessing methods effectively improved model prediction accuracy.
The modeling for the RF algorithm and the prediction accuracy of the RF model based on different preprocessing methods are shown in
Table 2 below. The highest prediction accuracy in the model set is achieved by the RF model after SD preprocessing, achieving a prediction accuracy of 96% and an F1 coefficient of 0.96. The model’s confusion matrix results (
Figure 6b) indicate that it can accurately classify Chinese chives seeds and Welsh onion seeds.
The model was established based on the PLS-DA algorithm (PLS-DA model for short), and the model prediction accuracies for various preprocessing methods are shown in
Table 2. Among these, the PLS-DA model using raw data as input achieved the highest prediction accuracy of 98%, with an F1 coefficient of 0.98. The results from its model confusion matrix (
Figure 6c) indicate that the model achieved 99% precision for identifying Chinese chives seeds, and 98% and 97% for identifying Welsh onion and onion seeds, respectively. This demonstrates the strong performance of the model in identifying all three seed types.
The SVM algorithm was employed to establish the model (referred to as the SVM model), with the kernel functions of the SVM set to linear kernel function (Linear), polynomial kernel function (Polynomial), radial basis function (Radial), and Sigmoid kernel function (Sigmoid), respectively, with their respective optimal parameters selected. The results (
Table 3) indicate that the Linear-SVM model established using both the original spectral data and data after FD preprocessing achieved the best prediction performance, achieving an accuracy of 98% in the model test set, enabling rapid and nondestructive identification of Welsh onion, onion, and Chinese chives seeds.
Based on the results of the model’s confusion matrix (
Figure 7), it can be concluded that the Original-Linear-SVM model (
Figure 7a) and the FD-Linear-SVM model (
Figure 7b) accurately classify Chinese chives seeds and Welsh onion seeds. Both models achieved 100% prediction precision for classifying Chinese chives seeds. For classifying Welsh onion seeds, the FD-Linear-SVM model exhibited higher prediction precision than the Original-Linear-SVM model; in classifying onion seeds, the Original-Linear-SVM model demonstrated higher prediction precision than the FD-Linear-SVM model.
3.5. Classification Model Results Based on the 700–1000 nm Region Data
Based on the raw spectral images, we concluded that the seed reflectance exhibits significant variation in values between 700 and 1000 nm, leading to the conclusion that utilizing reflectance values between 700 and 1000 nm would be a more effective approach for building the seed classification model. Using the same method as described above, the original spectral data and five different preprocessed datasets were used as inputs to train models for identifying Welsh onion, onion, and Chinese chives seeds.
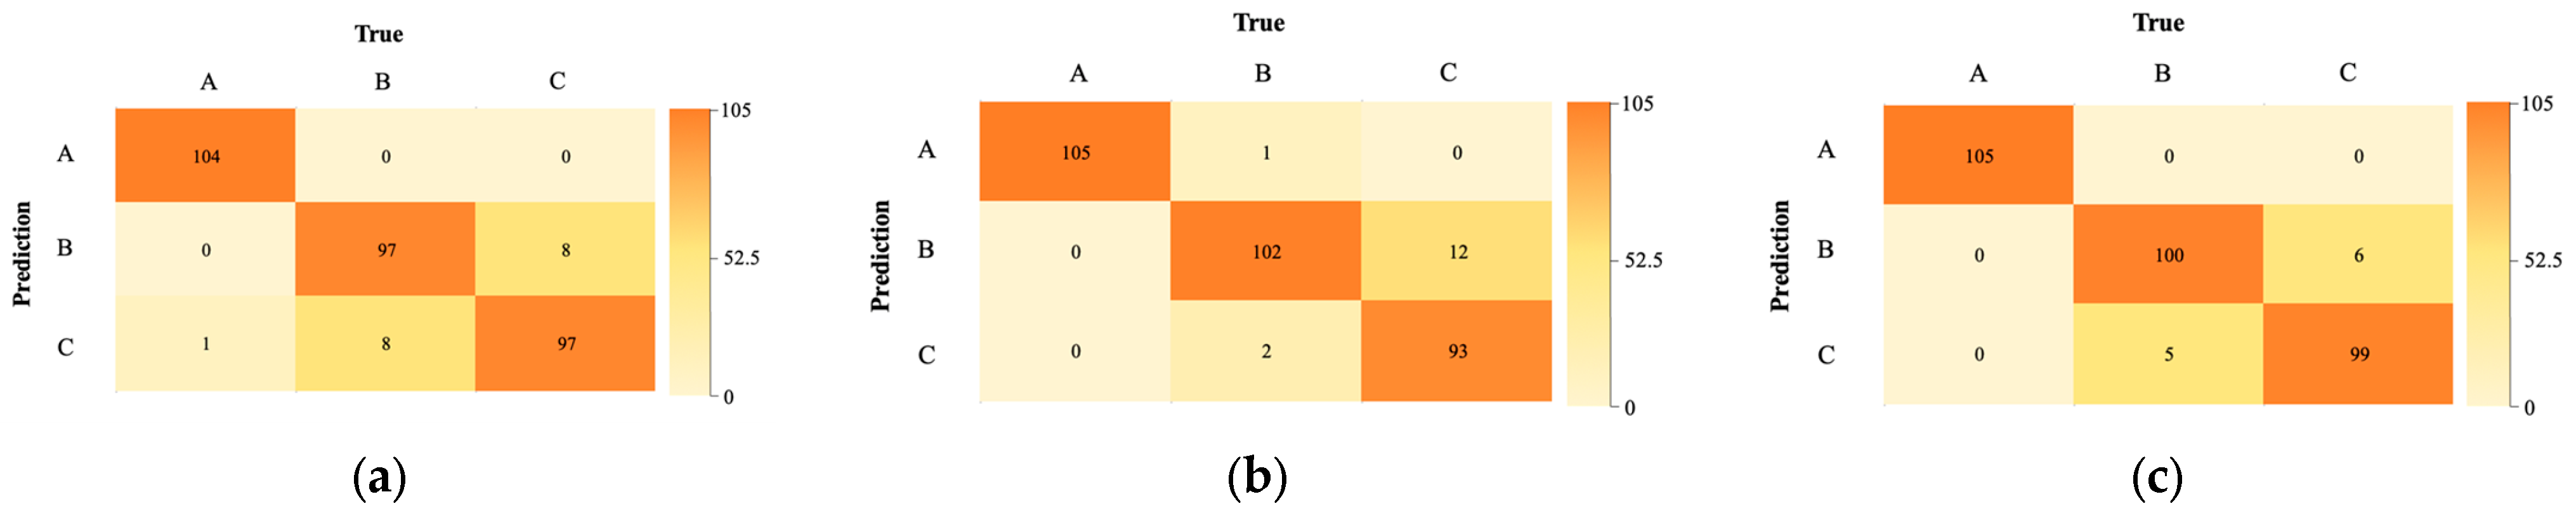
The KNN model after SD preprocessing achieved the highest prediction accuracy among the KNN models, with a prediction accuracy of 95% and an F1 coefficient of 0.95. The optimal parameter value for k in the model was 4 (
Table 4). The confusion matrix (
Figure 8a) revealed that this model achieved a prediction precision of 98% for classifying Chinese chives seeds. The results also demonstrated that the five preprocessing methods effectively improved the model’s accuracy. Overall, the model’s prediction accuracy exceeded 90%, indicating that the existing model is suitable for identifying seed categories.
When Random Forest (RF) was employed as the modeling algorithm, the RF model, following SD preprocessing, achieved the highest prediction accuracy, with an impressive prediction accuracy of 95% and an F1 coefficient of 0.95 (
Table 4). The confusion matrix results (
Figure 8b) demonstrated that the model accurately classified Chinese chives seeds and effectively classified Welsh onion seeds with a precision of 97%, but classified onion seeds with a lower precision of only 88%.
When the Partial Least Squares Discriminant Analysis (PLS-DA) modeling algorithm was employed, the model with the highest accuracy was achieved using the Random Forest (RF) algorithm, with raw data as the input, yielding a remarkable prediction accuracy of 97% and an F1 coefficient of 0.96 (
Table 4). The confusion matrix of this model (
Figure 8c) revealed that the model accurately classified Chinese chives seed categories, achieving a perfect identification precision of 100%, while it also achieved 95% and 94% precision for the identification of onion and Welsh onion seeds, respectively. Overall, this model demonstrated strong effectiveness in accurately identifying the three types of seeds.
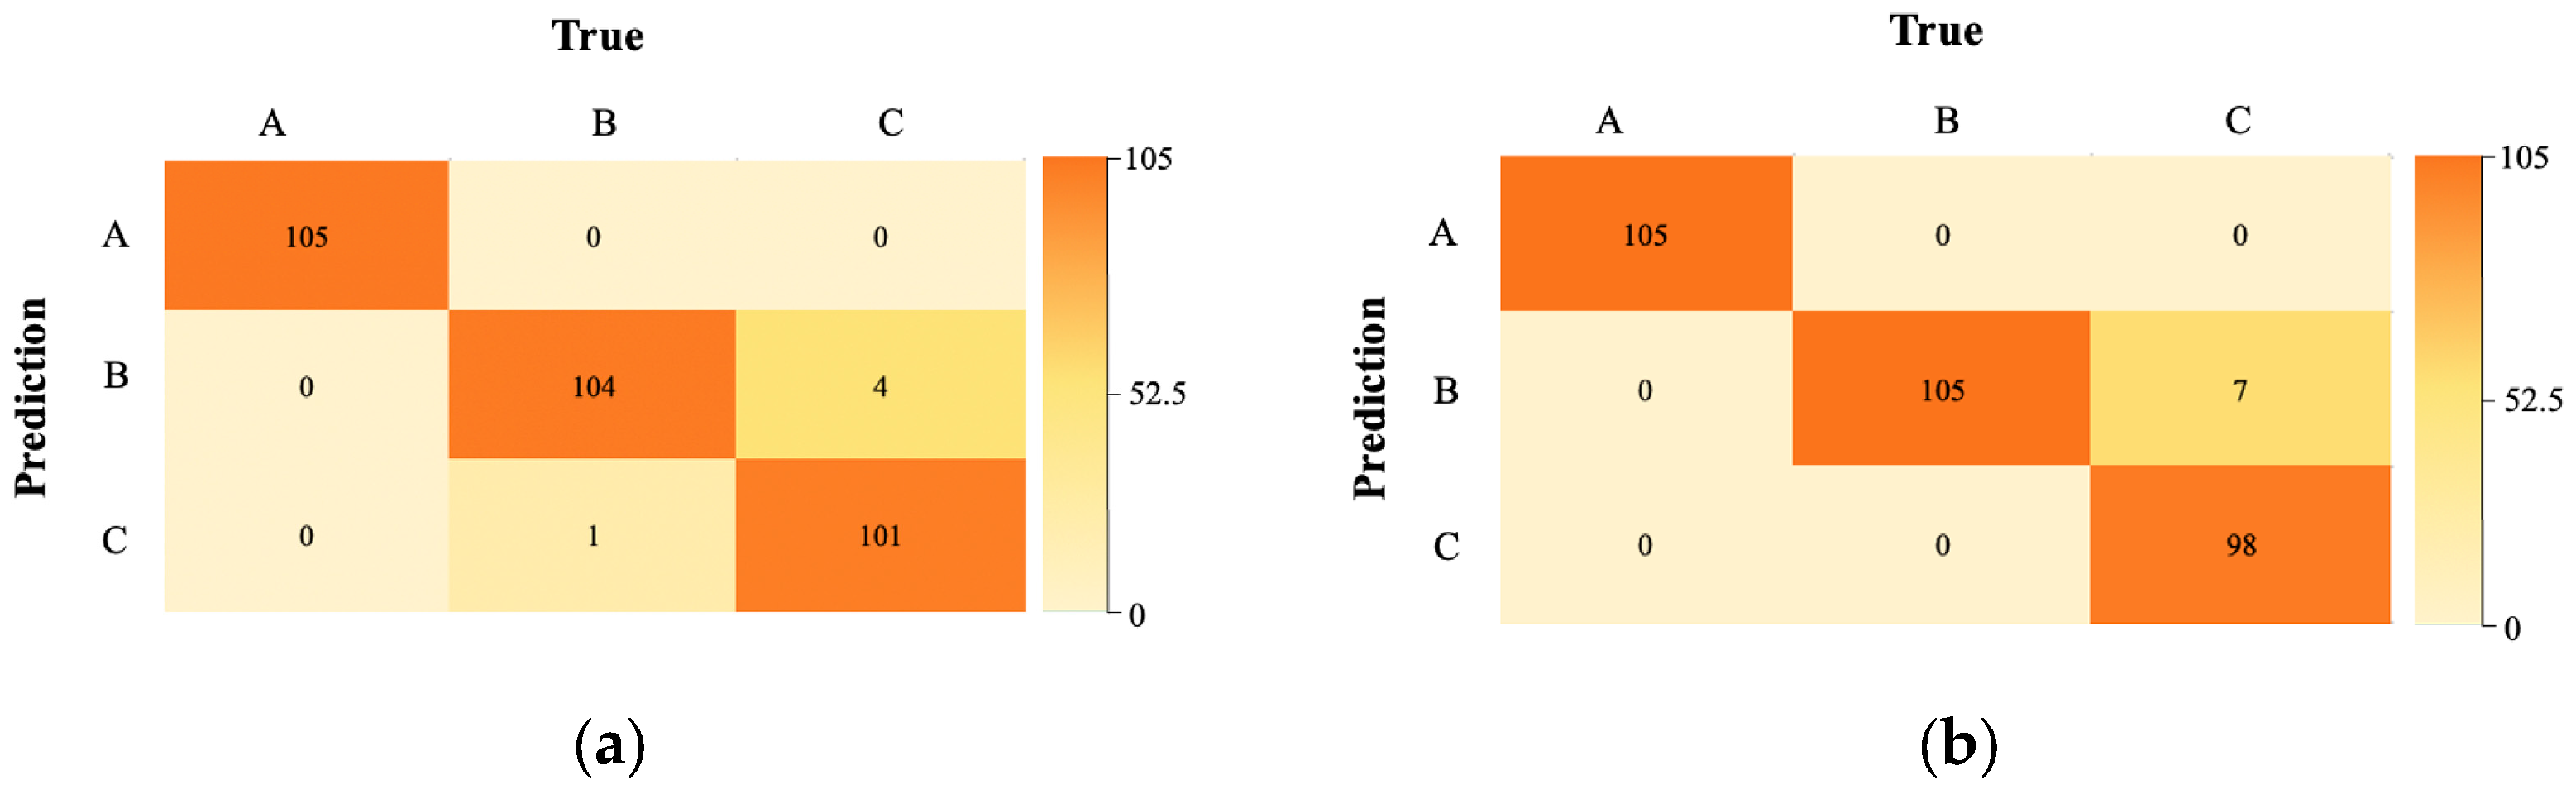
Among the Support Vector Machine (SVM) modeling algorithms, both the Original-Linear-SVM and Original-Polynomial-SVM models achieved 97% accuracy on the test set, with an F1 coefficient of 0.96 (
Table 5). This suggests that the predicted values align well with the spectral data and that it enables the rapid, non-destructive identification of Chinese chives, Welsh onion, and onion seeds. The accuracy decreased by 0.01 percentage points compared to the model based on the 400–1000 nm data.
The confusion matrix results for the Original-Linear-SVM model (
Figure 9a) demonstrate 100% classification precision for Chinese chives seeds, 97% for Welsh onion seeds, and 92% for onion seeds. The confusion matrix results for the Original-Polynomial-SVM model (
Figure 9b) show 100% classification precision for Chinese chives seeds, 97% for Welsh onion seeds, and 92% for onion seeds. Both models achieved 100% prediction precision for Chinese chives seed classification.
3.6. Evaluation of Classification Model Results Based on 400–1000 nm and 700–1000 nm
We compared the best classification models derived from different preprocessing and classification methods, and the results (
Table 6) indicated that, at wavelengths of 400–1000 nm, the Original-PLS-DA, Original-Linear-SVM, and FD-Linear-SVM models achieved the highest accuracies. The precision of the Original-PLS-DA model for identifying Chinese chives, Welsh onion, and onion seeds was 99%, 98%, and 97%, respectively. This indicates that the model was effective in identifying all three seed types. The precision of the FD-Linear-SVM model for identifying Chinese chives, Welsh onion, and onion seeds was 99%, 98%, and 97%, respectively, and the precision of the Original-Linear-SVM model for identifying Chinese chives, Welsh onion, and onion seeds was 100%, 100%, and 98%, respectively. Therefore, the FD-Linear-SVM model performed best for classifying Chinese chives and Welsh onion seeds. The Original-PLS-DA model achieved the highest prediction precision when classifying onion seeds. However, the Original-Linear-SVM and FD-Linear-SVM models took 8–9 s longer to run than the Original-PLS-DA model.
The results for the wavelength range of 700–1000 nm (
Table 6) show that both the Original-Linear-SVM and Original-Polynomial-SVM models achieved a maximum overall prediction accuracy of 97%, with an F1 score of 0.96 for both. The Original-Linear-SVM model achieved a precision of 100%, 97%, and 92% for identifying Chinese chives, Welsh onion, and onion seeds, respectively, demonstrating effective differentiation of the three seed types. The FD-Polynomial-SVM model achieved a precision of 100%, 97%, and 92% for identifying Chinese chives, Welsh onion, and onion seeds, respectively. Both models achieved 100% prediction precision in classifying Chinese chives seeds.
Among the species identification models in this study, models constructed using 400–1000 nm spectral data generally demonstrated higher accuracy than those utilizing 700–1000 nm spectral data, although the prediction accuracy of both models was relatively similar. Hyperspectral data is characterized by large volumes of data and inherent information redundancy. The 700–1000 nm spectral data, which contains only 97 bands, reduces data volume, enhancing model runtime.
4. Conclusions
This study examined the impact of hyperspectral imaging on seed classification, as well as the spectral characteristics of Chinese chives, onion, and Welsh onion, which share similar appearances, and analyzed the construction and evaluation of their classification models. Through a detailed analysis of the spectral data from 1050 seed samples, the following conclusions are drawn.
By applying various preprocessing techniques to the original spectral data (e.g., MSC, SNV, SD, FD), we observed that the SD preprocessing method significantly enhanced the model’s prediction accuracy. Among all the classification models evaluated, the KNN, RF, PLS-DA, and SVM models demonstrated high accuracy after SD preprocessing, with the accuracy of the SD-KNN and SD-RF models exceeding 96%, highlighting the advantage of preprocessing in enhancing the signal-to-noise ratio.
During the evaluation of various classification models, both the PLS-DA and SVM models performed effectively, particularly when applied to raw spectral data, with the PLS-DA model achieving an accuracy of 98%. The SVM model, specifically the FD-Linear-SVM, performed exceptionally well in seed classification, achieving 100% precision for Chinese chives seeds, and also demonstrated strong performance in classifying the other two seed types. These results indicate that both the PLS-DA and SVM models exhibit high accuracy in hyperspectral data-driven seed classification tasks.
A comparison of the models using the 400–1000 nm and 700–1000 nm wavelength range data reveals that although the 400–1000 nm range model demonstrates slightly higher accuracy, the data processing for the 700–1000 nm range is more straightforward, thereby reducing data redundancy and enhancing computational efficiency. Consequently, data in the 700–1000 nm band also demonstrates high effectiveness for use in practical applications, particularly in scenarios that require a rapid response.
In conclusion, the nondestructive testing of various seed types is effectively achieved using hyperspectral imaging technology in this study. Proper data preprocessing and the selection of an appropriate classification model are essential for enhancing model prediction accuracy particularly when combined with SD preprocessing and a suitable classification model, classification performance can be significantly enhanced.
At the same time, it is observed that the peak accuracy rates achieved by the various combinations of preprocessing and classification models do not significantly differ from one another. This observation can be attributed to the inherent limitations of the models themselves. It may also stem from the fact that when multiple preprocessing techniques are employed to eliminate background noise and redundant information, the distinctions between the different methods become less pronounced. Essentially, what remains is the spectral data that most effectively discriminates between the various Allium L. seed categories. In the future, we intend to explore the integration of multiple preprocessing techniques, recognizing that reliance on a single method may not yield the most pronounced outcomes. We aim to identify the nuances between different combinations to pinpoint the optimal model, thereby offering significant assistance in the classification of Allium seeds.
This study also has certain limitations. While controlled laboratory conditions ensured precise spectral data acquisition by minimizing environmental interference, such rigorous parameter management may not fully represent real-world agricultural scenarios. Practical seed production faces inherent challenges, including uncontrolled field humidity, diurnal temperature fluctuations during maturation, and variable storage conditions—factors that could introduce spectral variability and classification errors. Furthermore, the current models require validation in operational field environments where dynamic factors like soil particulates and ambient light interference may necessitate adaptive preprocessing. Future work should prioritize field trials under diverse storage and cultivation conditions while developing environmental compensation algorithms to enhance the robustness of hyperspectral classification systems.
Future research endeavors should be directed towards refining the optimization strategies for the wavelength range and preprocessing techniques of spectral data, specifically tailored to diverse practical application scenarios. It is imperative to delve deeper into the influence of environmental factors on seed classification. By adopting more efficient and precise classification algorithms, we aim to address the issue of seed misidentification in agricultural production, thereby mitigating the prevalence of counterfeit and substandard seeds, as well as defective seed quality. Ensuring the enhancement of agricultural production quality, we are committed to bolstering agricultural safety, elevating seed quality standards, and safeguarding the interests of farmers, thereby providing them with a reliable layer of protection.
Author Contributions
Conceptualization, H.W. and D.Z.; methodology, H.W. and D.Z.; validation, S.Z. and D.Z.; formal analysis, D.Z.; investigation, S.Z. and D.Z.; resources, H.W.; data curation, D.Z.; writing—original draft preparation, S.Z. and D.Z.; writing—review and editing, H.W.; supervision, H.W., J.S., H.J., X.Z. and W.Y.; project administration, H.W.; funding acquisition, H.W. All authors have read and agreed to the published version of the manuscript.
Funding
This work was financially supported by the National Modern Agricultural Industry Technology System Construction Special Fund Project (CARS-24-A-01), Natural Science Foundation of China (32172566, 32272731, 31872946), Innovation Engineering Project of Chinese Academy of Agricultural Sciences (CAAS-ASTIP-2021-IVF), Safe Preservation Project Of Crop Germplasm Resources of MOF (2024NWB037), National Horticultural Germplasm Repository Beijing Vegetable Subcenter Operational Service Project, Observation and Monitoring Mission Project of National Crop Germplasm Resources Data Center (ZX01NK-03).
Institutional Review Board Statement
Not applicable.
Data Availability Statement
The original contributions presented in this study are included in the article. Further inquiries can be directed to the corresponding author.
Conflicts of Interest
The authors declare no conflicts of interest.
Abbreviations
The following abbreviations are used in this manuscript:
| SNV | Standard Normal Variable |
| MSC | Multivariate Scattering Correction |
| FD | First-Order Differential |
| SD | Second-Order Differential |
| PCA | Principal Component Analysis |
| PLS-DA | Partial Least Squares Discriminant Analysis |
| SVM | Support Vector Machine |
| RF | Random Forest |
| KNN | k-Nearest Neighbor |
References
- Ba, T.; Liu, E. Conservation of Vegetable Germplasm Resources and Vegetable Breeding. Contemp. Hortic. 2015, 210. [Google Scholar] [CrossRef]
- Wang, Y. How to Identify Welsh Onion, Onion, Chinese Chives Seeds. Rich World 2005, 30. [Google Scholar]
- Li, S.; Wang, J.; Luo, Y. Problems and solutions in the production of garlic chives (Allium tuberosum). Mod. Agric. 2003, 17. [Google Scholar]
- Liu, Y.; Li, C. Research on Seed Security in China Under a Holistic Approach to National Security: Current Situation, Problems and Approaches. J. Northwest A&F Univ. Soc. Sci. Ed. 2022, 22, 16–26. [Google Scholar] [CrossRef]
- Wei, Y.; Shao, A.; Cheng, M.; Fu, G.; Chen, M.; Lin, S. Macroscopic and Microscopic Identification of Seeds of Allium fistulosum L. and Allium tuberosum Rottl. ex Spreng. Mod. Chin. Med. 2012, 14, 20–22. [Google Scholar] [CrossRef]
- Li, Z.; Zhao, X.; Zhang, R.; Zou, R. Quality Assessment of Forest Tree Seeds. Shanxi For. Sci. Technol. 2016, 45, 55–56. [Google Scholar]
- Gao, T.; Chandran, A.K.N.; Paul, P.; Walia, H.; Yu, H. HyperSeed: An End-to-End Method to Process Hyperspectral Images of Seeds. Sensors 2021, 21, 8184. [Google Scholar] [CrossRef]
- Lin, Z.; Liu, H.; Wei, H.; Ma, Z.; Chu, X. Detection of Moisture Content in S. funghomii McClure Based on Hyperspectral Imaging Technology. Mod. Agric. Equip. 2024, 45, 2–9. [Google Scholar]
- Wang, J.; Sun, H.; Ma, P.; Liu, Y.; Zhang, D. SVM nutrient element deficit identification of potato plants based on hyperspectral analysis. China Meas. Test 2023, 49, 141–149. [Google Scholar]
- Bao, H.; Huang, L.; Zhang, Y.; Pang, H. Progress in Biochemistry and Biophysics. Prog. Biochem. Biophys. 2025, 52, 513–524. [Google Scholar] [CrossRef]
- Wei, Y.; Li, X.; Pan, X.; Li, L. Nondestructive Classification of Soybean Seed Varieties by Hyperspectral Imaging and Ensemble Machine Learning Algorithms. Sensors 2020, 20, 6980. [Google Scholar] [CrossRef] [PubMed]
- Xu, S.; Zhao, G.; Deng, F.; Qi, H. Research on Detection Technology of Rice Seed Vigor Based on Hyperspectral. Seed 2016, 35, 34–40. [Google Scholar] [CrossRef]
- Ansari, N.; Ratri, S.S.; Jahan, A.; Ashik-E-Rabbani, M.; Rahman, A. Inspection of Paddy Seed Varietal Purity Using Machine Vision and Multivariate Analysis. J. Agric. Food Res. 2021, 3, 100109. [Google Scholar] [CrossRef]
- Song, S.; Dong, Z.; Wu, Y. Based on the RF algorithm and hyperspectral information of waxy corn leaves, the classification and identification of corn varieties. Agric. Technol. 2024, 44, 51–55. [Google Scholar] [CrossRef]
- Yang, Y.; Xu, X.; Xue, H.; Zhang, N.; Zhang, Y.; Suo, K. Research on peanut hyperspectral image classification method based on SPA-PSO-BP. Laser Technol. 2024, 48, 556–564. [Google Scholar]
- Huang, H. The Application of Hyperspectral Imaging Technology in the Research on the Classification and Detection of Rice Seeds. Rural Sci. Technol. 2022, 13, 79–81. [Google Scholar] [CrossRef]
- Identification Techniques for Green Onion, Onion, and Chive Seeds. Agric. Sci.-Technol. Inf. 2013, 41.
- Da, S.; Wu, D.; Huang, R.; Liu, J.; Qiao, F.; Wei, F.; Lian, C.; Zheng, J. Rapid and Non-Destructive Determination of Wuwei Qingzhuo Preparation Based on Hyperspectral Technology. Mod. Chin. Med. 2024, 26, 1–14. [Google Scholar] [CrossRef]
- Gerretzen, J.; Szymańska, E.; Jansen, J.J.; Bart, J.; Van Manen, H.-J.; Van Den Heuvel, E.R.; Buydens, L.M.C. Simple and Effective Way for Data Preprocessing Selection Based on Design of Experiments. Anal. Chem. 2015, 87, 12096–12103. [Google Scholar] [CrossRef]
- Zhang, Z.; Gu, H.; Xie, K.; Jiang, H.; Xie, Q.; Sa, J. Pretreatment and Combined Method Based on Near Infrared Spectro. Laser Optoelectron. Prog. 2021, 58, 1617001. [Google Scholar] [CrossRef]
- Isaksson, T.; Næs, T. The Effect of Multiplicative Scatter Correction (MSC) and Linearity Improvement in NIR Spectroscopy. Appl. Spectrosc. 1988, 42, 1273–1284. [Google Scholar] [CrossRef]
- Xu, L.; Chen, Y.; Wang, X.; Chen, H.; Tang, Z.; Shi, X.; Chen, X.; Wang, Y.; Kang, Z.; Zou, Z.; et al. Non-Destructive Detection of Kiwifruit Soluble Solid Content Based on Hyperspectral and Fluorescence Spectral Imaging. Front. Plant Sci. 2023, 13, 1075929. [Google Scholar] [CrossRef]
- Barnes, R.J.; Dhanoa, M.S.; Lister, S.J. Correction to the Description of Standard Normal Variate (SNV) and De-Trend (DT) Transformations in Practical Spectroscopy with Applications in Food and Beverage Analysis—2nd Edition. J. Infrared Spectrosc. 1993, 1, 185–186. [Google Scholar] [CrossRef]
- Sharma, S.; Sumesh, K.C.; Sirisomboon, P. Rapid Ripening Stage Classification and Dry Matter Prediction of Durian Pulp Using a Pushbroom Near Infrared Hyperspectral Imaging System. Measurement 2022, 189, 110464. [Google Scholar] [CrossRef]
- Cui, S.; Ling, P.; Zhu, H.; Keener, H. Plant Pest Detection Using an Artificial Nose System: A Review. Sensors 2018, 18, 378. [Google Scholar] [CrossRef]
- Lee, L.; Liong, C.-Y. Effects of Data Pre-Processing Methods on Classification of ATR-FTIR Spectra of Pen Inks Using Partial Least Squares-Discriminant Analysis (PLS-DA). Chemom. Intell. Lab. Syst. 2018, 182, 90–100. [Google Scholar] [CrossRef]
- Mavroforakis, M.E.; Theodoridis, S. A Geometric Approach to Support Vector Machine (SVM) Classification. IEEE Trans. Neural Netw. 2006, 17, 671–682. [Google Scholar] [CrossRef]
- Tian, H. Model for Gear Fault Diagnosis Based on a Hybrid Algorithm-Optimized SVM Multi-Classifier. New Technol. New Prod. China 2023, 1–5. [Google Scholar] [CrossRef]
- Yang, J.; Qiao, P.; Li, Y.; Wang, N. Review of Machine Learning Classification Problems and Algorithms. Stat. Decis. 2019, 35, 36–40. [Google Scholar] [CrossRef]
- Sarker, I.H. Machine Learning: Algorithms, Real-World Applications and Research Directions. SN Comput. Sci. 2021, 2, 160. [Google Scholar] [CrossRef]
- Lv, H.; Feng, Q. A review of random forests algorithm. J. Hebei Acad. Sci. 2019, 36, 37–41. [Google Scholar] [CrossRef]
- Lee, L.C.; Liong, C.-Y.; Jemain, A.A. Partial Least Squares-Discriminant Analysis (PLS-DA) for Classification of High-Dimensional (HD) Data: A Review of Contemporary Practice Strategies and Knowledge Gaps. Analyst 2018, 143, 3526–3539. [Google Scholar] [CrossRef] [PubMed]
- Xu, H.; Sun, W.; Du, Y.; Wang, A. Survey on the Classic Machine Learning Algorithms and Their Applications. Comput. Knowl. Technol. 2020, 16, 17–19. [Google Scholar] [CrossRef]
| Disclaimer/Publisher’s Note: The statements, opinions and data contained in all publications are solely those of the individual author(s) and contributor(s) and not of MDPI and/or the editor(s). MDPI and/or the editor(s) disclaim responsibility for any injury to people or property resulting from any ideas, methods, instructions or products referred to in the content. |
© 2025 by the authors. Licensee MDPI, Basel, Switzerland. This article is an open access article distributed under the terms and conditions of the Creative Commons Attribution (CC BY) license (https://creativecommons.org/licenses/by/4.0/).


