Article

Optimizing Spray Technology and Nitrogen Sources for Wheat Grain Protein Enhancement

by
S. O. Abiola
,
R. Sharry
,
J. Bushong
and
D. B. Arnall
*
Department of Plant and Soil Sciences, Ferguson College of Agriculture, Oklahoma State University, Stillwater, OK 74078, USA
*
Author to whom correspondence should be addressed.
Agriculture 2025, 15(8), 812; https://doi.org/10.3390/agriculture15080812
Submission received: 19 March 2025 / Revised: 4 April 2025 / Accepted: 7 April 2025 / Published: 9 April 2025

Abstract

:
Increasing wheat (Triticum aestivum L.) grain protein concentration (GPC) without excessive nitrogen (N) inputs requires understanding the interactions between N source characteristics and application technology parameters. This study evaluated the effects of foliar N applications at anthesis on wheat grain yield and GPC across three locations over three growing seasons in Oklahoma. Treatments consisted of two N sources (urea-ammonium nitrate [UAN] and aqueous urea [Aq. urea]), three nozzle types (flat fan [FF], 3D, and twin [TW]), and two droplet types (fine and coarse). Late foliar applications increased GPC by 12% without affecting grain yield (0.5–5.8 Mg ha−1). During the 2020–21 growing season, a late season freeze during anthesis resulted in no significant differences in GPC across locations. UAN produced significantly higher GPC (13.7%) than Aq. urea (13.1%). Among nozzle types, the 3D nozzle consistently produced the highest GPC (13.8%), compared to FF (13.1%) and TW nozzles (13.2%). Two-way interactions revealed UAN with fine droplets achieved consistently high GPC (14.6%), as did Aq. urea with coarse droplets (14.5%) at Lake Carl Blackwell in 2021–22 as compared to Aq. Urea_Fine (13.8%). At Chickasha 2021–22 and Perkins 2020–21, a significant three-way interaction was observed, with the UAN_3D_Fine (13.2%) and UAN_3D_Coarse (12.2%) treatments producing the highest GPC, with 8% and 15% greater than the Aq. Urea_TW_Fine, respectively, which is lowest. These findings provide a foundation for precision agriculture approaches that optimize foliar N application parameters to enhance wheat quality while maintaining sustainable production practices.

1. Introduction

Wheat (Triticum aestivum) is one of the most important food crops, contributing 20% of the world’s calories and serving as a vital source of human nutrition [1]. Wheat producers, however, face the challenge of maximizing yields while maintaining high GPC levels [2]. The increasing demand for high-quality wheat products has intensified the need for effective nitrogen (N) management strategies that can simultaneously address both yield and GPC requirements [3]. In dryland production systems, where environmental conditions often limit nutrient availability and uptake efficiency, this challenge becomes particularly acute, necessitating innovative approaches to N management [4].
Foliar N applications at anthesis offer a promising strategy to address the yield–protein trade-off in wheat [5,6]. This approach is effective because foliar-applied N bypasses root uptake and is directly absorbed through leaf surfaces, following different physiological pathways than soil-applied methods [7,8]. The effectiveness of foliar N applications depends on complex interactions between N source characteristics and application technology parameters, with environmental conditions at application time playing crucial roles in determining uptake efficiency [9,10,11].
Urea-ammonium nitrate (UAN) and Aq. urea solutions are the most common and readily available liquid N sources, each with distinct advantages for absorption efficiency and crop response [12,13,14]. Spray characteristics, especially droplet size and distribution patterns greatly affect how solutions adhere to leaf surfaces and how efficiently N is absorbed [15,16]. Although traditional FF nozzles remain widely used, newer technologies such as 3D and TW nozzles offer advantages in spray coverage and canopy penetration [17,18]. Twin nozzles produce two spray patterns angled forward and backward, targeting both sides of the leaf surface and improving penetration into dense canopies [18]. Similarly, 3D nozzles create a three-dimensional spray pattern that can better navigate complex crop architectures, potentially increasing the contact area between the foliar solution and plant tissue [19]. These design innovations aim to address common limitations of conventional FF nozzles, such as uneven coverage and reduced penetration in thick canopies. However, their relative efficacy under varying environmental conditions, droplet types, and solution types remains unclear, particularly in winter wheat production systems.
Previous studies have typically examined individual aspects of foliar applications such as nozzle type, droplet size, or N source rather than their interactions [20,21,22,23,24,25]. Despite extensive research documenting the effects of foliar N applications on wheat grain yield and GPC [26,27,28,29], significant knowledge gaps persist regarding the interactions between N source characteristics and application technology parameters in modern production systems. Understanding these relationships is especially important for dryland wheat production in the southern Great Plains, where variable environmental conditions further complicate N management decisions.
This study addresses this knowledge gap by investigating the interactive effects of N source, nozzle type, and droplet type on wheat performance under dryland conditions in Oklahoma. Specifically, our objectives were to (a) evaluate the impact of different combinations of N source, nozzle type, and droplet type on wheat grain yield and GPC; and (b) determine how these treatment combinations perform across different environmental conditions. We hypothesized that (1) the combination of UAN with fine droplets would result in higher GPC compared to Aq. urea due to enhanced foliar absorption efficiency; (2) 3D nozzle type would outperform conventional FF nozzles by providing better canopy penetration and leaf coverage; and (3) the efficacy of specific treatment combinations would vary across environments due to differences in weather conditions at application time. This research aims to develop precise recommendations for late-season foliar N applications. These recommendations will help wheat producers optimize both yield and GPC under variable dryland conditions, leading to more sustainable and profitable wheat production.

2. Material and Methods

2.1. General Experiment Information

A non-irrigated field study was conducted over three growing seasons (2019–20, 2020–21, and 2021–22) at three locations in Oklahoma: Cimarron Valley Research Station in Perkins (35°59′25.2″ N, 97°02′41.2″ W), Lake Carl Blackwell Research Farm near Perry (36°08′ N, 97°17′ W), and South-Central Research Station in Chickasha (35°2′ N, 97°57′ W). The soil type for the experiment in Perkins was classified as Teller series (fine-loamy, mixed, active, thermic Udic Argiustolls) and Konawa series (fine-loamy, mixed, active, thermic Ultic Haplustalfs); at Lake Carl Blackwell as Port series soil (fine-silty, mixed, superactive, thermic Cumulic Haplustolls); and at Chickasha as McLain silty clay loam (fine, mixed, superactive, thermic Pachic Argiustolls) and Dale silt loam (fine-silty, mixed, superactive, thermic Pachic Haplustolls).
Weather information was acquired daily from planting to harvest (September to June) from automated weather stations operated by the Mesonet Oklahoma weather network, proximately located to the research sites (https://www.mesonet.org/past-data) (accessed 5 March 2025) (Table 1). A significant late-season freeze during anthesis (April 2020) was experienced across all locations. Data were collected from all locations except Perkins in the 2021–22 growing season. The field trials were performed under a no-tillage system. Plots were 3 m wide and 6 m long, with hard red winter wheat planted at a rate of 166 kg ha−1 with 0.19 m between rows. Soil fertility was evaluated at the time of sowing for each site-year (Table 2). Composite soil samples were collected at 0–15 cm depth prior to sowing for each site-year. Soil analysis was conducted by the Soil, Water, and Forage Analytical Laboratory (SWFAL) at Oklahoma State University. Soil pH was determined using a 1:1 soil–water ratio. Buffer index was measured using the Sikora method. Nitrate-N was extracted with 1M KCl. Phosphorus, potassium, calcium, and magnesium were extracted using Mehlich-3 solution. Sulfate was determined using calcium phosphate extraction. Organic matter (OM) was determined by loss on ignition. Phosphorus and potassium fertilization was managed according to Oklahoma State University Extension recommendations based on soil test results [30]. Diseases, insects, and weeds were chemically controlled as needed according to Oklahoma State University Extension recommendations.

2.2. Experimental Design, Treatment Structure, and Harvest

The experiment was arranged in a randomized complete block design (RCBD) with a 4 × 3 × 3 factorial treatment structure (i.e., three nozzle types, two droplet types, and two N sources) including their control treatments and four replications (Table 3). The three distinct nozzle types with unique spray characteristics to optimize foliar N application at anthesis were utilized. The flat fan (FF) nozzle (models PSLDC 02/03 for coarse droplets and PSERCQ 02/03 for fine droplets) feature a standard 110° spray angle with a traditional tapered distribution pattern, operating at 20 PSI for both droplet sizes. This nozzle produces a single-plane spray pattern with uniform coverage across the boom width. The innovative 3D nozzle (models PS3DQ0003 for coarse droplets and PS3DQ0002/00015 for fine droplets) feature an integrated three-dimensional spray pattern with a 100° spray angle, operating at 20 PSI for coarse droplets and 40 PSI for fine droplets. This design creates a comprehensive spatial distribution that enhances canopy penetration through its unique geometry, providing up to 50–75% drift reduction while maintaining effective coverage (Table 3). The twin (TW) nozzles (model PSGAT1002 for coarse droplets and PSERCQ02 Dual Fan for fine droplets) featured a specialized configuration with dual 30° forward- and rear-facing sprays within a 110° overall spray angle, operating at 30 PSI for coarse droplets and 40 PSI for fine droplets. This bidirectional spray pattern allows simultaneous targeting of both adaxial and abaxial leaf surfaces, creating enhanced solution retention opportunities particularly beneficial in dense canopies.
Two N sources were applied at anthesis (Feekes 10.4) using urea-ammonium nitrate (UAN) and aqueous urea (Aq. Urea), both as 14% N solutions at a rate of 33.6 kg N ha−1. The UAN treatment used 2.5 L of 50% UAN solution diluted with 2.5 L water, while Aq. urea used 3050 mL diluted with 1950 mL water. Droplet sizes were precisely controlled according to ASABE S572.3 standard, with fine droplets (<141 microns) selected for enhanced solution retention and coarse droplets (≥141 microns) for reduced drift potential. We calibrated application speeds using a metronome to ensure consistent delivery rates. For fine droplets, we used 22.7 s per 30.48 m (4.83 km h−1). For coarse droplets, we used 17.0 s per 30.48 m (6.44 km h−1). This maintained our target application rate of 187 L ha−1 across all treatments (Figure 1).
Hard red winter wheat varieties adapted to Oklahoma growing conditions were used consistently within each site-year. Grain was harvested from the center 1.5 m of each plot using a Massey Ferguson plot combine when grain reached appropriate harvest moisture. Harvested samples were cleaned and weighed to determine grain yield (Mg ha−1, adjusted to 12% moisture basis). Grain protein concentration (GPC) was determined on subsamples using a Diode Array Near-Infrared instrument (model DA 7200, Perten Instruments, Hägersten, Sweden).

2.3. Data Analysis

Prior to statistical analysis, we assessed the homogeneity of variances using Levene’s tests from the ‘car’ package to evaluate whether data could be combined across locations and years for both grain yield and GPC [31]. Linear mixed models were applied for evaluating the treatment effects on grain yield and GPC. First, a three-way ANOVA was run including the control treatment. Once a significant interaction was established, the control was removed from the analysis and the three-way factorial analysis was re-run to determine if the significant interactions were not simply coming from the inclusion of the control in our analysis as the focus work was on the differences among the treatments. Each site-year was analyzed independently following statistical procedures. In cases where we found no significant interactions (either two-way or three-way), only main effects were considered.
A three-way factorial analysis was conducted using the lmerTest package in R version 4.2.0 [32]. The model can be generally described as
Yijklm = μ + Ri + Sj + Nk + Dl + (SN)jk + (SD)jl + (ND)kl + (SND)jkl + εijklm
where Yijklm is the observed (grain yield or GPC), μ is the overall mean, Ri is the effect of the ith block, Sj is the effect of the jth N source, Nk is the effect of the kth nozzle type, Dl is the effect of the lth droplet type, (SN)jk, (SD)jl, (ND)kl are the two-way interactions, (SND)jkl is the three-way interaction, and εijklm is the random error term. When significant effects (p ≤ 0.05) were identified, mean comparisons were conducted using Tukey’s Honest Significant Difference test with the ‘agricolae’ package [33].

3. Results

This study evaluated the effect of foliar N applications by examining two N sources (UAN and Aq. urea), three nozzle types (FF, 3D, and TW), and two droplet types (fine and coarse) and their respective control treatments at three locations over three growing seasons (2019–20 to 2021–22) except Perkins in 2021, resulting in a total of 1152 observations.
Preliminary statistical analysis revealed significant differences in variances across locations and years for both grain yield and GPC (p < 0.05, Supplementary Figures S1–S4). Consequently, we analyzed each site-year separately to account for these variance disparities.

3.1. Overview of Grain Yield and Grain Protein Concentration Responses

The grain yield values ranged from 0.5 to 5.8 Mg ha−1 with an estimated standard deviation of 1 Mg ha−1. The GPC values ranged from 10 to 16.3% with a standard deviation of 1.3% across all treatments and environments evaluated. Statistical analysis revealed no significant differences in grain yield across treatments for any site-year (p > 0.05) (Supplementary Table S1). In contrast, the significant differences in GPC were observed across treatment combinations, with notable variations in response patterns across environments. Across all site-years and treatments, late foliar N application increased GPC by 12% compared to control treatment. The lack of yield response is consistent with the timing of application at anthesis, when yield components are largely established. Therefore, grain yield will not be further discussed.

3.2. Grain Protein Concentration Response Patterns Across Locations

The 2019–20 growing season showed no significant differences in GPC across all three locations, coinciding with a late-season freeze during anthesis in April (Supplementary Table S2). Significant treatment effects on GPC were observed in the remaining site-years, with responses varying based on N source, nozzle, and droplet type.
At Chickasha, GPC values ranged between 10.1 and 13.5% with a standard deviation of 0.79% across all treatments in 2020–2021, and from 10.5 to 13.8% with a standard deviation of 0.7% in 2021–22. In the 2021–22 season, the treatment response pattern simplified, with only main effects becoming significant (p < 0.05) (Figure 2). Among N sources, UAN resulted in significantly higher GPC (12.7%) compared to aqueous urea (12.2%), with both outperforming the control (11.8%) (p < 0.05) (Figure 2A). Also, the 3D nozzle produced the highest GPC (12.8%), significantly greater than both the FF and the TW (both 12.2%) (p = 0.05) (Figure 2B).
Furthermore, the GPC values at Lake Carl Blackwell in 2020–21 ranged from 12.2 to 15.8% with a standard deviation of 0.7%, and from 12.3 to 16.3% with a standard deviation of 0.8% in 2021–2022. In 2020–21, only main effects of nozzle type (p < 0.05) and N source (p < 0.01) significantly influenced GPC (Figure 2). For N sources, UAN resulted in significantly higher GPC (14.7%) than Aq. urea (14.0%), with both outperforming the control (13.1%) (Figure 2C). The 3D nozzle produced the highest GPC (14.7%), significantly greater than the control (13.9%) but statistically similar to FF (14.0%) and TW nozzles (14.2%) (Figure 2D).

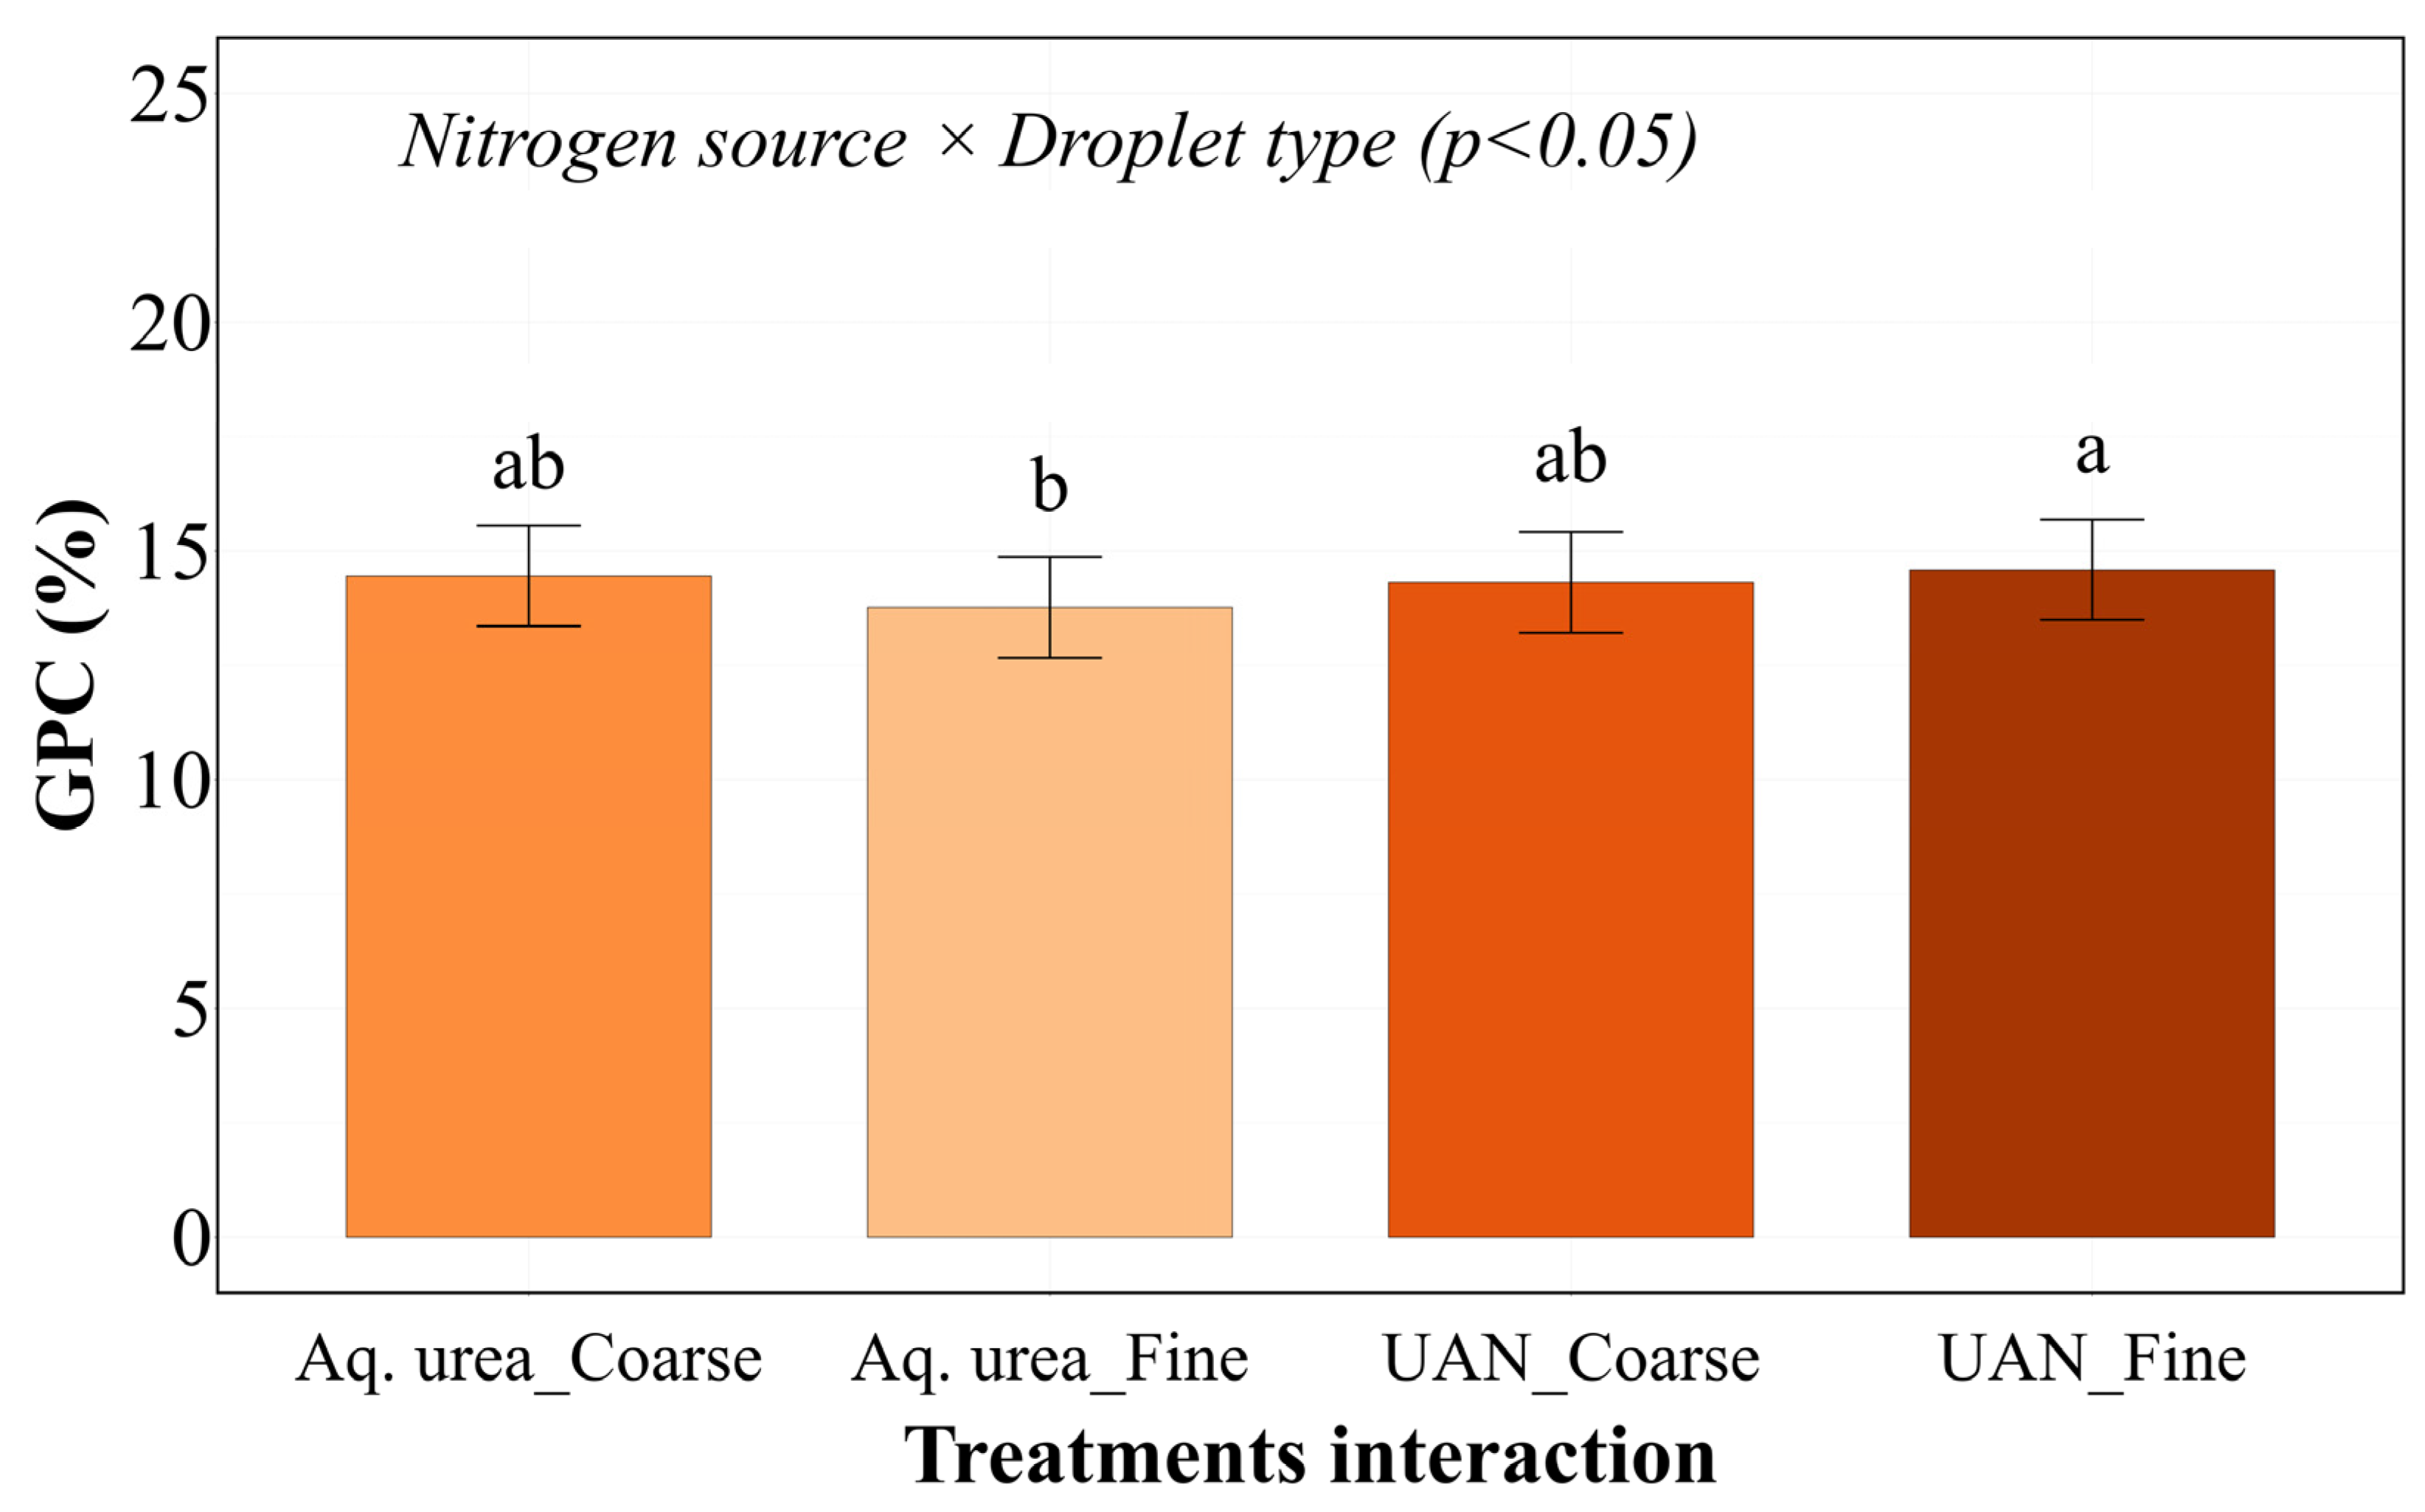
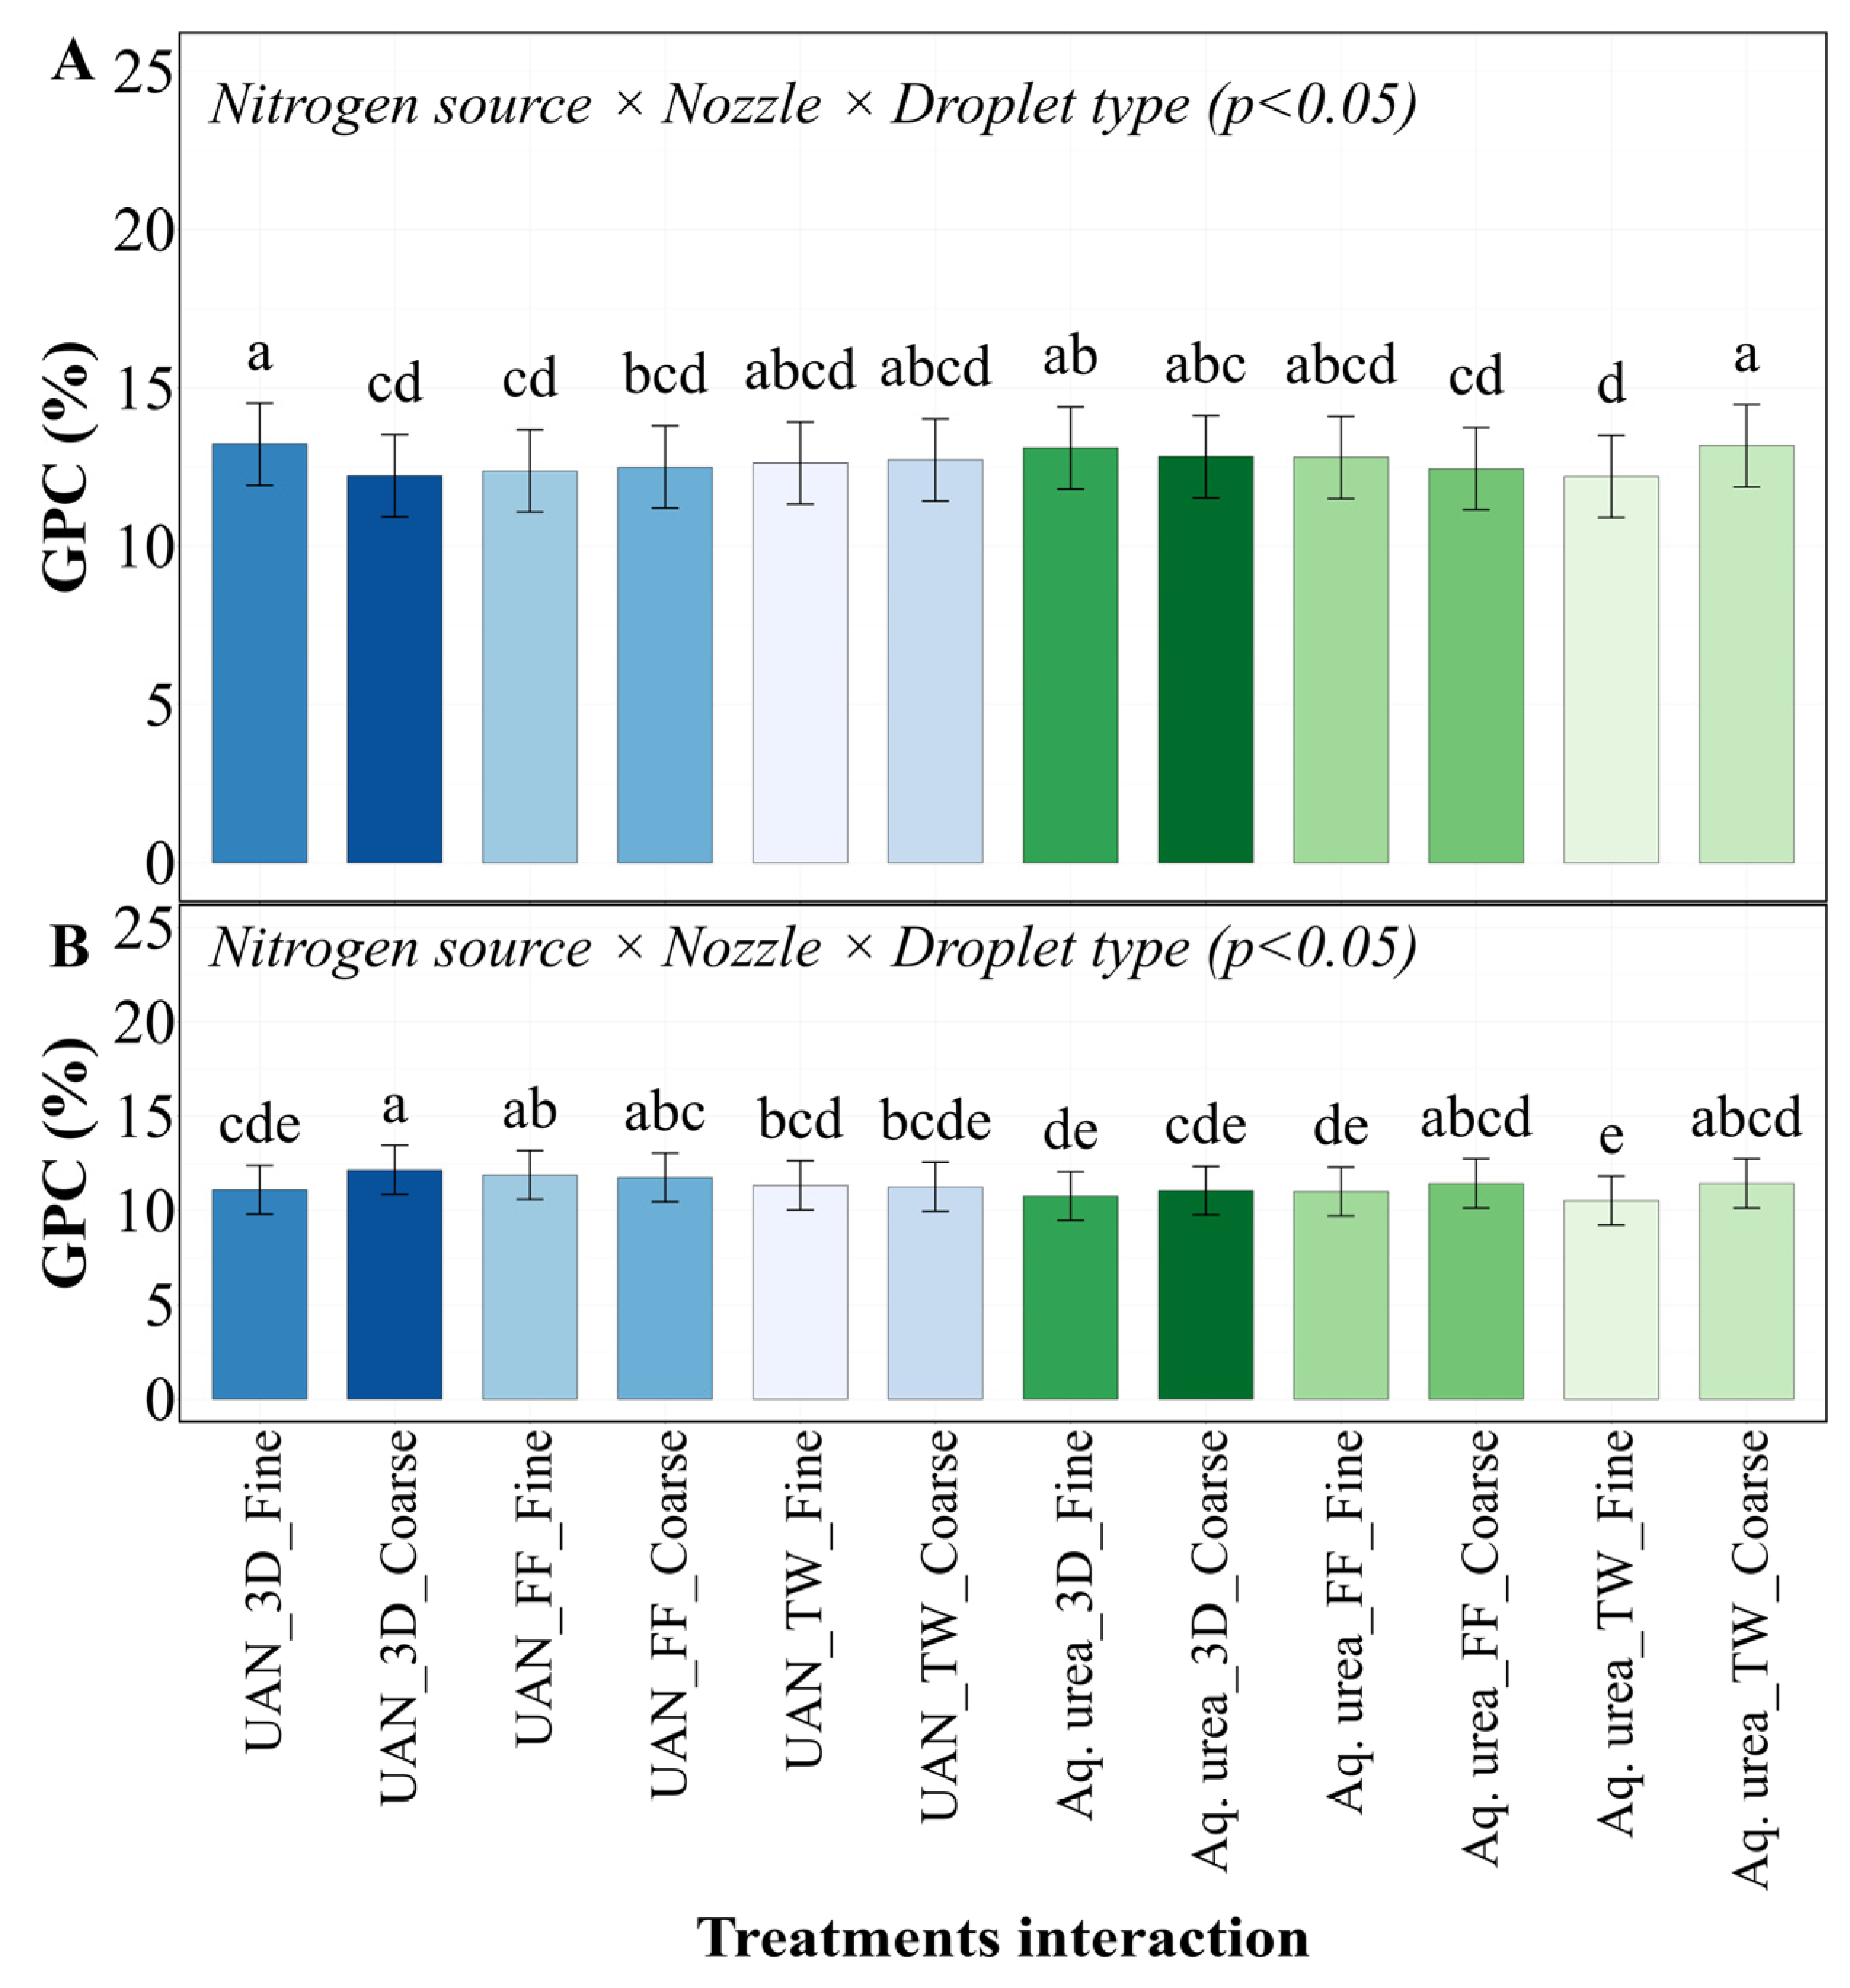
3.3. Interactive Effects of Foliar N Treatments on Grain Protein Concentration

Lake Carl Blackwell in 2021–22 showed a significant two-way interaction between N source and droplet type (p < 0.05) (Figure 3). The N source × droplet interaction revealed that UAN_Fine produced the highest GPC (14.6%), statistically similar to UAN_Coarse (14.4%) and Aq. Urea_Coarse (14.3%), while Aq. Urea_Fine (13.8%) resulted in significantly lower GPC compared to UAN_Fine.
At Chickasha in 2020–21, a significant three-way interaction was observed among N source, nozzle type, and droplet size (p < 0.05) for GPC (Figure 4A). This interaction showed that UAN_3D_Fine produced the highest GPC (13.23%), which was statistically similar to Aq. urea_TW_Coarse (13.18%). The lowest GPC values were observed with Aq. urea_TW_Fine (12.20%), which was statistically similar to UAN_3D_Coarse (12.23%), UAN_FF_Fine (12.38%), and Aq. urea_FF_Coarse (12.45%).
Perkins in 2020–21 showed GPC values ranging from 10 to 13.1% with a standard deviation of 0.7%. A significant three-way interaction between nozzle type, N source, and droplet type (p < 0.05) was observed (Figure 4B). The UAN_3D_Coarse treatment produced the highest GPC (12.2%), statistically different from all other treatment combinations except UAN_FF_Fine (11.9%). Among the treatment combinations, Aq. urea_TW_Coarse (11.4%) showed intermediate performance, while Aq. urea_TW_Fine resulted in the lowest GPC (10.5%). The UAN treatments generally outperformed their Aq. urea counterparts under similar nozzle and droplet combinations, with UAN_3D_Coarse, UAN_FF_Fine, and UAN_TW_Fine exhibiting 10.0%, 7.9%, and 7.6% higher GPC values compared to their respective Aq. urea treatment combinations.

4. Discussion

4.1. Foliar N Applications at Anthesis for Protein Enhancement

The consistent GPC enhancement across multiple environments confirms that foliar N applications at anthesis effectively address the protein–yield trade-off in wheat production. This timing targets physiological processes during grain development when additional N directly influences protein formation without affecting yield components established earlier [3,34]. The robustness of this approach under variable growing conditions offers wheat producers a reliable management option for enhancing grain quality parameters even when early-season conditions have been suboptimal. The physiological basis for this effectiveness stems from the direct translocation pathway that becomes available during grain filling, allowing foliar-applied N to bypass potential soil limitations and be efficiently directed toward protein synthesis in developing kernels [35]. This mechanism is particularly valuable in dryland production systems where soil moisture limitations often constrain conventional N management approaches. The disruption of this mechanism during severe environmental stress, as observed in the freeze-affected season, underscores the connection between normal plant physiological processes and successful foliar N utilization [36].
Furthermore, the lack of yield response confirms that anthesis represents an ideal timing for interventions specifically targeting quality parameters such as GPC without risking negative impacts on productivity. This temporal separation of yield formation and quality enhancement processes offers producers an opportunity to make informed decisions about foliar applications based on in-season conditions and market opportunities.

4.2. Nitrogen Source Dynamics: UAN Versus Aq. Urea Performance Across Environments

The comparative efficacy of UAN versus Aq. urea across diverse environments provides insight into how N source characteristics influence foliar fertilization outcomes. Our findings partially supported our first hypothesis, as UAN generally outperformed Aq. urea in most environments, especially when applied with fine droplets UAN’s practical advantages likely come from its multi-form N composition, which provides more flexibility in plant uptake compared to the single-form Aq. urea solution [37,38,39,40]. The diversity of N forms enables multiple simultaneous uptake pathways, potentially improving overall efficiency compared to single-form solutions. The N concentration in foliar applications (14% N) used in this study represents a balance between maximizing N delivery and minimizing leaf burn risk. This concentration was selected based on previous research showing that increasing N concentrations beyond limit significantly increase phytotoxicity risk [41], while concentrations below 10% N require impractically high spray volumes to deliver sufficient N. UAN and Aq. urea were selected as the primary N sources for this study as they represent the most commonly used liquid N fertilizers in the Southern Great Plains wheat production systems [42,43].
Additionally, the chemical properties of UAN, including lower surface tension and higher wetting ability, may enhance solution retention and penetration through the leaf surface [44,45]. These solution characteristics become particularly important under field conditions where environmental factors can rapidly alter droplet behavior after application. The immediate availability of multiple N forms in UAN represents another important advantage over Aq. urea, which requires conversion before becoming available for plant use [46]. This difference in availability may be especially relevant during the limited timeframe of the grain-filling period when N must be rapidly assimilated to influence protein formation. The time sensitivity of anthesis applications makes this rapid availability particularly valuable, as the window for effectively influencing GPC is relatively short and coincides with increasing plant demand for N [47].
The choice between UAN and Aq. urea in commercial applications is influenced by several factors including cost, availability, and application conditions. UAN offers advantages in stability and handling but typically at a higher cost per unit of N. Aqueous urea solutions can be prepared on-farm at lower cost but require additional preparation time and may present greater risk of leaf burn under certain environmental conditions. Our findings suggest that the superior performance of UAN across most environments may justify its higher cost, particularly when targeting grain protein enhancement in premium wheat markets.
While UAN generally outperformed Aq. urea, the interaction effects with droplet type highlight the complexity of optimizing foliar applications. For instance, the superior performance of Aq. urea_coarse compared Aq. urea_Fine in Lake Carl Blackwell suggests that solution characteristics must be considered alongside application parameters rather than in isolation. These findings align with work by [48,49], who observed that carrier volume and solution properties interact to determine foliar fertilizer effectiveness. Also, the significant environment by treatment interactions observed in our study reflect principles established by [50] who documented how environmental conditions can substantially alter foliar fertilizer performance.
From a practical standpoint, our findings indicate that UAN generally represents a more reliable N source for anthesis applications aimed at enhancing GPC, particularly when paired with appropriate application technology. However, producers should recognize that local environmental conditions may occasionally favor Aq. urea, especially when used with coarse droplets. This nuanced understanding of N source interactions contributes to more informed decision-making regarding late-season foliar applications in wheat production systems [51,52].

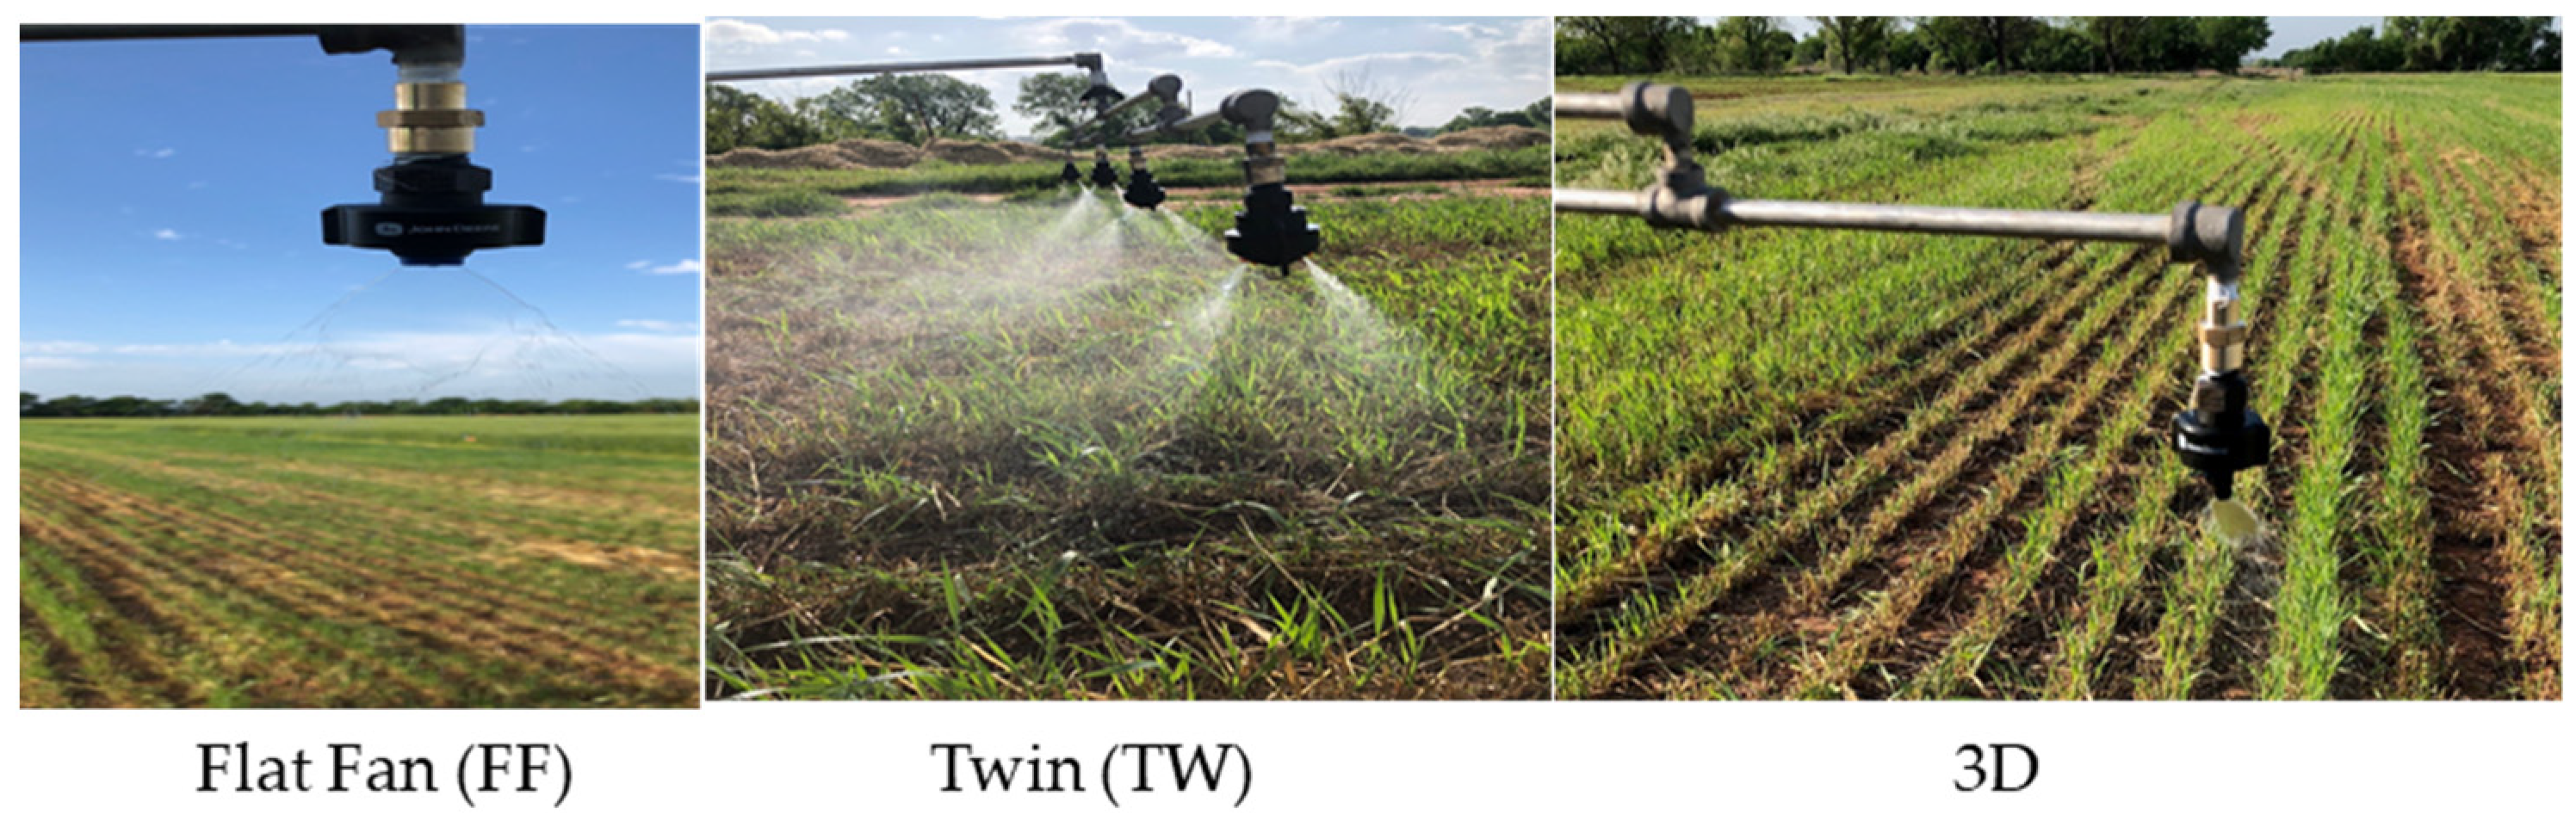
4.3. Nozzle Design Influence on Foliar N Efficiency and GPC

The 3D nozzle consistently produced higher grain protein concentrations than other nozzle types across most environments. This result strongly supports our second hypothesis that 3D nozzle would outperform conventional FF nozzle by improving canopy penetration and leaf coverage. These results extend previous findings by [53,54,55] regarding the importance of distribution patterns in determining foliar fertilizer efficacy.
The superior performance of the 3D nozzle can be attributed to its unique spray pattern geometry, which creates a more comprehensive three-dimensional distribution of solution droplets throughout the wheat canopy. This improved spatial coverage likely increases the total leaf area contacted by the N solution, enhancing overall absorption efficiency [56]. Furthermore, the 3D nozzle’s ability to navigate complex canopy architectures may be particularly advantageous in dense wheat stands where penetration to lower leaf layers is challenging with conventional nozzle designs [56].
Significant interactions between nozzle type and droplet type observed at multiple site-years suggest that nozzle performance can be optimized by pairing with appropriate droplet characteristics. For example, at Chickasha in 2020–2021 and Lake Carl Blackwell in 2021–2022, the 3D nozzle performed best with fine droplets, while the TW nozzle performed best with coarse droplets. This pattern indicates that each nozzle design may have specific complementary droplet characteristics that optimize spray retention and absorption. The 3D nozzle may benefit from the increased surface area coverage provided by fine droplets, while the TW nozzle might compensate for reduced coverage with coarse droplets through its bidirectional application pattern.

4.4. Droplet Size Characteristics Influence on GPC

Droplet size effects on GPC varied considerably across environments and treatments, highlighting the complex interaction between spray properties and environmental conditions. Fine droplets typically performed better with 3D and FF nozzles, while coarse droplets often showed advantages when paired with the TW nozzle. This pattern may relate to the specific spray pattern characteristics of each nozzle type and their interaction with droplet mobility and retention properties, as suggested by [52].
The theoretical advantages of fine droplet include greater total surface area for absorption, improved leaf surface coverage, and potentially enhanced cuticle penetration [57,58]. However, these advantages must be balanced against potential disadvantages such as increased drift susceptibility and more rapid evaporation, which may vary in importance depending on environmental conditions at application time. The varied performance of fine versus coarse droplets across different environments in our study suggests that local weather conditions, particularly temperature, humidity, and wind speed, significantly influence the relative efficacy of different droplet sizes [59,60].
The significant three-way interactions observed at Perkins (2020–21) and Chickasha (2021–22) further illustrate these complex relationships. The 3D nozzle combined with UAN and either coarse or fine droplets produced the highest grain protein. This finding aligns with the general trend favoring fine droplets with 3D nozzles, highlighting the environmental nature of these interactions. These findings strongly support our third hypothesis that treatment efficacy would vary across environments due to differences in weather conditions at application time.

5. Conclusions

We investigated how N sources, nozzle types, and droplet size interact to affect wheat grain yield and GPC under dryland conditions. Our findings show that foliar N applications at anthesis increased GPC by 12% without affecting yield across all treatments and environment.
The UAN generally outperformed Aq. urea across most environments, supporting the advantages of multi-form N sources while highlighting the importance of contextual decision-making. Nozzle design proved critical, with the 3D nozzle consistently producing superior results compared to FF and TW nozzle types. This underscores the importance of spray pattern geometry for successful application. Droplet type interactions varied considerably across environments and treatment combinations, emphasizing the need for adaptive management approaches rather than fixed application parameters. Under conditions similar to Lake Carl Blackwell and Chickasha, UAN with fine droplets performs best. In environments like Perkins, UAN with 3D nozzles and coarse droplets gives optimal results. Overall, the combination of 3D nozzle with UAN solution provides the most consistent performance advantage. However, droplet size recommendations should be adjusted based on local conditions at application time. These findings provide a foundation for developing more efficient wheat production systems capable of achieving both yield and quality objectives through optimized foliar N application strategies.

Supplementary Materials

The following supporting information can be downloaded at: https://www.mdpi.com/article/10.3390/agriculture15080812/s1, Figure S1. Grain yield (Mg ha−1) distribution of three experimental locations averaged across growing seasons. Figure S2. Grain yield (Mg ha−1) distribution of three harvest seasons averaged across locations. Figure S3. Grain protein concentration (%) distribution of three experimental locations averaged across growing seasons. Figure S4. Grain protein concentration (%) distribution of three harvest seasons averaged across locations. Table S1. Grain yield (Mg ha−1) analysis of variance (ANOVA) p-values for main effects and interactions of nitrogen source, nozzle type, and droplet type by location and growing season. Table S2. Grain protein concentration (%) analysis of variance (ANOVA) p-values for main effects and interactions of nitrogen source, nozzle type, and droplet type by location and growing season.

Author Contributions

S.O.A., formal analysis, writing—original draft, writing—review and editing; R.S., project administration, investigation, writing—review and editing; J.B., validation, writing—review and editing; D.B.A., resources, funding acquisition, methodology, data curation, supervision, writing—review and editing. All authors have read and agreed to the published version of the manuscript.

Funding

This research was funded by John Deere Company project number SUM-PSA-000140680.

Data Availability Statement

The original contributions presented in the study are included in the article/Supplementary Materials. Further inquiries can be directed to the corresponding author/s.

Conflicts of Interest

The authors declare no conflicts of interest.

References

  1. FAO. FAO Statistical Pocket Book; Food and Agricultural Organization: Rome, Italy, 2015; p. 28. Available online: https://openknowledge.fao.org/server/api/core/bitstreams/9a8e88e3-5814-49c9-b350-1d68a745ca6a/content (accessed on 24 January 2025).
  2. Abiola, S.O.; Lacasa, J.; Carver, B.F.; Arnall, B.D.; Ciampitti, I.A.; de Oliveira Silva, A. Nitrogen uptake dynamics of high and low protein wheat genotypes. Front. Plant Sci. 2024, 15, 1493901. [Google Scholar] [CrossRef] [PubMed]
  3. Bogard, M.; Allard, V.; Brancourt-Hulmel, M.; Heumez, E.; Machet, J.M.; Jeuffroy, M.H.; Le Gouis, J. Deviation from the grain protein concentration–grain yield negative relationship is highly correlated to post-anthesis N uptake in winter wheat. J. Exp. Bot. 2010, 61, 4303–4312. [Google Scholar] [CrossRef]
  4. Lollato, R.P.; Figueiredo, B.M.; Dhillon, J.S.; Arnall, D.B.; Raun, W.R. Wheat grain yield and grain-nitrogen relationships as affected by N, P, and K fertilization: A synthesis of long-term experiments. Field Crops Res. 2019, 236, 42–57. [Google Scholar] [CrossRef]
  5. Karim, M.R.; Zhang, Y.Q.; Zhao, R.R.; Chen, X.P.; Zhang, F.S.; Zou, C.Q. Alleviation of drought stress in winter wheat by late foliar application of zinc, boron, and manganese. J. Plant Nutr. Soil Sci. 2012, 175, 142–151. [Google Scholar] [CrossRef]
  6. Wu, W.; Wang, Y.; Wang, L.; Xu, H.; Zörb, C.; Geilfus, C.M.; Ma, W. Booting stage is the key timing for split nitrogen application in improving grain yield and quality of wheat–A global meta-analysis. Field Crops Res. 2022, 287, 108665. [Google Scholar] [CrossRef]
  7. Niu, J.; Liu, C.; Huang, M.; Liu, K.; Yan, D. Effects of foliar fertilization: A review of current status and future perspectives. J. Soil Sci. Plant Nutr. 2021, 21, 104–118. [Google Scholar] [CrossRef]
  8. Ishfaq, M.; Kiran, A.; ur Rehman, H.; Farooq, M.; Ijaz, N.H.; Nadeem, F.; Wakeel, A. Foliar nutrition: Potential and challenges under multifaceted agriculture. Environ. Exp. Bot. 2022, 200, 104909. [Google Scholar] [CrossRef]
  9. Bi, G.; Scagel, C. Nitrogen foliar feeding has advantages. Nurs. Manag. Prod. 2007, 23, 43–46. Available online: https://scholar.google.com/scholar?hl=en&as_sdt=0%2C37&q=14.%09Bi%2C+G.%3B+Scagel%2C+C.+%282007%29.+Nitrogen+foliar+feeding+has+advantages.+Nurs+Manage+Prod%2C+23%283%29%2C+43-46.&btnG= (accessed on 24 January 2025).
  10. Lyu, X.; Liu, Y.; Li, N.; Ku, L.; Hou, Y.; Wen, X. Foliar applications of various nitrogen (N) forms to winter wheat affect grain protein accumulation and quality via N metabolism and remobilization. Crop J. 2022, 10, 1165–1177. [Google Scholar] [CrossRef]
  11. Sotiropoulos, S.; Chatzissavvidis, C.; Papadakis, I.; Kavvadias, V.; Paschalidis, C.; Antonopoulou, C.; Koriki, A. Inorganic and organic foliar fertilization in olives. Hortic. Sci. 2023, 50, 1–11. [Google Scholar] [CrossRef]
  12. Woodard, H.J.; Bly, A. Relationship of nitrogen management to winter wheat yield and grain protein in South Dakota. J. Plant Nutr. 1998, 21, 217–233. [Google Scholar] [CrossRef]
  13. Dick, C.D.; Thompson, N.M.; Epplin, F.M.; Arnall, D.B. Managing late season foliar nitrogen fertilization to increase grain protein for winter wheat. Agron. J. 2016, 108, 2329–2338. [Google Scholar] [CrossRef]
  14. Walsh, O.S.; Shafian, S.; Christiaens, R.J. Nitrogen fertilizer management in dryland wheat cropping systems. Plants 2018, 7, 9. [Google Scholar] [CrossRef]
  15. Fernández, V.; Eichert, T. Uptake of hydrophilic solutes through plant leaves: Current state of knowledge and perspectives of foliar fertilization. Crit. Rev. Plant Sci. 2009, 28, 36–68. [Google Scholar] [CrossRef]
  16. Massinon, M.; Lebeau, F. Review of physicochemical processes involved in agrochemical spray retention. Biotechnol. Agron. Soc. Environ. 2013, 17, 494–504. Available online: https://hdl.handle.net/2268/148678 (accessed on 25 March 2025).
  17. Wang, S.; Li, X.; Nuyttens, D.; Zhang, L.; Liu, Y.; Li, X. Evaluation of compact air-induction flat fan nozzles for herbicide applications: Spray drift and biological efficacy. Front. Plant Sci. 2023, 14, 1018626. [Google Scholar] [CrossRef]
  18. Michielsen, J.M.G.P.; van de Zande, J.C.; Wenneker, M. Nozzle classification for drift reduction in orchard spraying; effect of nozzle type on a dormant stage orchard. In Proceedings of the SuproFruit 2009 10th Workshop on Spray Application Techniques in Fruit Growing, Wageningen, The Netherlands, 30 September–2 October 2009; pp. 36–37. [Google Scholar]
  19. Blomendahl, S. Understanding Droplet Sizes Produced by Agricultural Sprayer Nozzles. Available online: https://www.dultmeier.com/understanding-droplet-sizes-produced-by-agricultural-sprayer-nozzles (accessed on 21 January 2025).
  20. McCormick, A.N.; Smith, L.G.; Dillon, T.W.; Collie, L.M.; Davis, B.M.; Butts, T.R. Nozzle type and arrangement effect on spray coverage. Res. Ser. Ark. Agric. Exp. Stn. 2020, 670, 135–139. [Google Scholar]
  21. Parkin, C.S. Methods for measuring spray droplet sizes. In Application Technology for Crop Protection; CAB International: Wallingford, UK, 1993; pp. 57–84. [Google Scholar]
  22. Tishkoff, J.M.; Ingebo, R.D.; Kennedy, J.B. (Eds.) Liquid Particle Size Measurement Techniques: A Symposium; ASTM International: West Conshohocken, PA, USA, 1983; Volume 848. [Google Scholar]
  23. Piggott, S.; Matthews, G.A. Air induction nozzles: A solution to spray drift? Int. Pest Control 1999, 41, 24–28. [Google Scholar]
  24. Al-Juthery, H.W.; Habeeb, K.H.; Altaee, F.J.K.; AL-Taey, D.K.; Al-Tawaha, A.R.M. Effect of foliar application of different sources of nano-fertilizers on growth and yield of wheat. Biosci. Res. 2018, 15, 3976–3985. [Google Scholar]
  25. Barneix, A.J. Physiology and biochemistry of source-regulated protein accumulation in the wheat grain. J. Plant Physiol. 2007, 164, 581–590. [Google Scholar] [CrossRef]
  26. McDonald, G.K. Effects of nitrogenous fertilizer on the growth, grain yield and grain protein concentration of wheat. Aust. J. Agric. Res. 1992, 43, 949–967. [Google Scholar] [CrossRef]
  27. Woolfolk, C.W.; Raun, W.R.; Johnson, G.V.; Thomason, W.E.; Mullen, R.W.; Wynn, K.J.; Freeman, K.W. Influence of late-season foliar nitrogen applications on yield and grain nitrogen in winter wheat. Agron. J. 2002, 94, 429–434. [Google Scholar] [CrossRef]
  28. Bly, A.G.; Woodard, H.J. Foliar nitrogen application timing influence on grain yield and protein concentration of hard red winter and spring wheat. Agron. J. 2003, 95, 335–338. [Google Scholar] [CrossRef]
  29. Delfine, S.; Tognetti, R.; Desiderio, E.; Alvino, A. Effect of foliar application of N and humic acids on growth and yield of durum wheat. Agron. Sustain. Dev. 2005, 25, 183–191. [Google Scholar] [CrossRef]
  30. Warren, J.; Zhang, H.; Arnall, B.; Bushong, J.; Raun, B.; Penn, C.; Abit, J. Oklahoma Soil Fertility Handbook; Oklahoma Cooperative Extension Service: Stillwater, OK, USA, 2017; id. E-1039; Available online: https://extension.okstate.edu/fact-sheets/oklahoma-soil-fertility-handbook-full.html (accessed on 25 March 2025).
  31. Fox, J.; Weisberg, S.; Adler, D.; Bates, D.; Baud-Bovy, G.; Ellison, S.; Firth, D.; Friendly, M.; Gorjanc, G.; Graves, S.; et al. Package ‘car’. R Found. Stat. Comput. 2012, 16, 333. [Google Scholar]
  32. Kuznetsova, A.; Brockhoff, P.B.; Christensen, R.H.B. Package ‘lmertest’. R Package Version 2015, 2, 734. [Google Scholar] [CrossRef]
  33. de Mendiburu, F.; de Mendiburu, M.F. Package ‘agricolae’. R Package Version 2019, 1, 1143–1149. [Google Scholar] [CrossRef]
  34. Fortunato, S.; Nigro, D.; Lasorella, C.; Marcotuli, I.; Gadaleta, A.; de Pinto, M.C. The role of glutamine synthetase (GS) and glutamate synthase (GOGAT) in the improvement of nitrogen use efficiency in cereals. Biomolecules 2023, 13, 1771. [Google Scholar] [CrossRef]
  35. Turley, D.B.; Sylvester-Bradley, R.; Dampney, P.M. Foliar-applied nitrogen for grain protein and canopy management of wheat. HGCA Res. Rev. 2001, 47, 32. [Google Scholar]
  36. Griffiths, M.W.; Kettlewell, P.S.; Hocking, T.J. Effects of foliar-applied sulphur and nitrogen on grain growth, grain sulphur and nitrogen concentrations and yield of winter wheat. J. Agric. Sci. 1995, 125, 331–339. [Google Scholar] [CrossRef]
  37. Souza, J.L.B.; Antonangelo, J.A.; de Oliveira Silva, A.; Reed, V.; Arnall, B. Recovery of grain yield and protein with fertilizer application post nitrogen stress in winter wheat (Triticum aestivum L.). Agronomy 2022, 12, 2024. [Google Scholar] [CrossRef]
  38. Ren, B.; Guo, Y.; Liu, P.; Zhao, B.; Zhang, J. Effects of urea-ammonium nitrate solution on yield, N2O emission, and nitrogen efficiency of summer maize under integration of water and fertilizer. Front. Plant Sci. 2021, 12, 700331. [Google Scholar] [CrossRef] [PubMed]
  39. Gagnon, B.; Ziadi, N. Grain corn and soil nitrogen responses to sidedress nitrogen sources and applications. Agron. J. 2010, 102, 1014–1022. [Google Scholar] [CrossRef]
  40. Sundaram, P.K.; Mani, I.; Lande, S.D.; Parray, R.A. Evaluation of urea ammonium nitrate application on the performance of wheat. Int. J. Curr. Microbiol. App. Sci. 2019, 8, 1956–1963. [Google Scholar] [CrossRef]
  41. Kong, L.; Xie, Y.; Hu, L.; Si, J.; Wang, Z. Excessive nitrogen application dampens antioxidant capacity and grain filling in wheat as revealed by metabolic and physiological analyses. Sci. Rep. 2017, 7, 43363. [Google Scholar] [CrossRef] [PubMed]
  42. Arnall, D.B.; Mallarino, A.P.; Ruark, M.D.; Varsa, G.O.; Solie, J.B.; Raun, W.R. Relationship between grain crop yield potential and nitrogen response. Agron. J. 2013, 105, 1335–1344. [Google Scholar] [CrossRef]
  43. Mengel, D.B. Types and Uses of Nitrogen Fertilizers for Crop Production. Available online: https://www.extension.purdue.edu/extmedia/ay/ay-204.html (accessed on 4 April 2025).
  44. Castro, S.A.Q.D.; Kichey, T.; Persson, D.P.; Schjoerring, J.K. Leaf Scorching following Foliar Fertilization of Wheat with Urea or Urea–Ammonium Nitrate Is Caused by Ammonium Toxicity. Agronomy 2022, 12, 1405. [Google Scholar] [CrossRef]
  45. Wang, Y.; Xu, Z.; Li, B.N.; Gao, Q.; Feng, G.Z.; Li, C.L.; Li, Y.; ShaoJie, W. Effects of urea ammonium nitrate solution on grain yield and nitrogen uptake of spring maize in black soil region. Sci. Agric. Sin. 2018, 51, 718–727. [Google Scholar] [CrossRef]
  46. Millar, N.; Robertson, G.P.; Grace, P.R.; Gehl, R.J.; Hoben, J.P. Nitrogen fertilizer management for nitrous oxide (N2O) mitigation in intensive corn (Maize) production: An emissions reduction protocol for US Midwest agriculture. Mitig. Adapt. Strateg. Glob. Change 2010, 15, 185–204. [Google Scholar] [CrossRef]
  47. Hall, A.J.; Savin, R.; Slafer, G.A. Is time to flowering in wheat and barley influenced by nitrogen?: A critical appraisal of recent published reports. Eur. J. Agron. 2014, 54, 40–46. [Google Scholar] [CrossRef]
  48. Lake, J.R. The effect of drop size and velocity on the performance of agricultural sprays. Pestic. Sci. 1977, 8, 515–520. [Google Scholar] [CrossRef]
  49. Miller, P.C.H.; Ellis, M.B. Effects of formulation on spray nozzle performance for applications from ground-based boom sprayers. Crop Prot. 2000, 19, 609–615. [Google Scholar] [CrossRef]
  50. Hong, J.; Wang, C.; Wagner, D.C.; Gardea-Torresdey, J.L.; He, F.; Rico, C.M. Foliar application of nanoparticles: Mechanisms of absorption, transfer, and multiple impacts. Environ. Sci. Nano 2021, 8, 1196–1210. [Google Scholar] [CrossRef]
  51. Lv, X.; Ding, Y.; Long, M.; Liang, W.; Gu, X.; Liu, Y.; Wen, X. Effect of foliar application of various nitrogen forms on starch accumulation and grain filling of wheat (Triticum aestivum L.) under drought stress. Front. Plant Sci. 2021, 12, 645379. [Google Scholar] [CrossRef]
  52. Butler Ellis, M.C.; Tuck, C.R. How adjuvants influence spray formation with different hydraulic nozzles. Crop Prot. 1999, 18, 101–109. [Google Scholar] [CrossRef]
  53. Dombrowski, N.; Fraser, R.P. A photographic investigation into the disintegration of liquid sheets. Philos. Trans. R. Soc. Lond. A Math. Phys. Sci. 1954, 247, 101–130. [Google Scholar] [CrossRef]
  54. Dombrowski, N.; Hasson, D.; Ward, D.E. Some aspects of liquid flow through fan spray nozzles. Chem. Eng. Sci. 1960, 12, 35–50. [Google Scholar] [CrossRef]
  55. Ford, R.E.; Furmidge, C.G.L. The formation of drops from viscous Newtonian liquids sprayed through fan-jet nozzles. Br. J. Appl. Phys. 1967, 18, 335. [Google Scholar] [CrossRef]
  56. Syngenta. New Defy 3D Nozzles Improve Coverage and Reduce Drift. Available online: https://syngenta-au.my.salesforce.com/sfc/p/#90000atoO/a/900008gxf/SFdik58N0BmDc92cetlLFeJV1QV8AB3dFUo6pAi0t1M (accessed on 4 March 2025).
  57. Deere, J. John Deere Sprayer Parts Guide. Available online: https://jdparts.deere.com/partsmkt/unsecured/document/english/featbene/SPRAYER_PARTS_GUIDE_UPDATE.pdf (accessed on 22 January 2025).
  58. Hilz, E.; Vermeer, A.W. Spray drift review: The extent to which a formulation can contribute to spray drift reduction. Crop Prot. 2013, 44, 75–83. [Google Scholar] [CrossRef]
  59. Sun, T.; Zhang, S.; Xue, X.; Jiao, Y. Comparison of droplet distribution and control effect of wheat aphids under different operation parameters of the crop protection UAV in the wheat flowering stage. Agronomy 2022, 12, 3175. [Google Scholar] [CrossRef]
  60. Chen, H.; Weng, H.; Zhu, H.; Shen, S.; Li, W. Insights on droplet drift and effective utilization of pesticide in “Third Pole”: Qinghai-Tibet Plateau of China. Heliyon 2024, 10, e30935. [Google Scholar] [CrossRef] [PubMed]
Figure 1. Spray patterns of the three nozzle types evaluated in this study. Images show actual field applications during the foliar nitrogen treatments at anthesis.
Agriculture 15 00812 g001
Figure 2. Main effect of foliar N treatments on GPC (%) at Chickasha in 2021–22: (A) nitrogen source effect; (B) nozzle type effect; and at Lake Carl Blackwell in 2020–21: (C) nitrogen source effect; (D) nozzle type effect. Error bars represent standard errors of means. Different letters above bars indicate statistically significant differences at p ≤ 0.05.
Agriculture 15 00812 g002
Figure 3. Two-way interaction effects on GPC (%) at Lake Carl Blackwell in 2021–22. Error bars represent standard errors of means. Different letters above bars indicate statistically significant differences at p < 0.05.
Agriculture 15 00812 g003
Figure 4. Three-way interaction effects on GPC (%) at Chickasha in 2020–21 (A) and at Perkins 2020–21 (B). Error bars represent standard errors of means. Different letters above bars indicate statistically significant differences at p < 0.05.
Agriculture 15 00812 g004
Table 1. Weather information. Cumulative precipitation (Cum PPT) in millimeters, maximum, minimum, and average daily temperature (T) in Celsius for each site-year and season, and average of 10 years (2013–23), cumulative growing degree-day (Cum GDD) in Celsius for each site-year and season. Weather data were collected from the Oklahoma Mesonet, www.mesonet.org (accessed on 25 March 2025).
YearSiteSeasonCum PPTT MaxT MinT AvgCum GDD
MM°C
2019–20Lake Carl BlackwellFall13433−118364
Winter21934−1171004
Spring14136−1192814
PerkinsFall18533−109439
Winter26733−981170
Spring38237−1202784
ChickashaFall20420512.5600
Winter12612−251200
Spring318201017.52500
2020–21Lake Carl BlackwellFall22018310586
Winter13712−251256
Spring108229192560
PerkinsFall22317410582
Winter13311−151218
Spring2432514192363
Fall17420512.5600
ChickashaWinter12610−241200
Spring364251017.52500
2021–22Lake Carl BlackwellFall12720613829
Winter117201051518
Spring4213915212666
ChickashaFall14420512908
Winter10013−351609
Spring4092815212584
Fall: October to December; Winter: January to March; Spring: April to June.
Table 2. Composite (0–15 cm) soil sample nutrient analysis results collected for each site year. Soil pH was measured in a 1:1 soil–water extract and buffer index (BI) determined utilizing the Sikora buffer method. Soil nitrate-N (NO3) determined with 1M KCl, sulfate (SO4) via calcium phosphate, while phosphorus (M3P), potassium (K), calcium (Ca), and magnesium (Mg) were determined with the Mehlich 3 extraction method. Nutrient concentrations are presented as mg kg−1 of soil. The soil organic matter (OM) was determined via loss on ignition and presented as a percentage (%).
Growing SeasonLocationpHBINO3M3PKSO4CaMgOM
mg kg−1%
2019–20Chickasha6718.519.52807.8251510482.01
LCB5.77.14.519.5902.8936.5213.51.1
Perkins5.26.85191126536.5140.51.17
2020–21Chickasha6.17.17111485.51519537.51.7
LCB6.17.19.524.5125.55.521394291.51.36
Perkins6.6 334143.52.4644137.50.78
2021–22Chickasha6.17.18.518133.53.21162.5436.51.51
LCB6.8 8.550.51551.38516.51070.64
Table 3. Treatment structure detailing the 13 combinations of nozzle, droplet size, and nitrogen source evaluated.
Treatment NumberNozzle TechDroplet SizeNitrogen SourceFlow Rate
(L ha−1)
kPaNozzle Used
1Control----
2FFCoarseUAN187138PSLDC 03
3FFCoarseAq. Urea187138PSLDC 02
4FFFineUAN187138PSERCQ 03
5FFFineAq. Urea187138PSERCQ 02
63DCoarseUAN187138PS3DQ0003
73DCoarseAq. Urea187138PS3DQ0003
83DFineUAN187276PS3DQ0002
93DFineAq. Urea187276PS3DQ00015
10TWCoarseUAN187207PSGAT1002
11TWCoarseAq. Urea187207PSGAT1002
12TWFineUAN187276PSERCQ02 Dual Fan
13TWFineAq. Urea187276PSERCQ02 Dual Fan
Flow rate: liter per hectare application rate; kPa: pressure (kilopascal); nozzle used: specific nozzle model used for each treatment combination.
Disclaimer/Publisher’s Note: The statements, opinions and data contained in all publications are solely those of the individual author(s) and contributor(s) and not of MDPI and/or the editor(s). MDPI and/or the editor(s) disclaim responsibility for any injury to people or property resulting from any ideas, methods, instructions or products referred to in the content.

