Article

Greenhouse Gas Emissions from Flood-Irrigated Rice as Affected by Phosphorus Fertilizer Source

by
Chandler M. Arel
1,*,
Kristofor R. Brye
1,
Diego Della Lunga
1,†,
Trenton L. Roberts
1 and
Richard Adams
2
1
Department of Crop, Soil, and Environmental Sciences, University of Arkansas, 115 Plant Sciences Building, Fayetteville, AR 72701, USA
2
Department of Entomology and Plant Pathology, University of Arkansas, 115 Plant Sciences Building, Fayetteville, AR 72701, USA
*
Author to whom correspondence should be addressed.
This work was part of the Doctor thesis of the third Diego Della Lunga. Doctor program in University of Arkansas, USA.
Agriculture 2025, 15(8), 815; https://doi.org/10.3390/agriculture15080815
Submission received: 3 March 2025 / Revised: 28 March 2025 / Accepted: 7 April 2025 / Published: 9 April 2025
(This article belongs to the Section Agricultural Soils)

Abstract

Research into alternative phosphorus (P) fertilizer sources that may be able to supplement P resources is necessary. Struvite (MgNH4PO4 · 6H2O) can be made by removing excess nutrients from waste sources and may reduce greenhouse gas (GHG) emissions from cropping systems. This study sought to quantify GHG [i.e., methane (CH4), nitrous oxide (N2O), and carbon dioxide (CO2)] fluxes, season-long emissions, and net GHG emissions from chemically precipitated struvite (CPST) and synthetic and real-wastewater-derived electrochemically precipitated struvite (ECST) compared to monoammonium phosphate (MAP) and an unamended control (UC) from flood-irrigated rice (Oryza sativa) grown in P-deficient, silt loam soil in a greenhouse. Gas samples were collected weekly over a 140-day period in 2022. Methane and CO2 emissions differed (p < 0.05) among P fertilizer sources, while N2O emissions were similar among all treatments. Methane, CO2, and N2O emissions from MAP-fertilized rice were the greatest (98.7, 20,960, and 0.44 kg ha−1 season−1, respectively), but they were similar to those of CH4 and CO2 for CPST and those of N2O for all other P fertilizer sources. Season-long CH4, CO2, and N2O emissions and net GHG emissions did not differ between ECST materials. This study’s results emphasized the potential that wastewater-recovered struvite has to reduce GHG emissions in rice production systems.

1. Introduction

Globally, the increase in atmospheric greenhouse gas (GHG) concentrations and emissions has begun to concern both researchers and the general public, leading to the creation of the International Panel on Climate Change (IPCC) by the United Nations General Assembly in 1988 to provide reviews and recommendations regarding climate change and create response strategies to mitigate potential consequences [1]. Agriculture is currently responsible for ~11% of GHG emissions from the United States (US), but this could change as the demand for food production grows over time [2]. Among the major GHGs, carbon dioxide (CO2), methane (CH4), and nitrous oxide (N2O), enteric fermentation and manure management were the primary sources of anthropogenic CH4 production in 2020, representing 36.1% of all US CH4 emissions, while flood-irrigated rice (Oryza sativa) production has been specifically recognized as a major crop contributor of atmospheric CH4 emissions [3]. In contrast to CH4, the majority of N2O emissions were attributed to agricultural soil management (74.2%) via fertilizer applications [3].
Soil is often described as a living, breathing entity due to the multitude of physical, chemical, and biological processes that are constantly taking place in soil. Soil respiration is responsible for CO2 production and release, as aerobic, heterotrophic microbes decompose soil organic matter (OM), and roots release CO2 [4]. However, under anaerobic soil conditions, such as those present for extended periods of time for flood-irrigated rice production, CO2 production and release are greatly minimized [5]. The production of N2O within soil differs from that for CO2, as denitrifying, chemo-organotrophic bacteria anaerobically convert nitrate (NO3) into nitrite (NO2) and then into nitric oxide (NO), N2O, or dinitrogen gas (N2) [4].
The production of N2O in soil is strongly influenced by the addition of N fertilizers, like urea, and water management [6,7]. Peak N2O fluxes have been commonly measured shortly (i.e., 7 days) after N has been added to soil, such as after a fertilization event, followed by optimal nitrification and denitrification conditions, such as a rainfall or irrigation event that temporarily saturates portions of the soil [8,9]. In a traditionally managed rice agroecosystem, continuous flood-irrigated conditions minimize conditions for optimal N2O production and release, as the soil oxidation–reduction (redox) potential decreases below what is conducive to nitrate reduction and limits oxygen availability necessary for nitrification [6].
Methane production in soil is similar to N2O production, as microbes, mainly methanogens, decompose OM in anaerobic conditions using carbon (C) as a terminal electron acceptor during the process [10]. Traditional, flood-irrigated rice production systems tend to promote CH4 production and release and generally minimize CO2 and N2O production and release [11,12,13].
In 2021, rice was globally produced on a total of 164.2 million ha [14]. Arkansas, the leading rice-producing state in the US, had 485,622 ha of the total 1.1 million ha of US-planted rice (~47%), with approximately 76.3% being cultivated under flooded conditions [15]. A typical flood-irrigated rice field in Arkansas uses ~31 hectare (ha) cm season−1 of water [16]. Fertilizer application rates vary based on rice variety and soil test reports, but N fertilizer recommendations for rice grown in Arkansas range from 134.5 to 168.1 kg ha−1 and are based on the cultivar and soil texture of the production system [17].
Though not needed in as large quantities as N, adequate phosphorus (P) fertility is important for optimal rice production [17]. Despite the general abundance of total P in soil, the vast majority of soil P is unavailable for plant uptake, often resulting in P becoming a limiting nutrient for plant growth and resulting in the need for P fertilization to optimize crop production [18,19]. In 2016, 255 million metric tons (281 million tons) of rock phosphate (RP), the primary source of global P fertilizer, was mined [20]. Consequently, natural sources of RP are being depleted, and alternative P fertilizer sources need to be identified and studied [21].
With RP reserves being slowly depleted, along with increasing P demand to keep pace with the need for increasing food production, research into capturing and recycling nutrients, particularly P, from waste streams, such as agricultural and municipal wastes, is essential. The natural precipitation of the mineral struvite (MgNH4PO4 · 6H2O) can occur in several waste environments, such as in wastewater treatment plants (WWTPs), requiring regular maintenance to remove struvite as it is a nuisance [22,23]. Struvite is a crystalline mineral containing equal molar concentrations of magnesium (Mg), ammonium (NH4+), and phosphate (PO4) [24]. However, intentional struvite precipitation out of wastewaters and/or at a strategic location in a WWTP could provide a means to capture and recycle excess nutrients, particularly P, as a potential fertilizer nutrient source.
Several methods of intentional struvite precipitation have been developed. Chemical precipitation is the most widely used method, where salts are added to supply the necessary Mg to drive the reaction [25,26]. Electrochemical precipitation is a more recently developed method that uses a sacrificial Mg anode to supply Mg without the addition of external Mg-containing salts [25]. Previous studies have recorded P recovery via electrochemical precipitation up to 99% from swine wastewater, making electrochemical precipitation an efficient technique for struvite P recovery [27].
Regardless of the method used, struvite production can aid in minimizing excess nutrients in waste streams and may provide an alternative P fertilizer source for mined RP. Struvite has been reported to be an efficient, slow-release fertilizer source, characterized by ~96% citrate solubility and a dissolution rate that increases as solution pH decreases [25,28]. Struvite varies in nutrient concentration, but, on average, struvite consists of 5% N, 13% P, and 10% Mg [25,29,30]. Additionally, struvite’s low water solubility allows for the slow release of nutrients after application which could reduce nutrient losses during concentrated rainfall events and improve crop response by providing nutrients throughout the growing season as rhizosphere acidification from growing plants creates optimal conditions for struvite dissolution [17,31].
The use of struvite as a potential alternative P fertilizer source has been studied in several agronomic crops, such as corn (Zea mays), soybean (Glycine max), wheat (Triticum aestivum), and rice, in the greenhouse [32,33,34,35] and in the field [36,37,38,39,40]. However, due to its relative newness and potential use in production agriculture as an alternative P fertilizer source, the possible environmental ramifications of struvite, particularly struvite’s potential role in GHG emissions, have yet to be investigated. Furthermore, struvite created via electrochemical precipitation from a real wastewater source has not been investigated relative to other commercially available P fertilizer sources. Therefore, this study aimed to evaluate the potential environmental and climate change implications of GHG emissions from rice grown under flooded conditions with various struvite P sources. The specific objectives were to quantify GHG fluxes, season-long emissions, and total (i.e., CH4, N2O, and CO2) and CO2-excluded (i.e., CH4 and N2O) net GHG emissions from several struvite P sources [i.e., chemically precipitated struvite (CPST) and synthetic and real-wastewater-derived electrochemically precipitated struvite (ECSTSyn and ECSTReal, respectively)] compared to monoammonium phosphate (MAP) and a no-P-added control (UC) from flood-irrigated rice.
It was hypothesized that CH4, CO2, and N2O flux peaks for MAP-fertilized rice would occur the earliest and be the greatest, followed by the two ECST P fertilizer sources, CPST, and then the UC due to differences in solubility characteristics between the P fertilizer sources [31,37,41]. Additionally, it was hypothesized that season-long emissions for CH4, CO2, and N2O would be similar between all four P fertilizer sources but differ from and be greater than those of the UC, as each of the P-receiving treatments received the same quantity of total nutrients. It was also hypothesized that CH4, CO2, and N2O fluxes and emissions and net GHG emissions would be similar between the two ECST sources.
This study was necessarily conducted initially in a greenhouse, as a limited amount of ECSTSyn and ECSTReal material was available for application and study. However, the results were assumed to reasonably reflect the expected results from a similar study conducted in the field.

2. Materials and Methods

2.1. Soil Collection, Processing, and Analyses

On 5 December 2021, approximately 450 kg of Calhoun silt loam (fine-silty, mixed, active, thermic Typic Glossaqualf) soil was collected [42]. Soil was removed from the upper 10 to 15 cm from an agricultural field border area at the University of Arkansas, Division of Agriculture’s Pine Tree Research Station, near Colt, AR. The soil collection area had been cultivated and winter wheat had been planted but had received no P fertilizer additions for several years to intentionally lower the soil test P concentration. Soil was air-dried at approximately 31 °C for at least seven days, after which all soil was manually passed through a 6.35 mm mesh screen to remove large coarse fragments and plant material and homogenize the soil material.
Following the final air-drying, six grab samples of soil were collected during soil tub preparation (described below) from the first and fifth soil tubs in each replication block for soil physical and chemical property characterization. Soil sub-samples were weighed, dried in a forced draft oven at 70 °C for at least 48 h, re-weighed to determine the gravimetric water content (GWC) of the air-dried soil, and sieved through a 2 mm mesh screen. Six replicates of the oven-dried, sieved soil (~50 g) were analyzed for particle size distribution using a modified 12 h hydrometer method [43]. Soil pH and electrical conductivity (EC) were potentiometrically measured in a 1:2 soil mass–water volume suspension. In a 1:10 soil mass–extractant volume suspension, Mehlich-3 (M3) extraction was conducted to determine extractable soil nutrient concentrations (i.e., P, K, Ca, Mg, S, Na, Fe, Mn, Zn, Cu, and B) by inductively coupled argon plasma spectrophotometry (ICAPS) [44]. Soil organic matter (SOM) was determined via weight loss on ignition for two hours at 360 °C in a muffle furnace. High-temperature combustion was used to measure total C (TC) and total N (TN) concentrations (VarioMax CN Analyzer, Elementar Americas Inc., Ronkonkoma, NY, USA) [45]. The soil C:N ratio was calculated using the measured TC and TN concentrations. The soil’s lack of effervescence when treated with diluted hydrochloric acid confirmed that all measured soil C was organic C. Soil bulk density was determined using the calculated mass of oven-dried soil added to a tub (~21,515 g) divided by the measured volume of wetted soil within each soil tub (~19,327 cm3). Initial soil properties are summarized in Table 1.

2.2. Treatments and Experimental Design

Five P fertilizer treatments were evaluated in this study. Treatments consisted of MAP, CPST (i.e., Ostara’s Crystal Green), ECST derived from a synthetic (Syn) solution containing a known concentration of P and N (ECSTSyn), ECST derived from a local municipal wastewater source (ECSTReal), and an unamended control (UC) that received no P fertilizer addition.
P fertilizer treatments were arranged in a randomized complete block (RCB) design on a single greenhouse bench. The five P fertilizer treatments were randomized in each block for a total of 15 individual experimental units (i.e., tubs).

2.3. P Fertilizer Sources and Characterization

The most commonly used P fertilizer sources for rice production in Arkansas are triple superphosphate (TSP), diammonium phosphate, and MAP [17]. Since MAP more closely represents the fertilizer grade associated with struvite materials (Table 2), MAP was used in this study as the commonly used, commercially available P fertilizer source and was evaluated in its commercially available, pelletized form. In addition, MAP was the only P fertilizer source evaluated in this study that is highly water-soluble (85 to 90%; Table 2) [41].
The CPST material used in this study was the Crystal Green product produced and marketed by Ostara Nutrient Recovery Technologies, Inc. (Vancouver, Canada), and was evaluated in the commercially available, pelletized form. The CPST material was produced using nutrient recovery systems and contained ~8.3% magnesium (Mg; Table 2) [37]. Ostara Nutrient Recovery Technologies, Inc., commercially produces Crystal Green using their Pearl and waste-activated, sludge-stripping technique to remove internal phosphorus (WASSTRIP) to chemically precipitate struvite granules [34]. The Crystal Green material is commercially available in granular form, ranging in size from 2.5 to 3 mm diameter granules, with reported citrate and water solubilities of 96 and 4%, respectively (Table 2) [37].
Both the ECSTSyn and ECSTReal P fertilizer sources were produced through electrochemical precipitation using a sacrificial Mg anode [2020]. The ECSTSyn material was produced using a synthetically derived solution with known concentrations of P and NH4+-N in the Department of Chemical Engineering at the University of Arkansas. The ECSTReal material was produced using a real wastewater solution collected from the West Side Wastewater Treatment Facility near Fayetteville, AR. Both ECST materials had original crystalline forms, and thus, they were crushed into a powder and chemically analyzed for N, P, K, and Mg concentrations and pH. The pH was potentiometrically measured in a 1:2 fertilizer–water (mass–volume) ratio paste. Total recoverable N, P, K, and Mg were extracted using a concentrated nitric acid digest and measured by ICAPS (Table 2) [37,46]. The ECST P fertilizer sources were the least water-soluble fertilizers compared in this study (2 to 3.8%) [31].
Fertilizer analyses were conducted in Fayetteville, AR, at the University of Arkansas, Division of Agriculture’s Agricultural Diagnostic Laboratory. Chemical analyses of MAP, CPST, and ECSTSyn were conducted and reported by [37]. Table 2 summarizes the chemical composition, pH, and fertilizer grade of the four P fertilizer sources used in this study.

2.4. Soil Tub Preparation

Plastic tubs (55.5 cm long by 39.1 cm wide by 15.1 cm tall, interior dimensions) were set on a single leveled greenhouse bench (1.2 m wide by 4.9 m long and 1.1 m tall). Tubs were filled with ~24 kg of air-dried, sieved soil to an average soil depth of 11.3 cm. After soil addition, polyvinyl chloride (PVC) base collars were installed to the maximum soil depth in the center of each tub. Base collars were 1 cm thick by 30 cm wide by 30 cm tall and beveled to the outside with four 1.25 cm diameter holes drilled equidistant from one another on each side and 12 cm from the bottom to allow for water flow into the base collars. Soil was then saturated to allow for settling, and the distance from the soil surface to the top of each soil tub was measured along each tub edge, within all 15 soil tubs, to determine the average volume of soil in the tubs. Three empty soil tubs were filled with water to the mean saturated soil height inside the tubs (8.9 cm) using a graduated cylinder, and the volume was recorded. The average volume of water was used as the final volume used to estimate the settled soil bulk density in the soil tubs.

2.5. Rice Establishment and Fertilization

On 30 April 2022, the pureline rice variety “Diamond” was manually seeded at a rate of 137 seeds m−2 for a total of 30 seeds per tub. For several weeks prior to planting, soil tubs were watered twice weekly until thoroughly wet, but not saturated, to facilitate weed growth and removal. Weeds were manually removed twice weekly to ensure no effect on soil nutrient concentrations. Rice seeds were planted into visibly wet soil to a depth of 2 cm in three rows parallel to the long side of the soil tub, with 5.3 cm between seeds in a row and 15.6 cm between rows. Rows were established 4 cm away from the tub edges on each side to minimize the effects of limited soil on plant roots. Weeds were manually removed during each watering event after germination from the time soil was first wet until flood establishment. Directly before initial fertilizers were applied, the number of rice plants in each tub was corrected to 18 total plants, with surplus plants being removed. The optimum stand density for pureline variety rice was recommended as 108 to 215 plants m−2; thus, 6 rice plants were kept within each base collar, with the other 12 plants remaining in the outer soil area [36,47].
The Arkansas Rice Production Handbook recommends N, P, and K fertilizers be applied at rates of 168.2 kg N ha−1, 34.2 kg P ha−1, and 83.8 kg K ha−1 for the “Diamond” rice variety grown in flood-irrigated, very-low-soil-test-P Calhoun silt loam soil in Arkansas [17]. Macronutrient fertilizer recommendations were increased by 20% to account for the effects of the shallow soil conditions present in the soil tubs; thus, N, P, and K were applied at rates of 201.8 kg N ha−1, 41.1 kg P ha−1, and 100.5 kg K ha−1 [17,47,48,49]. Phosphorus, K as muriate of potash, and Zn fertilizers were manually broadcast on 23 May 2022 at the 3- to 4-leaf stage (i.e., ~23 days after planting). Since the P fertilizer sources had different N concentrations, with MAP having the largest N concentration, N-(n-butyl) thiophosphoric triamide (NBPT)-coated urea (46% N) was used to equalize, among tubs, the amount of N that was applied with the P fertilizer addition of 20.3 kg N ha−1. Zinc sulfate was applied at a rate of 5.4 kg Zn ha−1, despite optimal initial soil Zn levels, to avoid any possible deficiencies later in the growing season. For each of the fertilizer treatments, 28% was applied within the collar, and the remaining 72% was applied outside of the collar to account for the total area of soil within each of the two zones. Soil tubs were then wet to 0.45 cm3 cm−3 volumetric water content (VWC) to allow fertilizer treatments to incorporate fully by dissolution.
Nitrogen fertilizer, in the form of NBPT-coated urea, was applied at two different points during the rice growing season. The first application was a pre-flood application on 6 June 2022 that was manually broadcast at a rate of 121 kg N ha−1 to reach the recommended pre-flood N fertilization rate of 141.3 kg N ha−1 during the 4- to 5-leaf stage, as some N had already been applied shortly after planting when the N-containing P fertilizer sources were applied [50]. To minimize potential volatilization losses, soil tubs were allowed to dry for five days before urea was applied so the urea could be applied to a relatively dry soil surface. The second N fertilizer application occurred mid-season at the beginning of internode elongation on 27 June 2022 (i.e., ~58 days after planting) at a rate of 60.5 kg N ha−1 and was manually applied directly into the previously established flood in each tub [17].

2.6. Water Management

From 30 April to 2 June, soil tubs were watered to a target VWC of 0.45 cm3 cm−3 three times weekly using filtered tap water. Filtered water was used to minimize the potential effects of salts present in the regular tap water source that was available in the greenhouse. A soil moisture probe (SM 150, Delta-T Devices Ltd., Cambridge, UK) was used to determine the VWC in the top 6 cm inside and outside of the base collar before each watering event. Measured VWC values were averaged together, and the difference between the measured VWC and the desired 0.45 cm3 cm−3 was then used to determine the needed volume of water to achieve the target VWC. The target VWC of 0.45 cm3 cm−3 was determined as the mid-point between saturation (0.58 cm3 cm−3) and the estimated field moisture capacity of undisturbed silt loam soil with 14% sand and 14% clay (0.32 cm3 cm−3) [51]. Sand, clay, and SOM concentrations were used to estimate the field moist capacity of undisturbed silt loam soil using the Soil Water Characteristics sub-routine of the Soil-Plant-Atmosphere-Water (SPAW) Field and Pond Hydrology model (version 6.02.74) [52]. Soil tubs were flooded on 7 June 2022 (i.e., ~38 days after planting) to an average depth of 6.2 cm. Floodwater was refreshed to the maximum depth three times weekly using filtered water. Flooded conditions were allowed to evaporate beginning on 17 September 2022 (i.e., ~140 days after planting), two weeks before plant biomass was harvested.

2.7. Gas Sample Collection, Analyses, and Calculations

Routine gas sampling began on 17 May 2022 and was repeated a total of 21 times throughout the rice growing season. Sampling events occurred on a weekly basis at 17, 23, 26, 31, 37, 40, 45, 52, 58, 61, 66, 73, 80, 87, 101, 108, 113, 120, 128, 134, and 140 days after planting (DAP). The sampling event 26 DAP was added to record gas flux observations three days after P, K, and Zn fertilizers were applied. Sampling events at 40 and 61 DAP were added to record gas flux observations three days after the pre-flood and mid-season urea applications.
Similar to recent greenhouse studies [47,53], gas sampling events took place between 0800 and 0900 h on each sampling date, in which closed chambers were assembled atop each base collar. Base collars were sealed immediately before each sampling event at the four drilled holes using 1.3 cm diameter rubber stoppers. Closed chamber assemblages consisted of a 30 cm diameter by 10 cm tall PVC cap connected to base collars via a rubber flap creating an airtight seam. The PVC caps were mounted with a 9 V battery and wiring system to power a 2.5 cm2 fan fixed to the under-side of the cap to facilitate air movement and mixing within the sealed chamber. A 15 cm long copper refrigerator tube with an inner diameter of 0.63 cm was installed along the interior sidewall of each cap to maintain equal pressure between the enclosed space and the surrounding atmosphere. A 1.25 cm diameter hole was drilled into the top of each cap and fitted with a septum to facilitate the collection of gas samples via a syringe. A single cap was fitted with an additional drilled hole and septa to allow a thermometer to be inserted into the closed chamber during gas sampling events. In response to increasing plant size, 40 and 60 cm tall, 30 cm diameter PVC collar extensions were used throughout the growing season. Extenders were connected to base collars using the same rubber flap method as that used with caps.
Three gas samples were collected from each closed chamber during gas sampling events for a total of forty-five gas samples per sampling date. Samples were collected at the 0, 30, and 60 min time intervals using a 20 mL syringe fitted with a 25 mm long, 0.5 mm diameter needle [47,54]. Separate syringes were used for each chamber to eliminate the contamination of gas samples. At each time interval, cap septa were punctured, and 20 mL of headspace gas was collected. Extracted gas samples were then immediately transferred into pre-evacuated, 10 mL glass vials with pre-crimped steel caps (20 mm headspace crimp cap). Vials were evacuated within 24 h prior to each gas sampling event.
Greenhouse air temperature, barometric pressure, and relative humidity were also recorded at the 0, 30, and 60 min time intervals using a portable weather station (AcuRite, Schaumburg, IL, USA). Internal chamber temperature was recorded at the same time intervals using the inserted thermometer. Chamber height was recorded on each sampling date from the soil or floodwater surface to 0.2 cm from the top of the chamber cap to account for the thickness of the cap lid. Chamber height was used to determine the internal chamber volume. Rubber stoppers, extenders, and caps were removed once gas sampling was completed.
Gas sample analyses were initiated within 8 h of the samples being collected using a Shimadzu GC-2014 ATFSPL 115V gas chromatograph (GC; Shimadzu North America/Shimadzu Scientific Instruments Inc., Columbia, MD, USA). Methane and CO2 concentrations were measured using a flame ionization detector (FID) coupled with a methanizer. An electron capture detector (ECD) was used to measure N2O concentrations. In addition to the 45 gas samples, 14 gas samples from known concentration standards were collected and analyzed (i.e., 1, 5, 10, 20, and 50 mg CH4 kg−1, 0.1, 0.5, 1, 5, 10, and 20 mg N2O kg−1 and 300, 500, and 1000 mg CO2 kg−1). The best fit of a linear regression was used to calculate gas fluxes (mg m−2 h−1) over the 1 h measurement period for each chamber by multiplying the slope of the linear regression characterizing the gas concentrations across the three sampling time intervals by the measured volume of each chamber [6,7,11,47,50,55]. Gas fluxes with negative linear regression slopes were replaced with a zero value to report only GHG emissions, not uptakes. Season-long emissions (kg ha−1 season) were calculated using flux measurements and linear interpolation between consecutive sample dates for each chamber.
The 100 yr global warming potential conversion factors were used to convert CH4 and N2O season-long emissions into CO2-equivalents using factors of 28 and 265, respectively [56]. On a collar-by-collar basis, the total net GHG emissions were calculated using season-long emissions for all three gasses, and reduced net GHG emissions were calculated using season-long emissions for just CH4 and N2O, excluding CO2.
Greenhouse climate data were recorded during each gas sampling event from 17 May 2022 (i.e., 17 DAP) to the final sampling event on 17 September 2022 (i.e., 140 DAP). Season-long greenhouse climate data from sampling periods are summarized in Table 3. Season-long chamber air temperatures were recorded during sampling periods and ranged from 18.9 to 37.4 °C with a mean of 28.5 °C (Table 3). Additionally, season-long greenhouse air pressure was recorded during sampling periods and ranged from 59.4 to 77 cm Hg with a mean of 75.4 cm Hg (Table 3).

2.8. Statistical Analyses

Based on a split-plot experimental design with a P fertilizer source as the whole-plot factor arranged as an RCB design with three blocks and time as the split-plot factor, a two-factor analysis of variance (ANOVA) was conducted to evaluate the effects of P fertilizer treatment, measurement date, and their interaction on CH4, N2O, and CO2 fluxes throughout the growing season. A one-factor ANOVA was conducted to evaluate the effects of P fertilizer treatment on season-long CH4, N2O, and CO2 emissions, total net GHG emissions, and CO2-excluded net GHG emissions. All statistical analyses were conducted using the PROC GLIMMIX procedure with parameters evaluated using a gamma distribution in SAS (version 9.4, SAS Institute, Inc., Cary, NC, USA). Significance was determined at p < 0.05.

3. Results and Discussion

3.1. Initial Soil Properties

Soil properties were assessed at the beginning of this study to detail soil physical and chemical characteristics prior to any treatment application. A silt loam soil texture was confirmed, averaging 0.14, 0.72, and 0.14 g g−1 sand, silt, and clay, respectively (Table 1). The mean initial soil pH was 7.3, which was greater than what is considered optimal for flood-irrigated rice grown on silt loam soil regarding P (pH < 6.5) and Zn (pH < 6.0) availability (Table 1) [17]. The mean initial soil test K concentration (72.7 mg kg−1; Table 1) was below the recommended optimal level (131–175 mg kg−1), which necessitated K fertilizer additions [17]. The mean initial soil test Zn concentration (10.5 mg kg−1; Table 1) was considered optimal (>4.1 mg kg−1) for silt loam soil in Arkansas [17]. Initial SOM concentration averaged 17.4 g kg−1 (Table 1). As was desired for this study, the mean initial M3-P concentration was 6.4 mg kg−1 (Table 1), which was in the very-low category (M3-P < 9 mg kg−1) for soil pH > 6.5 for rice production on silt loam soil in Arkansas [17].

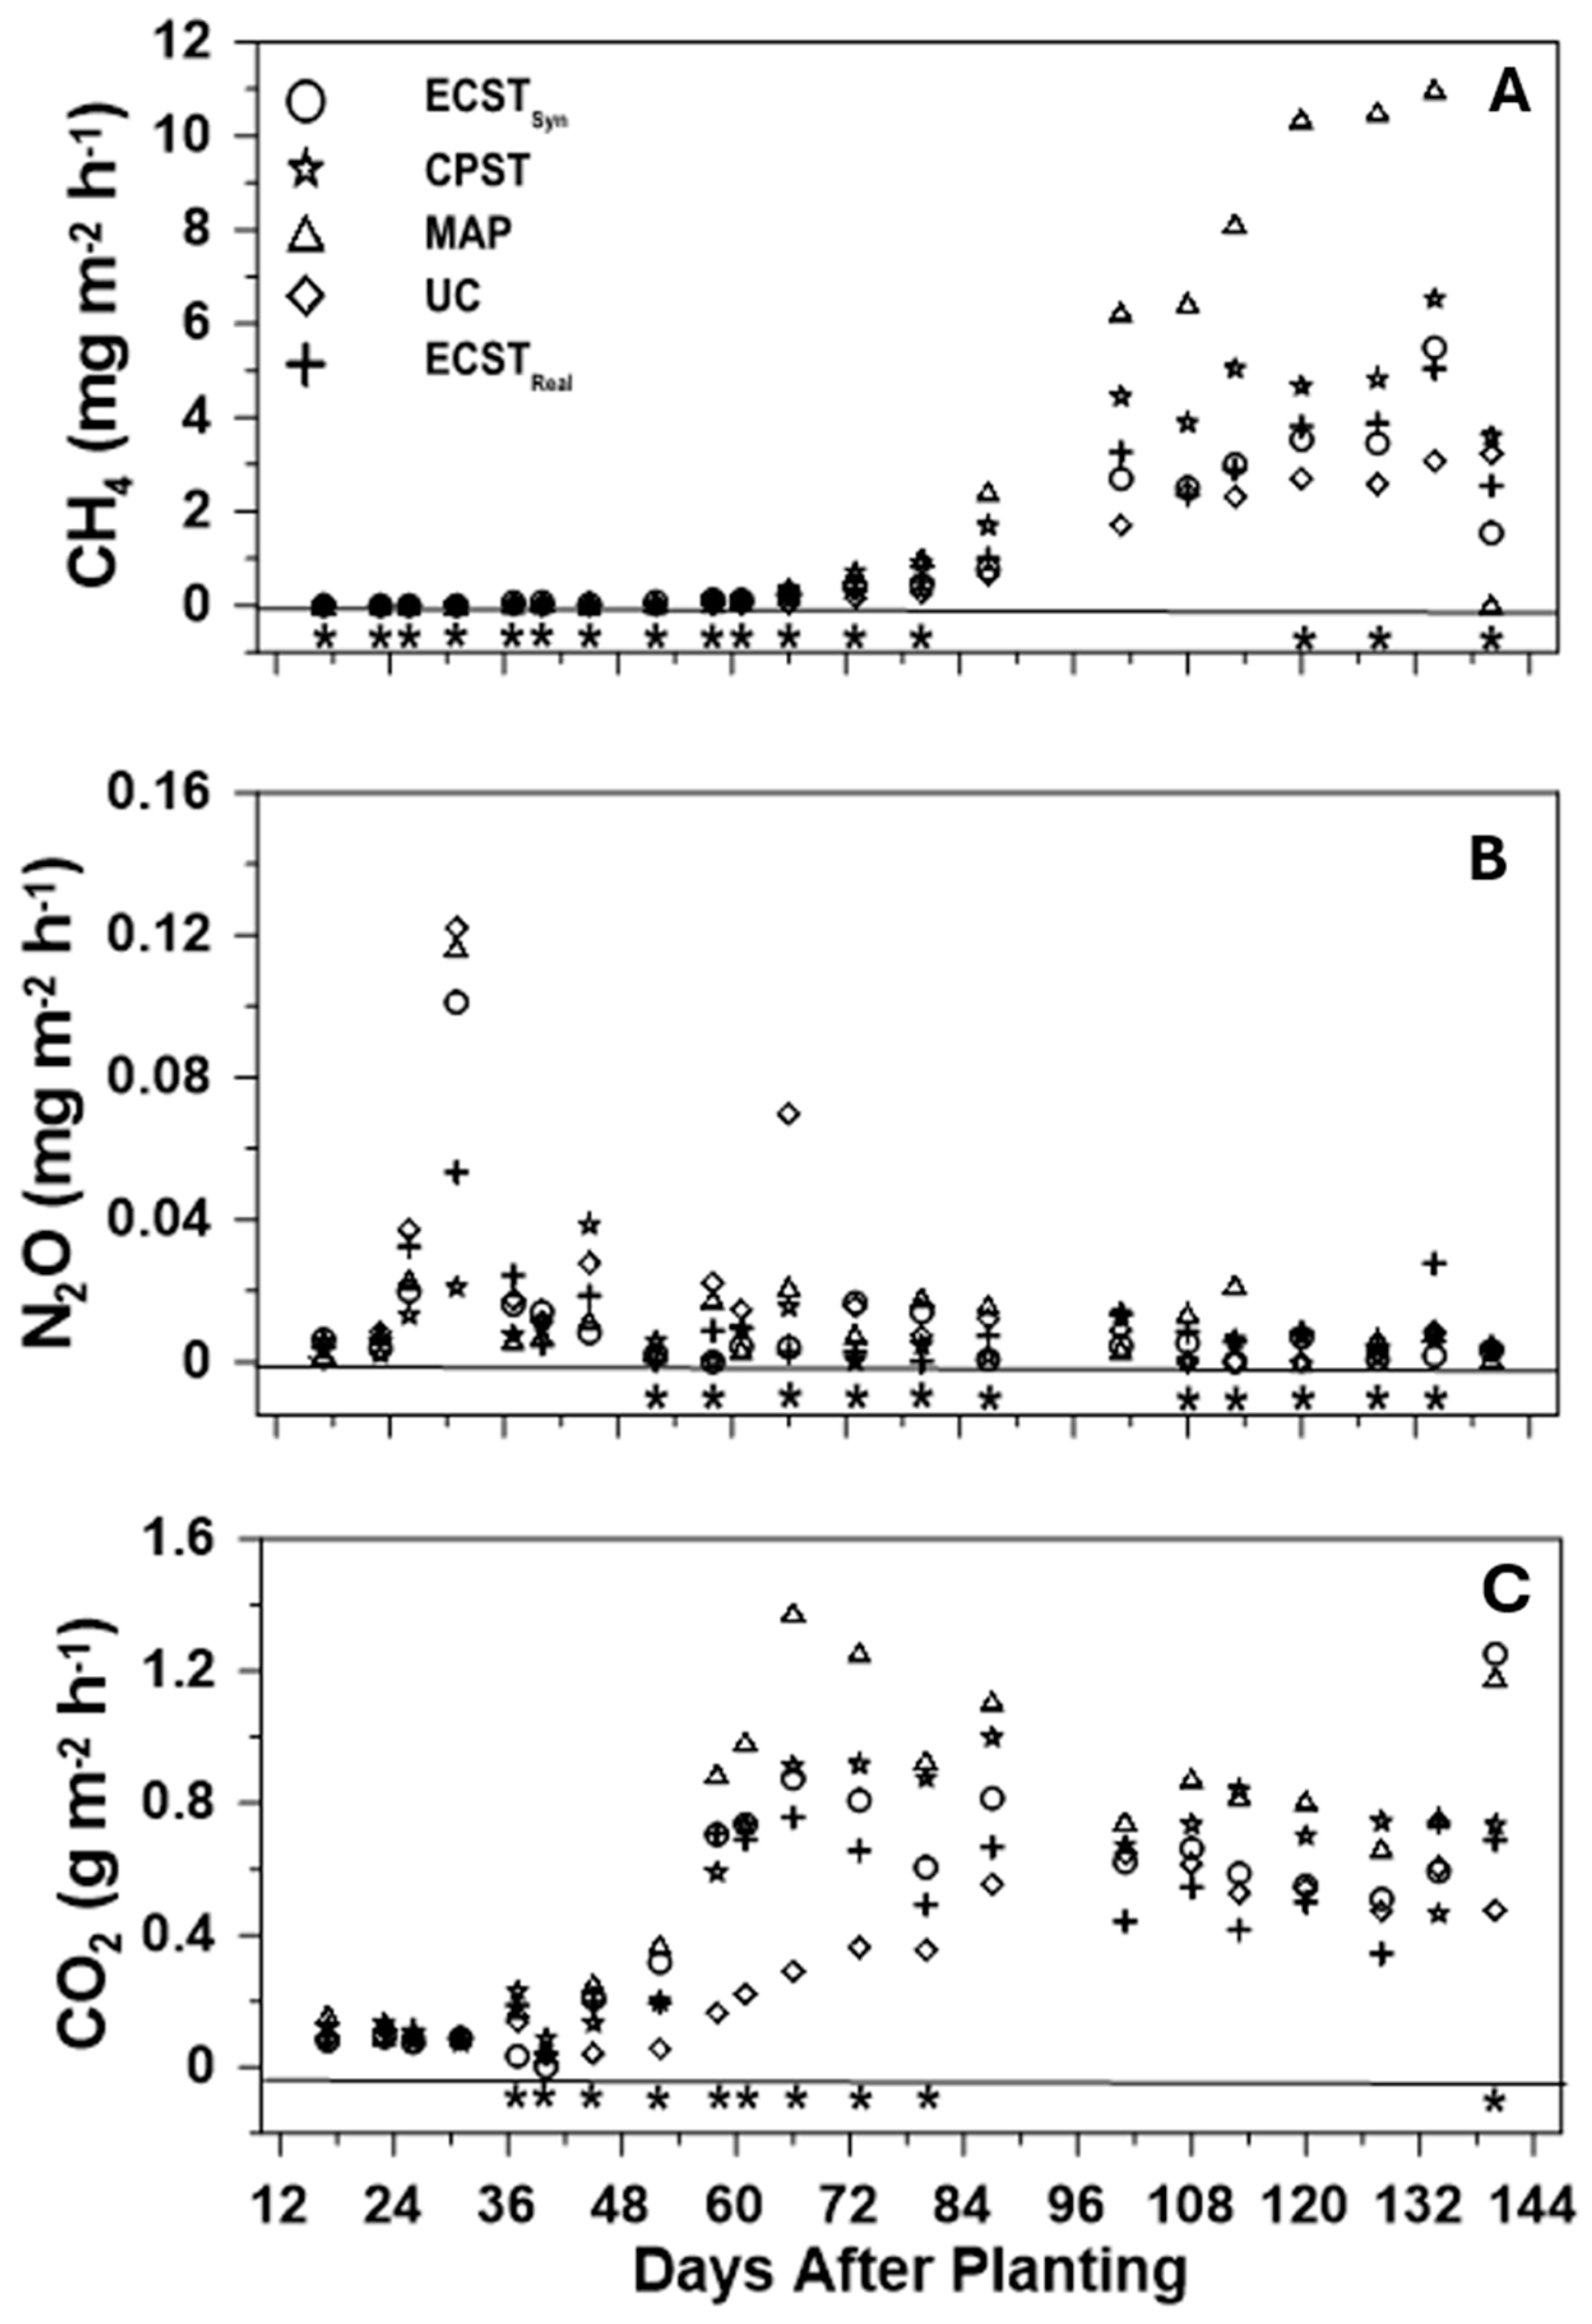
3.2. Greenhouse Gas Fluxes

As expected, GHG fluxes varied temporally over the course of the growing season. Methane fluxes ranged from <0.01 mg CH4 m−2 h−1 at 17 DAP from the UC to 11 mg CH4 m−2 h−1 at 134 DAP from MAP (Figure 1A). Generally, CH4 fluxes were low (<0.3 mg CH4 m−2 h−1) in the first half of the growing season in all P fertilizer sources and began to increase at approximately 66 DAP in all P fertilizer sources until the flood was released at 140 DAP (Figure 1A). Nitrous oxide ranged from <0.01 mg N2O m−2 h−1 at 73 DAP from CPST to 0.12 mg N2O m−2 h−1 at 31 DAP from the UC (Figure 1B). Generally, in contrast to CH4, N2O fluxes were low (<0.03 mg N2O m−2 h−1) for the majority of the growing season, except for four sample dates (i.e., 26, 31, 45, and 66 DAP) when N2O fluxes from several P fertilizer sources exceeded 0.03 mg N2O m−2 h−1 (Figure 1B). Carbon dioxide ranged from <0.01 g CO2 m−2 h−1 at 40 DAP from ECST to 1.4 g CO2 m−2 h−1 at 66 DAP from MAP (Figure 1C). Generally, similarly to CH4, CO2 fluxes were low (<0.3 g CO2 m−2 h−1) early in the growing season, then, in contrast to CH4, began to increase around 45 DAP until 66 to 87 DAP when CO2 fluxes generally decreased until right before flood release (Figure 1C).
The range of CH4 fluxes measured in this greenhouse study was comparable to that reported by Brye et al. [57] and Humphreys et al. [55] from field trials, where rice was managed using flood irrigation on silt loam soil in Arkansas with fluxes starting low and reaching peaks of 20.8 mg CH4 m−2 h−1 at 82 DAP and 12.8 mg CH4 m−2 h−1 at 89 DAP, respectively. However, the N2O flux range in the current study differed somewhat from that reported from a field trial by Rector et al. [6], where the mean N2O fluxes peaked for the pureline variety “LaKast” under flood irrigation at 0.48 mg N2O m−2 h−1 at 57 DAP when mid-season N was added into floodwater. However, Rector et al. [6] and Kongchum et al. [58] reported zero or near-zero fluxes for the majority of the growing season, especially after the flood was established, which were comparable to the N2O flux trends reported in the current greenhouse study.
Each of the GHG fluxes differed (p < 0.01) among P fertilizer sources over time (Table 4). Of the 21 total sample dates, 1 sample date (i.e., 87 DAP) included CH4 fluxes in all P fertilizer sources that did not differ (p > 0.05) from a flux of zero (Figure 1A). On 16 of the 21 sample dates (i.e., 17, 23, 26, 31, 37, 40, 45, 52, 58, 61, 66, 73, 80, 120, 128, and 140 DAP), CH4 fluxes differed (p < 0.05) among P fertilizer sources (Figure 1A). On 5 of the 16 sample dates (i.e., 23, 26, 80, 120, and 128 DAP) when CH4 fluxes differed (p < 0.05) among P fertilizer sources, the CH4 flux from MAP was numerically the largest and similar to at least one other P fertilizer source, most commonly CPST, but was never similar to that of the UC (Figure 1A). The peak CH4 fluxes for MAP, CPST, ECSTSyn, and ECSTReal occurred near the end of the growing season at 134 DAP and were 11, 6.5, 5.5, and 5 mg CH4 m−2 h−1, respectively (Figure 1A). The peak CH4 flux from the UC (3.2 mg CH4 m−2 h−1) occurred at 140 DAP (Figure 1A). There was no difference (p > 0.05) in the peak CH4 flux among P fertilizer sources (Figure 1A).
In contrast to what was hypothesized, CH4 flux peaks occurred for MAP, CPST, ECSTSyn, and ECSTReal at 134 DAP and were followed by the UC CH4 flux peak at 140 DAP (Figure 1A). Throughout the growing season, flooded conditions were maintained to equal depths; thus, the influence of the flood on soil redox potentials was likely similar in all soil tubs. Methane fluxes from ECSTSyn and ECSTReal were also hypothesized to be similar throughout the growing season, but they differed (p < 0.05) at 17, 31, and 40 DAP but remained similar to one another on all other sampling dates (Figure 1A).
Nitrous oxide fluxes differed from a flux of zero (p < 0.05) for all P fertilizer treatments across 17 of the 21 sample dates (17, 23, 26, 31, 37, 40, 45, 52, 61, 66, 73, 80, 87, 101, 128, 134, and 140 DAP; Figure 1B). On 11 of the 21 sampling dates (i.e., 52, 58, 66, 73, 80, 87, 108, 113, 120, 128, and 134 DAP), N2O fluxes differed (p < 0.05) among P fertilizer sources (Figure 1B). Peak N2O fluxes for MAP, ECSTSyn, ECSTReal, and the UC occurred at 31 DAP, with the CPST peak N2O flux occurring at 45 DAP (Figure 1B). Peak N2O fluxes for MAP, ECSTSyn, ECSTReal, CPST, and the UC were 0.12, 0.10, 0.05, 0.04, and 0.12 mg N2O m−2 h−1, respectively (Figure 1B). On 5 of the 11 sample dates (i.e., 80, 87, 108, 113, and 128 DAP) when N2O fluxes differed (p < 0.05) among P fertilizer sources, the N2O flux from MAP was numerically the greatest and was similar (p > 0.05) to at least one other P fertilizer source, but it was greater (p < 0.05) than that of the UC on each sampling date (Figure 1B).
Due to the flooded and likely anaerobic soil conditions, N2O fluxes were minimized, as the aerobic soil conditions needed for nitrification were limited temporally to the pre- and post-flood portions of the season, thus limiting the substrate available for the subsequent denitrification during anaerobic periods. Nitrous oxide peak fluxes for MAP, ECSTSyn, ECSTReal, and the UC occurred at 31 DAP and likely resulted from the loss of N as N2O after N was applied to the soil during P fertilizer source applications at 23 DAP (Figure 1B) [6,7]. Nitrous oxide flux peaks that occurred after P fertilization, but before flood establishment, highlight the potential risk of N loss from N-containing P fertilizers before flood establishment (Figure 1B). After the flood was established, N2O fluxes were generally low (<0.03 mg N2O m−2 h−1) for the majority of the season, but they did increase after mid-season N applications in the UC at 66 DAP before returning to near-constant and low fluxes (Figure 1B).
Peak N2O fluxes, contrary to what was hypothesized, occurred on the same day (31 DAP) for MAP, ECSTSyn, ECSTReal, and the UC and occurred at 45 DAP for CPST (Figure 1B). Peak N2O fluxes were likely related to the loss of N from P fertilizer additions pre-flood, with the presence of the flood limiting the loss of N from pre-flood and mid-season N applications [6,7,9]. In contrast to that hypothesized, N2O fluxes from ECSTSyn and ECSTReal differed during the growing season on 4 of the 21 sample dates (i.e., 80, 87, 113, and 134 DAP; Figure 1B). The overall trend of N2O flux peaks occurring after fertilizer application has been reported by previous studies, such as in Rector et al. [6,7], Della Lunga [59,60], and Karki et al. [61], in which flux peaks were primarily influenced by N application and flood establishment timing.
Comparable to CH4, on 20 of the 21 sampling dates, CO2 fluxes from each P fertilizer source differed (p < 0.05) from a flux of zero, where ECSTSyn at 40 DAP had the only CO2 flux to not differ (p > 0.05) from a flux of zero (Figure 1C). On 10 of the 21 sampling dates (i.e., 37, 40, 45, 52, 58, 61, 66, 73, 80, and 140 DAP), CO2 fluxes differed (p < 0.05) among P fertilizer sources (Figure 1C). Peak CO2 fluxes for MAP, ECSTSyn, ECSTReal, CPST, and the UC occurred at 66, 140, 66, 87, and 101 DAP, and they were 1.4, 1.3, 0.8, 1, and 0.6 g CO2 m−2 h−1, respectively (Figure 1C). Carbon dioxide flux peaks did not differ (p > 0.05) from one another, but CO2 flux peaks at 66 and 140 DAP differed among P fertilizer sources on the sampling date in which the peak value was similar (p > 0.05) to all other P sources but differed (p < 0.05) from and was greater than that of the UC. Carbon dioxide fluxes were numerically the greatest from MAP on 7 of the 10 sampling dates (i.e., 45, 52, 58, 61, 66, 73, and 80 DAP) that P fertilizer sources differed (p < 0.05) and were similar to at least one other P fertilizer source on the same sampling date (Figure 1C). On 6 of the 10 sampling dates when CO2 fluxes differed (p < 0.05) among P fertilizer sources, CO2 fluxes were the smallest from the UC and differed (p < 0.05) from all other P fertilizer sources (Figure 1C).
In contrast to that hypothesized, CO2 flux peaks occurred the earliest and on the same sampling date (66 DAP) for MAP and ECSTReal (Figure 1C). Additionally, the CO2 fluxes from ECSTSyn and ECSTReal P fertilizer sources differed during the growing season at 37 and 40 DAP, but they were similar to one another on the other 19 sampling dates (Figure 1C). Season-long CO2 fluxes represent CO2 released plant and soil microbial respiration, which generally increased for all treatments, likely due to plant growth, until ~66 DAP when CO2 fluxes began to steadily decrease across all treatments until 134 DAP (Figure 1C). The increase in CO2 flux that occurred on the final sampling date (140 DAP) was likely related to decreasing soil moisture as the flood was allowed to drain beginning at 128 DAP, thus allowing for an increasingly aerobic soil environment that would have been conducive to increased CO2 production (Figure 1C) [59]. Both the magnitude and temporal trends for CO2 fluxes measured in the current study were similar to those reported in another flood-irrigated rice greenhouse study conducted by Della Lunga [62] utilizing ECSTSyn, CPST, and a no-P-added UC on silt loam soil from Arkansas.

3.3. Season-Long Emissions

Season-long CH4 and CO2 emissions differed (p ≤ 0.01) among P fertilizer sources during the 2022 rice growing season, while season-long N2O emissions were unaffected (p > 0.05) by P fertilizer source (Table 5). Methane emissions ranged from 29.9 kg CH4 ha−1 season−1 from the UC, which did not differ from ECSTReal and ECSTSyn, to 98.7 kg CH4 ha−1 season−1 from MAP, which did not differ from CPST (Table 5). Season-long CH4 emissions from MAP were at least 2.2 times greater than those from ECSTSyn and ECSTReal and were 3.3 times greater than those from the UC, while season-long CH4 emissions from CPST were 2.0 times greater than those from the UC (Table 5). Similar to that hypothesized, season-long CH4 emissions did not differ among ECSTSyn, ECSTReal, and CPST (Table 5).
In contrast to that hypothesized, season-long CH4 emissions differed among P fertilizer sources (Table 5). Differences in CH4 emissions during the 2022 growing season were likely due to differences in plant response to P fertilizer sources, as season-long CH4 emission trends were similar to trends present for aboveground DM and nutrient uptakes, total aboveground DM and P and Mg uptakes, and total plant P and Mg uptakes, as reported by Arel [63]. The greater plant response to MAP, coupled with very-low-initial-soil-test-P soil, likely resulted in an increased release of C-rich root exudates readily consumable by methanogenic microorganisms by MAP-fertilized rice, as reported in previous studies [50,64,65].
Season-long CH4 emissions from the ECST sources were lower (p < 0.05) than those from MAP, but they were similar (p > 0.05) to those of the UC (Table 5). Differences in the release of weak acid root exudates and P fertilizer source solubilities also likely explain the reduction in CH4 emissions from the ECST sources compared to MAP (Table 5). Previous studies have shown that the slow release characteristics of struvite fertilizers may limit CH4 emissions compared to more water-soluble fertilizers, such as MAP [12,59]. The quick release of nutrients by MAP likely stimulated methanogenic activity more compared to the ECST sources, as the slow release of nutrients from ECST has been shown to progressively increase with plant growth, thus allowing for greater competition for nutrients by plants and reducing CH4 emissions generated by methanogenic microorganisms [12,59,66]. P fertilizer source solubility likely impacted CH4 emissions as a result of the response of methanogenic soil microbial communities to fertilization. Increasing P fertilizer additions to rice grown in P-deficient soils have been shown to increase the abundance and potential activity of rhizosphere-inhabiting methanogens [67]. Thus, the CH4 emission trend reported, with MAP being numerically the greatest, followed by the struvite P fertilizer sources and then the UC, was likely due to temporal differences in nutrient release, whereas MAP-fertilized treatments stimulated methanogens the earliest, resulting in the greatest potential for CH4 production by increasing microbial abundance [67]. Additionally, the relatively large concentration of Mg present in struvite sources (~10%) compared to MAP has been reported to negatively impact methanogenic processes, further decreasing CH4 release [68].
The range of season-long CH4 emissions measured in the current study was comparable to that in both field and greenhouse studies by Humphreys et al. [55] and Della Lunga [59], in which average season-long CH4 emissions of 77.7 kg CH4-C ha−1 season and 31.15 kg CH4 ha−1 season−1, respectively, were reported from flood-irrigated rice grown in silt loam soil. However, season-long CH4 emissions in the current study were considerably lower, often by 50%, compared to previous reports [57,69,70], highlighting the possible variation in CH4 production from flood-irrigated rice based on nutrient and water management, SOM concentrations, and rice cultivar.
Season-long N2O emissions ranged from 0.2 kg N2O ha−1 season−1 from CPST to 0.5 kg N2O ha−1 season−1 from the UC (Table 5). As was hypothesized, season-long N2O emissions did not differ among P fertilizer sources and did not differ between the two ECST P fertilizer sources. Previous research on N2O emissions from flood-irrigated rice grown in Arkansas [6,7] reported comparable season-long N2O emissions to those measured in the current study for the 2022 growing season (Table 5). In a rice field study conducted in eastern Arkansas in a direct-seeded, delayed-flood system on silt loam soil, Rector et al. [6] reported N2O emissions ranging from 0.27 kg N2O-N ha−1 season−1 under no tillage with NBPT-coated urea to 0.50 kg N2O-N ha−1 season−1 under no tillage with non-coated urea. Additionally, another field study reported season-long N2O emissions of 0.80 and 0.38 kg N2O-N ha−1 season−1 from a delayed-flood rice production system planted with the pureline rice cultivar “LaKast” and the hybrid rice cultivar “XL753”, respectively [7]. Due to the presence of flooded conditions, N2O production from flood-irrigated rice is significantly limited and generally occurs after N fertilizers are applied but before the flood is established and at the end of the season when the flooded soil is allowed to dry, as occurred in the current study (Figure 1B). The results of the current and previous studies emphasize the significant relationship between N and water management in rice production and the risk of N loss if flooded conditions do not quickly follow N applications [6,7,17].
Season-long CO2 emissions ranged from 10.4 Mg CO2 ha−1 season−1 from the UC, which did not differ from ECSTReal, to 21 Mg CO2 ha−1 season−1 from MAP, which did not differ from CPST (Table 5). Similar to CH4, season-long CO2 emissions from MAP were at least 1.3 times greater than those from ECSTSyn and ECSTReal and were twice as great compared to the UC, while season-long CO2 emissions from CPST, ECSTSyn, and ECSTReal were at least 1.4 times greater than those from the UC (Table 5). Similar to CH4 and what was hypothesized, season-long CO2 emissions did not differ among ECSTSyn, ECSTReal, and CPST (Table 5).
In contrast to that hypothesized, season-long CO2 emissions differed (p < 0.05) among P fertilizer sources (Table 5). During the 2022 growing season, CO2 emission differences among P fertilizer sources paralleled or were comparable to the majority of plant response variables, as CO2 emissions were likely related to differing respiration rates from both plants and soil microorganisms in response to the P fertilizer sources and the resulting varied responses [37,59,63]. Additionally, the significantly greater season-long CO2 emissions from MAP compared to the ECST and ECST sources were likely due to the characteristic slow release of nutrients from the ECST sources compared to more water-soluble fertilizers like MAP, as plant response did not differ (p > 0.05) among either of the ECST sources and MAP, except in terms of aboveground tissue N concentration and Mg uptake and total aboveground DM and Mg uptake [63]. During the growing season, rapidly available nutrients from MAP likely stimulated plant and soil microbial respiration, especially early in the growing season, when competition from plants for nutrients was the least influential compared to the slowly available nutrients from the ECST sources, thus increasing CO2 emissions from MAP [12,17,37]. Greater aerenchyma tissue from MAP-fertilized rice could have also influenced CO2 emission measurements, as aboveground DM was numerically larger from MAP compared to both ECST sources, and the total aboveground DM was the greatest from MAP, which was similar (p > 0.05) to that of ECSTSyn but differed (p < 0.05) from that of ECSTReal (Table 5) [50].

3.4. Net Greenhouse Gas Emissions

To integrate the combined effects of multiple GHGs, total net GHG emissions were calculated as the sum of CO2-equivalents for CH4, N2O, and CO2 based on conversion factors from the 6th IPCC assessment [56]. Similar to season-long CH4 and CO2 emissions, total net GHG emissions differed (p < 0.05) among P fertilizer sources (Table 5). Total net GHG emissions ranged from 11,426 kg CO2-equivalents season−1 from the UC, which did not differ (p > 0.05) from ECSTReal, to 23,841 kg CO2-equivalents season−1 from MAP, which did not differ from CPST (Table 5). The total net GHG emissions from MAP were at least 1.4 times greater than those from ECSTSyn and ECSTReal and were 2.1 times greater than those from the UC, while the total net GHG emissions from CPST, ECSTSyn, and ECSTReal were at least 1.2 times greater than those from the UC (Table 5). Similar to that hypothesized, total net GHG emissions did not differ among the three struvite P sources (Table 5). Averaged across treatments, CO2-equivalents from CH4 and N2O represented 8.5 and 0.6% of the total net GHG emissions, respectively (Table 5). However, considering that CH4 and N2O emissions represented <10% of the total net GHG emissions and that the focus of many previous studies has been on limiting the production of CH4 and N2O in rice production systems due to the difficulty and impracticality of regulating soil and plant respiration, CO2-excluded net GHG emissions using conversion factors from the 6th IPCC assessment were calculated [56,71].
Similar to total net GHG emissions, the CO2-excluded net GHG emissions differed (p < 0.05) among P fertilizer sources (Table 5). The CO2-excluded net GHG emissions ranged from 977.5 kg CO2-equivalents from the UC, which did not differ from ECSTReal and ECSTSyn, to 2880.6 kg CO2-equivalents from MAP, which did not differ from CPST (Table 5). Similar to total net GHG emissions, the CO2-excluded net GHG emissions were at least 2.2 times greater from MAP than those from ECSTSyn and ECSTReal and were 2.9 times greater than those from the UC, while the CO2-excluded net GHG emissions from CPST, ECSTSyn, and ECSTReal were at least 1.2 times greater than those from the UC (Table 5). Averaged across P fertilizer sources, CO2-equivalents for CH4 and N2O represented 92.3 and 7.7%, respectively, of the CO2-excluded net GHG emissions, emphasizing the importance of season-long CH4 emissions as a part of net GHG emission calculations from flood-irrigated rice production systems in Arkansas (Table 5). Similar to that hypothesized, the CO2-excluded net GHG emissions did not differ between the three struvite P fertilizer sources (Table 5).
In contrast to that hypothesized, the CO2-excluded net GHG emissions differed (p < 0.05) among P fertilizer sources (Table 5). Due to the majority of the CO2-excluded net GHG emissions being CH4-emission-dominated, the results of the CO2-excluded net GHG emissions and rationale were comparable to the results and rationale for the season-long CH4 emissions. The contribution of N2O emissions to the total and the CO2-excluded net GHG emissions was relatively low (0.6 and 7.7%, respectively) compared to CH4 and represented the benefits of flood irrigation in terms of reducing N loss via denitrification, as fluctuating aerobic and anaerobic conditions to stimulate subsequent nitrification and denitrification were not present for the majority of the growing season [17]. The significant decrease in the total and CO2-excluded net GHG emissions from both of the ECST sources reported by the current study, relative to MAP, emphasized the potential for a more sustainable production of rice in Arkansas under conventional flood-irrigated systems due to the slow release characteristics associated with struvite fertilizers. Generally, the slow release behavior of struvite can dramatically impact the release of GHG. Similar to the results of the current study, previous studies have shown decreased net GHG emissions from struvite-fertilized treatments compared to more water-soluble fertilizers, such as triple superphosphate, diammonium phosphate, and MAP [12,53,62]. Decreases in GHG emissions in struvite fertilizer treatments were likely directly related to the low water solubility of struvite, as the dissolution of struvite particles occurs as a result of increasing weak acid exudation from plant roots as plant biomass increases. In comparison to MAP, a highly water-soluble fertilizer, N and P present in struvite are relatively unavailable early in the growing season and, as a result, less susceptible to use by microorganisms responsible for the production of CH4 and N2O [29,62]. Additionally, throughout the growing season, the use of struvite likely has the potential to decrease GHG emissions, as competition for N and P between microorganisms and plants is enhanced as nutrient demand and growth increase simultaneously [37,62].

4. Conclusions

This study aimed to quantify the environmental implications of flood-irrigated rice grown in a greenhouse fertilized with ECSTReal compared to various other P fertilizer sources. In contrast to that hypothesized, CH4 peak fluxes for P-fertilized rice occurred at the same time and did not differ among P-fertilized treatments. Additionally, peak N2O fluxes differed from those hypothesized, as peak fluxes occurred for the UC, ECSTSyn, ECSTReal, and MAP at 31 DAP, but did not differ from one another. Contrary to that hypothesized, peak CO2 fluxes for MAP and ECSTReal occurred at 66 DAP and were similar, while peak CO2 fluxes from CPST, the UC, and ECSTSyn occurred at 87, 101, and 140 DAP, respectively. Although CH4, N2O, and CO2 fluxes were expected to peak the earliest from MAP, followed by ECSTSyn and ECSTReal, then CPST, and then the UC, GHG fluxes followed similar trends during the growing season and often peaked during the same weeks. In contrast to that hypothesized, season-long CH4 and CO2 emissions differed among P fertilizer sources. Contrary to that hypothesized, the total and CO2-excluded net GHG emissions were the greatest from MAP, which did not differ from CPST, and the smallest from the UC, which was similar to both ECST sources.
Similar to that hypothesized, the ECSTReal and ECSTSyn sources did not differ among P fertilizer sources for any measured or calculated GHG parameter. The results showed that the novel ECSTReal material behaved similarly to ECSTSyn and often behaved similarly to, and at times had a lower magnitude across numerous GHG properties than, MAP, providing important evidence for the potential environmental benefits that ECSTReal may provide in terms of improved nutrient recycling and wastewater and atmospheric quality.
As previous research into both the environmental and agronomic value of struvite has primarily focused on forms of CPST, with ECST slowly gaining attention, the current study represents an important extension of past research to quantify the efficiency and potential environmental benefits of using struvite created from a real wastewater source regarding impacts on GHG fluxes and emissions. The current study reported that the use of an ECST P fertilizer source could significantly decrease CH4 and CO2 emissions without increasing N2O emissions to the point that season-long CH4 emissions from ECST-fertilized rice were more similar to those of the no-P-added UC than to rice that received widely used, commercially available MAP fertilizer. As a result, the use of ECST as the primary P fertilizer source in flood-irrigated rice could significantly decrease the net GHG emissions primarily associated with the release of CH4 and N2O. Further research into the use of ECST P fertilizer sources across various soil textures, pureline and hybrid rice varieties, climates, and irrigation practices is necessary to better understand the effects of ECST on greenhouse gas fluxes and emissions. Additionally, further research into how ECST impacts crop yield and soil health on the field scale is warranted to develop sound recommendations.

Author Contributions

Conceptualization, C.M.A., K.R.B. and D.D.L.; Methodology, C.M.A., K.R.B. and D.D.L.; Software, D.D.L., C.M.A. and K.R.B.; Formal Analysis, C.M.A. and D.D.L.; Investigation, C.M.A. and D.D.L.; Resources, K.R.B.; Data Curation, C.M.A. and D.D.L.; Writing—Original Draft Preparation, C.M.A.; Writing—Review and Editing, K.R.B., D.D.L., T.L.R. and R.A.; Supervision, K.R.B. and D.D.L.; Project Administration, K.R.B.; Funding Acquisition, K.R.B. All authors have read and agreed to the published version of the manuscript.

Funding

This work was supported by a grant from the USDA-NIFA-AFRI Water for Food Production Systems program (Award # 2018-68011-28691).

Institutional Review Board Statement

Not applicable.

Data Availability Statement

The raw data supporting the conclusions of this article will be made available by the authors on request.

Acknowledgments

The greenhouse and laboratory assistance provided by Diego Della Lunga, Shane Ylagan, Lauren Gwaltney, and Jonathan Brye was greatly appreciated. This manuscript represents a component of the master’s degree research work conducted by Chandler Arel and was performed at the University of Arkansas in partial fulfillment of the requirements for the graduate degree requirements in the Department of Crop, Soil, and Environmental Sciences.

Conflicts of Interest

The authors declare no conflicts of interest.

References

  1. Intergovernmental Panel on Climate Change (IPCC) History of the IPCC. Available online: https://www.ipcc.ch/about/history/ (accessed on 27 March 2025).
  2. Cordell, D.; Drangert, J.; White, S. The story of phosphorus: Global food security and food for thought. Glob. Environ. Chang. 2009, 19, 292–305. [Google Scholar] [CrossRef]
  3. United States Environmental Protection Agency (USEPA) Inventory of U.S. Greenhouse Gas Emissions and Sinks: 1990–2020. Available online: https://www.epa.gov/ghgemissions/inventory-us-greenhouse-gas-emissions-and-sinks-1990-2020 (accessed on 27 March 2025).
  4. Brady, N.C.; Weil, R.R. The Nature and Properties Soils, 15th ed.; Pearson: London, UK, 2016. [Google Scholar]
  5. Motschenbacher, J.M.; Brye, K.R.; Anders, M.M.; Gbur, E.E.; Slaton, N.A.; Evans-White, M.A. Daily soil surface CO2 flux during non-flooded periods in flood-irrigated rice rotations. Agron. Sustain. Dev. 2015, 35, 771–782. [Google Scholar] [CrossRef]
  6. Rector, C.; Brye, K.R.; Humphreys, J.J.; Norman, R.J.; Gbur, E.E.; Hardke, J.T.; Willett, C.; Evans-White, M.A. N2O emissions and global warming potential as affected by water management and rice cultivar on an Alfisol in Arkansas, USA. Geoderma Reg. 2018, 14, e00170. [Google Scholar] [CrossRef]
  7. Rector, C.; Brye, K.R.; Humphreys, J.; Norman, R.J.; Slaton, N.A.; Gbur, E.E.; Willett, C.; Evans-White, M.E. Tillage and coated-urea effects on nitrous oxide emissions from direct-seeded, delayed-flood rice production in Arkansas. J. Rice Res. Dev. 2018, 1, 25–37. [Google Scholar] [CrossRef]
  8. Li, L.; Huang, Z.; Mu, Y.; Song, S.; Zhang, Y.; Tao, Y.; Lixiao, N. Alternative wetting and drying maintains rice yield and reduces global warming potential: A global meta-analysis. Field Crop Res. 2024, 318, 109603. [Google Scholar] [CrossRef]
  9. Liu, X.J.; Mosier, A.R.; Halvorson, A.D.; Reule, C.A.; Zhang, F.S. Dinitrogen and N2O emissions in arable soils: Effect of tillage, N source and soil moisture. Soil Biol. Biochem. 2007, 39, 2362–2370. [Google Scholar] [CrossRef]
  10. Dubey, S.K. Microbial ecology of methane emission in rice agroecosystem: A review. Appl. Ecol. Environ. Res. 2005, 3, 1–27. [Google Scholar] [CrossRef]
  11. Della Lunga, D.; Brye, K.R.; Slayden, J.M.; Henry, C.G.; Wood, L.S. Soil moisture, temperature, and oxidation-reduction potential fluctuations across a furrow-irrigated rice field on a silt-loam soil. J. Rice Res. Dev. 2020, 13, 103–114. [Google Scholar] [CrossRef]
  12. Della Lunga, D.; Brye, K.R.; Slayden, J.M.; Henry, C.G.; Wood, L.S. Relationships among soil factors and greenhouse gas emissions from furrow-irrigated Rice in the mid-southern, USA. Geoderma Reg. 2021, 24, e00365. [Google Scholar] [CrossRef]
  13. Penning, H.; Conrad, R. Quantification of carbon flow from stable isotope fractionation in rice field soils with different organic matter content. Org. Geochem. 2007, 38, 2058–2069. [Google Scholar] [CrossRef]
  14. Statista World Rice Acreage 2020. Available online: https://www.statista.com/statistics/271969/world-rice-acreage-since-2008/#statisticContainer (accessed on 27 March 2025).
  15. Hardke, J. Trends in Arkansas rice production, 2021. In BR Wells Rice Research Studies 2021; Hardke, J., Sha, X., Bateman, N., Eds.; University of Arkansas Systems Division of Agriculture Cooperative Extension Service: Little Rock, AR, USA, 2022; pp. 11–18. [Google Scholar]
  16. Henry, C.G.; Hirsch, S.L.; Anders, M.M.; Vories, E.D.; Reba, M.L.; Watkins, K.B.; Hardke, J.T. Annual irrigation water use for Arkansas rice production. J. Irrig. Drain. Eng. 2016, 142, 05016006. [Google Scholar] [CrossRef]
  17. University of Arkansas System Division of Agriculture, Cooperative Extension Service (UA-DA-CES) Rice Production Handbook. Available online: https://www.uaex.uada.edu/publications/pdf/mp192/mp192.pdf (accessed on 27 March 2025).
  18. Shen, J.; Yuan, L.; Zhang, J.; Li, H.; Bai, Z.; Chen, X.; Zhang, W.; Zhang, F. Phosphorus dynamics: From soil to plant. Plant Physiol. 2011, 156, 997–1005. [Google Scholar] [CrossRef] [PubMed]
  19. Smil, V. Phosphorus in the environment: Natural flows and human interferences. Annu. Rev. Energy Environ. 2000, 25, 53–88. [Google Scholar] [CrossRef]
  20. United States Geological Survey (USGS) 2022 Mineral Commodity Summaries. Available online: https://pubs.usgs.gov/periodicals/mcs2022/mcs2022-phosphate.pdf (accessed on 27 March 2025).
  21. Geissler, B.; Hermann, L.; Mew, M.C.; Steiner, G. Striving toward a circular economy for phosphorus: The role of phosphate rock mining. Minerals 2018, 8, 395. [Google Scholar] [CrossRef]
  22. Doyle, J.D.; Parsons, S.A. Struvite formation, control and recovery. Water Res. 2002, 36, 3925–3940. [Google Scholar] [CrossRef]
  23. Le Corre, K.S.; Valsami-Jones, E.; Hobbs, P.; Parsons, S.A. Phosphorus recovery from wastewater by struvite crystallization: A Review. Crit. Rev. Environ. Sci. Tech. 2009, 39, 433–477. [Google Scholar] [CrossRef]
  24. Schoumans, O.F.; Bouraoui, F.; Kabbe, C.; Oenema, O.; Dijk, V.; Kimo, C. Phosphorus management in Europe in a changing world. Ambio 2015, 44, S180–S192. [Google Scholar] [CrossRef]
  25. Kékedy-Nagy, L.; Teymouri, A.; Herring, A.M.; Greenlee, L.F. Electrochemical removal and recovery of phosphorus as struvite in an acidic environment using pure magnesium vs. the AZ31 magnesium alloy as the anode. Chem. Eng. J. 2020, 380, 122480. [Google Scholar] [CrossRef]
  26. Muhmood, A.; Lu, J.; Dong, R.; Wu, S. Formation of struvite from agricultural wastewaters and its reuse on farmlands: Status and hindrances to closing the nutrient loop. J. Environ. Manag. 2019, 230, 1–13. [Google Scholar] [CrossRef]
  27. Huang, H.; Zhang, P.; Zhang, Z.; Liu, J.; Xiao, J.; Gao, F. Simultaneous removal of ammonia nitrogen and recovery of phosphate from swine wastewater by struvite electrochemical precipitation and recycling technology. J. Clean. Prod. 2016, 127, 302–310. [Google Scholar] [CrossRef]
  28. Chirmuley, D.G. Struvite precipitation in WWTPs: Causes and solutions. Water (J. Aust. Water Assoc.) 1994, 21, 21–23. [Google Scholar]
  29. Nagy, J.; Mikola, A.; Pradhn, S.K.; Zseni, A. The utilization of struvite produced from human urine in agriculture as a natural fertilizer: A review. Period. Polytech. Chem. Eng. 2019, 63, 478–484. [Google Scholar] [CrossRef]
  30. Nongqwenga, N.; Muchaonyerwa, P.; Hughes, J.; Odindo, A.; Bame, I. Possible use of struvite as an alternative phosphate fertilizer. J. Soil Sci. Plant Nutr. 2017, 17, 581–593. [Google Scholar] [CrossRef]
  31. Hertzberger, A.J.; Cusick, R.D.; Margenot, A.J. A review and meta-analysis of the agricultural potential of struvite as a phosphorous fertilizer. Soil Sci. Soc. Am. J. 2020, 84, 653–671. [Google Scholar] [CrossRef]
  32. Ackerman, J.N.; Zvomuya, F.; Cicek, N.; Flaten, D. Evaluation of manure-derived struvite as a phosphorus source for canola. Can. J. Plant Sci. 2013, 93, 419–424. [Google Scholar] [CrossRef]
  33. Barak, P.; Stafford, A. Struvite: A recovered and recycled phosphorus fertilizer. In Proceedings of the 2006 Wisconsin Fertilizer, Aglime and Pest Management Conference, Madison, WI, USA, 17–19 February 2006. [Google Scholar]
  34. Talboys, P.J.; Heppell, J.; Roose, T.; Healey, J.R.; Jones, D.L.; Withers, P.J.A. Struvite: A slow-release fertilizer for sustainable phosphorus management? Plant Soil. 2016, 401, 109–123. [Google Scholar] [CrossRef]
  35. Ylagan, S.; Brye, K.R.; Greenlee, L. Corn and soybean response to wastewater-recovered and other common phosphorus fertilizers. Agrosyst. Geosci. Environ. 2020, 3, e20086. [Google Scholar] [CrossRef]
  36. Brye, K.R.; Omidire, N.S.; English, L.; Parajuli, R.; Kékedy-Nagy, L.; Sultana, R.; Popp, J.; Thoma, G.; Roberts, T.L.; Greenlee, L.F. Assessment of struvite as an alternative source of fertilizer-phosphorus for flood-irrigated rice. Sustainability 2022, 14, 9621. [Google Scholar] [CrossRef]
  37. Omidire, N.S.; Brye, K.R.; Roberts, T.L.; Kekedy-Nagy, L.; Greenlee, L.; Gbur, E.E.; Mozzoni, L.A. Evaluation of electrochemically precipitated struvite as a fertilizer-phosphorus source in flood-irrigated rice. Agron. J. 2021, 114, 739–755. [Google Scholar] [CrossRef]
  38. Omidire, N.S.; Brye, K.R.; English, L.; Popp, J.; Kekedy-Nagy, L.; Greenlee, L.; Roberts, T.L.; Gbur, E.E. Wastewater-recovered struvite evaluation as a fertilizer-phosphorus source for corn in eastern Arkansas. Agron. J. 2022, 114, 2994–3012. [Google Scholar] [CrossRef]
  39. Omidire, N.S.; Brye, K.R. Wastewater-recycled struvite as a phosphorus source in a wheat-soybean double-crop production system in eastern Arkansas. Agrosyst. Geosci. Environ. 2022, 5, e20271. [Google Scholar] [CrossRef]
  40. Omidire, N.S.; Brye, K.R.; English, L.; Kekedy-Nagy, L.; Greenlee, L.; Popp, J.; Roberts, T.L. Soybean growth and production as affected by struvite as a phosphorus source in eastern Arkansas. Crop Sci. 2023, 63, 320–335. [Google Scholar] [CrossRef]
  41. Chien, S.H.; Prochnow, L.I.; Tu, S.; Snyder, C.S. Agronomic and environmental aspects of phosphate fertilizers varying in source and solubility: An update review. Nutr. Cycl. Agroecosyst. 2011, 89, 229–255. [Google Scholar] [CrossRef]
  42. United States Division of Agriculture (USDA), Natural Resources Conservation Services (NRCS) Calhoun Soil Series. Available online: https://soilseries.sc.egov.usda.gov/OSD_Docs/C/CALHOUN.html (accessed on 27 March 2025).
  43. Gee, G.W.; Or, D. Particle size analysis. In Methods of Soil Analysis Part 4, Physical Methods Book Series No. 5; Dane, J.H., Topp, G.C., Eds.; Soil Science Society of America: Madison, WI, USA, 2002; pp. 255–293. [Google Scholar]
  44. Tucker, M.R. Determination of phosphorus by Mehlich 3 extraction. In Soil and Media Diagnostic Procedures for the Southern Region of the United States; No. 374; Donohue, S.J., Ed.; Virginia Agricultural Experiment Station: Blacksburg, VA, USA, 1992; pp. 6–8. [Google Scholar]
  45. Nelson, D.W.; Sommers, L.E. In Total carbon, organic carbon, and organic matter. In Methods of Soil Analysis Part 3: Chemical Analysis, 3rd ed.; Sparks, D.L., Page, A.L., Helmke, P.A., Loepper, R.H., Soltanpour, P.N., Tabatabai, M.A., Johnston, C.T., Sumner, M.E., Eds.; Soil Science Society of America: Madision, WI, USA, 1996; pp. 961–1010. [Google Scholar]
  46. United States Environmental Protection Agency (USEPA). Method 3050B: Acid Digestion of Sediments, Sludges, and Soils, Revision 2. 1996. Available online: https://www.epa.gov/sites/default/files/2015-06/documents/epa-3050b.pdf (accessed on 27 March 2025).
  47. Slayden, J.M.; Brye, K.R.; Lunga, D.D. Nitrogen fertilizer application timing effects on nitrous oxide emissions from simulated furrow-irrigated rice on a silt-loam soil in the greenhouse. J. Rice Res. Dev. 2022, 5, 366–377. [Google Scholar] [CrossRef]
  48. Bouman, B.A.M.; Tuong, T.P. Field water management to save water and increase its productivity in irrigated lowland rice. Agric. Water Manag. 2001, 49, 11–30. [Google Scholar] [CrossRef]
  49. Craswell, E.T.; Vlek, P.L.G. Greenhouse evaluation of nitrogen fertilizers for rice. Soil Sci. Soc. Am. J. 1979, 43, 1184–1188. [Google Scholar] [CrossRef]
  50. Smartt, A.D.; Brye, K.R.; Rogers, C.W.; Norman, R.J.; Gbur, E.E.; Hardke, J.T.; Roberts, T.L. Previous crop and cultivar effects on methane emissions from drill-seeded, delayed-flood rice grown on a clay soil. Appl. Environ. Soil Sci. 2016, 2016, 1–13. [Google Scholar] [CrossRef]
  51. Saxton, K.E.; Rawls, W.J. Soil water characteristic estimates by texture and organic matter for hydrologic solutions. Soil Sci. Soc. Am. J. 2006, 70, 1569–1578. [Google Scholar] [CrossRef]
  52. United States Department of Agriculture (USDA) Soil-Plant-Atmosphere-Water Field, and Pond Hydrology. Available online: https://www.nrcs.usda.gov/resources/tech-tools/spaw-version-602 (accessed on 27 March 2025).
  53. Della Lunga, D.; Brye, K.R.; Roberts, T.L.; Brye, J.; Evans-White, M.; Henry, C.G.; Lessner, D. Water regime and fertilizer-phosphorus source effects on greenhouse gas emissions from rice. Agrosyst. Geosci. Environ. 2024, 7, e20482. [Google Scholar] [CrossRef]
  54. Sander, B.O.; Wassmann, R. Common practices for manual greenhouse gas sampling in rice production: A literature study on sampling modalities of the closed chamber method. Greenh. Gas Meas. Manag. 2014, 4, 1–13. [Google Scholar] [CrossRef]
  55. Humphreys, J.J.; Brye, K.R.; Rector, C.; Gbur, E.E.; Hardke, J.T. Water management and cultivar effects on methane emissions from direct-seeded, delayed-flood rice production in Arkansas. J. Rice Res. Dev. 2018, 1, 14–24. [Google Scholar] [CrossRef]
  56. Intergovernmental Panel on Climate Change (IPCC). Global carbon and other biogeochemical cycles and feedbacks. In Climate Change 2021: The Physical Sci. Basis. Contribution of Working Group I to the Sixth Assessment Report of the Intergovernmental Panel on Climate Change; Canadell, J.G., Ed.; Cambridge University Press: Cambridge, UK, 2021; pp. 673–816. [Google Scholar]
  57. Brye, K.R.; Rogers, C.W.; Smartt, A.D.; Norman, R.J. Soil texture effects on methane emissions from direct-seeded, delayed-flood rice production in Arkansas. Soil Sci. 2013, 178, 519–529. [Google Scholar] [CrossRef]
  58. Kongchum, M.; Harrell, D.; Barron, M.A.; Adotey, N.; Li, J.F. Methane and nitrous oxide emission from Louisiana rice fields under three management practices. J. Rice Res. Dev. 2020, 3, 74–81. [Google Scholar] [CrossRef]
  59. Della Lunga, D.; Brye, K.R.; Roberts, T.L.; Henry, C.G.; Evans-White, M.; Lessner, D. Struvite effects on rice growth and productivity under flood-irrigation in the greenhouse. Agric. Sci. 2023, 14, 864–877. [Google Scholar] [CrossRef]
  60. Della Lunga, D.; Brye, K.R.; Slayden, J.M.; Henry, C.G. Evaluation of site position and tillage effects on global warming potential from furrow-irrigated rice in the mid-southern, USA. Geoderma Reg. 2023, 32, e00625. [Google Scholar] [CrossRef]
  61. Karki, S.; Adviento-Borbe, M.A.A.; Runkle, B.R.K.; Moreno-García, B.; Anders, M.; Reba, M.L. Multiyear methane and nitrous oxide emissions in different irrigation management under long-term continuous rice rotation in Arkansas. J. Environ. Qual. 2022, 3, 558–572. [Google Scholar] [CrossRef]
  62. Della Lunga, D. Field and Greenhouse Environmental Evaluation of Struvite in Rice Production Systems. Ph.D. Thesis, University of Arkansas, Fayetteville, AR, USA, 2023. [Google Scholar]
  63. Arel, C. Struvite Effects on Greenhouse Gas Emissions from Flood- and Furrow-Irrigated Rice in the Greenhouse. Master’s Thesis, University of Arkansas, Fayetteville, AR, USA, 2024. [Google Scholar]
  64. Adhya, T.K.; Pattnaik, P.; Satpathy, S.N.; Kumaraswamy, S.; Sethunathan, N. Influence of phosphorous application on methane emission and production in flooded paddy soils. Soil Biol. Biochem. 1998, 30, 177–181. [Google Scholar] [CrossRef]
  65. Xiao, W.; Zhang, Q.; Zhao, S.; Chen, D.; Gao, N.; Huana, M.; Ye, X. Citric acid secretion from rice roots contributes to reduction and immobilization of Cr(VI) by driving microbial sulfur and iron cycle in paddy soil. Sci. Total Environ. 2023, 854, 158832. [Google Scholar] [CrossRef]
  66. Anderson, R.; Brye, K.; Kékedy-Nagy, L.; Greenlee, L.; Gbur, E.; Roberts, T.L. Electrochemically precipitated struvite effects on extractable nutrients compared with other fertilizer phosphorus sources. Agrosyst. Geosci. Environ. 2013, 4, e20183. [Google Scholar] [CrossRef]
  67. Gao, D.; Sheng, R.; Whiteley, A.; Moreira-Grez, B.; Qin, H.; Zhang, W.; Zhan, Y.; Wei, W. Effect of phosphorus amendments on rice rhizospheric methanogens and methanotrophs in a phosphorus deficient soil. Geoderma 2020, 368, 114312. [Google Scholar] [CrossRef]
  68. Huang, Y.; Jiao, Y.; Zong, L.; Zheng, X.; Sass, R.L.; Fisher, F.M. Quantitative dependence of methane emission on soil properties. Nutr. Cycl. Agroecosyst. 2002, 64, 157–167. [Google Scholar] [CrossRef]
  69. Humphreys, J.; Brye, K.R.; Rector, C.; Gbur, E.E. Methane emissions from rice across a soil organic matter gradient in Alfisols of Arkansas, USA. Geoderma Reg. 2019, 16, e00200. [Google Scholar] [CrossRef]
  70. Rogers, C.W.; Brye, K.R.; Smartt, A.D.; Norman, R.J.; Gbur, E.E.; Evans-White, M.E. Cultivar and previous crop effects on methane emissions from drill-seeded, delayed-flood rice production on a silt-loam soil. Soil Sci. 2013, 179, 28–36. [Google Scholar] [CrossRef]
  71. Paustian, K.; Cole, C.V.; Sauerbeck, D.; Sampson, N. CO2 mitigation by agriculture: An overview. Clim. Chang. 1998, 40, 135–162. [Google Scholar] [CrossRef]
Figure 1. Season-long greenhouse gas fluxes. Methane (CH4; (A)), nitrous oxide (N2O; (B)), and carbon dioxide (CO2; (C)) fluxes for five phosphorus (P) fertilizer treatments [i.e., real-wastewater-derived (ECSTReal) and synthetic-solution-derived electrochemically precipitated struvite (ECSTSyn), chemically precipitated struvite (CPST), monoammonium phosphate (MAP), and a no-P fertilizer, unamended control (UC)] from flood-irrigated rice in a greenhouse. Asterisks (*) represent days on which CH4, N2O, and CO2 fluxes differed (p < 0.05) among P fertilizer sources. The flood was established 38 days after planting (DAP). Pre-flood P, K, Zn, and N fertilizer sources were applied 23 DAP, and the pre-flood and mid-season urea N applications were applied at 37 and 58 DAP, respectively.
Agriculture 15 00815 g001
Table 1. Summary of mean [± standard error (SE)] initial soil chemical and physical properties for Calhoun silt loam soil used in greenhouse study in 2022 (n = 6).
Soil PropertyMean (±SE)
Soil Texture (g g−1)
   Sand0.14 (<0.01)
   Silt0.72 (0.01)
   Clay0.14 (0.01)
Bulk density (g cm−3)1.11 (<0.01)
pH7.3 (0.05)
Electrical conductivity (dS m−1)0.173 (<0.01)
Extractable soil nutrients (mg kg−1)
   Phosphorus6.4 (0.8)
   Potassium72.7 (1.0)
   Calcium1816 (24.3)
   Magnesium257 (3.2)
   SO4-S4.0 (0.1)
   Sodium50.1 (0.3)
   Iron112 (1.4)
   Manganese251 (3.0)
   Zinc10.5 (0.2)
   Copper2.0 (0.3)
   Boron0.4 (<0.01)
Soil organic matter (g kg−1)17.4 (0.07)
Total carbon (g kg−1)5.3 (0.2)
Total nitrogen (g kg−1)0.6 (0.01)
Carbon–nitrogen ratio9.4 (0.4)
Table 2. Summary of phosphorus (P) fertilizer source fertilizer grade and mean pH and nutrient concentrations [± standard error (SE)] and water solubility.
P Fertilizer SourceMeasured Fertilizer Grade apHNutrient Concentration (±SE)P Fertilizer Source Water Solubility c
NPMg
______________ % ______________
ECSTReal3–35–07.2 (<0.1)3.3 (0.1)15.5 (0.2)13.6 (0.3)2–3.8%
ECSTSyn5–37–0- b5.1 (0.2)16.1 (0.3)12.7 (0.3)2–3.8%
MAP11–52–04.4 (0.02)10.7 (0.1)20.9 (0.2)1.5 (<0.1)85–90%
CPST6–27–08.8 (0.13)5.7 (0.2)11.7 (0.2)8.3 (0.2)4%
a Measured fertilizer grade expressed as % N—P2O5—K2O; b limited ECSTSyn supply prohibited pH determination; c [31,37,41].
Table 3. Summary of season-long average, maximum, and minimum greenhouse climate conditions during 2022’s sampling periods.
Descriptive StatisticAmbient Air
Temperature
(°C)
Chamber Air Temperature
(°C)
Greenhouse
Pressure
(cm Hg)
Relative
Humidity
(%)
Mean28.928.575.462.5
Maximum35.037.477.082.0
Minimum20.018.959.440.0
Table 4. Summary of analysis of variance of effects of phosphorus (P) fertilizer source, days after planting (DAP), and their interaction on methane (CH4), nitrous oxide (N2O), and carbon dioxide (CO2) fluxes during 2022 in greenhouse.
Source of VariationCH4N2OCO2
_______________________ P_______________________
P fertilizer source<0.010.03<0.01
DAP<0.01<0.01<0.01
  P fertilizer source x DAP<0.01<0.01<0.01
Table 5. Summary of effects of phosphorus (P) fertilizer source on season-long methane (CH4), nitrous oxide (N2O), and carbon dioxide (CO2) emissions, as well as total net GHG emissions and CH4-N2O net GHG emissions using sixth (IPCC, 2021) assessment conversion factors during 2022 in greenhouse.
Greenhouse Gas PropertyPP Fertilizer Source aOverall Mean
ECSTRealECSTSynCPSTMAPUC
Season-long emissions
  CH4 (kg ha−1)0.0143.1 bc b40.3 bc60.7 ab98.7 a29.9 c-
  N2O (kg ha−1)0.360.34 a0.31 a0.24 a0.44 a0.53 a0.37
  CO2 (Mg ha−1)<0.0113.0 bc15.4 b17.1 ab21.0 a10.4 c-
Total Net GHG Emissions (kg CO2-equivalents ha−1 season−1)
<0.0114296 bc16657 b18865 ab23841 a11426 c-
CH4-N2O Net GHG Emissions (kg CO2-equivalents ha−1 season−1)
0.011297 bc1211 bc1763 ab2881 a978 c-
a Abbreviations: ECSTSyn, electrochemically precipitated struvite made from a synthetic solution; ECSTReal, electrochemically precipitated struvite made from real wastewater; CPST, chemically precipitated struvite; MAP, monoammonium phosphate; UC, unamended control. b Means in a row followed by the same letter do not differ (p > 0.05).
Disclaimer/Publisher’s Note: The statements, opinions and data contained in all publications are solely those of the individual author(s) and contributor(s) and not of MDPI and/or the editor(s). MDPI and/or the editor(s) disclaim responsibility for any injury to people or property resulting from any ideas, methods, instructions or products referred to in the content.

