Article

Effects of Different Nitrogen Substitution Practices on Nitrogen Utilization, Surplus, and Footprint in the Sweet Maize Cropping System in South China

1
College of Agriculture, South China Agricultural University, Guangzhou 510642, China
2
Guangzhou Nansha Assets Operation Group Co., Ltd., Guangzhou 511466, China
*
Author to whom correspondence should be addressed.
Agriculture 2025, 15(8), 800; https://doi.org/10.3390/agriculture15080800
Submission received: 11 March 2025 / Revised: 31 March 2025 / Accepted: 4 April 2025 / Published: 8 April 2025
(This article belongs to the Special Issue Detection and Management of Agricultural Non-Point Source Pollution)

Abstract

:
Long-term excessive application of nitrogen fertilizers in sweet maize farmland in South China has led to low nitrogen absorption and high emissions of reactive nitrogen (RN). In this study, four kinds of organic materials, including maize straw, cow manure, biochar, and biogas residue, were applied to sweet maize farmland for three consecutive cropping seasons to substitute 20% of synthetic nitrogen fertilizer. We compared the effects of different nitrogen substitution practices on nitrogen use efficiency (NUE), nitrogen surplus (NSP), and nitrogen footprint (NF) in farmland, with conventional fertilization as the control (CK). Results demonstrated that nitrogen substitution practices increased crop nitrogen uptake by 18.80–52.37%, NUE by 16.00–43.03%, and nitrogen partial factor productivity (PFPN) by 46.18–74.31%, while reducing nitrogen surplus and loss by 7.84–21.84% and 12.08–42.88%, respectively. From a life cycle assessment perspective, nitrogen footprint per unit area (NFA) and per unit yield (NFY) decreased by 13.64–32.24% and 34.26–47.64%, respectively. The results demonstrated that partial substitution with organic fertilizers improved nitrogen utilization as well as reduced nitrogen surplus, loss and, footprint in the sweet maize cropping system in South China. Biochar substitution achieved the most significant improvements. This study provides a research basis for nitrogen management in the sweet maize cultivation system in South China and valuable information for achieving sustainable agricultural development in typical subtropical areas in East Asia.

1. Introduction

Nitrogen is a limiting nutrient in terrestrial ecosystems and plays an essential role in regulating these systems [1]. Nitrogen fertilizer plays a crucial role in sustaining crop yields to support agricultural productivity. On the one hand, the application of nitrogen fertilizer meets the nitrogen demand of crops at various developmental stages, ensuring normal crop growth [2]. On the other hand, it promptly compensates for the soil nitrogen taken up by crops, maintaining the balance of the soil organic and inorganic nitrogen pools. This practice aids in soil microbial activity, facilitates nutrient cycling, and enhances soil fertility, thereby ensuring the sustainable production of farmland [3]. China is the largest consumer of nitrogen fertilizer globally, accounting for approximately 22.62% of the world’s usage [4]. To achieve high crop yields, China’s fertilizer application has dramatically increased over the past 40 years [5]. By 2017, total annual fertilizer application in China had reached 58.59 million tons. Nitrogen fertilizer input per unit area on farmland was 225 kg N·ha−1 annually [4]. Meanwhile, nitrogen fertilizer use efficiency was only 35%, with an average over-application rate of 65% [6]. Excessive application of nitrogen fertilizer limits the nutrient use efficiency of crop systems [7] and degrades soil quality [8], causing air pollution [9,10], greenhouse gas emissions [11], eutrophication [12], etc. Therefore, how to reduce nitrogen fertilizer application and improve nitrogen fertilizer utilization while ensuring crop yield and environmental benefits has become a hot issue of global concern [13,14].
Nitrogen substitution (NS) practice, which refers to partial replacement of synthetic nitrogen fertilizer with different types of organic materials, was viewed as a cost-effective and environmentally friendly fertilization method [15,16]. Previous research indicated that NS practice could align soil nutrient supply with crop demand, providing a balanced and stable nutrient supply throughout the crop growth period, improving nitrogen use efficiency (NUE) and reducing nitrogen leaching and NH3 volatilization [17,18]. At the same time, the combined application of organic and synthetic fertilizers significantly impacted the soil nitrogen pool and its dynamic transformations [19]. Nevertheless, the effects of NS practices on the nitrogen uptake and storage of cropping systems were always varied due to the different crops, soil properties, and substitution approaches [20,21,22]. For example, Peng et al. [23] found that biochar compound fertilizers could increase carbon stability and nitrogen retention in soil and improve nitrogen uptake by maize, while the loss of nitrogen was minimized. However, the addition of biochar alone has few significant yield-improving effects [24]. Many factors, including the types of organic materials, nitrogen substitution ratio, crop types, and land use patterns, affected the practice of NS [25].
Sweet maize is a type of maize that is harvested young and consumed in a variety of ways, including raw, boiled, grilled, or in various dishes [26,27]. Sweet maize is a popular ingredient in many cuisines around the world and can be found in both fresh and canned forms [27]. South China is the largest producing area of sweet maize currently, where it is always harvested 2–4 times a year due to abundant light and heat conditions [28]. Continuous maize cropping has become a common cropping system in South China [29]. However, this planting pattern demands a high amount of nitrogen fertilizer, with farmers typically applying over 360 kg·ha−1 of nitrogen fertilizer per cropping season for sweet maize production [30]. At this level of fertilization, the NUE is only 11.6% [31]. The high cropping index increases the requirement for nutrient input, especially nitrogen fertilizer. Additionally, the predominant soil type in South China is acidic red soil. The excessive application of nitrogen fertilizer in the region exacerbates issues like soil acidification, nutrient loss, and compaction. The region’s soils are also highly prone to nitrogen leaching and NH3 volatilization, leading to severe environmental pollution [32,33]. It is of significant practical importance for the continuous cropping of sweet maize in South China to explore the effects of different NS practices on nitrogen use and loss. However, relative information on this subject is lacking at present.
Therefore, this study applied four kinds of organic materials, including maize straw (MS), straw-based biochar (CB), cow manure (CM), and manure-based biogas residue (BR), to sweet maize cropland to partially substitute synthetic nitrogen fertilizer in the Pearl River Delta Plain, which is a typical red soil area in South China. The study aimed to compare the effects of different NS practices on the nitrogen budget of the sweet maize continuous cropping system. More specifically, the objectives of this study were as follows: (1) to analyze nitrogen use efficiency based on on-field measured data; (2) to compare the nitrogen surplus (NSP) of the crop–soil system based on the input, storage, and output of nitrogen at the farmland level; and (3) to assess the nitrogen footprint of the sweet maize continuous cropping system based on a life cycle assessment. This study would provide a research basis for nitrogen management in the sweet maize cultivation system in South China and valuable information with respect to achieving sustainable agricultural development in typical subtropical areas in East Asia.

2. Materials and Methods
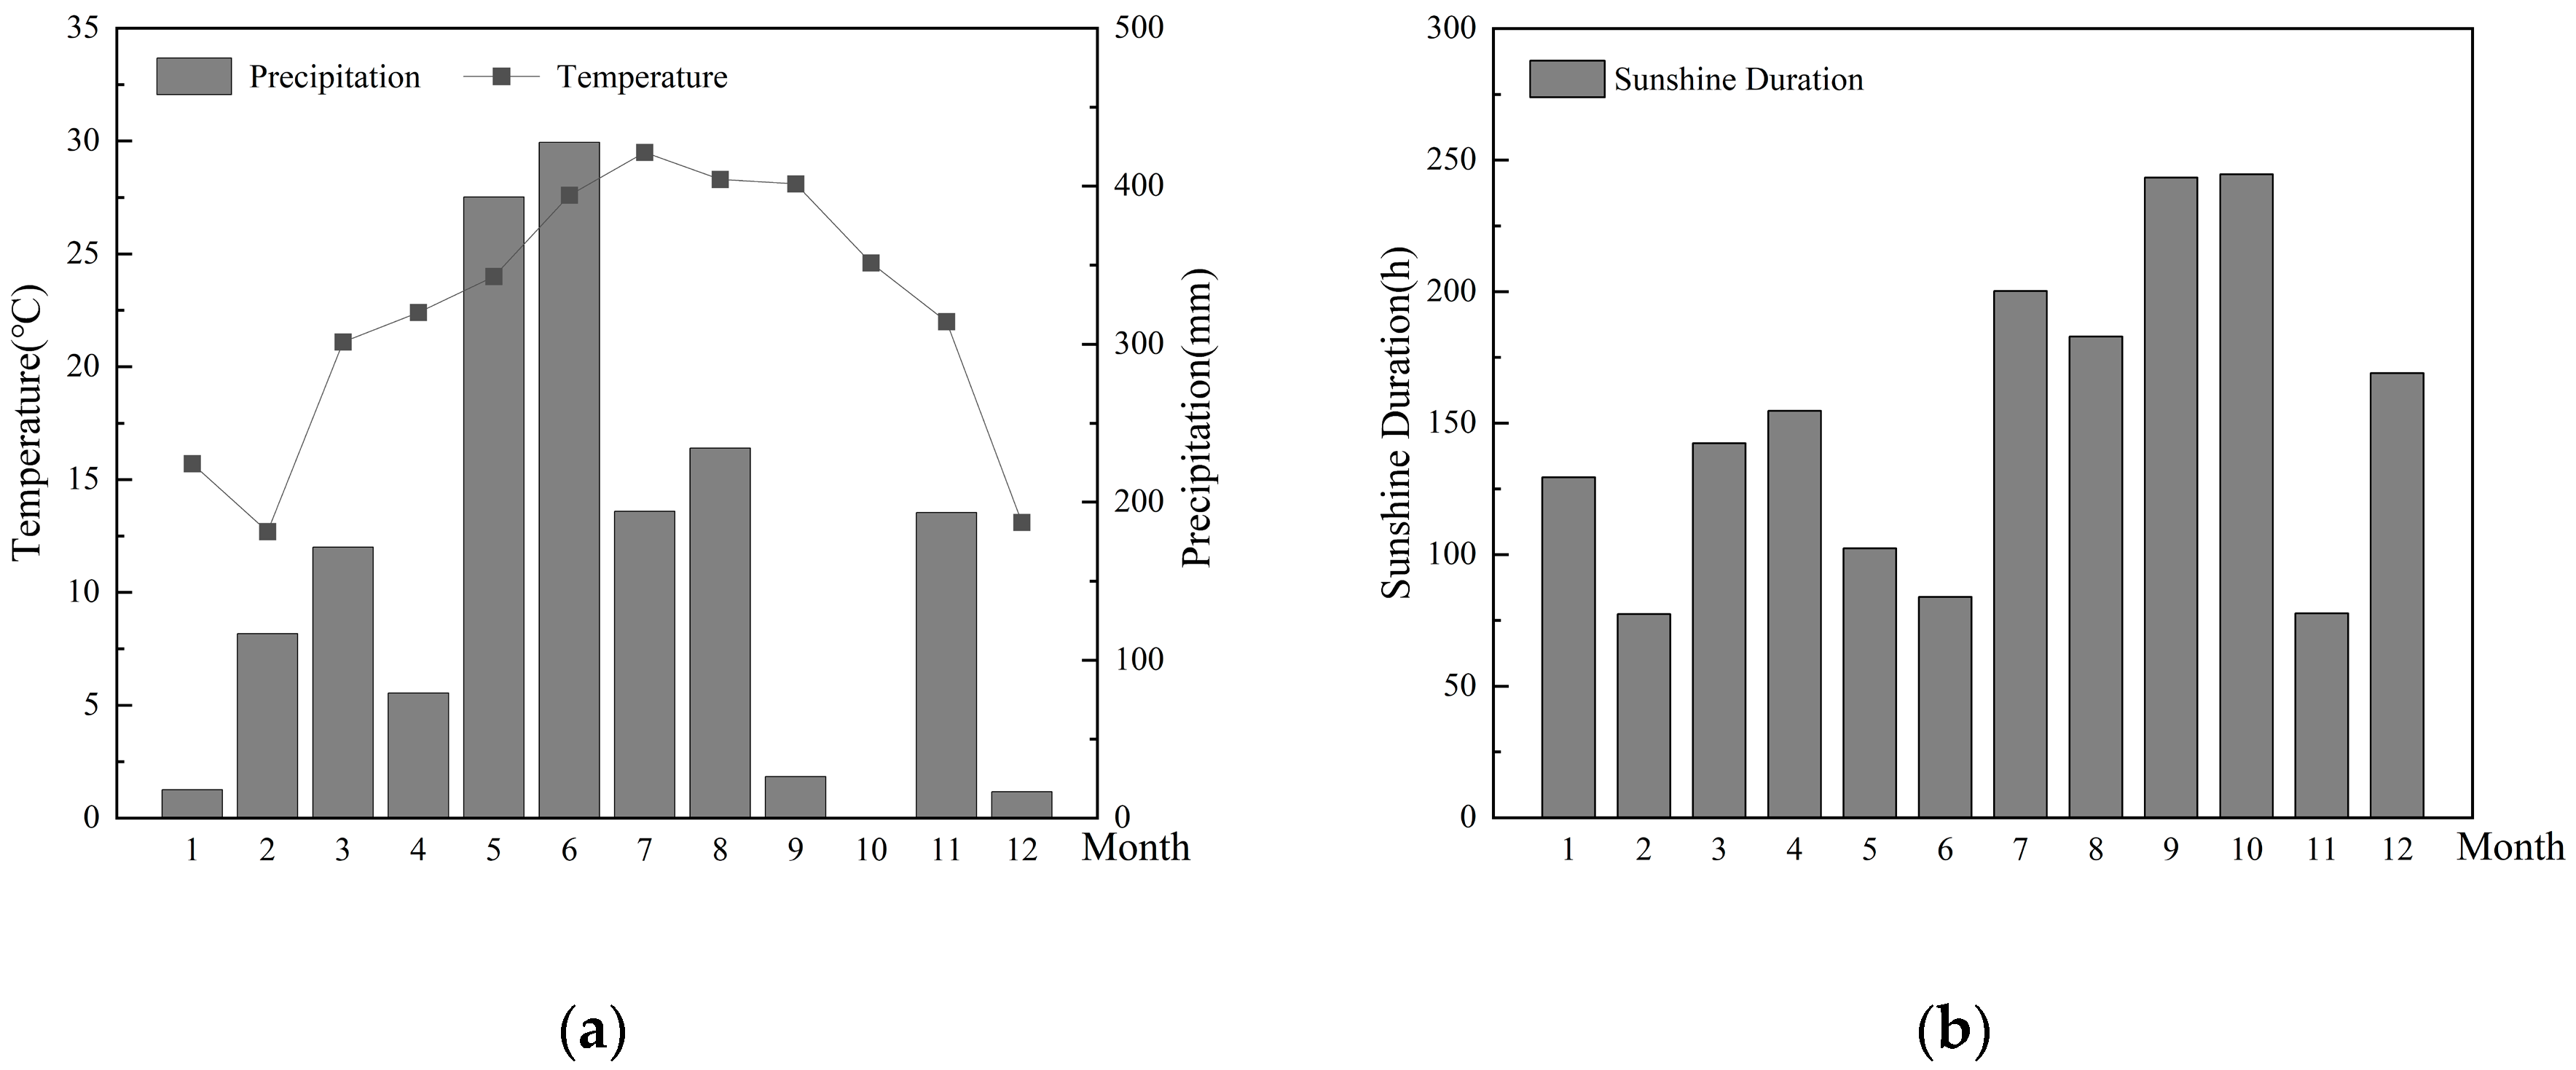
2.1. Study Site

This study was conducted at the Ningxi experimental farm of the South China Agricultural University in Guangzhou, Guangdong Province, China (23°24′ N, 113°64′ E). The region has a subtropical monsoon climate with an average annual temperature of 22.40 °C and average annual precipitation of 1871.70 mm. The accumulated temperature above 10 °C is approximately 8000 °C, with an annual sunshine duration of 1807.9 h and a frost-free period of 355 days. The temperature, precipitation, and sunshine duration during the study period are shown in Figure 1. The soil at the experimental site is classified as red soil derived from granite, with a silty clay loam texture, consisting of 21% clay (<2 μm), 65% silt (2–20 μm), and 14% sand (20–2000 μm). Prior to the experiment, the following basic soil properties were determined in mixed topsoil samples (0–20 cm): soil pH, 5.68; organic matter, 12.85 g·kg−1; total nitrogen, 1.07 g·kg−1; total phosphorus, 1.62 g·kg−1; and total potassium, 15.23 g·kg−1. The long-term field experiment started in 2020. The experimental data were collected from March 2022 to November 2022, covering three consecutive maize cropping seasons.

2.2. Experimental Design

The field experiment was arranged in a completely randomized block design with three replications, with each plot measuring 28 m2 (7 m × 4 m). Five fertilization treatments were applied, including a conventional nitrogen application as the control (CK) and four treatments in which 20% of synthetic nitrogen was replaced with maize straw (MS), biochar (CB), cow manure (CM), and biogas residue (BR), respectively. All treatments maintained a consistent total nitrogen input of 300.00 kg N·ha−1. The specific application rates of synthetic fertilizer and organic materials are shown in Table 1. The cow manure and biogas residue were obtained from a local cow farm (23°11′ N, 113°11′ E). The cow manure was applied without any pretreatment, while the biogas residue was obtained from the cow manure after solid–liquid separation. The maize straw was sourced from the previous maize crops cultivated in the field. The biochar produced from maize straw was purchased from a market. The basic properties of the four organic materials are shown in Table 2. Prior to planting, all organic materials were evenly spread over the field surface and incorporated into the topsoil through tillage. The maize straw was first chopped into pieces of about 2 cm before being spread over the field. All treatments received uniform basal applications of 150 kg·ha−1 of phosphorus (12.00% calcium superphosphate), 300 kg·ha−1 of potassium (60.00% potassium chloride), and 30% synthetic nitrogen fertilizer (46% urea) combined with the organic materials, with the remaining 70% nitrogen applied in three split doses (35% at V6, 30% at V12, and 5% at VT). Ridge cultivation was conducted through rotary tillage followed by manual leveling, with 140 cm spacing between ridges, with a ridge width of 100 cm and ridge height of 20 cm.
The cropping pattern was a continuous “maize-maize-maize” cultivation system. The cultivar of sweet maize (Zea mays L.) used in the study was “Huameitian 12”, which is one of local dominant cultivars in the Pearl River Delta. Seedlings were first raised in trays and then transplanted to the field at the three-leaf stage with double-row planting (30 cm hole spacing). Field management mirrored regional practices except for fertilization practices. Irrigation was carried out before maize transplanting to ensure seedling establishment. No irrigation is required during the sweet maize growth period because the experimental region experiences abundant annual precipitation (approximately 1800 mm). The maize straw was removed from the field after harvest.

2.3. Plant Sample Collection and Analysis

The sweet maize was harvested at the end of May, August, and November, respectively, in 2022. In each plot, five sweet maize plants with consistent and representative growth were selected. The mean fresh weight of the maize ears per plant was used to ascertain the yield per hectare. After sampling, the plants were inactivated at 105 °C for 30 min and then dried at 80 °C to a constant weight and weighed in three parts: grain, cob, and straw. The dried samples were then pulverized and passed through a 0.25 mm sieve, and the nitrogen contents of each part were determined by the Kjeldahl-digestion method using an automated Kjeldahl analyser (KT8400, FOSS, Beijing, China) [34]. Their total nitrogen content was used to calculate the nitrogen uptake of the crops.

2.4. Soil Sample Collection and Analysis

Soil samples were collected at depths of 0–20 cm before planting and after harvest in each cropping season. A random 5-point sampling was collected in each plot and then mixed as a composite sample. Soil total nitrogen content was determined by the Kjeldahl-digestion method [34]. Total soil nitrogen storage was calculated based on soil nitrogen content and bulk density [35]. The increment of the soil nitrogen pool was quantified as the difference between total soil nitrogen storage at the end and the beginning of the experiment. Thus, it was calculated based on the following equation [36]:
N s = C t × B t C 0 × B 0 × H × 10 2
where Ns is the increment of the soil nitrogen pool at the end of each season (kg·ha−1); C0 and Ct represent the total nitrogen content in the 0–20 cm of topsoil at the beginning and the end of the experiment (g·kg−1), respectively; B0 and Bt represent the bulk density of the soil in the 0–20 cm of topsoil at the beginning and the end of the experiment (g·cm−3), respectively; and H is the soil depth (0.20 m).

2.5. Calculation Methods for Nitrogen Management Indicators

2.5.1. Nitrogen Use Efficiency

Nitrogen use efficiency (NUE) of crops reflects the efficiency of the system in terms of utilizing the whole nitrogen input [37], which was calculated based on the following equation:
N U E = N h a r v e s t / N i n p u t
N i n p u t = N f e r + N o r g + N s e e d + N b i o + N d e p + N N o n - b i o
where Nharvest represents the nitrogen output at crop harvest (kg·ha−1), which is the sum of the nitrogen uptake of grain, cob, and straw; and Ninput represents the total nitrogen input (kg·ha−1), which is the sum of nitrogen from fertilizer, organic material nitrogen, seed nitrogen, biological nitrogen fixation, atmospheric deposition nitrogen, and non-symbiotic nitrogen fixation in the soil. More specifically, Nfer and Norg represent the nitrogen content from fertilizer and organic material inputs (kg·ha−1), with specific data shown in Table 3; Nseed represents the nitrogen content from seed inputs, calculated as 0.5 kg·ha−1 [38]; Nbio represents biological nitrogen fixation by crop, calculated as 5 (kg·ha−1) [39]; Ndep represents nitrogen from atmospheric deposition, calculated as 37.8 kg·ha−1 [40]; and NNon-bio represents non-symbiotic nitrogen fixation in the soil, calculated as 15.0 kg·ha−1 [41].

2.5.2. Partial Productivity of Nitrogen Fertilizer

The partial productivity of nitrogen fertilizer (PFPN) reflects the efficiency of the nitrogen fertilizer output in the production process [42], which was calculated based on the following equation:
P F P N = Y / N f e r
where Y represents the grain yield of sweet maize (kg·ha−1) and Nfer represents the nitrogen content from the synthetic fertilizer input (kg·ha−1).

2.5.3. Nitrogen Surplus

Nitrogen surplus (NSP) is an important tool for measuring nitrogen cycling, efficiency, and environmental impacts in agricultural ecosystems [3,43]. It plays a crucial role in evaluating the sustainability of agriculture and optimizing environmental benefits [44]. NS refers to the difference between nitrogen input and nitrogen uptake in crops, reflecting nitrogen losses and changes in soil nitrogen pools. In this study, NS was calculated as follows:
N s u r p l u s = N i n p u t N h a r v e s t
N l o s s = N i n p u t N h a r v e s t N s
where Nsurplus is the difference between nitrogen input and nitrogen uptake in crops (kg·ha−1); Ninput represents the total nitrogen input (kg·ha−1), which primarily includes the nitrogen from fertilizer, organic material nitrogen, seed nitrogen, biological nitrogen fixation, atmospheric deposition nitrogen, and non-symbiotic nitrogen fixation in the soil in this study; Nharvest represents nitrogen output in the crop harvest (kg·ha−1), which is the sum of the nitrogen uptake of grain, cob, and straw; Nloss represents nitrogen losses (kg·ha−1), including ammonia volatilization, nitrification–denitrification losses, leaching and runoff losses, and other pathways; and Ns represents the increment of the soil nitrogen pool (kg·ha−1).

2.5.4. Nitrogen Footprint

In farmland systems, nitrogen footprint (NF) typically represents the total amount of reactive nitrogen (RN) released into the environment during agricultural production [45], which refers to the sum of RN emitted directly and indirectly during sweet maize cultivation.
In this study, indirect RN emission primarily considered the emissions caused by the production and use of agricultural materials such as diesel, synthetic fertilizers, and pesticides. Organic materials were considered waste products from other systems, and their environmental impacts have already been accounted for in those systems. Therefore, they were not included within the calculation boundaries of this study. The calculation formula is as follows:
N F I D = i = 1 n δ i × m i
where n indicates the number of agricultural inputs; i denotes the type of agricultural inputs; δ i represents the RN emission parameters of agricultural materials (Table 3); and mi is the consumed amount of the ith agricultural material (kg·ha−1), which is the average value of the agricultural inputs recorded during the experiment period.
The direct RN emission from the field mainly included NH3 volatilization, N2O emission, nitrogen leaching, and nitrogen runoff. Due to the minimal amoung of RN from nitrogen runoff and unavailable data in the study region, it was neglected in this study. Therefore, the calculation formulas are shown as follows:
N F D = N F N 2 O + N F N H 3 + N F N O 3 + N F N H 4 +
N F N 2 O = E N 2 O × 44 / 28 × 0.476
N F N H 3 = E N H 3 × 17 / 14 × 0.833
N F N O 3 = E N O 3 × 62 / 14 × 0.238
N F N H 4 + = N × β × 18 / 14 × 0.786
where E N 2 O , E N H 3 , and E N O 3 represent the cumulated N2O emission, NH3 volatilization from farmland, and leaching of nitrate–nitrogen from soil (kg·ha−1), respectively; N is the application rate of nitrogen fertilizer (kg·ha−1); β is the leaching coefficient of N H 4 + , whose value is 0.0030 [46]; the ratios 44/28, 17/14, 62/14, and 18/14 are for converting N into N2O, NH3, N O 3 , and N H 4 + , respectively; and 0.476, 0.833, 0.238, and 0.786 are the eutrophication coefficients of N2O, NH3, N O 3 , and N H 4 + , respectively [47]. In this study, N2O emissions ( E N 2 O ) were estimated based on the IPCC [46] methodology, while NH3 volatilization ( E N H 3 ) and N O 3 leaching ( E N O 3 ) were estimated based on the model from Chen et al. [48]. The calculation formulas are as follows:
E N 2 O = N × E F D × 44 / 28
E N H 3 = 1.45 + 0.24 N
E N O 3 = 25.31 × e x p 0.0095 y
where EFD is the emission factor for N2O, whose value is 2.47 × 10⁻³ (kg N2O-N·kg−1 N) [49]; N is the nitrogen input (kg N-eq·ha−1); and y is the nitrogen surplus in the field (kg N-eq·ha−1).
To avoid evaluation from a single perspective and to further weigh the relationship between productivity and environmental costs, the NF on unit area (NFA) and on unit yield (NFY) were both calculated in this study:
N F A = N F I D + N F D
N F Y = ( N F I D + N F D ) / Y
where NFID represents the indirect RN generated by agricultural inputs and agricultural operations (kg N-eq·ha−1); NFD represents the direct RN emissions from the field (kg N-eq·ha−1); and Y is the yield per unit area (kg·ha−1).
Table 3. Emission factors related to reactive nitrogen (RN) emissions of agricultural inputs used in this study.
ItemEmission Coefficient (g N-eq·kg−1)Data Source
Diesel0.08[50]
Diesel combustion4.58[50]
Synthetic N fertilizer (N)0.89[50]
Synthetic P fertilizer (P2O5)0.54[50]
Synthetic K fertilizer (K2O)0.03[50]
Insecticides3.53[50]
Herbicides4.49[50]
Fungicides7.00[50]

2.6. Economic Benefits

To evaluate the economic benefits of different fertilization treatments, the input–output ratio was introduced to standardize the dimensions. The calculation formulas are as follows:
R = T R / T C
where R represents the input–output ratio; TR represents the revenue of sweet maize (CNY·ha−1); and TC represents the total cost of organic materials, fertilizers, and other agricultural inputs.

2.7. Statistical Analysis

Data processing was performed using Microsoft Office Excel 2016 on the IBM SPSS Statistics platform (version 18.0). Data normality was assessed through Shapiro–Wilk tests (α = 0.05), complemented by Bartlett’s test to verify intergroup variance homogeneity. All datasets satisfied the homogeneity of variance assumption. For data conforming to normal distribution (Shapiro–Wilk p ≥ 0.05), one-way analysis of variance (ANOVA) was implemented, with Duncan’s multiple range test employed for post hoc comparisons between treatment groups at a 0.05 probability threshold.

3. Results

3.1. Nitrogen Uptake

As shown in Table 4, NS practices boosted the yields of maize grains, cobs, and straw compared to CK. Within this area, the CB practice showed the highest yields, with significant increases of 41.51%, 25.32%, and 46.07%, respectively, compared to CK. Over the three seasons, compared to CK, grain nitrogen content in the CM practice and cob nitrogen content in the CB practice significantly decreased by 4.89% and 10.00%, respectively. Additionally, straw nitrogen content in the MS, CB, and CM practices significantly decreased by 10.12–13.69%. For nitrogen uptake, grain significantly increased by 19.44–35.21%, cobs increased by 0.67–17.43%, with only CB and CM practices showing a significant difference compared to CK, and stalks increased by 20.83–58.04%, with the CB practice being the most significant. The total nitrogen absorbed by crops was significantly higher than CK at 18.80–52.37%, with the ranking CB > CM > BR > MS > CK. These results indicated that the four NS practices increased crop biomass and nitrogen uptake in the sweet maize farmland system, in which biochar substitution showed the greatest increase, followed by cow manure, biogas residue, and straw.

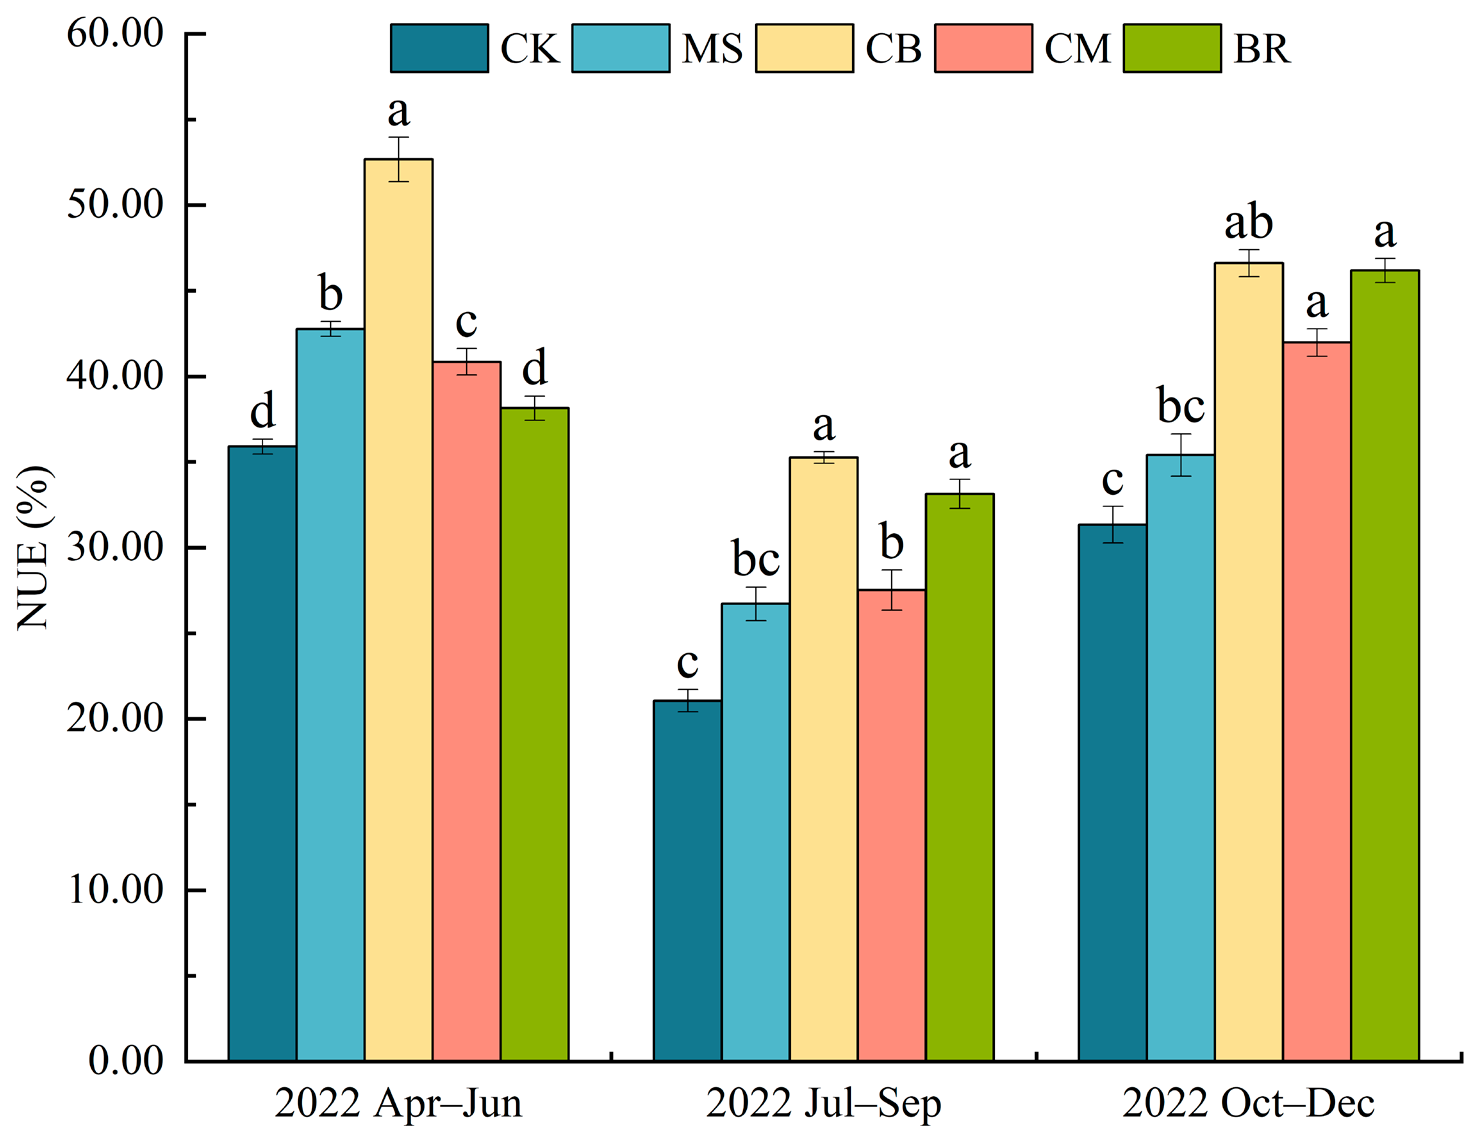
3.2. Nitrogen Use Efficiency

Compared to CK, NS practices enhanced crop NUE to varying degrees (Figure 2). The CB practice exhibited the highest NUE, with values of 52.66%, 35.26%, and 46.61% in spring, summer, and autumn, respectively, while CK showed the lowest NUE, at 35.90%, 21.06%, and 31.33%, respectively, with CB significantly increasing NUE by 46.72–67.37% over CK. The MS practice showed significant differences in the spring but no significant differences in summer and fall. The CM practice performed significantly in all three seasons of the experiment. The BR practice did not show significant differences in the spring but showed significant differences in the summer and fall. The CK, MS, and CB practices exhibited the highest NUE in spring, while the CM and BR practices had the highest NUE in autumn. All five fertilization methods showed the lowest NUE in summer, primarily due to lower yields during the summer trial period compared to spring and autumn, resulting in a lower response from maize plants to soil nitrogen supply and thus a lower NUE. Overall, NS was an effective measure in terms of improving NUE, especially with respect to biochar substitution, which showed the best crop nitrogen use efficiency performance.

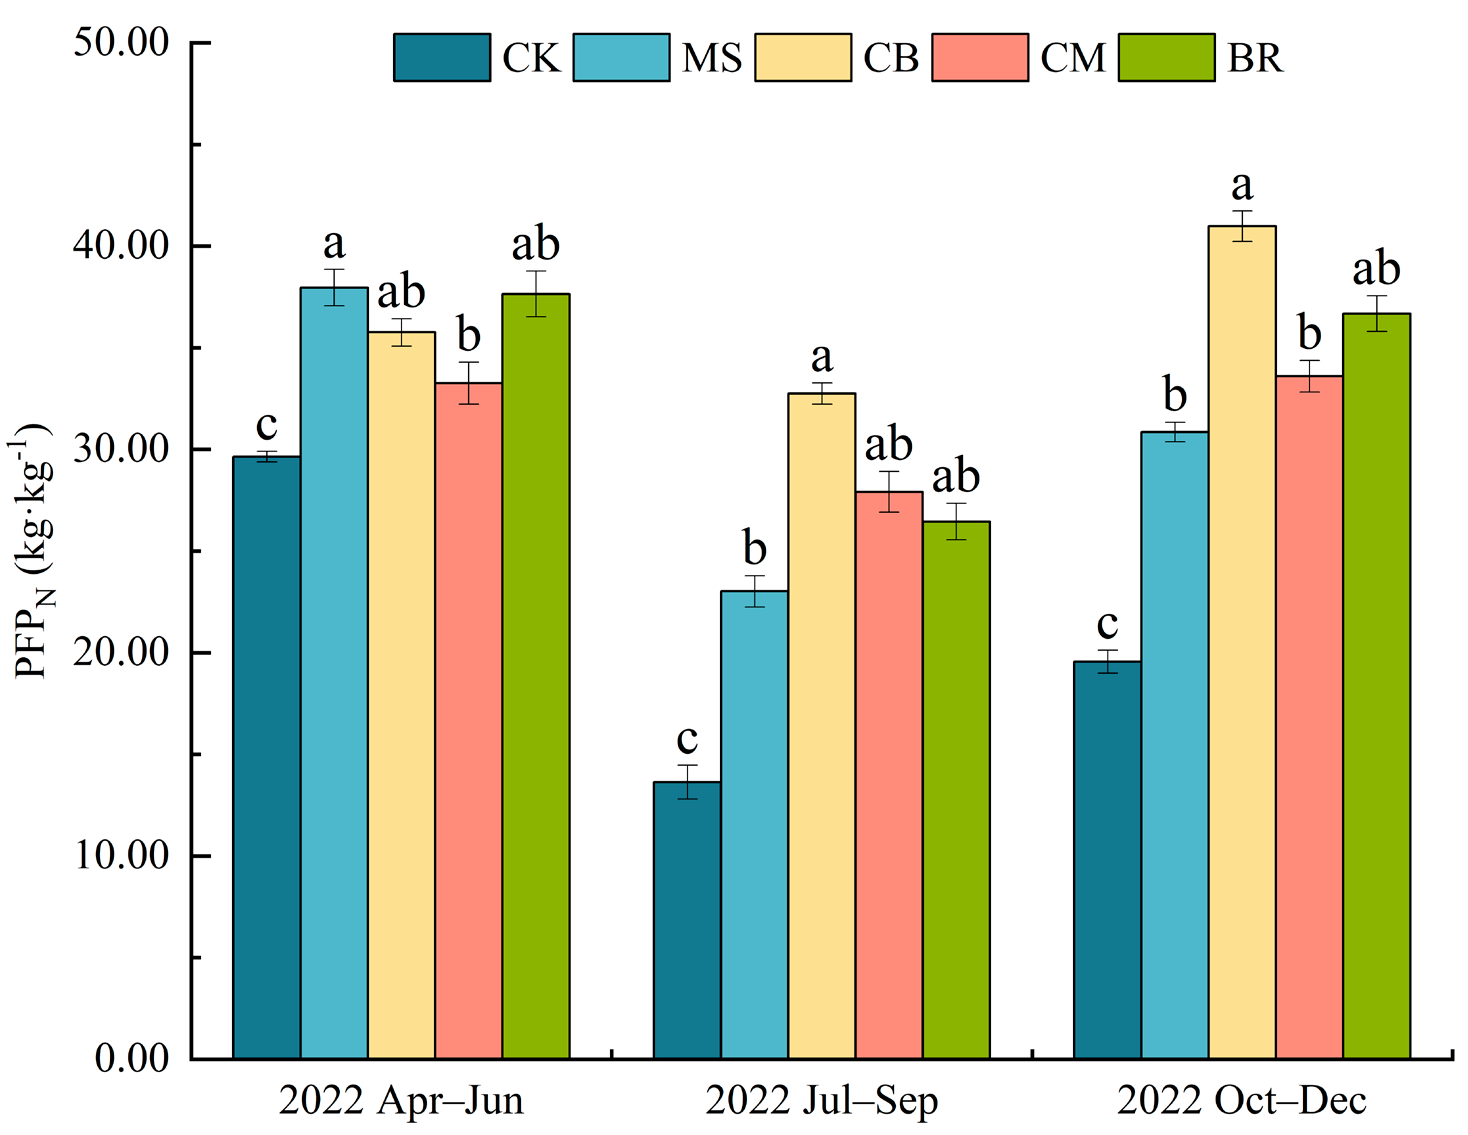
3.3. Partial Productivity of Nitrogen Fertilizer

In the three crop seasons, the PFPN in NS practices was higher than that of CK. Specifically, the CB practice had the best improvement in terms of PFPN, which was significantly increased by 20.63–140.30% compared to CK, followed by, in order, BR, CM, and MS practices (Figure 3). These results indicate that NS practice was an effective way to enhance PFPN, with biochar substitution showing the best effect.

3.4. Nitrogen Surplus and Loss

The difference between nitrogen input and nitrogen uptake in crops is the nitrogen surplus. As shown in Table 5, compared to CK, NS practices reduced farmland NSP, with the CB practice consistently exhibiting lower NSP in all three seasons. The CM practice significantly reduced NSP by 15.50% in autumn, with reductions in spring and summer being present but not significant. The BR practice significantly reduced NSP by 15.30% in summer and 21.63% in autumn compared to CK. The MS practice reduced NSP in all three seasons, but the differences were not significant. The variations in NSP across treatments could be attributed to differences in nitrogen uptake in crops and soil nitrogen storage. The NS practices significantly increased nitrogen uptake in crops in the sweet maize farmland system, contributing to a lower NSP compared to CK. At the same time, the CB, CM, and BR practices all increased soil nitrogen storage, while the MS practice decreased soil nitrogen storage, with the effect being more pronounced in autumn. Results from the three-season trials indicated that NS practices increased crop nitrogen uptake and impacted soil nitrogen storage, thus reducing farmland NSP compared to CK.
Under the same nitrogen input conditions, NS practices generally resulted in lower nitrogen losses compared to CK. This indicates that organic substitution could improve nitrogen use efficiency and reduce environmental losses. Among the treatments, the CB practice had the lowest nitrogen losses, followed by MS, CM, and BR. The lower nitrogen losses in the CB practice could be related to its higher crop nitrogen uptake and better soil nitrogen retention. In general, NS practices have lower risks in terms of NSP compared to conventional fertilization, with biochar and biogas residue substitution practices performing particularly well.

3.5. Nitrogen Footprint

As shown in Table 6, compared to CK, NS practices showed a reduction in both NFA and NFY, with the CB practice demonstrating the lowest NF and performing the best overall. The reduction in NF was primarily due to the significant decrease in nitrogen leaching emissions in the NS practices, particularly in the CB practice, which had notably lower nitrogen leaching than CK, while the other treatments also differed from CK but without significantly reductions. Additionally, the reduction in nitrogen fertilizer input in the NS practices led to a decrease in indirect RN emissions, further contributing to the overall reduction in NF.

3.6. Economic Benefit

From a profitability perspective (Table 7), revenue from the NS practices was consistently higher than that from CK, with an increase ranging from 18.25% to 31.54%. However, it is worth noting that although the CB practice achieved the highest revenue (44,921 CNY∙ha−1), its substantial investment in organic materials resulted in a negative net income and a significantly lower input–output ratio compared to the other practices. This serves as a major challenge to its large-scale market adoption. Therefore, reducing the cost of biochar procurement would facilitate the broader implementation of biochar substitution strategies.

4. Discussion

4.1. Effect of Nitrogen Substitution on Nitrogen Utilization

In this study, compared to conventional fertilization, partial substitution with organic fertilizers improved NUE and PFPN in the sweet maize cropping system in South China, indicating that NS practices promote nitrogen uptake in the aboveground parts of crops and enhance nitrogen reutilization capacity and nitrogen availability, thereby creating the conditions for increased crop yield. These findings align with the results of Geng et al. [51] and Zhou et al. [52]. Economically, NS practices also boosted the system’s NUE, leading to higher outputs with the same level of nitrogen inputs. This suggests that NUE has been optimized under NS practices, ultimately enhancing the economic benefits of farmland. On the one hand, organic fertilizers provide a comprehensive range of nutrients, which helps maintain a balanced state of N, P, K, and other nutrients in the soil, thereby contributing to the accumulation of the soil nutrient pool. This balanced nutrient supply not only increases nitrogen fixation but also enhances the crop’s absorption and utilization of nitrogen [53]. On the other hand, the appropriate application of organic fertilizers could effectively coordinate the relationship between soil nitrogen supply and crop nitrogen demand. The application of organic fertilizers optimizes nitrogen supply in the soil, making it more aligned with the needs of crop growth and development, thus improving NUE [54].
In addition, this study found that different substitution methods have varying effects on NUE, which, as some studies suggest, was primarily related to the properties of the organic materials themselves, such as their C/N ratio, nutrient content, micronutrient levels, and nutrient release rates [55,56]. In the NS treatments, the enhancement effect of biochar substitution was more pronounced. This was because the application of biochar improved the physical, chemical, and biological properties of the soil, which promotes root growth and significantly increases aboveground biomass [57]. Additionally, biochar enhances nitrogen uptake by crops by improving soil aggregate stability [58,59,60], thereby effectively increasing NUE. In contrast, the effect of straw substitution on NUE was relatively weaker. This was likely due to the high content of large organic molecules in straw (such as cellulose, hemicellulose, and lignin), which were difficult to fully decompose in the short term [61], leading to relatively weaker nutrient supply capabilities. Furthermore, during the initial decomposition of straw, microbes might compete with crops for soil nitrogen [62]. Compared to straw, manure substitution provided suitable resources for microbes, reducing the competition between microbes and crops caused by straw substitution [63]. The organic fertilizers derived from animal manure always showed active microbes, which were more conducive to the release of soil nutrients [64,65]. However, this might also lead to nitrogen losses during periods of low crop demand. Biogas residue, which was produced through anaerobic fermentation, mainly contains nitrogen in the form of ammonium, providing a more direct and available nitrogen source, but its effect on improving soil structure is relatively weak [66,67].

4.2. Effect of Nitrogen Substitution on Nitrogen Surpluses

In China, the nitrogen input in farmland primarily comes from synthetic fertilizers, followed by organic fertilizers, while nitrogen output is influenced by crop harvest, fertilizer nitrogen loss, and soil nitrogen loss [38,68,69]. Previous studies have shown that properly controlling nitrogen fertilizer application is key to maximizing crop yield and avoiding excessive NSP [14,70]. Moreover, the addition of organic fertilizers significantly affects nitrogen balance, and partially substituting traditional nitrogen fertilizers with organic fertilizers can effectively reduce NSP [71]. The balance of nutrient inputs and outputs in agroecosystems is critical to an understanding of the efficiency of nutrient recycling and an understanding of the potential environmental impacts of cropping systems [72]. Janssen et al. [72] clearly pointed out that when nutrient input exceeds output, a positive balance indicates gradual accumulation of soil nutrients, which, if sustained over the long term, can lead to serious environmental pollution issues. Conversely, a negative balance, where nutrient input is less than output, suggests gradual depletion of soil nutrients, negatively impacting soil productivity.
In this study, all fertilization treatments resulted in a nitrogen surplus in the soil system, indicating that the applied nitrogen was not entirely absorbed by the crops, with a significant portion either remaining in the soil or being lost through other processes. However, compared to CK, NS practices not only increased nitrogen uptake in crops but also contributed to a greater accumulation of nitrogen in the soil pool, thereby effectively reducing the overall NSP in the agricultural system under the same nitrogen application rates. This suggests that organic materials could effectively enhance soil nitrogen stability [73] and reduce nitrogen losses, thereby lowering the risk of environmental pollution [74].
Similarly, a study by Yang et al. [75] demonstrated that partial replacement of chemical fertilizers with organic manure significantly reduced gaseous nitrogen losses (such as N2O emissions and ammonia volatilization) and nitrogen leaching while improving soil nutrient status and crop yields in a wheat–maize rotation system in North China. Nevertheless, the transformation of nitrogen from organic materials was susceptible to factors such as soil type, soil fertility, and the C/N ratio [76,77]. Additionally, differences in soil microbial communities could further influence the transformation and retention of nitrogen from organic materials in the soil. This study showed that CB and BR practices significantly reduced NSP in the soil system, while MS and CM practices did not show significant differences compared to CK. The primary reason might be that biochar, with its highly porous structure and large surface area, effectively adsorbs nitrogen in the soil, particularly ammonium nitrogen [23,78]. This adsorption reduced nitrogen leaching and volatilization, thereby decreasing nitrogen losses. Furthermore, the high C/N ratio of biochar could stimulate microbial growth and enhance microbial nitrogen fixation, leading to better nitrogen retention in the soil [79,80]. Similarly, biogas residue contains a high proportion of ammonium nitrogen, making it an efficient nitrogen source for crops, significantly increasing crop nitrogen uptake and thus reducing soil NSP [81]. On the other hand, cow manure decomposes rapidly and is rich in nitrogen, quickly releasing nitrogen to meet crop demands in the short term [82,83]. Although MS and CM practices significantly increased the nitrogen content in harvested crops, the soil nitrogen pool increment was limited, and the risk of nitrogen loss was higher, making the long-term effects less favorable than those of biochar and biogas residue. Lastly, the MS practice did not significantly improve NUE, leading to only a limited increase in crop nitrogen uptake, maintaining a relatively high NSP in the system.

4.3. Effect of Nitrogen Substitution on Nitrogen Loss

Optimizing nitrogen management strategies is crucial for improving crop nitrogen fertilizer use efficiency, reducing apparent nitrogen losses, and mitigating environmental pollution risks [84]. Reasonable nitrogen management measures could ensure that crops receive sufficient nutrients while reducing the ineffective loss of nitrogen in the environment, thus realizing the sustainable development of agricultural production [85,86]. Standing at the farmland level, this study showed that the average nitrogen loss in CK accounted for 65.26% of total nitrogen input, while the average total nitrogen loss under the NS practices ranged from 52.78% to 64.30% of total nitrogen content. This clearly indicates that NS practices could reduce nitrogen loss. From the environmental point of view, conventional fertilization is not conducive to the safety of sweet maize farmland in South China. Meanwhile, the results of this study showed that the combined application of biochar and reduced nitrogen was the most effective. This might be a result of biochar’s ability to absorb nitrogen, which reduces nitrogen leaching and volatilization, thereby lowering direct RN emissions [87]. Additionally, biochar can serve as a habitat for soil microbial communities, enhancing microbial nitrogen retention [88]. Studies have shown that biochar-amended soils exhibit increased microbial biomass and enzyme activity [89], which promote nitrogen immobilization and reduce nitrogen losses through nitrification and denitrification processes [90]. Furthermore, under the same nitrogen input conditions, the biochar substitution introduced additional exogenous carbon into the soil system, which facilitates nitrogen fixation and reduces nitrogen loss [48,91].
Furthermore, this study used a NF method to evaluate the nitrogen loss caused by different NS practices from a life cycle perspective. Our results showed that, under equal nitrogen input, partial substitution of synthetic fertilizers with organic fertilizers effectively reduced the NF of the sweet maize farming system. The results were consistent with previous studies. For example, Li et al. [92] found that by reducing nitrogen fertilizer application and incorporating a small amount of organic material into the soil, the NF in wheat–maize systems could be lowered. Zhou et al. [93] also discovered that organic-substitute strategies decreased the carbon footprint and nitrogen footprint in intensive vegetable farming. This outcome could be attributed to several factors. On the one hand, nitrogen fertilizer is the primary factor contributing to the NF in cropping systems [92]. Research has shown that RN emissions from synthetic fertilizer application account for 70.18% to 81.04% of the NF in agricultural production [92]. The combined application of organic and synthetic fertilizers could reduce not only indirect RN emissions during the production process by reducing the use of nitrogen fertilizers but also direct RN emissions caused by the excessive application of nitrogen fertilizers. On the other hand, NS practices increased crop nitrogen uptake and reduced NSP in the agricultural system, thereby lowering the risk of nitrogen loss. This study, from a life cycle assessment perspective, highlights the importance of NS practices as a fertilization strategy. However, in this study, the direct RN emissions were estimated using local models derived from Chen et al. [48], without measuring actual data for each component, leading to consistent nitrogen emissions, ammonia volatilization, and ammonium nitrogen leaching across different fertilization methods. Therefore, to improve the accuracy of the estimates, future research could consider obtaining actual data on the loss of each component of direct RN emissions through field measurements and development of specific parameters and models tailored to the sweet maize production system in the Pearl River Delta region. This would enable a more precise assessment of the impact of organic substitution on the nitrogen footprint, providing a scientific basis for formulating reasonable fertilization management strategies.

4.4. Potential Uncertainty and Limitations

This study explored the effects of nitrogen substitution practices on nitrogen utilization, surplus, and footprint, but a few limitations and uncertainties still exist. First, we assumed that the nitrogen substitution rate of organic materials was fixed and that different types of organic materials were equivalent in the nutrient supply. However, there are significant differences in the decomposition rates and nutrient availability of different organic materials [94]. For example, straw decomposes more slowly and releases nutrients over a longer period [61], while manure decomposes faster and releases nutrients more quickly [95]. This means that the set substitution rate of organic fertilizers may not fully reflect the actual nutrient supply situation, thus introducing some uncertainty. Second, this study only focused on short-term changes in nitrogen use efficiency, nitrogen surplus, and nitrogen footprint. In the long term, the application of organic fertilizers may have more complex effects on soil microbial communities, soil structure, and nutrient cycling [96,97]. Therefore, future studies can consider conducting long-term trials to better understand the long-term impacts of organic fertilizer substitution on the sustainability of agricultural ecosystems. Third, we did not integrate the pre-existing footprints of biogas residue and biochar into the NF system boundary in this study because these emissions would introduce multi-product allocation issues and increase more uncertainty. Also, the pre-existing footprints are generally viewed as environmental costs derived from the clean energy sector instead of from agricultural practices.

5. Conclusions

The results indicate that NS practices could enhance nitrogen uptake by crops, thereby improving NUE in the sweet maize system in South China. Meanwhile, compared to conventional nitrogen fertilizer, NS practices reduced NSP and nitrogen loss in the sweet maize farming system. Additionally, the study showed that NS practices could effectively reduce the area-based and yield-based NFs of the sweet maize farming system. Among the NS treatments, biochar substitution was particularly effective in promoting nitrogen uptake by the crops and reducing NSP, significantly lowering nitrogen losses and further mitigating the risk of environmental pollution. However, its high input cost limited its competitiveness in terms of economic benefits. More studies on exploring higher substitution rates or investigating microbial responses to different NS practices would be necessary in the future. This study provides a research basis for nitrogen management in the sweet maize cultivation system in South China. It also provides valuable information with respect to achieving sustainable agricultural development in typical subtropical areas in East Asia.

Author Contributions

Conceptualization, X.W. and Y.C.; data curation, K.C. and Y.X.; formal analysis, H.H. and Y.C.; investigation, L.Z. and J.L.; methodology, Y.C.; writing—original draft, H.H.; writing—review and editing, X.W. All authors have read and agreed to the published version of the manuscript.

Funding

This research was funded by the National Key Research and Development Program of China, grant number 2023YFD2302300, and the Natural Science Foundation of Guangdong Province, grant number 2025A1515010987.

Institutional Review Board Statement

Not applicable.

Informed Consent Statement

Not applicable.

Data Availability Statement

The data presented in this study are available on request from the corresponding author.

Acknowledgments

We thank the anonymous reviewers and editors for their very helpful comments and suggestions for the manuscript.

Conflicts of Interest

The author Yun Chen was employed by the company Guangzhou Nansha Assets Operation Group Co., Ltd. All authors declare no conflicts of interest.

References

  1. Gruber, N.; Galloway, J.N. An Earth-system perspective of the global nitrogen cycle. Nature 2008, 451, 293–296. [Google Scholar] [CrossRef] [PubMed]
  2. Yan, X.Y.; Xia, L.L.; Ti, C.P. Win-win Nitrogen Management Practices for Improving Crop Yield and Environmental Sustainability. Bull. Chin. Acad. Sci. 2018, 33, 177–183, (In Chinese with English Abstract). [Google Scholar] [CrossRef]
  3. Ju, X.T.; Zhang, C. The Principles and Indicators of Rational N Fertilization. Acta Pedol. Sin. 2021, 58, 1–13, (In Chinese with English Abstract). [Google Scholar] [CrossRef]
  4. FAOSTAT Database. Food and Agriculture Organization of the United Nations, Statistics Division. Available online: http://www.fao.org/faostat/en/#home (accessed on 15 August 2024).
  5. Zhang, X.; Davidson, E.A.; Mauzerall, D.L.; Searchinger, T.D.; Dumas, P.; Shen, Y. Managing nitrogen for sustainable development. Nature 2015, 528, 51–59. [Google Scholar] [CrossRef] [PubMed]
  6. Yu, C.; Huang, X.; Chen, H.; Godfray, H.C.J.; Wright, J.S.; Hall, J.W.; Gong, P.; Ni, S.; Qiao, S.; Huang, G.; et al. Managing nitrogen to restore water quality in China. Nature 2019, 567, 516–520. [Google Scholar] [CrossRef]
  7. Ochieng, I.O.; Gitari, H.I.; Mochoge, B.; Rezaei-Chiyaneh, E.; Gweyi-Onyango, J.P. Optimizing Maize Yield, Nitrogen Efficacy and Grain Protein Content under Different N Forms and Rates. J. Soil Sci. Plant Nutr. 2021, 21, 1867–1880. [Google Scholar] [CrossRef]
  8. Guo, J.H.; Liu, X.J.; Zhang, Y.; Shen, J.L.; Han, W.X.; Zhang, W.F.; Christie, P.; Goulding, K.W.T.; Vitousek, P.M.; Zhang, F.S. Significant Acidification in Major Chinese Croplands. Science 2010, 327, 1008–1010. [Google Scholar] [CrossRef] [PubMed]
  9. Reay, D.S.; Davidson, E.A.; Smith, K.A.; Smith, P.; Melillo, J.M.; Dentener, F.; Crutzen, P.J. Global agriculture and nitrous oxide emissions. Nat. Clim. Change 2012, 2, 410–416. [Google Scholar] [CrossRef]
  10. Kanakidou, M. China’s nitrogen management. Nat. Geosci. 2019, 12, 403–404. [Google Scholar] [CrossRef]
  11. Fu, Y.; Zhong, X.; Pan, J.; Liang, K.; Liu, Y.; Peng, B.; Hu, X.; Huang, N. QTLs identification for nitrogen and phosphorus uptake-related traits using ultra-high density SNP linkage. Plant Sci. 2019, 288, 110209. [Google Scholar] [CrossRef]
  12. Pandey, C.; Diwan, H. Assessing fertilizer use behaviour for environmental management and sustainability: A quantitative study in agriculturally intensive regions of Uttar Pradesh, India. Environ. Dev. Sustain. 2021, 23, 5822–5845. [Google Scholar] [CrossRef]
  13. Hou, P.; Liu, Y.; Liu, W.; Liu, G.; Xie, R.; Wang, K.; Ming, B.; Wang, Y.; Zhao, R.; Zhang, W.; et al. How to increase maize production without extra nitrogen input. Resour. Conserv. Recycl. 2020, 160, 104913. [Google Scholar] [CrossRef]
  14. Ren, K.; Xu, M.; Li, R.; Zheng, L.; Liu, S.; Reis, S.; Wang, H.; Lu, C.; Zhang, W.; Gao, H.; et al. Optimizing nitrogen fertilizer use for more grain and less pollution. J. Clean. Prod. 2022, 360, 132180. [Google Scholar] [CrossRef]
  15. Cai, A.; Xu, M.; Wang, B.; Zhang, W.; Liang, G.; Hou, E.; Luo, Y. Manure acts as a better fertilizer for increasing crop yields than synthetic fertilizer does by improving soil fertility. Soil Tillage Res. 2019, 189, 168–175. [Google Scholar] [CrossRef]
  16. Tang, Q.; Ti, C.; Xia, L.; Xia, Y.; Wei, Z.; Yan, X. Ecosystem services of partial organic substitution for chemical fertilizer in a peri-urban zone in China. J. Clean. Prod. 2019, 224, 779–788. [Google Scholar] [CrossRef]
  17. Pan, G.; Zhou, P.; Li, Z.; Smith, P.; Li, L.; Qiu, D.; Zhang, X.; Xu, X.; Shen, S.; Chen, X. Combined inorganic/organic fertilization enhances N efficiency and increases rice productivity through organic carbon accumulation in a rice paddy from the Tai Lake region, China. Agric. Ecosyst. Environ. 2009, 131, 274–280. [Google Scholar] [CrossRef]
  18. Sun, R.; Zhang, X.; Guo, X.; Wang, D.; Chu, H. Bacterial diversity in soils subjected to long-term chemical fertilization can be more stably maintained with the addition of livestock manure than wheat straw. Soil Biol. Biochem. 2015, 88, 9–18. [Google Scholar] [CrossRef]
  19. Schröder, J.J.; de Visser, W.; Assinck, F.B.T.; Velthof, G.L. Effects of short-term nitrogen supply from livestock manures and cover crops on silage maize production and nitrate leaching. Soil Use Manag. 2013, 29, 151–160. [Google Scholar] [CrossRef]
  20. Zhang, F.; Cui, Z.; Chen, X.; Ju, X.; Shen, J.; Chen, Q.; Liu, X.; Zhang, W.; Mi, G.; Fan, M.; et al. Chapter one—Integrated Nutrient Management for Food Security and Environmental Quality in China. In Advances in Agronomy; Sparks, D.L., Ed.; Academic Press: Cambridge, MA, USA, 2012; Volume 116, pp. 1–40. [Google Scholar]
  21. Xu, D.Y.; Li, H.Y.; Sun, Y.X.; Wu, G.; Wang, J.B.; Yuan, M.M.; Wang, P.X.; Zhang, X.M.; Shu, X.H. Combined Application of Different Proportions of Organic and Inorganic Fertilizers: Effects on Rice Yield and Nitrogen Use Efficiency. Chin. Agric. Sci. Bull. 2022, 38, 1–5, (In Chinese with English Abstract). [Google Scholar] [CrossRef]
  22. Wan, C.; Ma, Y.J.; Chen, S.W.; Zhang, K.Q.; Wang, F.; Shen, S.Z. Effects of different ratios of organic fertilizers replacing chemical fertilizers on nitrogen and phosphorus utilization ratio of rice and nitrogen and phosphorus balance in rice fields. Jiangsu Agric. Sci. 2024, 52, 93–98, (In Chinese with English Abstract). [Google Scholar] [CrossRef]
  23. Peng, J.; Han, X.; Li, N.; Chen, K.; Yang, J.; Zhan, X.; Luo, P.; Liu, N. Combined application of biochar with fertilizer promotes nitrogen uptake in maize by increasing nitrogen retention in soil. Biochar 2021, 3, 367–379. [Google Scholar] [CrossRef]
  24. Li, S.; Wang, S.; Shangguan, Z. Combined biochar and nitrogen fertilization at appropriate rates could balance the leaching and availability of soil inorganic nitrogen. Agric. Ecosyst. Environ. 2019, 276, 21–30. [Google Scholar] [CrossRef]
  25. Fan, X.; Chen, X.; Chen, T.; Liu, X.; Song, Y.; Tan, S.; Chen, Y.; Yan, P.; Wang, X. Effects of substituting synthetic nitrogen with organic amendments on crop yield, net greenhouse gas emissions and carbon footprint: A global meta-analysis. Field Crop Res. 2023, 301, 109035. [Google Scholar] [CrossRef]
  26. Xu, L.; Zhao, J.R.; Lu, B.S.; Shi, Y.X.; Fan, Y.L. Current situation and development trend of fresh corn seed industry in China. China Seed Ind. 2020, 10, 14–18, (In Chinese with English Abstract). [Google Scholar] [CrossRef]
  27. Demeter, C.; Nagy, J.; Huzsvai, L.; Zelenák, A.; Szabó, A.; Széles, A. Analysis of the Content Values of Sweet Maize (Zea mays L. Convar Saccharata Koern) in Precision Farming. Agronomy 2021, 11, 2596. [Google Scholar] [CrossRef]
  28. Li, K.; Huang, C.L. Current Production Status, Problem and Countermeasure on Sweet Corn Industry in China. Sugar Crops China 2021, 43, 67–71, (In Chinese with English Abstract). [Google Scholar] [CrossRef]
  29. Yin, X.; Song, Z.; Shi, S.; Bai, Z.; Jiang, Y.; Zheng, A.; Huang, W.; Chen, N.; Chen, F. Developments and prospects of multiple cropping in China. Farming Syst. 2024, 2, 100083. [Google Scholar] [CrossRef]
  30. Zhang, B.G.; Li, Q.; Chen, Q.X.; Luo, S.B.; Cao, J.; Zhong, Y.J.; Yang, Q. Research on index system for sweet maize fertilization in Guangdong. Guangdong Agric. Sci. 2013, 40, 67–70, (In Chinese with English Abstract). [Google Scholar] [CrossRef]
  31. Huang, Q.Y.; Tang, S.H.; Zhang, F.B.; Zhang, M.; Huang, X.; Pang, Y.W.; Li, P.; Fu, H.T. Effect of the blending ratio of controlled-release urea and conventional urea on yield and nitrogen utilization efficiency of sweet corn. J. Plant Nutr. Fertil. 2017, 23, 622–631, (In Chinese with English Abstract). [Google Scholar] [CrossRef]
  32. Heumann, S.; Fier, A.; Haßdenteufel, M.; Höper, H.; Schäfer, W.; Eiler, T.; Böttcher, J. Minimizing nitrate leaching while maintaining crop yields: Insights by simulating net N mineralization. Nutr. Cycl. Agroecosys. 2013, 95, 395–408. [Google Scholar] [CrossRef]
  33. Shang, Q.; Gao, C.; Yang, X.; Wu, P.; Ling, N.; Shen, Q.; Guo, S. Ammonia volatilization in Chinese double rice-cropping systems: A 3-year field measurement in long-term fertilizer experiments. Biol. Fert. Soils 2014, 50, 715–725. [Google Scholar] [CrossRef]
  34. Bremner, J.M.; Mulvaney, C.S. Nitrogen—Total. In Methods of Soil Analysis: Part 2 Chemical and Microbiological Properties, 9.2.2, 2nd ed.; Wiley Online Library: Hoboken, NJ, USA, 1982; pp. 595–624. [Google Scholar]
  35. Gai, X.; Liu, H.; Liu, J.; Zhai, L.; Yang, B.; Wu, S.; Ren, T.; Lei, Q.; Wang, H. Long-term benefits of combining chemical fertilizer and manure applications on crop yields and soil carbon and nitrogen stocks in North China Plain. Agric. Water Manag. 2018, 208, 384–392. [Google Scholar] [CrossRef]
  36. Sun, W.Y.; Tian, C.Y.; Yin, H.J.; Xu, J.K.; Zhao, B.Q.; Tang, J.W. Long-term effect of organic fertilizer on soil system nitrogen surplus and nitrogen loss in winter wheat-summer maize rotation system. Soil Fertil. Sci. China 2022, 3, 21–28, (In Chinese with English Abstract). [Google Scholar] [CrossRef]
  37. Ju, X.T.; Gu, B.J. Indexes of Nitrogen Management. Acta Pedol. Sin. 2017, 54, 281–296, (In Chinese with English Abstract). [Google Scholar] [CrossRef]
  38. Wang, C.; Mori, T.; Mao, Q.; Zhou, K.; Wang, Z.; Zhang, Y.; Mo, H.; Lu, X.; Mo, J. Long-term phosphorus addition downregulates microbial investments on enzyme productions in a mature tropical forest. J. Soil Sediment. 2020, 20, 921–930. [Google Scholar] [CrossRef]
  39. Bouwman, L.; Goldewijk, K.K.; Van Der Hoek, K.W.; Beusen, A.H.W.; Van Vuuren, D.P.; Willems, J.; Rufino, M.C.; Stehfest, E. Exploring global changes in nitrogen and phosphorus cycles in agriculture induced by livestock production over the 1900–2050 period. Proc. Natl. Acad. Sci. USA 2013, 110, 20882–20887. [Google Scholar] [CrossRef] [PubMed]
  40. Xu, W.; Luo, X.S.; Pan, Y.P.; Zhang, L.; Tang, A.H.; Shen, J.L.; Zhang, Y.; Li, K.H.; Wu, Q.H.; Yang, D.W.; et al. Quantifying atmospheric nitrogen deposition through a nationwide monitoring network across China. Atmos. Chem. Phys. 2015, 15, 12345–12360. [Google Scholar] [CrossRef]
  41. Xu, P.X.; Han, L.L.; He, J.Z.; Luo, F.; Zhang, L.M. Research advance on molecular ecology of asymbiotic nitrogen fixation microbes. Chin. J. Appl. Ecol. 2017, 28, 3440–3450, (In Chinese with English Abstract). [Google Scholar]
  42. Li, Y.; Huang, G.; Chen, Z.; Xiong, Y.; Huang, Q.; Xu, X.; Huo, Z. Effects of irrigation and fertilization on grain yield, water and nitrogen dynamics and their use efficiency of spring wheat farmland in an arid agricultural watershed of Northwest China. Agric. Water Manag. 2022, 260, 107277. [Google Scholar] [CrossRef]
  43. Chuan, L.M.; He, P.; Zhao, T.K.; Xu, X.P.; Zheng, H.G. Nitrogen cycling and balance for wheat in China. Chin. J. Appl. Ecol. 2015, 26, 76–86, (In Chinese with English Abstract). [Google Scholar] [CrossRef]
  44. Ren, C.; Zhang, X.; Reis, S.; Wang, S.; Jin, J.; Xu, J.; Gu, B. Climate change unequally affects nitrogen use and losses in global croplands. Nat. Food 2023, 4, 294–304. [Google Scholar] [CrossRef] [PubMed]
  45. Galloway, J.N.; Winiwarter, W.; Leip, A.; Leach, A.M.; Bleeker, A.; Erisman, J.W. Nitrogen footprints: Past, present and future. Environ. Res. Lett. 2014, 9, 115003. [Google Scholar] [CrossRef]
  46. Buendia, E.; Tanabe, K.; Kranjc, A.; Jamsranjav, B.; Fukuda, M.; Ngarize, S.; Osako, A.; Pyrozhenko, Y.; Shermanau, P.; Federici, S. 2019 Refinement to the 2006 IPCC Guidelines for National Greenhouse Gas Inventories; IPCC: Geneva, Switzerland, 2019. [Google Scholar]
  47. Guinee, J.B. Handbook on life cycle assessment operational guide to the ISO standards. Int. J. Life Cycle Assess. 2002, 7, 311–313. [Google Scholar] [CrossRef]
  48. Chen, X.; Cui, Z.; Fan, M.; Vitousek, P.; Zhao, M.; Ma, W.; Wang, Z.; Zhang, W.; Yan, X.; Yang, J.; et al. Producing more grain with lower environmental costs. Nature 2014, 514, 486–489. [Google Scholar] [CrossRef] [PubMed]
  49. Zhu, Y.C.; Li, Y.E.; Jiang, D.F.; Zou, X.X. Life Cycle Assessment on Carbon Footprint of Winter Wheat-Summer Maize Cropping System Based on Survey Data of Gaomi in Shandong Province, China. J. Agric. Resour. Environ. 2017, 34, 473–482. [Google Scholar]
  50. Chen, Z.D.; Xu, C.C.; Ji, L.; Fang, F.P. Comprehensive evaluation for carbon and nitrogen footprints of rice–wheat rotation system in Middle Yangtze River Basin. J. Plant. Nutr. Fertil. 2019, 25, 1125–1133, (In Chinese with English Abstract). [Google Scholar] [CrossRef]
  51. Geng, Y.; Cao, G.; Wang, L.; Wang, S. Effects of equal chemical fertilizer substitutions with organic manure on yield, dry matter, and nitrogen uptake of spring maize and soil nitrogen distribution. PLoS ONE 2019, 14, e219512. [Google Scholar] [CrossRef] [PubMed]
  52. Zhou, Y.L.; Zhang, Y.F.; Chen, S.Q.; Zhang, L.; Wang, W.B. Effect of combined application of organic and inorganic fertilizers on nitrogen uptake and utilization efficiency by paddy rice. Chin. J. Trop. Agric. 2021, 41, 1–6, (In Chinese with English Abstract). [Google Scholar]
  53. Li, F.; Wang, J.P.; Liang, B.; Li, J.L. Effects of Different Organic Materials on Nitrogen Leaching Loss in Greenhouse. Acta Agric. Boreali-Sin. 2020, 35, 256–261, (In Chinese with English Abstract). [Google Scholar] [CrossRef]
  54. Wu, X.K.; Shi, W.M.; Xu, Y.H.; Min, J. Effects of Long-term Different Chemical Nitrogen Rates on Soil Nitrogen Mineralization and Nitrification in Greenhouse Vegetable Field. Soils 2021, 53, 1160–1166, (In Chinese with English Abstract). [Google Scholar] [CrossRef]
  55. Bao, X.M.; Zhang, F.S.; Ma, W.Q.; Xu, W.H. Change of farmyard manure application in Shaanxi Province. Chin. J. Appl. Ecol. 2023, 10, 1669–1672, (In Chinese with English Abstract). [Google Scholar]
  56. Wei, W.L.; Liu, L.; Qiu, H.H. Effects of different organic resources application combined with chemical fertilizer on yield and nitrogen use efficiency of main grain crops in China. J. Plant Nutr. Fertil. 2020, 26, 1384–1394, (In Chinese with English Abstract). [Google Scholar] [CrossRef]
  57. Nguyen, T.T.N.; Xu, C.; Tahmasbian, I.; Che, R.; Xu, Z.; Zhou, X.; Wallace, H.M.; Bai, S.H. Effects of biochar on soil available inorganic nitrogen: A review and meta-analysis. Geoderma 2017, 288, 79–96. [Google Scholar] [CrossRef]
  58. Saikia, P.; Bhattacharya, S.S.; Baruah, K.K. Organic substitution in fertilizer schedule: Impacts on soil health, photosynthetic efficiency, yield and assimilation in wheat grown in alluvial soil. Agric. Ecosyst. Environ. 2015, 203, 102–109. [Google Scholar] [CrossRef]
  59. Zhao, J.; Ni, T.; Li, J.; Lu, Q.; Fang, Z.; Huang, Q.; Zhang, R.; Li, R.; Shen, B.; Shen, Q. Effects of organic–inorganic compound fertilizer with reduced chemical fertilizer application on crop yields, soil biological activity and bacterial community structure in a rice–wheat cropping system. Appl. Soil Ecol. 2016, 99, 1–12. [Google Scholar] [CrossRef]
  60. Fungo, B.; Lehmann, J.; Kalbitz, K.; Thion, O.M.; Okeyo, I.; Tenywa, M.; Neufeldt, H. Aggregate size distribution in a biochar-amended tropical Ultisol under conventional hand-hoe tillage. Soil Tillage Res. 2017, 165, 190–197. [Google Scholar] [CrossRef]
  61. Zhang, Y.X.; Hong, M.; Wen, X.; Pei, Z.F.; Zhao, H.X.; Chen, C.; Wen, X.L. Effect of Different Organic Amendments on Soil Organic Carbon Pool and Chemical Properties in Soda Alkaline Soil. J. Soil Water Conserv. 2022, 36, 311–318, (In Chinese with English Abstract). [Google Scholar] [CrossRef]
  62. Wang, Z.; Sui, P.; Lian, H.; Li, Y.; Liu, X.; Xu, H.; Zhang, H.; Xu, Y.; Gong, X.; Qi, H.; et al. Tillage with straw incorporation? Reduces the optimal nitrogen rate for maize production by affecting crop uptake, utility efficiency, and the soil balance of nitrogen. Land Degrad. Dev. 2023, 34, 2825–2837. [Google Scholar] [CrossRef]
  63. Liu, H.; Du, X.; Li, Y.; Han, X.; Li, B.; Zhang, X.; Li, Q.; Liang, W. Organic substitutions improve soil quality and maize yield through increasing soil microbial diversity. J. Clean. Prod. 2022, 347, 131323. [Google Scholar] [CrossRef]
  64. Liu, E.; Yan, C.; Mei, X.; Zhang, Y.; Fan, T. Long-Term Effect of Manure and Fertilizer on Soil Organic Carbon Pools in Dryland Farming in Northwest China. PLoS ONE 2013, 8, e56536. [Google Scholar] [CrossRef] [PubMed]
  65. Siedt, M.; Sch Ffer, A.; Smith, K.E.C.; Nabel, M.; Ro Nickoll, M.; van Dongen, J.T. Comparing straw, compost, and biochar regarding their suitability as agricultural soil amendments to affect soil structure, nutrient leaching, microbial communities, and the fate of pesticides. Sci. Total Environ. 2021, 751, 141607. [Google Scholar] [CrossRef] [PubMed]
  66. Möller, K.; Müller, T. Effects of anaerobic digestion on digestate nutrient availability and crop growth: A review. Eng. Life Sci. 2012, 12, 242–257. [Google Scholar] [CrossRef]
  67. Möller, K. Effects of anaerobic digestion on soil carbon and nitrogen turnover, N emissions, and soil biological activity. A review. Agron. Sustain. Dev. 2015, 35, 1021–1041. [Google Scholar] [CrossRef]
  68. Zhang, X.J.; Zhao, Y.; Chen, X.Q.; Wu, L.S.; Hu, C.X. Effects of N rate on application rate on N utilization and yield of vegetable and soil residual NO3--N under drip irrigation system. Sci. Agric. Sin. 2017, 11, 2535–2545, (In Chinese with English Abstract). [Google Scholar]
  69. Liu, X.Y.; Ju, X.T.; Zhang, L.J.; Li, X.; Yuan, L.J.; Liu, N. Effects of different N rates on fate of N fertilizer and balance of soil N of winter wheat. J. Plant Nutr. Fertil. 2010, 16, 296–303, (In Chinese with English Abstract). [Google Scholar] [CrossRef]
  70. Deng, L.J.; Ren, Q.R.; Jiao, X.Q. Nitrogen flow characteristics and management of wheat-maize system in Quzhou. Chin. J. Soil Sci. 2020, 51, 1422–1429, (In Chinese with English Abstract). [Google Scholar] [CrossRef]
  71. Ning, J.F.; Ai, S.Y.; Li, M.J.; Yao, J.W.; Yu, D.N.; Wang, S.Y.; Shen, J. Impacts of Reduced Fertilizer Application with Organic N on Vegetable Growth and Soil N Balance in Vegetable Fields in Latosolic Red Soil Zones. Chin. J. Trop. Crops 2019, 40, 1008–1014, (In Chinese with English Abstract). [Google Scholar] [CrossRef]
  72. Janssen, B.H.; de Willigen, P. Ideal and saturated soil fertility as bench marks in nutrient management: II. Interpretation of chemical soil tests in relation to ideal and saturated soil fertility. Agric. Ecosyst. Environ. 2006, 116, 147–155. [Google Scholar] [CrossRef]
  73. Chen, L.; Du, H.; Liu, Q.; Li, T.; Sui, P.; Gao, W.; Chen, Y. Different organic material amendments effects soil nitrogen utilization and crop yield in the North China Plain. Agron. J. 2022, 114, 3473–3486. [Google Scholar] [CrossRef]
  74. Hu, T.R.; Cai, Z.J.; Wang, B.R.; Zhang, L.; Wen, S.L.; Zhu, J.Q.; Xu, M.G. Swine manure as part of the total N source improves red soil resistance to acidification. J. Plant. Nutr. Fertil. 2022, 28, 2052–2059, (In Chinese with English Abstract). [Google Scholar]
  75. Yang, K.; Wu, K.; Sun, R.; Zhang, Y.; Liu, X.; Dong, W.; Li, X.; Hu, C. Effect of partial replacement of mineral fertilizer by manure on nitrogen losses and balance from wheat-maize farmland in North China. Chin. J. Eco-Agric. 2025, 33, 484–497. [Google Scholar] [CrossRef]
  76. Cai, M.; Dong, Y.; Chen, Z.; Kalbitz, K.; Zhou, J. Effects of nitrogen fertilizer on the composition of maize roots and their decomposition at different soil depths. Eur. J. Soil Biol. 2015, 67, 43–50. [Google Scholar] [CrossRef]
  77. Ma, X.; Xu, M.G.; Zhao, H.L.; Duan, Y.H. Decomposition Characteristics and Driving Factors of Organic Materials in Typical Farmland Soils in China. Sci. Agric. Sin. 2019, 52, 1564–1573, (In Chinese with English Abstract). [Google Scholar] [CrossRef]
  78. Marcińczyk, M.; Oleszczuk, P. Biochar and engineered biochar as slow- and controlled-release fertilizers. J. Clean. Prod. 2022, 339, 130685. [Google Scholar] [CrossRef]
  79. Nelissen, V.; Rütting, T.; Huygens, D.; Staelens, J.; Ruysschaert, G.; Boeckx, P. Maize biochars accelerate short-term soil nitrogen dynamics in a loamy sand soil. Soil Biol. Biochem. 2012, 55, 20–27. [Google Scholar] [CrossRef]
  80. Urakawa, R.; Ohte, N.; Shibata, H.; Isobe, K.; Tateno, R.; Oda, T.; Hishi, T.; Fukushima, K.; Inagaki, Y.; Hirai, K.; et al. Factors contributing to soil nitrogen mineralization and nitrification rates of forest soils in the Japanese archipelago. For. Ecol. Manag. 2016, 361, 382–396. [Google Scholar] [CrossRef]
  81. Arthurson, V. Closing the Global Energy and Nutrient Cycles through Application of Biogas Residue to Agricultural Land—Potential Benefits and Drawback. Energies 2009, 2, 226–242. [Google Scholar] [CrossRef]
  82. Eghball, B.; Power, J.F. Phosphorus- and Nitrogen-Based Manure and Compost Applications Corn Production and Soil Phosphorus. Soil Sci. Soc. Am. J. 1999, 63, 895–901. [Google Scholar] [CrossRef]
  83. Whalen, J.K.; Chang, C.; Clayton, G.W.; Carefoot, J.P. Cattle Manure Amendments Can Increase the pH of Acid Soils. Soil Sci. Soc. Am. J. 2000, 64, 962–966. [Google Scholar] [CrossRef]
  84. Shi, X.; Hu, K.; Batchelor, W.D.; Liang, H.; Wu, Y.; Wang, Q.; Fu, J.; Cui, X.; Zhou, F. Exploring optimal nitrogen management strategies to mitigate nitrogen losses from paddy soil in the middle reaches of the Yangtze River. Agric. Water Manag. 2020, 228, 105877. [Google Scholar] [CrossRef]
  85. Deng, O.; Gu, B. Nitrogen management across croplands. Nat. Food 2024, 5, 974–975. [Google Scholar] [CrossRef] [PubMed]
  86. Liu, Y.; Zhuang, M.; Liang, X.; Lam, S.K.; Chen, D.; Malik, A.; Li, M.; Lenzen, M.; Zhang, L.; Zhang, R.; et al. Localized nitrogen management strategies can halve fertilizer use in Chinese staple crop production. Nat. Food 2024, 5, 825–835. [Google Scholar] [CrossRef]
  87. Xia, H.; Riaz, M.; Zhang, M.; Liu, B.; El-Desouki, Z.; Jiang, C. Biochar increases nitrogen use efficiency of maize by relieving aluminum toxicity and improving soil quality in acidic soil. Ecotoxicol. Environ. Saf. 2020, 196, 110531. [Google Scholar] [CrossRef] [PubMed]
  88. Ibrahim, M.M.; Tong, C.; Hu, K.; Zhou, B.; Xing, S.; Mao, Y. Biochar-fertilizer interaction modifies N-sorption, enzyme activities and microbial functional abundance regulating nitrogen retention in rhizosphere soil. Sci. Total Environ. 2020, 739, 140065. [Google Scholar] [CrossRef] [PubMed]
  89. Lopes, É.M.G.; Reis, M.M.; Frazão, L.A.; Da Mata Terra, L.E.; Lopes, E.F.; Dos Santos, M.M.; Fernandes, L.A. Biochar increases enzyme activity and total microbial quality of soil grown with sugarcane. Environ. Technol. Innov. 2021, 21, 101270. [Google Scholar] [CrossRef]
  90. Liu, X.; Shi, Y.; Zhang, Q.; Li, G. Effects of biochar on nitrification and denitrification-mediated N2O emissions and the associated microbial community in an agricultural soil. Environ. Sci. Pollut. Res. 2021, 28, 6649–6663. [Google Scholar] [CrossRef]
  91. Fan, C.; Chen, H.; Li, B.; Xiong, Z. Biochar reduces yield-scaled emissions of reactive nitrogen gases from vegetable soils across China. Biogeosciences 2017, 14, 2851–2863. [Google Scholar] [CrossRef]
  92. Li, C.X.; Liu, Q.; Shao, Y.; Li, S.S.; Li, X.B.; Weng, Z.P. Effects of organic material returning and nitrogen fertilizer reduction on the economic yields and carbon, nitrogen, and water footprints of wheat-maize annual farmland in China. J. Agric. Resour. Environ. 2020, 37, 527–536, (In Chinese with English Abstract). [Google Scholar] [CrossRef]
  93. Zhou, J.; Li, B.; Xia, L.; Fan, C.; Xiong, Z. Organic-substitute strategies reduced carbon and reactive nitrogen footprints and gained net ecosystem economic benefit for intensive vegetable production. J. Clean. Prod. 2019, 225, 984–994. [Google Scholar] [CrossRef]
  94. Sun, L.; Sun, Z.; Hu, J.; Yaa, O.; Wu, J. Decomposition Characteristics, Nutrient Release, and Structural Changes of Maize Straw in Dryland Farming under Combined Application of Animal Manure. Sustainability 2021, 13, 7609. [Google Scholar] [CrossRef]
  95. Bloukounon Goubalan, A.Y.; Aliou, S.; Obognon, N.; Amadji, G.; IGUE, A.; Clottey, V.; Kenis, M. Decomposition and nutrient release pattern of animal manures biodegraded by fly larvae in Acrisols. Can. J. Soil Sci. 2018, 99, 60–69. [Google Scholar] [CrossRef]
  96. Chen, Y.; Jiang, Z.; Ou, J.; Liu, F.; Cai, G.; Tan, K.; Wang, X. Nitrogen substitution practice improves soil quality of red soil (Ultisols) in South China by affecting soil properties and microbial community composition. Soil Tillage Res. 2024, 240, 106089. [Google Scholar] [CrossRef]
  97. Zhu, X.; Ros, G.H.; Xu, M.; Cai, Z.; Sun, N.; Duan, Y.; de Vries, W. Long-term impacts of mineral and organic fertilizer inputs on nitrogen use efficiency for different cropping systems and site conditions in Southern China. Eur. J. Agron. 2023, 146, 126797. [Google Scholar] [CrossRef]
Figure 1. Monthly precipitation, average temperature (a), and sunshine duration (b) in 2022. Data sources: Meteorological data were obtained from the Guangzhou Meteorological Bureau and cited from the Guangzhou Statistical Yearbook 2023.
Agriculture 15 00800 g001
Figure 2. Effects of different treatments on nitrogen utilization efficiency (NUE) in the study. Different letters represent significant differences between different treatments (p < 0.05; Duncan test). Error bars represent the standard error of three replicates. Abbreviations for different fertilization treatments are the same as those in Table 1.
Agriculture 15 00800 g002
Figure 3. Effects of different treatments on the partial productivity of nitrogen fertilizer (PFPN) in the study. Different letters represent significant differences between different treatments (p < 0.05; Duncan test). Error bars represent the standard error of three replicates. Abbreviations for different fertilization treatments are the same as those in Table 1.
Agriculture 15 00800 g003
Table 1. Treatments and application amounts of synthetic fertilizers and organic materials in the field experiment.
TreatmentOrganic Material 1Synthetic Fertilizer (kg·ha−1)Total N Input
Amount (kg·ha−1)Total N content (%)NP2O5K2O(kg·ha−1)
Conventional N input (CK)0.000.00300.00150.00300.00300.00
Substituting 20% synthetic N with crop straw (MS)7091.361.40240.00150.00300.00300.00
Substituting 20% synthetic N with biochar (CB)12,485.040.77240.00150.00300.00300.00
Substituting 20% synthetic N with cow manure (CM)18,117.791.85240.00150.00300.00300.00
Substituting 20% synthetic N with biogas residue (BR)17,251.671.46240.00150.00300.00300.00
1 Applied amounts presented here are the average values of applied organic materials during the study period, which were calculated based on their measured total N content before each cropping season.
Table 2. The basic properties of organic materials used in the study.
Organic MaterialTOC (g·kg−1)TN (g·kg−1)C/N
Maize straw385.10 14.00 27.51
Biochar536.00 7.70 69.61
Cow manure265.50 18.45 14.39
Biogas residue305.95 14.60 20.96
TOC: total organic carbon; TN: total N; C/N: carbon-to-nitrogen ratio. The data in this table represent the average measurements taken during the experimental period.
Table 4. Nitrogen uptake in crops with respect to different treatments in the study.
SeasonTreatmentMaize GrainMaize CobMaize StrawN Uptake in Crops
(kg·ha−1)
Yield
(kg·ha−1)
N Content
(%)
N Uptake
(kg·ha−1)
Yield
(kg·ha−1)
N Content
(%)
N Uptake
(kg·ha−1)
Yield
(kg·ha−1)
N Content
(%)
N Uptake
(kg·ha−1)
2022
April–June
CK1762.23 ab1.51 a26.61 b1063.03 a0.58 a6.20 a5951.58 ab1.82 b95.81 bc128.62 bc
MS1987.93 a1.45 ab29.42 a1044.33 a0.52 a5.48 a6467.75 a1.67 b119.54 b153.23 b
CB1854.03 ab1.42 ab28.76 a990.07 ab0.55 a5.46 a6387.57 a2.19 a154.48 a188.69 a
CM1666.87 b1.34 b27.57 b977.17 ab0.57 a5.45 a6332.00 a1.50 bc113.34 b145.23 b
BR1927.03 a1.50 ab30.66 a993.10 ab0.59 a5.81 a5875.73 ab1.20 c70.14 c106.61 c
2022
July–September
CK1064.61 d1.56 b16.62 d743.46 c1.12 a8.36 bc3187.50 b1.58 b50.49 b75.47 d
MS1449.18 c1.63 ab23.62 c867.24 b1.03 c8.91 bc4023.17 ab1.57 b63.21 ab95.74 cd
CB2002.29 a1.69 a33.91 a1124.23 a0.98 d11.01 a5246.33 a1.55 b81.42 a126.34 a
CM1553.69 c1.62 ab25.23 c1041.34 a1.03 c10.69 a4029.83 ab1.56 b62.7 ab98.61 bc
BR1696.54 b1.65 a27.98 b918.60 b1.07 b9.81 b4603.56 a1.75 a80.95 a118.74 ab
2022
October–December
CK1303.14 d2.45 a31.93 c862.03 c0.71 a6.15 b4556.00 b1.63 a74.19 b112.27 c
MS1565.64 c2.35 b36.72 bc953.33 bc0.68 ab6.46 b6452.67 ab1.30 d83.68 ab126.86 bc
CB1988.00 a2.34 b46.56 a1229.96 a0.64 b7.85 a8369.83 a1.34 c112.57 a166.99 a
CM1737.50 bc2.29 b39.89 b1068.78 b0.71 a7.55 a7886.67 a1.30 d102.96 ab150.40 ab
BR1797.93 ab2.30 b41.34 b953.53 bc0.70 a6.66 b7626.00 a1.54 b117.49 a165.48 a
AverageCK1376.66 c1.84 a25.05 d889.51 b0.80 a6.90 b4565.03 d1.68 a73.50 b105.45 d
MS1667.58 b1.81 ab29.92 c954.97 ab0.74 ab6.95 b5647.86 bc1.51 b88.81 ab125.27 c
CB1948.11 a1.82 a36.40 a1114.75 a0.72 b8.11 a6667.91 a1.69 a116.16 a160.67 a
CM1652.69 b1.75 b30.89 c1029.10 a0.77 a7.90 a6082.83 ab1.45 c93.00 ab131.79 b
BR1807.17 ab1.82 a33.32 b955.08 ab0.79 a7.43 ab6035.10 ab1.50 b89.53 ab130.27 b
Different letters in each line represent significant differences between different treatments (p < 0.05). Abbreviations for different fertilization treatments are the same as those in Table 1.
Table 5. Nitrogen surplus and loss with respect to different treatments in the study.
SeasonNitrogen Budget (kg·ha−1)CKMSCBCMBR
2022
April–June
Nitrogen fertilizer300.00 a240.00 b240.00 b240.00 b240.00 b
Organic material0.00 a60.00 b60.00 b60.00 b60.00 b
Seed0.50 a0.50 a0.50 a0.50 a0.50 a
Biological nitrogen fixation5.00 a5.00 a5.00 a5.00 a5.00 a
Nitrogen deposition37.80 a37.80 a37.80 a37.80 a37.80 a
Soil non-symbiotic nitrogen fixation15.00 a15.00 a15.00 a15.00 a15.00 a
Nitrogen input358.30 a358.30 a358.30 a358.30 a358.30 a
Nitrogen uptake in crops128.62 c153.23 b188.69 a145.23 b136.65 bc
Soil nitrogen pool increment−33.51 d14.54 c42.38 a−25.73 e23.40 b
Nitrogen surplus229.68 a205.07 ab169.61 b211.93 ab221.65 a
Nitrogen loss263.19 a190.53 c127.23 d237.66 ab198.25 c
2022
July–September
Nitrogen fertilizer300.00 a240.00 b240.00 b240.00 b240.00 b
Organic material0.00 a60.00 b60.00 b60.00 b60.00 b
Seed0.50 a0.50 a0.50 a0.50 a0.50 a
Biological nitrogen fixation5.00 a5.00 a5.00 a5.00 a5.00 a
Nitrogen deposition37.80 a37.80 a37.80 a37.80 a37.80 a
Soil non-symbiotic nitrogen fixation15.00 a15.00 a15.00 a15.00 a15.00 a
Nitrogen input358.30 a358.30 a358.30 a358.30 a358.30 a
Nitrogen uptake in crops75.47 d95.74 cd126.34 a98.61 bc118.74 ab
Soil nitrogen pool increment−56.70 b−59.76 bc−36.31 a−52.24 b−34.37 a
Nitrogen surplus282.83 a262.56 ab231.96 c259.69 ab239.56 bc
Nitrogen loss339.53 a322.32 ab268.27 c311.93 ab273.93 c
2022
October–December
Nitrogen fertilizer300.00 a240.00 b240.00 b240.00 b240.00 b
Organic material0.00 a60.00 b60.00 b60.00 b60.00 b
Seed0.50 a0.50 a0.50 a0.50 a0.50 a
Biological nitrogen fixation5.00 a5.00 a5.00 a5.00 a5.00 a
Nitrogen deposition37.80 a37.80 a37.80 a37.80 a37.80 a
Soil non-symbiotic nitrogen fixation15.00 a15.00 a15.00 a15.00 a15.00 a
Nitrogen input358.30 a358.30 a358.30 a358.30 a358.30 a
Nitrogen uptake in crops112.27 c126.86 bc166.99 a150.40 ab165.48 a
Soil nitrogen pool increment87.88 cd75.35 d144.56 a102.58 c131.81 ab
Nitrogen surplus246.03 a231.44 ab191.31 c207.9 bc192.82 c
Nitrogen loss158.15 a156.09 ab46.75 de105.32 c61.01 d
Different letters in each line represent significant differences between different treatments (p < 0.05). Abbreviations for different fertilization treatments are the same as those in Table 1.
Table 6. Nitrogen footprints (NFs) of different treatments in this study.
TreatmentDirect RN Emissions (kg N-eq·ha−1)Indirect RN Emissions (kg N-eq·ha−1)NFA
(kg N-eq·ha−1)
NFY
(kg N-eq·kg−1)
N2O EmissionsNH3 VolatilizationN LeachingDieselFertilizerPesticides
CK0.87 a74.29 a304.09 a0.05 a0.36 a0.08 a379.75 a0.0426 a
MS0.87 a74.29 a252.36 a0.05 a0.30 b0.08 a327.95 a0.0280 b
CB0.87 a74.29 a181.73 b0.05 a0.30 b0.08 a257.33 b0.0223 b
CM0.87 a74.29 a237.80 ab0.05 a0.30 b0.08 a313.40 ab0.0225 b
BR0.87 a74.29 a240.96 ab0.05 a0.30 b0.08 a316.55 ab0.0272 b
Different letters in each line represent significant differences between different treatments (p < 0.05). Abbreviations for different fertilization treatments are the same as those in Table 1.
Table 7. Economic benefits of different treatments in this study.
TreatmentsTotal Input (CNY·ha−1)Revenue
(CNY·ha−1)
Net Revenue
(CNY·ha−1)
Input–Output
Ratio
Organic Material
(CNY·ha−1)
Fertilizer
(CNY·ha−1)
Other Costs
(CNY·ha−1)
CK0213010,89134,15021,1292.62 bc
MS0197411,27640,38227,1323.05 ab
CB49,940197411,25144,921−18,2440.71 d
CM0197411,25141,59628,3713.15 a
BR3450197411,25142,46025,7842.55 c
Different letters in each line represent significant differences between different treatments (p < 0.05). Abbreviations for different fertilization treatments are the same as those in Table 1.
Disclaimer/Publisher’s Note: The statements, opinions and data contained in all publications are solely those of the individual author(s) and contributor(s) and not of MDPI and/or the editor(s). MDPI and/or the editor(s) disclaim responsibility for any injury to people or property resulting from any ideas, methods, instructions or products referred to in the content.

