Article

Spatiotemporal Variability and Drivers of Cropland Non-Agricultural Conversion Across Mountainous County Types: Evidence from the Qian-Gui Karst Region, China

1
Faculty of Geography, Yunnan Normal University, Kunming 650500, China
2
School of Business and Tourism Management, Yunnan University, Kunming 650500, China
3
School of History, Yunnan Normal University, Kunming 650500, China
*
Author to whom correspondence should be addressed.
Agriculture 2025, 15(7), 795; https://doi.org/10.3390/agriculture15070795
Submission received: 1 March 2025 / Revised: 31 March 2025 / Accepted: 3 April 2025 / Published: 7 April 2025

Abstract

:
The accelerating conversion of agricultural land to non-agricultural uses poses critical threats to food security and sustainable land management, particularly in ecologically fragile karst mountainous regions. This study investigated the spatiotemporal patterns and driving mechanisms of cropland non-agricultural conversion (CNAC) in the Qian-Gui karst region (Guangxi and Guizhou, China) from 2000 to 2020, employing land use datasets and socioeconomic indicators through geographically weighted regression (GWR) modeling. The results showed that (1) from 2000 to 2020, the CNAC rate in the Qian-Guizhou karst mountainous region reached 2.03%. The area of CNAC increased by 14.60 × 10⁴ hm2, increasing 1.74 times in 2010–2020 compared to 2000–2010, showing a trend of rapid growth. Specifically, the growth rate of the CNAC area was the highest in apparent mountainous (110.36%) and quasi-mountainous counties (100.5%), followed by semi-mountainous counties (95.28%), while entirely mountainous (40.89%) and pure hilly counties (37.68%) experienced the lowest growth, revealing distinct regional disparities. (2) Spatially, CNAC exhibited a pattern of “high in the north and south, low in the central region”, and the overall level of CNAC displayed significant regional imbalances, with extreme grades distributed in provincial capitals, high and medium grades concentrated in prefecture-level city districts, and light and low grades mainly located in counties and districts (accounting for more than 55.56% of the total number of research units in the two time periods). (3) There was significant spatial heterogeneity in the driving effect of factors influencing CNAC. Agricultural output and population density showed the strongest positive correlations; effectively irrigated areas exhibited a growing influence over time (except for pure hilly counties); rocky desertification areas exerted a strengthened influence on CNAC in pure hilly counties, while their impact was relatively lower in other regions compared to other indicators. Therefore, when formulating policies to protect farmland, it is essential to take into account the specific conditions of different types of counties in mountainous areas and adopt management measures tailored to these regional characteristics.

1. Introduction

Cropland is the cornerstone of agricultural activity [1] and is essential for food production and rural livelihoods [2]. As urbanization continues to accelerate, along with industrialization and population growth in China, a large amount of cropland is being converted to impervious surfaces [3], resulting in a significant loss of scarce cropland resources. At the same time, China’s cropland also faces the reality of a gradual decrease in quantity and local quality degradation [4,5,6], coupled with the uncertainty brought about by geopolitical conflicts and extreme climate impacts over the past few years [7,8]. Alterations in cropland directly affect China’s food production and supply [9], which, in turn, affects social stability and economic development [10]. Therefore, the spatiotemporal dynamics of and changes in cropland utilization are consistently a focus of social concern [11,12], particularly CNAC.
The essence of CNAC is that it is a process by which cropland becomes an impervious surface for housing, transportation, industry, etc., due to changes in the socioeconomic environment [13,14]. This is an inevitable phenomenon of human social and economic development and is also the result of the competitive allocation of land resources [15]. In recent years, research on CNAC has focused on analyzing its causes [16], discussing its scale [17], acquiring relevant information [18], examining its spatiotemporal patterns [19], assessing the various impacts it has caused [20], and proposing relevant suggestions on how to curb it [21,22]. The existing research results have provided important theoretical support and empirical evidence for analyzing the impact mechanism of CNAC and formulating related policies. However, there is still room for further research.
First, in terms of influencing factors, there is a lack of consideration of time and place. The process of CNAC exhibits strong temporal and spatial non-stationarity [23], which must lead to the spatiotemporal variability of driving factors in different time periods and regions [24]. For example, how deeply does rocky desertification in karst areas affect CNAC, and does it play a dominant or secondary role? Existing studies on the factors affecting CNAC in karst areas have been based on the analysis of general factors identified by academics (e.g., urbanization rate), and there has been no quantification of rocky desertification to discuss its impact on CNAC [25,26,27]. Second, in terms of research scale, scholars have mostly focused on the macro-level, such as national, provincial, and municipal levels [25,28]. However, discussions at the provincial scale struggle to effectively reveal the spatial heterogeneity of CNAC within a region [29], and research at the township scale [26] may lead to the weakening of the pilot effect due to the fragmentation of the administrative unit, which all constrain the reference value and practical application value of the research results to varying degrees. However, it is worth paying attention to the fact that China is currently accelerating the construction of new urbanization with counties as the carriers of this change [30], and the county scale not only carries the realistic governance needs of CNAC but also fits highly with the basic administrative unit in the land spatial planning system. Therefore, it is imperative to introduce county data to carry out a comprehensive analysis of CNAC. Third, in the regional dimension, the existing studies on CNAC have mostly focused on economically developed regions in the east and have paid insufficient attention to mountainous counties, which are both ecologically fragile and lagging behind in development. It is worth noting that mountainous counties account for approximately half of the total number of county-level administrative units in the country [31], and their geographic environment is characterized by spatial heterogeneity with diverse geomorphic patterns, significant gradients in resource endowment, and obvious differences in development stages. This multidimensional heterogeneity directly leads to different types of counties in mountainous areas while also presenting significant spatial differentiation characteristics in terms of the distribution pattern, utilization intensity, and influencing factors of CNAC. Therefore, constructing an analytical framework based on the differences in mountain types is of great theoretical value in resolving the multidimensional driving mechanism of CNAC under heterogeneous geographic environments.
Based on this, this study focuses on the spatial and temporal evolution of CNAC and its driving factors in karst counties in ecologically fragile areas from the perspective of different types of mountainous areas. This mainly includes (1) assessing the current status of CNAC in the Qian-Gui karst mountainous region; (2) clarifying the characteristics of the spatial and temporal processes of CNAC at the level of different types of counties in karst mountainous regions; (3) exploring the dominant factors of CNAC in different types of counties in karst mountainous regions. The results of the study are expected to provide a scientific basis for promoting the optimal layout of differentiated land space in karst mountainous regions and policy combinations that can guarantee regional food security.

2. Theoretical Framework Analysis

According to land economics theory, changes in land use result from interactions between humans and the land, as well as between individuals [32]. One key irreversible process in this context is CNAC [33]. Consequently, this is also a land use phenomenon that fundamentally arises from spatial conflicts between urban expansion and agricultural preservation [34]. Similarly, CNAC is driven by human–land interactions and human–human relationships. Although the driving forces behind CNAC differ at various stages of development, they are generally influenced by a combination of natural, economic, and social factors [29,35]. Ultimately, it results from the interplay of multiple factors [36,37].
Social factors are the dominant drivers of the transition to CNAC [17]. First, population growth and urbanization are key drivers of cropland change [38]. With the increase in urban population, a significant amount of cropland has been converted into impervious surfaces, impacting the CNAC trend [16]. Second, as a fundamental element of regional socioeconomic development, per capita food ownership directly affects the way cropland resources are allocated. A higher level of grain production per capita could provide more space for the diversion of cropland for industrialization and urbanization. At the same time, the special surface–subsurface dichotomous hydrological structure of the karst region constrains the quality of cropland and food production capacity [39]. To address this issue, the karst region has expanded its irrigated areas and ensures food production by constructing agricultural water conservancy facilities. Additionally, the rise in agricultural mechanization levels has had a dual impact on land use: while increasing grain yields and reducing pressure on cropland, it has also freed up agricultural labor, promoted higher production efficiency, and increased agricultural surplus value [40]. However, with agricultural development reaching a certain level, the increase in production efficiency per unit of cropland has also provided an opportunity to shift some cropland to non-agricultural purposes.
Natural factors primarily influence the quality of cropland and the quantity of available cropland, which together contribute to CNAC. In karst areas, fluctuations in the area of rocky desertification (rocky desertification is an extreme form of land degradation in karst areas. It refers to a land degradation phenomenon in which surface vegetation has been damaged by anthropogenic interference in a natural context of extreme development of karst landscapes, resulting in severe soil loss and large areas of exposed bedrock or gravel accumulation) has altered the quality and quantity of available cropland [41], which, in turn, has affected the extent and distribution of CNAC. For example, an increase in the area of rocky desertification has led to soil degradation and soil erosion, reducing the quality of cropland and further weakening its productive capacity, making it difficult to sustain agricultural production [42] and providing potential conditions for CNAC. The amount of cropland per capita affects the process of CNAC by limiting the availability of cropland resources. In regions with a low cropland area per capita, the scarcity of cropland resources makes this region’s protection more important, yet also subjects it to greater pressure for non-agricultural conversion driven by economic interests [43].
Economic factors are the core driving force of CNAC [25]. They influence this process by affecting the economic efficiency of land use and resource allocation. Studies have shown that CNAC is usually strongly correlated with regional economic development levels, and the extent of CNAC is higher in economically developed regions [44]. For example, growth in agricultural output reflects improvements in agricultural production efficiency; however, once production efficiency reaches a certain level, the law of diminishing marginal returns to agricultural land becomes more pronounced, providing an economic incentive to use cropland for non-agricultural purposes. An increase in the net per capita income of farmers might, in turn, change farmers’ livelihood strategies, making them more inclined to convert cropland into impervious surfaces to obtain higher economic returns. Increases in GDP (Gross Domestic Product) per capita tend to be accompanied by accelerated urbanization and infrastructure expansion [45], which require large amounts of cropland resources.

3. Materials and Methods

3.1. Study Area

The Qian-Gui karst mountainous region is located in southwestern China [46]. It includes the central and southern parts of Guizhou and the central and western parts of Guangxi, which are vital ecological safeguards for the upper reaches of China’s Yangtze and Pearl River systems and also comprise the core area of southern karst distribution. The area is approximately 22 × 104 km2 (Figure 1). The topography of the study area gradually decreases from the northwest to the southeast, with many mountains and few plains [47]. In addition, the natural geographical features of the study area, such as the development of fissures and severe groundwater loss, severely limit the development of agricultural resources, which, in turn, limits light industry and regional socioeconomic development [48], seriously affecting the production and livelihood of people in the area.

3.2. Methodology and Data Processing

3.2.1. Research Methods

(1)
Measuring CNAC
CNAC is predominantly characterized by the occupation of agricultural land for non-farming infrastructure development [35]. Therefore, based on land use data, the conversion of cropland into impervious surfaces was used to determine the extent of CNAC, and the ratio of the area of CNAC to the original area of cropland was used to represent the degree of CNAC. The formula is as follows:
N A i = ( S i N A / S i ) × 100
where NAi is the rate of CNAC in the i-th county; SiNA is the area of cropland that has undergone non-agriculturalization in the i-th county; and Si is the initial area of cropland in the i-th county.
(2)
Ordinary Least Square
The ordinary least squares (OLS) model is used for global linear regression analysis. In this study, it was mainly used to describe the overall situation of CNAC in the study area as influenced by each variable. The calculation formula is as follows:
Y = β 0 + β 1 X 1 + β 2 X 2 + + β k X k + ε
where Y is the dependent variable; Xk is the independent variable; βk is the regression coefficient; and ε is the error term.
(3)
GWR Model
The OLS model can only perform global linear parameter estimation without accounting for spatial distribution characteristics [49]. The GWR model is a local spatial regression approach that extends linear regression by incorporating a spatial weighting matrix accounting for data locations. This spatial integration enabled the localized estimation of parameter effects across regions, thereby detecting spatial non-stationarity in variable relationships [50]. The model is formulated as follows:
Y i = β 0 u i , v i + k β k u i , v i X i k + ε i
where Y is the dependent variable; X is the independent variable; (ui, vi) are the spatial coordinates of the i-th county; β0(ui, vi) represents the intercept term; βk(ui, vi) represents the i-th regression parameter for the k-th county; Xik is the value of the k-th driving factor in the i-th county; and εi is the random error term [51]. This study used the GWR model of ArcGIS 10.8 with the following settings: FIXED was selected for kernel type, AICc (Akaike information criterion corrected) was selected for the bandwidth method, and 30 was selected for the number of neighbors.
(4)
Variance Inflation Factor (VIF)
GWR model analyses are susceptible to multicollinearity, which inflates the variance in regression coefficients, leading to biased model estimations [51]. Therefore, the VIF was employed to diagnose multicollinearity in the GWR model. The VIF quantifies the severity of multicollinearity in linear regression analysis and can be directly computed through the OLS tool in ArcGIS 10.8 software. The formula is expressed as follows:
V I F i = 1 1 R i 2
where R i 2 is the coefficient of determination of the regression equation, with a value ranging from 0 to 1. If the value of R i 2 is larger, the multicollinearity between the variables is more serious; otherwise, the problem of multicollinearity is smaller. It is generally accepted that VIFi > 10 indicates the presence of strong multicollinearity in the model [51].
(5)
AICc
A I C c = ( 2 k 2 L ) / n + ( 2 k ( k + 1 ) / ( n k 1 ) )
Here, k is the number of model parameters; L is the log-likelihood; and n is the sample size. The smaller the value of AICc, the closer the estimate is to the observed values [52].
(6)
Global Moran’s I
Global Moran’s I evaluates spatial autocorrelation in residuals from the GWR model. If a non-significant spatial autocorrelation pattern (p > 0.05) in the residuals is observed, it indicates the successful capture of spatial heterogeneity through the model, demonstrating appropriate specification [53]. The analysis employed ArcGIS 10.8’s spatial statistics tools, with methods detailed in [54].

3.2.2. Data Sources and Data Processing

The data requirements and sources for this study are detailed in Table 1.
Data processing: (1) The overall accuracy of CLCD was 80%, and it was divided into 9 different land categories. Following China’s land resource classification standards and regional utilization patterns, this study used ArcGIS 10.8 for land class grouping, which was categorized into 6 land types: cropland, forest land, grassland, impervious surfaces, water areas, and unused land. Cropland and impervious surfaces were then extracted. (2) For socioeconomic data, additional socioeconomic indicators not included in official publications were acquired through the inquiry services provided on the National Statistics Bureau’s official platform. Some missing data were replaced with data from adjacent years. (3) The Qian-Gui karst mountainous region only includes the individual municipal districts of Nanning and Guigang, and the administrative divisions of these city districts were adjusted during the study period, which limited data collection. Therefore, all districts of Nanning and Guigang were included in the study area. For the remaining prefecture-level cities, when administrative divisions were adjusted, the prefecture-level city districts were uniformly grouped, resulting in a total of 90 county-level units. (4) The rocky desertification data were finalized from the bedrock exposure rate and vegetation cover data, which were graded according to the existing classification criteria (Table 2). Please refer to the literature for details [56,57]. The rocky desertification area for each county was subsequently extracted using the Area Tabulation tool in ArcGIS 10.8. According to current classification standards, NKRD and PKRD are not classified as rocky desertification types. Therefore, these two categories were excluded from statistical calculations.

3.2.3. Division of Mountainous Type Counties

The delineation of different types of counties was based on Zhao et al.’s [48] delineation. First, they used the mean–variable–point method to determine the size of the moving window. Second, they used spatial analysis tools to obtain elevation, slope, and topographic relief; then, the spatial extent and scale information of each type of mountainous area was extracted based on these three topographic factors. Finally, the counties were divided according to the size of the mountainous area as a proportion of the whole county (Table 3), with a total of five categories. Among them, there were 18 pure hilly counties, 10 semi-mountainous counties, 15 quasi-mountainous counties, 21 apparent mountainous counties, and 32 entirely mountainous counties. Please refer to the literature for the process of the division methodology [48].
In this study, on the basis of the above, individual districts and counties were grouped according to data accessibility to obtain 18 pure hilly counties, 7 quasi-mountainous counties, 12 semi-mountainous counties, 21 apparent mountainous counties, and 32 entirely mountainous counties (Figure 2).

4. Results

4.1. Temporal Characteristics of CNAC

At the temporal scale, CNAC was analyzed using two key metrics: the converted area (Table 4) and conversion rate (Figure 3). These metrics were calculated using Equation (1) to represent the extent and temporal dynamics of CNAC in the study area.
The Qian-Gui karst mountainous region experienced persistent growth in the CNAC area (Table 4), reaching 14.60 × 10⁴ hm2 during the study period. Furthermore, the area of CNAC in 2010–2020 was 1.74 times larger than that in 2000–2010. Meanwhile, the total area of impervious surfaces in the study region increased by 14.85 × 10⁴ hm2 during the 21-year period, with 96.06% of this increase being converted from cropland. It was obvious that the cropland in the study region was the main source of the increase in impervious surfaces. Among the different county types in mountainous areas, the growth rate of the CNAC area from 2000 to 2020 was the highest in quasi-mountainous and apparent mountainous counties, reaching 100.50% and 110.36%, respectively. Semi-mountainous counties ranked second, with a CNAC area growth rate of 95.28%. In contrast, the growth rate of the CNAC area of entirely mountainous and pure hilly counties was significantly lower, at 40.89% and 37.68%, respectively, both lower than 73.77% in the study region. This indicates that socioeconomic activities in the Qian-Gui karst mountainous region were primarily concentrated in gently sloping areas such as semi-mountainous areas, but in recent years, the fastest developing areas are still those in semi-mountainous and apparent mountainous counties. This pattern is strongly influenced by the topography and geomorphology of the study area, which, in this case, was predominantly mountainous with limited gentle terrain.
The CNAC rate in the study area was 2.03% for the period 2000–2020. The CNAC rate was 1.24% in 2010–2020, showing an increase of 0.5% compared to the rate of 0.74% in 2000–2010. The CNAC rate varied significantly between the different county types in mountainous areas, and the ranking for 2010–2020 was as follows: semi-mountainous counties (1.35%) > pure mountainous counties (0.86%) > quasi-mountainous counties (0.62%) > entirely mountainous counties (0.50%) > apparent mountainous counties (0.47%). From 2020, the order changed to semi-mountainous counties (2.67%) > quasi-mountainous counties (1.24%) > pure hilly counties (1.13%) > apparent mountainous counties (0.92%) > entirely mountainous counties (0.66%).
At the county scale, the spatial and temporal pattern of CNAC in the study area showed instability between 2000 and 2020, with significant changes in the CNAC area growth rate of each county type and large differences in the CNAC rate (Figure 3).
(1) Among pure hilly counties, the growth rate of the CNAC area ranged from −3.81% to 125.22%, with the highest growth rate observed in Liucheng County, where the area increased by 466.26 hm2. The CNAC rate ranged from 0.30% to 7.19%, with the largest change observed in Liuzhou City District, where the CNAC rate increased from 4.88% to 7.19%. (2) In semi-mountainous counties, the growth rate of the CNAC area ranged from 42.90% to 238.74%, with the highest growth rate observed in Zun’yi City District, where the area increased by 5959.25 hm2. The CNAC rate increased from 0.58% to 6.36%, with the largest change in Guiyang City District, where the CNAC rate increased from 3.29% in 2000–2010 to 6.36% in 2010–2020. (3) Among quasi-mountainous counties, the growth rate of the CNAC area ranged from 1% to 460.02%, with the highest value observed in Meitan County, where the area increased by 846.69 hm2. The CNAC rate ranged from 0.16% to 2.24%, with the most significant change occurring in Dushan County, where the CNAC rate increased from 0.43% to 1.69%. (4) In apparent mountainous counties, the growth rate of the CNAC area ranged from −38.23% to 330.83%, with the highest growth rate observed in Longli County, where the area increased by 535.30 hm2. The CNAC rate ranged from 0.21% to 2.11%, with the most significant change occurring in Guiding County, where the CNAC rate increased from 0.50% to 2.11%. (5) In entirely mountainous counties, the growth rate of the CNAC area from 2000 to 2020 ranged from −54.72% to 213.32%, with the highest value observed in Guanling County, where the area of CNAC increased by 202.25 hm2. The CNAC rate ranged from 0.12% to 2.09%, with the most significant change occurring in Jingxi City, where the CNAC rate increased from 0.71% to 1.56%.
In summary, the CNAC area and the CNAC rate in the Qian-Gui karst mountainous region have exhibited a notable increase over the past 21 years, especially the rapid growth depicted from 2010 to 2020, and the situation of arable land protection has become more serious. Additionally, significant variations were observed in the CNAC area and the CNAC rate of different county types in mountainous areas. These differences were largely driven by disparities in natural resource endowments and socioeconomic conditions across counties.

4.2. Spatial Characteristics of CNAC

At the spatial scale, the study area was classified into five zones of CNAC intensity—low, light, medium, high, and extreme—based on the quantitative classification method and the natural breakpoint method, and a spatial pattern map was generated (Figure 4).
Figure 4 illustrates that the spatial distribution pattern of CNAC classes in the counties during the two time periods was uneven. (1) Low-intensity CNAC zones were more contiguous, primarily located in the western, southern, and northeastern counties of Guizhou and the northwestern counties of Guangxi, accounting for over 55.56% of the total counties in both periods. (2) The number of counties with light-intensity CNAC zones slightly increased, transitioning from sporadic to contiguous distribution, primarily in central Guizhou and northern and western Guangxi. (3) Medium-intensity CNAC zones were primarily distributed in southwestern Guizhou and eastern Guangxi, with a slight decrease in the number of counties from three to two in Guizhou and a shift from a scattered to concentrated distribution in Guangxi. (4) High-intensity CNAC zones included fewer counties. During 2000–2010, there were five counties, all of which were prefecture-level city districts. By 2010–2020, this number decreased to two counties: Liuzhou City District and Guigang City District in Guangxi. This phenomenon primarily stemmed from accelerated socioeconomic development in Liuzhou and Guigang City during 2010–2020. In particular, Liuzhou was designated as a sub-central city and industrial center of the Guangxi Zhuang Autonomous Region in the Township System Planning of Guangxi Zhuang Autonomous Region (2001–2020). Over this decade, Liuzhou’s population density increased rapidly from 806 to 1131 persons/km2. Guigang City, serving as the central city of southeastern Guangxi and a modern inland river port city, boasted significant advantages in waterway transportation. Its developed port-related industries and its logistics sector attracted a substantial population influx, achieving an urbanization rate of 54.17% by 2020. The built-up area expanded by 30.37 km2 during this period, with urban encroachment consuming cultivated land. (5) Extreme CNAC zones had only one zone (Nanning City District) in 2000–2010 and increased to three zones in 2010–2020, with the increased zones being Guiyang City District and Zunyi City District, respectively. Guiyang and Zunyi constitute core components of the Qianzhong Urban Agglomeration. Following the promulgation of the Several Opinions of the State Council on Promoting Sound and Rapid Economic and Social Development in Guizhou (Guo Fa [2012] No.2), the built-up areas of these cities expanded significantly, recording spatial expansions of 207 and 95.11 km2, respectively, over the decade. This urban growth consumed substantial cultivated land, triggering the consequent escalation of CNAC levels from high to extreme levels in Guiyang and Zunyi City District.
In summary, looking at the number of counties with each CNAC level, there were no districts with high or extreme CNAC in the entirely mountainous region and no districts with low CNAC in the semi-mountainous region. Furthermore, with the exception of the semi-mountainous counties, the number of counties in the other regions decreased with increasing CNAC intensity.

5. Analysis of the Factors Influencing CNAC

5.1. Analysis of Model Credibility

Based on existing studies and the theoretical analytical framework and taking into account the reality of the study area and data availability, eleven indicators were selected from three dimensions: social, economic, and natural dimensions (Figure 5).
Given the divergent directional effects of the indicators on CNAC and the significant influence of dimensional discrepancies on the calculated results, standardized processing was implemented using IBM SPSS Statistics 23. Then, multicollinearity diagnostics were performed using the OLS model in ArcGIS 10.8 (Table 5), and variables with VIF > 10 were excluded; finally, comparative modeling was performed using OLS and GWR, and optimal models were selected through comparative analysis of the adjusted R2 and AICc (Table 6). Among these methods, the model was more accurate when the value of adjusted R2 was closer to one [58].
Table 5 shows that the VIF of all indicators was below four, which is well under the critical threshold of 10. This confirms that there was no multicollinearity among the indicators [59].
Table 6 indicates that, during the same period, the R2 and adjusted R2 values of the GWR model were higher than those of the OLS model. Meanwhile, the AICc of the GWR model was also smaller than that of the OLS model in the same period. This indicates that the fit of the GWR model was better than that of the OLS model in all respects. In addition, the GWR model residuals exhibited a global Moran’s I of 0.04 (p = 0.52) during 2000–2010 and −0.04 (p = 0.70) in 2010–2020. Residual spatial patterns showed a stochastic distribution in both periods. These results indicate that the GWR model specification was appropriate, enabling us to proceed to subsequent analysis.

5.2. Analysis of the GWR Model Results

To further explore the spatial variation characteristics of the influence of each factor on CNAC, the regression coefficients of the indicators were divided using the natural breaks (Jenks) method in ArcGIS software before being visualized and expressed (Figure 6).
(1) Figure 6 reveals that between 2000 and 2010, the order of the affected size of each indicator of CNAC in the Qian-Gui karst mountainous region was X6 > X9 > X10 > X2 > X1 > X11 > X4 > X7 > X5 > X3 > X8. In 2010–2020, the order was X6 > X9 > X3 > X10 > X1 > X2 > X11 > X5 > X7 > X4 > X8.
It can be seen that the range of regression coefficients for each indicator increased, demonstrating that the spatial and temporal differentiation of the influence of each indicator on CNAC in different periods intensified. For instance, the range of regression coefficients of rocky desertification areas shifted from 27.31–79.58 during 2000–2010 to −148.21 to −256.44 during 2010–2020, with the difference increasing from 52.27 to 108.23, which indicates the significant intensification of negative effects. At the same time, except for agricultural output and population density, which always maintained a positive correlation with CNAC, the influence of other indicators on CNAC changed from a positive to a negative correlation or from a negative to a positive correlation. Overall, population density, agricultural output, effective irrigated areas, and farmer net income per capita exerted a greater influence on CNAC in the Qian-Gui karst mountainous area, while the cropland area per capita exerted the least influence. In addition, throughout the study period, the influence of rocky desertification areas and agricultural machinery power on CNAC was weakened compared to the other indicators, whereas the influence of effective irrigated areas was enhanced.
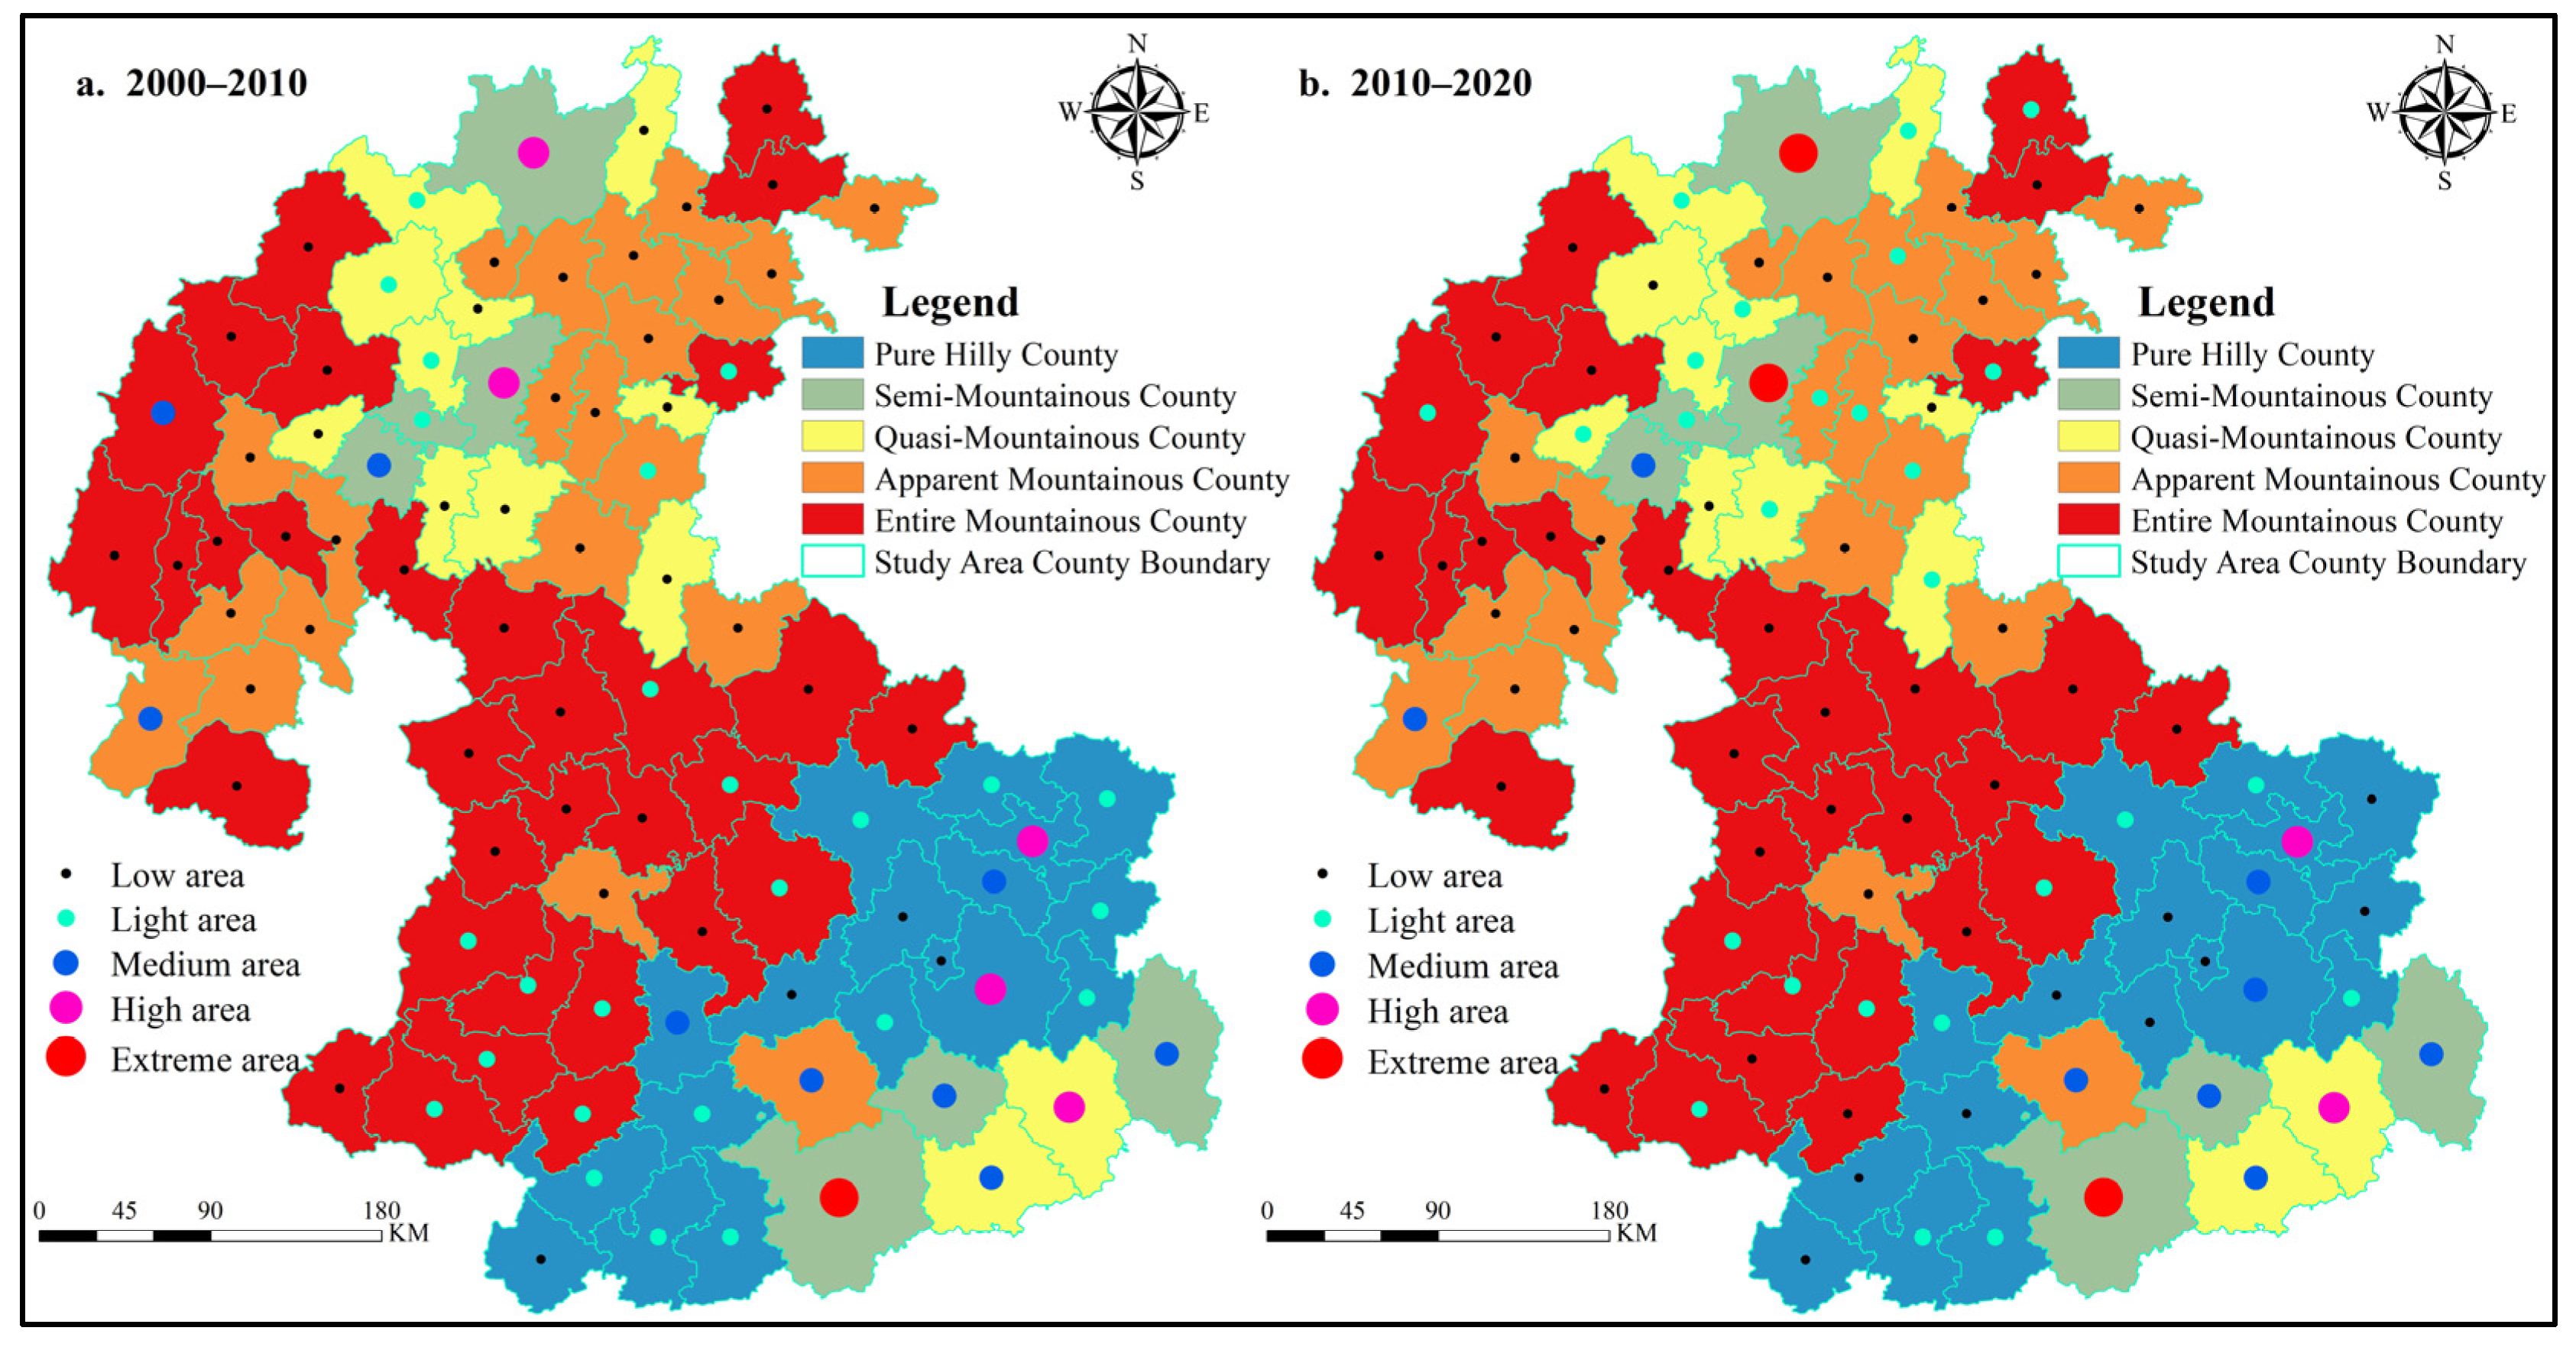
(2) From the perspective of the different types of counties, the main indicators influencing the CNAC from 2000 to 2020 were population density, agricultural output, effective irrigated area, farmer net income per capita, and grain output per capita. The differences were as follows: ① The contribution of farmer net income per capita and the primary industry employment rate in pure hilly counties was lower than that of the other indicators, while the contribution of grain output per capita and the urbanization rate increased. ② The contribution of agricultural machinery power and the primary industry employment rate decreased in semi-mountainous counties relative to the other indicators, while the contribution of effective irrigated areas increased from 10th to 3rd place. ③ The contribution of GDP per capita in the quasi-mountainous counties decreased relative to the other indicators, from 6th to 10th place, while the contribution of effective irrigated areas increased from 10th to 3rd place. ④ In apparent mountainous counties, the contribution of farmer net income per capita and GDP per capita decreased relative to the other indicators, both falling by three places, while the contribution of effective irrigated areas increased more significantly, from 10th to 3rd place. ⑤ In entirely mountainous counties, the contribution of farmer net income per capita and grain output per capita decreased relative to the other indicators, falling by two places, and GDP per capita decreased by three places. Meanwhile, the contribution of effective irrigated areas increased from 9th to 3rd place, and the share of primary industry employment rate increased from 11th to 8th place.
In summary, excluding the pure hilly county category, effective irrigation coverage (X3) demonstrated significantly enhanced contributions to CNAC across the other county types, emerging as a critical determinant of CNAC. The main reason for this is that the government strengthened the construction of water conservancy facilities. These measures not only enhanced soil productivity but also elevated land use efficiency while ensuring grain production capacity. With continuous improvements in the fundamental water conservancy infrastructure, the study area witnessed a 5522.49 km2 expansion in effective irrigation coverage between 2000 and 2020. Concurrently, through implementing the “Linkage Between Urban-Rural Construction Land Increase and Decrease” policy, local governments have incorporated more marginal cultivated lands into territorial spatial planning adjustments, facilitating the non-agricultural utilization of peri-urban cultivated lands and thereby accelerating CNAC. Representative cases include Guizhou’s Qianzhong Water Conservancy Hub Project, irrigating 434.27 km2 across semi-mountainous, quasi-mountainous, and apparent mountainous counties, and Guangxi’s Baise Reservoir, covering 394.67 km2 across entirely mountainous counties such as Youjiang District, Tianyang District, and Tiandong County.

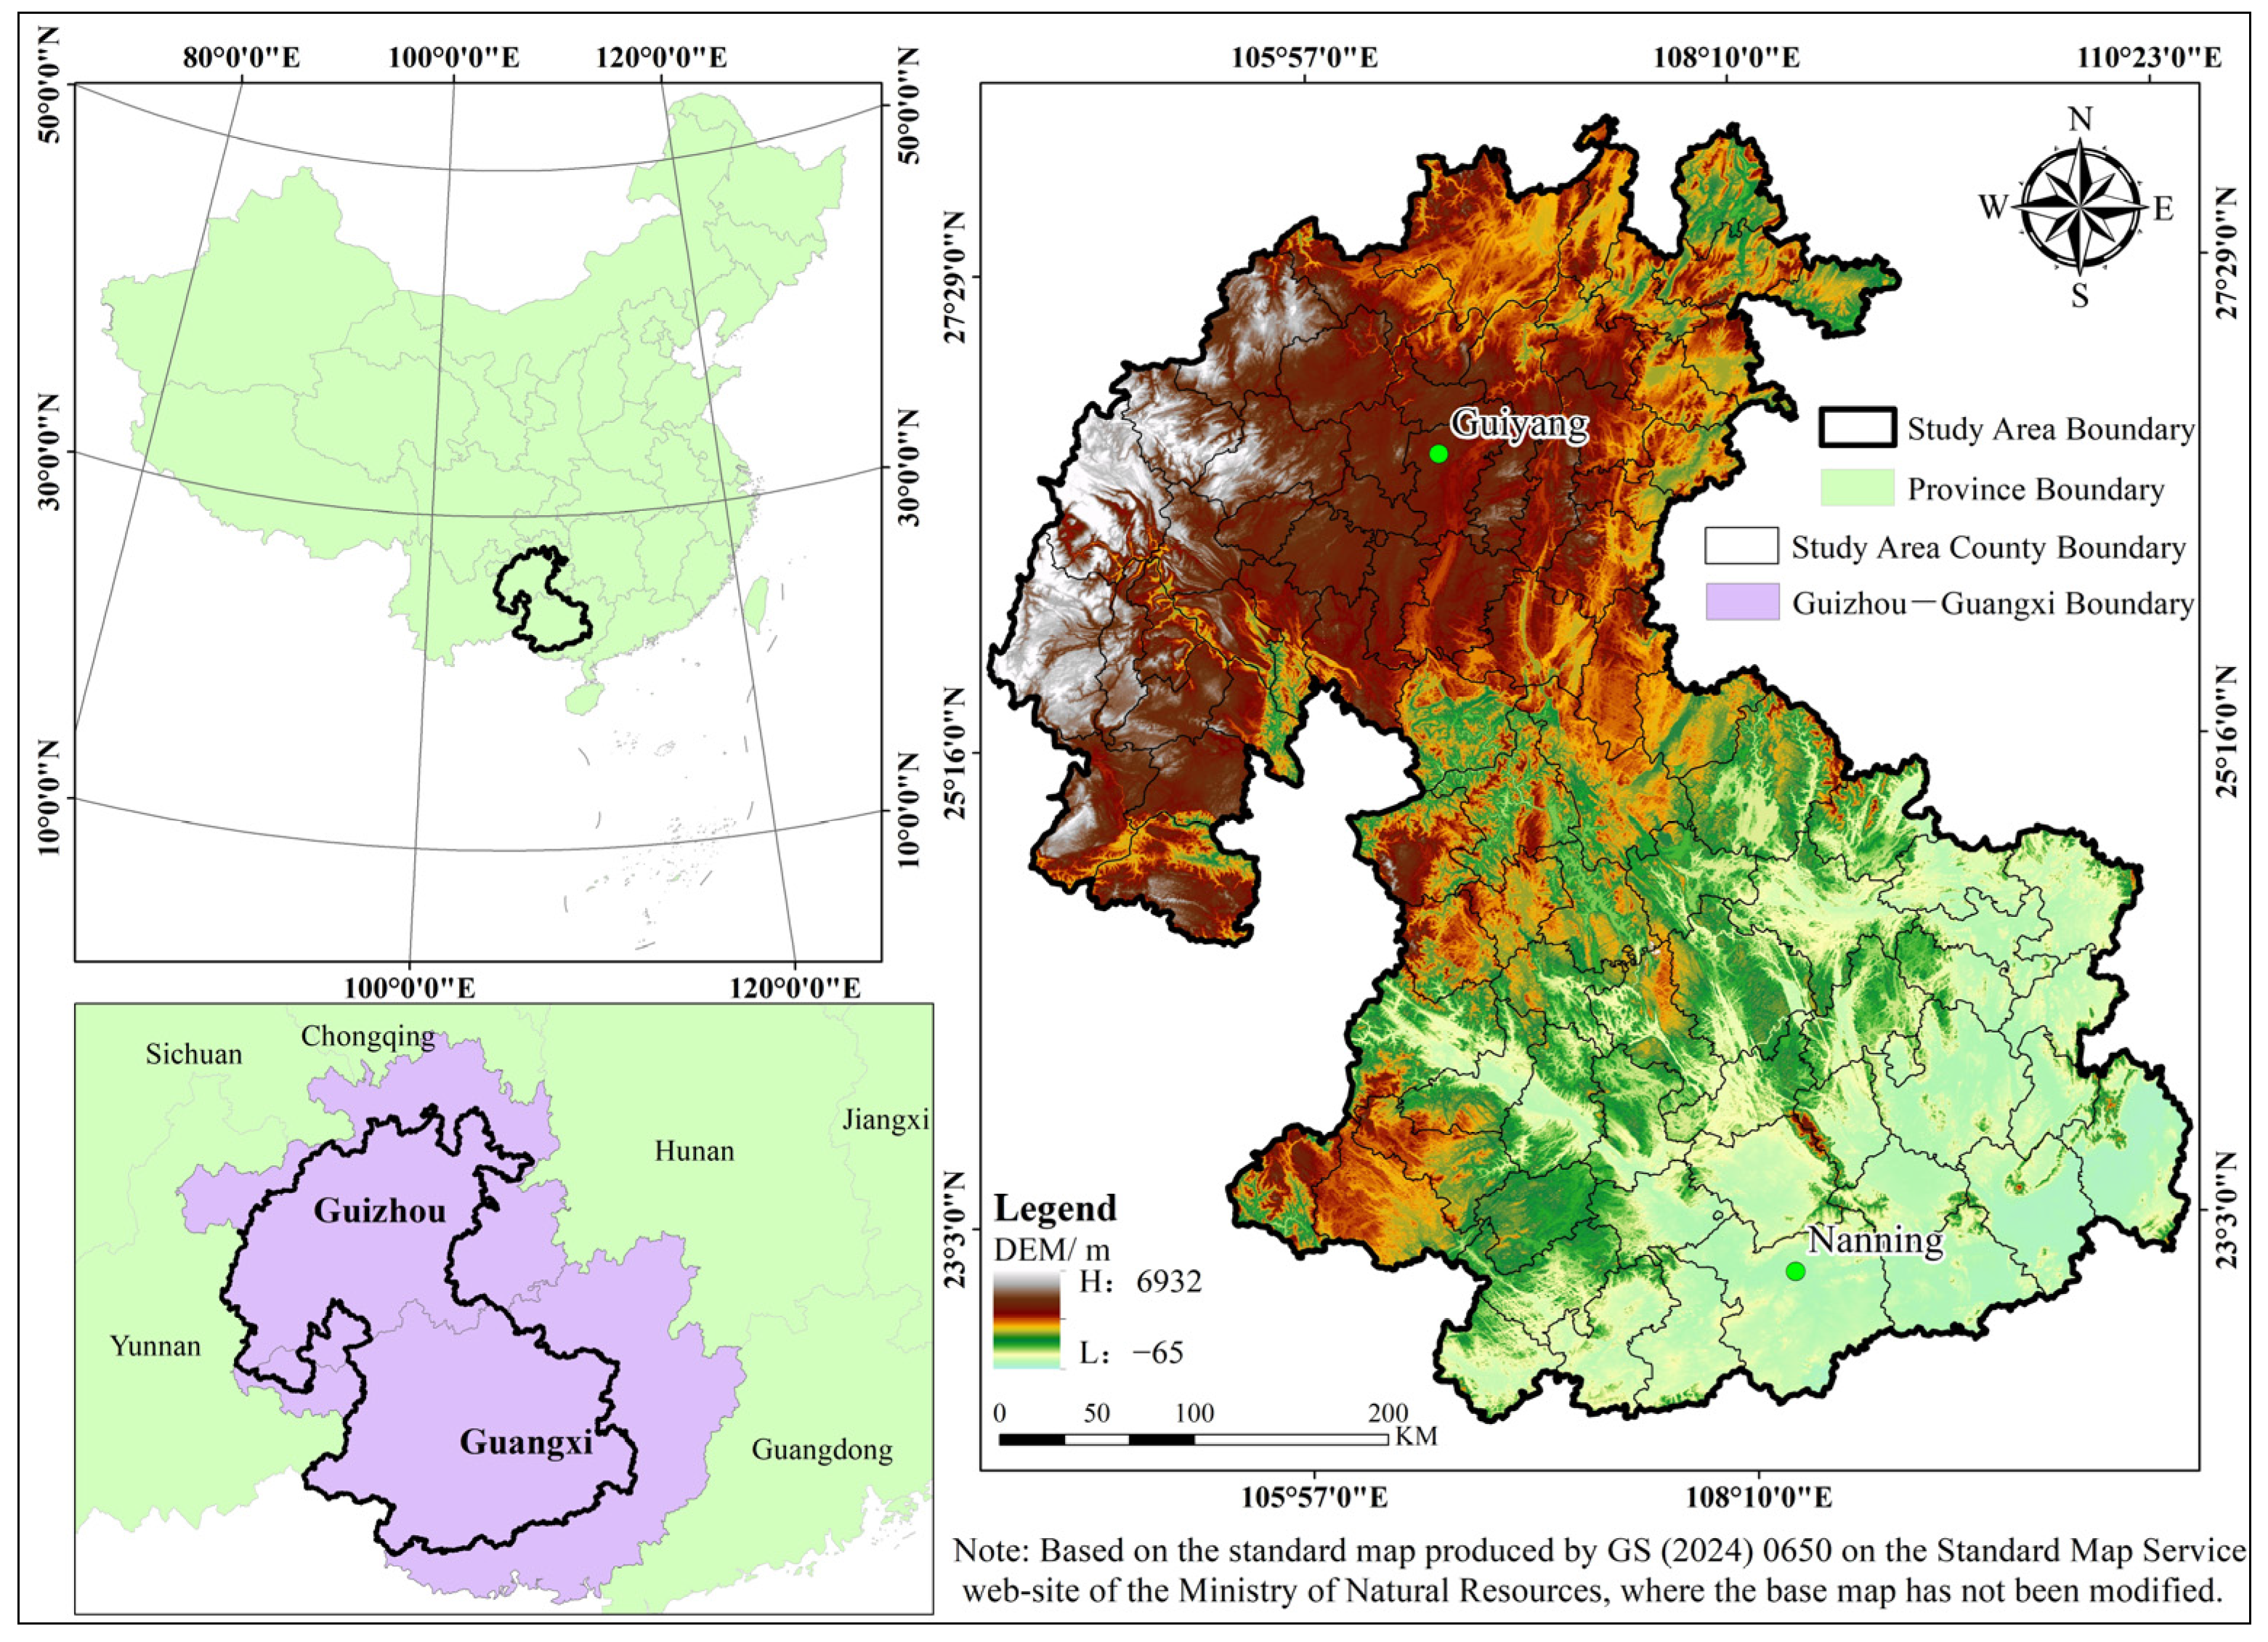
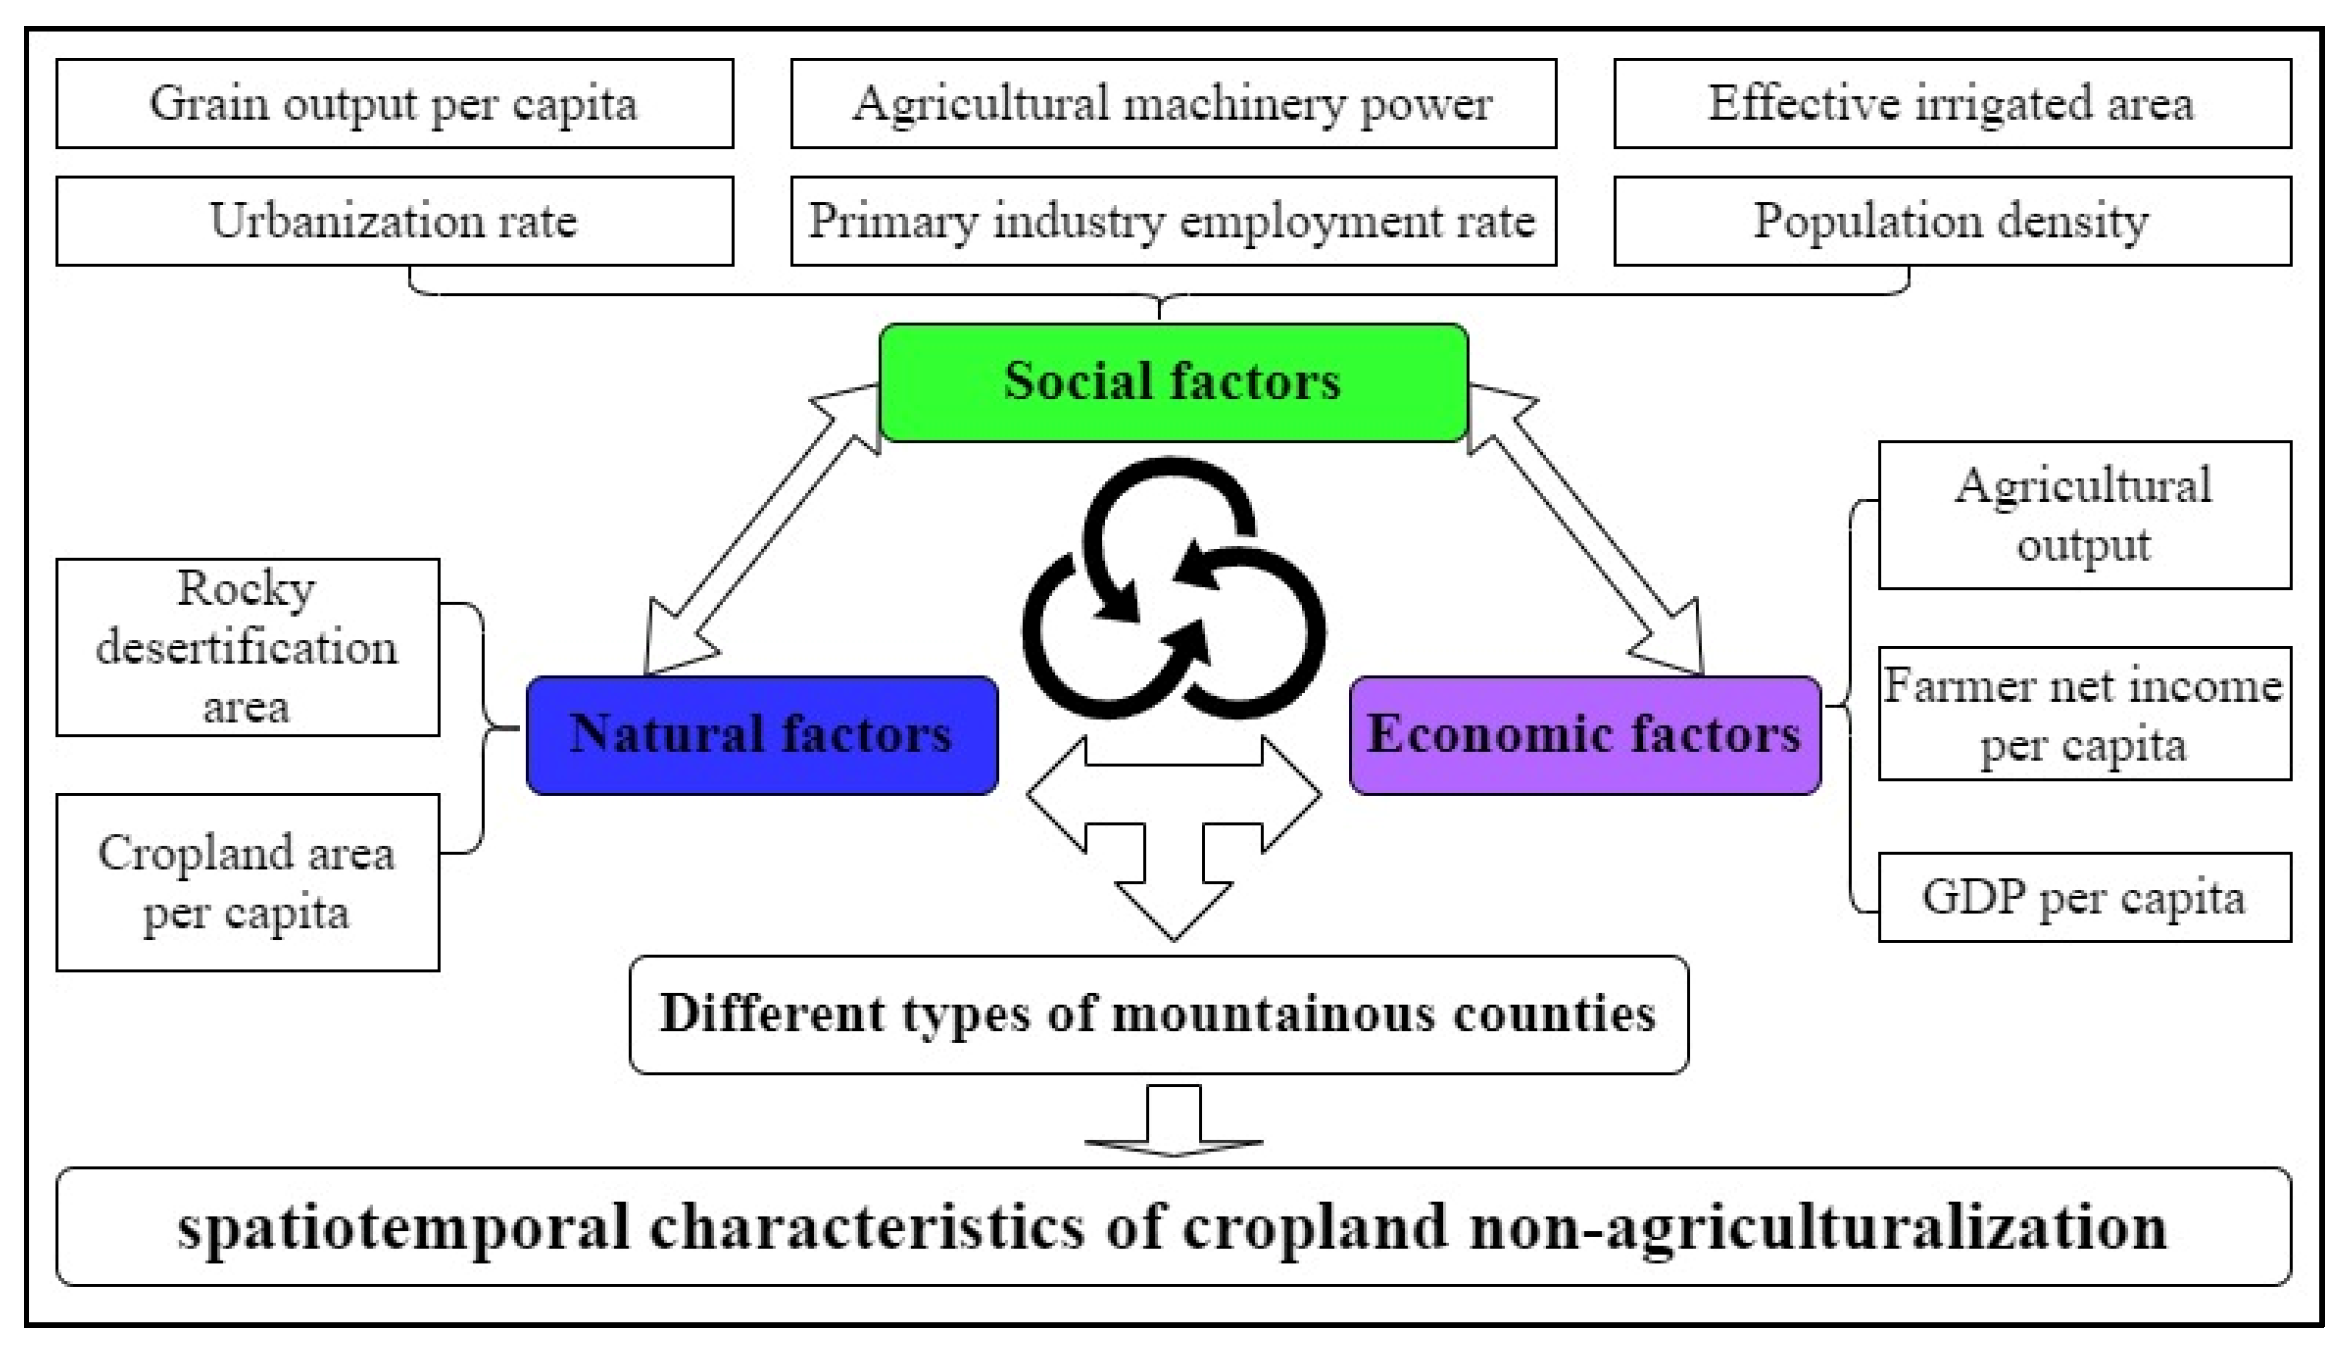
5.2.1. Spatial and Temporal Variation in Natural Factors

(1) The effect of rocky desertification areas on CNAC changed from a positive to a negative driver (Figure 6a). Spatially, from 2000 to 2010, the areas with high regression coefficients were concentrated in pure hilly, semi-mountainous, and apparent mountainous counties in southern Guangxi, as well as entirely mountainous counties in western Guizhou. In these areas, the rocky desertification areas showed a positive correlation with CNAC. The highest regression coefficient, 79.58, was recorded in Hengzhou City, a semi-mountainous county. The regression coefficients were all negative in 2010–2020. High values appeared in semi-mountainous, entirely mountainous, and pure hilly counties located in the north of the study area, as well as in its southern regions. This suggests that the reduction in rocky desertification areas in these localities increases the area of CNAC. The maximum value of the regression coefficient was found in Sinan County, −256.44, which is an entirely mountainous county. The driving effect of rocky desertification areas on the CNAC significantly increased compared to the 2000–2010 period.
(2) Between 2000 and 2010, cropland area per capita negatively influenced CNAC in the study area. However, from 2010 to 2020, it had a positive impact on this process in 48 counties (Figure 6b). Among the 48 counties, 6.25% were pure hilly counties, 4.17% were semi-mountainous counties, 10.42% were quasi-mountainous counties, 22.92% were apparent mountainous counties, and 56.25% were entirely mountainous counties. It can be seen that there was also a gradient in resource and economic development in mountainous areas, and the better the geographical environment, the greater the impact of cropland area per capita on CNAC. Spatially, the areas with a high negative absolute regression coefficient of cropland area per capita in 2000–2010 were distributed in entirely mountainous, quasi-mountainous, and apparent mountainous counties in Guizhou, with the maximum value being −56.27 in Sinan County, which is an entirely mountainous county. The regression coefficient of the cropland area per capita in 2010–2020 was negative in high-value areas, contiguously distributed in semi-mountainous, pure hilly, and quasi-mountainous counties in southeastern Guangxi, and the maximum value was −196.92 in Guiping City, a semi-mountainous county.

5.2.2. Spatial and Temporal Differences in Economic Factors

(1) The impact of agricultural output on CNAC in the examined region remained consistently positive, with the driving effect intensifying (Figure 6c). Spatially, in 2010–2020, high regression coefficients of agricultural output were observed in the entirely mountainous and apparent mountainous counties, which were along the western and southwestern edges of the study area. For example, Xingyi City and Youjiang District had regression coefficients of 555.43 and 555.57, respectively, indicating a strong positive driving effect. The areas with high regression coefficients in 2010–2020 were concentrated in the entirely mountainous, quasi-mountainous, semi-mountainous, and apparent mountainous counties of the northern Qian-Gui karst mountainous region. These areas include contiguous regions such as Liupanshui City District, Guiyang City District, and the area north of Huangping County. The highest value was found for Zunyi City District, a semi-mountainous county, with a regression coefficient of 1172.05, indicating that the influence of agricultural output on CNAC was very significant.
(2) The impact of farmer net income per capita on CNAC in the study area was almost entirely negative (Figure 6d), and the negative driving effect increased. The spatial distribution of intensified negative effects was primarily concentrated in the northeastern part of the study area. This included entirely mountainous, quasi-mountainous, semi-mountainous, and apparent mountainous counties in the outer ring region encompassing Dafang County, Guiyang City District, and Majiang County and the southeastern part of the study area, which included pure hilly counties, as well as Wuxuan County in the quasi-mountainous county and the area around Guigang City district. The maximum regression coefficients were found for Fusui County (−195.68) in a pure hilly county and Guiping City (−542.15) in a semi-mountainous county for 2000–2010 and 2010–2020, respectively, indicating a trend of the negative driving effect shifting eastwards.
(3) From 2000 to 2010, the GDP per capita had a positive impact on CNAC in the study area but was negatively driven in 22 counties from 2010 to 2020 (Figure 6e). Spatially, the high positive GDP per capita regression coefficients from 2000 to 2010 were mostly distributed in pure hilly, semi-mountainous, and entirely mountainous counties in Guangxi, with the maximum value being 124.23 in Guiping City, a semi-mountainous county. Between 2010 and 2020, high positive regression coefficients for the GDP per capita were primarily concentrated in the pure hilly and entirely mountainous counties in Guizhou, as well as the quasi-mountainous and semi-mountainous counties in eastern Guangxi, with a maximum value of 295.41 in Guiping City, a semi-mountainous county in Guangxi. The high-value areas with negative absolute regression coefficients were concentrated in the entirely mountainous and pure hilly counties in the central–southwest of Guangxi, with a maximum value of −120.22 in Longzhou County, which is a pure hilly county. It can be seen that the GDP per capita increased the positive driving force of CNAC in the study area, but its negative influence also increased, showing a trend of polarization.

5.2.3. Spatial and Temporal Variations in Social Factors

(1) The impact of grain output per capita on CNAC in the study area changed from entirely positive to negative (Figure 6f), especially in pure hilly counties, where the negative driving effect increased. Spatially, the high values of the regression coefficients of grain output per capita during the two periods were concentrated in the pure hilly, semi-mountainous, and quasi-mountainous counties within the central–southern sector of the research area. In stages, between 2010 and 2020, Guiping City—a quasi-mountainous county—exhibited the highest regression coefficient for grain output per capita, which was 140.11. The subsequent decade (2010–2020) saw Guigang City District have the most significant negative regression coefficient of −516.36. At the same time, regions where grain output per capita had a strong positive driving effect on CNAC in 2000–2010 also experienced a significant negative driving effect in 2010-2020. For example, in Tiandeng County, an entirely mountainous county, the regression coefficient changed from 132.02 to −313.46, representing an increase of 2.37 times.
(2) The impact of agricultural machinery power on CNAC was positively driven from 2000 to 2010. However, this trend reversed during 2010–2020, demonstrating negative impacts in 41 counties (Figure 6g). Spatially, during 2000–2010, areas with high regression coefficients for agricultural machinery power were continuously distributed across the pure hilly, semi-mountainous, and quasi-mountainous counties in the south and southwest of Guangxi. The maximum coefficient of 150.16 was recorded in Hengzhou City, a quasi-mountainous county. During 2010–2020, regions with high positive regression coefficients for agricultural machinery power expanded northwestward compared to the earlier period, with Hengzhou City—a quasi-mountainous county—recording a maximum coefficient of 452.84. In contrast, the largest negative regression coefficients were concentrated in the northwestern, northern, and northeastern parts of Guizhou. In these regions, which included entirely mountainous, semi-mountainous, apparent mountainous, and quasi-mountainous counties, the most negative coefficient of −372.04 was observed in Meitan County, a quasi-mountainous county.
(3) Between 2000 and 2010, the effect of effective irrigated areas was positively correlated with CNAC in 58% of the counties. In contrast, from 2010 to 2020, 60% of the counties exhibited a negative correlation, with the negative effect increasing (Figure 6h). Spatially, the high positive coefficient areas in 2000–2010 and the high negative coefficient areas in 2010–2020 were continuously distributed in the entirely mountainous, semi-mountainous, quasi-mountainous, and apparent mountainous counties in Guizhou. The maximum values of the regression coefficients for the two periods were 59.15 in Dafang County, an entirely mountainous county, and −575.45 in Meitan County, a quasi-mountainous county. The high negative areas in 2000–2010 and the high positive areas in 2010–2020 were continuously distributed in the pure hilly, semi-mountainous, and quasi-mountainous counties in Guangxi. The maximum values of the regression coefficients for the two periods were −46.05 in Fusui County and 135.30 in Wuxuan County; both are pure hilly counties. This shows that the effective irrigated area in the same location had different driving effects on CNAC in different periods, and the driving effect increased. For example, the effect of effective irrigated areas on CNAC in pure hilly counties changed from negative to positive in 89% of the counties, and the positive effect increased.
(4) From 2000 to 2010, the primary industry employment rate positively influenced CNAC in the study area. However, between 2010 and 2020, this effect became negative in 19 counties, 13 of which were located in pure hilly and semi-mountainous counties (Figure 6i). Spatially, the high regression coefficients from 2000 to 2010 were continuously distributed in the pure hilly, semi-mountainous, and apparent mountainous counties in Guangxi, with a maximum value of 80.07 in Guiping City, a semi-mountainous county. The high positive values of the regression coefficients from 2010 to 2020 were mostly concentrated in the quasi-mountainous, entirely mountainous, and apparent mountainous counties in the central–northeastern part of the research zone, with a maximum value of 244.34 observed in Cenggong County, an apparent mountainous county. The high-value areas with negative absolute regression coefficients were concentrated in the pure hilly, semi-mountainous, and quasi-mountainous counties in the southwestern part of Guangxi, with a maximum value of −126.09 in Longzhou County, which is a pure hilly county.
(5) Between 2000 and 2010, the urbanization rate negatively drove CNAC in 90% of the counties in the study area. From 2010 to 2020, this effect was positive in half of the counties and negative in the other half (Figure 6j). Spatially, during the 2000–2010 period, high absolute negative regression coefficients were distributed in the entirely mountainous, quasi-mountainous, and apparent mountainous counties in Guizhou, with a maximum value of −59.41 in Dafang County, an entirely mountainous county. In 2010–2020, the areas with high negative absolute regression coefficients were mostly concentrated in the entirely mountainous, pure hilly, and quasi-mountainous counties in southwest Guangxi, with a maximum value of −269.36 in Guiping City, a semi-mountainous county. The regions with high positive regression coefficient values were predominantly located in Guizhou’s entirely mountainous, semi-mountainous, quasi-mountainous, and apparent mountainous counties, with a maximum value of 51.13 in Panzhou City, an entirely mountainous county. In addition, the negative driving effect of the urbanization rate on CNAC increased in pure hilly counties, which was more than six times higher than in 2000–2010, and the driving effect was much higher than in the other regions.
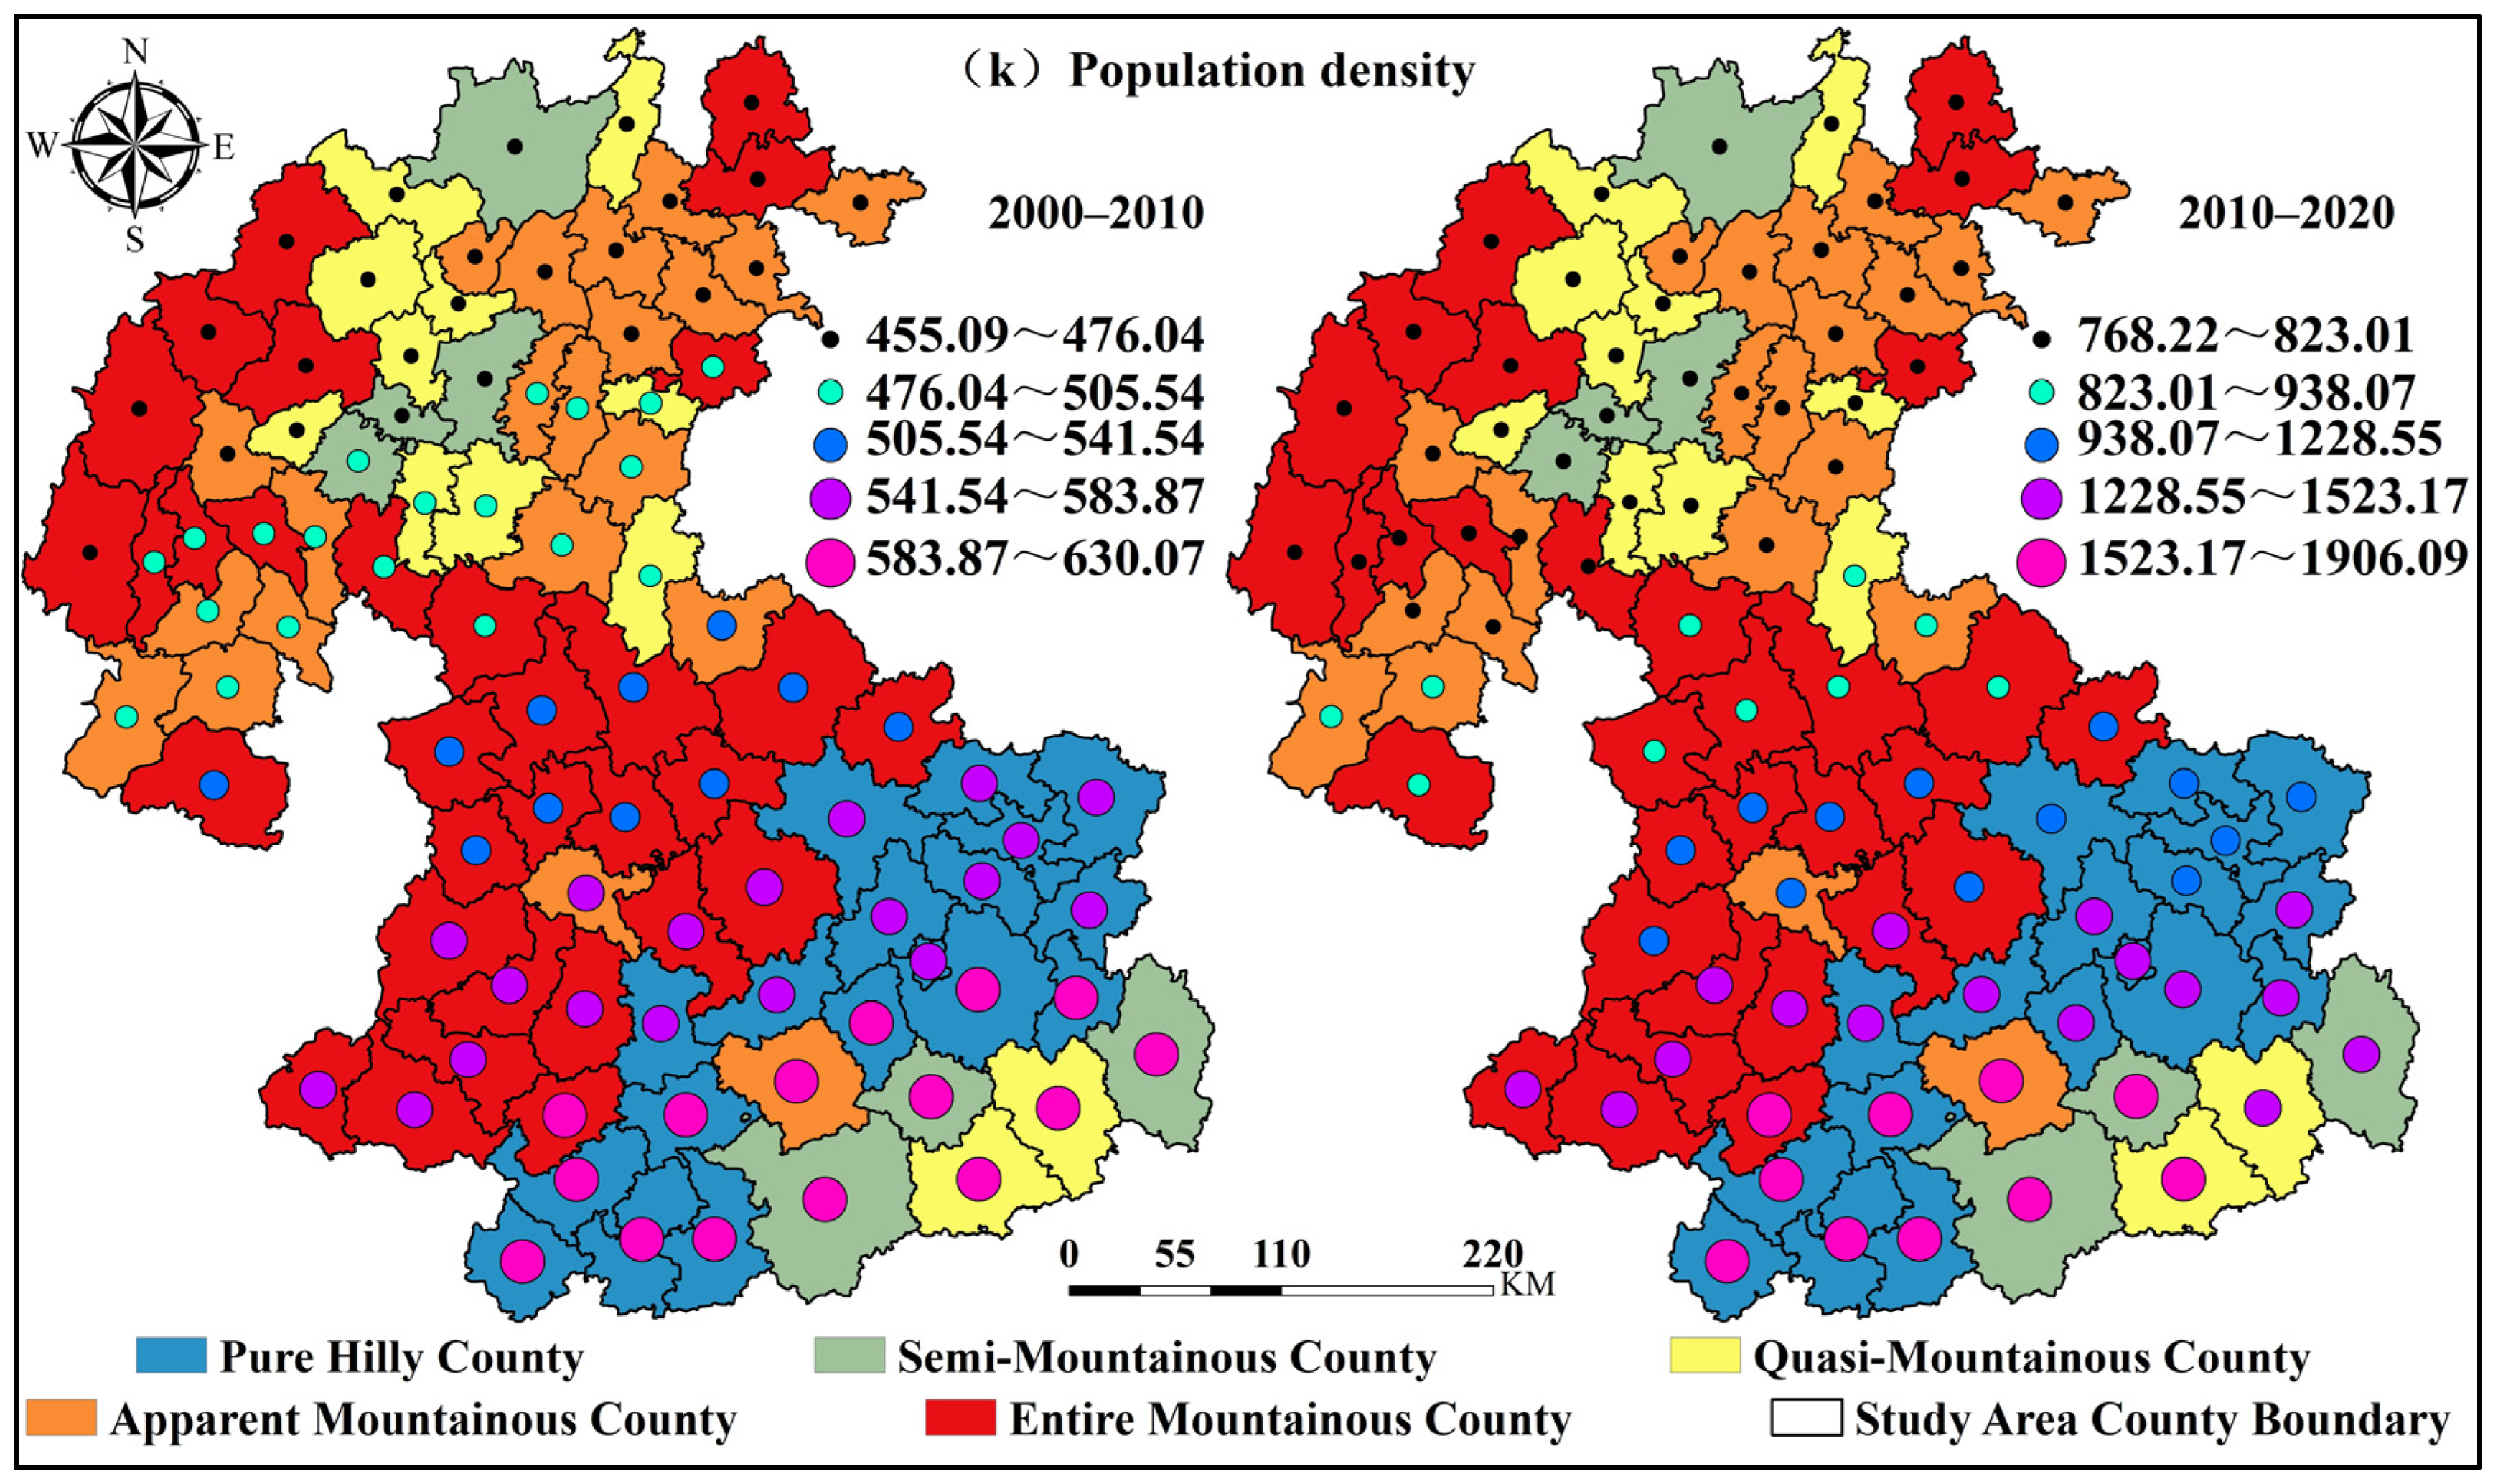
(6) Population density consistently exerted a positive influence on CNAC (Figure 6k), with this positive effect showing an increasing trend. This was due to population growth, which increased the demand for impervious surfaces and resulted in the conversion of cropland. The spatial distribution of high regression coefficients during both periods was primarily concentrated in the pure hilly, semi-mountainous, and quasi-mountainous counties of Guangxi, with maximum values of 630.07 in Hengzhou City, a quasi-mountainous county, and 1906.09 in Longzhou County, a pure hilly county, showing a tendency for high-value areas to move westward. This fully reflects the higher population pressure in these areas and the greater challenge of protecting cropland. The low-value areas of the regression coefficients in both periods were concentrated in the entirely mountainous, semi-mountainous, quasi-mountainous, and apparent mountainous counties in Guizhou, with the lowest values of 455.09 in Dafang County, an entirely mountainous county, and 768.22 in Yuqing County, an apparent mountainous county. This was primarily due to the limited availability of flatland cropland resources in these areas, which made large-scale cropland development unsuitable while ensuring food security.

6. Discussion

6.1. Spatiotemporal Characteristics of CNAC

(1) The areas with rapid CNAC in the Qian-Gui karst mountainous region were more scattered, while areas with slow conversion rates were more concentrated. This pattern was the opposite of the CNAC trend observed in plain regions [60], mainly due to the differences between plain and mountainous regions in terms of natural, economic, and social conditions [61,62]. The complex topography and fragmented cropland resources in the Qian-Gui karst mountainous region limit large-scale non-agricultural development, resulting in the concentration of areas with slow non-agricultural conversion, which are mostly distributed in regions with poor transportation and high development challenges. Areas with rapid conversion rates are more scattered, typically located in regions with good transportation conditions or near urban areas [27,63]. Plain regions, characterized by flat terrain and contiguous cropland, are suitable for large-scale non-agricultural development (e.g., urban construction, industrial parks), especially around cities and in economically developed areas [64].
(2) In the Qian-Gui karst mountainous region, CNAC showed spatially continuous characteristics at different levels (except for the extreme degree). The spatial pattern shifted from a pyramid distribution pattern during 2000–2010 to a parallel pattern of “three poles” and regional multi-nodes during 2010–2020 (Figure 4). These results align with those of Xia et al. [63]. The primary reason for this is that in economically advanced regions, concentrated populations accelerate the expansion of impervious surfaces that gradually encroach on cropland [65]. For instance, Guiyang and Nanning, as the political and economic centers of the region, attract large populations during rapid urbanization. To meet development demands, these cities occupy substantial amounts of cropland. Over\20-year period, Guiyang and Nanning recorded CNAC areas of 1.24 × 10⁴ and 1.76 × 10⁴ hm2, respectively, accounting for 8.50% and 12.06% of the total CNAC area in the study region. Moreover, the National New Urbanization Plan (2014–2020) calls for optimizing urban-scale structures, enhancing the influence of central cities, accelerating the development of small and medium-sized cities, and promoting coordinated growth among cities and towns. Consequently, regional nodes—such as prefecture-level cities and counties—have experienced rapid development driven by the sustained influence of these central hubs, encroaching upon the surrounding cropland.
(3) In both periods, semi-mountainous counties exhibited the highest CNAC rates among different county types. This trend was largely due to the locations of cities like Nanning, Guiyang, and Zunyi, all of which are situated in semi-mountainous counties. Nanning is designated as a “regional international city for China’s openness and cooperation with ASEAN” and serves as a key node in China–ASEAN relations [66]. Guiyang and Zunyi are pivotal engines for the economic development of the Qianzhong City Cluster [67]. These regions are at the forefront of economic growth and urbanization, leading to rapid urban expansion and the significant occupation of cropland. From 2000 to 2020, they collectively occupied 40,968.47 hm2 of cropland. This accounted for 28.07% of the total cropland converted to impervious surfaces in the study area. Additionally, by analyzing the changes in the sequence of CNAC areas and rates among different county types in mountainous areas (Figure 3), it can be observed that quasi-mountainous and apparent mountainous counties experienced rapid socioeconomic development and the significant expansion of impervious surfaces. Semi-mountainous counties showed slightly slower development, while entirely mountainous and pure hilly counties exhibited relatively slower development.

6.2. Differential Analysis of CNAC Influencing Factors

(1) Previous research on the drivers of CNAC in karst regions has often overlooked the impact of rocky desertification. This study revealed that rocky desertification areas influenced CNAC differently across various periods and regions. In 2000–2010, rocky desertification areas were positively correlated with CNAC, indicating that the degree of CNAC decreases with the decrease in rocky desertification areas. The reason for this is that ecological restoration and management from 2000 to 2010 improved the soil structure and water retention capacity, which reduced the rocky desertification areas by 1.19 × 10⁴ km2 and also enabled some of the rocky desertification lands to regain conditions for agricultural production. Additionally, the increase in agricultural machinery power and effective irrigated areas improved the water retention capacity and fertility of the soil, reducing the phenomenon of abandonment due to infertile land. Statistical analysis indicated that Guizhou’s cropland expanded by 2.72 × 10⁴ km2 from 2000 to 2010, while Guangxi’s cropland increased by 1.77 × 10⁴ km2. This cropland expansion contributed to reduced CNAC rates, consequently demonstrating a positive correlation between rocky desertification and CNAC. From 2010 to 2020, the negative effect of rocky desertification on CNAC intensified. This suggests that as rocky desertification areas diminished, CNAC increased. The reason for this is that rapid economic growth and urbanization during this period heightened the demand for impervious surfaces, which encroached upon cropland. Simultaneously, the exodus of people from the countryside led to significant land abandonment, further reducing cropland areas. These interacting factors resulted in a negative correlation between rocky desertification areas and CNAC during 2010–2020. Additionally, in terms of mountainous-type counties, from 2000 to 2020, the influence of rocky desertification areas on CNAC became more pronounced in pure hilly counties while remaining stable in entirely mountainous counties. In contrast, its impact lessened in semi-mountainous, quasi-mountainous, and apparent mountainous counties. These findings demonstrate the heightened sensitivity of CNAC to rocky desertification dynamics in pure hilly counties, but its contribution was not as strong as that of other indicators.
(2) This study’s findings indicate that, during the period examined, urbanization had a relatively minor effect on CNAC compared to the other indicators. This result differs from previous research by Li et al. [34] and Wang et al. [36]. Over time, the influence of the urbanization rate progressively weakened in apparent mountainous and entirely mountainous counties while intensifying in pure hilly, semi-mountainous, and quasi-mountainous counties, where the terrain is relatively flat. This variation occurred because karst regions, with their complex topography and rugged surfaces, offer limited and scattered cropland. Urban expansion is constrained by this rugged terrain, making the large-scale occupation of cropland difficult. This phenomenon was especially pronounced in entirely mountainous and apparent mountainous counties. In contrast, pure hilly, semi-mountainous, and quasi-mountainous counties serving as primary population centers experienced a rapid increase in the urbanization rate, rising from 37.06% in 2000 to 65.55% in 2020. Consequently, urban expansion occupied more cropland in these counties. Furthermore, in pure hilly, semi-mountainous, and quasi-mountainous counties, advancements in agricultural mechanization and expanded irrigation coverage have created superior farming conditions compared to other regions. These factors have rendered this region more suitable for intensive agricultural development and have indirectly provided additional space for urban expansion.
(3) Between 2000 and 2010, the urbanization rate and CNAC in the study area showed a significant negative correlation. This is because between 2000 and 2010, the level of urbanization development in the study area was relatively slow, people were highly dependent on land, and the area of cropland converted to impervious surfaces was low. After 2010, there was a significant spatial differentiation: The negative driving effect increased in Guangxi and neighboring counties (especially in pure hilly counties), while most of the counties in Guizhou experienced a positive driving effect. This divergence reflects regional developmental disparities: in Guangxi’s pure hilly counties, the proportion of primary industry was generally high [68], and the development of the planting industry led to high demand for cropland (such as corn and rice), which, coupled with the enforcement of permanent farmland protection policies, caused the conversion rate to lag behind urbanization, thereby maintaining a negative correlation. Conversely, in the entirely mountainous and apparent mountainous counties of Guizhou, with the implementation of the Grain to Green Program and resettlement for poverty alleviation policy, as well as a large number of farmers going out to work and the change in farmers’ livelihoods, cropland was gradually converted into forest and grassland, and the area of arable land decreased. These processes, combined with urban encroachment, led to positive correlations between urbanization and CNAC.
(4) The indicators exhibited significant variations in their contributions across county types. For instance, the regression coefficients for GDP per capita ranged from 85.34 to 113.72 in pure hilly counties (2000–2010), compared to 35.27 to 124.23 in semi-mountainous counties. The range of variation in the regression coefficients increased, indicating more pronounced spatial variation in the effect of GDP per capita on CNAC in semi-mountainous counties. A similar trend emerged across other indicators. These variations were predominantly associated with regional environmental conditions, economic structures, and policy orientations. For example, Liupanshui City—an emerging city with coal resources, transitioning from coal-dependent development to implementing industrial restructuring under the “both golden, silver hill and clean water, green mountains as well” initiative—experienced a decline in its secondary sector GDP contribution from 62.7% (2011) to 48.6% (2018). As a result, the range of changes in the regression coefficient of its GDP per capita was also much smaller than that of similar prefecture-level urban areas. At the same time, the influence of the primary industry employment rate on CNAC also varied considerably, with the degree of influence decreasing in pure hilly, semi-mountainous, and quasi-mountainous counties, but the contribution of apparent and entirely mountainous counties increasing, suggesting that the more mountainous an area is, the more significant the influence of agricultural production on CNAC.

6.3. Research Limitations and Insights

Most of the Qian-Gui karst mountainous region belongs to China’s Yunnan–Guizhou–Guangxi and Wumeng Mountain contiguous poverty-stricken areas [69], characterized by extensive poverty [70] and representing a typical socioecologically fragile zone [71,72]. At the same time, the Qian-Gui karst mountainous area is also one of the most complete and representative regions in the world in terms of karst landform-type development [48,73]. At present, CNAC not only exists in the Qian-Gui karst mountainous region but also prevails globally. Consequently, the methodology and findings of this study can be extended to research in China and other global regions, offering a significant reference value for advancing ecological civilization construction and sustainable development practices in karst landscapes worldwide.
CNAC, as an important type of land use change, has significant two-sided effects on regional environmental systems and economic development [62]. On the one hand, CNAC provides development space for urban construction and industries, effectively driving regional economic growth. On the other hand, the process mostly occurs in high-quality arable land agglomerations with gentle topography, leading to the irreversible loss of high-quality arable land resources and posing a potential threat to food production security. Particularly in karst areas with a special surface–subsurface dichotomy, the excessive CNAC of arable land can lead to a sharp decrease in biodiversity and a more pronounced urban heat island effect [74], thus increasing the risk of extreme droughts and torrential rain [75]. In addition, the expansion of CNAC may change soil infiltration characteristics, reduce soil organic matter content, and increase soil erosion rates [76], which, in turn, may interfere with surface–underground water circulation processes and increase the probability of extreme weather events.
This study has two limitations. First, the study adopted the method of combining statistical units, which is often employed by academics, taking into account the limitations of data access due to the adjustment of administrative divisions. However, the extension of the spatial scale may amplify the measurement error of the impact indicators, leading to a bias in the assessment of the explanatory power of CNAC. Second, due to the lack of a standardized policy effectiveness assessment system, this study failed to incorporate institutional factors such as cropland protection policies and land spatial planning into the measurement model. Future research could achieve methodological innovation through multi-source data integration as follows: (1) enhance land cover classification accuracy using high-resolution remote sensing and deep learning; (2) develop a multidimensional “natural–economic–policy” driver model through policy text analysis and farmer behavior surveys; and (3) employ a system dynamics simulation to identify balanced pathways between cropland preservation and urban expansion in karst areas. Of course, it is also necessary for the study to construct a coupled coordination model between CNAC and regional ecological and economic systems at the county scale, with an emphasis on analyzing the mutual feedback mechanism between CNAC and extreme weather events. These improvements will help to establish a more spatially adapted land governance system and provide decision support for the sustainable development of karst fragile ecosystems.

7. Conclusions

This study, which used the GWR model, examined the spatiotemporal characteristics of CNAC and its influencing factors across different county types in the Qian-Gui karst mountainous region. The main findings are summarized as follows:
(1) From 2000 to 2020, the CNAC rate in the study area reached 2.03%, and the CNAC area increased by 14.60 × 10⁴ hm2. Cropland was the primary source of expanding impervious surfaces. Among county types, quasi-mountainous and apparent mountainous counties showed the highest CNAC rates, followed by semi-mountainous counties, and the lowest source was found to be entirely mountainous and pure hilly counties. Additionally, except for semi-mountainous counties, the number of counties decreased as the degree of CNAC increased.
(2) The grade of CNAC showed a spatial differentiation pattern of gradient diffusion, and the overall distribution was characterized by “high in the north and south, low in the middle.” Specifically, low-degree CNAC zones were distributed in western, southern, and northeastern Guizhou and northwestern Guangxi; light-degree zones were gradually developed from sporadic distribution to contiguous distribution, mostly in central Guizhou and northern and western Guangxi; medium-degree zones were concentrated in southwestern Guizhou and eastern Guangxi; high-degree zones were distributed in various prefectural-level city districts; and extreme levels were mostly concentrated in provincial capitals.
(3) Driving factors have significant spatial heterogeneity. Agricultural output and population density consistently exhibited strong positive effects. Meanwhile, the contribution of effective irrigated areas in all regions except pure hilly counties increased significantly. In addition, among the natural factors, the explanatory power of rocky desertification areas to CNAC in pure hilly counties increased. In contrast, the cropland area per capita had a lower contribution compared to other indicators.
In summary, CNAC in various county types of the Qian-Gui karst mountain region exhibits distinct spatial heterogeneity characteristics, with driving mechanisms demonstrating spatiotemporal non-stationarity. The contribution of individual factors shows dynamic differentiation across development stages. Therefore, establishing a differentiated land control system under the “red line of ecological protection, permanent basic farmland, urban development boundary” constraints is imperative [77], and focus should be given to coordinating the spatial layout of arable land and construction land through the synergistic governance framework of “zoning-monitoring-regulation”. Secondly, improvements should be made to compensation for arable land protection, and the precise subsidy policy of “benefiting from planting grain” should be implemented so as to provide productive subsidies to farmers who are actually engaged in grain cultivation and simultaneously terminate the policy subsidies for non-grain production subjects. Thirdly, the management of rocky desertification should be strengthened, coordinating the spatial allocation of soil and water conservation and agriculture with special characteristics and achieving a dynamic balance between ecological security and food security. Meanwhile, according to the actual differences in the study area, the hierarchical governance paths are as follows: For pure hilly and semi-mountainous counties, governments should focus on enhancing grain production capacity by establishing agricultural technology innovation systems to reduce cultivation costs, improve farming efficiency, and increase farmers’ returns on cultivation [78]. Apparent mountainous and quasi-mountainous counties should adopt collaborative cultivation models combining food crops with non-competing cash crops. Entirely mountainous counties need to intensify ecological restoration projects, focusing on the development of ecologically oriented agriculture, pastoralism, fruit and vegetable cultivation, and other sectors with high-demand potential, as well as the implementation of no-till planting, pasture rotation, and crop–livestock integration.

Author Contributions

Conceptualization, J.S. and Q.L.; methodology, Q.L. and G.Z.; software, Q.L. and Z.X.; formal analysis, Q.L., S.Z., W.H. and J.C.; data curation, Q.L., Z.X., J.L. and S.Z.; writing—original draft preparation, Q.L.; writing—review and editing, S.Z.; supervision, J.S.; funding acquisition, J.S. All authors have read and agreed to the published version of the manuscript.

Funding

This research was funded by the “Yunnan Revitalization Talent Support Program” in Yunnan Province (grant number XDYC-WTRC-2023-0045), the Yunnan Fundamental Research Key Projects (grant numbers 202401AS070037), the National Natural Science Foundation of China (grant number 52168001; 42161040), and the National Social Science Fund of China (grant numbers 20FZSB006).

Institutional Review Board Statement

Not applicable.

Informed Consent Statement

Not applicable.

Data Availability Statement

The data required for the study are available free of charge at https://doi.org/10.5281/zenodo.5210928 (accessed on 16 October 2024) and https://www.gscloud.cn (accessed on 13 October 2024).

Acknowledgments

We gratefully acknowledge Huang Xin’s team for providing the fundamental data for this study. Additionally, we extend our sincere appreciation to the Groundwater Resources Information Service (http://www.groundwater.cn, accessed on 24 December 2024) for supplying the karst boundary data essential to this research.

Conflicts of Interest

The authors declare no conflicts of interest.

Abbreviations

The following abbreviations are used in this manuscript:
CNACCropland Non-Agricultural Conversion
GWRGeographically Weighted Regression
SEANAssociation of South East Asian Nations

References

  1. Zhou, Y.; Li, X.; Liu, Y. Cultivated Land Protection and Rational Use in China. Land Use Policy 2021, 106, 105454. [Google Scholar] [CrossRef]
  2. Shackleton, C.M.; Mograbi, P.J.; Drimie, S.; Fay, D.; Hebinck, P.; Hoffman, M.T.; Maciejewski, K.; Twine, W. Deactivation of Field Cultivation in Communal Areas of South Africa: Patterns, Drivers and Socio-Economic and Ecological Consequences. Land Use Policy 2019, 82, 686–699. [Google Scholar] [CrossRef]
  3. Tu, Y.; Chen, B.; Yu, L.; Xin, Q.; Gong, P.; Xu, B. How Does Urban Expansion Interact with Cropland Loss? A Comparison of 14 Chinese Cities from 1980 to 2015. Landsc. Ecol. 2021, 36, 243–263. [Google Scholar] [CrossRef]
  4. Liu, T.; Chen, M. The Status-Quo and Improvement Path for the Implementation of Cultivated Land Protection Policy in China. China Land Sci. 2020, 34, 32–37+47. [Google Scholar] [CrossRef]
  5. Zhang, H.; Tan, M.; Kong, X.; Xu, Y.; Xu, E.; Shang, E. Research on the Strategy for Improving Cultivated Land Quality in China. Strateg. Study CAE 2018, 20, 16–22. [Google Scholar] [CrossRef]
  6. Wang, J.; Li, X. Research in the Change Trend of Farmland and Quantity in China for Recent 20 Years and Its Driving Factors. Chin. J. Agric. Resour. Reg. Plan. 2019, 40, 171–176. [Google Scholar]
  7. Mehrabi, Z.; Delzeit, R.; Ignaciuk, A.; Levers, C.; Braich, G.; Bajaj, K.; Amo-Aidoo, A.; Anderson, W.; Balgah, R.A.; Benton, T.G.; et al. Research Priorities for Global Food Security under Extreme Events. One Earth 2022, 5, 756–766. [Google Scholar] [CrossRef] [PubMed]
  8. Ran, D.; Zhang, Z.; Jing, Y. A Study on the Spatial–Temporal Evolution and Driving Factors of Non-Grain Production in China’s Major Grain-Producing Provinces. Int. J. Environ. Res. Public Health 2022, 19, 16630. [Google Scholar] [CrossRef]
  9. Li, H.; Song, W. Spatial Transformation of Changes in Global Cultivated Land. Sci. Total Environ. 2023, 859, 160194. [Google Scholar] [CrossRef]
  10. Chen, Y.F.; Wang, J.Y.; Zhang, F.R.; Liu, Y.S.; Cheng, S.K.; Zhu, J.; Si, W.; Fan, S.G.; Gu, S.S.; Hu, B.C.; et al. New Patterns of Globalization and Food Security. J. Nat. Resour. 2021, 36, 1362–1380. [Google Scholar] [CrossRef]
  11. Chiemela, S.N.; Noulekoun, F.; Zenebe, A.; Abadi, N.; Birhane, E. Transformation of Degraded Farmlands to Agroforestry in Zongi Village, Ethiopia. Agrofor. Syst. 2018, 92, 1317–1328. [Google Scholar] [CrossRef]
  12. Potapov, P.; Turubanova, S.; Hansen, M.C.; Tyukavina, A.; Zalles, V.; Khan, A.; Song, X.-P.; Pickens, A.; Shen, Q.; Cortez, J. Global Maps of Cropland Extent and Change Show Accelerated Cropland Expansion in the Twenty-First Century. Nat. Food 2021, 3, 19–28. [Google Scholar] [CrossRef]
  13. Qu, F.T.; Chen, J.L.; Chen, W. Theoretical and Empirical Study on the Land Conversion Economic Driving Forces. J. Nat. Resour. 2005, 20, 231–241. [Google Scholar]
  14. Yuan, S.F.; Yang, L.X.; Yang, G.S.; Yao, S.M. The Spatial Heterogeneity of Socio-Economic Driving Factors of Cultivated Land Conversion:A Case Based on STIRPAT and GWR Models. Econ. Geogr. 2013, 33, 137–143. [Google Scholar] [CrossRef]
  15. Zhang, H.B.; Jia, S.H. Analysis on the Regulation Mechanism of Non-Agricultural Land. Econ. Res. J. 2001, 12, 50–54. [Google Scholar]
  16. Cui, X.F.; Ma, Y.M.; Zhang, G.H. The Factors of Farmland Conversion and Its Temporal and Spatial Characteristics: An Integrated Model. Sci. Agric. Sin. 2018, 51, 4316–4327. [Google Scholar] [CrossRef]
  17. Liu, H.H.; Wang, H.H.; Jin, Z.W.; Pan, C.L. Spatial and Temporal Evolution Characteristics and Driving Mechanism of Cultivated Land Conversion in Lower Liaohe River Plain. Chin. J. Eco-Agric. 2024, 32, 1420–1431. [Google Scholar] [CrossRef]
  18. Li, F.T.; Zhang, G.; Shi, T.T.; Li, L. Classification System and Application of Remote Sensing Interpretation Samples of Cultivated Land Non-Agriculturalization. Trans. Chin. Soc. Agric. Eng. Trans. CSAE 2022, 38, 297–304. [Google Scholar] [CrossRef]
  19. Ma, L.; Long, H.; Tu, S.; Zhang, Y.; Zheng, Y. Farmland Transition in China and Its Policy Implications. Land Use Policy 2020, 92, 104470. [Google Scholar] [CrossRef]
  20. Ye, S.J.; Song, C.Q.; Cheng, C.X.; Gao, P.C.; Shen, S.; Mu, W.S. Five Issues and Countermeasures of China Cropland Resource Use. Bull. Chin. Acad. Sci. 2023, 38, 1962–1976. [Google Scholar] [CrossRef]
  21. Li, J.J.; Liu, B.F. Development Trends and Innovative Approaches of China’s Policies to Curb the “Non-Agriculturalization” of Farmland. Chin. Public Adm. 2023, 3, 152–154. [Google Scholar]
  22. Tan, R.; Qu, F.T. Demonetization of Agricultural Land and Protection of Agricultural Land Resources in China: From Dilemma to Win-win Situation. J. Manag. World 2006, 4, 50–59+66. [Google Scholar]
  23. Wang, H.; Zhang, B.; Liu, Y.; Liu, Y.; Xu, S.; Deng, Y.; Zhao, Y.; Chen, Y.; Hong, S. Multi-Dimensional Analysis of Urban Expansion Patterns and Their Driving Forces Based on the Center of Gravity-GTWR Model: A Case Study of the Beijing-Tianjin-Hebei Urban Agglomeration. Acta Geogr. Sin. 2018, 73, 1076–1092. [Google Scholar] [CrossRef]
  24. Jiang, H.; Chen, L. Spatial Allocation Efficiency and Control Strategy of County Land Resources Based on Main Functional Areas of Territorial Space: A Case Study of Ganyu, Jiangsu Province. J. Nat. Resour. 2021, 36, 2424–2436. [Google Scholar] [CrossRef]
  25. Chen, Y.; Wang, S.; Wang, Y. Spatiotemporal Evolution of Cultivated Land Non-Agriculturalization and Its Drivers in Typical Areas of Southwest China from 2000 to 2020. Remote Sens. 2022, 14, 3211. [Google Scholar] [CrossRef]
  26. Han, H.; Peng, H.; Li, S.; Yang, J.; Yan, Z. The Non-Agriculturalization of Cultivated Land in Karst Mountainous Areas in China. Land 2022, 11, 1727. [Google Scholar] [CrossRef]
  27. Huang, T.N.; Xu, J.L. The Characteristics, Causes and Countermeasures of Spatial-Temporal Evolution of Guangxi Cultivated Land Deagriculturalization in the Past 40 Years. Chin. J. Agric. Resour. Reg. Plan. 2023, 44, 40–51. [Google Scholar]
  28. Liu, H.B.; Wang, H.H.; Pan, C.L. Research Progress on Cultivated Land Conversion at Home and Abroad Based on the Perspective of Bibliometrics: Context, Hot Spots and Prospects. Chin. J. Agric. Resour. Reg. Plan. 2024, 45, 173–183. [Google Scholar]
  29. Zhang, J.; Liu, Y.J.; Zhang, E.M.; Chen, J.; Tan, Q.H. Dynamics and Driving Mechanisms of Cultivated Land at County Level in China. Acta Geogr. Sin. 2023, 78, 2105–2127. [Google Scholar] [CrossRef]
  30. Liu, F.; Wu, X.; Guo, Z. Spatio-Temporal Evolution Characteristics and Dynamic Trends of Cultivated Land Conversion in County: A Case Study of Anhui Province. J. Northeast Agric. Univ. 2024, 55, 50–61. [Google Scholar] [CrossRef]
  31. Duan, X.W.; Li, X.J. Spatial Differentiation and Its Influencing Factors of Settlements Evolution in Mountainous Counties: A Case Study of Songxian County in Western Henan Province. Geogr. Res. 2018, 37, 2459–2474. [Google Scholar]
  32. Chen, L.; Qiu, R.M.; Li, C. Spatiotemporal Characteristics of Non-Grain Production of Cultivated Land and Its Driving Factors in Chengdu Plain. Trop. Geogr. 2023, 43, 2406–2417. [Google Scholar] [CrossRef]
  33. Jiang, D.M.; Li, X.S.; Qu, F.T.; Yan, J.M.; Wang, Y.J.; Zhang, S.L.; Shi, X.P.; He, G.C. Simulation of Cultivated Land Conversion Trend and Its Effect on Carbon Budget in China. Trans. Chin. Soc. Agric. Eng. 2015, 31, 1–9. [Google Scholar] [CrossRef]
  34. Li, H.P.; Tian, D.E.; Tan, J.B. Spatio-Temporal Pattern Evolution and Influencing Factors of Cultivated Land Non-Agriculturalization in Yan’an City. Bull. Soil Water Conserv. 2022, 42, 330–337+372. [Google Scholar] [CrossRef]
  35. Cui, J.X.; Jin, H.; Luo, Y.Y.; Lin, Y.; Tong, X.; Zhu, Y.Y. Non-Agricultural Transformation and Non-Grain Production and Their Coordinated Relationships with Rural Population Hollowing: A Case Study of Yangtze River Economic Belt. Acta Ecol. Sin. 2024, 44, 1822–1836. [Google Scholar] [CrossRef]
  36. Wang, Q.X.; Song, G.; Sui, H.J. Spatial-Temporal Pattern Evolution of Cultivated Land Conversion and Its Driving Factors: A Twofold Perspectives of Impact Analysis and Configuration Analysis. China Land Sci. 2023, 37, 113–124. [Google Scholar] [CrossRef]
  37. Yuan, X.N.; Lu, C.Y.; Lv, K.Y.; Guo, X.B.; Wen, F. Research Progress and Prospect of Non-Agriculturalization of Arable Land in China. Chin. J. Agric. Resour. Reg. Plan. 2019, 40, 128–133. [Google Scholar]
  38. Ding, S.P.; Li, M.M.; Wang, X.Q.; Li, L.; Wu, R.J.; Huang, H. The Use of Time Series Remote Sensing Data to Analyze the Characteristics of Non-Agriculture Farmland and Their Driving Factors in Fuzhou. Remote Sens. Technol. Appl. 2022, 37, 550–563. [Google Scholar]
  39. Gao, J.B.; Wu, S.H.; Dai, E.F.; Hou, W.J. The Progresses and Prospects of Research on Water and Heat Balance at Land Surface in the Karst Region of Southwest China. Adv. Earth Sci. 2015, 30, 647–653. [Google Scholar] [CrossRef]
  40. Shi, X.; Zhao, S.; Lu, S.; Wang, T.; Xu, X. The Effect of Farmers’ Livelihood Capital on Non-Agricultural Income Based on the Regulatory Effect of Returning Farmland to Forests: A Case Study of Qingyuan Manchu Autonomous County in China. Small-Scale For. 2024, 23, 59–83. [Google Scholar] [CrossRef]
  41. Wang, L.J.; Wang, P.; Sheng, M.Y. Stoichiometric Characteristics of Soil Nutrient Elements and Its Influencing Factors in Typical Karst Rocky Desertification Ecosystems, Southwest China. Acta Ecol. Sin. 2018, 38, 6580–6593. [Google Scholar] [CrossRef]
  42. Bai, Y.; Du, J.; Yang, T.T.; Wang, Z.X.; Qiu, J.L.; Li, J. Effects of Different Soil and Water Conservation Measures on Soil and Water Loss from Rocky Desertification Area. Sci. Soil Water Conserv. 2018, 16, 103–110. [Google Scholar] [CrossRef]
  43. Zhang, H.; Wang, Y. Spatial Differentiation of Cropland Pressure and Its Socio-Economic Factors in China Based on Panel Data of 342 Prefectural-Level Units. Geogr. Res. 2017, 36, 731–742. [Google Scholar]
  44. Zhang, H.G.; Cui, X.F. Driving Mechanism and Regional Differentiation of Cultivated Land Non-Agricultural-Transformation. Sci. Agric. Sin. 2015, 48, 1632–1640. [Google Scholar] [CrossRef]
  45. Mahtta, R.; Fragkias, M.; Güneralp, B.; Mahendra, A.; Reba, M.; Wentz, E.A.; Seto, K.C. Urban Land Expansion: The Role of Population and Economic Growth for 300+ Cities. Npj Urban Sustain. 2022, 2, 5. [Google Scholar] [CrossRef]
  46. Shang, E.P.; Xu, E.Q. Temporal and Spatial Variation of Main Ecosystem Services in Guizhou and Guangxi Karst Mountainous Region. Resour. Sci. 2017, 39, 2000–2015. [Google Scholar] [CrossRef]
  47. Liu, L.M.Z.; Zhan, C.S.; Hu, S.; Dong, Y.X. Vegetation Change and Its Topographic Effects in the Karst Mountainous Areas of Guizhou and Guangxi. Geogr. Res. 2018, 37, 2433–2446. [Google Scholar]
  48. Zhao, Y.L.; Li, X.B.; Zhang, Y. Technology and Application of Mountainous Area Divisions in Qian-Gui Karst Areas. J. Geo-Inf. Sci. 2017, 19, 934–940. [Google Scholar]
  49. Chen, W.; Liao, Y.; Kong, X.; Lei, M.; Wen, L.; Zhang, B. Characteristics, Drivers and Control of Non-grain Production on Permanent Basic Farmland Based on Plot Scale. Trans. Chin. Soc. Agric. Mach. 2023, 54, 114–124. [Google Scholar] [CrossRef]
  50. Su, Z.; Zheng, Y.H.; Guo, L. Impact of the Digital Economy on the Carbon Efficiency of the Tourism Industry and Its Threshold Effect. China Popul. Environ. 2023, 33, 69–79. [Google Scholar] [CrossRef]
  51. Zhang, T.P.; Bao, W.K.; Lei, Q.L.; Liu, X.T.; Du, X.Z.; Zhou, J.G.; Luo, J.F.; Liu, H.B. Characteristics of Spatio-Temporal Changes in Soil Temperature in China from 1951 to 2010 and Its Influencing Factors. Acta Geogr. Sin. 2022, 77, 589–602. [Google Scholar] [CrossRef]
  52. Liu, C.; Xu, Y.; Ji, Z. Impact and Zoning of Production-Living-Ecological Spaces Changes on Carbon Balance: Evidence from Shandong Province, China. J. Geogr. Sci. 2025, 35, 293–314. [Google Scholar] [CrossRef]
  53. Song, Y.; Gao, M.; Wang, J.; Xu, Z. Spatial Prediction and Influencing Factors Analysis of Soil Salinization in Coastal Area Based on MGWR. Environ. Sci. 2024, 45, 4293–4301. [Google Scholar] [CrossRef]
  54. Lewandowska-Gwarda, K. Geographically Weighted Regression in the Analysis of Unemployment in Poland. ISPRS Int. J. Geo-Inf. 2018, 7, 17. [Google Scholar] [CrossRef]
  55. Yang, J.; Huang, X. The 30 m Annual Land Cover Datasets and Its Dynamics in China from 1985 to 2023. 2024. Available online: https://zenodo.org/records/12779975 (accessed on 16 October 2024).
  56. Wang, M.M.; Wang, S.J.; Bai, X.Y.; Li, S.J.; Li, H.W.; Cao, Y.; Xi, H.P. Evolution Characteristics of Karst Rocky Desertification in Typical Small Watershed and the Key Characterization Factor and Driving Factor. Acta Ecol. Sin. 2019, 39, 6083–6097. [Google Scholar] [CrossRef]
  57. Xi, J.; Jiang, Q.; Liu, H.; Gao, X. Karst Rocky Desertification Mapping and Causes Analysis Based on Sentinel-2A Imagery. J. Jilin Univ. Sci. Ed. 2023, 53, 1301–1312. [Google Scholar] [CrossRef]
  58. Saunders, L.J.; Russell, R.A.; Crabb, D.P. The Coefficient of Determination: What Determines a Useful R2 Statistic? Investig. Opthalmology Vis. Sci. 2012, 53, 6830. [Google Scholar] [CrossRef]
  59. Sun, C.Z.; Ma, Q.F.; Zhao, L.S. Analysis of Driving Mechanism Based on a GWR Model of Green Efficiency of Water Resources in China. Acta Geogr. Sin. 2020, 75, 1022–1035. [Google Scholar] [CrossRef]
  60. Li, J.T.; Wen, L.J.; Zhang, A.L. Spatial Disequilibrium and Spatial Diffusion Path of Cultivated Land Conversion:A Case Study of Wuhan Metropolitan Areas. Ecol. Sci. 2024, 43, 110–119. [Google Scholar] [CrossRef]
  61. Lou, F.; Lou, X.J.; Chen, X.Y. Comparison on Spatial Evolution of Rural Settlements between the Flat and the Mountainous Areas: Evidence from Yanjin County and Baofeng County, Henan Province. Econ. Geogr. 2017, 37, 158–166. [Google Scholar]
  62. Chen, L. Spatio-Temporal Changes of Cultivated Land Non-Grain Conversion and the Regional Differences of Its Influence on Economic Growth in Sichuan Province in Recent 20 Years. Sci. Technol. Rev. 2023, 41, 44–54. [Google Scholar] [CrossRef]
  63. Xia, Z.L.; Lan, A.J.; Fan, Z.M.; Zhu, N. Spatial Patterns and Shift Paths of Non-Agricultural Cultivated Land in Guizhou Province. Chin. J. Agric. Resour. Reg. Plan. 2023, 44, 159–170. [Google Scholar]
  64. Chen, G.; Li, X.; Liu, X.; Chen, Y.; Liang, X.; Leng, J.; Xu, X.; Liao, W.; Qiu, Y.; Wu, Q.; et al. Global Projections of Future Urban Land Expansion under Shared Socioeconomic Pathways. Nat. Commun. 2020, 11, 537. [Google Scholar] [CrossRef]
  65. Huang, Z.; Du, X.; Castillo, C.S.Z. How Does Urbanization Affect Farmland Protection? Evidence from China. Resour. Conserv. Recycl. 2019, 145, 139–147. [Google Scholar] [CrossRef]
  66. Wang, Q.; Li, R.; Cheong, K.C. Nanning—Perils and Promise of a Frontier City. Cities 2018, 72, 51–59. [Google Scholar] [CrossRef]
  67. Tian, J.; Li, X.D.; Chen, X.; Guo, X. Impact of Coupling and Coordination of New Urbanization and Agricultural Modernization on the Urban-Rural Income Gap in the Central Guizhou Urban Agglomeration. Prog. Geogr. 2024, 43, 1355–1371. [Google Scholar] [CrossRef]
  68. Wang, P.C.; Zhang, L.G.; Lu, Y.L.; Zhao, Y.Y.; Luo, S. Study on the Spatial-Temporal Evolution and Influencing Factors of Non-Grain Cultivated Land in Guangxi. Chin. J. Agric. Resour. Reg. Plan. 2023, 44, 187–197. [Google Scholar]
  69. Ding, J.J. Comparative Analysis on Poverty Degree of China′s 11 Contiguous Destitute Areas: With View of Comprehensive Development Index. Sci. Geogr. Sin. 2014, 34, 1418–1427. [Google Scholar] [CrossRef]
  70. Zhang, Y.; Zhao, Y.L. Spatial Difference of Land Use Degree Evolution in Guizhou-Guangxi Karst Mountainous Areas. Res. Soil Water Conserv. 2018, 25, 287–297. [Google Scholar] [CrossRef]
  71. Hartmann, A.; Goldscheider, N.; Wagener, T.; Lange, J.; Weiler, M. Karst Water Resources in a Changing World: Review of Hydrological Modeling Approaches: KARST WATER RESOURCES PREDICTION. Rev. Geophys. 2014, 52, 218–242. [Google Scholar] [CrossRef]
  72. Wang, J.Y.; Xin, L.J.; Dai, F.F. Spatio-Temporal Variations of the Matching Patterns of Agricultural Land and Water Resources in Typical Mountainous Areas of China. Geogr. Res. 2020, 39, 1879–1891. [Google Scholar] [CrossRef]
  73. Xiong, K.; Chi, Y. The Problems in Southern China Karst Ecosystem in Southern of China and Its Countermeasures. Ecol. Econ. 2015, 31, 23–30. [Google Scholar]
  74. Zhang, K.; Cao, C.; Chu, H.; Zhao, L.; Zhao, J.; Lee, X. Increased Heat Risk in Wet Climate Induced by Urban Humid Heat. Nature 2023, 617, 738–742. [Google Scholar] [CrossRef]
  75. Huang, S.; Wang, S.; Gan, Y.; Wang, C.; Horton, D.E.; Li, C.; Zhang, X.; Niyogi, D.; Xia, J.; Chen, N. Widespread Global Exacerbation of Extreme Drought Induced by Urbanization. Nat. Cities 2024, 1, 597–609. [Google Scholar] [CrossRef]
  76. Ayer, J.E.B.; Lämmle, L.; Mincato, R.L.; Donadio, C.; Avramidis, P.; Pereira, S.Y. Three-Dimensional Model and Environmental Fragility in the Guarani Aquifer System, SE-Brazil. Groundw. Sustain. Dev. 2024, 26, 101285. [Google Scholar] [CrossRef]
  77. Chen, M.; Liu, W.; Lu, D. Challenges and the Way Forward in China’s New-Type Urbanization. Land Use Policy 2016, 55, 334–339. [Google Scholar] [CrossRef]
  78. Zhu, Y.; Zhou, H. The Spatiotemporal Differentiation and Driving Mechanism of Farmland “Non-Grain Use” at County Scale: A Case Study of Hunan Province. Res. Agric. Mod. 2024, 45, 399–408. [Google Scholar] [CrossRef]
Figure 1. Schematic location of the study area.
Agriculture 15 00795 g001
Figure 2. Diagram of the different types of counties.
Agriculture 15 00795 g002
Figure 3. Area and rate of CNAC by county.
Agriculture 15 00795 g003
Figure 4. Ranking of CNAC in various types of counties.
Agriculture 15 00795 g004
Figure 5. Indicators of factors influencing CNAC.
Agriculture 15 00795 g005
Figure 6. Spatial and temporal changes in the regression coefficients of the indicators.
Agriculture 15 00795 g006aAgriculture 15 00795 g006b
Table 1. Data and sources of information.
Data NameSpatial ResolutionData Source
Land use data (raster)30 mChina Land Cover Dataset (CLCD), https://zenodo.org/records/8176941, accessed on 16 October 2024 [55].
Digital elevation model30 mGeospatial data cloud (https://www.gscloud.cn, accessed on 13 October 2024).
Socioeconomic dataCounty-level unitsChina county statistical yearbook, statistical yearbooks of prefecture-level cities in Guizhou and Guangxi, county statistical bulletins, and government work reports.
Data on rock outcrop rate and vegetation coverage30 mCalculated using GEE platform programming.
Table 2. The rocky desertification classification criteria.
Fractional Vegetation Cover/%Rock Exposure Rate/%
<2020–3031–5051–70>71
>70NKRDNKRDPKRDPKRDPKRD
51–70NKRDPKRDPKRDPKRDLKRD
36–50PKRDPKRDLKRDLKRDLKRD
21–35PKRDPKRDLKRDMKRDMKRD
<20PKRDPKRDLKRDMKRDSKRD
NKRD: no karst rocky desertification; PKRD: potential karst rocky desertification; LKRD: light karst rocky desertification; MKRD: moderate karst rocky desertification; SKRD: severe karst rocky desertification.
Table 3. Indicators for the division of different county types in the Qian-Gui karst mountainous region.
TypePercentage of Mountainous Areas
Pure hilly countyPercentage of hilly areas ≥ 80%
Semi-mountainous county40% ≤ Percentage of mountainous areas < 70%
Quasi-mountainous county70% ≤ Percentage of mountainous areas < 80%
Apparent mountainous county80% ≤ Percentage of mountainous areas < 90%
Entirely mountainous county90% ≤ Percentage of mountainous areas < 100%
Table 4. Area and rate of CNAC, 2000–2020.
Different Types of Mountainous Counties2000–20102010–20202000–20102010–2020
hm2hm2%%
Pure hilly county13,572.8418,686.460.861.13
Semi-mountainous county17,220.0933,626.661.352.67
Quasi-mountainous county7153.5814,342.940.621.24
Apparent mountainous county6237.9413,122.230.470.92
Entirely mountainous county9129.5712,862.610.500.66
Total53,314.0392,640.900.741.24
Table 5. The variance inflation factors.
Impact FactorsIndicators2000–20102010–2020
Social factorsGrain output per capita (X1)1.241.49
Agricultural machinery power (X2)1.391.56
Effective irrigated area (X3)1.261.36
Primary industry employment rate (X4)1.271.87
Urbanization rate (X5)1.231.41
Population density (X6)1.651.57
Natural factorRocky desertification area (X7)1.391.40
Cropland area per capita (X8)1.351.06
Economic factorsAgricultural output (X9)2.421.54
Farmer net income per capita (X10)3.222.56
GDP per capita (X11)3.011.59
Table 6. Comparison of OLS and GWR simulation effects.
ModelsTime PeriodR2Adjusted R2AICc
OLS2000—20100.910.891310.76
2010—20200.780.751492.01
GWR2000—20100.930.901305.56
2010—20200.930.891441.10
Disclaimer/Publisher’s Note: The statements, opinions and data contained in all publications are solely those of the individual author(s) and contributor(s) and not of MDPI and/or the editor(s). MDPI and/or the editor(s) disclaim responsibility for any injury to people or property resulting from any ideas, methods, instructions or products referred to in the content.

