Article

The Impact of the Natural Grass-Growing Model on the Development of Korla Fragrant Pear Fruit, as Well as Its Influence on Post-Harvest Sugar Metabolism and the Expression of Key Enzyme Genes Involved in Fruit Sugar Synthesis

1
College of Horticulture and Forestry, Tarim University (Main Campus), Alar 843300, China
2
Tarim Basin Biological Resources Protection and Utilization Key Laboratory, Xinjiang Production and Construction Corps, Alar 843300, China
3
Southern Xinjiang Characteristic Fruit Tree Efficient Cultivation and Deep Processing Technology Joint Engineering Laboratory, Alar 843300, China
4
College of Horticulture and Forestry, Nanjing Agricultural University, Nanjing 210095, China
*
Author to whom correspondence should be addressed.
These authors contributed equally to this work.
Agriculture 2025, 15(7), 792; https://doi.org/10.3390/agriculture15070792
Submission received: 7 March 2025 / Revised: 1 April 2025 / Accepted: 5 April 2025 / Published: 7 April 2025
(This article belongs to the Section Agricultural Product Quality and Safety)

Abstract

:
In this study, the effects of natural grass cultivation and clear cultivation on the physiological characteristics of Korla fragrant pear during fruit development and storage were investigated, providing a scientific basis for high-quality fragrant pear cultivation. Sugar components, enzyme activities, and gene expression levels in the pulp and peel were comprehensively analyzed during fruit development and storage. A classification model was constructed using machine learning algorithms (RF, KNN, SVM), and particle swarm optimization (PSO) was employed to identify key factors. The results showed that natural grass cultivation significantly enhanced sugar accumulation in the fruits, particularly at 120 and 150 days after flowering, with fructose content increasing by 9.09 mg·g−1 and 12.59 mg·g−1, respectively, and glucose content also rising significantly. Additionally, natural grass cultivation promoted the relative expression levels of GK, PFK, and FK genes in the pulp. During fruit storage, enzyme activities in the natural grass cultivation group were consistently higher than those in the clear cultivation group across different periods, with PFK activity being 23.73 U/L higher at 150 days of storage. The model identified the activities of glyceraldehyde kinase, phosphofructokinase, and fructokinase as key factors influencing sugar content. A significant negative correlation was observed between peel phosphofructokinase activity and fruit fructose content, though this relationship requires further investigation. This study elucidates the regulatory mechanism by which cultivation methods affect fruit quality through enzyme activity and photosynthetic product distribution. Our findings provide a critical scientific foundation for the high-quality cultivation of Korla fragrant pear and are expected to advance the efficient development of the fragrant pear industry, helping farmers improve both fruit quality and income.

1. Introduction

The Korla fragrant pear (Pyrus sinkiangensis Yu.) is a hybrid of the western pear and the Xinjiang pear, and it is the primary cultivated variety in the Xinjiang region. It is highly popular among consumers due to its unique flavor and rich nutritional value [1]. Natural grass cover is an important orchard management practice. By improving the orchard’s ecological environment [2], including increasing soil organic matter content, optimizing mineral nutrient structure, and enhancing water retention capacity [3], it positively influences fruit tree growth, development, and fruit quality. This creates favorable conditions for fruit tree cultivation, potentially affecting the quality formation of Korla fragrant pears at multiple levels.
Among the many factors that determine fruit quality, sugar plays a crucial role [4]. The accumulation of sugar components is a key part of this process [5,6,7]. Sugars in fruits not only contribute to sweetness but are also closely linked to taste, flavor, and nutritional composition [8,9,10]. Sugar accumulation is associated with fruit softening [11], aroma synthesis [12], and the content and bioavailability of nutrients such as vitamins and minerals. Ren et al. [13] demonstrated that orchard grass significantly increased the soluble solids, sugar, and vitamin C content of fruits while reducing acidity, thereby improving taste and nutritional value. Similarly, Yu et al. [14] found that natural grass treatment significantly enhanced anthocyanin levels in fruits and improved the sugar–acid ratio, leading to better overall fruit quality. In another study, Yu et al. [15] showed that interrow grass cutting and plowing in natural grass apple orchards improved soil microorganisms, enzyme activity, and nutrient availability, resulting in higher soluble sugar content, an improved sugar–acid ratio, and enhanced fruit quality. Collectively, these studies indicate that orchard grass promotes nutrient accumulation and fruit quality by improving soil conditions and the microenvironment.
The Korla fragrant pear is a climacteric fruit that accumulates nutrients and develops its unique taste and flavor during post-harvest storage. Studying this process is crucial for understanding the fruit’s quality and ripening characteristics [16]. Plants contain a variety of soluble sugars, including glucose, sucrose, fructose, and minor sugar components. The composition and proportion of these sugars significantly influence the fruit quality of the Korla fragrant pear [17]. Soluble sugars serve not only as carbon and energy sources for plant cells but also as signaling molecules that regulate plant growth, development, and stress responses [18]. Zhu et al. [19] demonstrated that during glucose metabolism, the phosphorylation of glucose and fructose is catalyzed by hexokinase and fructokinase, respectively, which facilitates their absorption and utilization. Carbohydrate synthesis and metabolism play a crucial role in fruit flavor development. Sucrose, the primary end product of plant photosynthesis, is broken down into glucose and fructose. For further utilization, fructose must first be phosphorylated by either hexokinase or fructokinase—a mechanism first proposed by Wang et al. [20]. Changes in enzyme activity are closely linked to sugar synthesis, transport, and accumulation in fruits, ultimately promoting sugar metabolism and storage.
The sugar content in fruits is influenced by many factors, with cultivation methods being one of the most critical [21]. This study investigates the effects of natural grass cover and clear tillage on fruit quality, highlighting the importance of machine learning in this process. During fruit development and storage, numerous complex physiological indicators come into play, including sugar composition, enzyme activity, and gene expression. The relationships between these indicators are intricate, making it difficult for traditional methods to fully uncover their interactions. Machine learning techniques, however, can process high-dimensional nonlinear data, identify hidden patterns, and accurately pinpoint key factors [22]. By analyzing specific kinase activity, these methods can build high-accuracy predictive models, clearly demonstrating the combined effects of various factors on fruit quality and providing a scientific basis for optimizing cultivation strategies. For example, Dong et al. [23] employed machine learning models (RF, GPR, and XGBoost) to predict the root length density (RLD) of sunflowers and coupled these models with SWAP models to simulate crop growth. The results showed that RF and XGBoost provided more accurate RLD predictions, and the machine learning approach outperformed traditional methods in crop growth simulation. Notably, the RF model proved particularly effective for leaf area index (LAI) simulation in high-salinity environments, significantly improving crop model performance. Although natural grass cultivation shows broad potential in Korla fragrant pear production, its impact on fruit quality remains incompletely understood. To address this, our study adopts the methodology of Liu et al. [24], using RF, KNN, and SVM as baseline models. KNN and SVM are well-established classification algorithms in machine learning, widely applied in various practical problems with strong performance. Additionally, we incorporate the PSO (particle swarm optimization) algorithm to efficiently optimize model parameters and assist in feature selection. This approach allows for preliminary identification of key factors affecting fruit sugar content, facilitating further exploration of how natural grass cultivation regulates fruit quality.
The purpose of this study was to systematically analyze the effects of natural grass cultivation on fruit development, post-harvest glucose metabolism, and the expression of key enzyme genes involved in fructose synthesis in Korla fragrant pears. This research aims to reveal the regulatory mechanism of natural grass cultivation on fruit quality and provide robust scientific support and technical guidance for promoting the high-quality and sustainable development of the Korla fragrant pear industry. Ultimately, this study seeks to help fruit farmers achieve both economic and ecological benefits.

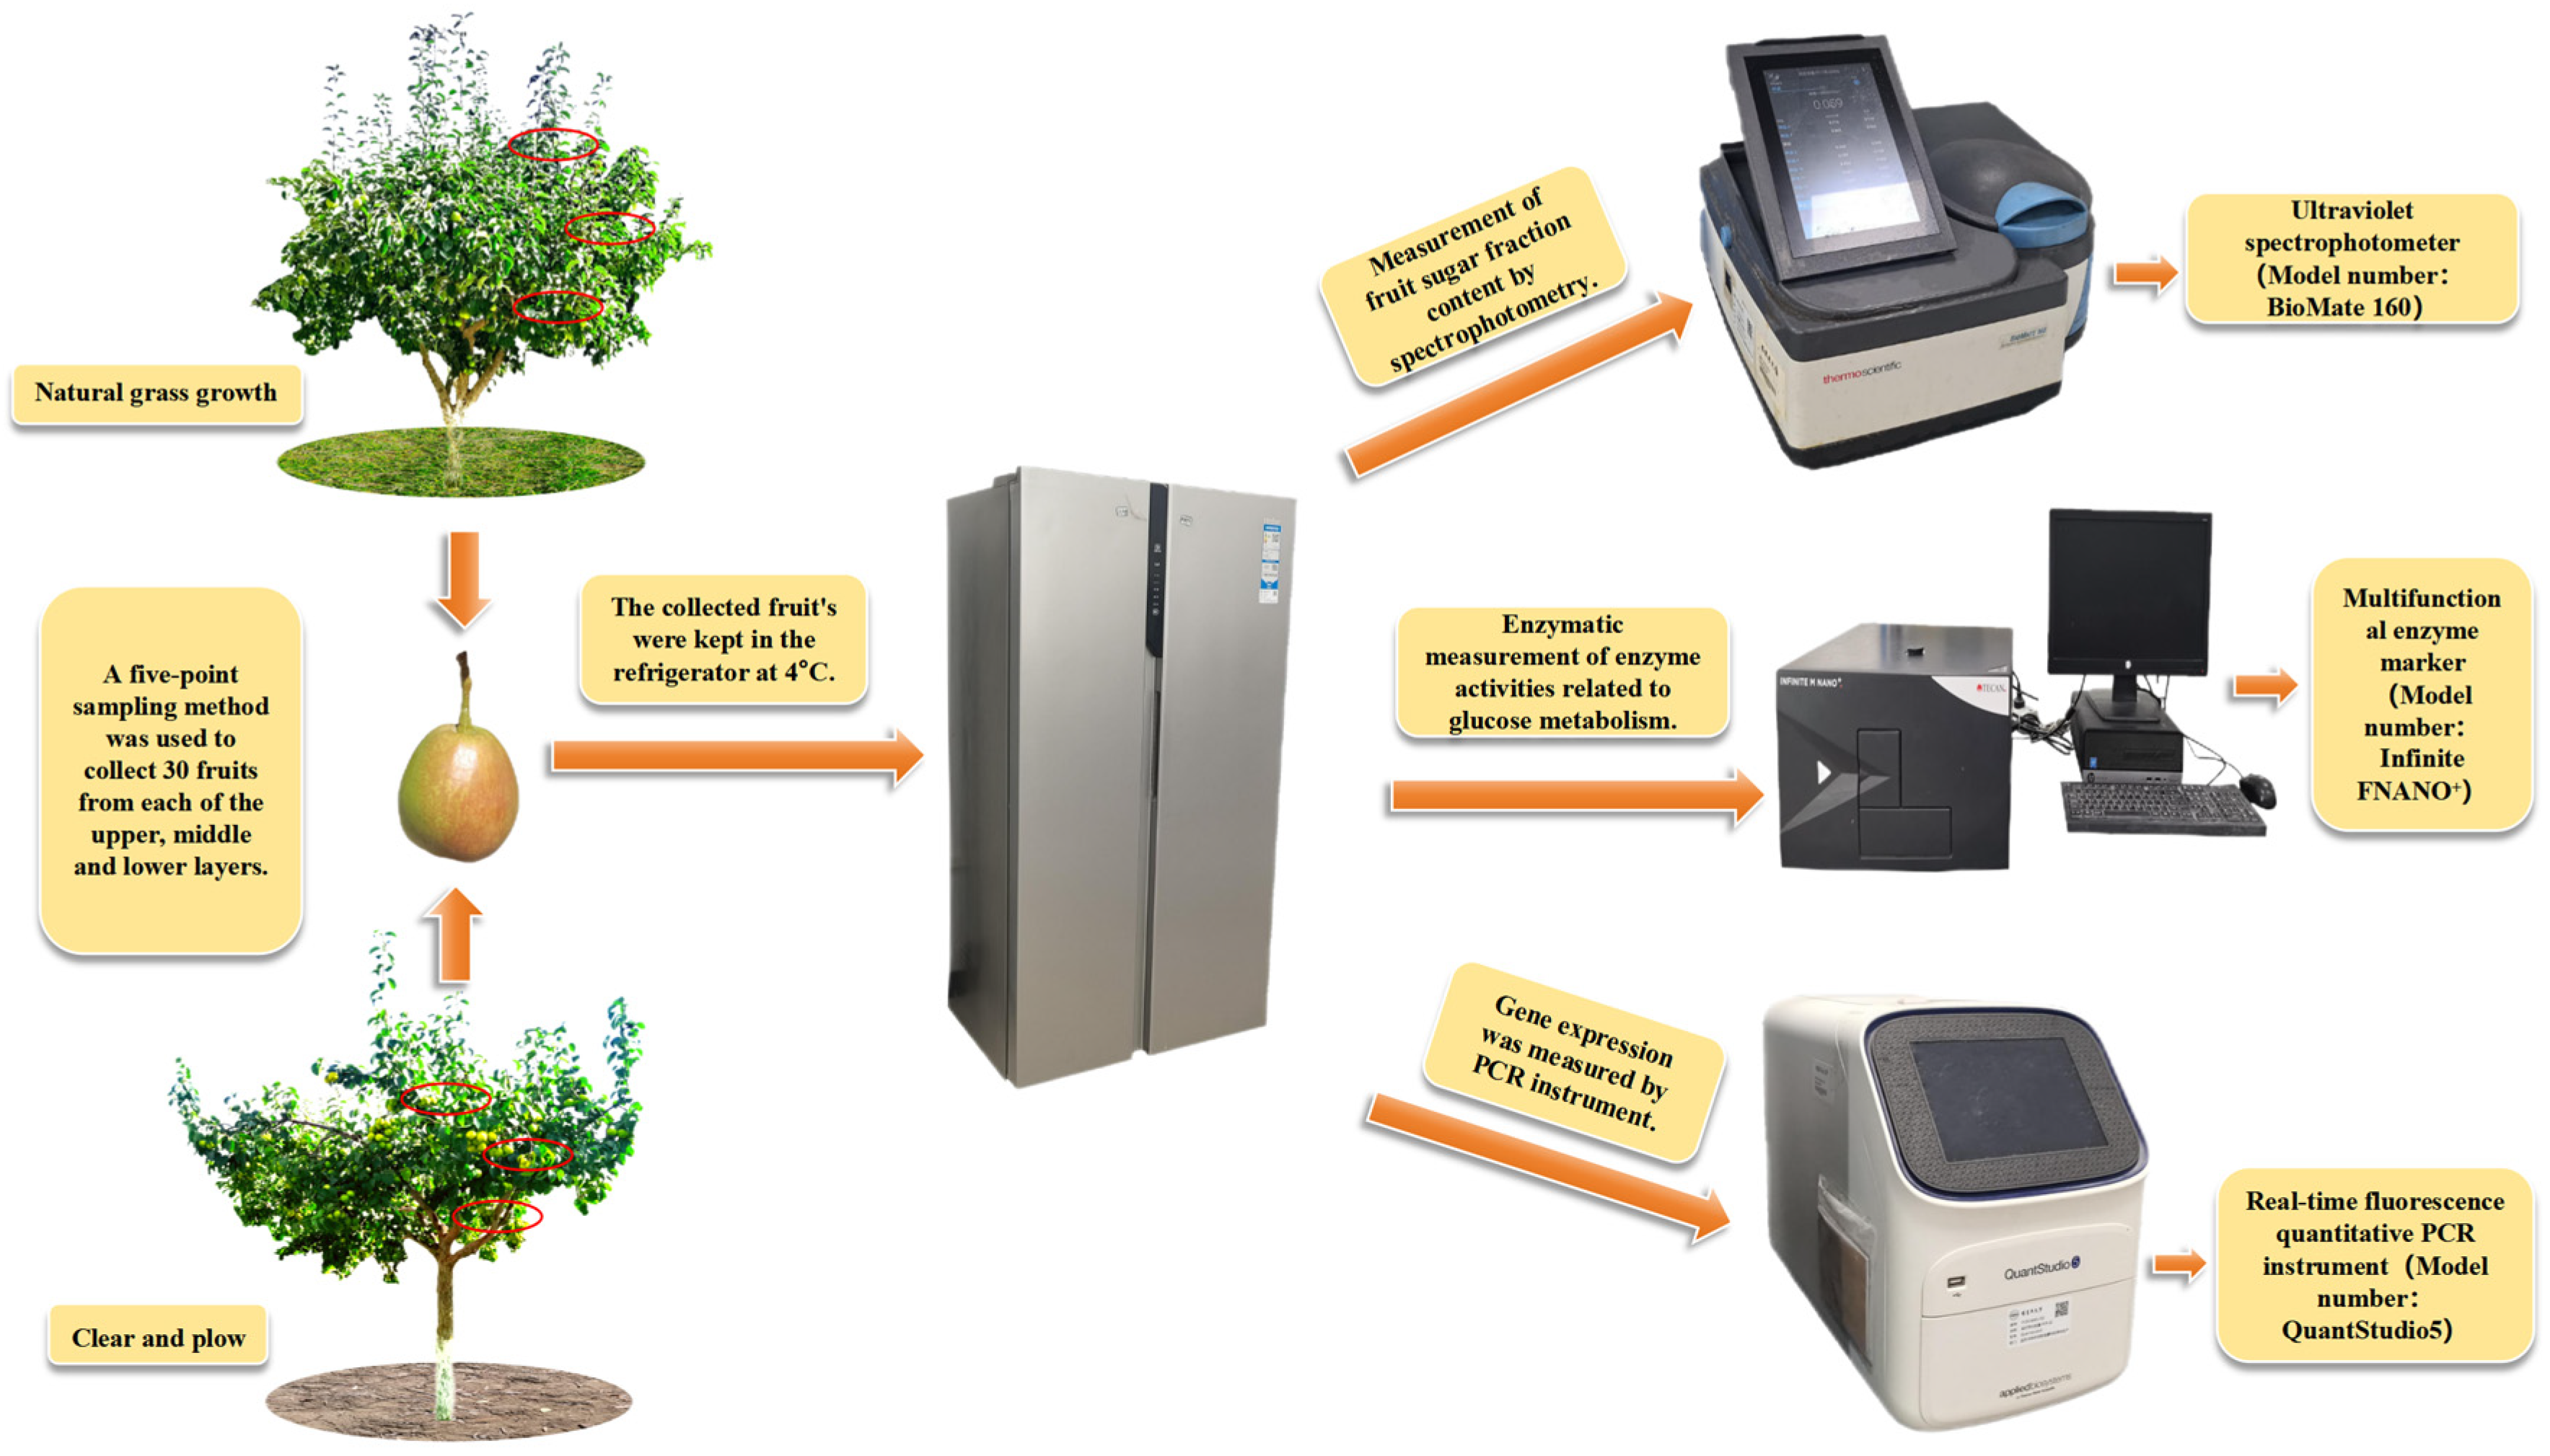
2. Materials and Methods

2.1. Test Situation

The materials for this experiment were collected from a natural grass pear orchard located on Jinyuan Road, Shituantuan, Alar City (coordinates: 40.65° N, 81.64° E; elevation: approximately 1010–1020 m above sea level). The region has a warm temperate extreme continental arid desert climate, with an average annual temperature of 12.3 °C, annual precipitation of 23.1 mm, and 2761.9 h of sunshine per year. The orchard contains 20-year-old Korla fragrant pear trees with small, sparse canopies, planted at a spacing of 1.5 × 4 m. Uniform water and fertilizer management practices were applied throughout the orchard. The grass-covered areas had been maintained for six years, with natural weeds such as shepherd’s purse, dandelion, field bindweed, and tares grass dominating the ground cover. The grass height did not exceed 45 cm and was cut 4–5 times annually. In the clear tillage areas, weed growth was controlled using a combination of cultivation and herbicide application. Specifically, 25% diuron wettable powder (500–800 g/mu diluted with water) was sprayed in May and June.

2.2. Experimental Design

At the experimental site, two distinct cultivation environments were set up: a grass cultivation mode and a clear tillage cultivation mode (control). During the fruit development period of Korla fragrant pear, spanning from May to September, fruit samples were collected every 30 days. For each sampling occasion, under both cultivation environments, pear trees with consistent growth were carefully selected, and a five-point sampling method was used to collect 30 fruit samples from the upper, middle, and lower levels of the trees. On September 5 (150 days after flowering), 300 fragrant pear fruits were collected from both the natural grass area and the clear plowing area. The peel and pulp were separated and stored at 4 °C. Additionally, 30 pear fruits were sampled after storage periods of 30, 60, 90, 120, 150, and 180 days. These samples were treated with liquid nitrogen and then stored at −80 °C for future use. After each storage period, 30 pear fruits were taken out, treated with liquid nitrogen, and then stored in a −80 °C freezer. This was completed to facilitate subsequent determination of post-harvest fruit sugar content, activity of sugar metabolism-related enzymes, and gene expression.
The concentrations of glucose, fructose, sucrose, and sorbitol in post-harvest fruits were determined using a UV spectrophotometer (Manufacturer: Thermo Fisher Scientific, USA Assembled in China, model: BioMate 160; kit from China Beijing Solarbio Technology Co., Ltd., Beijing, China). Additionally, a multifunctional enzyme marker (Manufacturer: Tecan of Switzerland, Made in Austria, model: Infinite F NANO+) was used to measure the activity of key enzymes, including fructokinase (FK), glyceraldehyde kinase (GK), phosphofructokinase (PFK), and hexokinase (HK). Gene expression levels were analyzed using a real-time fluorescent quantitative PCR instrument (Manufacturer: Thermo Fisher Scientific, Made in Singapore, model: QuantStudio 5) (Figure 1).

2.3. Determination of Sugar Content

2.3.1. Determination of Glucose Content

After separating the peel and pulp of the Korla pear, the glucose content in each part was measured using the glucose detection kit (article No.: BC6360) from Beijing Solarbio Technology Co., Ltd. Subsequent sugar content analyses were conducted using products from the same company (https://www.solarbio.com/).
(1)
Sample processing
Grind the homogenate according to a ratio of tissue mass (g) to distilled water volume (mL) ranging from 1:5 to 1:10. Subject the mixture to boiling in a water bath for 10 min, ensuring the container is tightly sealed to prevent evaporation. Allow the sample to cool to room temperature and then centrifuge at 8000 rpm for 10 min at 25 °C. Finally, collect the supernatant for further use.
(2)
Sample Determination
Take 20 µL of the supernatant and add it to 180 µL of the mixed reagent (a 1:1 v/v mixture of Reagent 2 and Reagent 3). Vortex the sample thoroughly and incubate at 37 °C for 15 min. Measure the absorbance at 505 nm and record the values as A_blank, A_standard, and A_sample (or A_determination, if preferred). Finally, calculate ΔA_sample (ΔA_measurement) and ΔA_standard. Glucose levels (including mol/g) = (V1) standard C * * delta A measurement/delta A standard/(W × V1/V2) = 2 × delta A determination standards/W/delta A.

2.3.2. Determination of Fructose Content

After the peel and pulp of Korla pear were separated, the fructose content in the pulp and peel was determined, respectively. Fructose detection kit (article No.: BC6360).
(1)
Sample Treatment
Accurately weigh approximately 0.05 g of the sample and grind it thoroughly. Add 0.5 mL of the extraction solution and incubate in a water bath at 80 °C for 10 min. Shake intermittently 3–5 times during this period. Allow the mixture to cool to room temperature and then centrifuge at 4000 rpm for 10 min. To the resulting supernatant, add 2 mg of the specified reagent and decolorize at 80 °C for 30 min. Subsequently, add another 0.5 mL of the extraction solution and centrifuge again at 4000 rpm for 10 min. Finally, collect the supernatant for analysis.
(2)
Sample Determination
Take 30 µL of the sample and add 210 µL of Reagent II and 60 µL of Reagent III. Vortex thoroughly and then incubate in an 80 °C water bath for 10 min. After cooling to room temperature, transfer 200 µL of the reaction mixture into a 96-well plate. Measure the absorbance at 480 nm and record the values as follows: A_blank (blank tube); A_standard (standard tube); A_sample (determination tube).
△A test = A test tube − A blank tube
△A standard = A standard tube − A blank tube
Fructose content (mg/g) = C standard × △A determination/△A standard × V sample total/W

2.3.3. Determination of Sucrose Content

After the peel and pulp of Korla fragrant pear were separated, the sucrose content in the pulp and peel was determined, respectively, using a sucrose detection kit (Item No.: BC6360).
(1)
Sample processing
Weigh 0.1 g sample, add 0.5 mL extract after grinding, and transfer to centrifuge tube; place in 80 °C water bath for 10 min, shake for 3–5 times, cool down, 4000 r, and centrifuge at 25 °C for 10 min; take supernatant, add 2 mg reagent, decolorize at 80 °C for 30 min, and then add 0.5 mL extract, 4000 r. Centrifuge at 25 °C for 10 min and take the supernatant for determination.
(2)
Sample Determination
Take 25 µL of sample, add 15 µL of Reagent II, and incubate at 100 °C for 5 min. Then, add 175 µL of Reagent III and 50 µL of Reagent IV, mix thoroughly, and immerse in a boiling water bath for 10 min. After cooling, transfer 200 µL to a 96-well microplate and measure absorbance at 480 nm, recording values as A1 (blank), A2 (standard), and A3 (sample). Perform calculations using the following absorbance readings:
Sucrose content (mg/g) = (CStandard*V1) × (A3 − A1)/(A2 − A1)/(W × V1/V2) = (A3 − A1)/(A2 − A1)/W

2.3.4. Determination of Sorbitol Content

After the peel and pulp of Korla fragrant pear were separated, the content of sorbitol in the pulp and peel was determined, respectively, using a sorbitol detection kit (article No.: BC2520).
(1)
Sample processing
Weigh 0.1 g sample, add 1 mL distilled water, and grind it into homogenate; boil it in a boiling water bath for 10 min (cover tightly to prevent loss), cool it to room temperature, centrifuge at room temperature at 8000 r for 10 min, and take the supernatant to be measured.
(2)
Sample Determination
Take 230 µL of the sample, add 35 µL of Reagent I and 35 µL of Reagent II, and then vortex thoroughly and incubate at room temperature for 15 min. Centrifuge the mixture at 8000 r for 10 min at room temperature. Transfer 200 µL of the supernatant to a microplate and measure the absorbance at 655 nm, recording the values as A_standard, A_sample, and A_blank. Calculate ΔA_sample = A_sample − A_blank and ΔA_standard = A_standard − A_blank for further analysis.
The standard curve is established according to the concentration of the standard tube (y, mg/mL) and the absorbance A (x, △A standard). According to the standard curve, the A determination (x, △A determination) is inserted into the formula to calculate the sample concentration (y, mg/mL).
Calculation: Sorbitol content (mg/g) = y × V1/(W × V1/V2) = y/W

2.4. Determination of Enzyme Activities Related to Sugar Metabolism

Fructokinase (FK) (article No.: BC0535), glyceraldehyde kinase (GK) (article No.: BC5905), phosphofructokinase (PFK) (article No.: BC0535), and hexokinase (HK) (article No.: BC0745) kits from Beijing Solarbio Technology Co., LTD were used for measurement (https://www.solarbio.com/).
(1)
Crude enzyme solution extraction
Weigh 0.1 g of pear flesh and peel tissue, add 1 mL of PBS buffer, and homogenize the mixture in an ice bath. Centrifuge at 8000 rpm and 4 °C for 10 min and then collect the supernatant and keep it on ice for subsequent analysis. Preheat the microplate reader for at least 30 min and set the wavelength to 340 nm. Pre-warm the working solution at 37 °C for 10 min before use.
(2)
Sample Determination
Combine 10 µL sample, 10 µL Reagent III, 10 µL Reagent IV, and 170 µL working fluid in a microquartz cuvette or 96-well UV plate. Immediately mix and measure initial absorbance (A1) at 340 nm. Incubate at 37 °C for 10 min (temperature-controlled) and then measure final absorbance (A2) at 340 nm. Calculate ΔA using the following formula: ΔA = A1 − A2.

2.5. Extraction of RNA from the Pulp and Peel of Korla Fragrant Pears and Digestion of DNA

In this study, total RNA was extracted from the pulp and peel of Korla pears at different developmental and storage stages using the Polysaccharide Polyphenol Plant RNA Extraction Kit (Nanjing Vazyme Biotechnology Co., Ltd., Location: Nanjing, Jiangsu, China). The fruit samples included five developmental stages and six storage stages, with three biological replicates per stage. RNA was isolated separately from the pulp and peel. The extracted RNA was then reverse-transcribed into complementary DNA (cDNA), which was stored at −20 °C for subsequent quantitative real-time PCR (qPCR) analysis. For qPCR, five technical replicates were performed for each of the five target genes. The primer sequence is shown in the Table 1. (https://www.vazyme.com/about.html, accessed on 28 February 2025).
Primer sequence design was obtained through the “Primer Online Design System” of Sangon Bioengineering (Shanghai) Co., Ltd, Location: Shanghai, China. (https://store.sangon.com/, accessed on 28 February 2025).

2.6. qRT-PCR

CR was performed using the Roche Light Cycler 480 II quantitative PCR instrument and Roche Light Cycler 480 SYBR Green I Master fluorescent dye. GAPDH was used as the internal reference gene. The relative expression levels were calculated using the 2−∆CT method [25].

2.7. Fuzzy Comprehensive Evaluation Method

(1)
Calculate the membership function.
The dimensionless processing of fruit quality data was carried out by using the membership function method of fuzzy mathematics.
The following is Formula (1) of an equation:
x i   j = X i   j X j m i n X j m a x X j m i n
In the formula, x i   j   represents the membership value of the ith indicator, X i   j   represents the measured value of the ith indicator j, and X j m a x and X j m i n   represent the maximum and minimum values of the indicator, respectively.
(2)
Calculate the weight using the mutation coefficient method (analysis of the degree of correlation with gray theory).
(3)
Conduct a comprehensive evaluation of fruit quality based on the weighted coefficients, using Formula (2).
The following is example 2 of an equation:
D = 1 j X ( i   j ) ω ( i   j )

2.8. Modeling Algorithm

This study employed three classification algorithms—random forest (RF), support vector machine (SVM), and K-nearest neighbors (KNNs)—for model construction, with hyperparameter optimization and feature selection performed using the particle swarm optimization (PSO) algorithm.
(1) Random forest [26]: An ensemble-based supervised learning algorithm primarily used for classification and regression tasks. It enhances model accuracy and stability by aggregating predictions from multiple decision trees. Classification is achieved by a majority vote of the constituent tree, and the output of a single tree is expressed as Formula (3):
h t x = m a j o r i t y   v o t e   o r   a v e r a g e y i l e a f x
where x is the input feature vector; l e a f x is the set of training samples in the leaf node where sample x is located; y i is the label of the i sample.
The final prediction result is Formula (4):
H x = m o d e h t x t = 1 T
The m o d e · function is the mode function, which selects the category that appears most frequently in the set (used for classification tasks); x represents the number of trees; h t x is the prediction result of the x decision tree for the input x (the output of a single tree); x is the input feature vector.
(2) Support vector machine [27]: A supervised learning algorithm based on statistical learning theory, primarily employed for classification and regression tasks. Its core principle involves identifying an optimal hyperplane that separates data of different classes, while maximizing the classification margin. Classification is achieved by solving the optimization problem defined in Equation (5), while nonlinear problems are addressed using the kernel function specified in Equation (6). In this study, a Gaussian function was adopted as the kernel function.
min w , b 1 2 w 2 s u b j e c t   t o   y i w T x i + b 1 , i N +
Among them, w is the weight vector, which is the normal vector of the hyperplane and determines the direction of the decision boundary; b is the bias term, which is the offset of the hyperplane relative to the origin; x i is the feature vector of the i sample; y i is the label of the i sample, and y i ϵ 1 , 1 ; w T x i + b is the sample decision function value, which is the raw score output by the hyperplane; y i · is the functional margin, requiring that the functional margin of all samples be greater than or equal to 1.
K x i , x j = ϕ x i T ϕ x j
The kernel function K x i , y i is used to directly compute the similarity between two samples in an implicit high-dimensional space without explicitly calculating ϕ x ; ϕ x is the feature mapping function, which maps the original feature x to a higher (even infinite) dimensional space, making the data linearly separable; ϕ x i T ϕ x j is the inner product, which serves to measure the similarity of the feature vectors after mapping; x i , y i are the input samples.
(3) K-nearest neighbors [28]: A simple yet effective supervised learning algorithm widely used for both classification and regression tasks. The algorithm operates by identifying the k closest training samples (neighbors) to the target prediction sample and determining the output based on the labels or values of these neighbors. Classification is performed according to the voting rule specified in Equation (7), with the number of neighbors (k) and distance metric serving as the key hyperparameters.
H x = m o d e y i | x i N k x
H x represents the predicted category of the sample; m o d e · is the mode function, which can reflect the category that appears most frequently in the returned set; N k x is the set of the K-nearest neighbors of x ; x i is the ith sample in the training set; y i is the corresponding category label for x i .
(4) Particle swarm optimization [29]: A population-based optimization algorithm inspired by the collective foraging behavior of bird flocks. This metaheuristic technique finds optimal solutions through cooperation and information sharing among individuals in the population. The algorithm iteratively updates particle positions (Equation (8)) and velocities (Equation (9)) to optimize the hyperparameter combinations of the aforementioned machine learning algorithms.
p i t + 1 = p i t + v i t + 1
Among them, p i t + 1 is the new position of particle i at time t + 1; p i t is the current position of particle i at time t; v i t + 1 is the velocity of particle i at time t + 1.
v i t + 1 = ω v i t + c 1 r 1 p b e s t , i p i t + c 2 r 2 g b e s t p i t
where v i t + 1 is the new velocity of particle i at time t + 1, determining the direction and step size of the particle’s next movement; ω is the inertia weight, controlling the influence of historical velocity; v i t is the current velocity of particle i at time t; c 1   a n d   c 2 are the learning factors, adjusting the weights of individual and social experiences; r 1   a n d   r 2 are random numbers, introducing randomness to avoid local optima; p b e s t , i is the individual historical best position of particle i, the best solution found by the particle during its own search process; g b e s t is the global historical best position, the best solution among all particles; p i t is the current position of particle i at time t.
The particle swarm optimization algorithm was employed to simultaneously optimize hyperparameters for RF, SVM, and KNN algorithms while facilitating feature selection. The parameter optimization scheme is detailed in Table 2. The feature selection mechanism incorporates two key components: feature mask encoding (Equation (10)) and the fitness function (Equation (11)).
T is the number of decision trees in the RF algorithm; d m a x is the maximum depth in the RF algorithm; m is the number of features considered by each tree in the RF algorithm; C is the penalty coefficient in the SVM algorithm; γ is the kernel parameter in the SVM algorithm; k is the number of neighbors in the KNN algorithm; m e t r i c is the distance metric in the KNN algorithm.
p i j = 1   i f   S i g m o i d ϑ i j > 0.5 0                                               o t h e r w i s e , S i g m o i d ϑ i j = 1 1 + e ϑ i j
p i j is a binary feature selection flag, where p i j   = 1 indicates the selection of the j feature, and 0 indicates non-selection; ϑ i j is the velocity value of particle i for the j feature; S i g m o i d ϑ i j is the Sigmoid function, which maps the velocity ϑ i j to the (0,1) interval, representing the selection probability.
f p = α · E r r o r H p + 1 α · P 0 D
Among them, f p is the fitness value; p is the binary feature mask vector; α is the weight coefficient, and 0 ≤ α ≤ 1; E r r o r H p is the model’s classification error; P 0 is the L0 norm, the number of non-zero elements in the vector p (i.e., the number of selected features); D is the total number of original features.

2.9. Data Analysis Methods

In this study, Analysis of Variance (ANOVA) was performed on the data using Excel 2010 to compare mean differences between different groups. When the results of ANOVA are significant, the least significant difference method is further used for multiple comparisons. In addition, a membership function analysis was performed to evaluate the ambiguity and uncertainty of the data. Relevant images were drawn using Origin 2022. R language was used for correlation analysis. Pearson correlation coefficient was used to analyze the linear correlation between variables, and the correlation relationship image was drawn. Matlab R2021b was used to build a mathematical model to fit and predict the experimental data.

3. Results

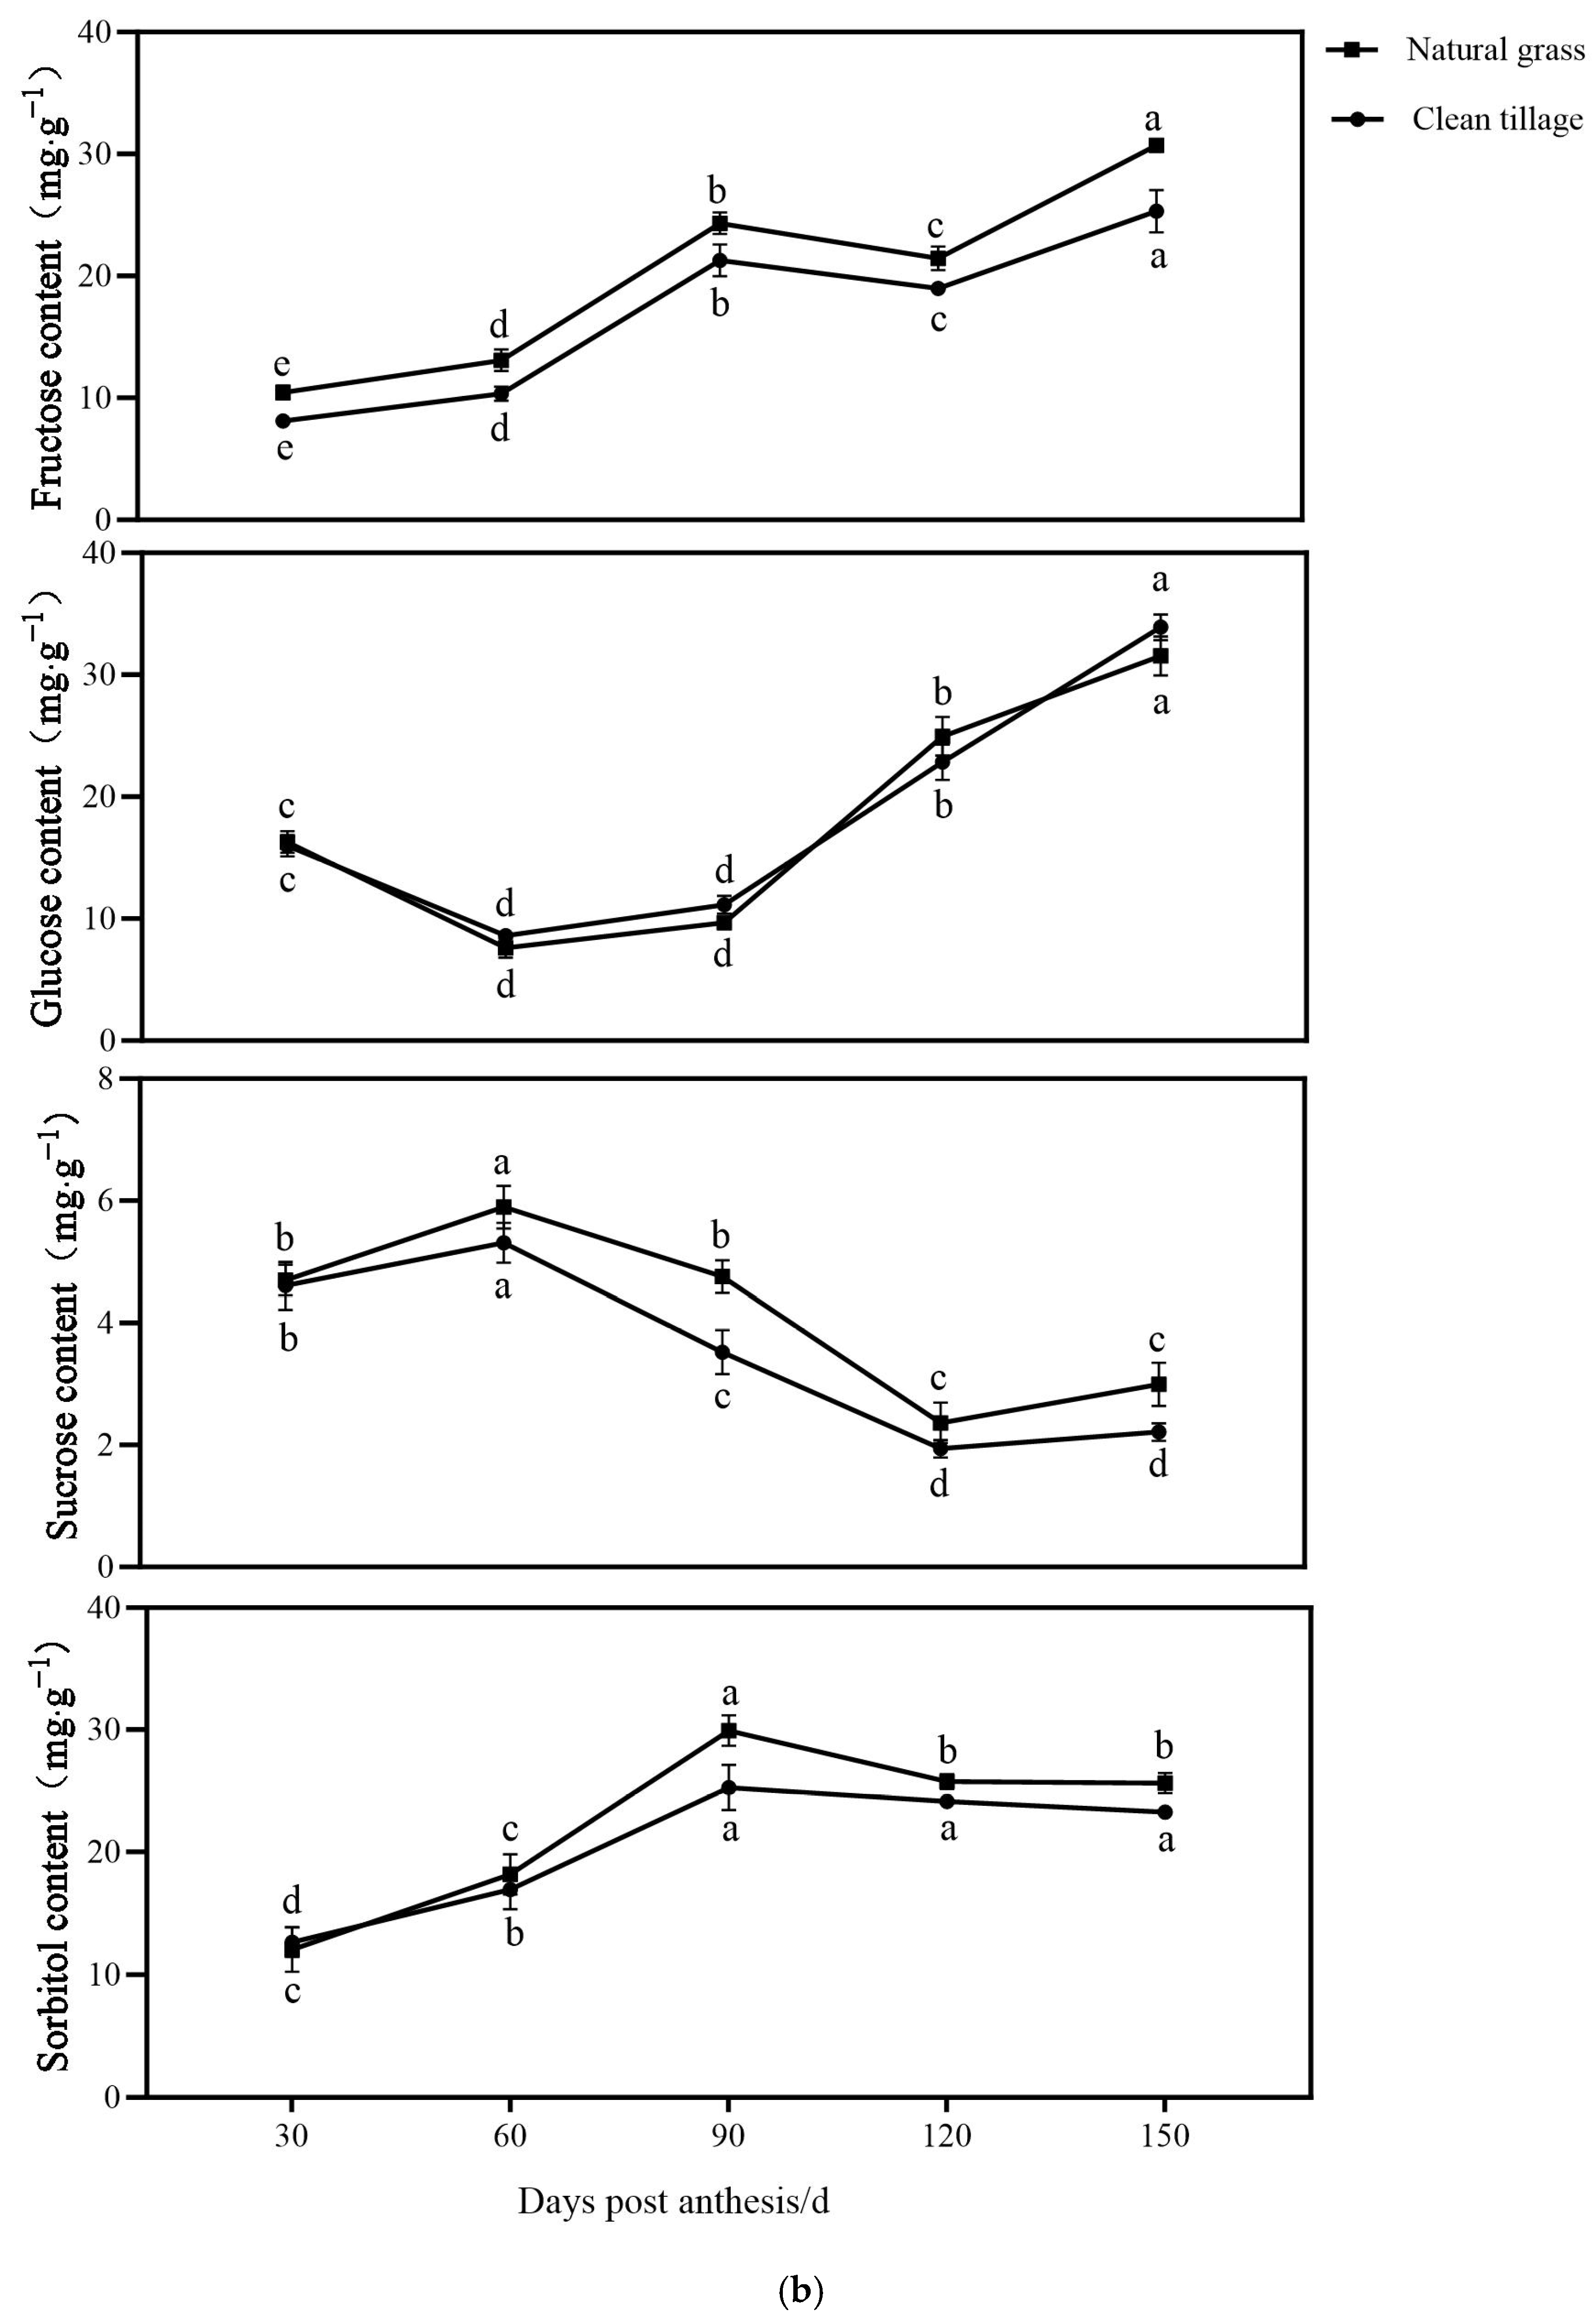
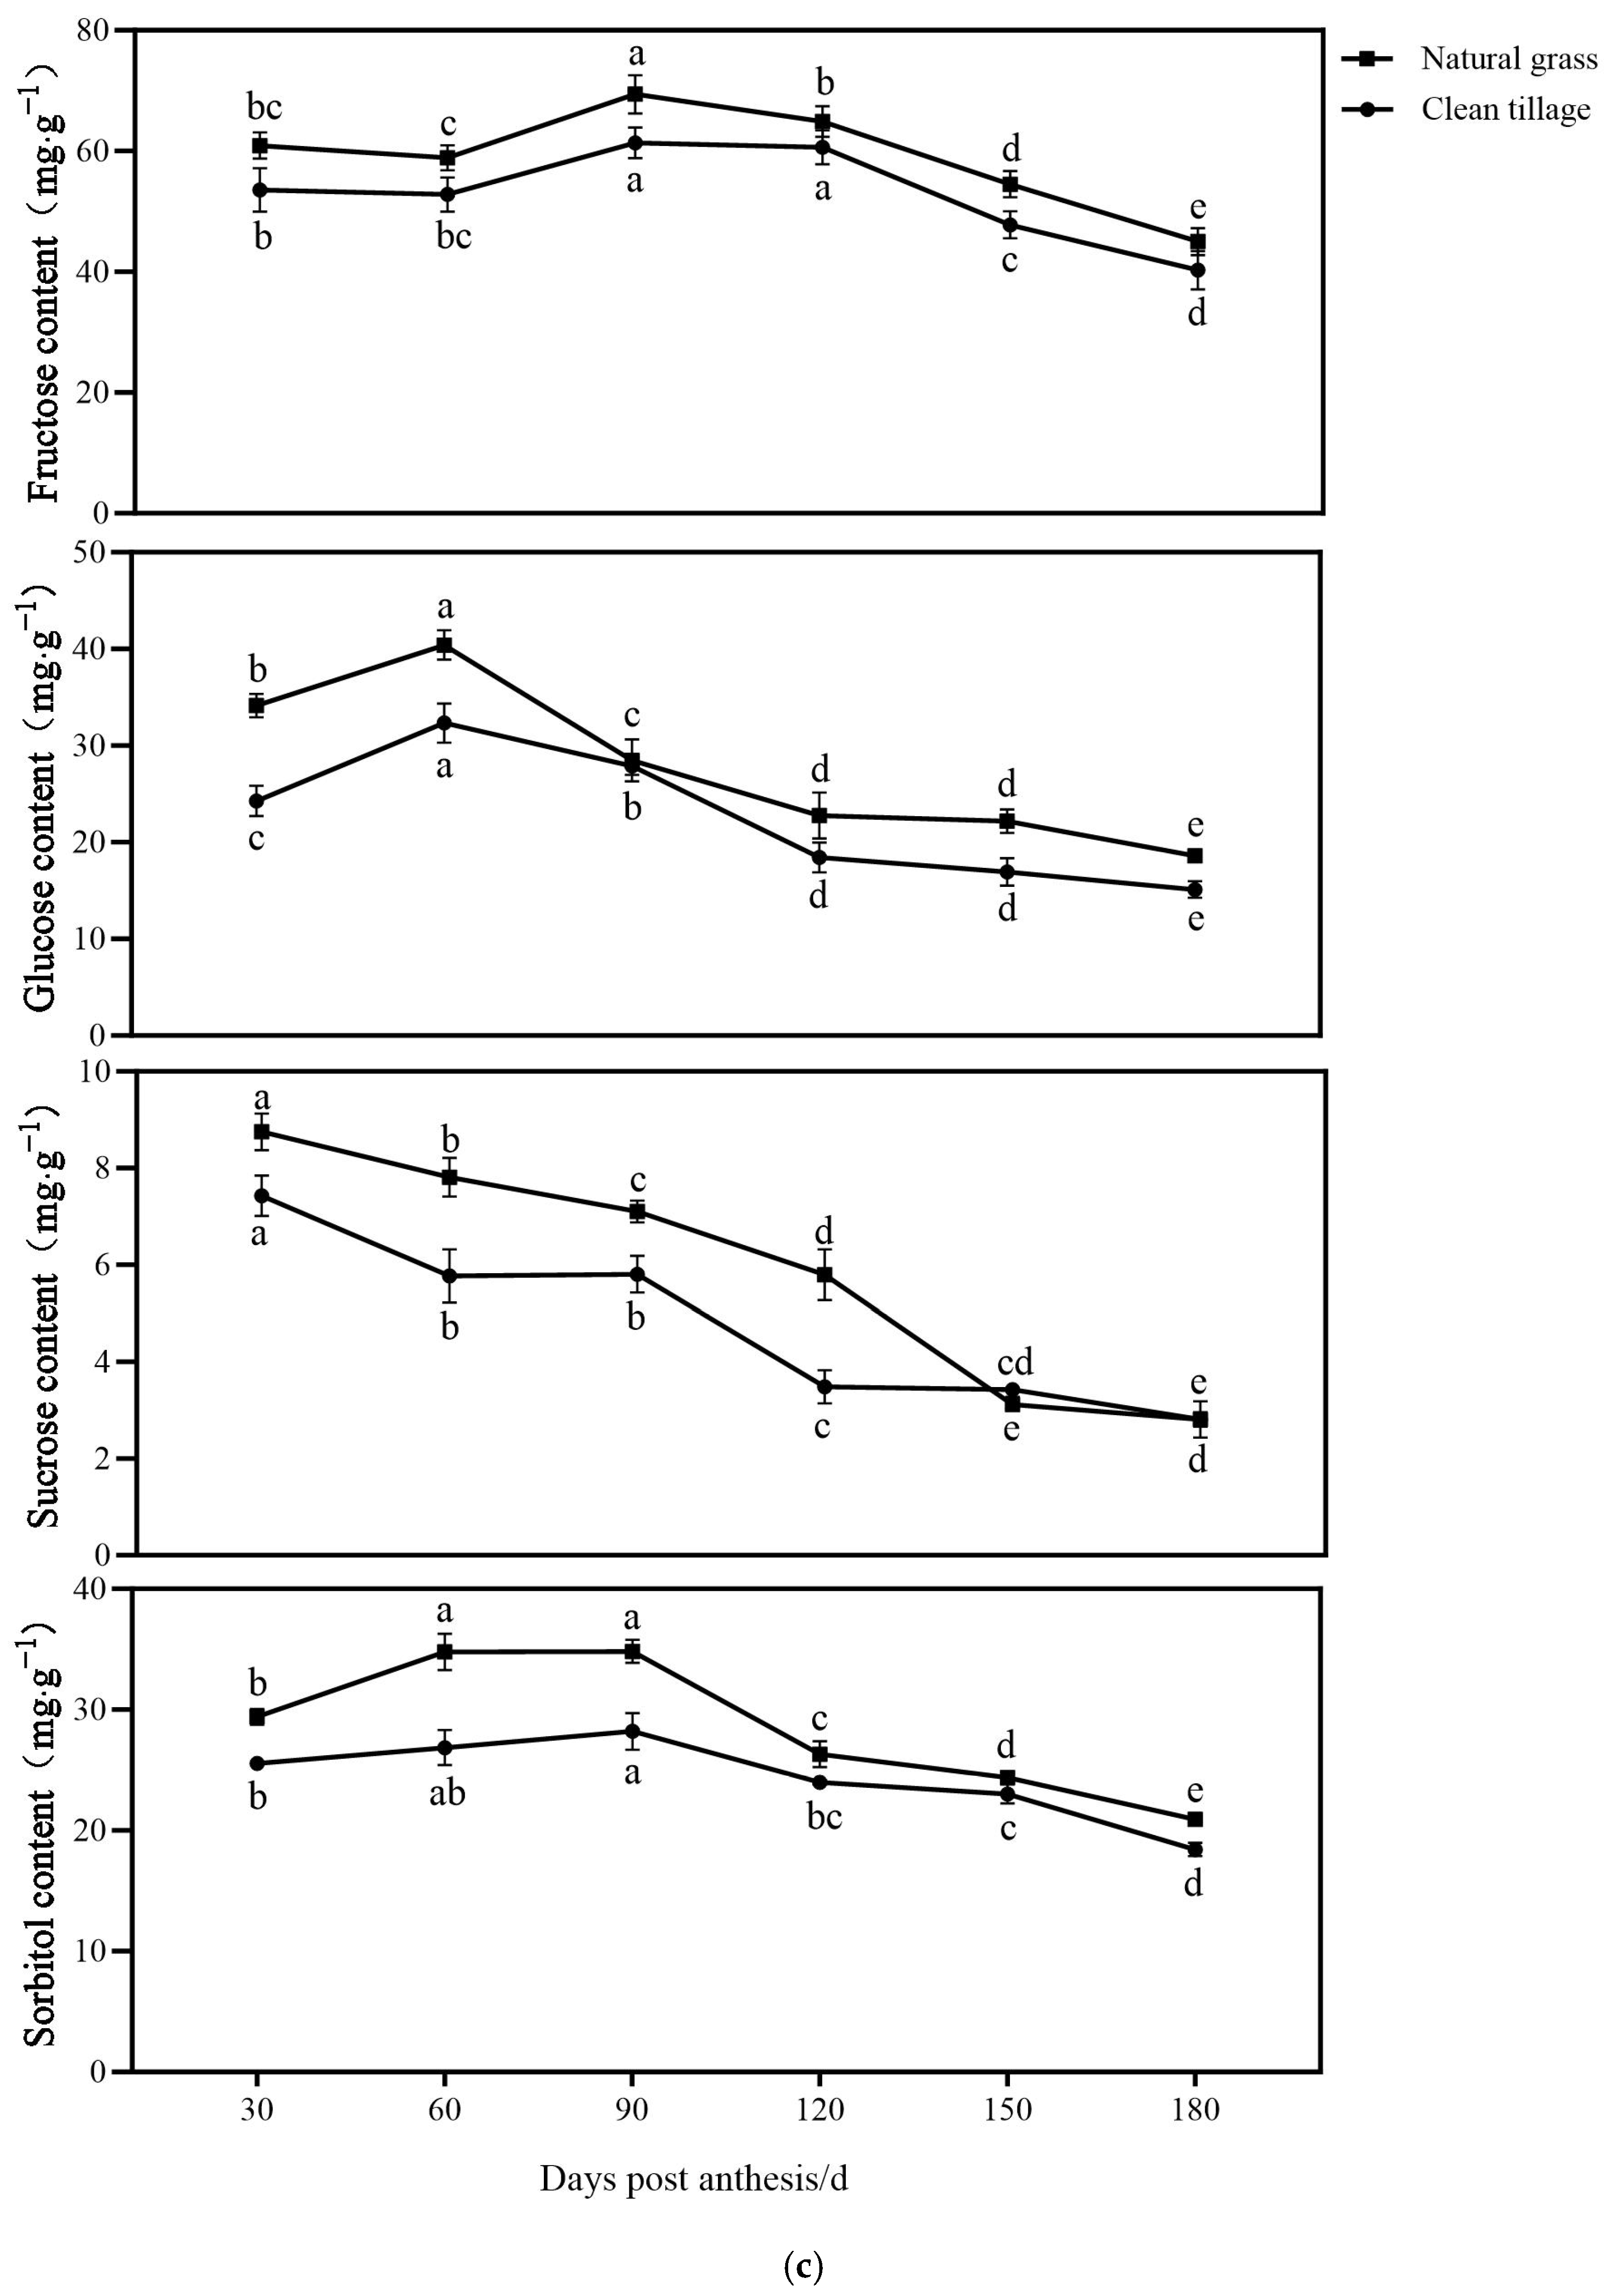
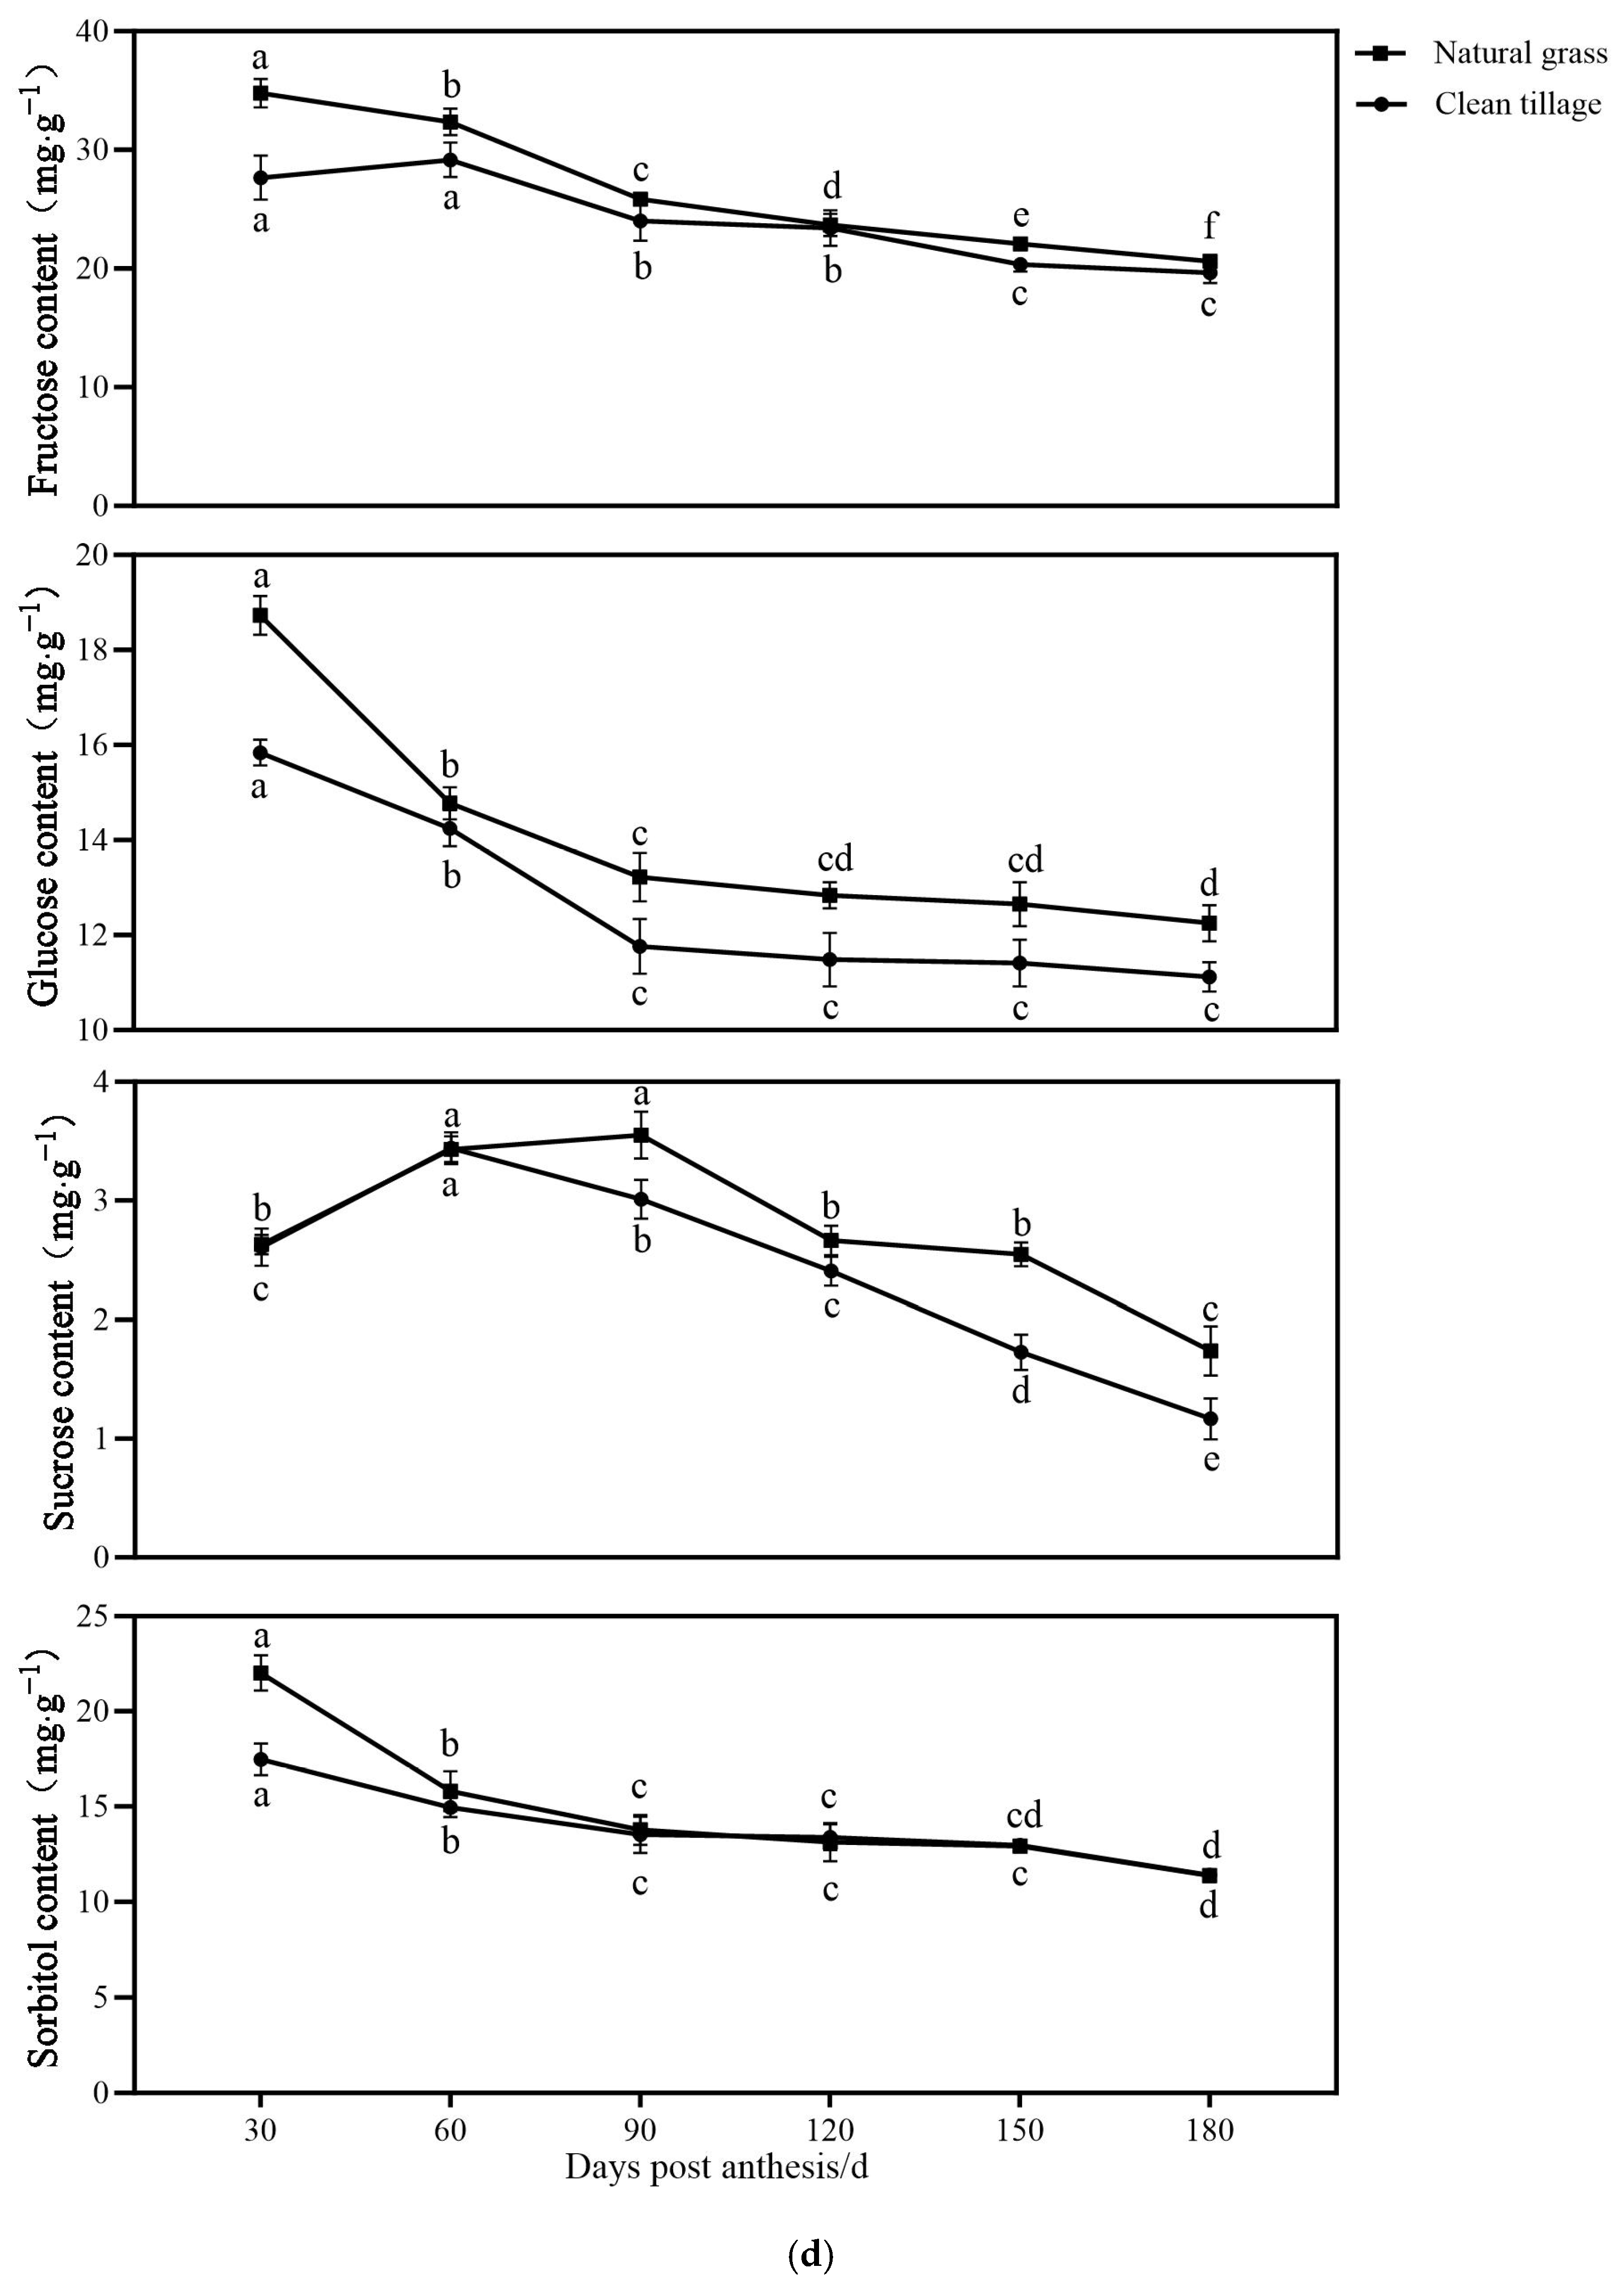
3.1. The Changes in the Fresh Weight of Flesh and Peel Sugar Components of Korla Fragrant Pears During Fruit Development and Storage Under Two Cultivation Patterns

As shown in Figure 2a, the fructose content in the natural grass area of Korla pear was significantly higher than that in the clear cultivation area at 120 and 150 days after flowering by 9.09 mg·g−1 and 12.59 mg·g−1, respectively. Secondly, from 90 to 150 days after anthesis, the glucose content in the flesh of the natural grass area was significantly increased by 6.28 mg·g−1, 12.24 mg·g−1, and 9.65 mg·g−1 compared with that of the clear cultivation area, respectively. However, there was no significant difference between sucrose and sorbitol.
As shown in Figure 2b, fructose content in Korla pear peel was significantly higher in the natural grass area than in the clear tillage area, increased by 2.12 mg·g−1 at 60 days after flowering, 3.71 mg·g−1 at 90 days after flowering, and 5.47 mg·g−1 at 150 days after flowering. There was no significant difference in glucose, sucrose, and sorbitol between the two regions, and the content of sucrose was the lowest.
As shown in Figure 2c, fructose content in pulp was significantly higher than other sugars in all periods and was significantly higher in the natural grass area than in the clear tillage area at 30 days of storage, with a difference of 8.92 mg·g−1. The glucose content increased first and then decreased, and it reached the maximum value after 60 days of storage. The glucose content in natural and cultivated grass areas was 40.04 mg·g−1 and 32.22 mg·g−1, respectively. There was no significant difference in sucrose content in all periods. The content of sorbitol in the natural grass area was significantly higher than that in the clear tillage area at 150 and 180 days of storage, 1.32 mg·g−1 and 2.66 mg·g−1, respectively.
As shown in Figure 2d, the fructose content in the peel of Korla fragrant pear is higher than other sugars during storage. The fructose content reached the highest value at 30 days after harvest (35.45 mg·g−1). The fructose content reached the highest value of 28.40 mg·g−1 at 60 days after harvest. The content of glucose and sorbitol decreased, while the content of sucrose increased first and then decreased, and there was no significant difference.

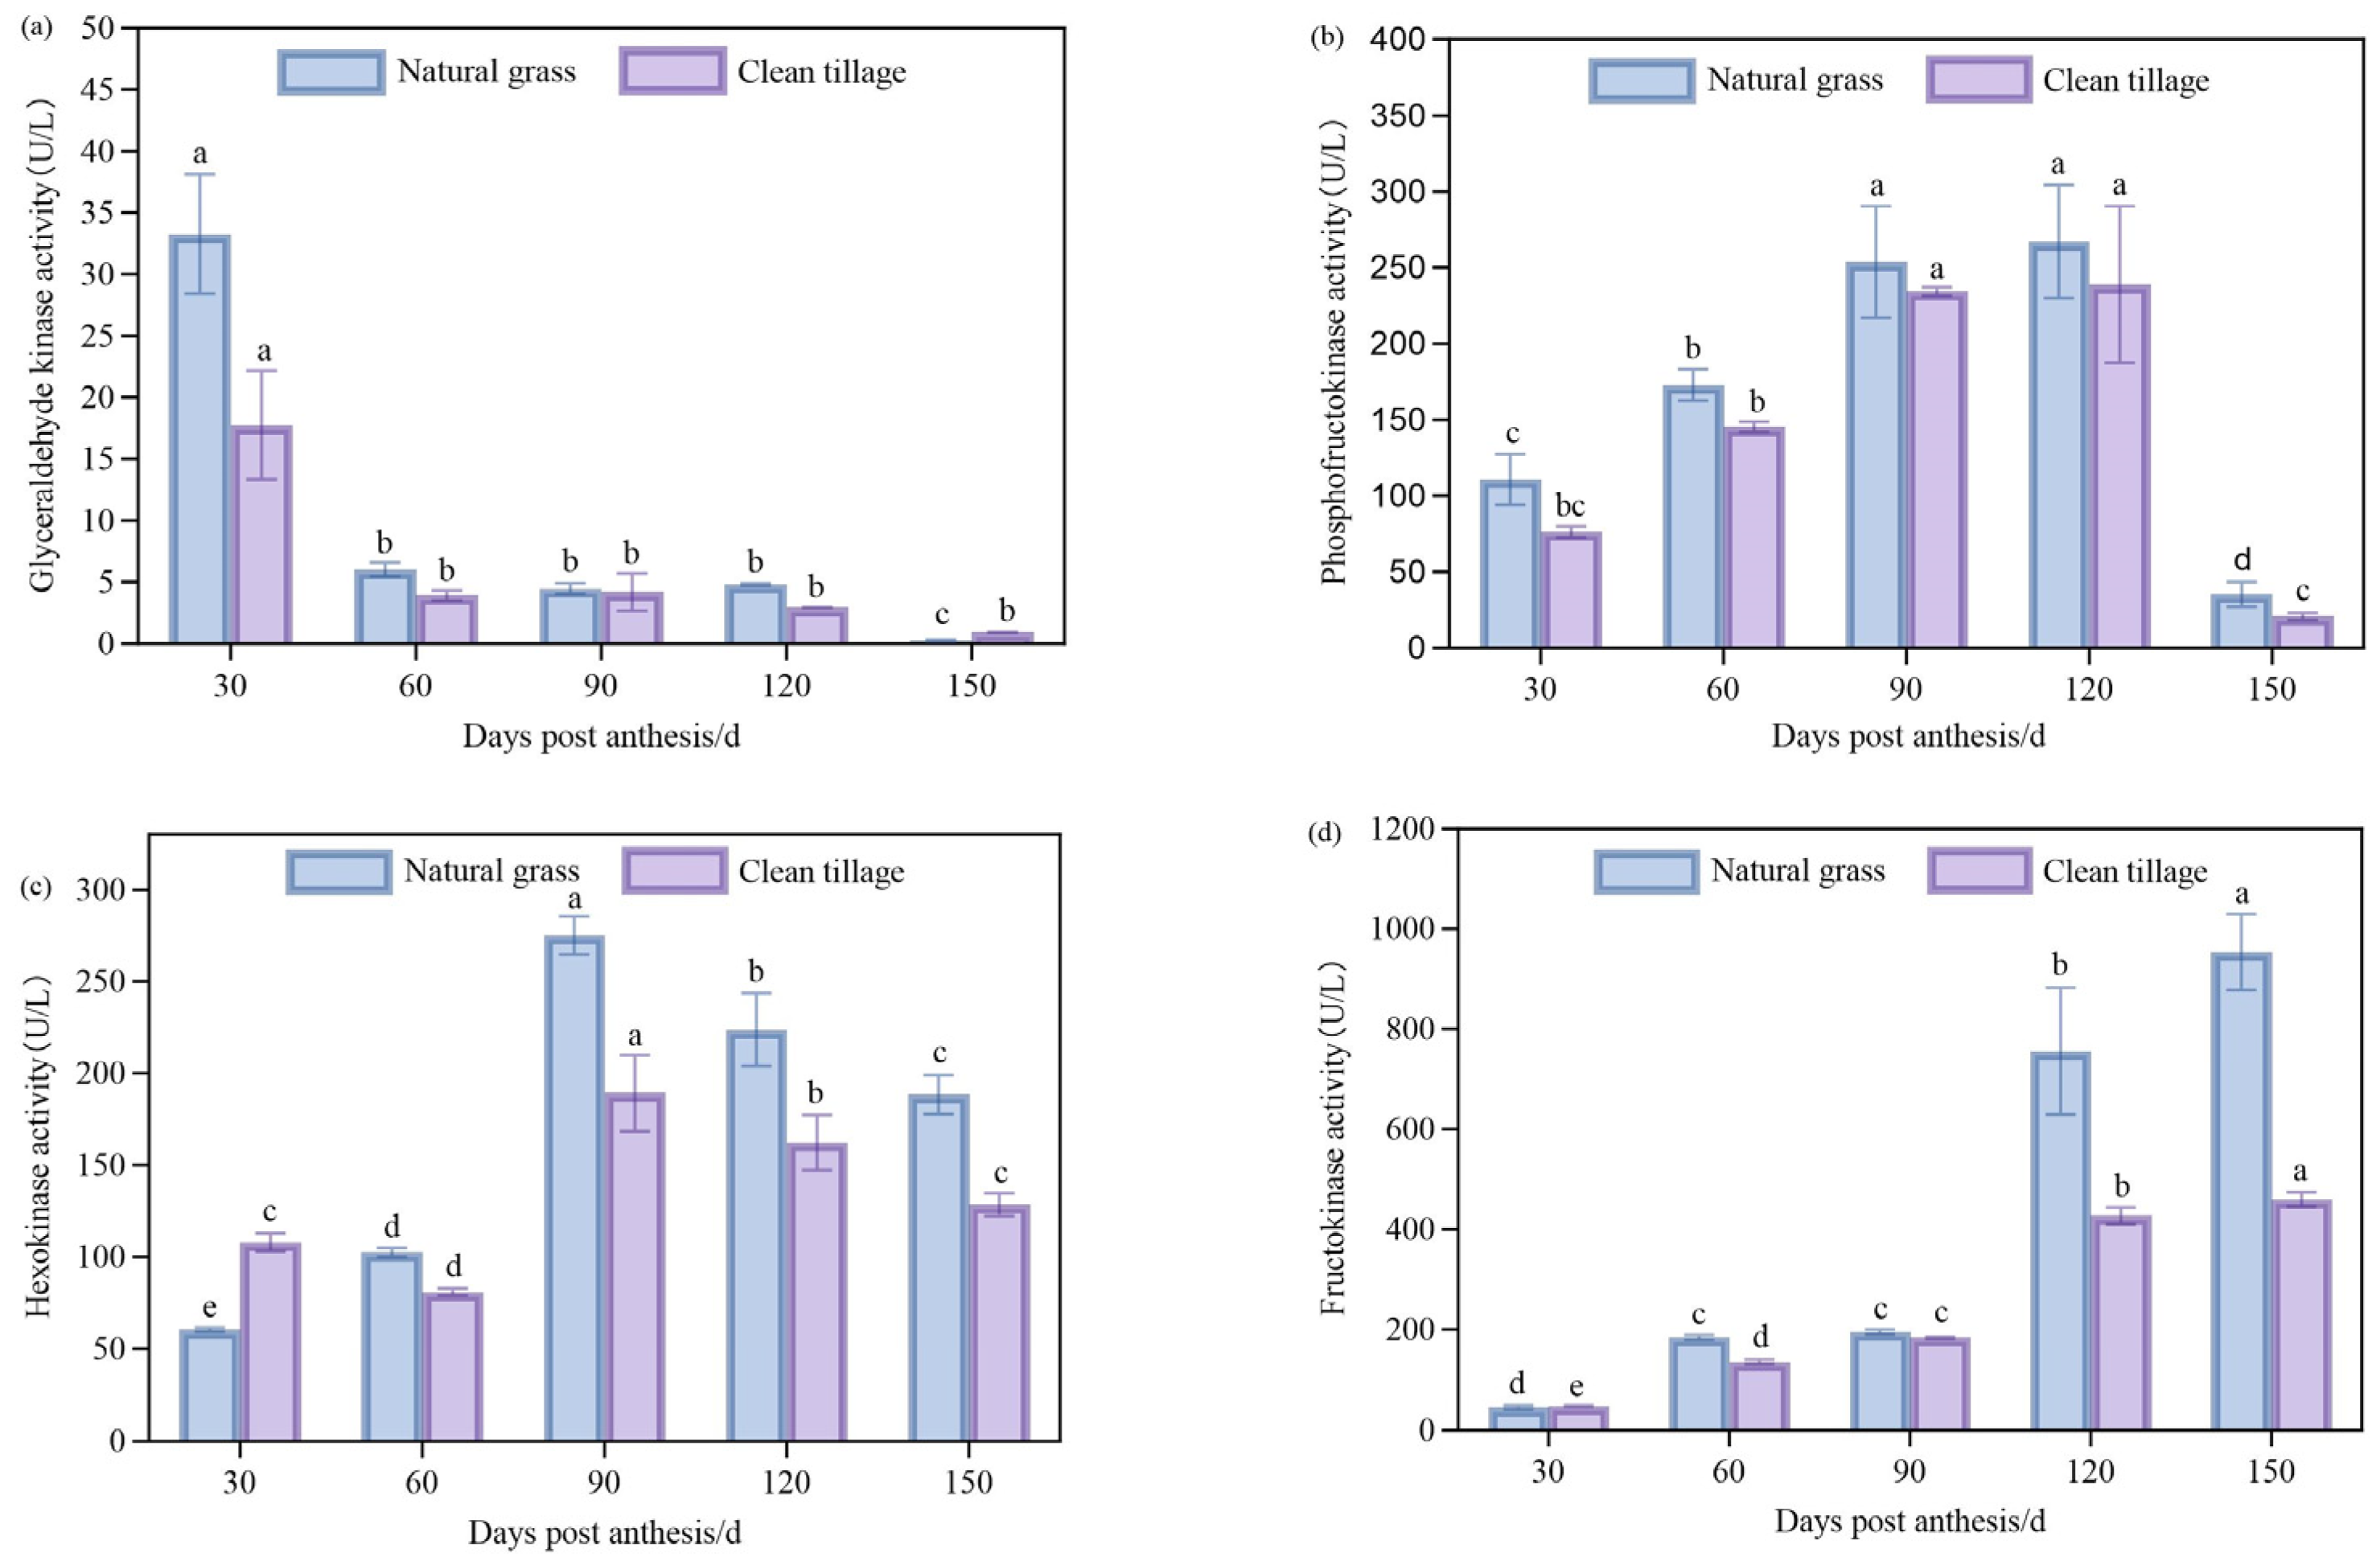
3.2. The Changes in the Enzyme Activities of the Pulp of Korla Fragrant Pears During Fruit Development Under Two Cultivation Modes

GK activity in the flesh of Korla fragrant pear (Figure 3a) was generally higher in the natural grass area than in the clear cultivation area from 30 to 120 days after flowering, but there was no significant difference. At 150 days after flowering, the GK activity in the natural grass area was significantly lower than that in the clear cultivation area, and the activity decreased by 0.67 U/L. The PFK activity of flesh (Figure 3b) was higher in the natural grass area than in the clear tillage area at all development stages, especially at 30 days and 150 days after flowering, PFK activity in the natural grass area was significantly higher than that in the clear tillage area, which was 34.48 U/L and 14.68 U/L, respectively. The HK activity of flesh is shown in Figure 3c. At 30 days after flowering, the HK activity of flesh in the natural grassed area was significantly lower than that in the clear plowing area (47.72 U/L lower). From 60 to 150 days after flowering, the HK activity in the natural grass area was higher than that in the clear cultivation area, but there was no significant difference between the two. The FK activity of flesh is shown in Figure 3d. At 120 and 150 days after anthesis, the FK activity of flesh in the natural grass area was higher than that in the clear cultivation area, which was 329.62 U/L and 494.50 U/L, respectively.

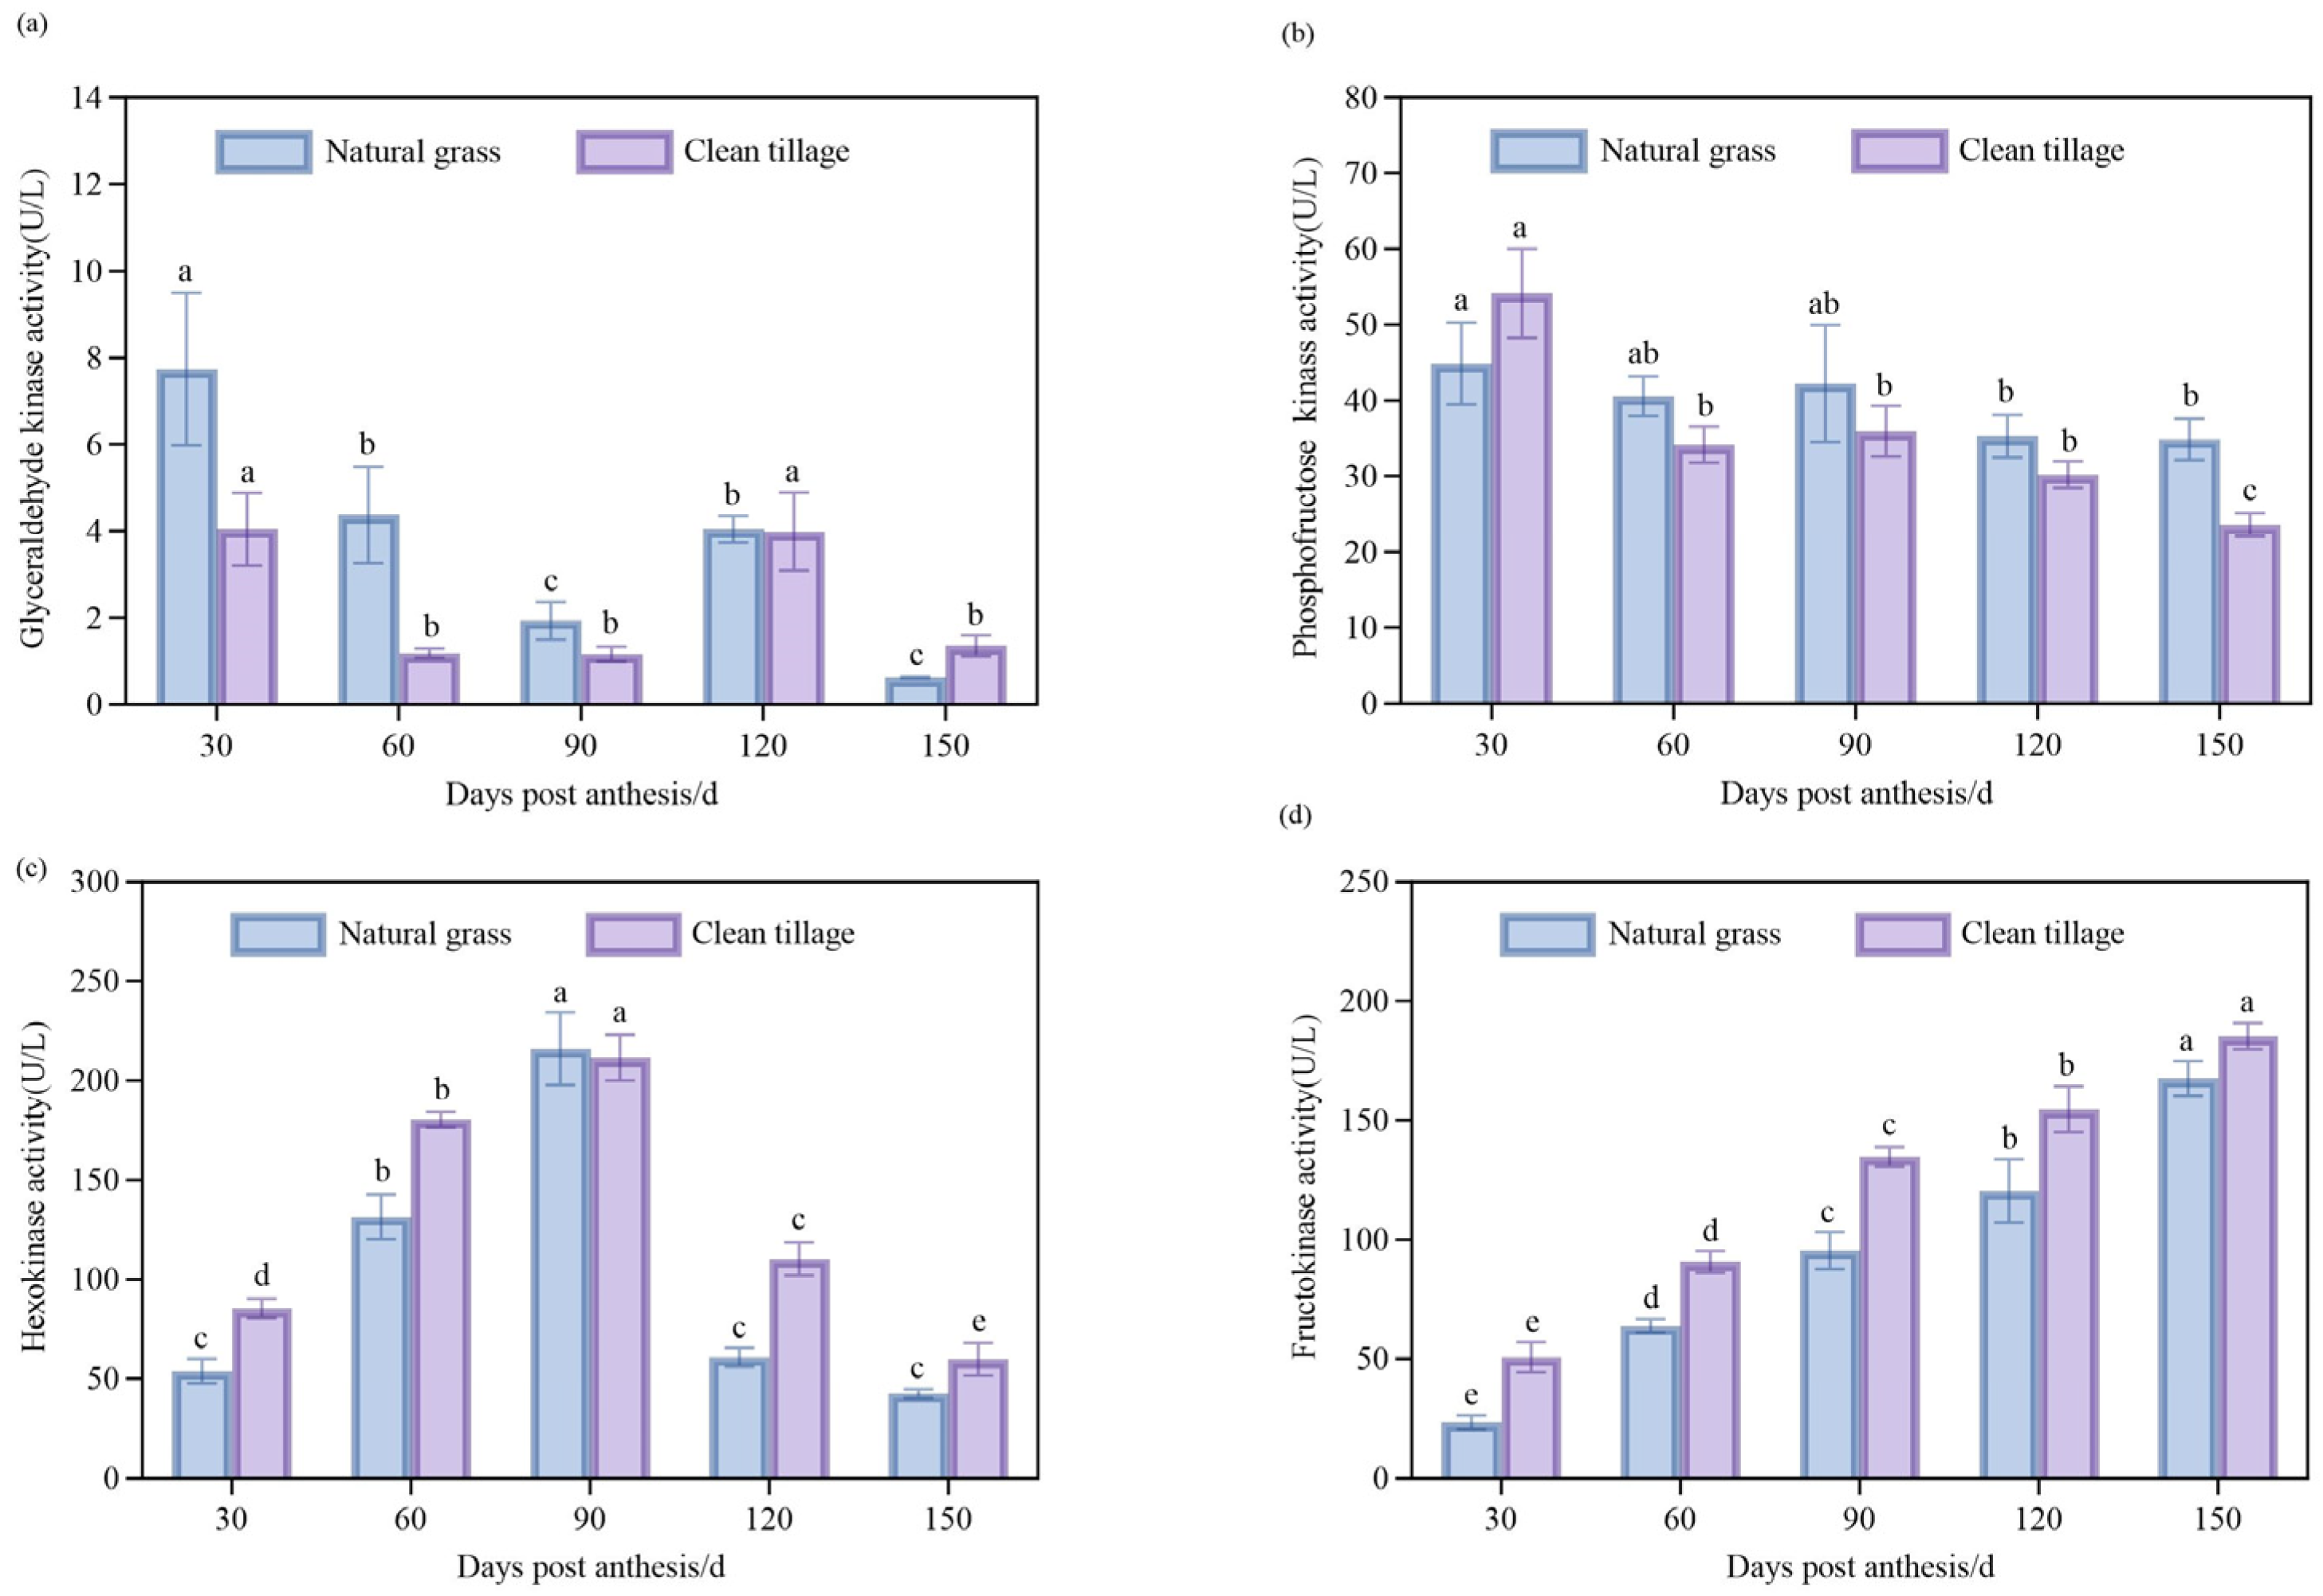
3.3. The Changes in the Activity of Enzymes in the Peel of Korla Fragrant Pears During Fruit Development Under Two Cultivation Modes

GK activity of Korla fragrant pear peel (Figure 4a) was 3.69 U/L, 3.19 U/L and 0.77 U/L higher in the natural grass area than in the clear cultivation area during 30 to 90 days after flowering. PFK activity in pericarp is shown in Figure 4b. At 60 days after flowering, PFK activity in the natural grass area was higher than that in the clear cultivation area at all developmental stages, which were 6.41 U/L, 6.35 U/L, 5.03 U/L, and 11.30 U/L, respectively. HK activity in fruit peel (Figure 4c) showed a trend of first increasing and then decreasing, and the change trend was almost the same in the natural grass area and the clear tillage area. However, the activity in the natural grass area was slightly higher than that in the clear tillage area (4.53 U/L) at 90 days after flowering and was lower than that in the rest periods. During the period from 30 days to 150 days after anthesis, the activity of FK in the natural grass area was lower than that in the clear cultivation area, which decreased by 27.45 U/L, 26.79 U/L, 39.35 U/L, 34.14 U/L, and 17.79 U/L, respectively.

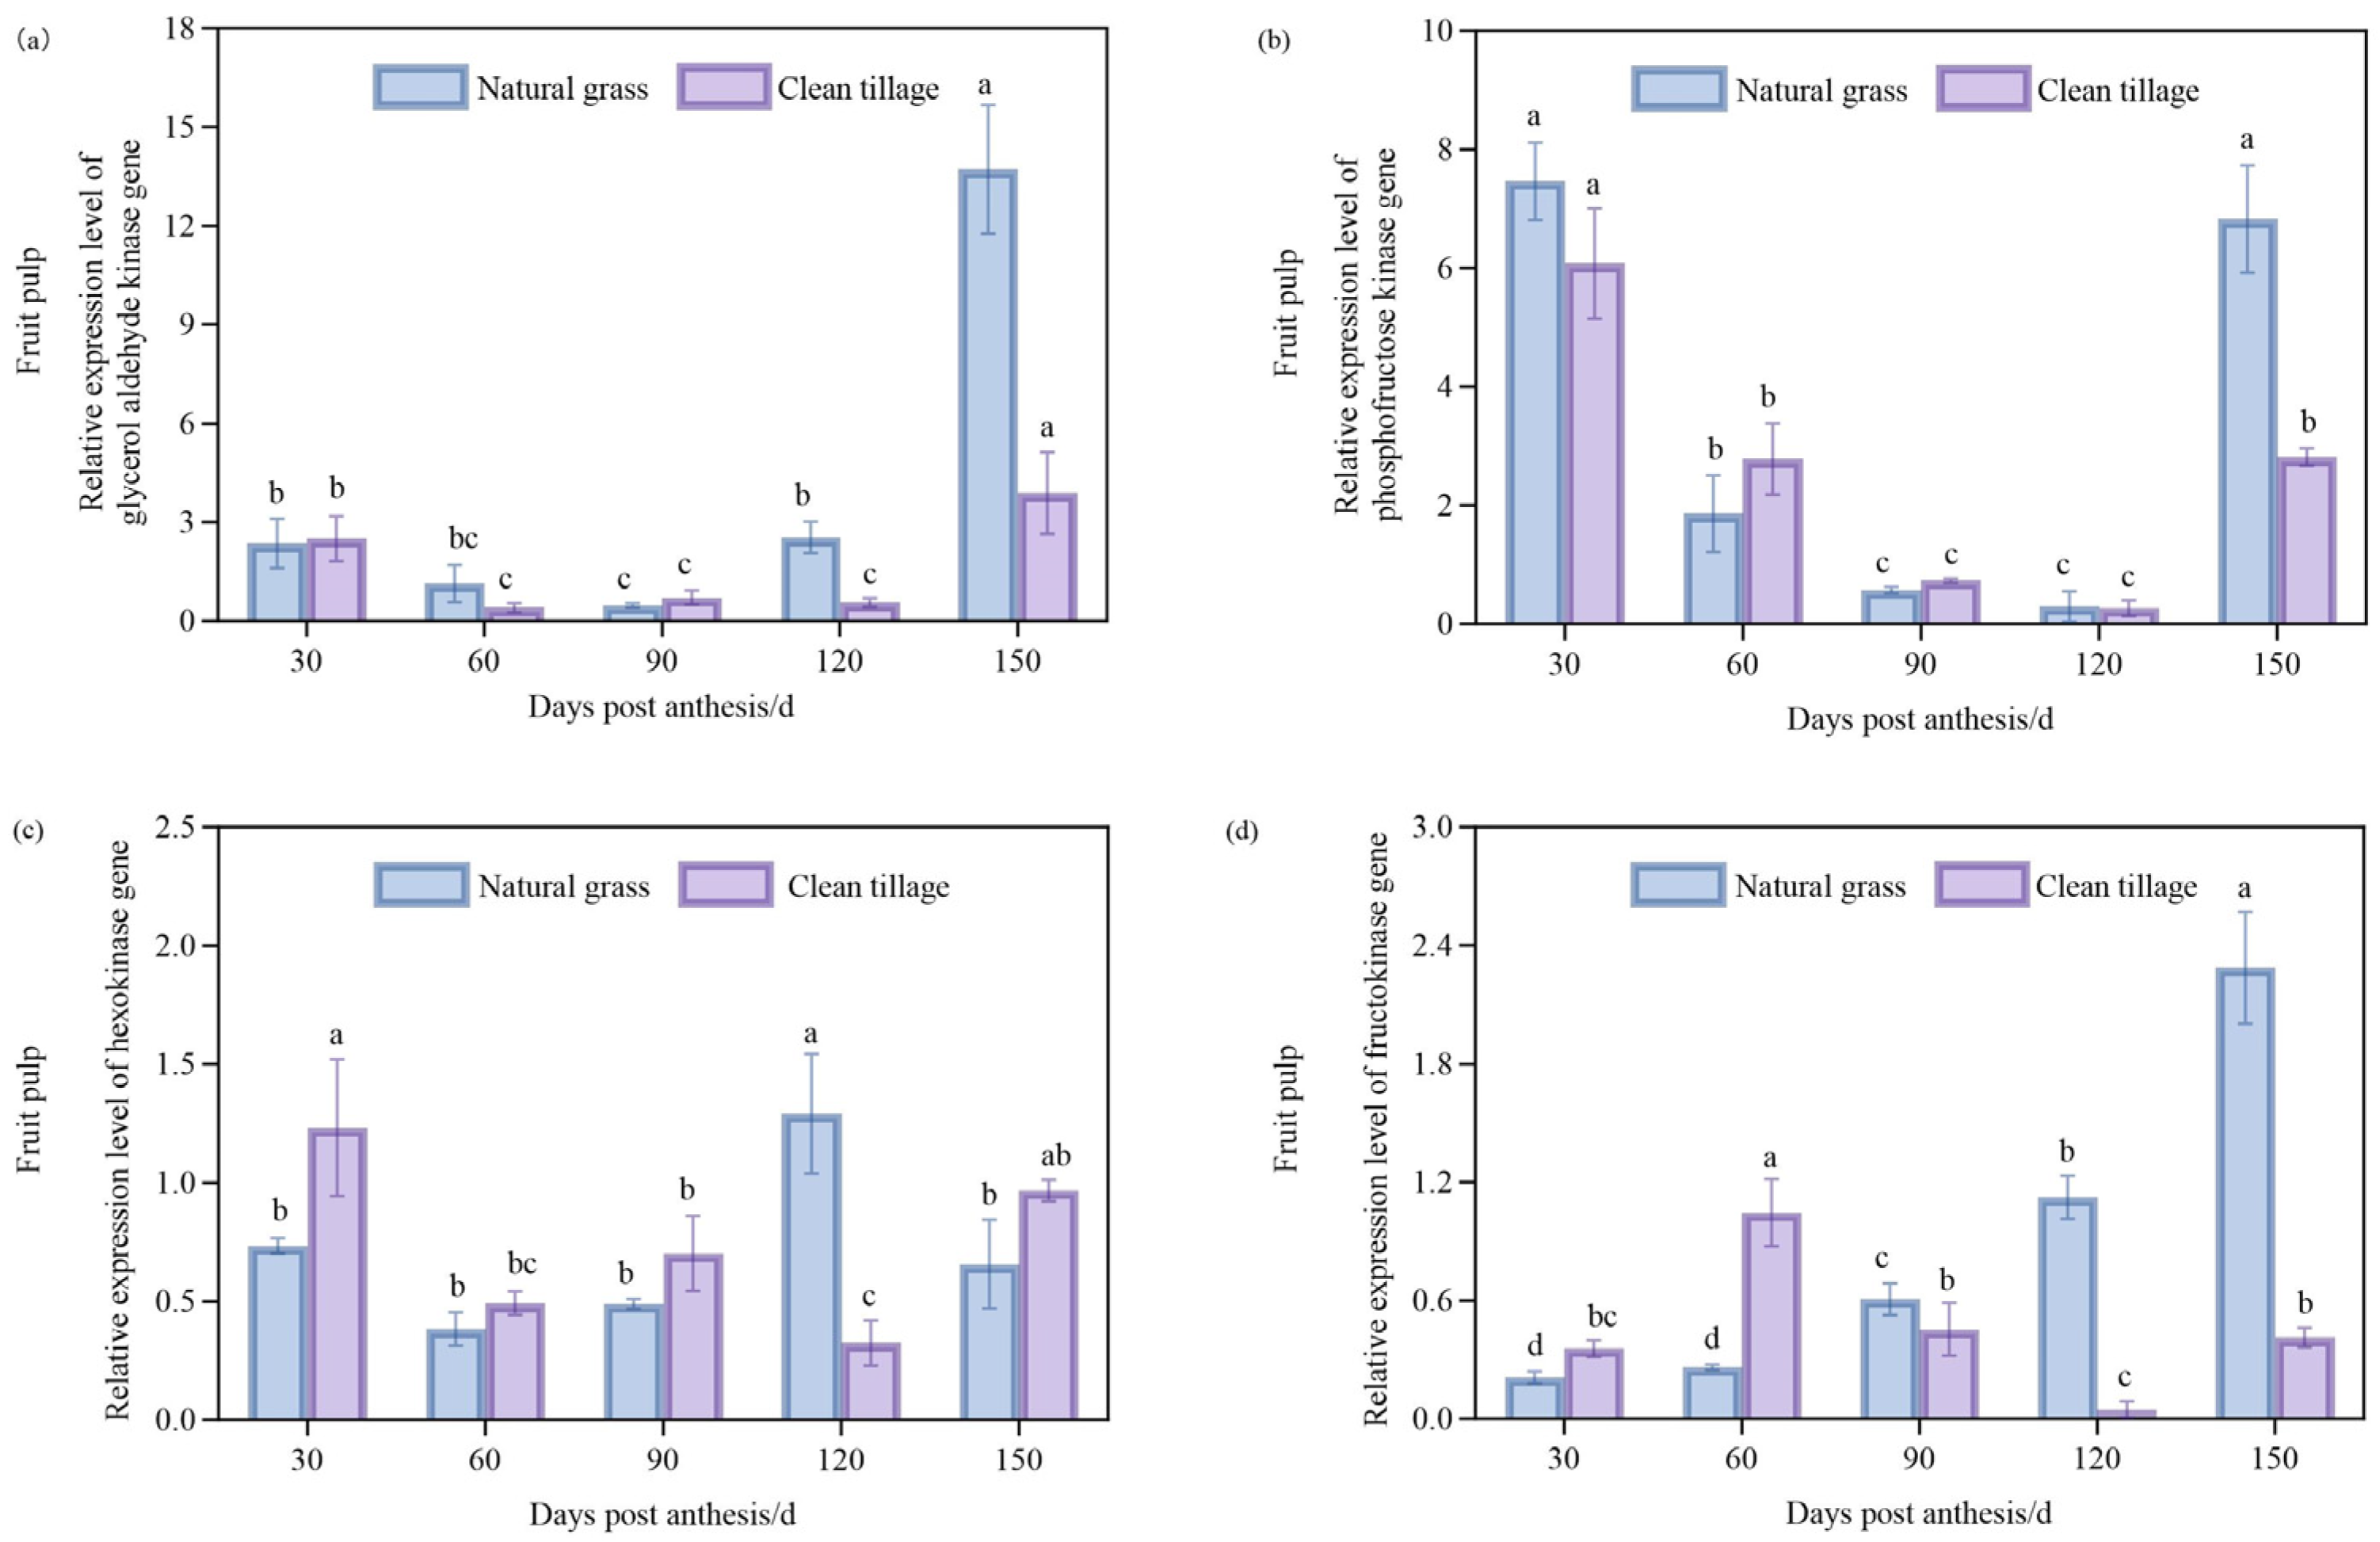
3.4. Changes in Enzyme Gene Expression in Pulp of Korla Fragrant Pear During Fruit Development Under Two Cultivation Modes

The expression levels of GK (Figure 5a) and PFK (Figure 5b) genes in the flesh of Korla pear at 150 days after flowering were significantly higher in the natural grass area than in the clear cultivation area, increasing by 9.83 and 4.01, respectively. The expression of HK genes in the flesh (Figure 5c) showed a trend of first decreasing, then increasing, and then decreasing in the natural grassed area, and the expression of HK genes in the natural grassed area was significantly higher than that in the clear plowed area at 120 days after anthesis, and the maximum value was 1.29 at 120 days after anthesis. On the other hand, the expression of HK genes in the clear tillage area showed a fluctuating trend, and at 30 days after flowering, the expression of HK genes in the clear tillage area was higher than that in the natural grass area, and it reached a maximum value of 1.23 at 30 days after flowering. The FK gene in flesh (Figure 5d) was significantly higher in the natural grass area than in the clear cultivation area at 120 and 150 days after flowering, 1.08 and 1.87 higher, respectively. The results showed that natural grasses could significantly increase the relative expression levels of GK, PFK, and FK genes in the pulp of Korla fragrant pear.

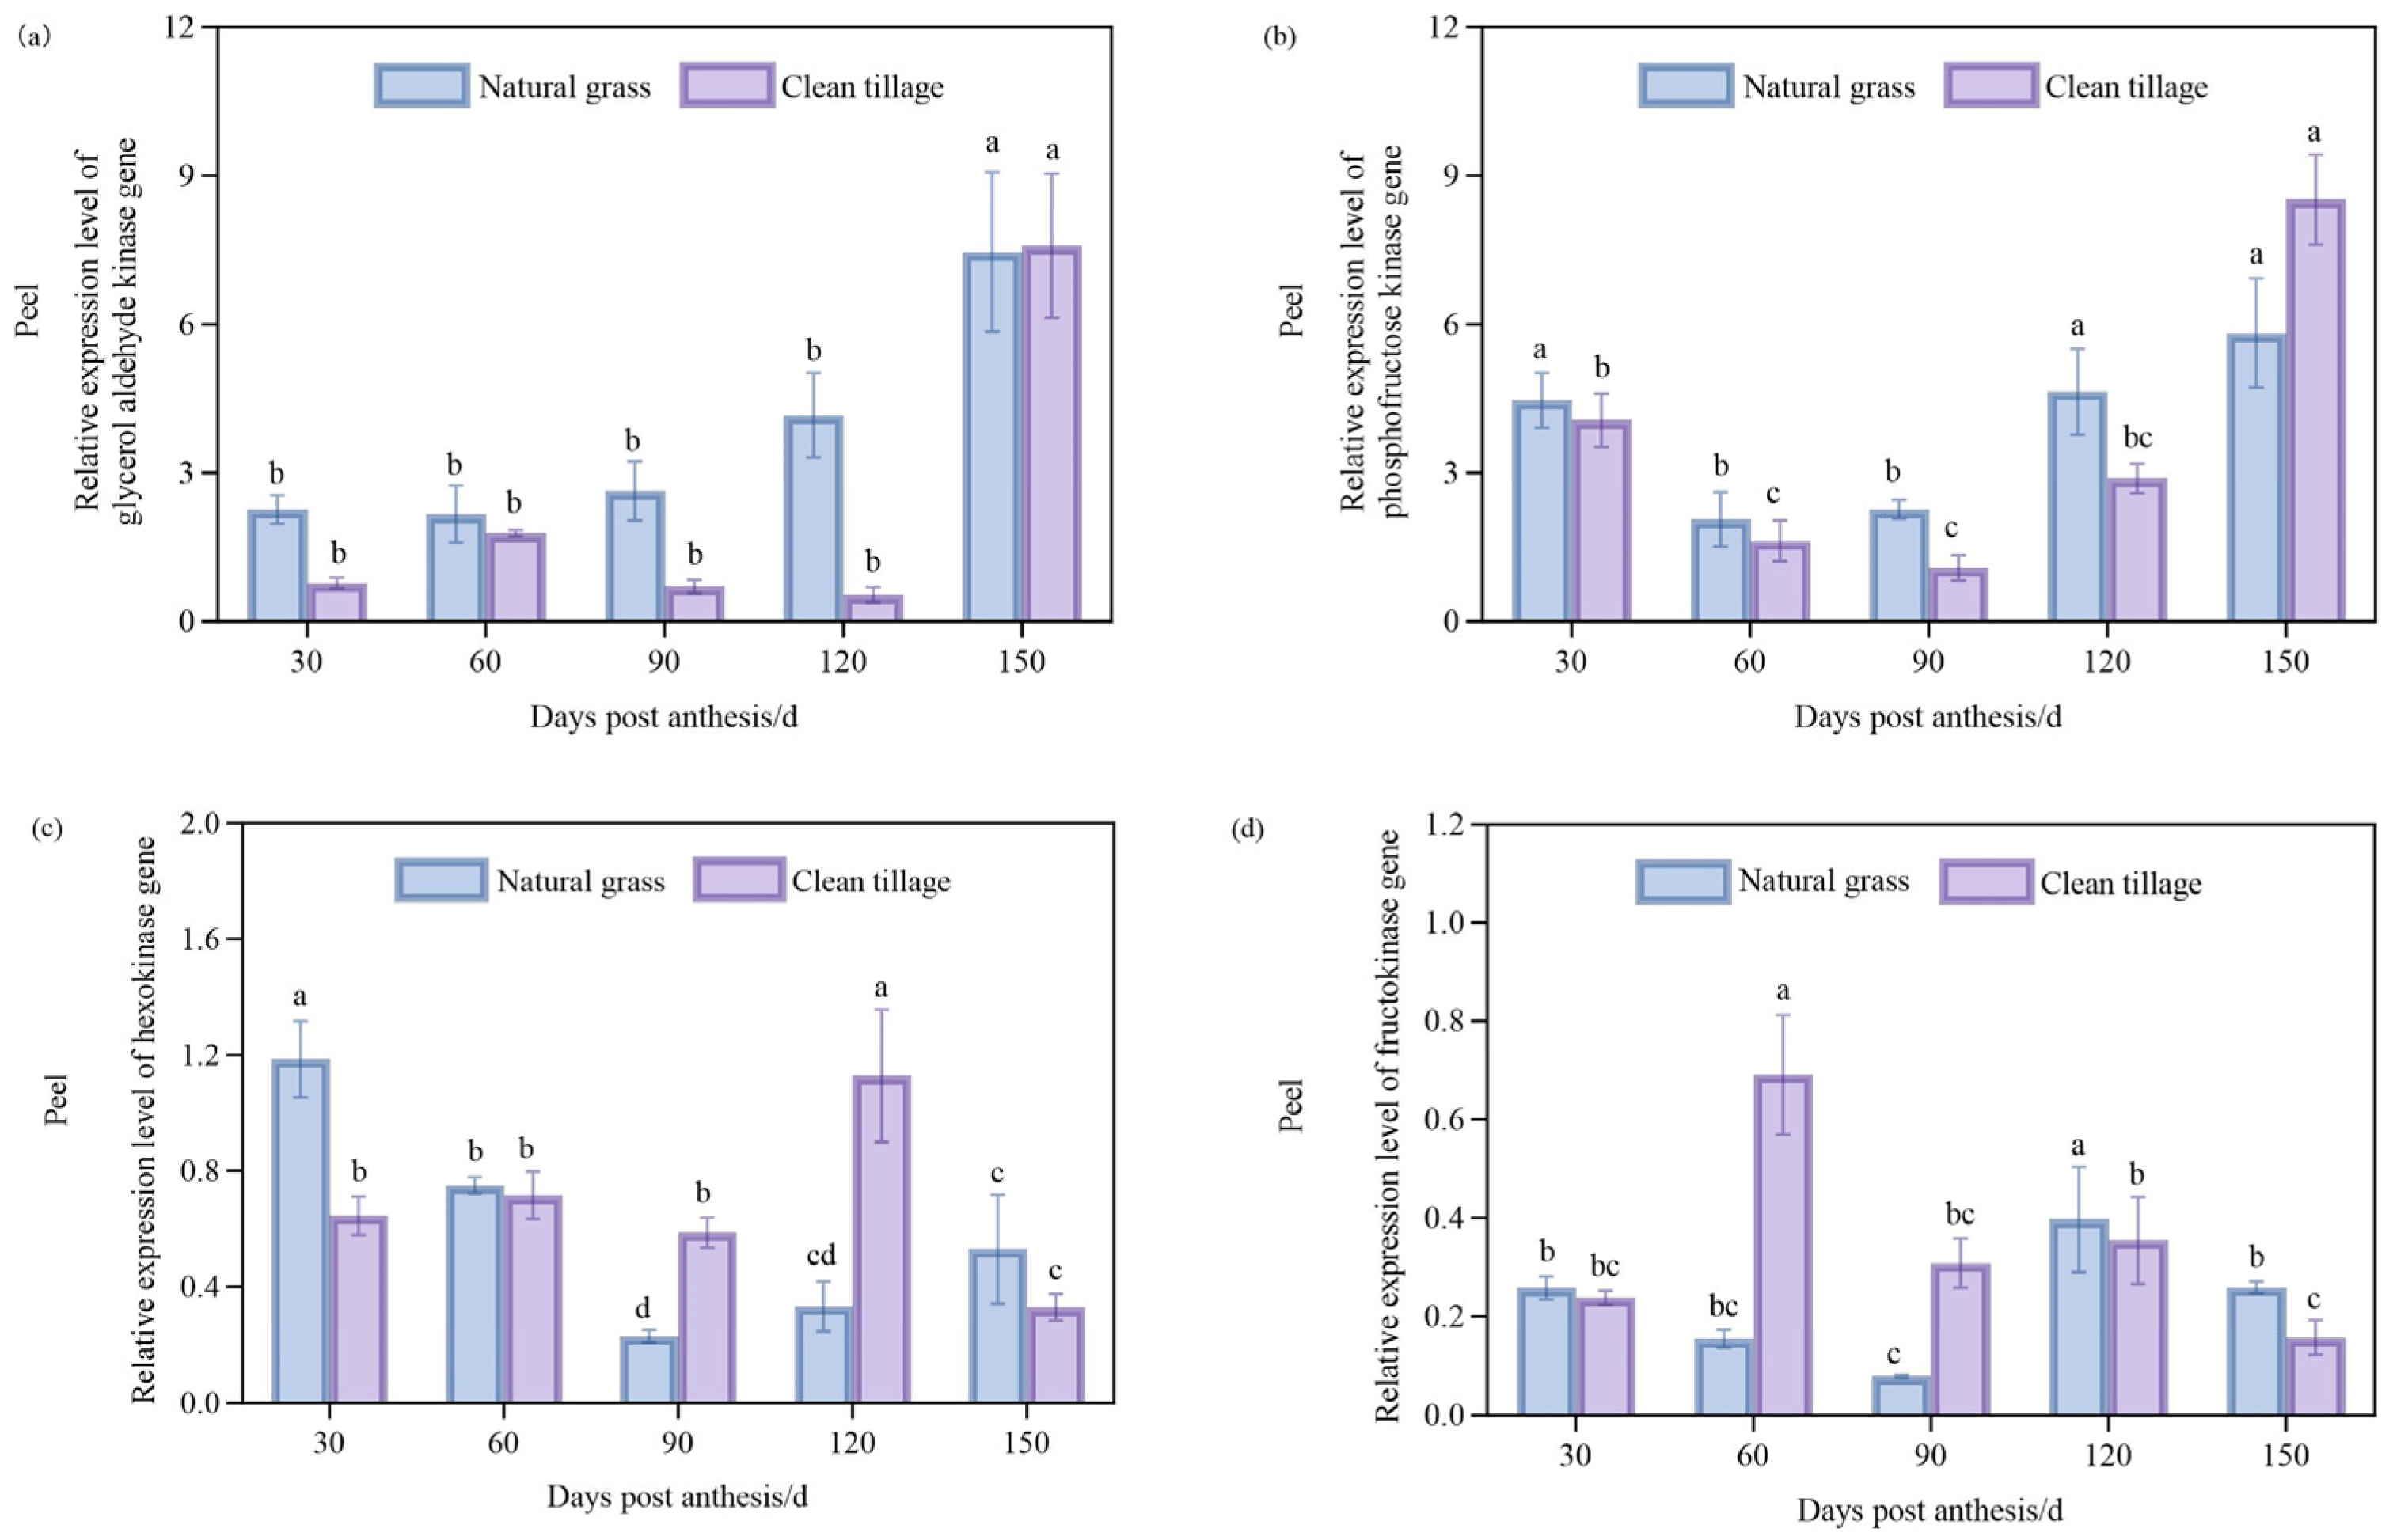
3.5. Changes in Peel Enzyme Gene Expression in Korla Fragrant Pear During Fruit Development Under Two Cultivation Modes

In the natural grass-growing area, the expression of the GK gene (Figure 6a) in the Korla fragrant pear peel exhibited an increasing trend, while in the cleared tillage area, it showed a pattern of initially increasing, then decreasing, and subsequently increasing again. The expression levels of the GK gene in the pericarp from natural grass-growing areas were consistently higher than those in cleared tillage areas, with significant differences observed at 90 and 120 days post-anthesis/d. The expression level of the PFK gene (Figure 6b) in the fruit peel followed a trend of initially decreasing and then increasing in the natural grass-growing area. From 30 to 120 days post-anthesis/d, the expression levels of the PFK gene in the pericarp from the natural grass-growing area were 0.40, 0.44, 1.18, and 1.74 units higher than those in the cleared tillage area, respectively. However, at 150 days post-anthesis/d, the expression level of the PFK gene in the pericarp from the natural grass-growing area was 2.7 units lower than that in the cleared tillage area. The expression level of the HK gene (Figure 6c) in the peel showed a trend of initially decreasing and then increasing in the natural grass-growing area. At 30, 60, and 150 days post-anthesis/d, the expression levels of the HK gene in the pericarp from the natural grass-growing area were 0.54, 0.04, and 0.20 units higher than those in the cleared tillage area, respectively. In contrast, in the cleared tillage area, the expression level exhibited a fluctuating trend. At 90 and 120 days post-anthesis/d, the expression levels of the HK gene in the peel from cultivated areas were 0.36 and 0.80 units higher than those in the natural grass-growing areas, respectively. The expression level of the FK gene (Figure 6d) in the peel demonstrated a trend of initially decreasing, then increasing, and finally decreasing in the natural grass-growing area. At 30, 120, and 150 days post-anthesis/d, the expression levels of the FK gene in the pericarp from the natural grass-growing area were 0.02, 0.04, and 0.32 units higher than those in the cleared tillage area, respectively. In the cleared tillage area, the expression level showed a fluctuating trend, reaching its highest value of 0.69 at 60 days post-anthesis/d.

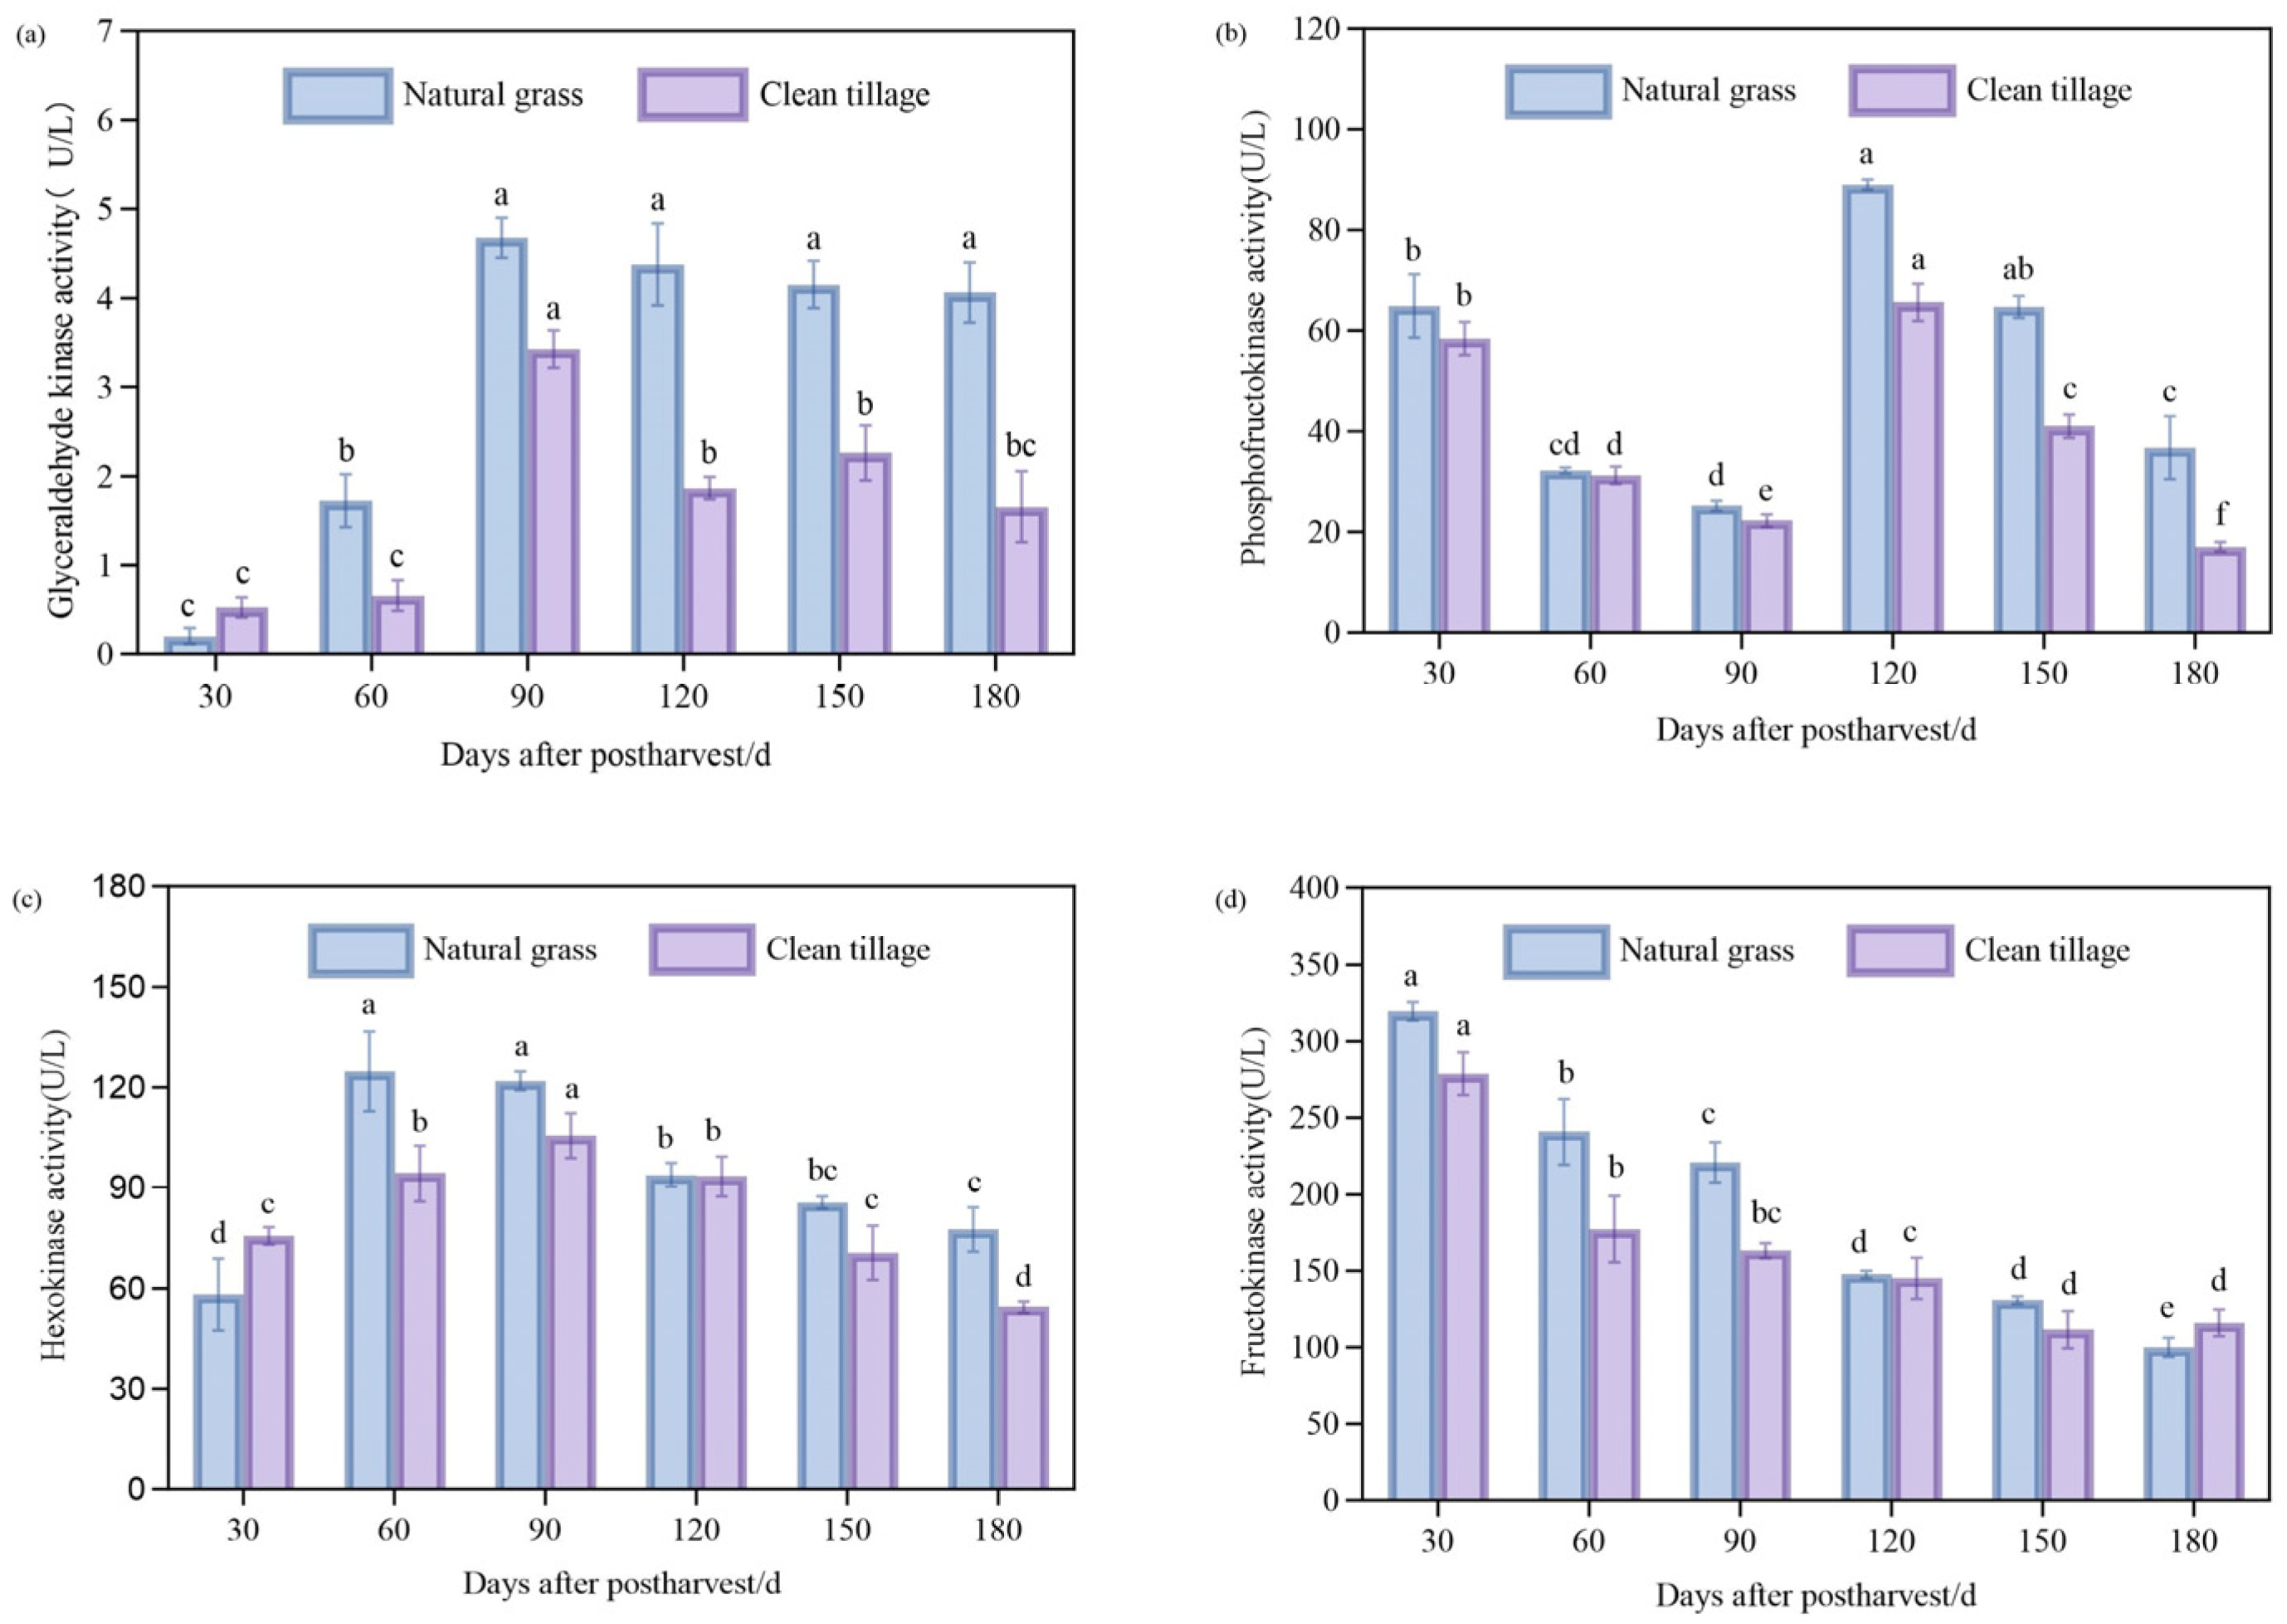
3.6. The Changes in the Enzyme Activity of the Pulp of Korla Fragrant Pears During Storage Under Two Cultivation Modes

During the post-harvest storage of Korla fragrant pears, the GK activity in the natural grass-growing area (Figure 7a) was significantly higher than that in the cleared tillage area at 60, 120, 150, and 180 days post-harvest, with increases of 1.06 U/L, 2.51 U/L, 1.96 U/L, and 2.40 U/L, respectively. The PFK activity (Figure 7b) in both the natural grass-growing area and the cleared tillage area exhibited a trend of initially decreasing, then increasing, and finally decreasing. At 150 and 180 days post-harvest, the PFK activity in the natural grass-growing area was significantly higher than that in the cleared tillage area, with differences of 23.73 U/L and 19.69 U/L, respectively. The HK activity (Figure 7c) in the natural grass area was significantly higher than that in the cleared tillage area at 60, 150, and 180 days post-harvest, with increases of 30.47 U/L, 15.11 U/L, and 23.16 U/L, respectively. However, in the last 30 days of storage, the HK activity in the natural grass-growing area was 17.54 U/L lower than that in the cleared tillage area. The FK activity (Figure 7d) was consistently higher than the activities of GK, PFK, and HK enzymes at all stages. At 90 and 120 days post-harvest, the FK activity in the natural grass-growing area was significantly higher than that in the cleared tillage area, with increases of 57.69 U/L and 2.41 U/L, respectively.

3.7. The Changes in the Activity of Enzymes in the Peel of Korla Fragrant Pears During Storage Under Two Cultivation Modes

The GK activity (Figure 8a) in the peel of Korla fragrant pears from the natural grass-growing area was generally higher than that in the cleared tillage area. Specifically, at 30, 60, 90, and 150 days post-harvest, the differences were 0.35 U/L, 1.02 U/L, 1.52 U/L, and 1.10 U/L, respectively. The PFK activity (Figure 8b) decreased with the extension of the storage period. At 60, 120, and 180 days post-harvest, the PFK activity in the natural grass-growing area was significantly lower than that in the cleared tillage area, with differences of 0.07 U/L, 2.00 U/L, and 0.21 U/L, respectively. The HK activity (Figure 8c) showed no significant difference between the two cultivation models. The FK activity (Figure 8d) was significantly higher in the natural grass-growing area compared to the cleared tillage area at 150 and 180 days post-mining, with differences of 2.47 U/L and 8.52 U/L, respectively.

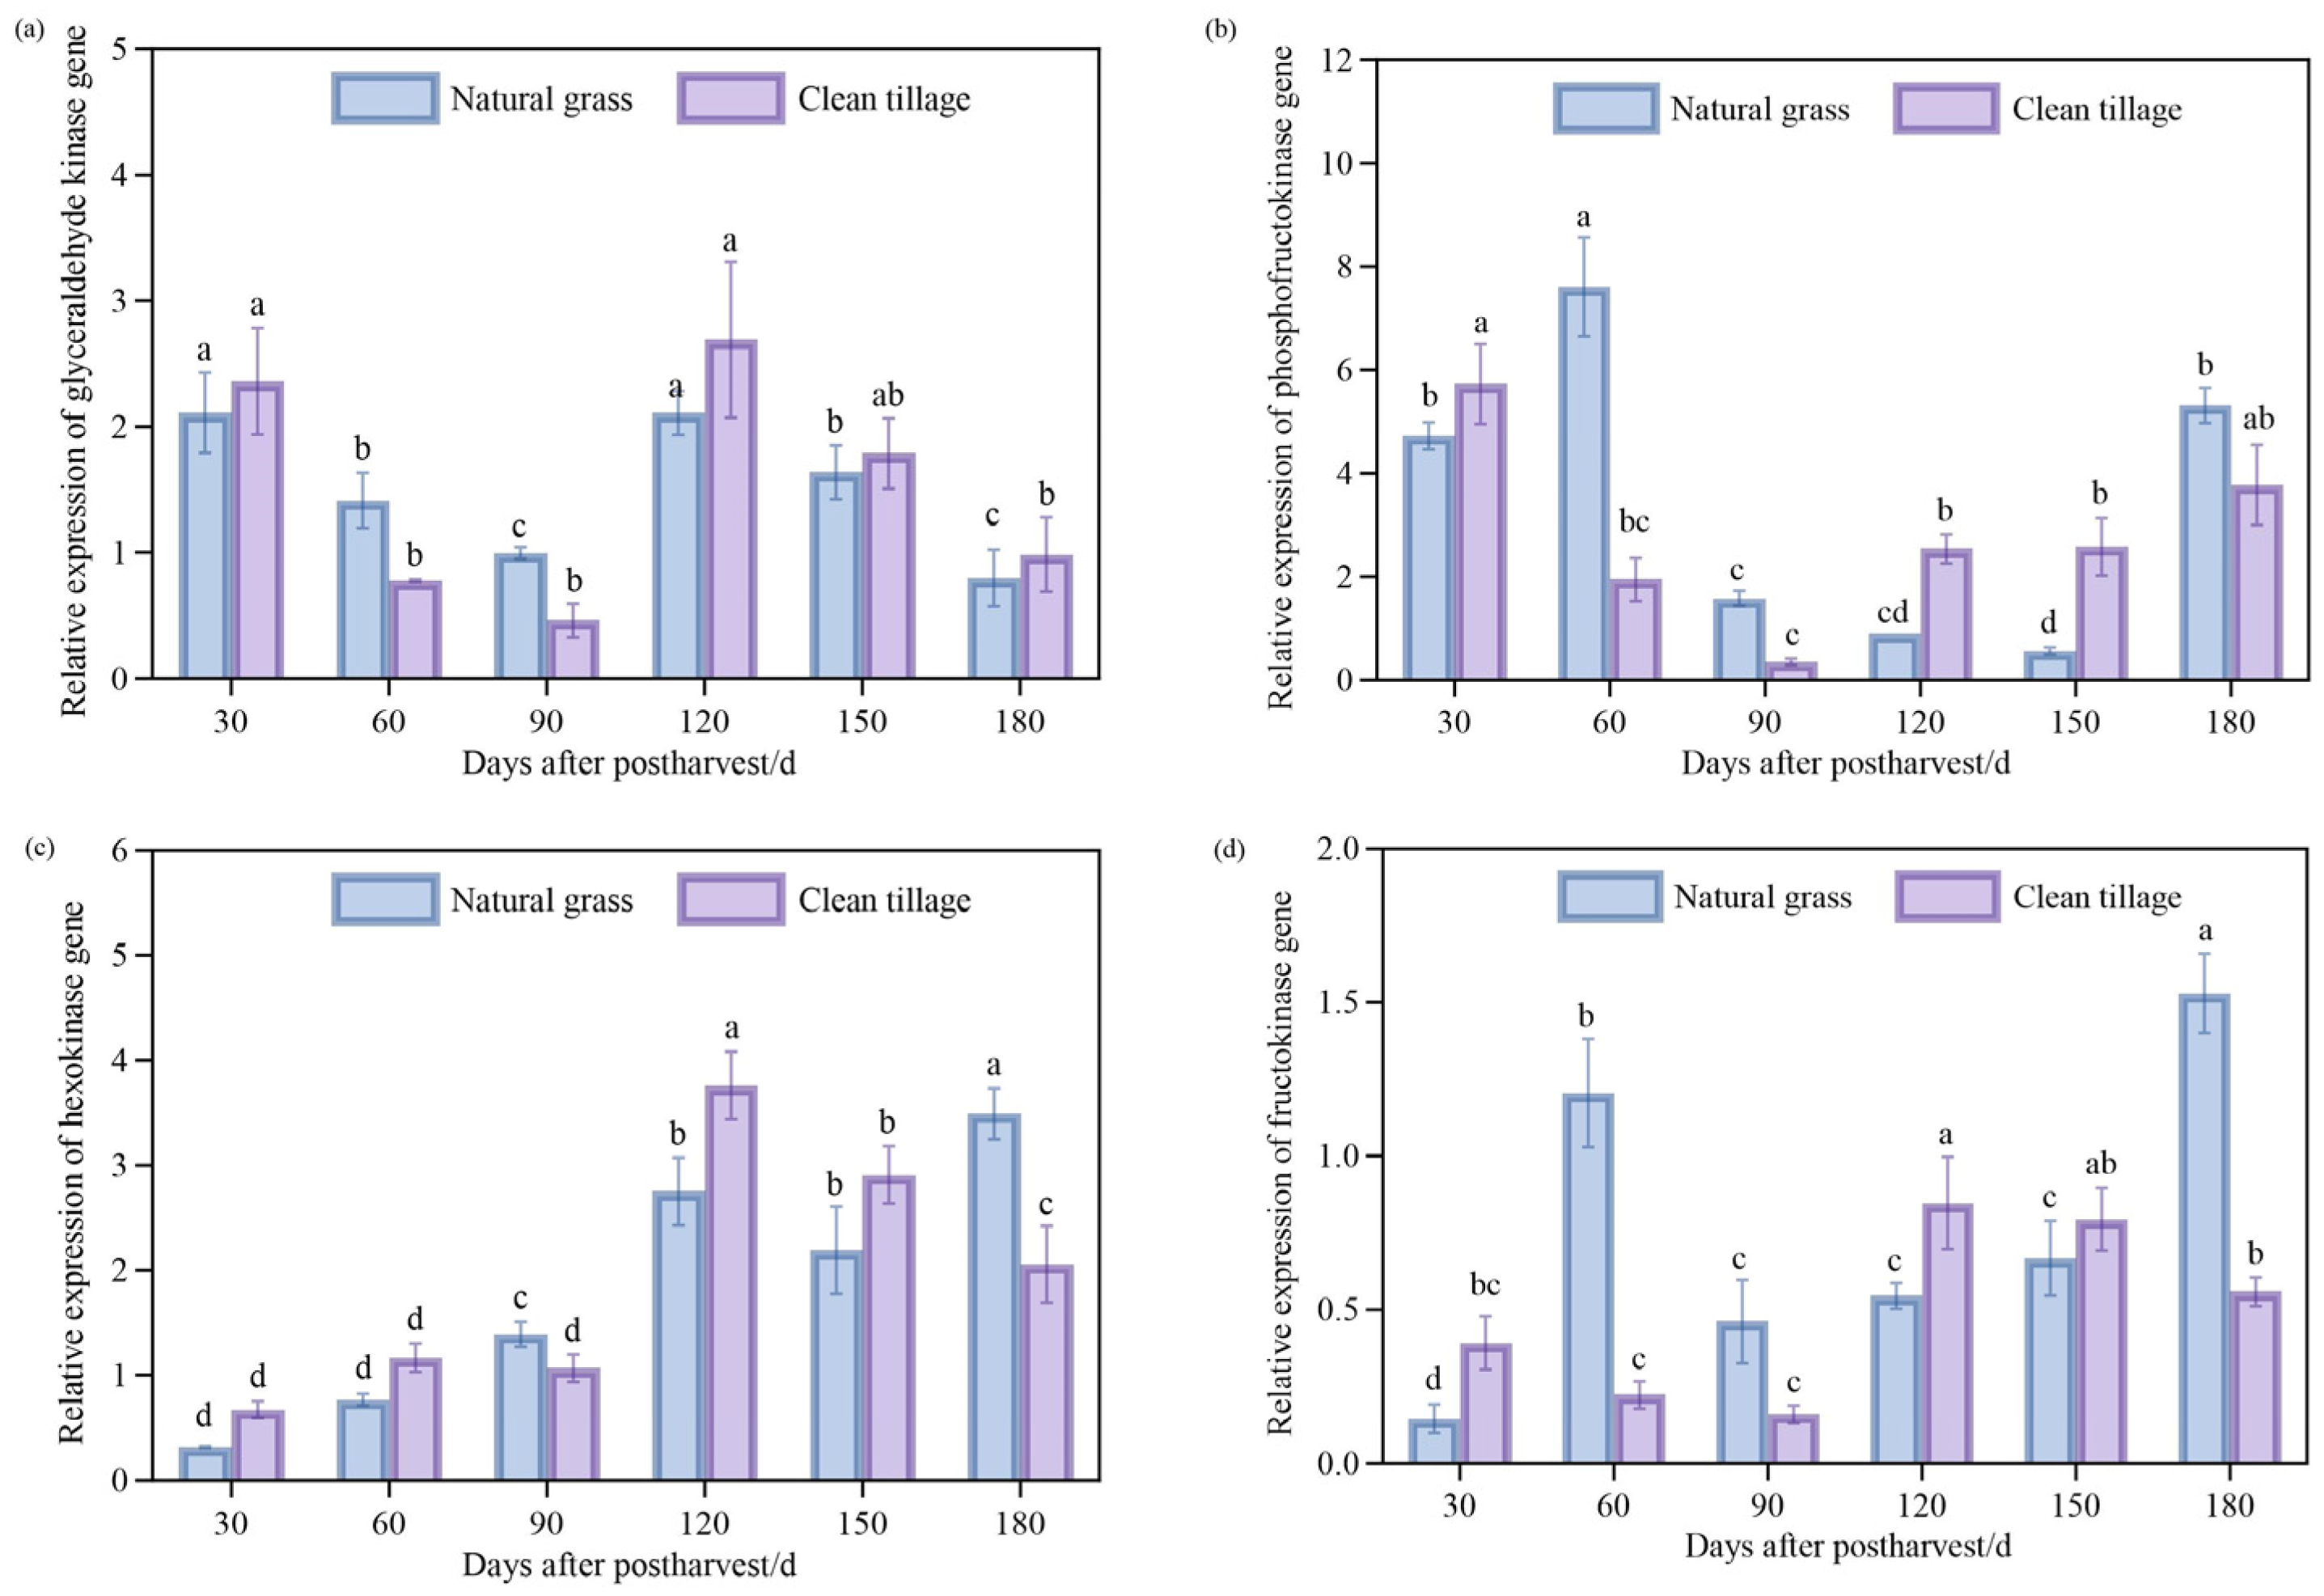
3.8. Changes in Enzyme Gene Expression in Pulp of Korla Fragrant Pear During Storage Under Two Cultivation Modes

During the post-harvest storage process of Korla fragrant pears, the expression of the GK gene (Figure 9a) initially decreased, then increased, and finally decreased. At 90 days post-harvest, the expression of the GK gene in the natural grass-growing area was significantly higher than that in the cleared tillage area, with a difference of 0.53 units. The expression of the PFK gene (Figure 9b) showed a fluctuating trend in the natural grass-growing area, while in the cleared tillage area, it initially decreased and then increased. At 60 days post-harvest, the expression level in the natural grass-growing area was significantly higher than that in the cleared tillage area, with a difference of 5.66 units. The expression level of the HK gene (Figure 9c) exhibited a fluctuating trend in both cultivation modes. At 90 and 180 days post-harvest, the expression level in the natural grass-growing area was significantly higher than that in the cleared tillage area, with differences of 0.32 and 3.43 units, respectively. The expression of the FK gene (Figure 9d) was significantly higher in the natural grass-growing area compared to the cleared tillage area at 60 and 180 days post-harvest, with differences of 0.98 and 0.97 units, respectively.

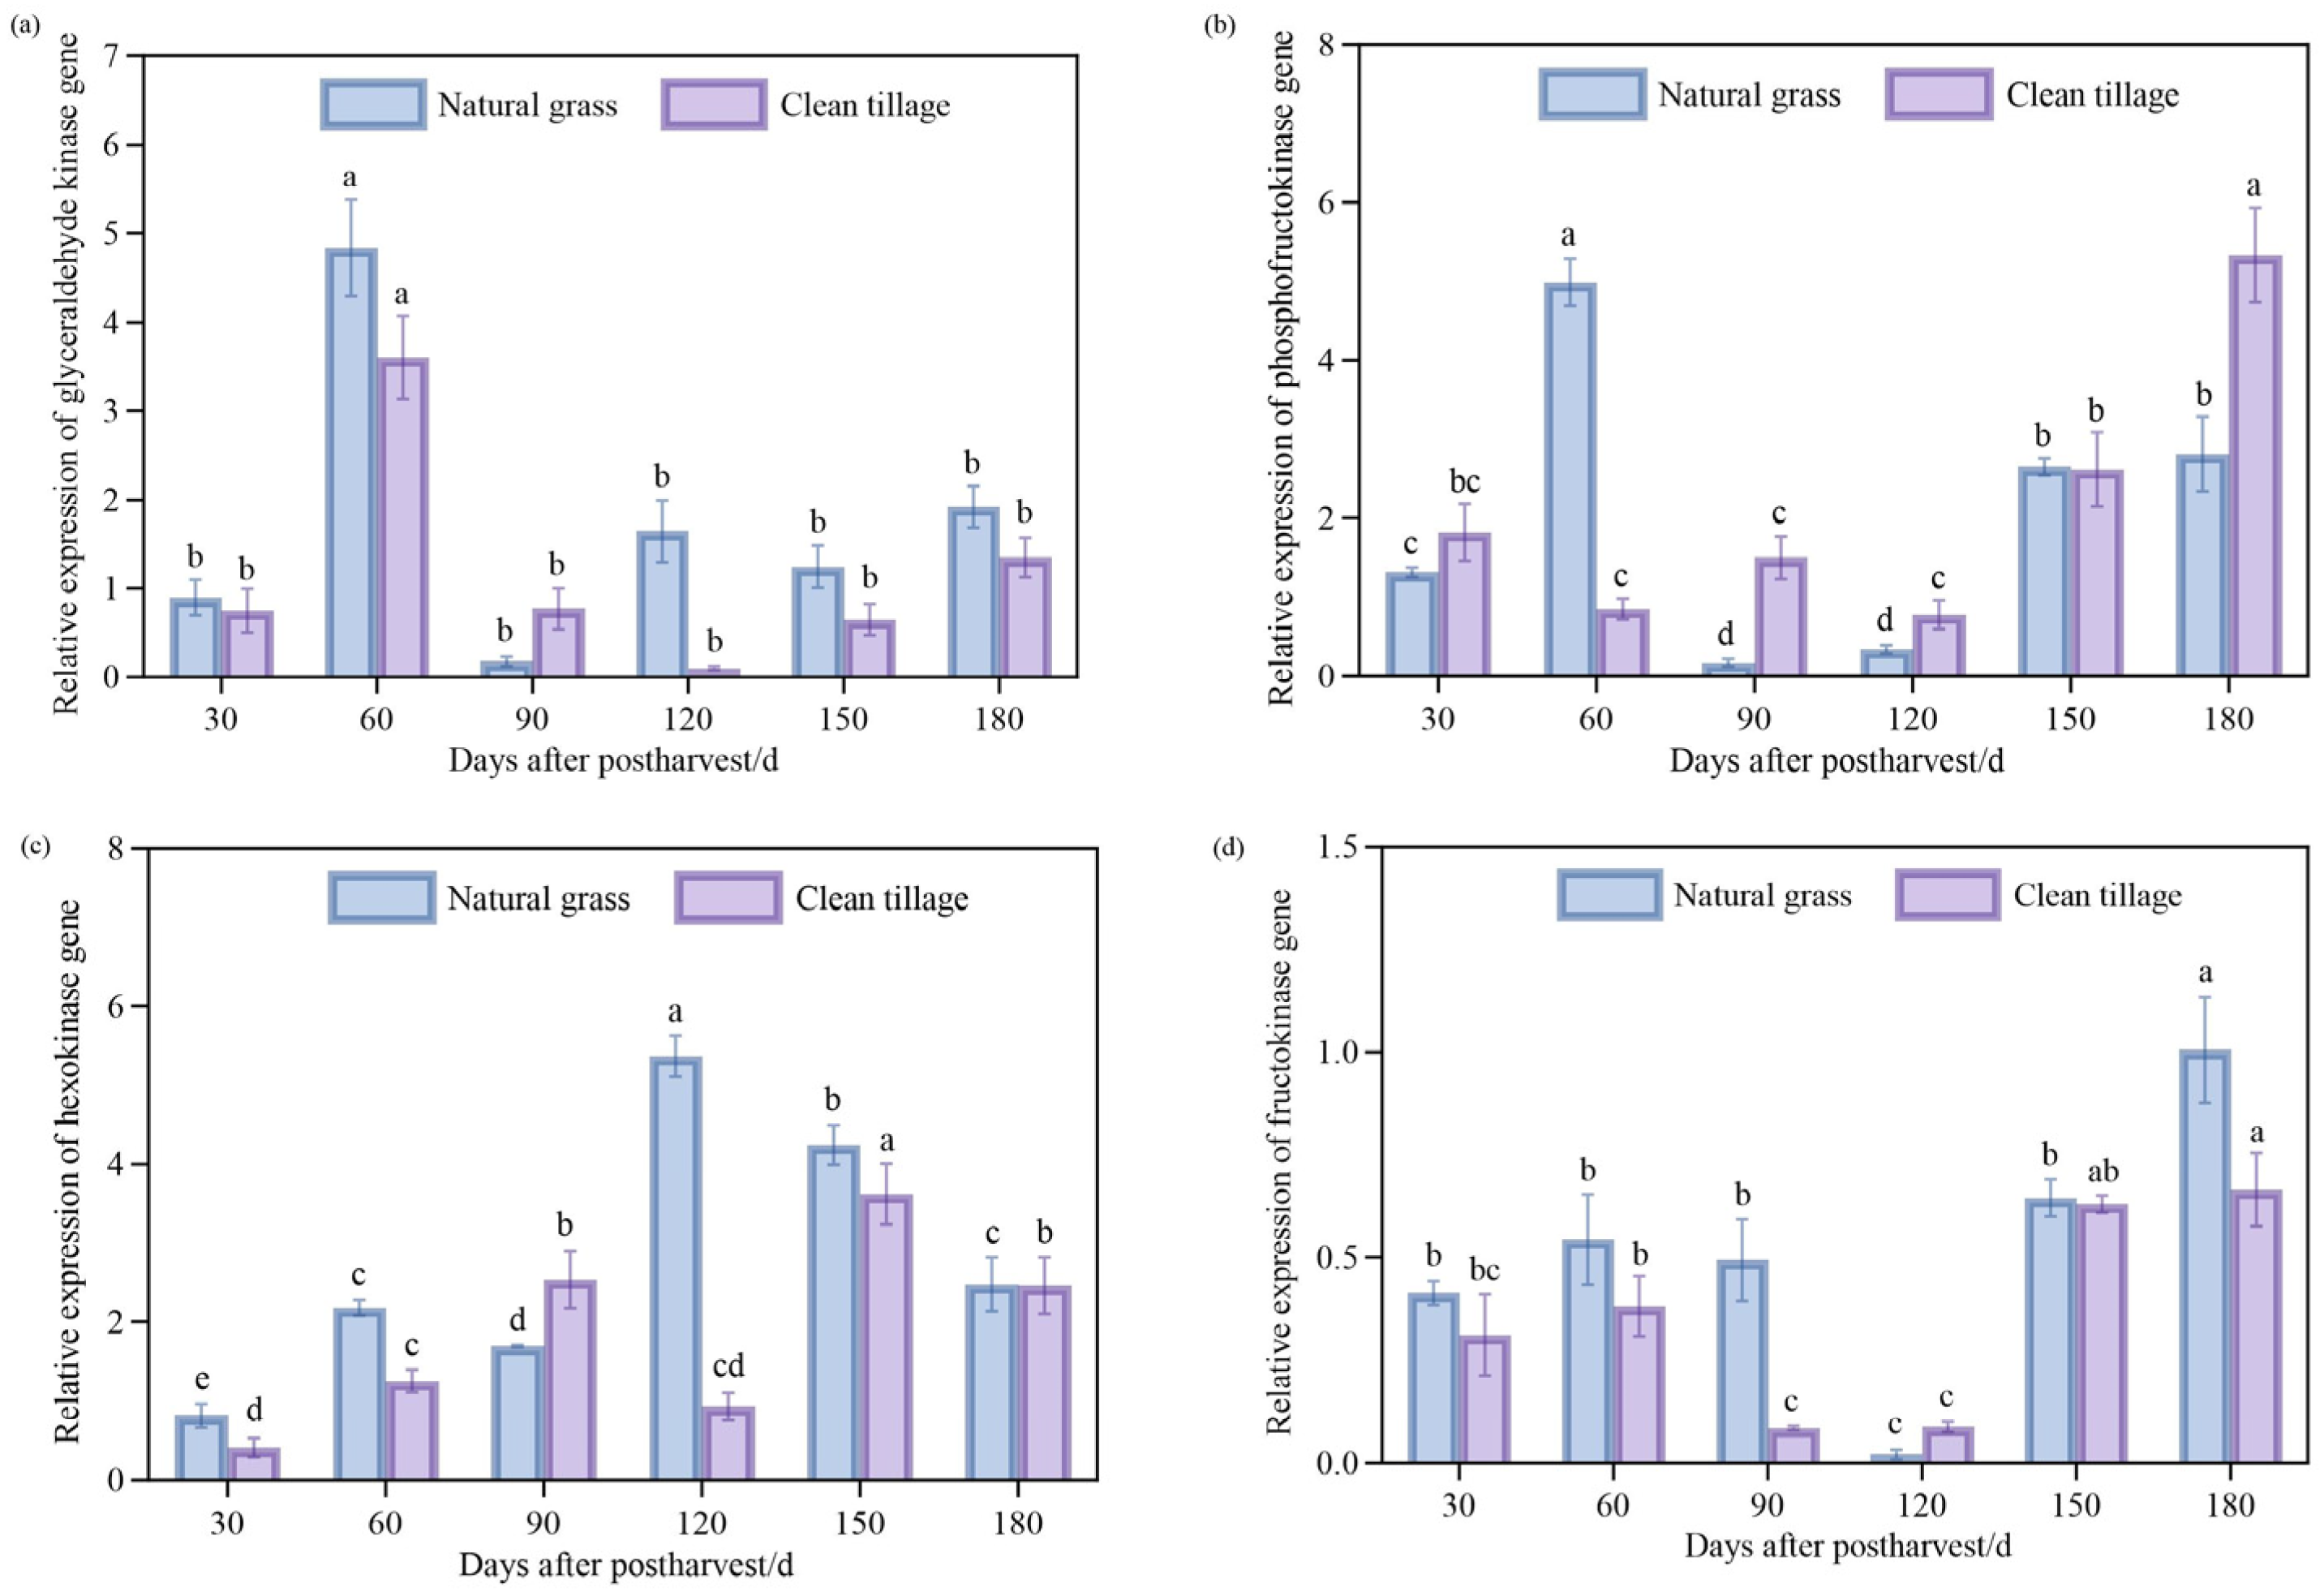
3.9. Changes in Peel Enzyme Gene Expression in Korla Fragrant Pear During Storage Under Two Cultivation Modes

During post-harvest storage, there was no significant difference in the expression of the GK gene (Figure 10a) in the peel of Korla fragrant pears between the natural grass-growing area and the cleared tillage area. At 60 days post-harvest, the expression levels of the GK gene in both cultivation models reached their maximum values, at 4.84 and 3.60, respectively. The expression level of the PFK gene (Figure 10b) in the natural grass-growing area was significantly higher than that in the cleared tillage area at 60 days post-harvest, with a value of 4.14. However, at 180 days post-harvest, the expression level in the natural grass-growing area was significantly lower than that in the cleared tillage area, decreasing to 2.52. The expression of the HK gene (Figure 10c) in the natural grass area was higher than that in the cleared tillage area from 30 to 60 days and from 120 to 180 days post-harvest. Notably, at 120 days post-harvest, there was a significant difference, with the expression level reaching 4.44 in the natural grass-growing area. The expression of the FK gene (Figure 10d) was significantly higher in the natural grass-growing area than in the cleared tillage area at 90 days post-harvest, with a difference of 0.40 units.

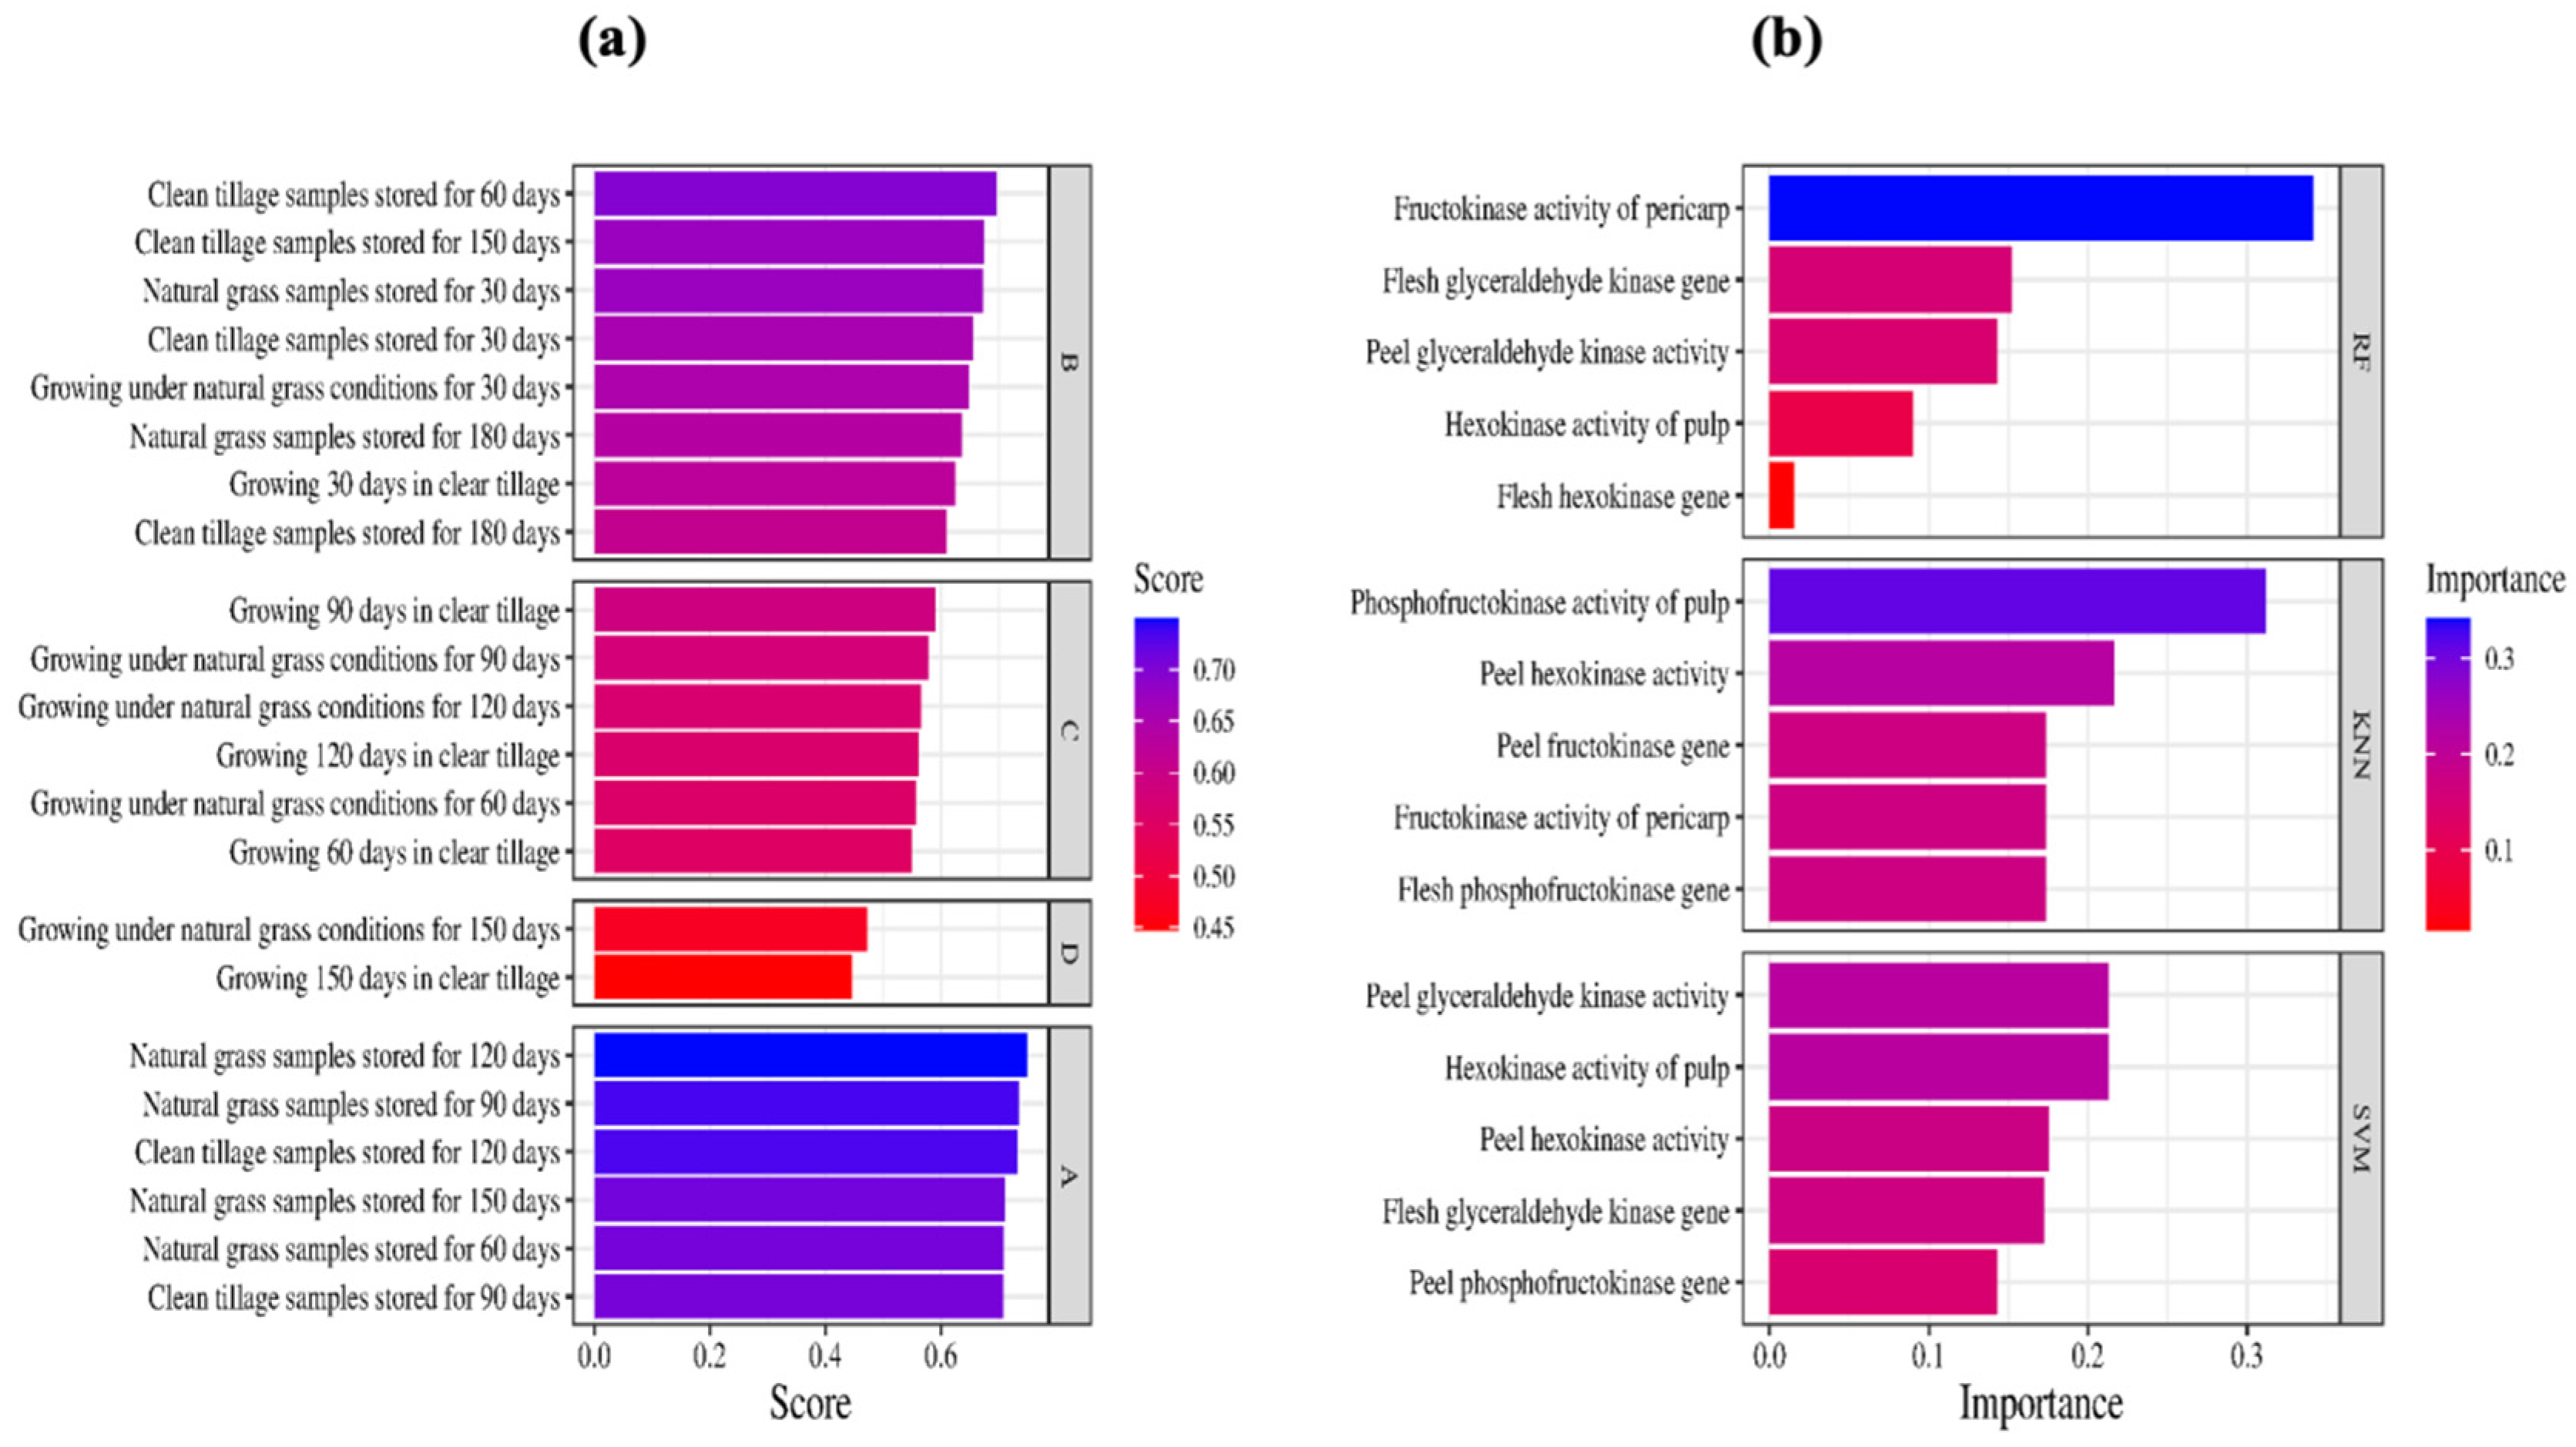
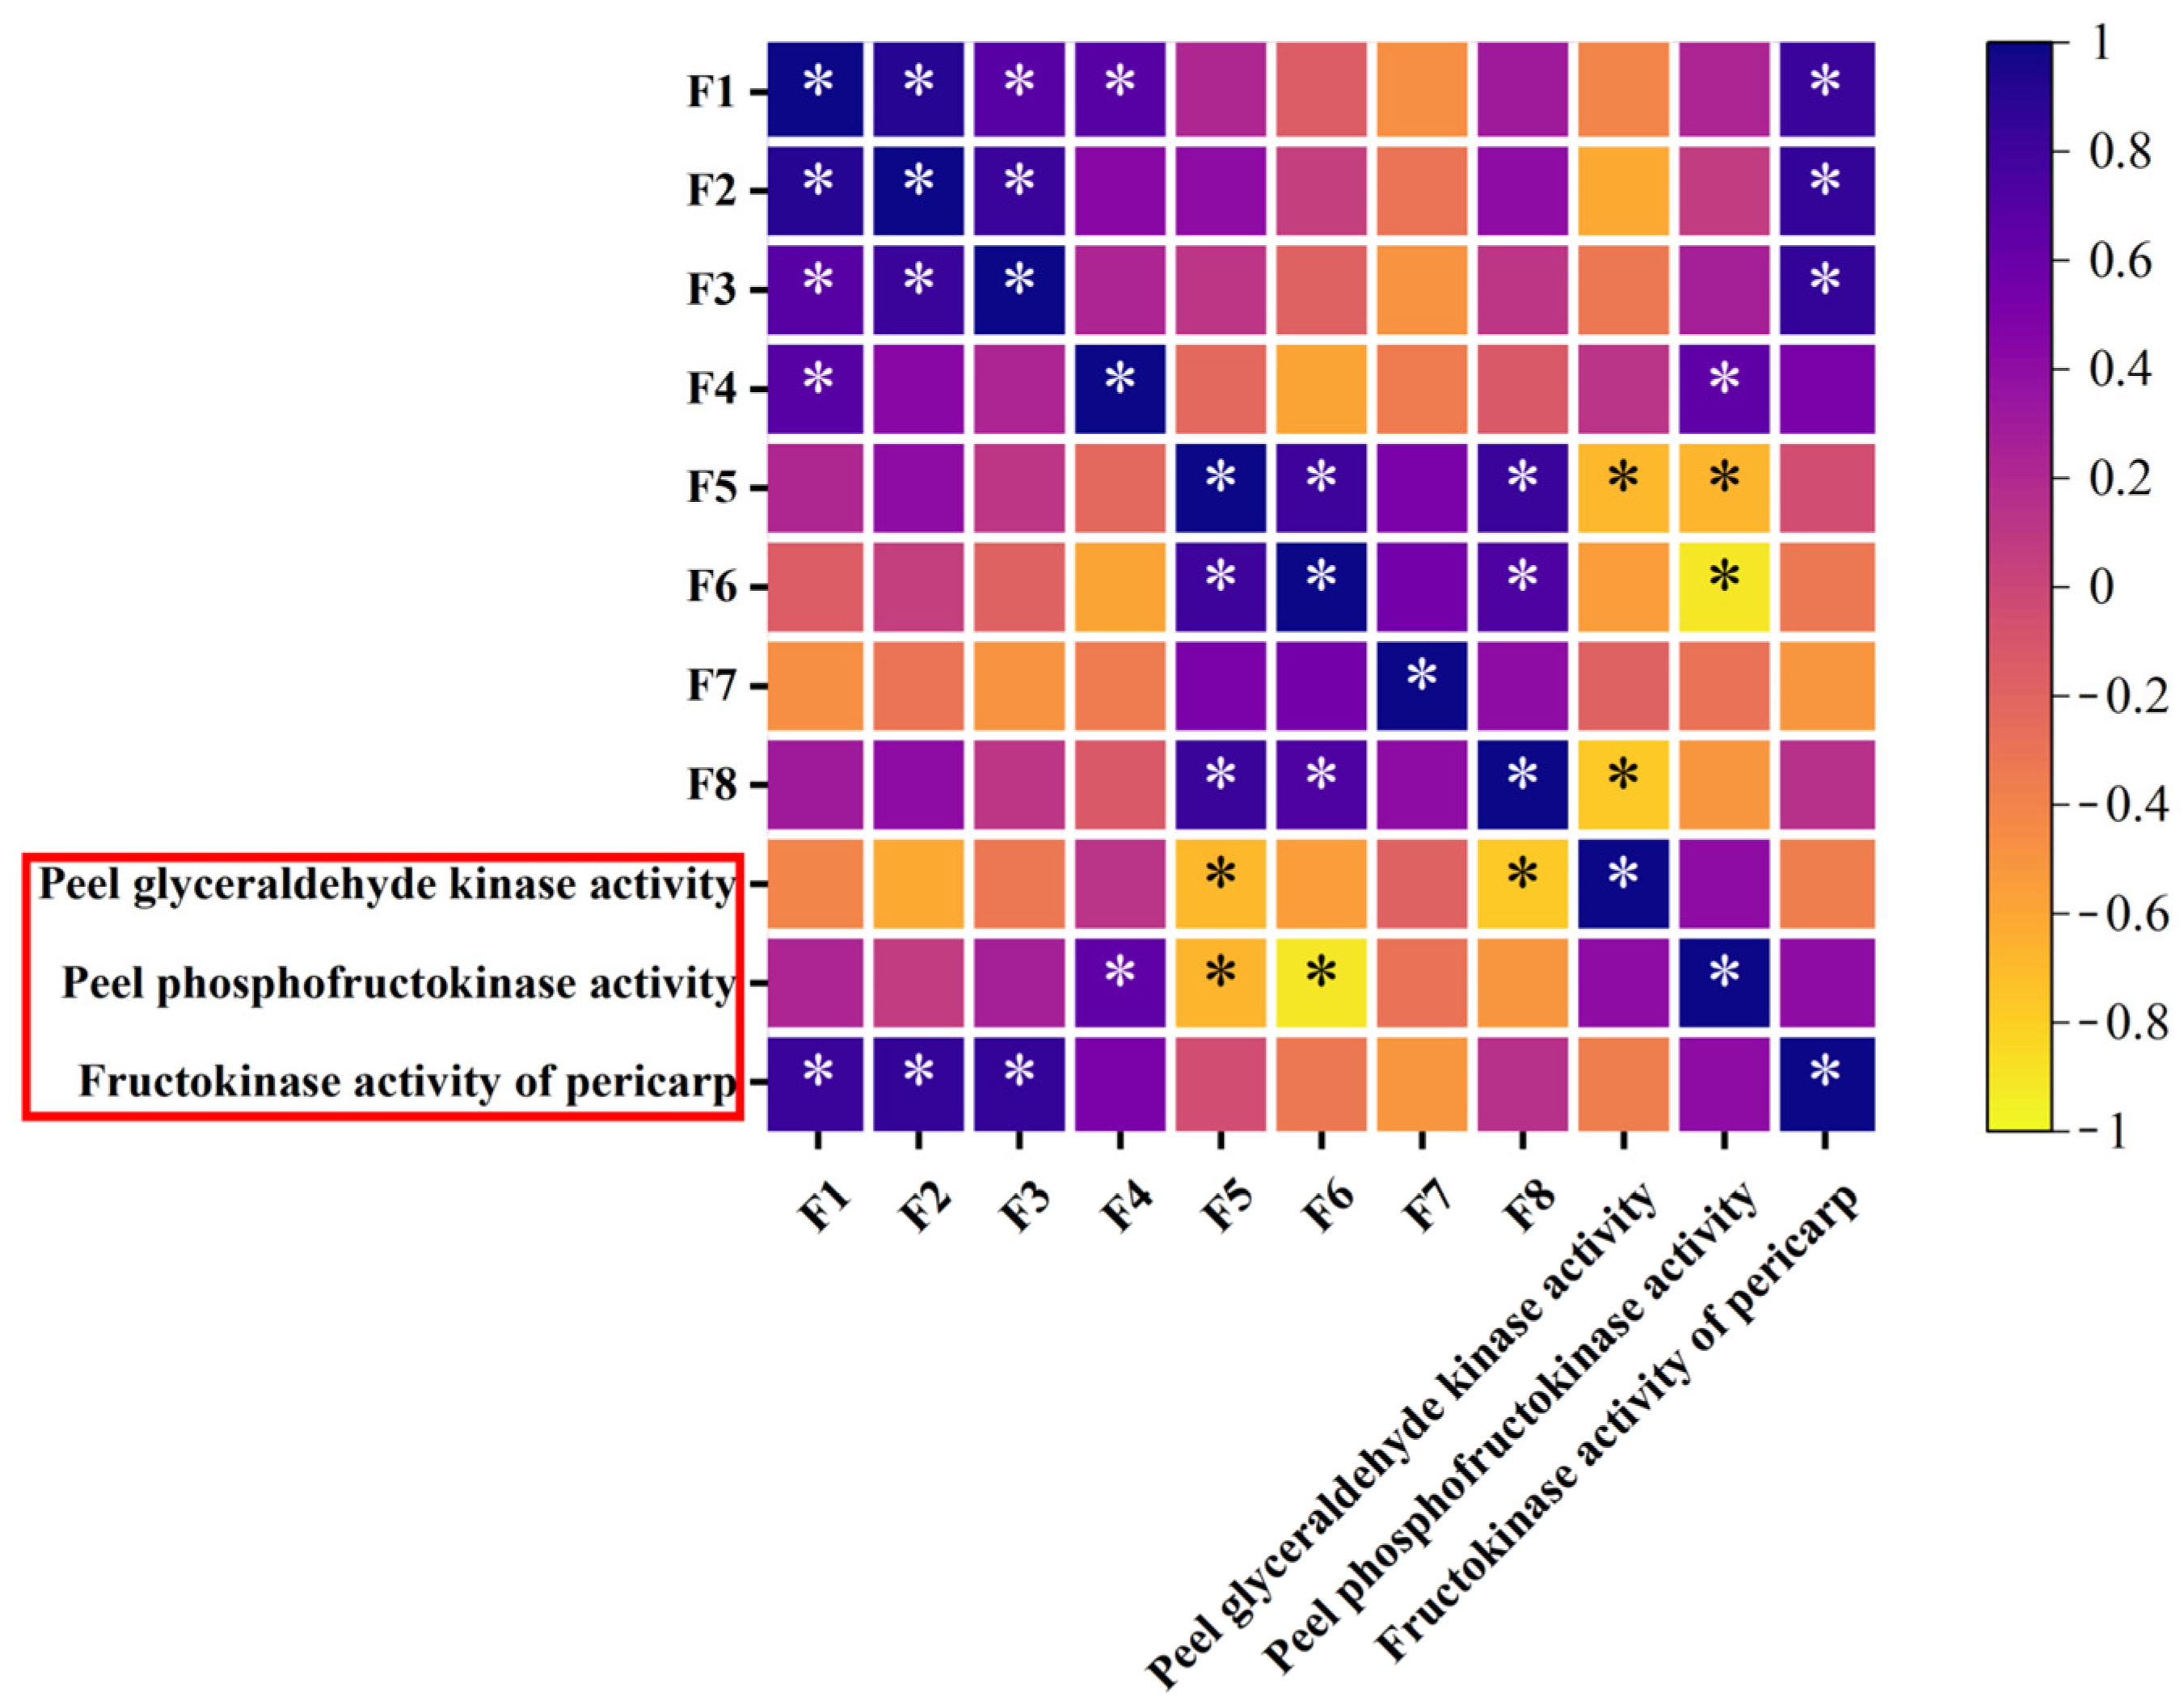
3.10. Screening of Key Factors Affecting Sugar Content in Korla Fragrant Pears

In this study, the levels of glucose, fructose, sucrose, and sorbitol in the picked samples and their peels were evaluated using a scoring system based on their functional attributes. According to Figure 11a, samples with scores below 0.5 are classified as D-level; those with scores between 0.5 and 0.6 are classified as C-level; those with scores between 0.6 and 0.7 are classified as A-level. Interestingly, most A- and B-level samples originate from natural grass-growing models. Notably, all four A-level samples were derived from natural-growing conditions in the storage area. To identify key factors influencing sugar content scores, this study employed machine learning algorithms to establish classification models linking sample flesh characteristics with the activities of GK, PFK, HK, and FK enzymes and their corresponding gene expressions. Optimized extraction methods were used to screen for key factors. Specifically, we applied RF, KNN, and SVM algorithms. Additionally, the particle swarm optimization algorithm was used to extract important factors for model prediction, and the relative importance of the top five factors was visualized (Figure 11b). The RF model identified 12 important factors, KNN identified 10 important factors, and the SVM algorithm identified 8 important factors.
Figure 12A–E represent the model’s accuracy, precision, recall, F1 score, and score based on 15 cross-validations, respectively. When we analyze these metrics, it becomes clear that the model demonstrates remarkable classification performance. Notably, the SVM model shines brightly, attaining an accuracy of 0.895238 and a precision of 0.9405. In contrast, the KNN model exhibits relatively weaker performance, with an accuracy of only 0.7238095 and a precision of 0.673428571. However, it still manages to meet the initial criteria for effective modeling. To further identify key impact factors, this study analyzed the feature factors extracted by the three models. The analysis revealed that glycerin kinase activity in the flesh, peel phosphatase activity, and peel fructokinase activity significantly influence the scoring.
To deeply explore the influence mechanisms of the activities of glyceraldehyde kinase (GK), phosphofructokinase (PFK), and fructokinase (HK) in the peel on the sugar content of samples, this study comprehensively carried out a correlation analysis between the activities of these three key enzymes and the contents of glucose, fructose, sucrose, and sorbitol in both the flesh and the peel. The specific results are shown in Figure 13. The analysis results indicate that there is a significant negative correlation between the GK activity in the peel and the contents of glucose and sorbitol in the peel, with Pearson correlation coefficients of −0.69 and −0.77, respectively. This implies that, as the GK activity in the peel increases, the contents of glucose and sorbitol in the peel tend to decrease. In addition, the study reveals that the PFK activity in the peel has a significant positive correlation with the sorbitol content in the flesh, with a correlation coefficient of 0.65, while it has a negative correlation with the contents of glucose and fructose in the peel, with Pearson correlation coefficients of −0.67 and −0.91, respectively. This demonstrates that the changes in PFK activity have effects in different directions on the sorbitol content in the flesh and the contents of glucose and fructose in the peel. Meanwhile, the HK activity in the peel shows a significant positive correlation with the contents of glucose, fructose, and sucrose in the flesh, with Pearson coefficients reaching 0.82, 0.84, and 0.84, respectively. This suggests that the enhancement of HK activity may promote the accumulation of glucose, fructose, and sucrose in the flesh.

4. Discussion

Orchard grass significantly enhances fruit yield and quality while improving soil fertility, demonstrating its potential as a sustainable orchard management practice [13]. For Korla fragrant pear, fruit quality is closely linked to soil physicochemical properties. The implementation of grass cultivation can effectively optimize orchard microclimate conditions and regulate the soil microenvironment, thereby improving fruit quality [30].
This study investigated the effects of natural grass cultivation on the development and post-harvest glucose metabolism of Korla pear fruit, including related enzyme activities and the gene expression of key synthesis enzymes. The findings highlight the significant advantages of natural grass in promoting sugar accumulation in fruits. From the perspective of sugar composition, the fructose and glucose content in both the flesh and peel of pears from the natural grass area were significantly higher than those from the clear cultivation area. At specific post-anthesis stages—such as 120 and 150 days after anthesis—the fructose content in the flesh of pears grown in the natural grass area was notably higher (9.09 mg·g−1 and 12.59 mg·g−1, respectively) than in the clear cultivation area. Similarly, glucose content exhibited a comparable increasing trend. These results align with the findings of Wei et al. [31] in apple cultivation studies, which demonstrated that orchard grass significantly increases soluble sugar content in fruits, thereby enhancing sweetness and flavor quality. For Korla fragrant pear, the natural grass cultivation model may optimize fruit sugar metabolism through multiple pathways: First, natural grass promotes the synthesis and accumulation of photosynthetic products [32,33,34]. Second, it increases soil organic matter content and improves microbial community structure [35], facilitating nutrient transformation and cycling. This enables more efficient nutrient uptake by fruit trees [36], directing a greater proportion of photosynthetic products toward fruit development. These mechanisms provide a solid foundation for improving fruit flavor and nutritional value, allowing for greater accumulation of high-quality sugars. Consequently, this enhances the market competitiveness of the fruit and consumer satisfaction.
Soluble sugars—including glucose, sucrose, and fructose, along with a small number of other sugar components—are abundant in plants. The type and composition of these soluble sugars significantly influence the quality of Korla fragrant pear fruit [37]. As key catalysts for biochemical reactions in organisms, enzymes play an indispensable role in fruit quality formation [38]. During glucose metabolism, glucose and fructose are phosphorylated by hexokinase and fructokinase, respectively [39]. Natural grass patterns may indirectly affect gene expression and enzyme activity in Korla fragrant pear by altering soil microbial communities, nutrient availability, or soil physicochemical properties, thereby influencing fruit development and quality. In this study, the natural grass pattern significantly impacted the activity and gene expression of various enzymes in the pulp and peel of Korla fragrant pear. The relative expression levels of GK, PFK, and FK genes in the flesh of the natural grass area increased markedly during the later stages of fruit development. Additionally, the corresponding enzyme activities were higher than those in the clear cultivation area at specific storage periods. After 150 days of storage, PFK activity in the natural grass area was significantly higher (by 23.73 U/L) than in the clear cultivation area. These findings align with previous studies by Jia et al. [12], which highlighted the close relationship between enzyme activity and fruit sugar metabolism in pears, further confirming the critical role of enzymes in fruit quality regulation. The natural grass pattern may enhance sugar metabolism and accumulation by modulating enzyme gene expression and activity through its influence on the physiological metabolism of fruit trees. From a molecular perspective, this study provides deeper insights into the mechanisms by which natural grass patterns affect fruit quality. The results offer an important theoretical foundation and practical guidance for the precise regulation of fruit quality through enzymology and gene expression. Moreover, these findings contribute to the development of more effective cultivation and management strategies to optimize fruit quality.
Further analysis reveals that the prediction model is constructed using the random forest (RF), support vector machine (SVM), and K-nearest neighbor (KNN) classification algorithms, with the performance of each model evaluated through comparative analysis. The particle swarm optimization (PSO) algorithm was utilized to optimize model hyperparameters and facilitate feature selection, thereby enhancing performance in complex data scenarios. Through machine learning modeling, we identified glyceraldehyde kinase, phosphofructokinase, and fructokinase activities in fruit peel as key determinants of fruit sugar content. From the perspective of molecular regulatory mechanisms, these PSO-selected metabolic pathway features exhibited statistically significant effects on pulp sugar content. This demonstrates that our machine learning approach successfully pinpointed critical regulatory nodes in sugar metabolic pathways, offering valuable insights into the fine-tuned regulation of these biochemical processes. Moreover, these findings underscore the robustness and reliability of integrating computational modeling with experimental validation for elucidating molecular mechanisms. At the cross-tissue regulatory level, correlation analyses revealed a substantial Pearson correlation between model-identified enzymatic activities (peel glucokinase and phosphofructokinase) and pulp sugar content. This discovery provides compelling evidence for understanding the complex intertissue sugar transport mechanisms in fruits [40], significantly advancing our comprehension of the multifaceted molecular networks underlying fruit quality formation. These results further exemplify the profound utility of machine learning models in uncovering cross-tissue molecular interactions [41].
By optimizing the cultivation techniques for Korla fragrant pears, this study investigated the relationship between cultivation methods and fruit quality, yielding research findings that promote sugar accumulation in the fruit. However, the molecular mechanisms and signal transduction pathways underlying the precise regulation of fruit tree growth and fruit quality remain incompletely understood. At the micro-level, the interactions between specific microbial species or microbial community combinations and fruit tree roots, as well as their effects on gene expression and enzyme activity related to fruit quality, require further elucidation [42]. Future research should focus on two key directions: First, deeper integration of multi-omics technologies to construct a comprehensive interaction network, enabling precise analysis of multi-level regulatory mechanisms and providing scientific theoretical and practical guidance for orchard management. Second, improving the interpretability of machine learning models by employing methods such as feature importance analysis and attention mechanisms [43] to better understand model decision-making processes. This will facilitate targeted optimization of cultivation practices, promote the translation of research findings into practical applications, and support the high-quality development of the pear and broader fruit industry.
This study has achieved significant advancements in investigating the relationship between the cultivation models of Korla fragrant pears and fruit quality. It provides comprehensive, precise, and reliable technical support and theoretical underpinnings for the sustainable development of the pear industry. As a result, this research propels the innovative development and strategic transformation of the fruit industry in the new era.

5. Conclusions

This study systematically compared two cultivation methods—natural grass cover and clear tillage—elucidating their distinct effects on the physiological characteristics of Korla fragrant pear during both fruit development and post-harvest storage. Natural grass cultivation significantly enhanced sugar accumulation in the fruit, particularly at 120 and 150 days after flowering, when fructose and glucose levels increased markedly. This improvement laid a material foundation for enhanced fruit flavor, attributable to the orchard’s optimized ecological microenvironment under natural grass cover. By regulating soil temperature and humidity, increasing organic matter, and improving microbial communities, this method promoted root nutrient absorption and photosynthetic product allocation. Furthermore, natural grass cultivation significantly boosted the activities and gene expression of key glucose metabolism enzymes, such as GK, PFK, and FK. Corresponding enzyme activities remained higher during specific storage stages, strongly supporting the critical role of enzymatic regulation in fruit quality. Using a comprehensive machine learning approach (RF, KNN, SVM, and PSO), we identified key factors influencing fruit sugar content, offering new insights into the molecular mechanisms of quality formation. While natural grass cultivation improves fruit quality, the precise molecular mechanisms and signaling pathways require further exploration. Future research should integrate multi-omics technologies to elucidate regulatory networks while enhancing the interpretability of machine learning models. Techniques such as feature importance analysis and attention mechanisms can deepen our understanding of model decision-making logic, facilitating the development of precise cultivation strategies and promoting the high-quality growth of the fragrant pear industry.

Author Contributions

Conceptualization, formal analysis, writing—original draft preparation, M.Y. and L.W.; writing—review and editing, project administration J.B.; visualization, Y.C.; funding acquisition, X.G.; formal analysis and methodology, W.F. and H.W.; data curation, K.G.; resources, S.T. All authors have read and agreed to the published version of the manuscript.

Funding

This paper is supported by the project of “Basic and Applied Research on Natural Dominant Grass Interseed System of Korla Fragrant Pear”, project number: NNTDLH201904.

Data Availability Statement

The data presented in this study will be provided by the authors upon request.

Acknowledgments

This research was carried out under the support of the project “Basic and Applied Research on Intercropping System of Natural Advantageous Grass Species for Korla Fragrant Pear” (Project No.: NNTDLH201904). We sincerely express our gratitude to the National and Local Joint Engineering Laboratory for Efficient and High-Quality Cultivation of Special Fruit Trees and Deep Processing Technology of Fruits in Southern Xinjiang for providing key resources and facilities. Special thanks are due to Professor Bao Jianping for his valuable guidance and support throughout the research process.

Conflicts of Interest

The authors declare no conflicts of interest.

Abbreviations

The following abbreviations are used in this manuscript:
GKGlyceraldehyde kinase
PFKPhosphofructokinase
HKHexokinase
FKFructokinase
RFRandom Forest
KNNK-Nearest Neighbor
SVMSupport Vector Machine
PSOParticle Swarm Optimization

References

  1. Wang, M.; Li, Y.; Wang, Z.; Li, H.; Zuo, C.; Zhao, J.; Yang, Y.; Tu, K.; Lan, W.; Pan, L. Exploring the optical response of water status and light propagation in bruised ‘Korla’ fragrant pear tissues based on low-field nuclear magnetic resonance coupled with Monte Carlo simulation. Food Chem. 2025, 477, 143504. [Google Scholar] [CrossRef] [PubMed]
  2. Chen, J.; Ma, J.; Li, Y.; Lu, X.; Yuan, J.; Ye, J. Effects of Herbage on Ecological Environment and Photosynthetic Characteristics Fruit Quality of ‘Korla Fragrant Pear’. North Hortic. 2019, 22, 49–59. [Google Scholar]
  3. Wang, Y.; Ji, X.; Wu, Y.; Mao, Z.; Jiang, Y.; Peng, F.; Wang, Z.; Chen, X. Research progress of cover crop in Chinese orchard. Chin. J. Appl. Ecol. 2015, 26, 1892–1900. [Google Scholar]
  4. Huang, T.; Zheng, T.; Hong, P.; He, J.; Cheng, Y.; Yang, J.; Zhou, Y.; Wang, B.; Zhou, S.; Cheng, G.; et al. Sucrose synthase 3 improves fruit quality in grape. Plant Physiol. Biochem. 2025, 221, 109590. [Google Scholar] [CrossRef]
  5. Belmys, C.C.; Gilles, V.; Valentina, B.; Léa, R.; Zhanwu, D.; Pierre, V.; Mohamed-Mahmoud, M.; Sophie, C.; Annick, M.; Yves, G.; et al. Model-assisted comparison of sugar accumulation patterns in ten fleshy fruits highlights differences between herbaceous and woody species. Ann. Bot. 2020, 126, 455–470. [Google Scholar]
  6. Zhong, H.; Yadav, V.; Wen, Z.; Zhou, X.; Wang, M.; Han, S.; Pan, M.; Zhang, C.; Zhang, F.; Wu, X. Comprehensive metabolomics-based analysis of sugar composition and content in berries of 18 grape varieties. Front. Plant Sci. 2023, 14, 1200071. [Google Scholar] [CrossRef]
  7. Li, B.; Zhu, L.; Yang, N.; Qu, S.; Cao, W.; Ma, W.; Wei, X.; Ma, B.; Ma, F.; Fu, A.; et al. Transcriptional landscape and dynamics involved in sugar and acid accumulation during apple fruit development. Plant Physiol. 2024, 195, 2772–2786. [Google Scholar]
  8. Middendorf, B.J.; Prasad, P.V.V.; Pierzynski, G.M.; Foyer, C. Setting research priorities for tackling climate change. J. Exp. Bot. 2020, 71, 480–489. [Google Scholar] [CrossRef]
  9. Grzeczka, A.; Graczyk, S.; Kordowitzki, P. DNA Methylation and Telomeres—Their Impact on the Occurrence of Atrial Fibrillation during Cardiac Aging. Int. J. Mol. Sci. 2023, 24, 15699. [Google Scholar] [CrossRef]
  10. Zhang, J.; Lyu, H.; Chen, J.; Cao, X.; Du, R.; Ma, L.; Wang, N.; Zhu, Z.; Rao, J.; Wang, J.; et al. Releasing a sugar brake generates sweeter tomato without yield penalty. Nature 2024, 635, 647–656. [Google Scholar] [CrossRef]
  11. Tang, G.; Chen, G.; Ke, J.; Wang, J.; Zhang, D.; Liu, D.; Huang, J.; Zeng, S.; Liao, M.; Wei, X.; et al. The Annona montana genome reveals the development and flavor formation in mountain soursop fruit. Ornam. Plant Res. 2023, 3, 14. [Google Scholar]
  12. Jia, L.; Zhang, X.; Zhang, Z.; Luo, W.; Nambeesan, S.U.; Li, Q.; Qiao, X.; Yang, B.; Wang, L.; Zhang, S. PbrbZIP15 promotes sugar accumulation in pear via activating the transcription of the glucose isomerase gene PbrXylA1. Plant J. 2023, 117, 1392–1412. [Google Scholar] [PubMed]
  13. Ren, J.; Li, F.; Yin, C. Orchard grass safeguards sustainable development of fruit industry in China. J. Clean. Prod. 2023, 382, 135291. [Google Scholar]
  14. Yu, B.; Wang, L.; Zhang, J.; Lyu, D. Natural Grass Cultivation Management Improves Apple Fruit Quality by Regulating Soil Mineral Nitrogen Content and Carbon–Nitrogen Metabolism. Metabolites 2023, 13, 925. [Google Scholar] [CrossRef]
  15. Yu, B.; Qin, S.J.; Lyu, D.G. Responses of soil microorganisms, enzyme activities and nutrient contents to inter-row grass ploughing and returning to the field in a natural sod culture apple orchard. Chin. J. Appl. Ecol. 2023, 34, 145–150. [Google Scholar]
  16. Yu, J.; Liu, X.; Wang, W.; Zhang, L.; Wang, C.; Zhang, Q.; Wang, J.; Du, M.; Sheng, L.; Hu, D. MdCIbHLH1 modulates sugar metabolism and accumulation in apple fruits by coordinating carbohydrate synthesis and allocation. Hortic. Plant J. 2025, 11, 578–592. [Google Scholar]
  17. Yao, G.; Zhang, S.; Cao, Y.; Liu, J.; Wu, J.; Yuan, J.; Zhang, H.; Xiao, C. Characteristics of Components and Contents of Soluble Sugars in Pear Fruits from Different Species. Sci. Agric. Sin. 2010, 43, 4229–4237. [Google Scholar]
  18. Qing, Y.W.; Ye, S.; Da, W.; Lan, L.J.; Zheng, Y.X.; Wen, J.L.; Wen, W.W. Research on Postharvest Physiology and Comprehensive Technologies for Quality Control of Korla Fragrant Pear. China Fruit Veg. 2018, 38, 1008–1038. [Google Scholar]
  19. Zhu, Y.; Zong, Y.; Wang, X.; Gong, D.; Zhang, X.; Zhang, F.; Prusky, D.; Bi, Y. Regulation of sucrose metabolism, sugar transport and pentose phosphate pathway by PacC in apple fruit colonized by Penicillium expansum. Food Chem. 2024, 461, 140863. [Google Scholar]
  20. Wang, R.; Shu, P.; Zhang, C.; Zhang, J.; Chen, Y.; Zhang, Y.; Du, K.; Xie, Y.; Li, M.; Ma, T.; et al. Integrative analyses of metabolome and genome-wide transcriptome reveal the regulatory network governing flavor formation in kiwifruit (Actinidia chinensis). New Phytol. 2021, 233, 373–389. [Google Scholar]
  21. Chen, J.; Liao, Q.; Huang, Y.; Chen, Q.; Zhang, W.; Tian, J. Effects of Different Cultivation Modes on Growth and Quality of Hongyang Kiwifruit. J. Nucl. Agric. Sci. 2023, 37, 1435–1441. [Google Scholar]
  22. Shu, X.; Ye, Y. Knowledge Discovery: Methods from data mining and machine learning. Soc. Sci. Res. 2023, 110, 102817. [Google Scholar] [PubMed]
  23. Dong, L.; Lei, G.; Huang, J.; Zeng, W. Improving crop modeling in saline soils by predicting root length density dynamics with machine learning algorithms. Agric. Water Manag. 2023, 287, 108425. [Google Scholar]
  24. Liu, X.; Wang, J.; Wang, H.; Huang, Y.; Ren, Z. Prediction of prunoideae fruit quality characteristics based on machine learning and spectral characteristic acquisition optimization. Food Control 2024, 165, 110627. [Google Scholar]
  25. Wittwer, C.T.; Vandesompele, J.; Shipley, G.L.; Pfaffl, M.W.; Nolan, T.; Mueller, R.; Kubista, M.; Huggett, J.; Hellemans, J.; Garson, J.A.; et al. The MIQE Guidelines: Minimum Information for Publication of Quantitative Real-Time PCR Experiments. Clin. Chem. 2009, 55, 611–622. [Google Scholar]
  26. .Amsili, J.P.; van Es, H.M.; Schindelbeck, R.R. Pedotransfer Functions for Soil Protein Based on Random Forest Modeling for Routine Soil Health Analysis. Commun. Soil Sci. Plant Anal. 2025, 56, 1381–1393. [Google Scholar]
  27. He, S.-S.; Hou, W.-H.; Chen, Z.-Y.; Liu, H.; Wang, J.-Q.; Cheng, P.-F. Early warning model based on support vector machine ensemble algorithm. J. Oper. Res. Soc. 2024, 76, 411–425. [Google Scholar]
  28. Deng, N.; Xu, R.; Zhang, Y.; Wang, H.; Chen, C.; Wang, H. Forest biomass carbon stock estimates via a novel approach: K-nearest neighbor-based weighted least squares multiple birth support vector regression coupled with whale optimization algorithm. Comput. Electron. Agric. 2025, 232, 110020. [Google Scholar]
  29. Wei, J.; Zheng, Q.; Yan, W.; Li, H.; Chi, Z.; Jiang, B. Probabilistic analysis of blade flutter based on particle swarm optimization-deep extremum neural network. Int. J. Turbo Jet-Engines 2025, 42, 99–114. [Google Scholar]
  30. Yang, W.; Qian, D.; Qun, D.; Hui, Z.; Xiao, Z.; Hong, L. Expression analysis of genes related to sugar and acid metabolism during fruit development of ‘Shucuizao’ jujube. Acta Agric. Boreali-Occident. Sin. 2022, 31, 876–885. [Google Scholar]
  31. Hong, W.; Yan, W.; Xiao, X.; Lian, C. Effects of grass on apple yield and fruit quality in orchard. Friends Fruit Farmers 2022, 10, 4–5. [Google Scholar]
  32. Wei, H.; Xiang, Y.; Liu, Y.; Zhang, J. Effects of sod cultivation on soil nutrients in orchards across China: A meta -analysis. Soil Tillage Res. 2017, 169, 16–24. [Google Scholar]
  33. Chen, L.; Bao, Y.; He, X.; Yang, J.; Wu, Q.; Lv, J. Nature-based accumulation of organic carbon and nitrogen in citrus orchard soil with grass coverage. Soil Tillage Res. 2025, 248, 106419. [Google Scholar] [CrossRef]
  34. Kang, P.; Pan, Y.; Hu, J.; Qu, X.; Ji, Q.; Zhuang, C.; Ren, Y.; Zhou, J.; Wei, T. Straw mulch and orchard grass mediate soil microbial nutrient acquisition and microbial community composition in Ziziphus Jujuba orchard. Plant Soil 2025, 1–17. [Google Scholar] [CrossRef]
  35. Crittenden, S.J.; de Goede, R.G.M. Integrating soil physical and biological properties in contrasting tillage systems in organic and conventional farming. Eur. J. Soil Biol. 2016, 77, 26–33. [Google Scholar] [CrossRef]
  36. Zhao, Y.; Hu, X. Soil pore structure may affect microbial communities involved in carbon cycling during thaw slumps development. Appl. Soil Ecol. 2025, 206, 105821. [Google Scholar] [CrossRef]
  37. Wang, Y.; Zhang, Z.; Wang, X.; Yuan, X.; Wu, Q.; Chen, S.; Zou, Y.; Ma, F.; Li, C. Exogenous dopamine improves apple fruit quality via increasing flavonoids and soluble sugar contents. Sci. Hortic. 2021, 280, 109903. [Google Scholar] [CrossRef]
  38. Wang, S.; Xu, Y.; Wang, F.; Gao, S.; Kang, H.; Ji, X.; Yao, Y. Postharvest changes in the phenolic and free volatile compound contents in Shine Muscat grapes at room temperature. Food Chem. 2025, 465, 141958. [Google Scholar] [CrossRef]
  39. Sun, S.; Sun, D.; Guo, L.; Cui, B.; Zou, F.; Wang, J.; Sun, C.; Zhu, Y.; Li, X. Structural and physicochemical properties of corn starch modified by phosphorylase b, hexokinase and alkaline phosphatase. Carbohydr. Polym. 2025, 349, 122979. [Google Scholar]
  40. Chen, J.; Zhang, L.; Zhao, Z.; Xu, J. Fruit Photosynthesis and Assimilate Translocation and Partitioning Their Characteristics and Role in Sugar Accumulation in Developing Citrus unshiu Fruit. Acta Bot. Sin. 2002, 44, 158–163. [Google Scholar]
  41. Tran, D.T.; Huh, J.-H. Building a model to exploit association rules and analyze purchasing behavior based on rough set theory. J. Supercomput. 2022, 78, 11051–11091. [Google Scholar] [CrossRef]
  42. Li, K.; ur Rahman, S.; Rehman, A.; Li, H.; Hui, N.; Khalid, M. Shaping rhizocompartments and phyllosphere microbiomes and antibiotic resistance genes: The influence of different fertilizer regimes and biochar application. J. Hazard. Mater. 2025, 487, 137148. [Google Scholar] [PubMed]
  43. Rehman, A.; Lin, J.C.W.; Heldal, I. Enhancing Psychologists’ Understanding Through Explainable Deep Learning Framework for ADHD Diagnosis. Expert Syst. 2024, 42, e13788. [Google Scholar]
Figure 1. Flowchart of the experimental design process.
Agriculture 15 00792 g001
Figure 2. Changes in sugar components of the flesh and peel of Korla fragrant pear during fruit development and storage. They should be listed as follows: (a) changes in sugar components of the pulp during development; (b) changes in sugar components of the peel during development; (c) changes in sugar components of the pulp during storage; (d) changes in sugar components of the peel during storage. Different lowercase letters indicated significant differences between treatments (p < 0.05), while the same lowercase letters indicated no significant differences (p > 0.05). Note: Days after flowering refers to the number of days passed from flowering to recording data; d: the unit is days. The same applies below.
Agriculture 15 00792 g002aAgriculture 15 00792 g002bAgriculture 15 00792 g002cAgriculture 15 00792 g002d
Figure 3. Changes in enzyme activity of the pulp during the fruit development of Korla fragrant pear. They should be listed as follows: (a) changes in flesh GK activity during development; (b) changes in PFK activity in flesh during development; (c) changes in flesh HK activity during development; (d) changes in FK activity in flesh during development. Different lowercase letters indicated significant differences between treatments (p < 0.05), while the same lowercase letters indicated no significant differences (p > 0.05).
Agriculture 15 00792 g003
Figure 4. Changes in the activity of enzymes in the pericarp of Korla fragrant pears during fruit development. They should be listed as follows: (a) changes in pericarp GK activity during development; (b) changes in pericarp PFK activity during development; (c) changes in HK activity of pericarp during development; (d) changes in pericarp FK activity during development. Different lowercase letters indicated significant differences between treatments (p < 0.05), while the same lowercase letters indicated no significant differences (p > 0.05).
Agriculture 15 00792 g004
Figure 5. Changes in enzyme gene expression in the pulp of Korla fragrant pear during fruit development. They should be listed as follows: (a) changes in GK gene expression in flesh during development; (b) changes in PFK gene expression in flesh during development; (c) changes in HK gene expression in flesh during development; (d) changes in FK gene expression in flesh during development. Different lowercase letters indicated significant differences between treatments (p < 0.05), while the same lowercase letters indicated no significant differences (p > 0.05).
Agriculture 15 00792 g005
Figure 6. Changes in gene expression in peel enzymes of Korla fragrant pear during fruit development. They should be listed as follows: (a) changes in GK gene expression in pericarp during development; (b) changes in PFK gene expression in pericarp during development; (c) changes in HK gene expression in pericarp during development; (d) changes in FK gene expression in pericarp during development. Different lowercase letters indicated significant differences between treatments (p < 0.05), while the same lowercase letters indicated no significant differences (p > 0.05).
Agriculture 15 00792 g006
Figure 7. Changes in enzyme activity of the pulp of Korla fragrant pears during storage. They should be listed as follows: (a) changes in pulp GK activity during storage; (b) changes in PFK activity during storage; (c) changes in flesh HK activity during storage; (d) changes in FK activity in pulp during storage. Different lowercase letters indicated significant differences between treatments (p < 0.05), while the same lowercase letters indicated no significant differences (p > 0.05).
Agriculture 15 00792 g007
Figure 8. Changes in the activity of enzymes in the peel of Korla fragrant pears during storage. They should be listed as follows: (a) changes in GK activity during storage; (b) changes in PFK activity in pericarp during storage; (c) changes in HK activity of pericarp during storage; (d) changes in FK activity in pericarp during storage. Different lowercase letters indicated significant differences between treatments (p < 0.05), while the same lowercase letters indicated no significant differences (p > 0.05).
Agriculture 15 00792 g008
Figure 9. Changes in enzyme gene expression in the pulp of Korla fragrant pear during storage. They should be listed as follows: (a) changes in GK gene expression in pulp during storage; (b) changes in PFK gene expression in pulp during storage; (c) changes in HK gene expression in flesh during storage; (d) changes in FK gene expression in flesh during storage. Different lowercase letters indicated significant differences between treatments (p < 0.05), while the same lowercase letters indicated no significant differences (p > 0.05).
Agriculture 15 00792 g009
Figure 10. Changes in gene expression in peel enzymes of Korla fragrant pear during storage. They should be listed as follows: (a) changes in GK gene expression in pericarp during storage; (b) changes in PFK gene expression in pericarp during storage; (c) changes in HK gene expression in pericarp during storage; (d) changes in FK gene expression in pericarp during storage. Different lowercase letters indicated significant differences between treatments (p < 0.05), while the same lowercase letters indicated no significant differences (p > 0.05).
Agriculture 15 00792 g010
Figure 11. (a) shows the sugar content score chart of the pulp and peel of Korla fragrant pears; (b) shows the importance of the top 5 important factors under each algorithm.
Agriculture 15 00792 g011
Figure 12. Model indicators and results. A–F represent the following respectively: (A) accuracy; (B) precision; (C) recall; (D) F1-score; (E) CV mean score; (F) Intersection analysis of feature factors extracted by three models.
Agriculture 15 00792 g012
Figure 13. Correlation heatmap (note: F1 to F8 in the figure represent flesh glucose, flesh fructose, flesh sucrose, flesh sorbitol, peel glucose, peel fructose, peel sucrose, and peel sorbitol, respectively). Note: The significance level is indicated by asterisks: * p < 0.05.
Agriculture 15 00792 g013
Table 1. The primer sequences.
NameSequence (5′-3′)Tm (°C)Length (bp)
GADPH-FGTGCCCACTGTTGATGTTTCC54.7922
GADPH-RCCTTCTGACTCCTCCTTGATAGC55.1324
GK-FGGTCTTCCTGTCATCGCATCCTTG54.1025
GK-RTTACCGCTCAAACTACCGACAATCC54.5226
PFK-FATGTCCAGGTTCCGCTGCTT55.0721
PFK-RACTGGAACTGCCGTTGGGAA54.7021
HK-FGAGCCTGGAGGTAGACGAGACAC54.0624
Table 2. Parameter optimization.
Algorithm Parameter   Vector   p
RF T , d m a x , m
SVM C , γ
KNN k , m e t r i c
Disclaimer/Publisher’s Note: The statements, opinions and data contained in all publications are solely those of the individual author(s) and contributor(s) and not of MDPI and/or the editor(s). MDPI and/or the editor(s) disclaim responsibility for any injury to people or property resulting from any ideas, methods, instructions or products referred to in the content.

